Attached files
| file | filename |
|---|---|
| 8-K - CORENERGY INFRASTRUCTURE TRUST, INC. 8-K 6-9-2016 - CorEnergy Infrastructure Trust, Inc. | form8k.htm |
Exhibit 99.1

REITWeek 2016David Schulte, Chief Executive Officer LISTED CORR NYSE
Disclaimer This presentation contains certain statements that may include "forward-looking statements" within the meaning of Section 27A of the Securities Act of 1933 and Section 21E of the Securities Exchange Act of 1934. All statements, other than statements of historical fact, included herein are "forward-looking statements." Although CorEnergy believes that the expectations reflected in these forward-looking statements are reasonable, they do involve assumptions, risks and uncertainties, and these expectations may prove to be incorrect. Actual results could differ materially from those anticipated in these forward-looking statements as a result of a variety of factors, including those discussed in CorEnergy’s reports that are filed with the Securities and Exchange Commission. You should not place undue reliance on these forward-looking statements, which speak only as of the date of this presentation. Other than as required by law, CorEnergy does not assume a duty to update any forward-looking statement. In particular, any distribution paid in the future to our stockholders will depend on the actual performance of CorEnergy, its costs of leverage and other operating expenses and will be subject to the approval of CorEnergy’s Board of Directors and compliance with leverage covenants.

Disciplined Investing in Energy Infrastructure High cash flow component of total returnAttractive potential risk-adjusted returnsDiversification vs. other asset classesPotential inflation protection Infrastructure assets are essential for our customers’ operations to produce revenueCorEnergy’s triple-net leases and other contracts generate operating expense for our tenantsTotal long-term return of 8-10% on assets from base rents, plus acquisitions and participating rentsGrowing CorEnergy through disciplined acquisitions that are accretive to AFFO and dividends per share Long-lived, critical assets to tenant operationsHigh barriers to entry with strategic locationsContracts provide predictable revenueLimited sensitivity to price/volume changes Asset Fundamentals Infrastructure REIT Strategy Overview Investment Characteristics
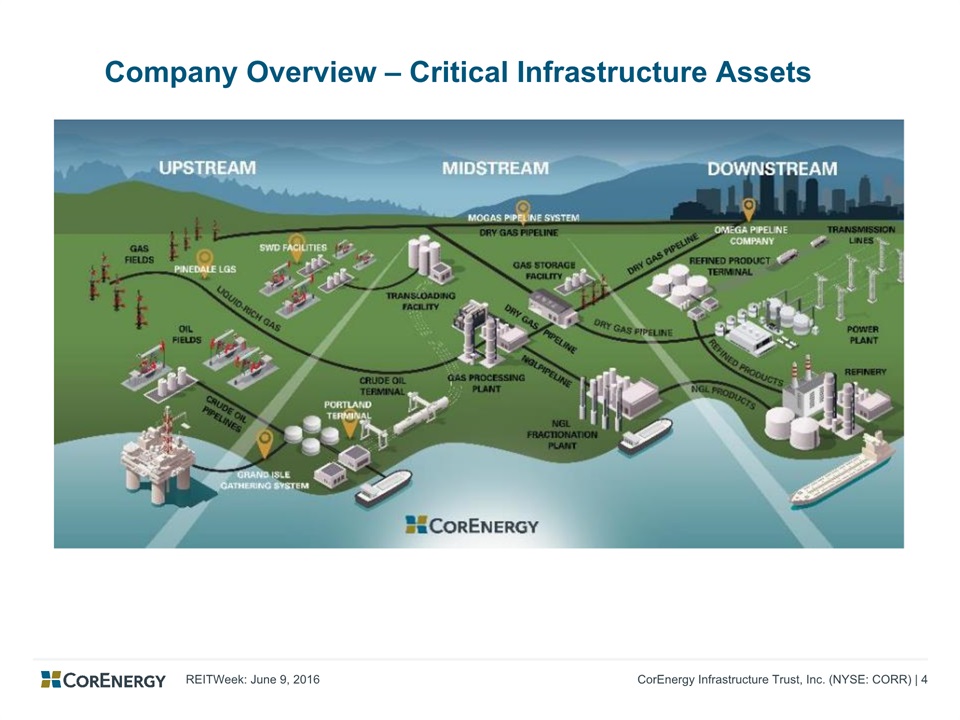
Company Overview – Critical Infrastructure Assets

CorEnergy Strategy Withstanding Energy Market Volatility Oil prices hit lowest levels in over a decade in the first quarter of 2016Since the beginning of 2015, over 75 North American energy companies have filed for bankruptcy, accounting for ~$52 billion of secured and unsecured debt1In April, the parent companies of two CorEnergy tenants, Energy XXI Ltd and Ultra Petroleum Corp, filed Chapter 11GIGS tenant (EXXI subsidiary) remains outside of bankruptcy proceedingsPinedale LGS tenant (UPL subsidiary) is included in Chapter 11 reorganization, but has not filed a motion to reject the Pinedale LeaseIn this environment, CorEnergy lease agreements continue to be paid by tenants in a timely manner (1) Haynes and Boone, LLP, “Oil Patch Bankruptcy Monitor”, May 16, 2016
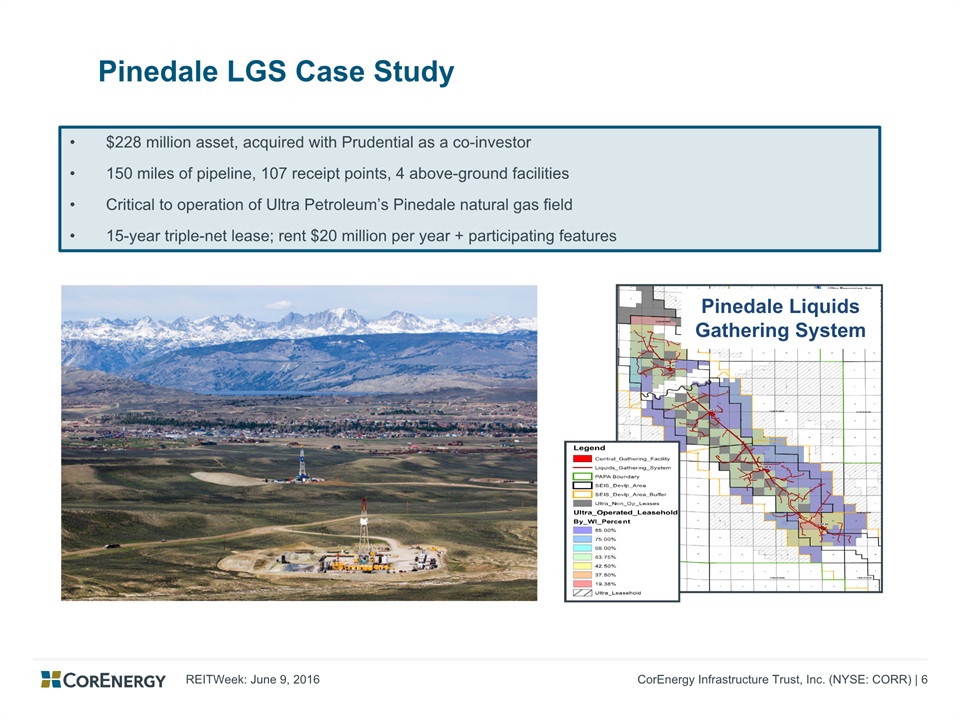
Pinedale LGS Case Study $228 million asset, acquired with Prudential as a co-investor150 miles of pipeline, 107 receipt points, 4 above-ground facilitiesCritical to operation of Ultra Petroleum’s Pinedale natural gas field15-year triple-net lease; rent $20 million per year + participating features Pinedale Liquids Gathering System

Pinedale LGS Supports Large Reserves & Low-Cost Operator (1) UPL 2015 10-K Filing, (2) CorEnergy Estimate, (3) Stifel Estimates, includes PUDs Reclassified by UPL, due to SEC rules related to capital constraints, (4) Declarations of Garland R. Shaw in Support of Chapter 11 Petitions and First Day Motions UPL Reserve Values as of 12/31/15 3 1 2 2 UPL Continues to Drive Down Well Costs4 Total Well Cost ($MM) Production Costs at Pinedale are Low vs. National Average4 Cash Costs Per Mcfe CORR Lease Payment = $0.07/Mcfe1 Pinedale LGS supports $3.5 billion, or ~93% of UPL reservesLease expense is relatively smallUPL is a low cost operator with significant presence in a low cost field

Grand Isle Gathering System Case Study ~$250 million critical midstream infrastructure in the Gulf of Mexico153 miles of undersea pipeline and terminal with separation, SWD and storage facilitiesEssential system to transport crude oil and produced water for large proven reservesTriple-net operating lease with Energy XXI subsidiary – average minimum rent of ~$40 million

GIGS Supports Large Reserves & Low-Cost Operator EXXI Reserve Values as of 3/3/16 EXXI Reduction of Direct LOE Expense1 EXXI Unlevered Cash Expenses Per BOE EXXI 8-K filed 4/14/16, (2) CorEnergy Estimate, (3) Includes PUDs Reclassified by EXXI, due to SEC rules related to capital constraints The GIGS supports $1.7 billion, or ~40% of EXXI reservesLease expense is relatively smallEXXI dedicated to further cost reduction

CorEnergy Stakeholder 1Q16 Per Share Financial Metrics ~1.4x coverage ratio of 1Q16 AFFO per share to 1Q16 dividend allows for return of capital through debt repayment and reinvestment The Company provides non-GAAP performance measures utilized by REITs, including NAREIT Funds From Operations (“NAREIT FFO”), Funds from Operations (“FFO”) and Adjusted Funds from Operations (“AFFO”). Due to legacy investments that we hold, we have historically presented a measure of FFO derived by further adjusting NAREIT FFO for distributions received from investment securities, income tax expense, net, and net distributions and dividend income. Management uses AFFO as a measure of long-term sustainable operational performance. See slides 13 and 14 for a reconciliation of NAREIT FFO, FFO and AFFO, as presented, to Net income attributable to CorEnergy common stockholders. (1) The provision for loan losses, net of taxes, includes the provision for loan loss of ~$4.6 million and income tax benefit of $605 thousand attributed to the Four Wood Financing Note

Capital Structure Capitalization Preferred to Total Equity Ratio: Adjusted ratio of 13.7%, below our 33% target Financing Ratios Well Below Targets Total Debt to Total Capitalization Ratio: Adjusted ratio of 33.7%, within our target range of 25-50% Conservative capital structure limits risk of high fixed costs, such as interest and preferred dividend paymentsRatio of Earnings to Fixed Charges: 2.1xRatio of Earnings to Fixed Charges and Preferred Dividends: 1.6xLiquidity available for future investment: $54.2 million available on revolver and $12.8 million of unrestricted cash = $67 million of available liquidity (1) Sum of CORR and related party debt

CorEnergy Thesis for Dividend Stability Direct access to energy infrastructure assets in an investor-friendly REITOwnership of assets which are critical to tenant revenue generationDividends are based solely on minimum rents Long-term lease contracts support CorEnergy revenueCorEnergy retains debt repayment and reinvestment capital prior to dividend paymentTherefore, we believe the $3.00 annualized dividend is a sustainable payout, with upside from portfolio growth and participating rents

APPENDIX

Non-GAAP Financial Metrics: FFO/AFFO Reconciliation

Non-GAAP Financial Metrics: FFO/AFFO Reconciliation

Non-GAAP Financial Metrics: Contribution Margin MoGas and Omega revenues have been combined and are presented net of Omega's natural gas and propane costs subsequent to the new contract with the DOD executed on January 28, 2016, effective February 1, 2016. In accordance with GAAP, Omega's historical Sales revenue and Cost of sales for the three months ended March 31, 2015 are presented separately, on a gross basis, in the Consolidated Statements of Income and Combined Income in this quarterly report on Form 10-Q. For ease of comparison in this results of operations discussion, Omega's historical Sales revenue, Cost of sales and Operating expenses for the three months ended March 31, 2015 are presented on a gross basis and are included in the Transportation and distribution lines in this table.MoGas' transportation, maintenance and administrative expenses and Omega's operating expenses and cost of sales on non-DOD customers have been combined subsequent to the new contract with the DOD executed on January 28, 2016.

Non-GAAP Financial Metrics: Contribution Margin
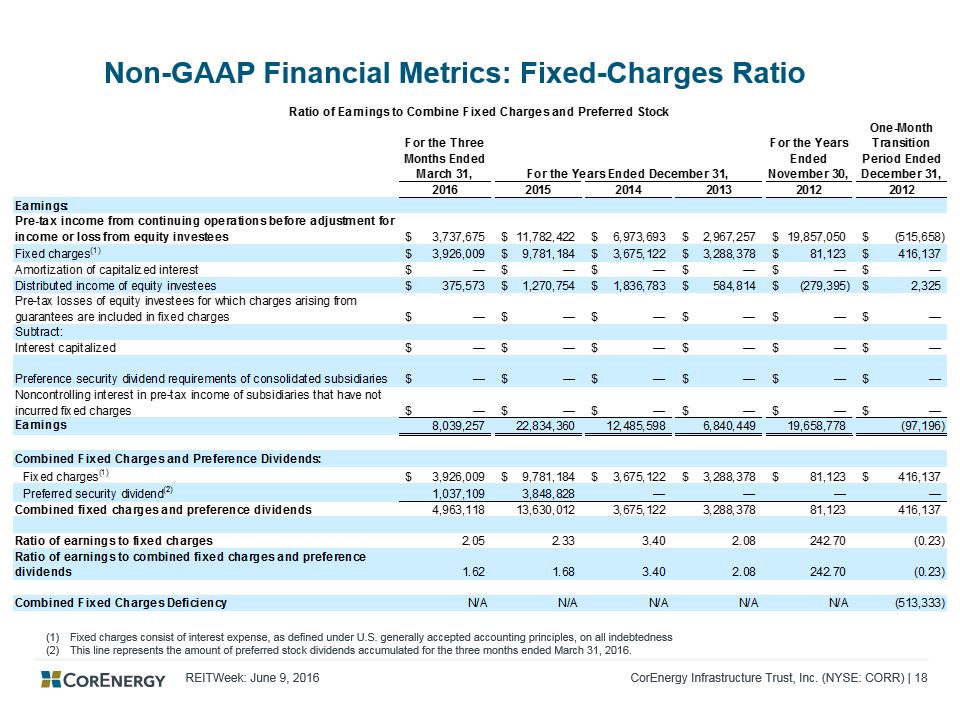
Non-GAAP Financial Metrics: Fixed-Charges Ratio Fixed charges consist of interest expense, as defined under U.S. generally accepted accounting principles, on all indebtednessThis line represents the amount of preferred stock dividends accumulated for the three months ended March 31, 2016.

Expected Next Steps for Bankrupt EXXI & UPL Traditional Chapter 11 Case Timeline Company files for Chapter 11 Negotiate Plan with Lenders Disclosure Statement Filed Creditors Approve Plan Court Confirms Plan Exit Bankruptcy Energy XXI Ltd (Guarantor) Ultra Petroleum Corp. (Guarantor) & Ultra Wyoming LGS, LLC (Tenant) Energy XXI GIGS Services, LLC(Tenant) (not in bankruptcy)

Corporate Structure Alignment with Investors CORR Expense Metrics vs. Peer Group1 Management Agreement Base Fee Incentive Fee Administration Fee Grand Isle Gathering System PinedaleLGS MoGasPipeline PortlandTerminal SWDFacilities OmegaPipeline Assets Fees Management FeeServices provided:Presents the Company with suitable acquisition opportunities, responsible for the day-to-day operations of the Company and performs such services and activities relating to the assets and operations of the Company as may be appropriateBase Fees paid: Quarterly management fee equal to 0.25 percent (1.00 percent annualized) of the value of the Company’s Managed Assets3 as of the end of each quarterIncentive Fees paid: Quarterly incentive fee of 10 percent of the increase in distributions earned over a threshold distribution equal to $0.625 per share per quarter. The Management Agreement also requires at least half of any incentive fees to be reinvested in the Company’s common stockAdministrative FeeServices provided:Performs (or oversees or arranges for the performance of) the administrative services necessary for our operation, including without limitation providing us with equipment, clerical, bookkeeping and record keeping servicesFees paid: 0.04 percent of our aggregate average daily Managed Assets, with a minimum annual fee of $30 thousand External Fee Structure Corporate Structure Peer group consists of REITs included in the RMZ index under $1BN market capGross Asset Value = Asset Value of Investment Properties + Accumulated Depreciation“Managed Assets” is defined as Total Assets of CORR minus the initial invested value of non-controlling interests, the value of any hedged derivative assets, any prepaid expenses, all of the accrued liabilities other than deferred taxes and debt entered into for the purposed of leverage

CorEnergy