Attached files
| file | filename |
|---|---|
| 8-K - FORM 8-K - Virtu KCG Holdings LLC | d172458d8k.htm |
KCG Holdings, Inc. (KCG) Sandler O’Neill Global Exchange and Brokerage Conference June 8, 2016 EXHIBIT 99.1
Safe Harbor Certain statements contained herein and the documents incorporated by reference containing the words “believes,” “intends,” “expects,” “anticipates,” and words of similar meaning, may constitute forward-looking statements as defined in the Private Securities Litigation Reform Act of 1995. These “forward-looking statements” are not historical facts and are based on current expectations, estimates and projections about KCG's industry, management's beliefs and certain assumptions made by management, many of which, by their nature, are inherently uncertain and beyond our control. Any forward-looking statement contained herein speaks only as of the date on which it is made. Accordingly, readers are cautioned that any such forward-looking statements are not guarantees of future performance and are subject to certain risks, uncertainties and assumptions that are difficult to predict including, without limitation, risks associated with: (i) the inability to manage trading strategy performance and sustain revenue and earnings growth; (ii) the sale of KCG Hotspot, including the receipt of additional payments that are subject to certain contingencies; (iii) changes in market structure, legislative, regulatory or financial reporting rules, including the increased focus by Congress, federal and state regulators, the SROs and the media on market structure issues, and in particular, the scrutiny of high frequency trading, alternative trading systems, market fragmentation, colocation, access to market data feeds, and remuneration arrangements such as payment for order flow and exchange fee structures; (iv) past or future changes to KCG's organizational structure and management; (v) KCG's ability to develop competitive new products and services in a timely manner and the acceptance of such products and services by KCG's customers and potential customers; (vi) KCG's ability to keep up with technological changes; (vii) KCG's ability to effectively identify and manage market risk, operational and technology risk, cybersecurity risk, legal risk, liquidity risk, reputational risk, counterparty and credit risk, international risk, regulatory risk, and compliance risk; (viii) the cost and other effects of material contingencies, including litigation contingencies, and any adverse judicial, administrative or arbitral rulings or proceedings; (ix) the effects of increased competition and KCG's ability to maintain and expand market share; (x) the announced plan to relocate KCG’s global headquarters from Jersey City, NJ to New York, NY; and (xi) KCG’s ability to complete the sale or disposition of any or all of the assets or businesses that are classified as held for sale. The list above is not exhaustive. Because forward looking statements involve risks and uncertainties, the actual results and performance of KCG may materially differ from the results expressed or implied by such statements. Given these uncertainties, readers are cautioned not to place undue reliance on such forward-looking statements. Unless otherwise required by law, KCG also disclaims any obligation to update its view of any such risks or uncertainties or to announce publicly the result of any revisions to the forward-looking statements made herein. Readers should carefully review the risks and uncertainties disclosed in KCG’s reports with the U.S. Securities and Exchange Commission (“SEC”), including those detailed in “Risk Factors” in Part I, Item 1A of KCG's Annual Report on Form10-K for the year ended December 31, 2015, “Legal Proceedings” in Part I, Item 3, under “Certain Factors Affecting Results of Operations” in “Management’s Discussion and Analysis of Financial Condition and Results of Operations” in Part II, Item 7, in “Quantitative and Qualitative Disclosures About Market Risk” in Part II, Item 7A, and in other reports or documents KCG files with, or furnishes to, the SEC from time to time. This information should be read in conjunction with KCG’s Consolidated Financial Statements and the Notes thereto contained in its Annual Report on Form 10-K, Quarterly Report on Form 10-Q for the quarter-ended March 31, 2016, and in other reports or documents KCG files with, or furnishes to, the SEC from time to time. For additional disclosures, please see https://www.kcg.com/legal/global-disclosures.
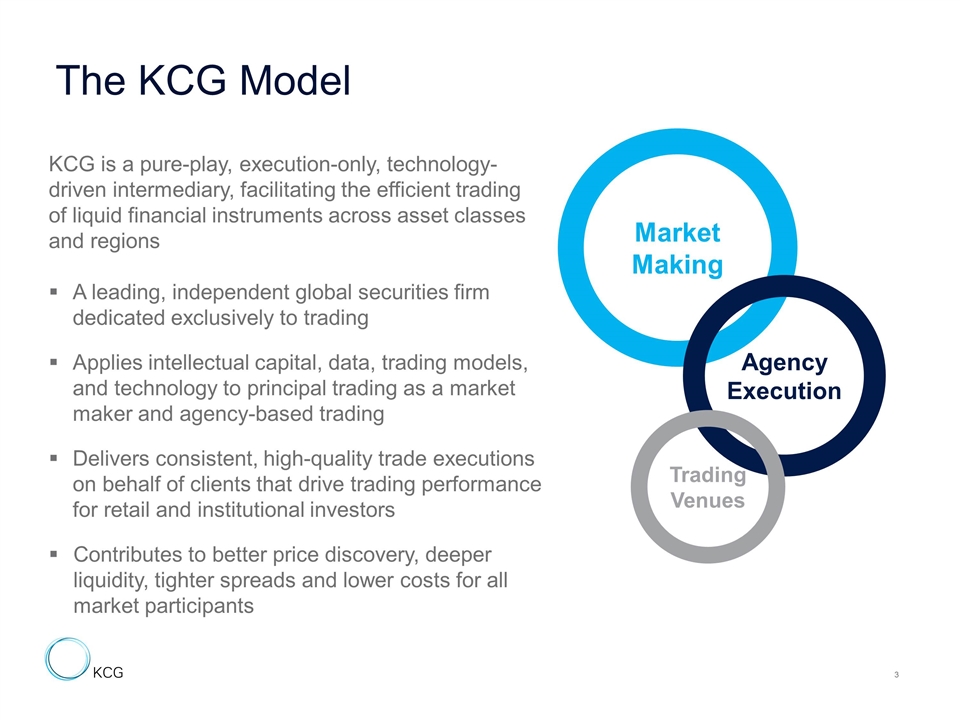
KCG is a pure-play, execution-only, technology-driven intermediary, facilitating the efficient trading of liquid financial instruments across asset classes and regions A leading, independent global securities firm dedicated exclusively to trading Applies intellectual capital, data, trading models, and technology to principal trading as a market maker and agency-based trading Delivers consistent, high-quality trade executions on behalf of clients that drive trading performance for retail and institutional investors Contributes to better price discovery, deeper liquidity, tighter spreads and lower costs for all market participants The KCG Model Market Making Agency Execution Trading Venues
Grow and diversify revenues from market making and agency-based trading Agency-based algorithmic trading in U.S. equities Market making in fixed income, currencies and commodities International expansion in Europe and Asia Reengineer trading and support functions to realize greater operational efficiencies Complete the corporate relocation in the second half of 2016 Continue to return capital to stockholders opportunistically under the recently expanded $200 million stock repurchase program Target a double-digit return on equity in 2017 Current Initiatives
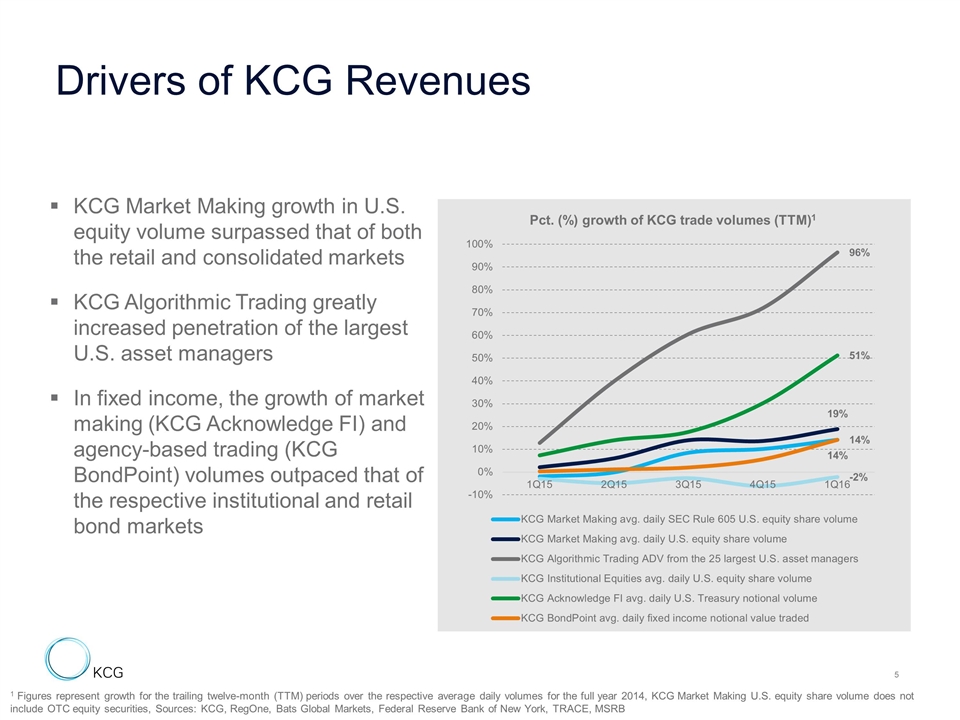
KCG Market Making growth in U.S. equity volume surpassed that of both the retail and consolidated markets KCG Algorithmic Trading greatly increased penetration of the largest U.S. asset managers In fixed income, the growth of market making (KCG Acknowledge FI) and agency-based trading (KCG BondPoint) volumes outpaced that of the respective institutional and retail bond markets Drivers of KCG Revenues 1 Figures represent growth for the trailing twelve-month (TTM) periods over the respective average daily volumes for the full year 2014, KCG Market Making U.S. equity share volume does not include OTC equity securities, Sources: KCG, RegOne, Bats Global Markets, Federal Reserve Bank of New York, TRACE, MSRB
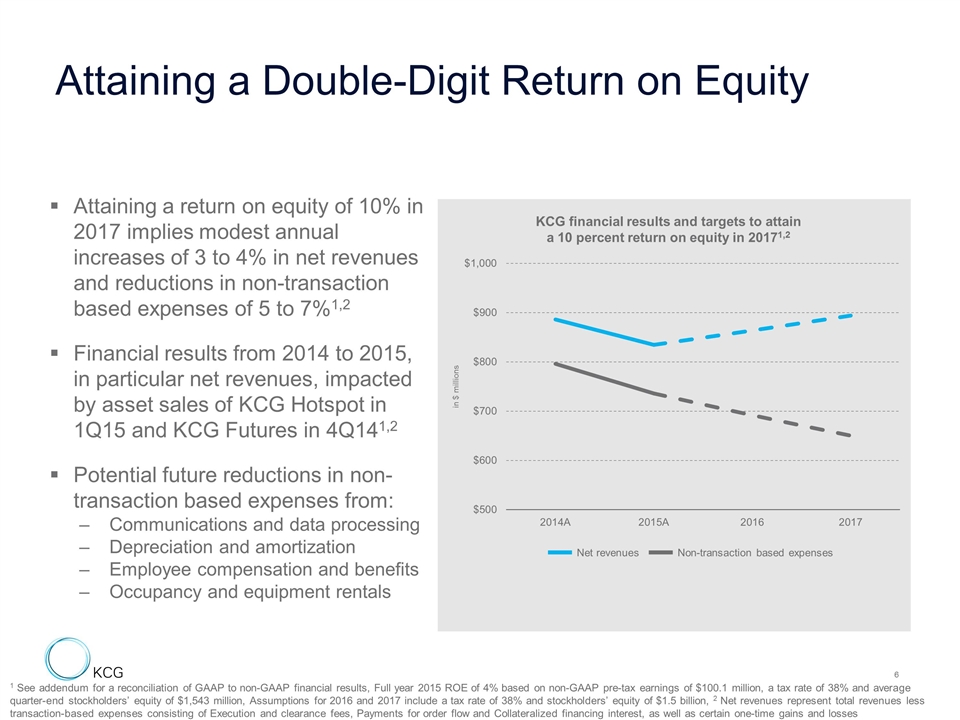
Attaining a return on equity of 10% in 2017 implies modest annual increases of 3 to 4% in net revenues and reductions in non-transaction based expenses of 5 to 7%1,2 Financial results from 2014 to 2015, in particular net revenues, impacted by asset sales of KCG Hotspot in 1Q15 and KCG Futures in 4Q141,2 Potential future reductions in non-transaction based expenses from: Communications and data processing Depreciation and amortization Employee compensation and benefits Occupancy and equipment rentals Attaining a Double-Digit Return on Equity KCG financial results and targets to attain a 10 percent return on equity in 20171,2 Net revenues Non-transaction based expenses 1 See addendum for a reconciliation of GAAP to non-GAAP financial results, Full year 2015 ROE of 4% based on non-GAAP pre-tax earnings of $100.1 million, a tax rate of 38% and average quarter-end stockholders’ equity of $1,543 million, Assumptions for 2016 and 2017 include a tax rate of 38% and stockholders’ equity of $1.5 billion, 2 Net revenues represent total revenues less transaction-based expenses consisting of Execution and clearance fees, Payments for order flow and Collateralized financing interest, as well as certain one-time gains and losses
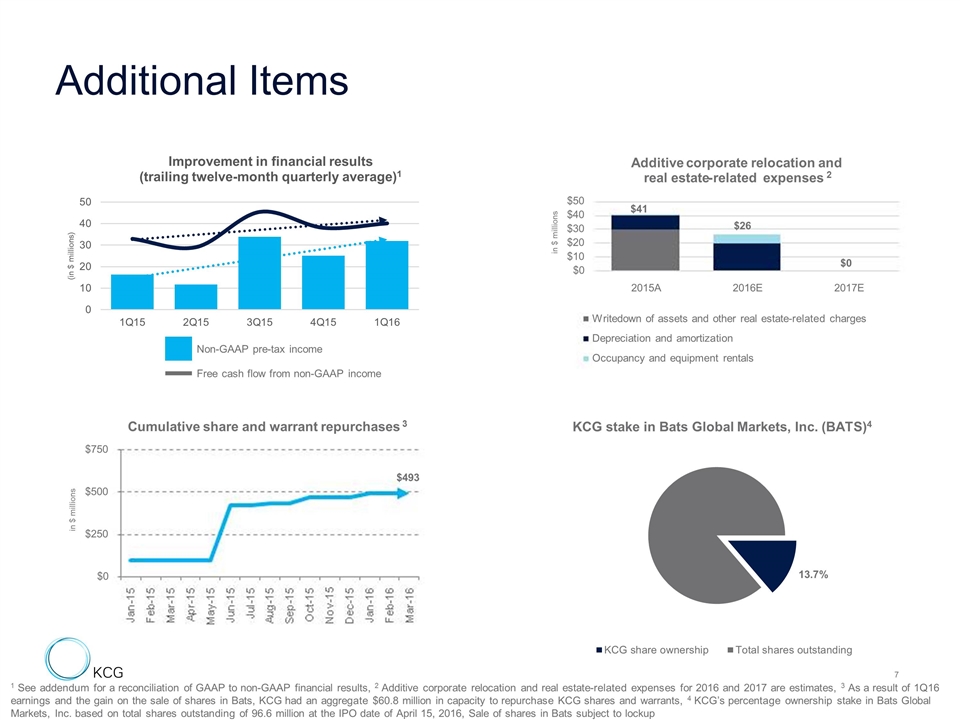
Additional Items Non-GAAP pre-tax income Free cash flow from non-GAAP income 1 See addendum for a reconciliation of GAAP to non-GAAP financial results, 2 Additive corporate relocation and real estate-related expenses for 2016 and 2017 are estimates, 3 As a result of 1Q16 earnings and the gain on the sale of shares in Bats, KCG had an aggregate $60.8 million in capacity to repurchase KCG shares and warrants, 4 KCG’s percentage ownership stake in Bats Global Markets, Inc. based on total shares outstanding of 96.6 million at the IPO date of April 15, 2016, Sale of shares in Bats subject to lockup $41 $26 $0 $493 $0 $250 $500 $750 Cumulative share and warrant repurchases 3 $0 $10 $20 $30 $40 $50 2015A 2016E 2017E Additive corporate relocation and real estate - related expenses 2 Writedown of assets and other real estate-related charges Depreciation and amortization Occupancy and equipment rentals in $ millions in $ millions

Addendum
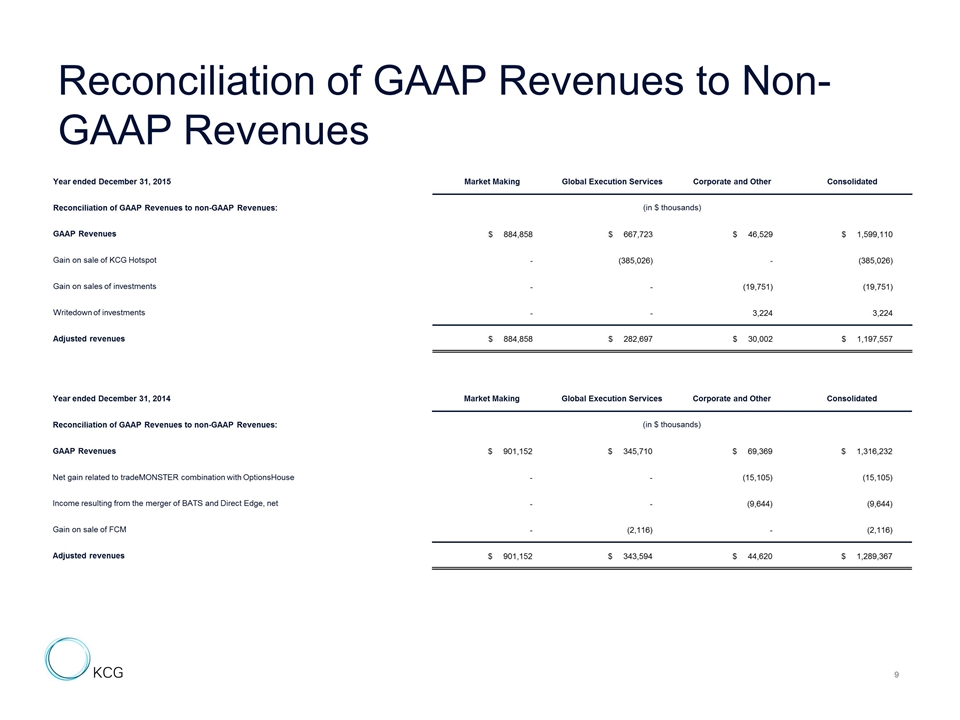
Reconciliation of GAAP Revenues to Non-GAAP Revenues Year ended December 31, 2015 Market Making Global Execution Services Corporate and Other Consolidated Reconciliation of GAAP Revenues to non-GAAP Revenues: (in $ thousands) GAAP Revenues $ 884,858 $ 667,723 $ 46,529 $ 1,599,110 Gain on sale of KCG Hotspot - (385,026) - (385,026) Gain on sales of investments - - (19,751) (19,751) Writedown of investments - - 3,224 3,224 Adjusted revenues $ 884,858 $ 282,697 $ 30,002 $ 1,197,557 Year ended December 31, 2014 Market Making Global Execution Services Corporate and Other Consolidated Reconciliation of GAAP Revenues to non-GAAP Revenues: (in $ thousands) GAAP Revenues $ 901,152 $ 345,710 $ 69,369 $ 1,316,232 Net gain related to tradeMONSTER combination with OptionsHouse - - (15,105) (15,105) Income resulting from the merger of BATS and Direct Edge, net - - (9,644) (9,644) Gain on sale of FCM - (2,116) - (2,116) Adjusted revenues $ 901,152 $ 343,594 $ 44,620 $ 1,289,367
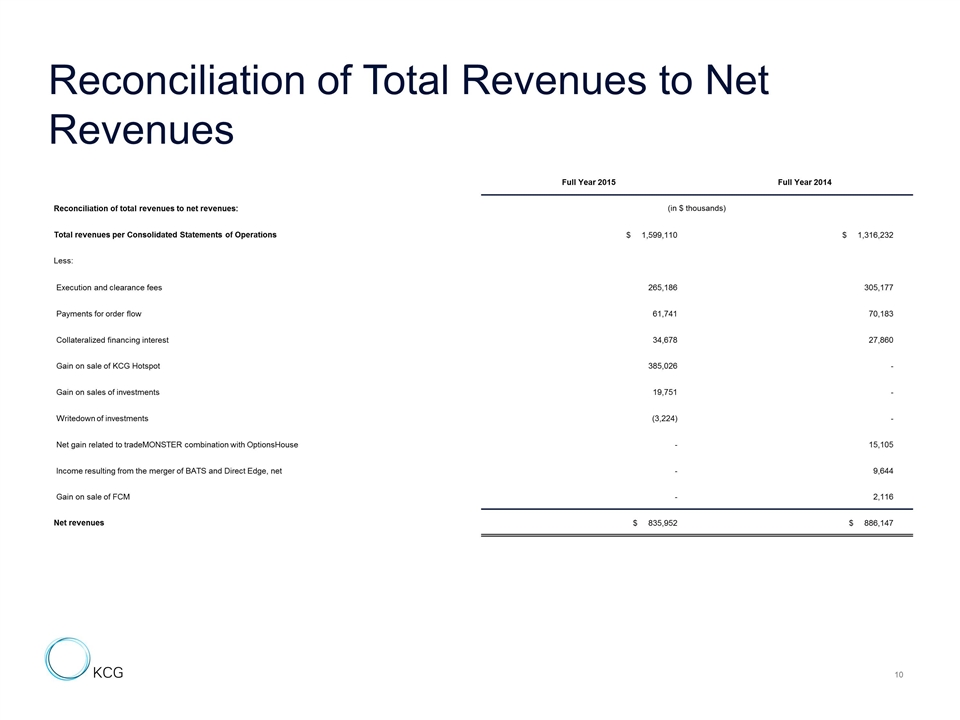
Reconciliation of Total Revenues to Net Revenues Full Year 2015 Full Year 2014 Reconciliation of total revenues to net revenues: (in $ thousands) Total revenues per Consolidated Statements of Operations $ 1,599,110 $ 1,316,232 Less: Execution and clearance fees 265,186 305,177 Payments for order flow 61,741 70,183 Collateralized financing interest 34,678 27,860 Gain on sale of KCG Hotspot 385,026 - Gain on sales of investments 19,751 - Writedown of investments (3,224) - Net gain related to tradeMONSTER combination with OptionsHouse - 15,105 Income resulting from the merger of BATS and Direct Edge, net - 9,644 Gain on sale of FCM - 2,116 Net revenues $ 835,952 $ 886,147
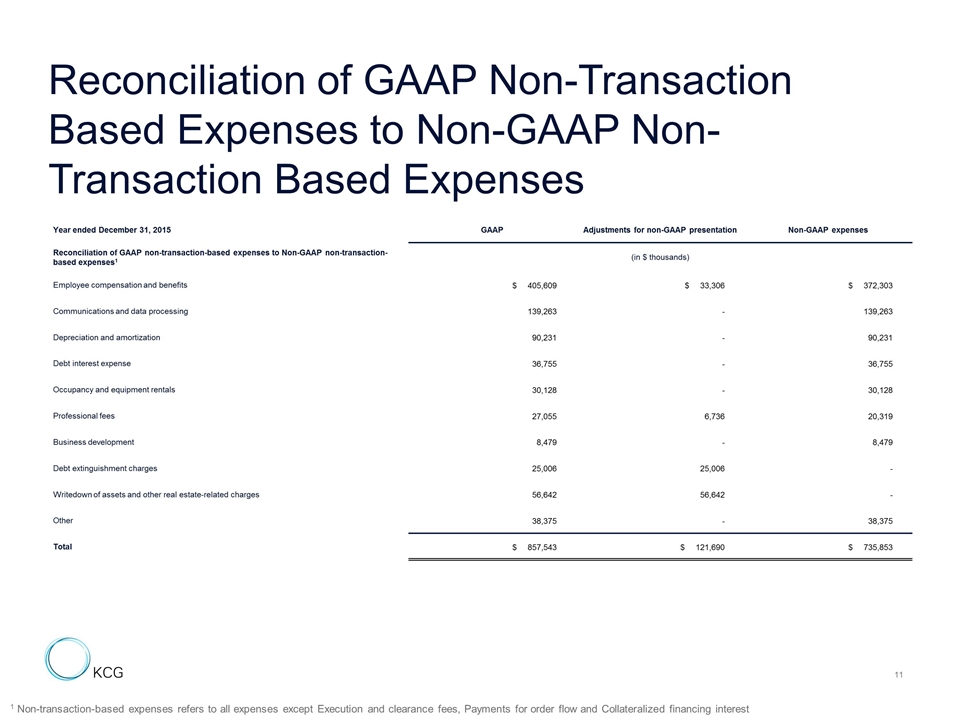
Reconciliation of GAAP Non-Transaction Based Expenses to Non-GAAP Non-Transaction Based Expenses Year ended December 31, 2015 GAAP Adjustments for non-GAAP presentation Non-GAAP expenses Reconciliation of GAAP non-transaction-based expenses to Non-GAAP non-transaction-based expenses1 (in $ thousands) Employee compensation and benefits $ 405,609 $ 33,306 $ 372,303 Communications and data processing 139,263 - 139,263 Depreciation and amortization 90,231 - 90,231 Debt interest expense 36,755 - 36,755 Occupancy and equipment rentals 30,128 - 30,128 Professional fees 27,055 6,736 20,319 Business development 8,479 - 8,479 Debt extinguishment charges 25,006 25,006 - Writedown of assets and other real estate-related charges 56,642 56,642 - Other 38,375 - 38,375 Total $ 857,543 $ 121,690 $ 735,853 1 Non-transaction-based expenses refers to all expenses except Execution and clearance fees, Payments for order flow and Collateralized financing interest
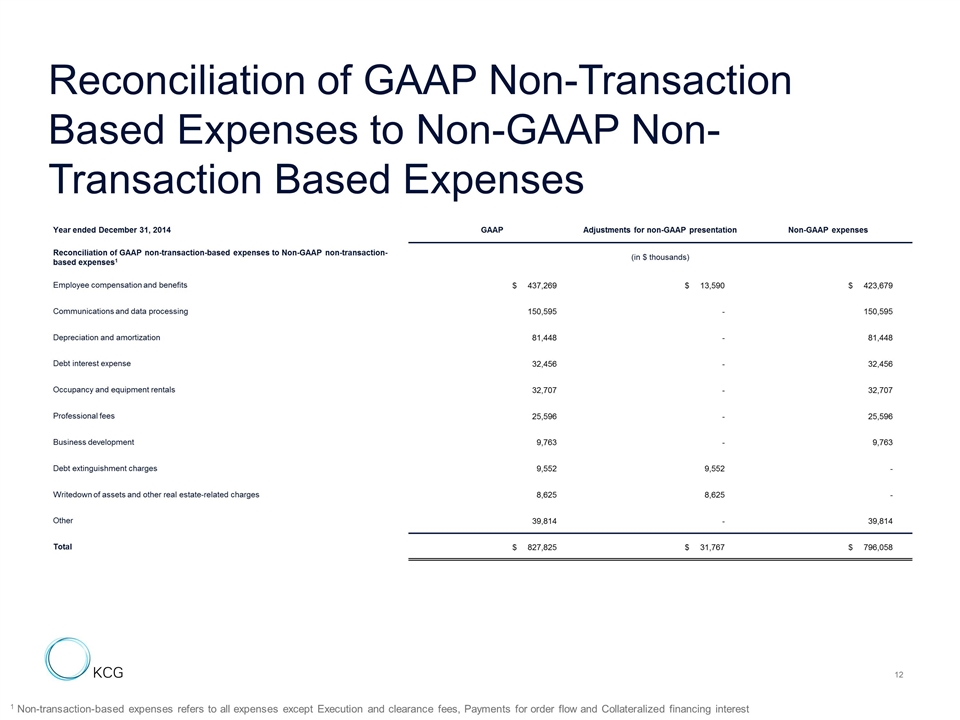
Reconciliation of GAAP Non-Transaction Based Expenses to Non-GAAP Non-Transaction Based Expenses Year ended December 31, 2014 GAAP Adjustments for non-GAAP presentation Non-GAAP expenses Reconciliation of GAAP non-transaction-based expenses to Non-GAAP non-transaction-based expenses1 (in $ thousands) Employee compensation and benefits $ 437,269 $ 13,590 $ 423,679 Communications and data processing 150,595 - 150,595 Depreciation and amortization 81,448 - 81,448 Debt interest expense 32,456 - 32,456 Occupancy and equipment rentals 32,707 - 32,707 Professional fees 25,596 - 25,596 Business development 9,763 - 9,763 Debt extinguishment charges 9,552 9,552 - Writedown of assets and other real estate-related charges 8,625 8,625 - Other 39,814 - 39,814 Total $ 827,825 $ 31,767 $ 796,058 1 Non-transaction-based expenses refers to all expenses except Execution and clearance fees, Payments for order flow and Collateralized financing interest
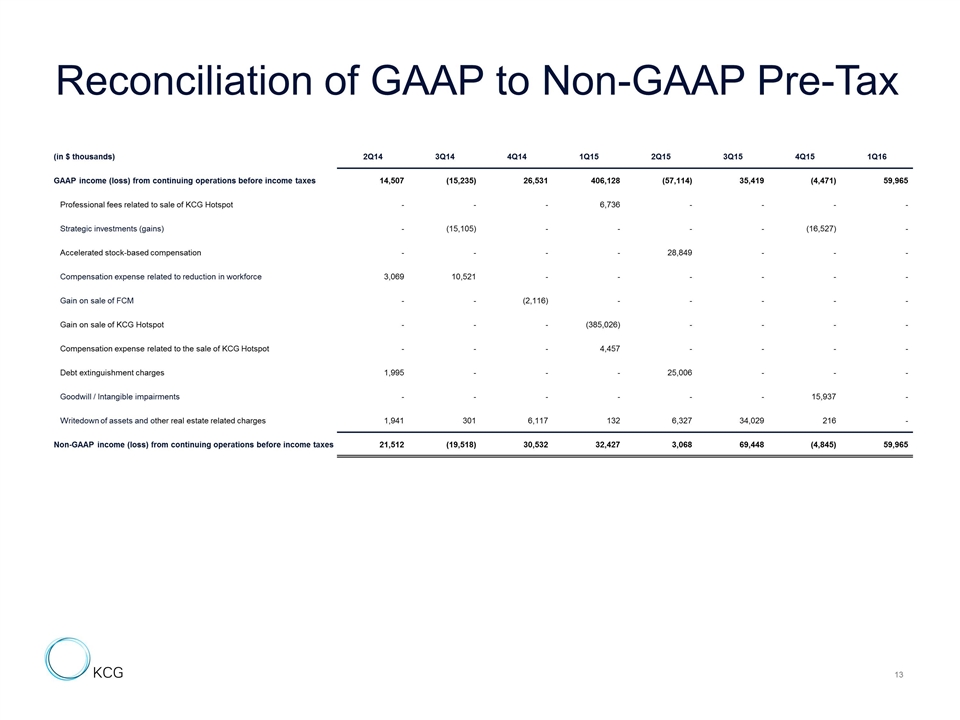
(in $ thousands) 2Q14 3Q14 4Q14 1Q15 2Q15 3Q15 4Q15 1Q16 GAAP income (loss) from continuing operations before income taxes 14,507 (15,235) 26,531 406,128 (57,114) 35,419 (4,471) 59,965 Professional fees related to sale of KCG Hotspot - - - 6,736 - - - - Strategic investments (gains) - (15,105) - - - - (16,527) - Accelerated stock-based compensation - - - - 28,849 - - - Compensation expense related to reduction in workforce 3,069 10,521 - - - - - - Gain on sale of FCM - - (2,116) - - - - - Gain on sale of KCG Hotspot - - - (385,026) - - - - Compensation expense related to the sale of KCG Hotspot - - - 4,457 - - - - Debt extinguishment charges 1,995 - - - 25,006 - - - Goodwill / Intangible impairments - - - - - - 15,937 - Writedown of assets and other real estate related charges 1,941 301 6,117 132 6,327 34,029 216 - Non-GAAP income (loss) from continuing operations before income taxes 21,512 (19,518) 30,532 32,427 3,068 69,448 (4,845) 59,965 Reconciliation of GAAP to Non-GAAP Pre-Tax

