Attached files
| file | filename |
|---|---|
| 8-K - 8-K - VORNADO REALTY TRUST | a16-12968_18k.htm |
Exhibit 99.1
FORWARD LOOKING STATEMENTS Certain statements in this investor presentation are “forward-looking statements” as such term is defined in Section 27A of the Securities Act of 1933, as amended, and Section 21E of the Securities Exchange Act of 1934, as amended. Forward-looking statements are not guarantees of performance. They represent our intentions, plans, expectations and beliefs and are subject to numerous assumptions, risks and uncertainties. Our future results, financial condition and business may differ materially from those expressed in these forward-looking statements. You can find many of these statements by looking for words such as “approximates,” “believes,” “expects,” “projects,” “anticipates,” “estimates,” “intends,” “plans,” “would,” “may” or other similar expressions in this investor presentation. We also note the following forward-looking statements: our incremental cash revenue and projected EBITDA. Many of the factors that will determine the outcome of these and our other forward-looking statements are beyond our ability to control or predict. For further discussion of factors that could materially affect the outcome of our forward-looking statements, see “Item 1A. Risk Factors” in our Annual Report on Form 10-K for the year ended December 31, 2015. For these statements, we claim the protection of the safe harbor for forward-looking statements contained in the Private Securities Litigation Reform Act of 1995. You are cautioned not to place undue reliance on our forward-looking statements, which speak only as of the date of this presentation. All subsequent written and oral forward-looking statements attributable to us or any person acting on our behalf are expressly qualified in their entirety by the cautionary statements contained or referred to in our Annual Report on Form 10-K, as amended. We do not undertake any obligation to release publicly any revisions to our forward-looking statements to reflect events or circumstances occurring after the date of this presentation.

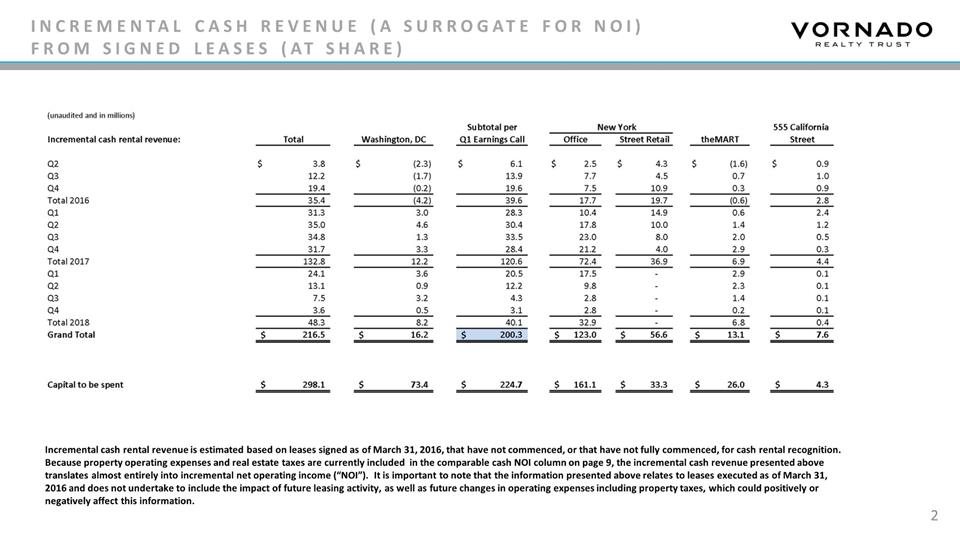
incremental cash revenue (a surrogate for NOI) From signed leases (AT share) Incremental cash rental revenue is estimated based on leases signed as of March 31, 2016, that have not commenced, or that have not fully commenced, for cash rental recognition. Because property operating expenses and real estate taxes are currently included in the comparable cash NOI column on page 9, the incremental cash revenue presented above translates almost entirely into incremental net operating income (“NOI”). It is important to note that the information presented above relates to leases executed as of March 31, 2016 and does not undertake to include the impact of future leasing activity, as well as future changes in operating expenses including property taxes, which could positively or negatively affect this information. kmaudned and in nkilioi,d Incremental cash rental revenue: Total Washington, OC Subtotal per COrnirgi s Call New York theMART 555 California Street Off Ice Street Retat Cl2 S 3.8 $ (23) $ 6.1 $ 2.5 $ 4.3 $ (1.0) 5 09 ci.(3) 12.2 11-71 13.9 7.7 4.5 03 1.0 CO 19.4 10.21 19.6 7.5 10.9 0.3 0.9 Total 2016 35.4 14.21 39.6 17.7 19.7 P.6) 2.6 41 51.3 3.0 20.3 204 14.9 0.0 2.4 42 35.0 4.3 30.4 170 10.0 IA 1.2 013 34.8 1.3 33.5 23.0 8.0 2.0 0.5 44 31.7 3.3 28.4 21.2 4.0 2.9 0.3 Total 2017 132.8 12.2 120.6 72.4 36.9 6.9 4.4 Q1 24.1 3.6 20.5 17.5 2.9 0.1 Q2 13.1 0.9 12.2 9.8 2.3 0.1 Q3 7.5 3.2 4.3 2.8 1.4 0.1 Q4 3.6 0.5 3.1 2.8 0.2 0.1 Total 2018 48.3 8.2 40.1 32.9 6.8 0.4 Grand Total 5 216.5 $ 16.2 $ 200.3 $ 123.0 $ 56.6 $ 13.1 $ 7.6 Capital to be spent 298.1 73.4 224.7 $ 161.1 $ 33.3 $ 26.0 4.3 1
Components of net asset value (AT share) Q12016 Annualized (unaudited and in millions, except share amounts(Comparable EBITDA Non-cash Adjustments ill, Add-back: G&A 121 Comparable Cash 601 Incremental Na I from Signed Leases (see page 8) Pro-forma Cash 601 New ‘York - Office (excludes BMS) $ 591 $ (76) $ 37 $ 552 $ 123 $ 675 New ‘York - Street Retail 373 (89) 284 57 341 New York - Residential 25 (2) 23 23 Washington DC - Office (excludes Skyline) 248 (18) 32 262 16 278 Washington DC - Residential 37 - 37 37 theMART 92 ((8)) 7 91 13 104 555 California Street 46 (21) 25 0 33 nl Total Vornado $ 1,412 $ (214) $ 76 $ 1,274 $ 217 $ 1,491 Cash, restricted cash and marketable securities 220 CPS - incremental value after repayment of debt and taxes The Bartlett - stabilized residential 601 (excluding Whole Foods) at 4.75% cap rate Hotel Pennsylvania AIX - 1,654,000 shares at $370.98 per share UE - 5,717,000 shares at $21.28 per share PEI - 6,250,000 shares at $27.66 per share 85 10th Avenue 141 Real Estate Fund investments (at VNO’s share of fair value) BMS (annualized 0.1. 2016 EBITDA of $20 at a 7.0x multiple) Other CIP (at book value) Other assets (at hook value) Total Other Asset Values Liabilites (see page 10) NAV Per Share - Weighted average shares - Operating Pat nership basis - 202.3 million shares Other Asset Values $ 1,958 900 345 500 614 133 158 250 193 140 283 569 $ 6,043 $ 12,385 2

Notes to Components of net asset value: 3 Annualized straight-line rent adjustments and acquired below market leases non-cash income (FAS 141) , inclusive of our share of unconsolidated joint ventures; and $21 for annualized other non-cash adjustments including (i) add back of one-time straight line rent receivable write-offs from our early termination of tenant leases, offset by (ii) elimination of FAS 141 accelerated income from our early termination of tenant leases and (iii) elimination of non-cash EBITDA from 666 Fifth Avenue - Office. G&A for the New York segment is reflected in New York Office (i.e., not allocated to Retail or Residential). G&A for the Washington, DC segment is reflected in Washington DC Office - excluding Skyline (i.e., not allocated to Skyline and residential). New York segment G&A expense includes $6.4 million which is the annualized effect of Q1 2016 OPP award accelerated amortization. Excludes incremental NOI from the lease-up of 315 and 345 Montgomery Street. Estimate of accreted mezzanine loan value plus 50% of the equity. 220 Central Park South debt of $950 and Skyline debt of $696. 666 Fifth Avenue – Office. 220 Central Park South term loan balance of $375. 1535 Broadway capital lease obligation of $240 which will be offset by the incremental value from purchasing the fee from Host Hotels & Resorts in the future. Components of net asset value (AT share) Incremental cash rental revenue is estimated based on leases signed as of March 31, 2016, that have not commenced, or that have not fully commenced, for cash rental recognition. Because property operating expenses and real estate taxes are currently included in the comparable cash NOI column on page 9, the incremental cash revenue presented on page 8 translates almost entirely into incremental net operating income (“NOI”). It is important to note that the information presented above relates to leases executed as of March 31, 2016 and does not undertake to include the impact of future leasing activity, as well as future changes in operating expenses including property taxes, which could positively or negatively affect this information. (unaudited and in millions) Liabilities Consolidated mortgage notes payable, net of non-controlling interests Non-consolidated real estate debt Corporate unsecured debt Revolver /term loan Other liabilities (at book value) Perpetual preferred (at redemption value) Capital required for leases signed (see page 8) Capital required to complete The Bartlett construction Total Liabilities As Reported Q116 Adjustments Net $ 9,367 $ (1,646) (151) $ 7,721 1,992 (636) (161) 1,356 850 - 850 375 (375) (17) 999 (240) (Is) 759 1,322 1,322 298 298 79 79 $ 14,905 $ (2,520) $ 12,385

4 APPENDIX - RECONCILIATION OF NET (LOSS) INCOME TO EBITDA AS ADJUSTED FOR COMPARABILITY (unaudited and in thousands) Three Months Ended March 31, 2016 Net (loss) income attributable to Vornado Interest and debt expense, including our share of partially owned Depreciation and amortization, including our share of partially owned Income tax expense, including our share of partially owned EBITDA Items that affect comparability expense (income): Skyline properties impairment loss Acquisition and transaction related costs Our share of PREIT impairment loss EBITDA from discontinued operations and sold properties Net gain on sale of residential condominiums Other Noncontrolling interest and unit distributions EBITDA as adjusted for comparability Total Newyork Washington, DC Other 5 (93,799) 5 79,808 $ (146,737) $ (26,870) 126,120 71,198 19,406 35,516 174,811 108,403 42,681 23,727 3,261 1,090 265 1,906 210,393 260,499 (84,385) 34,279 160,700 160,700 4,607 4,607 4,353 4,353 (721) (721) (714) (714 ) (500) (500 ) (7,487) (7,487) $ 370,631 $ 260,499 (CI)’ 76,315 (2) $ 33,817

5 APPENDIX - NOTES TO RECONCILIATION OF NET (LOSS) INCOME TO EBITDA AS ADJUSTED FOR COMPARABILITY The amounts in these captions (for this table only) exclude the results of the mark-to-market of our deferred compensation plan of $1,938 loss for the three months ended March 31, 2016. APPENDIX - NOTES TO RECONCILIATION OF NET (LOSS) VORNADO INCOME TO EBITDA AS ADJUSTED FOR COMPARABILITY REALTY TRUST Three Months Ended Mardi 31, 2016 (1) Detalls of New York EBITDA as adjusted for comm.., Office (Including MI5 EBITDA of $5,045) 152,729 Retail 93,323 Residential 6,350 Alexander’s 11,569 Hotel Pennsylvanla (3,472) Total New York290,499 (2) Details of Washington, DC EBITDA as adjusted for comparability: Office, excluding the Skyline properties 65)13 1,51•1.271s• PAO 11.6.1,41 51.135 TOW WashIngeon,DE 6 26315 114 31 ...0.4.4*.V.123061e.384 IRENRE bean nn 2111 1.531 1519 Curled ...frax Tool •••1110106.1nirsornme 5}11 0’04.1 Iraq WWII 23,0/6 351 2.14.3 36. 11.615 1,119 0.• HATS Ecrparamp.ral an4a6rn.L.raelr•aligen... 1151961 Isms • ew3aNa 00.7 033 ,911 1,811 reudnq i1.101.4
