Attached files
| file | filename |
|---|---|
| EX-99.2 - EX-99.2 - NorthStar Asset Management Group Inc. | a16-12804_3ex99d2.htm |
| 8-K - 8-K - NorthStar Asset Management Group Inc. | a16-12804_38k.htm |
Exhibit 99.1
Colony NorthStar Combination of NorthStar Asset Management Group Inc., Colony Capital, Inc. and NorthStar Realty Finance Corp. Creating a Leading Global Equity REIT with an Embedded Investment Management Platform June 7, 2016 (Updated)
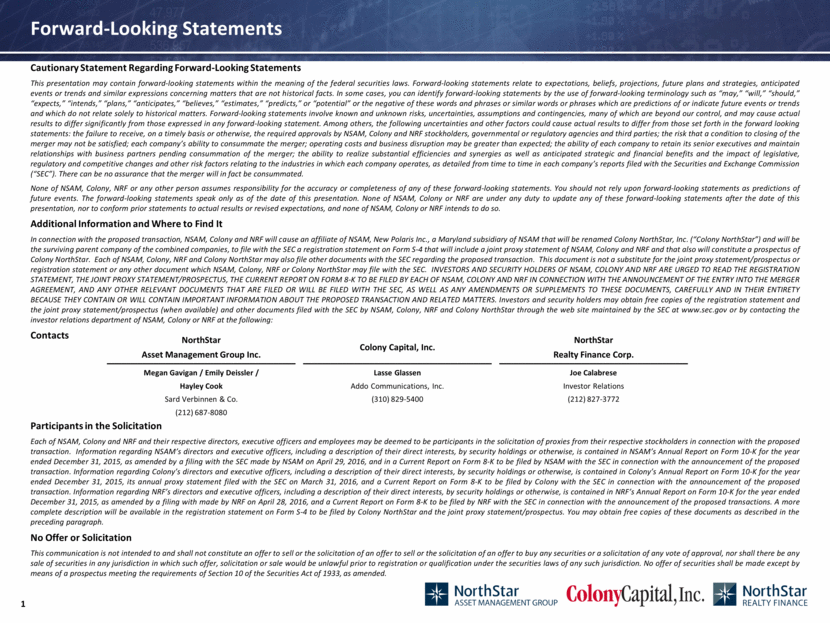
Forward-Looking Statements Cautionary Statement Regarding Forward-Looking Statements This presentation may contain forward-looking statements within the meaning of the federal securities laws. Forward-looking statements relate to expectations, beliefs, projections, future plans and strategies, anticipated events or trends and similar expressions concerning matters that are not historical facts. In some cases, you can identify forward-looking statements by the use of forward-looking terminology such as “may,” “will,” “should,” “expects,” “intends,” “plans,” “anticipates,” “believes,” “estimates,” “predicts,” or “potential” or the negative of these words and phrases or similar words or phrases which are predictions of or indicate future events or trends and which do not relate solely to historical matters. Forward-looking statements involve known and unknown risks, uncertainties, assumptions and contingencies, many of which are beyond our control, and may cause actual results to differ significantly from those expressed in any forward-looking statement. Among others, the following uncertainties and other factors could cause actual results to differ from those set forth in the forward looking statements: the failure to receive, on a timely basis or otherwise, the required approvals by NSAM, Colony and NRF stockholders, governmental or regulatory agencies and third parties; the risk that a condition to closing of the merger may not be satisfied; each company’s ability to consummate the merger; operating costs and business disruption may be greater than expected; the ability of each company to retain its senior executives and maintain relationships with business partners pending consummation of the merger; the ability to realize substantial efficiencies and synergies as well as anticipated strategic and financial benefits and the impact of legislative, regulatory and competitive changes and other risk factors relating to the industries in which each company operates, as detailed from time to time in each company’s reports filed with the Securities and Exchange Commission (“SEC”). There can be no assurance that the merger will in fact be consummated. None of NSAM, Colony, NRF or any other person assumes responsibility for the accuracy or completeness of any of these forward-looking statements. You should not rely upon forward-looking statements as predictions of future events. The forward-looking statements speak only as of the date of this presentation. None of NSAM, Colony or NRF are under any duty to update any of these forward-looking statements after the date of this presentation, nor to conform prior statements to actual results or revised expectations, and none of NSAM, Colony or NRF intends to do so. Additional Information and Where to Find It In connection with the proposed transaction, NSAM, Colony and NRF will cause an affiliate of NSAM, New Polaris Inc., a Maryland subsidiary of NSAM that will be renamed Colony NorthStar, Inc. (“Colony NorthStar”) and will be the surviving parent company of the combined companies, to file with the SEC a registration statement on Form S-4 that will include a joint proxy statement of NSAM, Colony and NRF and that also will constitute a prospectus of Colony NorthStar. Each of NSAM, Colony, NRF and Colony NorthStar may also file other documents with the SEC regarding the proposed transaction. This document is not a substitute for the joint proxy statement/prospectus or registration statement or any other document which NSAM, Colony, NRF or Colony NorthStar may file with the SEC. INVESTORS AND SECURITY HOLDERS OF NSAM, COLONY AND NRF ARE URGED TO READ THE REGISTRATION STATEMENT, THE JOINT PROXY STATEMENT/PROSPECTUS, THE CURRENT REPORT ON FORM 8-K TO BE FILED BY EACH OF NSAM, COLONY AND NRF IN CONNECTION WITH THE ANNOUNCEMENT OF THE ENTRY INTO THE MERGER AGREEMENT, AND ANY OTHER RELEVANT DOCUMENTS THAT ARE FILED OR WILL BE FILED WITH THE SEC, AS WELL AS ANY AMENDMENTS OR SUPPLEMENTS TO THESE DOCUMENTS, CAREFULLY AND IN THEIR ENTIRETY BECAUSE THEY CONTAIN OR WILL CONTAIN IMPORTANT INFORMATION ABOUT THE PROPOSED TRANSACTION AND RELATED MATTERS. Investors and security holders may obtain free copies of the registration statement and the joint proxy statement/prospectus (when available) and other documents filed with the SEC by NSAM, Colony, NRF and Colony NorthStar through the web site maintained by the SEC at www.sec.gov or by contacting the investor relations department of NSAM, Colony or NRF at the following: Contacts Participants in the Solicitation Each of NSAM, Colony and NRF and their respective directors, executive officers and employees may be deemed to be participants in the solicitation of proxies from their respective stockholders in connection with the proposed transaction. Information regarding NSAM’s directors and executive officers, including a description of their direct interests, by security holdings or otherwise, is contained in NSAM’s Annual Report on Form 10-K for the year ended December 31, 2015, as amended by a filing with the SEC made by NSAM on April 29, 2016, and in a Current Report on Form 8-K to be filed by NSAM with the SEC in connection with the announcement of the proposed transaction. Information regarding Colony’s directors and executive officers, including a description of their direct interests, by security holdings or otherwise, is contained in Colony’s Annual Report on Form 10-K for the year ended December 31, 2015, its annual proxy statement filed with the SEC on March 31, 2016, and a Current Report on Form 8-K to be filed by Colony with the SEC in connection with the announcement of the proposed transaction. Information regarding NRF’s directors and executive officers, including a description of their direct interests, by security holdings or otherwise, is contained in NRF’s Annual Report on Form 10-K for the year ended December 31, 2015, as amended by a filing with made by NRF on April 28, 2016, and a Current Report on Form 8-K to be filed by NRF with the SEC in connection with the announcement of the proposed transactions. A more complete description will be available in the registration statement on Form S-4 to be filed by Colony NorthStar and the joint proxy statement/prospectus. You may obtain free copies of these documents as described in the preceding paragraph. No Offer or Solicitation This communication is not intended to and shall not constitute an offer to sell or the solicitation of an offer to sell or the solicitation of an offer to buy any securities or a solicitation of any vote of approval, nor shall there be any sale of securities in any jurisdiction in which such offer, solicitation or sale would be unlawful prior to registration or qualification under the securities laws of any such jurisdiction. No offer of securities shall be made except by means of a prospectus meeting the requirements of Section 10 of the Securities Act of 1933, as amended. NorthStar Asset Management Group Inc. Colony Capital, Inc. NorthStar Realty Finance Corp. Megan Gavigan / Emily Deissler / Hayley Cook Sard Verbinnen & Co. (212) 687-8080 Lasse Glassen Addo Communications, Inc. (310) 829-5400 Joe Calabrese Investor Relations (212) 827-3772
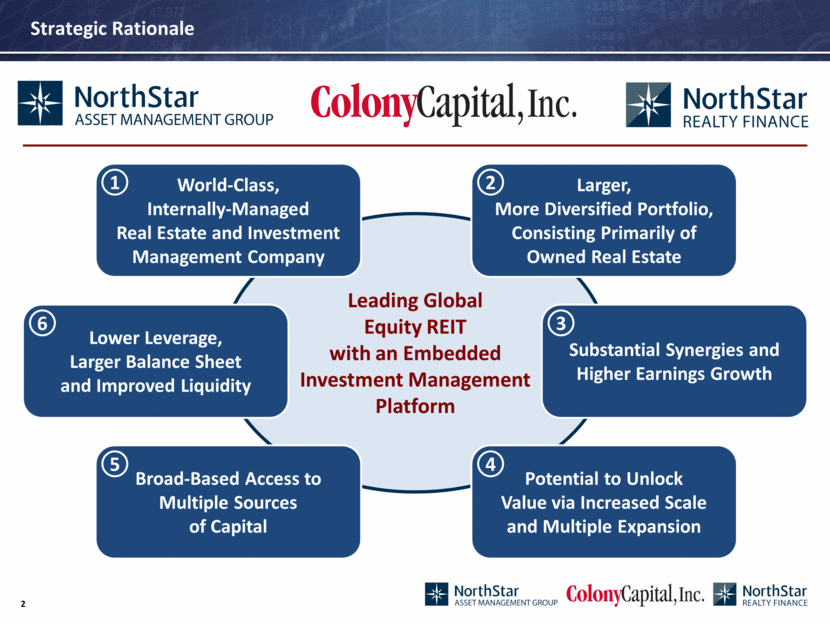
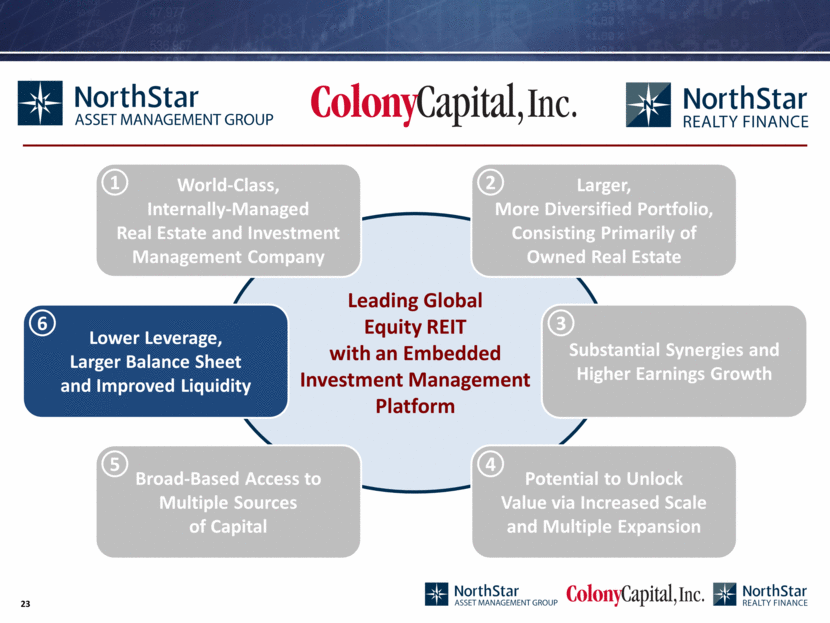
Leading Global Equity REIT with an Embedded Investment Management Platform Strategic Rationale World-Class, Internally-Managed Real Estate and Investment Management Company 1 Larger, More Diversified Portfolio, Consisting Primarily of Owned Real Estate 2 Substantial Synergies and Higher Earnings Growth 3 Potential to Unlock Value via Increased Scale and Multiple Expansion 4 Broad-Based Access to Multiple Sources of Capital 5 Lower Leverage, Larger Balance Sheet and Improved Liquidity 6
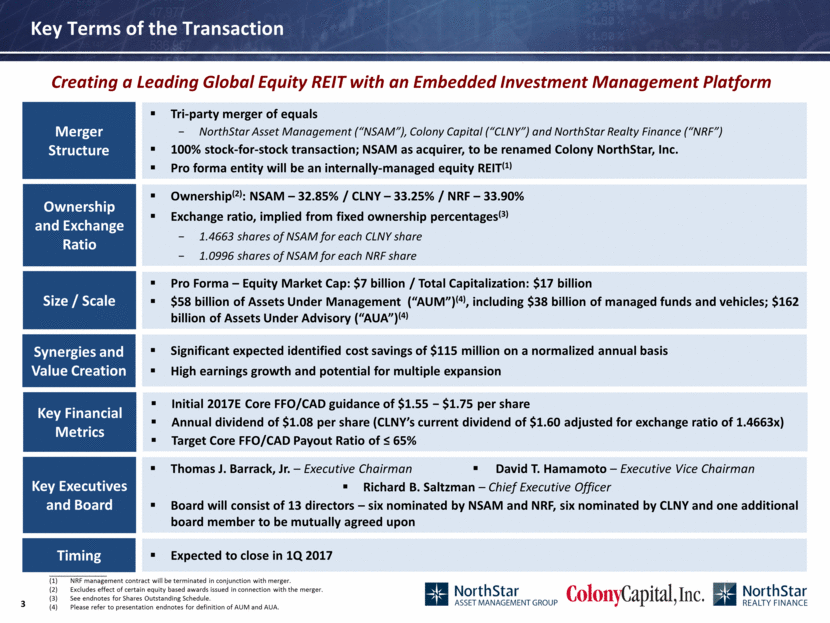
Key Terms of the Transaction Timing Merger Structure Key Executives and Board Synergies and Value Creation Tri-party merger of equals NorthStar Asset Management (“NSAM”), Colony Capital (“CLNY”) and NorthStar Realty Finance (“NRF”) 100% stock-for-stock transaction; NSAM as acquirer, to be renamed Colony NorthStar, Inc. Pro forma entity will be an internally-managed equity REIT(1) Thomas J. Barrack, Jr. – Executive Chairman David T. Hamamoto – Executive Vice Chairman Richard B. Saltzman – Chief Executive Officer Board will consist of 13 directors – six nominated by NSAM and NRF, six nominated by CLNY and one additional board member to be mutually agreed upon Significant expected identified cost savings of $115 million on a normalized annual basis High earnings growth and potential for multiple expansion Ownership and Exchange Ratio Ownership(2): NSAM – 32.85% / CLNY – 33.25% / NRF – 33.90% Exchange ratio, implied from fixed ownership percentages(3) 1.4663 shares of NSAM for each CLNY share 1.0996 shares of NSAM for each NRF share Size / Scale Pro Forma – Equity Market Cap: $7 billion / Total Capitalization: $17 billion $58 billion of Assets Under Management (“AUM”)(4), including $38 billion of managed funds and vehicles; $162 billion of Assets Under Advisory (“AUA”)(4) Key Financial Metrics Initial 2017E Core FFO/CAD guidance of $1.55 - $1.75 per share Annual dividend of $1.08 per share (CLNY’s current dividend of $1.60 adjusted for exchange ratio of 1.4663x) Target Core FFO/CAD Payout Ratio of <65% Creating a Leading Global Equity REIT with an Embedded Investment Management Platform ________________ NRF management contract will be terminated in conjunction with merger. Excludes effect of certain equity based awards issued in connection with the merger. See endnotes for Shares Outstanding Schedule. Please refer to presentation endnotes for definition of AUM and AUA. Expected to close in 1Q 2017
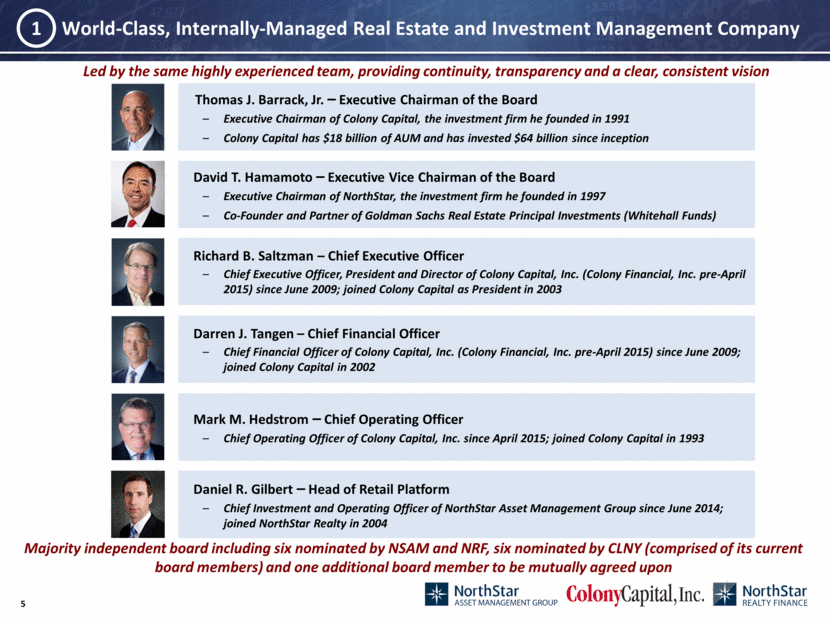
Leading Global Equity REIT with an Embedded Investment Management Platform World-Class, Internally-Managed Real Estate and Investment Management Company 1 Larger, More Diversified Portfolio, Consisting Primarily of Owned Real Estate 2 Substantial Synergies and Higher Earnings Growth 3 Potential to Unlock Value via Increased Scale and Multiple Expansion 4 Broad-Based Access to Multiple Sources of Capital 5 Lower Leverage, Larger Balance Sheet and Improved Liquidity 6
1 Led by the same highly experienced team, providing continuity, transparency and a clear, consistent vision Thomas J. Barrack, Jr. – Executive Chairman of the Board Executive Chairman of Colony Capital, the investment firm he founded in 1991 Colony Capital has $18 billion of AUM and has invested $64 billion since inception David T. Hamamoto – Executive Vice Chairman of the Board Executive Chairman of NorthStar, the investment firm he founded in 1997 Co-Founder and Partner of Goldman Sachs Real Estate Principal Investments (Whitehall Funds) Richard B. Saltzman – Chief Executive Officer Chief Executive Officer, President and Director of Colony Capital, Inc. (Colony Financial, Inc. pre-April 2015) since June 2009; joined Colony Capital as President in 2003 Darren J. Tangen – Chief Financial Officer Chief Financial Officer of Colony Capital, Inc. (Colony Financial, Inc. pre-April 2015) since June 2009; joined Colony Capital in 2002 Daniel R. Gilbert – Head of Retail Platform Chief Investment and Operating Officer of NorthStar Asset Management Group since June 2014; joined NorthStar Realty in 2004 Majority independent board including six nominated by NSAM and NRF, six nominated by CLNY (comprised of its current board members) and one additional board member to be mutually agreed upon World-Class, Internally-Managed Real Estate and Investment Management Company Mark M. Hedstrom – Chief Operating Officer Chief Operating Officer of Colony Capital, Inc. since April 2015; joined Colony Capital in 1993
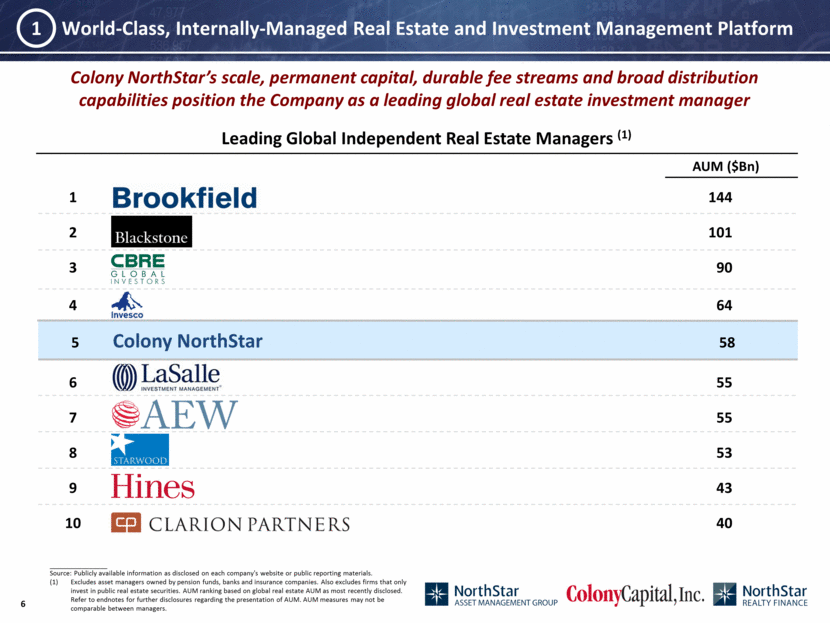
1 World-Class, Internally-Managed Real Estate and Investment Management Platform 1 144 2 101 3 90 4 64 5 Colony NorthStar 58 6 55 7 55 8 53 9 43 10 40 Leading Global Independent Real Estate Managers (1) AUM ($Bn) Colony NorthStar’s scale, permanent capital, durable fee streams and broad distribution capabilities position the Company as a leading global real estate investment manager ________________ Source: Publicly available information as disclosed on each company's website or public reporting materials. (1) Excludes asset managers owned by pension funds, banks and insurance companies. Also excludes firms that only invest in public real estate securities. AUM ranking based on global real estate AUM as most recently disclosed. Refer to endnotes for further disclosures regarding the presentation of AUM. AUM measures may not be comparable between managers.
World-Class, Internally-Managed Real Estate and Investment Management Company 1 AUM: $58 billion (AUA: $162 billion) Equity Market Capitalization: $7 billion Total Capitalization: $17 billion Balance Sheet AUM $7 billion Investment Management AUM $11 billion Balance Sheet AUM $13 billion(2) Investment Management AUM (Not Applicable) Balance Sheet AUM (Not Applicable) Investment Management AUM $27 billion(1) Balance Sheet AUM $20 billion Colony NorthStar Investment Management AUM $38 billion ________________ Note: AUM figures as of March 31, 2016. Definition of AUM described in the endnote section of this presentation. Excludes NRF’s direct balance sheet AUM. Includes NRF’s and NSAM’s indirect AUM through strategic partnerships/joint ventures with American Healthcare Investors (NSAM-43% ownership) and RXR (NRF-27%). Represents consolidated NRF AUM. Pro forma for the asset monetizations or sale commitments subsequent to the first quarter 2016 through May 5, 2016, which are described in the endnote section of this presentation. Excludes the impact of the other potential asset monetizations. to create a global leader in real estate and investment management Complementary institutional and high net worth capital raising capabilities Highly valuable post-crisis vintage investment portfolio Large, diversified portfolio across multiple sectors Scaled collection of real estate verticals Exceptional capital raising competency via innovative retail channel Intellectual capital from global client advisory business A scaled global leader in real estate and investment management “Category Killer” with a full-spectrum of distribution capabilities Combining the competitive strengths of each company
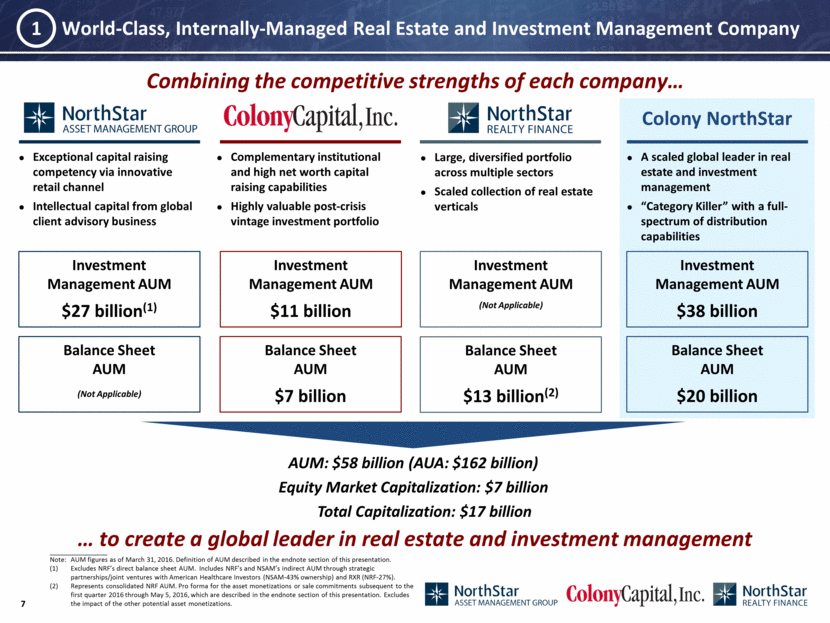
Colony NorthStar’s investment management platform provides a unique and balanced AUM composition, covering the entire Real Estate Investment Management (“REIM”) landscape Colony NorthStar’s REIM Franchise Target Strategy Debt Equity Hybrid Distribution Channel Institutional (Private) Retail (Private) Public Product Duration Open-End Closed-End Permanent Vehicle Structure Commingled Funds Separate Accounts Public Entities 1 World-Class, Internally-Managed Real Estate and Investment Management Company Differentiated product offering and expertise creates a highly attractive platform
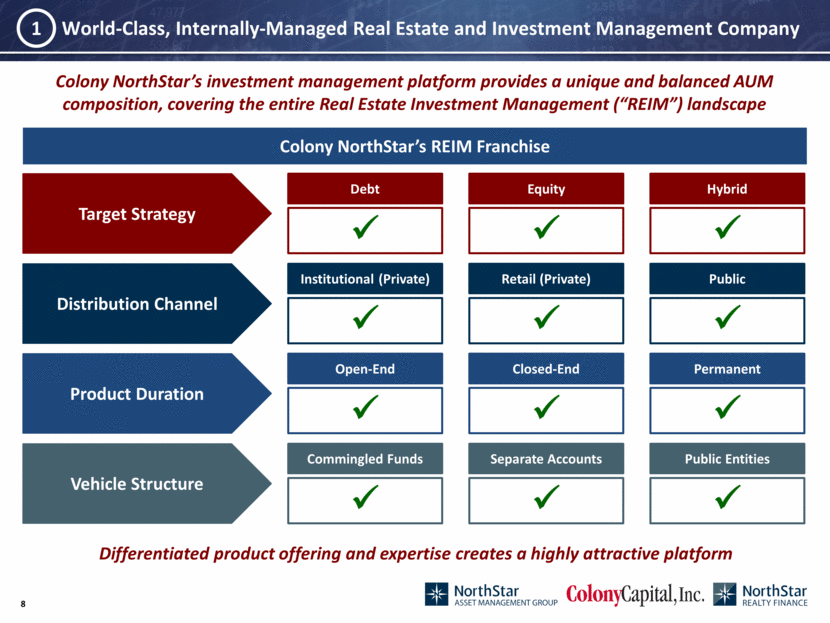
Investment Management AUM: $27 billion Investment Management AUM: $38 billion Investment Management AUM: $11 billion ________________ Note: AUM and AUA figures as of March 31, 2016. Definition of AUM and AUA described in the endnote section of this presentation. Excludes NRF’s direct balance sheet AUM. Includes NRF’s and NSAM’s indirect AUM through strategic partnerships/joint ventures with American Healthcare Investors (NSAM-43% ownership) and RXR (NRF-27%). (1) 1 World-Class, Internally-Managed Real Estate and Investment Management Company Colony NorthStar(1) Colony NorthStar will have $38 billion of investment management AUM and $162 billion of AUA Townsend Group NorthStar Europe NorthStar Income NorthStar Healthcare NorthStar Income II AHI RXR CLNY Credit Funds & Vehicles CLNY Opportunity Funds & Vehicles CLNY Core Plus / Value - Added Funds & Vehicles 36% 7% 5% 7% 3% 2% 9% 11% 9% 10% NorthStar Europe NorthStar Income NorthStar Healthcare NorthStar Income II AHI RXR Townsend Group 10% 7% 10% 5% 3% 13% 52% CLNY Credit Funds & Vehicles CLNY Opportunity Funds & Vehicles CLNY Core Plus / Value - Added Funds & Vehicles 38% 30% 32%
Leading Global Equity REIT with an Embedded Investment Management Platform World-Class, Internally-Managed Real Estate and Investment Management Company 1 Larger, More Diversified Portfolio, Consisting Primarily of Owned Real Estate 2 Substantial Synergies and Higher Earnings Growth 3 Potential to Unlock Value via Increased Scale and Multiple Expansion 4 Broad-Based Access to Multiple Sources of Capital 5 Lower Leverage, Larger Balance Sheet and Improved Liquidity 6
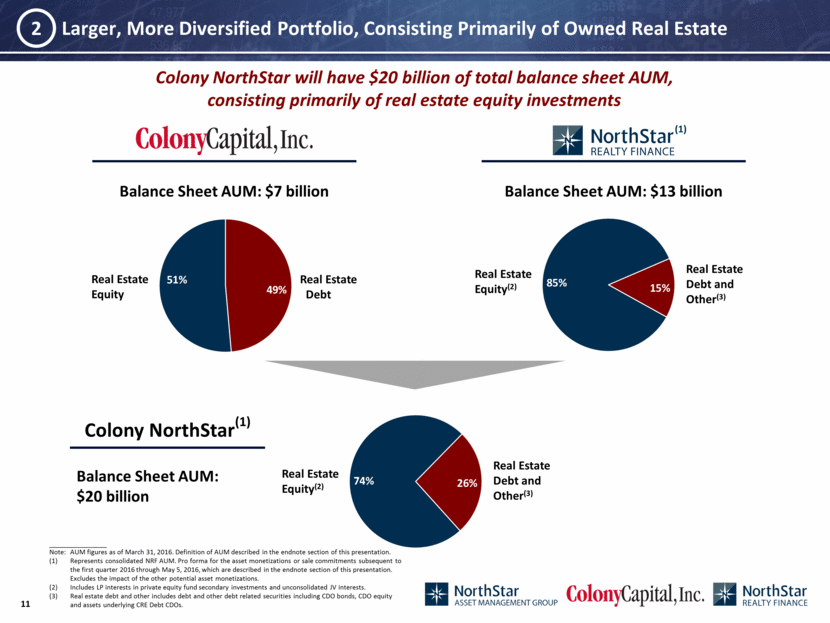
2 Real Estate Equity(2) Real Estate Debt and Other(3) Balance Sheet AUM: $13 billion ________________ Note: AUM figures as of March 31, 2016. Definition of AUM described in the endnote section of this presentation. Represents consolidated NRF AUM. Pro forma for the asset monetizations or sale commitments subsequent to the first quarter 2016 through May 5, 2016, which are described in the endnote section of this presentation. Excludes the impact of the other potential asset monetizations. Includes LP interests in private equity fund secondary investments and unconsolidated JV interests. Real estate debt and other includes debt and other debt related securities including CDO bonds, CDO equity and assets underlying CRE Debt CDOs. Real Estate Equity(2) Real Estate Debt and Other(3) Investment Management Balance Sheet AUM: $20 billion Balance Sheet AUM: $7 billion Real Estate Equity Real Estate Debt (1) Larger, More Diversified Portfolio, Consisting Primarily of Owned Real Estate Colony NorthStar(1) Colony NorthStar will have $20 billion of total balance sheet AUM, consisting primarily of real estate equity investments 74% 26% 85% 15% 51% 49%
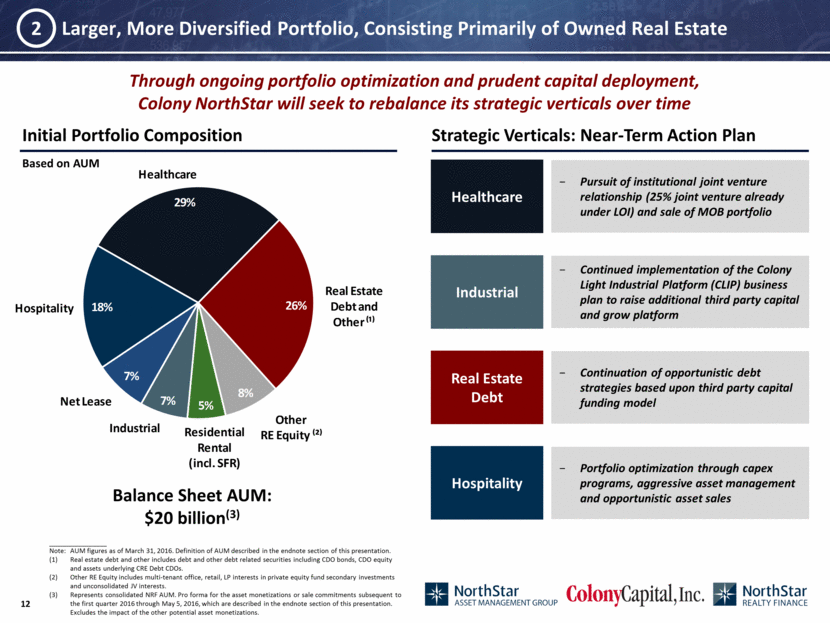
________________ Note: AUM figures as of March 31, 2016. Definition of AUM described in the endnote section of this presentation. Real estate debt and other includes debt and other debt related securities including CDO bonds, CDO equity and assets underlying CRE Debt CDOs. Other RE Equity includes multi-tenant office, retail, LP interests in private equity fund secondary investments and unconsolidated JV interests. Represents consolidated NRF AUM. Pro forma for the asset monetizations or sale commitments subsequent to the first quarter 2016 through May 5, 2016, which are described in the endnote section of this presentation. Excludes the impact of the other potential asset monetizations. Initial Portfolio Composition Based on AUM Strategic Verticals: Near-Term Action Plan Larger, More Diversified Portfolio, Consisting Primarily of Owned Real Estate 2 Balance Sheet AUM: $20 billion(3) Healthcare Real Estate Debt Hospitality Industrial Pursuit of institutional joint venture relationship (25% joint venture already under LOI) and sale of MOB portfolio Continuation of opportunistic debt strategies based upon third party capital funding model Portfolio optimization through capex programs, aggressive asset management and opportunistic asset sales Continued implementation of the Colony Light Industrial Platform (CLIP) business plan to raise additional third party capital and grow platform Through ongoing portfolio optimization and prudent capital deployment, Colony NorthStar will seek to rebalance its strategic verticals over time Other RE Equity ?²? Residential Rental (incl. SFR) Industrial Net Lease Hospitality Healthcare Real Estate Debt and Other ?¹? 8% 5% 7% 7% 18% 29% 26%
Leading Global Equity REIT with an Embedded Investment Management Platform World-Class, Internally-Managed Real Estate and Investment Management Company 1 Larger, More Diversified Portfolio, Consisting Primarily of Owned Real Estate 2 Substantial Synergies and Higher Earnings Growth 3 Potential to Unlock Value via Increased Scale and Multiple Expansion 4 Broad-Based Access to Multiple Sources of Capital 5 Lower Leverage, Larger Balance Sheet and Improved Liquidity 6
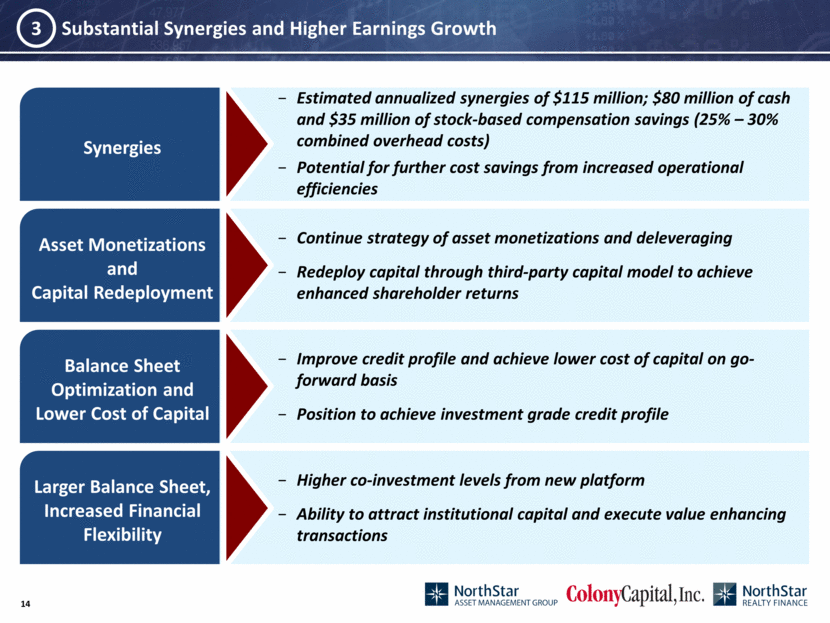
Substantial Synergies and Higher Earnings Growth 3 Synergies Estimated annualized synergies of $115 million; $80 million of cash and $35 million of stock-based compensation savings (25% – 30% combined overhead costs) Potential for further cost savings from increased operational efficiencies Asset Monetizations and Capital Redeployment Continue strategy of asset monetizations and deleveraging Redeploy capital through third-party capital model to achieve enhanced shareholder returns Balance Sheet Optimization and Lower Cost of Capital Improve credit profile and achieve lower cost of capital on go-forward basis Position to achieve investment grade credit profile Higher co-investment levels from new platform Ability to attract institutional capital and execute value enhancing transactions Larger Balance Sheet, Increased Financial Flexibility
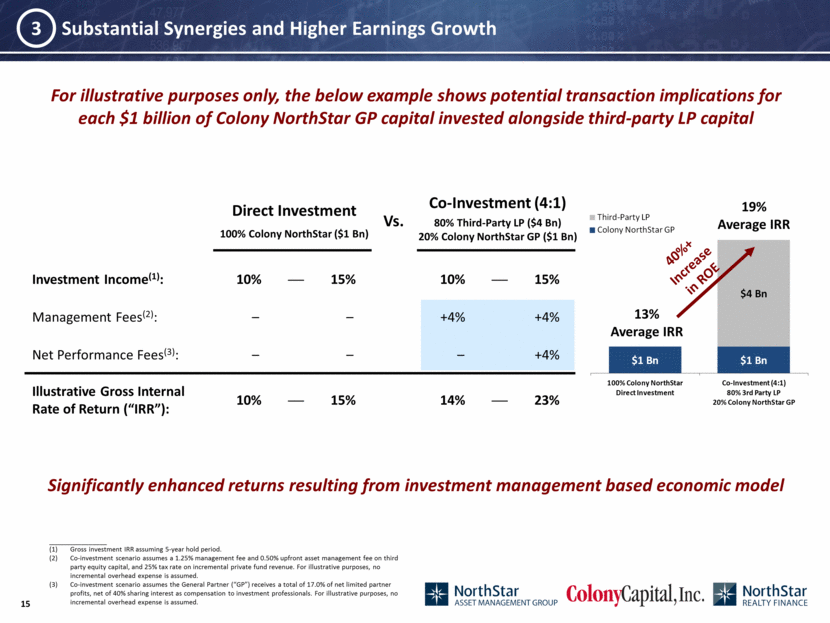
For illustrative purposes only, the below example shows potential transaction implications for each $1 billion of Colony NorthStar GP capital invested alongside third-party LP capital Investment Income(1): 10% 15% 10% 15% Management Fees(2): – – +4% +4% Net Performance Fees(3): – – – +4% Illustrative Gross Internal Rate of Return (“IRR”): 10% 15% 14% 23% Substantial Synergies and Higher Earnings Growth 3 Direct Investment 100% Colony NorthStar ($1 Bn) Vs. ________________ Gross investment IRR assuming 5-year hold period. Co-investment scenario assumes a 1.25% management fee and 0.50% upfront asset management fee on third party equity capital, and 25% tax rate on incremental private fund revenue. For illustrative purposes, no incremental overhead expense is assumed. Co-investment scenario assumes the General Partner (“GP”) receives a total of 17.0% of net limited partner profits, net of 40% sharing interest as compensation to investment professionals. For illustrative purposes, no incremental overhead expense is assumed. 13% Average IRR 19% Average IRR 40%+ Increase in ROE Co-Investment (4:1) 80% Third-Party LP ($4 Bn) 20% Colony NorthStar GP ($1 Bn) Significantly enhanced returns resulting from investment management based economic model $1 Bn $1 Bn $4 Bn 100% Colony NorthStar Direct Investment Co - Investment (4:1) 80% 3rd Party LP 20% Colony NorthStar GP Third - Party LP Colony NorthStar GP
Leading Global Equity REIT with an Embedded Investment Management Platform World-Class, Internally-Managed Real Estate and Investment Management Company 1 Larger, More Diversified Portfolio, Consisting Primarily of Owned Real Estate 2 Substantial Synergies and Higher Earnings Growth 3 Potential to Unlock Value via Increased Scale and Multiple Expansion 4 Broad-Based Access to Multiple Sources of Capital 5 Lower Leverage, Larger Balance Sheet and Improved Liquidity 6
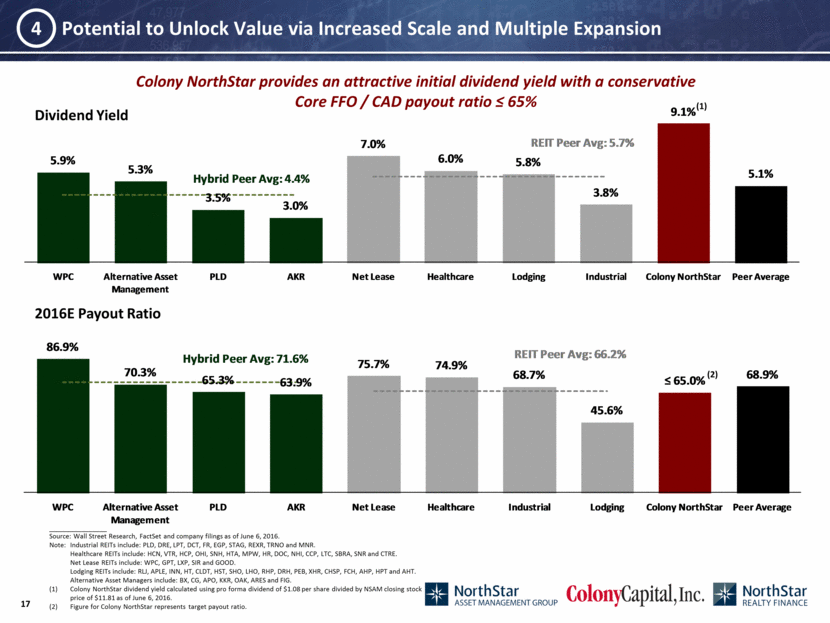
Dividend Yield ________________ Source: Wall Street Research, FactSet and company filings as of June 6, 2016. Note: Industrial REITs include: PLD, DRE, LPT, DCT, FR, EGP, STAG, REXR, TRNO and MNR. Healthcare REITs include: HCN, VTR, HCP, OHI, SNH, HTA, MPW, HR, DOC, NHI, CCP, LTC, SBRA, SNR and CTRE. Net Lease REITs include: WPC, GPT, LXP, SIR and GOOD. Lodging REITs include: RLJ, APLE, INN, HT, CLDT, HST, SHO, LHO, RHP, DRH, PEB, XHR, CHSP, FCH, AHP, HPT and AHT. Alternative Asset Managers include: BX, CG, APO, KKR, OAK, ARES and FIG. Colony NorthStar dividend yield calculated using pro forma dividend of $1.08 per share divided by NSAM closing stock price of $11.81 as of June 6, 2016. Figure for Colony NorthStar represents target payout ratio. 2016E Payout Ratio Colony NorthStar provides an attractive initial dividend yield with a conservative Core FFO / CAD payout ratio 65% < Potential to Unlock Value via Increased Scale and Multiple Expansion 4 (1) (2) 5.9% 5.3% 3.5% 3.0% 7.0% 6.0% 5.8% 3.8% 9.1% 5.1% Hybrid Peer Avg: 4.4% REIT Peer Avg: 5.7% WPC Alternative Asset Management PLD AKR Net Lease Healthcare Lodging Industrial Colony NorthStar Peer Average 86.9% 70.3% 65.3% 63.9% 75.7% 74.9% 68.7% 45.6% ? 65.0% 68.9% Hybrid Peer Avg: 71.6% REIT Peer Avg: 66.2% WPC Alternative Asset Management PLD AKR Net Lease Healthcare Industrial Lodging Colony NorthStar Peer Average
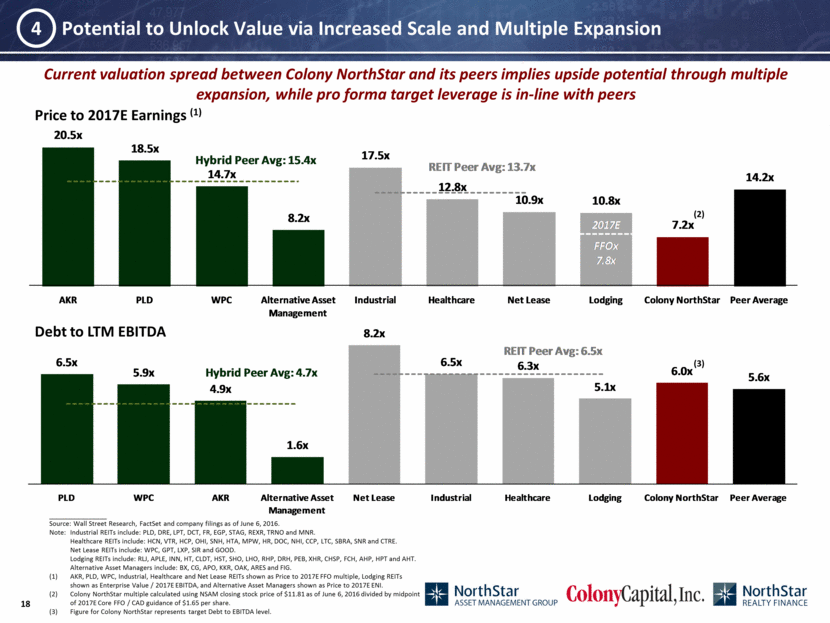
________________ Source: Wall Street Research, FactSet and company filings as of June 6, 2016. Note: Industrial REITs include: PLD, DRE, LPT, DCT, FR, EGP, STAG, REXR, TRNO and MNR. Healthcare REITs include: HCN, VTR, HCP, OHI, SNH, HTA, MPW, HR, DOC, NHI, CCP, LTC, SBRA, SNR and CTRE. Net Lease REITs include: WPC, GPT, LXP, SIR and GOOD. Lodging REITs include: RLJ, APLE, INN, HT, CLDT, HST, SHO, LHO, RHP, DRH, PEB, XHR, CHSP, FCH, AHP, HPT and AHT. Alternative Asset Managers include: BX, CG, APO, KKR, OAK, ARES and FIG. AKR, PLD, WPC, Industrial, Healthcare and Net Lease REITs shown as Price to 2017E FFO multiple, Lodging REITs shown as Enterprise Value / 2017E EBITDA, and Alternative Asset Managers shown as Price to 2017E ENI. Colony NorthStar multiple calculated using NSAM closing stock price of $11.81 as of June 6, 2016 divided by midpoint of 2017E Core FFO / CAD guidance of $1.65 per share. Figure for Colony NorthStar represents target Debt to EBITDA level. Debt to LTM EBITDA Potential to Unlock Value via Increased Scale and Multiple Expansion 4 Price to 2017E Earnings (1) Current valuation spread between Colony NorthStar and its peers implies upside potential through multiple expansion, while pro forma target leverage is in-line with peers (3) (2) 20.5x 18.5x 14.7x 8.2x 17.5x 12.8x 10.9x 10.8x 7.2x 14.2x Hybrid Peer Avg: 15.4x REIT Peer Avg: 13.7x AKR PLD WPC Alternative Asset Management Industrial Healthcare Net Lease Lodging Colony NorthStar Peer Average 2017E FFOx 7.8x 6.5x 5.9x 4.9x 1.6x 8.2x 6.5x 6.3x 5.1x 6.0x 5.6x Hybrid Peer Avg: 4.7x REIT Peer Avg: 6.5x PLD WPC AKR Alternative Asset Management Net Lease Industrial Healthcare Lodging Colony NorthStar Peer Average
Each of the standalone companies is undervalued relative to peer groups Colony NorthStar will present a unique, deep value investment opportunity with a strong growth trajectory Elimination of external management structure, increased trading liquidity, expected RMZ inclusion, and lower leverage could all be catalysts for expansion of valuation multiples Potential to Unlock Value via Increased Scale and Multiple Expansion 4 Valuation upside based on pro forma 2017E Core FFO / CAD of $1.65 per share and agreed upon exchange ratios (1) ________________ Based on 1.4663 shares of NSAM for each CLNY share and 1.0996 shares of NSAM for each NRF share. NSAM implied value per share includes special cash dividend equal to $128 million. Illustrative value upside is based on closing prices as of June 6, 2016 of $11.89, $17.35 and $12.98 for NSAM, CLNY and NRF, respectively. Assumed Implied Implied Value per Share (2) Illustrative Value Upside (vs. Current Stock Prices) (3) Core FFO / CAD Colony NorthStar Multiple Stock Price 16.0x $26.40 $27.05 $38.71 $29.03 +128% +123% +124% 14.0x $23.10 $23.75 $33.87 $25.40 +100% +95% +96% 12.0x $19.80 $20.45 $29.03 $21.77 +72% +67% +68% 10.0x $16.50 $17.15 $24.19 $18.14 +44% +39% +40% 8.0x $13.20 $13.85 $19.36 $14.51 +16% +12% +12% NRF NSAM CLNY NRF NSAM CLNY
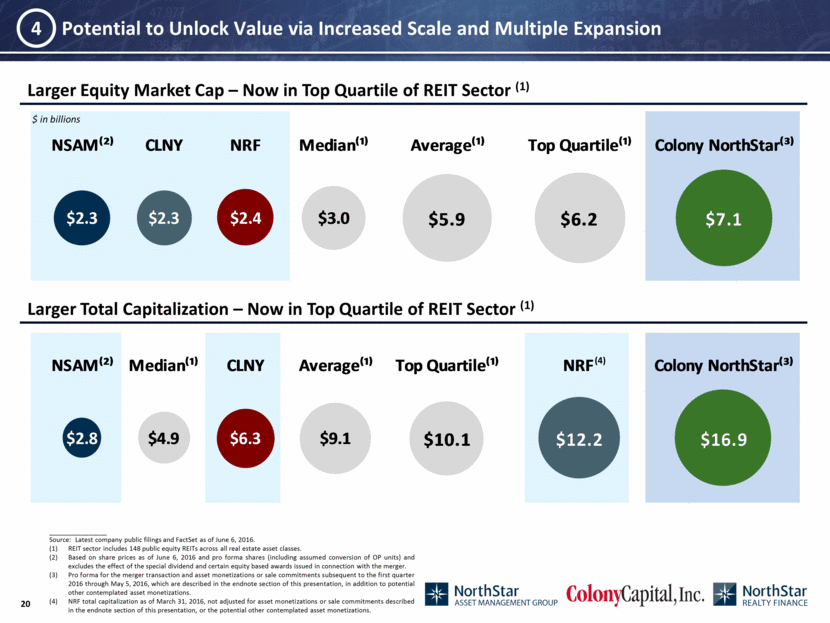
$ in billions Larger Total Capitalization – Now in Top Quartile of REIT Sector (1) 4 ________________ Source: Latest company public filings and FactSet as of June 6, 2016. REIT sector includes 148 public equity REITs across all real estate asset classes. Based on share prices as of June 6, 2016 and pro forma shares (including assumed conversion of OP units) and excludes the effect of the special dividend and certain equity based awards issued in connection with the merger. Pro forma for the merger transaction and asset monetizations or sale commitments subsequent to the first quarter 2016 through May 5, 2016, which are described in the endnote section of this presentation, in addition to potential other contemplated asset monetizations. NRF total capitalization as of March 31, 2016, not adjusted for asset monetizations or sale commitments described in the endnote section of this presentation, or the potential other contemplated asset monetizations. Potential to Unlock Value via Increased Scale and Multiple Expansion Larger Equity Market Cap – Now in Top Quartile of REIT Sector (1) (4) NSAM?²? CLNY NRF Median?¹? Average?¹? Top Quartile?¹? Colony NorthStar?³? $2.3 $2.3 $2.4 $3.0 $5.9 $6.2 $7.1 NSAM?²? Median?¹? CLNY Average?¹? Top Quartile?¹? NRF Colony NorthStar?³? $2.8 $4.9 $6.3 $9.1 $10.1 $12.2 $16.9
Leading Global Equity REIT with an Embedded Investment Management Platform World-Class, Internally-Managed Real Estate and Investment Management Company 1 Larger, More Diversified Portfolio, Consisting Primarily of Owned Real Estate 2 Substantial Synergies and Higher Earnings Growth 3 Potential to Unlock Value via Increased Scale and Multiple Expansion 4 Broad-Based Access to Multiple Sources of Capital 5 Lower Leverage, Larger Balance Sheet and Improved Liquidity 6
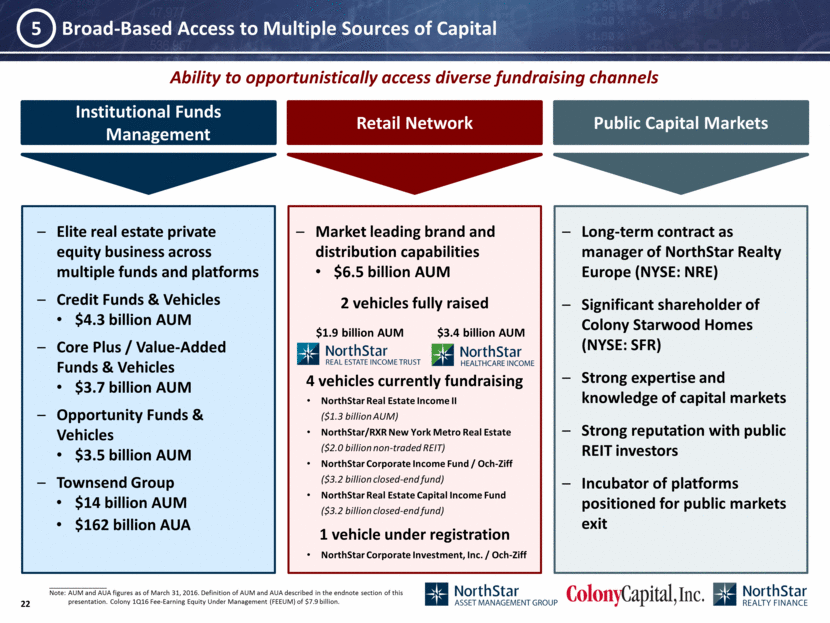
Institutional Funds Management Public Capital Markets Retail Network Broad-Based Access to Multiple Sources of Capital 5 Market leading brand and distribution capabilities $6.5 billion AUM 2 vehicles fully raised 4 vehicles currently fundraising 1 vehicle under registration Long-term contract as manager of NorthStar Realty Europe (NYSE: NRE) Significant shareholder of Colony Starwood Homes (NYSE: SFR) Strong expertise and knowledge of capital markets Strong reputation with public REIT investors Incubator of platforms positioned for public markets exit Elite real estate private equity business across multiple funds and platforms Credit Funds & Vehicles $4.3 billion AUM Core Plus / Value-Added Funds & Vehicles $3.7 billion AUM Opportunity Funds & Vehicles $3.5 billion AUM Townsend Group $14 billion AUM $162 billion AUA ________________ Note: AUM and AUA figures as of March 31, 2016. Definition of AUM and AUA described in the endnote section of this presentation. Colony 1Q16 Fee-Earning Equity Under Management (FEEUM) of $7.9 billion. Ability to opportunistically access diverse fundraising channels $1.9 billion AUM $3.4 billion AUM NorthStar Real Estate Income II ($1.3 billion AUM) NorthStar/RXR New York Metro Real Estate ($2.0 billion non-traded REIT) NorthStar Corporate Income Fund / Och-Ziff ($3.2 billion closed-end fund) NorthStar Real Estate Capital Income Fund ($3.2 billion closed-end fund) NorthStar Corporate Investment, Inc. / Och-Ziff
Leading Global Equity REIT with an Embedded Investment Management Platform World-Class, Internally-Managed Real Estate and Investment Management Company 1 Larger, More Diversified Portfolio, Consisting Primarily of Owned Real Estate 2 Substantial Synergies and Higher Earnings Growth 3 Potential to Unlock Value via Increased Scale and Multiple Expansion 4 Broad-Based Access to Multiple Sources of Capital 5 Lower Leverage, Larger Balance Sheet and Improved Liquidity 6
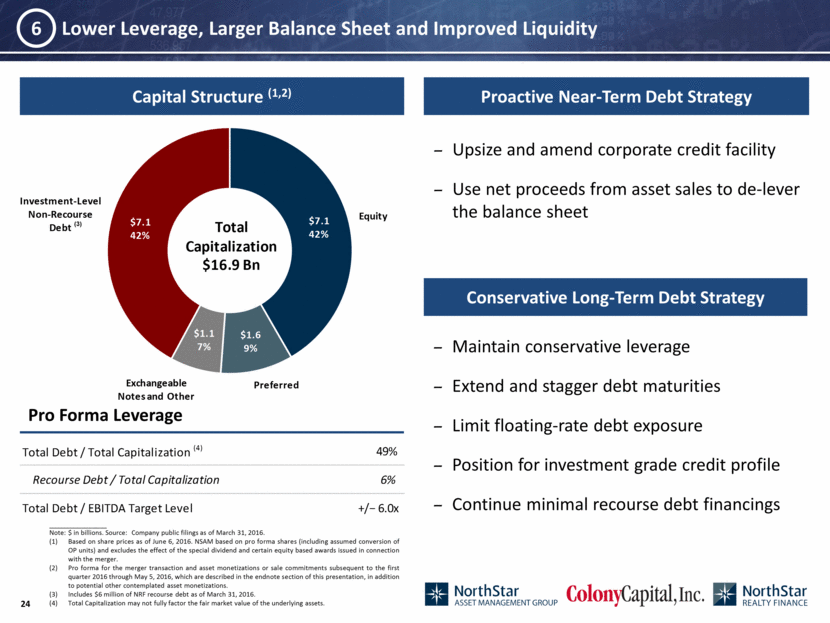
Capital Structure (1,2) Pro Forma Leverage Lower Leverage, Larger Balance Sheet and Improved Liquidity 6 Upsize and amend corporate credit facility Use net proceeds from asset sales to de-lever the balance sheet Conservative Long-Term Debt Strategy Maintain conservative leverage Extend and stagger debt maturities Limit floating-rate debt exposure Position for investment grade credit profile Continue minimal recourse debt financings Proactive Near-Term Debt Strategy ________________ Note: $ in billions. Source: Company public filings as of March 31, 2016. Based on share prices as of June 6, 2016. NSAM based on pro forma shares (including assumed conversion of OP units) and excludes the effect of the special dividend and certain equity based awards issued in connection with the merger. Pro forma for the merger transaction and asset monetizations or sale commitments subsequent to the first quarter 2016 through May 5, 2016, which are described in the endnote section of this presentation, in addition to potential other contemplated asset monetizations. Includes $6 million of NRF recourse debt as of March 31, 2016. Total Capitalization may not fully factor the fair market value of the underlying assets. (3) Equity Preferred Exchangeable Notes and Other Investment - Level Non - Recourse Debt $7.1 42% $1.6 9% $1.1 7% $7.1 42% Total Capitalization $16.9 Bn Total Debt / Total Capitalization (4) 49% Recourse Debt / Total Capitalization 6% Total Debt / EBITDA Target Level +/? 6.0x
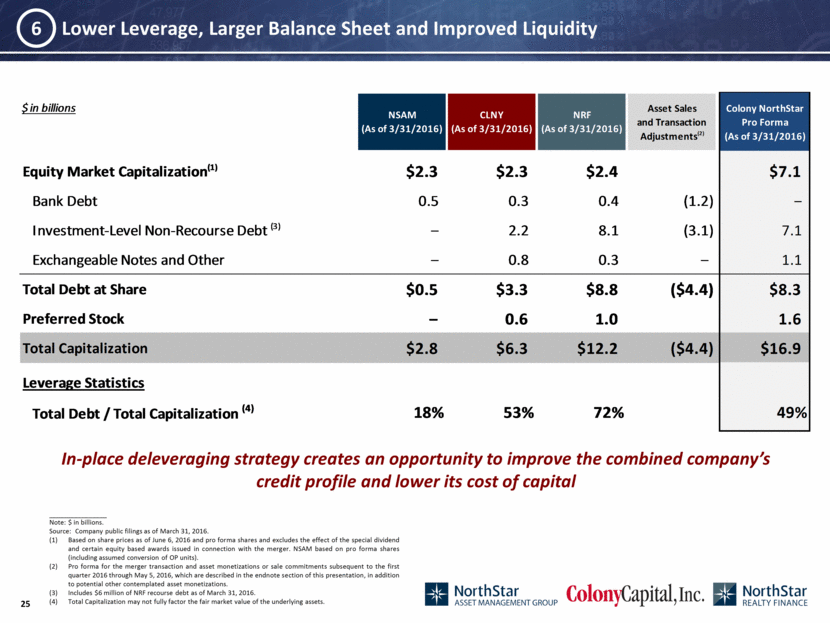
________________ Note: $ in billions. Source: Company public filings as of March 31, 2016. Based on share prices as of June 6, 2016 and pro forma shares and excludes the effect of the special dividend and certain equity based awards issued in connection with the merger. NSAM based on pro forma shares (including assumed conversion of OP units). Pro forma for the merger transaction and asset monetizations or sale commitments subsequent to the first quarter 2016 through May 5, 2016, which are described in the endnote section of this presentation, in addition to potential other contemplated asset monetizations. Includes $6 million of NRF recourse debt as of March 31, 2016. Total Capitalization may not fully factor the fair market value of the underlying assets. Lower Leverage, Larger Balance Sheet and Improved Liquidity 6 In-place deleveraging strategy creates an opportunity to improve the combined company’s credit profile and lower its cost of capital $ in billions Equity Market Capitalization (1) $2.3 $2.3 $2.4 $7.1 Bank Debt 0.5 0.3 0.4 (1.2) ? Investment-Level Non-Recourse Debt (3) ? 2.2 8.1 (3.1) 7.1 Exchangeable Notes and Other ? 0.8 0.3 ? 1.1 Total Debt at Share $0.5 $3.3 $8.8 ($4.4) $8.3 Preferred Stock ? 0.6 1.0 1.6 Total Capitalization $2.8 $6.3 $12.2 ($4.4) $16.9 Leverage Statistics Total Debt / Total Capitalization (4) 18% 53% 72% 49% NSAM (As of 3/31/2016) CLNY (As of 3/31/2016) NRF (As of 3/31/2016) Asset Sales and Transaction Adjustments (2) Colony NorthStar Pro Forma (As of 3/31/2016)
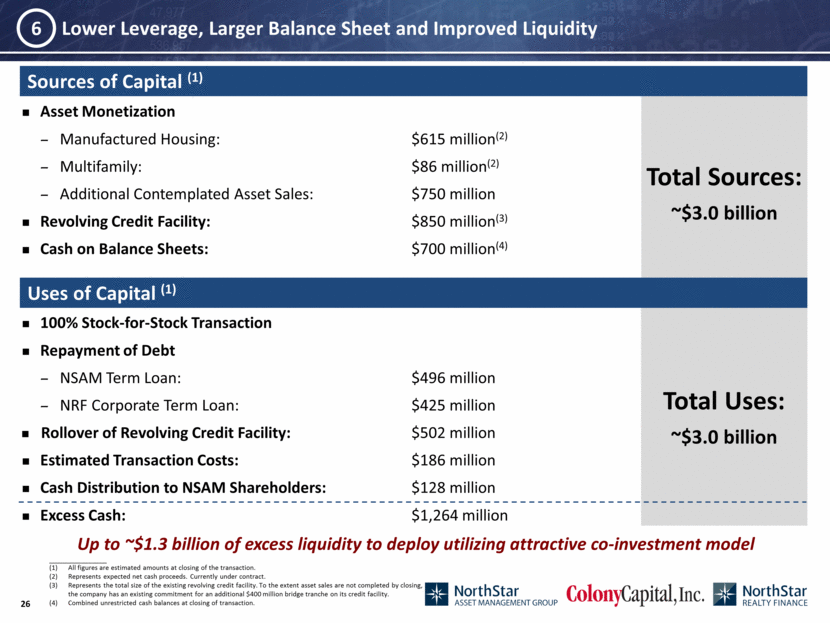
Asset Monetization Manufactured Housing: $615 million(2) Multifamily: $86 million(2) Additional Contemplated Asset Sales: $750 million Revolving Credit Facility: $850 million(3) Cash on Balance Sheets: $700 million(4) Lower Leverage, Larger Balance Sheet and Improved Liquidity ________________ All figures are estimated amounts at closing of the transaction. Represents expected net cash proceeds. Currently under contract. Represents the total size of the existing revolving credit facility. To the extent asset sales are not completed by closing, the company has an existing commitment for an additional $400 million bridge tranche on its credit facility. Combined unrestricted cash balances at closing of transaction. 100% Stock-for-Stock Transaction Repayment of Debt NSAM Term Loan: ~ $496 million NRF Corporate Term Loan: $425 million Rollover of Revolving Credit Facility: $502 million Estimated Transaction Costs: $186 million Cash Distribution to NSAM Shareholders: $128 million Excess Cash: $1,264 million 6 Total Sources: ~$3.0 billion Total Uses: ~$3.0 billion Uses of Capital (1) Sources of Capital (1) Up to ~$1.3 billion of excess liquidity to deploy utilizing attractive co-investment model
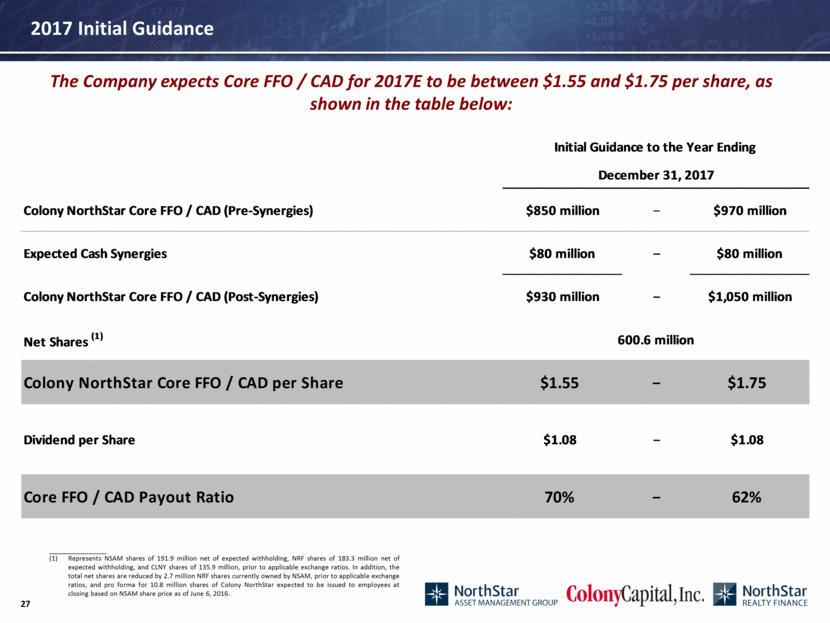
________________ (1) Represents NSAM shares of 191.9 million net of expected withholding, NRF shares of 183.3 million net of expected withholding, and CLNY shares of 135.9 million, prior to applicable exchange ratios. In addition, the total net shares are reduced by 2.7 million NRF shares currently owned by NSAM, prior to applicable exchange ratios, and pro forma for 10.8 million shares of Colony NorthStar expected to be issued to employees at closing based on NSAM share price as of June 6, 2016. 2017 Initial Guidance The Company expects Core FFO / CAD for 2017E to be between $1.55 and $1.75 per share, as shown in the table below: Initial Guidance to the Year Ending December 31, 2017 Colony NorthStar Core FFO / CAD (Pre-Synergies) $850 million ? $970 million Expected Cash Synergies $80 million ? $80 million Colony NorthStar Core FFO / CAD (Post-Synergies) $930 million ? $1,050 million Net Shares (1) 600.6 million Colony NorthStar Core FFO / CAD per Share $1.55 ? $1.75 Dividend per Share $1.08 ? $1.08 Core FFO / CAD Payout Ratio 70% ? 62%
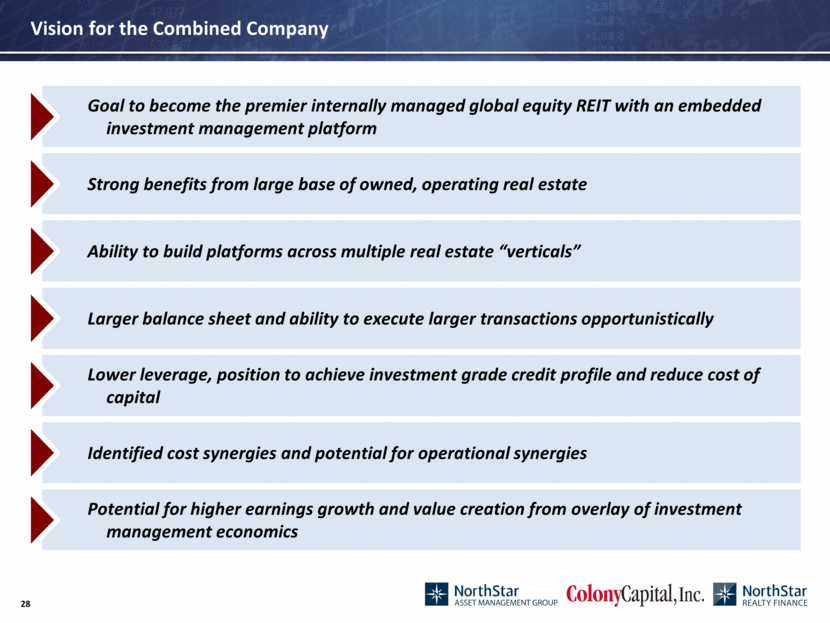
Vision for the Combined Company Goal to become the premier internally managed global equity REIT with an embedded investment management platform Strong benefits from large base of owned, operating real estate Ability to build platforms across multiple real estate “verticals” Larger balance sheet and ability to execute larger transactions opportunistically Lower leverage, position to achieve investment grade credit profile and reduce cost of capital Identified cost synergies and potential for operational synergies Potential for higher earnings growth and value creation from overlay of investment management economics
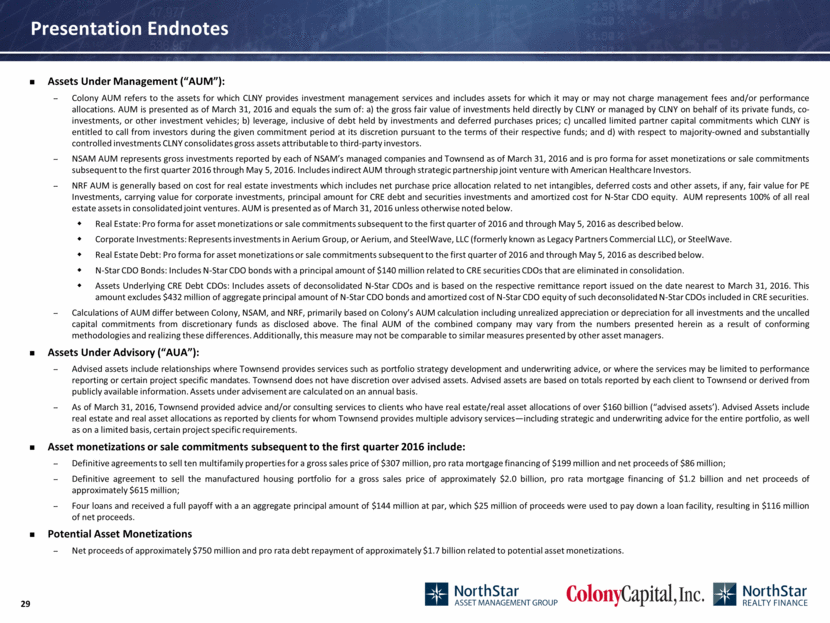
Presentation Endnotes Assets Under Management (“AUM”): Colony AUM refers to the assets for which CLNY provides investment management services and includes assets for which it may or may not charge management fees and/or performance allocations. AUM is presented as of March 31, 2016 and equals the sum of: a) the gross fair value of investments held directly by CLNY or managed by CLNY on behalf of its private funds, co-investments, or other investment vehicles; b) leverage, inclusive of debt held by investments and deferred purchases prices; c) uncalled limited partner capital commitments which CLNY is entitled to call from investors during the given commitment period at its discretion pursuant to the terms of their respective funds; and d) with respect to majority-owned and substantially controlled investments CLNY consolidates gross assets attributable to third-party investors. NSAM AUM represents gross investments reported by each of NSAM’s managed companies and Townsend as of March 31, 2016 and is pro forma for asset monetizations or sale commitments subsequent to the first quarter 2016 through May 5, 2016. Includes indirect AUM through strategic partnership joint venture with American Healthcare Investors. NRF AUM is generally based on cost for real estate investments which includes net purchase price allocation related to net intangibles, deferred costs and other assets, if any, fair value for PE Investments, carrying value for corporate investments, principal amount for CRE debt and securities investments and amortized cost for N-Star CDO equity. AUM represents 100% of all real estate assets in consolidated joint ventures. AUM is presented as of March 31, 2016 unless otherwise noted below. Real Estate: Pro forma for asset monetizations or sale commitments subsequent to the first quarter of 2016 and through May 5, 2016 as described below. Corporate Investments: Represents investments in Aerium Group, or Aerium, and SteelWave, LLC (formerly known as Legacy Partners Commercial LLC), or SteelWave. Real Estate Debt: Pro forma for asset monetizations or sale commitments subsequent to the first quarter of 2016 and through May 5, 2016 as described below. N-Star CDO Bonds: Includes N-Star CDO bonds with a principal amount of $140 million related to CRE securities CDOs that are eliminated in consolidation. Assets Underlying CRE Debt CDOs: Includes assets of deconsolidated N-Star CDOs and is based on the respective remittance report issued on the date nearest to March 31, 2016. This amount excludes $432 million of aggregate principal amount of N-Star CDO bonds and amortized cost of N-Star CDO equity of such deconsolidated N-Star CDOs included in CRE securities. Calculations of AUM differ between Colony, NSAM, and NRF, primarily based on Colony’s AUM calculation including unrealized appreciation or depreciation for all investments and the uncalled capital commitments from discretionary funds as disclosed above. The final AUM of the combined company may vary from the numbers presented herein as a result of conforming methodologies and realizing these differences. Additionally, this measure may not be comparable to similar measures presented by other asset managers. Assets Under Advisory (“AUA”): Advised assets include relationships where Townsend provides services such as portfolio strategy development and underwriting advice, or where the services may be limited to performance reporting or certain project specific mandates. Townsend does not have discretion over advised assets. Advised assets are based on totals reported by each client to Townsend or derived from publicly available information. Assets under advisement are calculated on an annual basis. As of March 31, 2016, Townsend provided advice and/or consulting services to clients who have real estate/real asset allocations of over $160 billion (“advised assets’). Advised Assets include real estate and real asset allocations as reported by clients for whom Townsend provides multiple advisory services—including strategic and underwriting advice for the entire portfolio, as well as on a limited basis, certain project specific requirements. Asset monetizations or sale commitments subsequent to the first quarter 2016 include: Definitive agreements to sell ten multifamily properties for a gross sales price of $307 million, pro rata mortgage financing of $199 million and net proceeds of $86 million; Definitive agreement to sell the manufactured housing portfolio for a gross sales price of approximately $2.0 billion, pro rata mortgage financing of $1.2 billion and net proceeds of approximately $615 million; Four loans and received a full payoff with a an aggregate principal amount of $144 million at par, which $25 million of proceeds were used to pay down a loan facility, resulting in $116 million of net proceeds. Potential Asset Monetizations Net proceeds of approximately $750 million and pro rata debt repayment of approximately $1.7 billion related to potential asset monetizations.
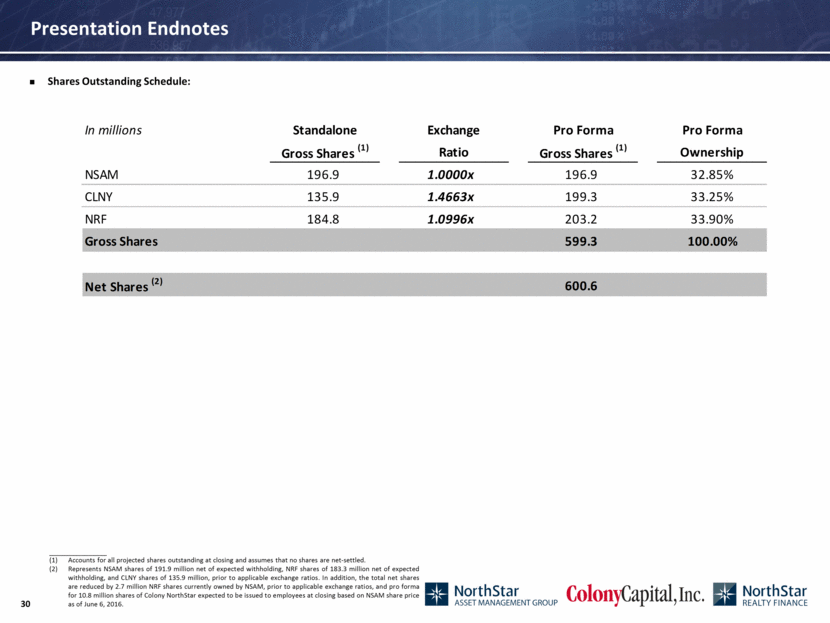
Presentation Endnotes Shares Outstanding Schedule: ________________ Accounts for all projected shares outstanding at closing and assumes that no shares are net-settled. Represents NSAM shares of 191.9 million net of expected withholding, NRF shares of 183.3 million net of expected withholding, and CLNY shares of 135.9 million, prior to applicable exchange ratios. In addition, the total net shares are reduced by 2.7 million NRF shares currently owned by NSAM, prior to applicable exchange ratios, and pro forma for 10.8 million shares of Colony NorthStar expected to be issued to employees at closing based on NSAM share price as of June 6, 2016. In millions Standalone Exchange Pro Forma Pro Forma Gross Shares (1) Ratio Gross Shares (1) Ownership NSAM 196.9 1.0000x 196.9 32.85% CLNY 135.9 1.4663x 199.3 33.25% NRF 184.8 1.0996x 203.2 33.90% Gross Shares 599.3 100.00% Net Shares (2) 600.6
