Attached files
| file | filename |
|---|---|
| 8-K - CURRENT REPORT OF MATERIAL EVENTS OR CORPORATE CHANGES - Monogram Residential Trust, Inc. | a16-12923_18k.htm |
Exhibit 99.1
Monogram Residential Trust SoMa – Miami, FL OLUME – San Francisco, CA Ev – San Diego, CA Nouvelle – Tysons Corner, VA Company Presentation June 2016

Forward-Looking Statements 2 This presentation contains forward-looking statements, within the meaning of Federal Securities laws, relating to the business and financial outlook of Monogram Residential Trust, Inc. (“Monogram”) that are based on our current expectations, estimates, forecasts and projections and are not guarantees of future performance. Such forward-looking statements can generally be identified by our use of forward-looking terminology such as “may,” “will,” “expect,” “projected,” “intend,” “anticipate,” “estimate,” “believe,” “outlook,” “continue,” or other similar words. Actual results may differ materially from those expressed in these forward-looking statements, and you should not place undue reliance on any such statements. A number of important factors could cause actual results to differ materially from the forward-looking statements contained in this presentation. Such factors include the risk that we may not meet our expected funds from operations, net operating income or other performance metrics, and other factors described in the Risk Factors section of Monogram’s Annual Report on Form 10-K for the year ended December 31, 2015 and in subsequent filings with the Securities and Exchange Commission. Forward-looking statements in this presentation speak only as of the date on which such statements were made, and we undertake no obligation to update any such statements to conform to actual results or changes in our expectations. We claim the safe harbor protection for forward-looking statements contained in the Private Securities Litigation Reform Act of 1995 and include this statement for purposes of complying with these safe harbor provisions.

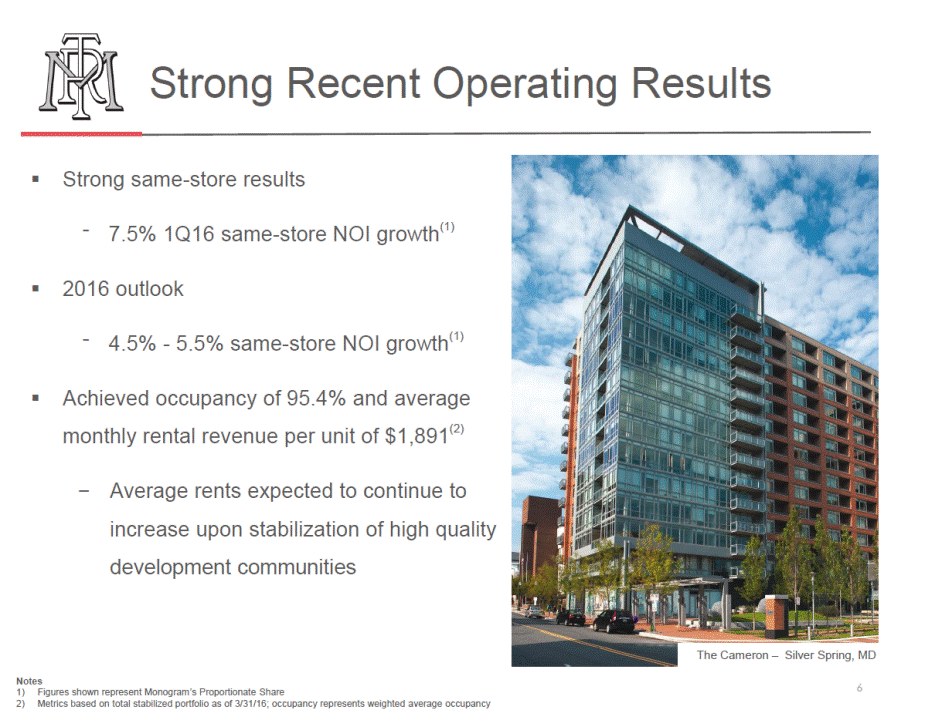
Monogram Overview (NYSE: MORE) Owner, operator, and developer of luxury apartment communities Young (6 years average age), class A portfolio drives premium average rent of $1,891 per unit(1) Well diversified across regions with significant coastal markets presence Track record of Value Creation and strong operational performance Mostly-funded development program fueling NOI(2) meaningful embedded stabilization growth through The Mark – Boca Raton, FL Notes 1)Metrics based on total stabilized portfolio as of 3/31/16 2)See appendix for Definitions and Reconciliations of Non-GAAP Measurements 3
StrategicFocus Executing on strategy to drive same-store NOI growth and realize meaningful embedded growth and value from development program Continue to drive same-store NOI growth through strong property operations Capture embedded NOI growth in developments by achieving stabilized occupancy Stabilize six development communities now in lease-up Deliver on three remaining development communities under construction - - Extend debt maturities while seeking to reduce leverage, pro forma for stabilized development, over the longer-term Engage in select property dispositions to supplement funding of existing development program, reduce debt and / or fund new strategic / accretive development projects Where accretive to value, continue to increase number of wholly-owned communities over time 4

AttractiveEmbeddedGrowth Profile Projected Incremental Contribution From (1): +$0.17 to $0.19 Stabilized in 1Q16 (4) SS NOI Growth (5) Annualized (2)Properties Stabilized Annualized (7) Notes: 1) Represents incremental growth potential, shown for illustrative purposes on an AFFO per share basis, from select expected contributors of incremental / embedded NOI and interest expense, net that are projected to occur through the second half of 2017. We expect 8 of the 9 development properties (excluding Huntington Beach) to be completed and stabilized by the end of 2017. Figures shown at Monogram’s proportionate share. See Appendix for Reconciliation to pro forma annualized net income (loss) 2) 1Q16 supplemental (page 8), represents reported 1Q16 AFFO per share, annualized 3) 1Q16 supplemental (page 28), estimated total Economic Costs multiplied by projected NOI yield at stabilization; excludes projected stabilized NOI of approximately $7.5 million from Huntington Beach development (under construction with 2Q19 estimated stabilization date) 4) Estimated stabilized NOI from two 2015 acquisitions (Ev and The Mile) which did not contribute positive NOI during 1Q16 5) Estimated incremental 2016 NOI from same-store growth (based on 2016 SS NOI outlook) 6) Estimated increase in interest expense and reduction of capitalized interest related to the development properties. Interest expense assumes approximately $50 million of incremental debt to finance remaining estimated development cash costs to complete for 8 of the 9 developments (Huntington Beach incremental interest expense is assumed to be offset by capitalized interest during the pro forma period as its completion date is estimated to occur in 2018) 7) Represents incremental growth potential, resulting from these select expected contributors, applicable to AFFO per share on an annualized basis for the period of the second half of 2017 on a pro forma basis 5 +$0.04 to $0.04+$0.01 to $0.02$0.50 to $0.52 -$0.04 to -$0.04 $0.31 ReportedContribution fromContribution fromContribution fromInterest Expense,Pro Forma 1Q16 AFFODevelopmentAcquisitions notIncremental 2016net (6)AFFO through 2017 (3)

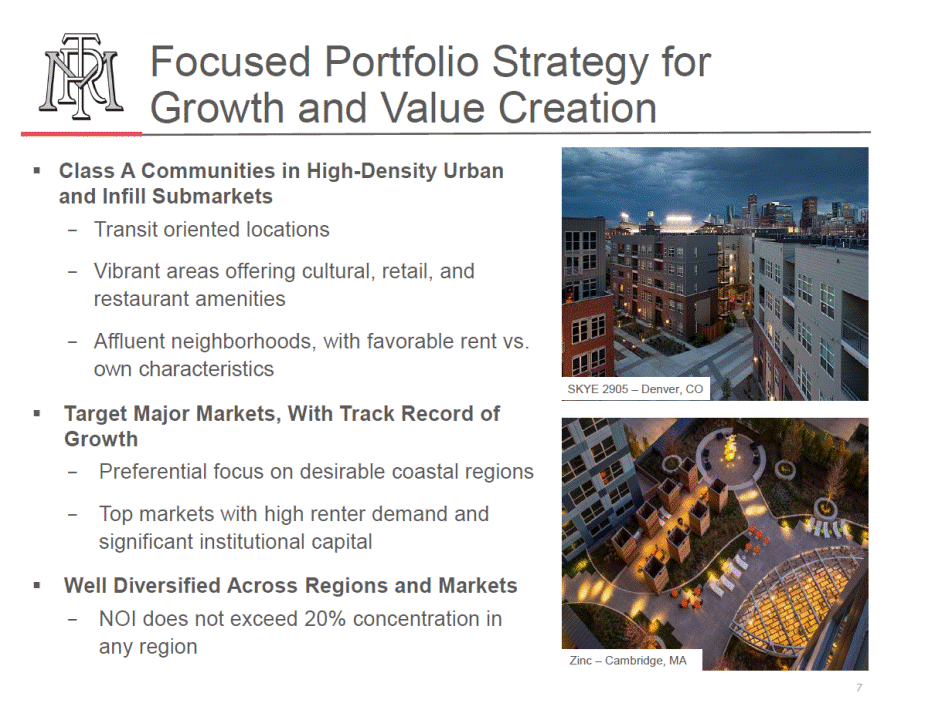
StrongRecent Operating Results Strong same-store results 7.5% 1Q16 same-store NOI growth(1) -2016 outlook 4.5% - 5.5% same-store NOI growth(1) - Achieved occupancy of 95.4% and average monthly rental revenue per unit of $1,891(2) - Average rents expected to continue to increase upon stabilization of high quality development communities The Cameron – Silver Spring, MD Notes 1)Figures shown represent Monogram’s Proportionate Share 2)Metrics based on total stabilized portfolio as of 3/31/16; occupancy represents weighted average occupancy 6
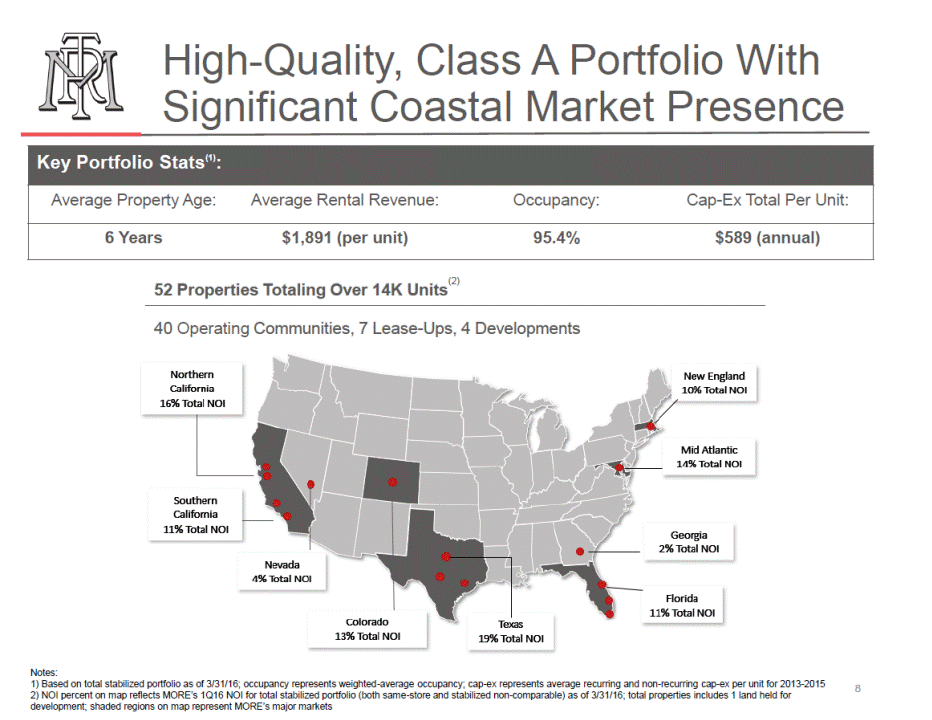
Focused PortfolioStrategy for Growthand Value Creation Class A Communities in High-Density Urban and Infill Submarkets Transit oriented locations Vibrant areas offering cultural, retail, and restaurant amenities Affluent neighborhoods, with favorable rent vs. own characteristics - - - SKYE 2905 – Denver, CO Target Major Markets, With Track Record of Growth Preferential focus on desirable coastal regions Top markets with high renter demand and significant institutional capital - - Well Diversified Across Regions and Markets 20% concentration in NOI does not exceed any region - Zinc – Cambridge, MA 7
High-Quality, Class A Portfolio With Significant Coastal Market Presence (2) 52 Properties Totaling Over 14K Units 40 Operating Communities, 7 Lease-Ups, 4 Developments Notes: 1) Based on total stabilized portfolio as of 3/31/16; occupancy represents weighted-average occupancy; cap-ex represents average recurring and non-recurring cap-ex per unit for 2013-2015 2) NOI percent on map reflects MORE’s 1Q16 NOI for total stabilized portfolio (both same-store and stabilized non-comparable) as of 3/31/16; total properties includes 1 land held for development; shaded regions on map represent MORE’s major markets 8 Key Portfolio Stats(1): Average Property Age:Average Rental Revenue:Occupancy:Cap-Ex Total Per Unit: 6 Years$1,891 (per unit)95.4%$589 (annual)
Superior Rents AcrossMonogram’s Major Markets MORE 1Q16 Monthly Rental Revenue (per unit) vs. Peers(1) $3,500 $3,000 $2,500 $2,000 $1,500 $1,000 $500 $0 N. California S. California Denver Dallas Houston Boston Mid-Atlantic S. Florida MORE PEER AVG Note: 1) Based on 1Q16 same-store data; public filings as reported by peers (AIV, AVB, CPT, EQR, ESS, MAA, PPS, UDR) 9

Monogram’s “Tailored Experience Living” Fundamental to our property management strategy is the development of our brand “Tailored Living” Emphasizes the unique high-end nature of our communities while maintaining individual personality and characteristics in each local market Argenta – San Francisco, CA Our branded property management company, the Monogram Apartment Collection, provides its residents the best in modern living Blue Sol – Costa Mesa, CA From gourmet kitchens and private patios resort-style pools and fully amenitized outdoor roof and podium decks to Calypso – Irvine, CA 10

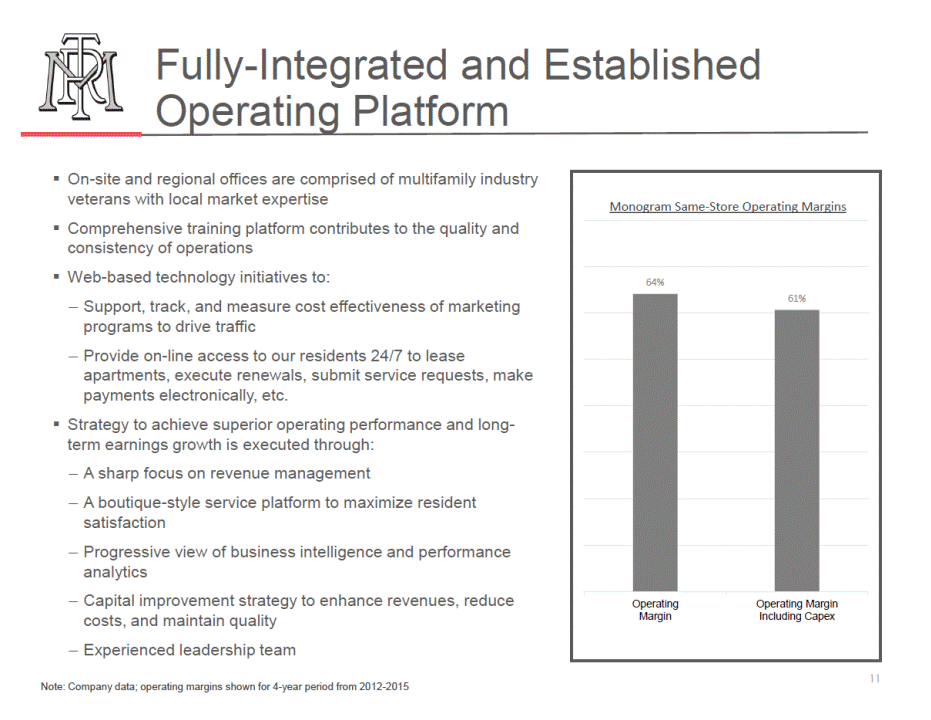
Fully-Integrated andEstablished OperatingPlatform On-site and regional offices are comprised of multifamily industry veterans with local market expertise Comprehensive training platform contributes to the quality and consistency of operations Web-based technology initiatives to: – Support, track, and measure cost effectiveness of marketing programs to drive traffic – Provide on-line access to our residents 24/7 to lease apartments, execute renewals, submit service requests, make payments electronically, etc. Strategy to achieve superior operating performance and long-term earnings growth is executed through: – A sharp focus on revenue management – A boutique-style service platform to maximize resident satisfaction – Progressive view of business intelligence and performance analytics – Capital improvement strategy to enhance revenues, reduce costs, and maintain quality – Experienced leadership team 11 Note: Company data; operating margins shown for 4-year period from 2012-2015 Monogram Same-Store Operating Margins 64% OperatingOperating Margin MarginIncluding Capex 61%
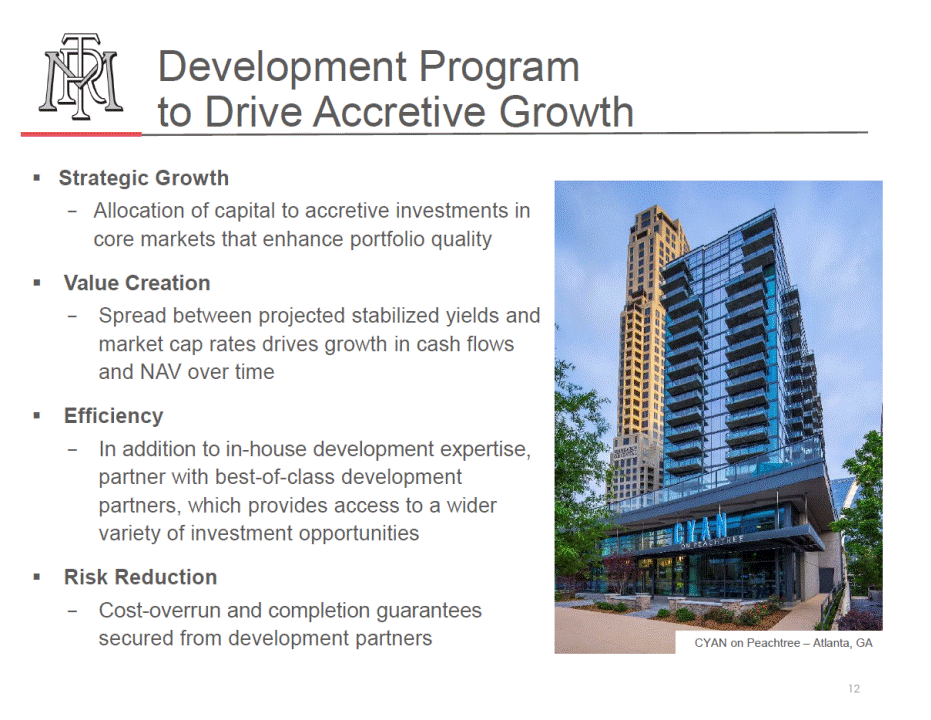
Development Program toDrive AccretiveGrowth Strategic Growth Allocation of capital to accretive investments in core markets that enhance portfolio quality - Value Creation Spread between projected stabilized yields and market cap rates drives growth in cash flows and NAV over time - Efficiency In addition to in-house development expertise, partner with best-of-class development partners, which provides access to a wider variety of investment opportunities - Risk Reduction Cost-overrun and completion guarantees secured from development partners - CYAN on Peachtree – Atlanta, GA 12
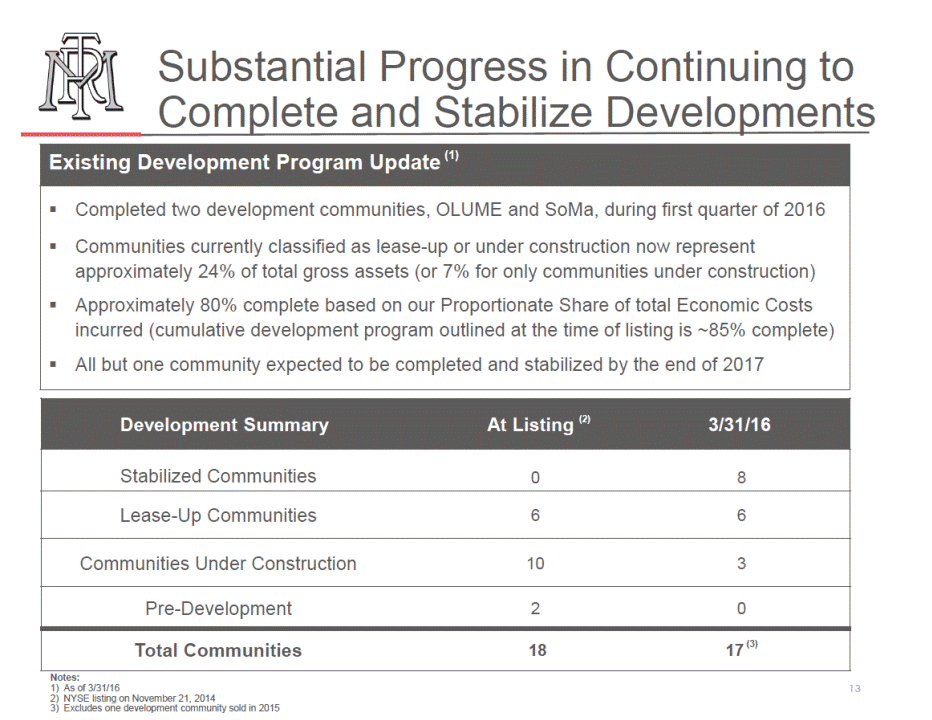
SubstantialProgress in Continuing to Developments Complete and Stabilize Notes: 1) As of 3/31/16 2) NYSE listing on November 21, 2014 3) Excludes one development community sold in 2015 13 Development SummaryAt Listing (2)3/31/16 Stabilized Communities08 Lease-Up Communities66 Communities Under Construction103 Pre-Development20 Total Communities1817 (3) Existing Development Program Update (1) Completed two development communities, OLUME and SoMa, during first quarter of 2016 Communities currently classified as lease-up or under construction now represent approximately 24% of total gross assets (or 7% for only communities under construction) Approximately 80% complete based on our Proportionate Share of total Economic Costs incurred (cumulative development program outlined at the time of listing is ~85% complete) All but one community expected to be completed and stabilized by the end of 2017
Proven Track Record of Value Creation: Development Pipeline to Stabilized Community Since listing, we have stabilized 8 communities at average realized NOI Yields at Stabilization of approximately 7.1% Results were largely above pro forma projections - Attractive returns on cost, which generally have been at spreads over market cap rates in excess of 150 – 200 basis points - Total Value Creation of approximately $90 million, or $0.54 per share, on these 8 stabilized properties(1) Point 21 – Denver, CO 14 Note 1) Represents estimates of value less estimated total Economic Cost for each of the projects (shown at Monogram Proportionate Share). See Appendix for additional descriptions
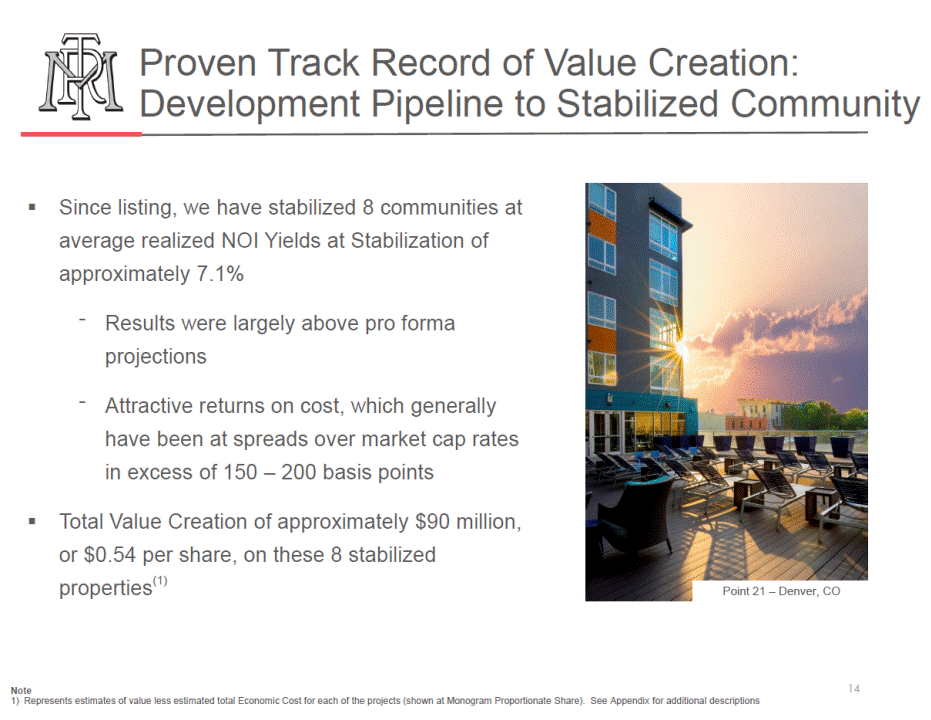
Lease-Up CommunitiesPrimarily Focused in Major Coastal Markets SoMa – Miami, FL CYAN on Peachtree – Atlanta, GA OLUME – San Francisco, CA Estimated Stabilization Date: 2Q16 Occupancy: 82% Projected NOI Yield at Stabilization: 8.2% Estimated Stabilization Date: 3Q16 Occupancy: 12% Projected NOI Yield at Stabilization: 5.5% Estimated Stabilization Date: 4Q16 Occupancy: 32% Projected NOI Yield at Stabilization: 7.0% The Verge – San Diego, CA Nouvelle – Tysons Corner, VA Zinc – Cambridge, MA Estimated Stabilization Date: 4Q16 Occupancy: 52% Projected NOI Yield at Stabilization: 6.3% Estimated Stabilization Date: 1Q17 Occupancy: 22% Projected NOI Yield at Stabilization: 6.0% Estimated Stabilization Date: 3Q17 Occupancy: 20% Projected NOI Yield at Stabilization: 5.3% 15 Note: 1) Data as of 3/31/16
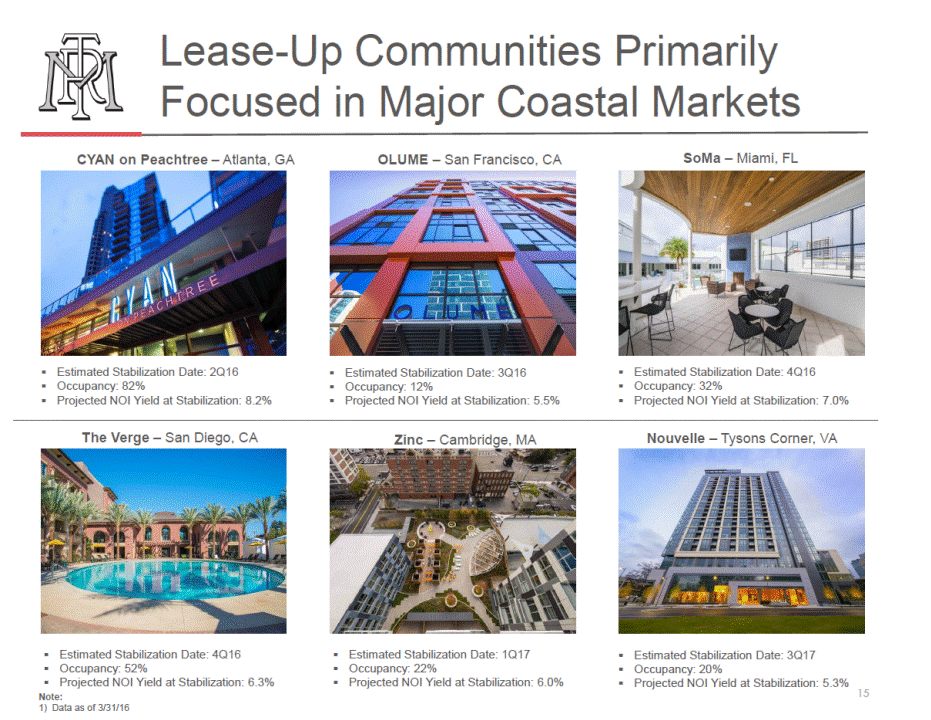
Communities Under Construction Primarily Focused in Major Coastal Markets Caspian Delray Beach – Delray Beach, FL HuntHinugntotingBtoenacBhea–chH–unHtuinngttionngtoBneaBceha,chC,ACA Note: 1)Map includes three development communities under construction as of 3/31/16; excludes land held for future development 16
ExpectedIncremental NOIin Development Communities Through 2016 Through 2017 Through 2018 Through 2019 17 (in millions) $40.0 $35.0 $30.0 $25.0 $20.0 $15.0 $10.0 $5.0 $-Previously StabilizedCurrent Period Additions Estimated Stabilization - 2016 Additions: 1. CYAN on Peachtree in 2Q 2. OLUME in 3Q 3. SoMa in 4Q 4. The Verge in 4Q Estimated Stabilization - 2017 Additions: 5. Zinc in 1Q 6. Caspian Delray Beach in 2Q 7. The Alexan in 3Q 8. Nouvelle in 3Q Estimated Stabilization - 2019 Additions: 9.Huntington Beach in 2Q Development NOI Summary Six recently completed development communities now in lease-up Three remaining developments under construction All but one community expected to be completed and stabilized by the end of 2017 Total projected NOI of approximately $38 million, which is estimated to contribute over $1 per share of NAV

Balance Sheet(1) Strong Current Contractual Balances by Maturity Year(2) Gross Operating Real Estate $3,244 $2,231 Construction in Progress, incl. Land $240 $157 Total Real Estate, Gross $3,484 $2,388 Mortgage and Construction Debt(3) $1,491 $978 Credit Facility(3) $39 $39 Total Debt $1,530 $1,017 Cash $68 $53 Debt / Gross Real Estate Assets 44% 43% Net Debt / Gross Real Estate Assets 42% 40% Notes 1) Data as of 3/31/16 2) Amounts reflect maturities as adjusted for extension options 3) Contractual Amounts as of 3/31/16 18 (in millions) $352 2016201720182019Thereafter Proportionate Share $154$180 $255 $76 Capitalization Summary as of March 31, 2016 (in Millions)Consol. Proportionate Debt Maturity Schedule Capital / Leverage Profile Approximately $322 million of available liquidity as of March 31, 2016 - $53 million of cash and $269 million of undrawn capacity on credit facilities Proven access to capital (mortgages, construction loans, credit facilities, JV equity, dispositions) Our share of estimated remaining development costs to complete is approximately $136 million. Funding is primarily expected to come from construction loans (binding commitments in place for approximately $45 million, or nearly 33%) Expect to use proceeds from potential sales to supplement funding of remaining development costs, thereby minimizing expected increase in leverage, and / or to pay down debt including borrowings on our credit facilities Strong balance sheet – 40% net debt to gross real estate assets (book value) Manageable debt maturities and weighted average interest rate of 3.3%

StrategicJoint Ventures Offer Efficient Capital for Growth Note: 1) Based on 1Q16 actual amounts annualized 2) Includes other co-investment partners in-addition to NPS and PGGM 19 Two Primary Institutional Joint Venture Relationships PGGM joint venture – Interests in both stabilized and development investments – 23 properties, containing 6,356 units in 11 markets – Gross cost of approximately $1.8 billion NPS joint venture –Interests in stabilized investments –14 properties, containing 3,748 units in 9 markets –Gross cost of approximately $925 million Enhances return on capital via promotes and fee income – Generates approximately $4.5 million(1) of fee income for Monogram annually which is projected to grow once developments are stabilized Buy / sell provisions which may allow for future wholly owned growth – Approximately $587 million of total JV property interests represent potential attractive acquisition opportunities with minimal transaction costs if Monogram determines they would be accretive acquisitions – Have previously purchased partners’ interests in 15 investments(2)

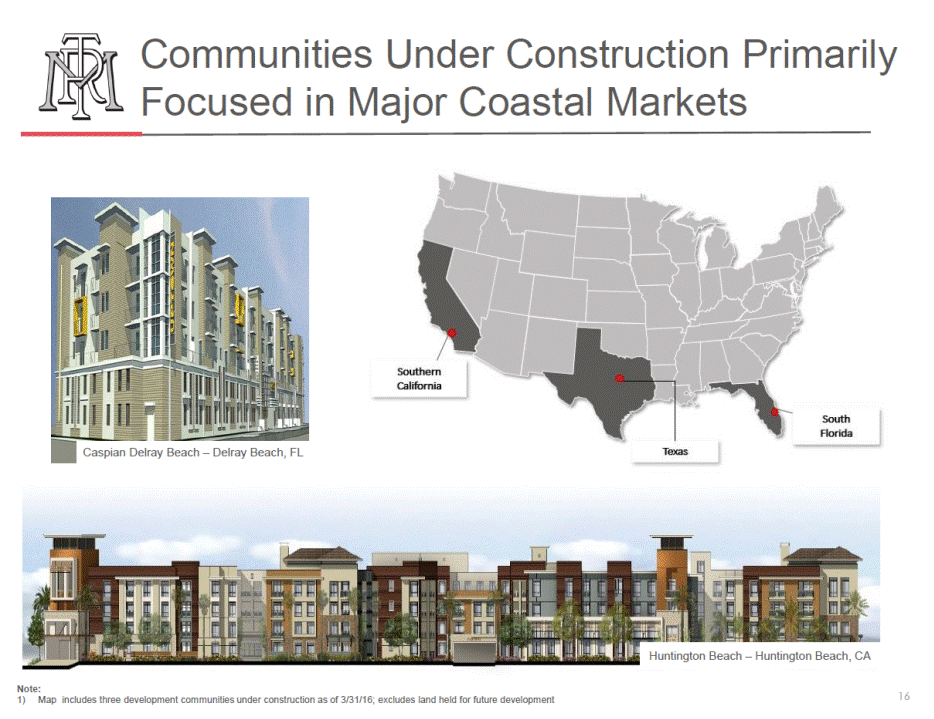
Monogram: A Compelling Proposition Value Executing on our strategy focused on strong operations and stabilizing developments Significant embedded NOI in development communities Disciplined approach to capital allocation Capitalizing on attractive investment and development opportunities in high-growth, urban coastal locations Considering selective asset dispositions to maximize value for all shareholders High-quality, class A portfolio that is significantly younger with lower cap-ex compared to other listed multifamily REITs Seven – Austin, TX 20
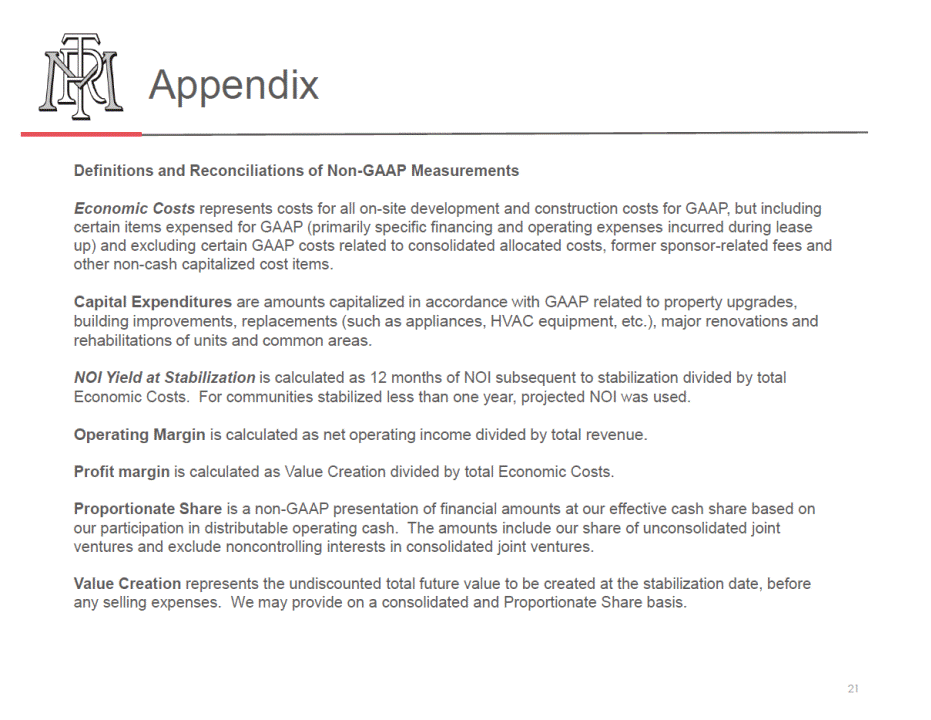
Appendix Definitions and Reconciliations of Non-GAAP Measurements Economic Costs represents costs for all on-site development and construction costs for GAAP, but including certain items expensed for GAAP (primarily specific financing and operating expenses incurred during lease up) and excluding certain GAAP costs related to consolidated allocated costs, former sponsor-related fees and other non-cash capitalized cost items. Capital Expenditures are amounts capitalized in accordance with GAAP related to property upgrades, building improvements, replacements (such as appliances, HVAC equipment, etc.), major renovations and rehabilitations of units and common areas. NOI Yield at Stabilization is calculated as 12 months of NOI subsequent to stabilization divided by total Economic Costs. For communities stabilized less than one year, projected NOI was used. Operating Margin is calculated as net operating income divided by total revenue. Profit margin is calculated as Value Creation divided by total Economic Costs. Proportionate Share is a non-GAAP presentation of financial amounts at our effective cash share based on our participation in distributable operating cash. The amounts include our share of unconsolidated joint ventures and exclude noncontrolling interests in consolidated joint ventures. Value Creation represents the undiscounted total future value to be created at the stabilization date, before any selling expenses. We may provide on a consolidated and Proportionate Share basis. 21
Appendix Non-GAAP Measurements We use the following non-GAAP measurements to present different components of our performance. We believe this information is also useful to our investors in comparing our results to other real estate companies and trusts because they provide characteristics of our performance that reflect the reality that real estate generally appreciates over time, which is not reflected in most depreciation methods, and focus on operating results widely used by real estate investors. These non-GAAP measurements should not be considered as alternatives to net income (loss) presented in accordance with GAAP but as a supplemental performance measurement. Because these measurements may exclude certain cash flows or expenses, we caution that these measurements may not be representative of our current or future liquidity as presented in accordance with GAAP. There can be no assurance that our methods for computing these non-GAAP measurements are comparable with those of other real estate companies and trusts in all respects. A reconciliation for each non-GAAP measurement to the most applicable GAAP measurement is provided below. Funds from Operations (“FFO”) is a non-GAAP performance financial measure that is widely recognized as a measure of REIT operating performance. We use FFO as currently defined by the National Association of Real Estate Investment Trusts (“NAREIT”) to be net income (loss), computed in accordance with GAAP, excluding gains (or losses) from sales of property (including deemed sales (if any) and settlements of pre-existing relationships), plus depreciation and amortization on real estate assets, impairment write-downs of depreciable real estate or of investments in unconsolidated real estate partnerships, joint ventures and subsidiaries (if any) that are driven by measurable decreases in the fair value of depreciable real estate assets, and after related adjustments for unconsolidated partnerships, joint ventures and subsidiaries and noncontrolling interests. May be calculated on a consolidated basis or based on our Proportionate Share. Core FFO is calculated starting from FFO adjusted for loss on early extinguishment of debt, acquisition expenses, contingent purchase price adjustments, gain or loss on derivative fair value adjustments and non-recurring expenses. May be calculated on a consolidated basis or based on our Proportionate Share. Adjusted Core FFO (“AFFO”) is calculated starting from Core FFO adjusted for recurring capital expenditures, straight-line rents and stock compensation expense. May be calculated on a consolidated basis or based on our Proportionate Share. 22

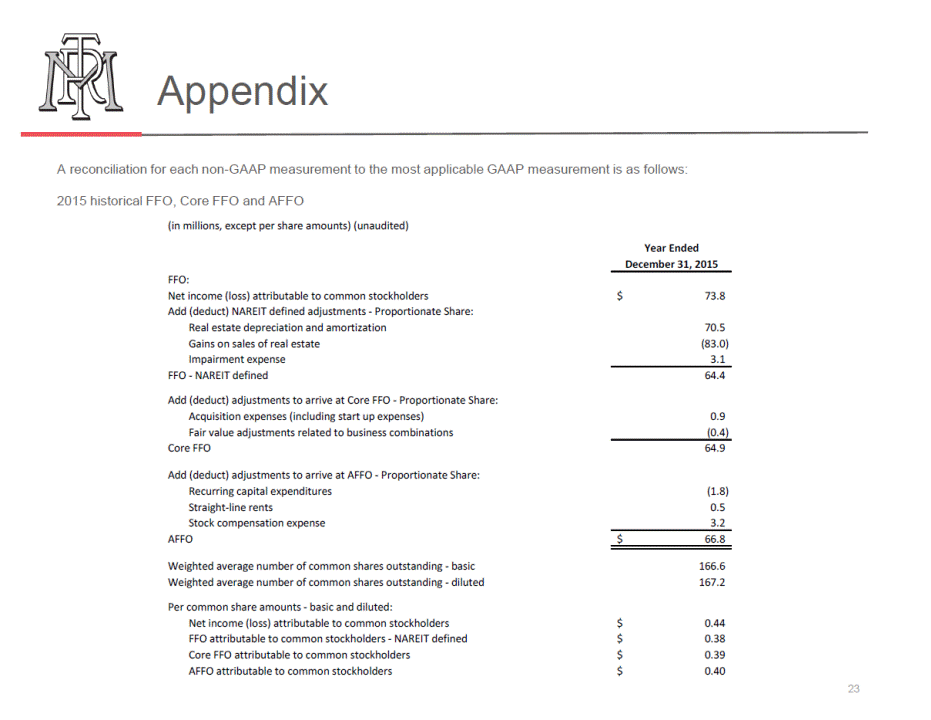
Appendix A reconciliation for each non-GAAP measurement to the most applicable GAAP measurement is as follows: 2015 historical FFO, Core FFO and AFFO (in millions, except per share amounts) (unaudited) Year Ended December 31, 2015 FFO: Net income (loss) attributable to common stockholders Add (deduct) NAREIT defined adjustments - Proportionate Share: Real estate depreciation and amortization Gains on sales of real estate Impairment expense FFO - NAREIT defined $ 73.8 70.5 (83.0) 3.1 64.4 Add (deduct) adjustments to arrive at Core FFO - Proportionate Share: Acquisition expenses (including start up expenses) Fair value adjustments related to business combinations Core FFO 0.9 (0.4) 64.9 Add (deduct) adjustments to arrive at AFFO - Proportionate Share: Recurring capital expenditures Straight-line rents Stock compensation expense AFFO (1.8) 0.5 3.2 $ 66.8 Weighted average number of common shares outstanding - basic Weighted average number of common shares outstanding - diluted 166.6 167.2 Per common share amounts - basic and diluted: Net income (loss) attributable to common stockholders FFO attributable to common stockholders - NAREIT defined Core FFO attributable to common stockholders AFFO attributable to common stockholders $ $ $ $ 0.44 0.38 0.39 0.40 23
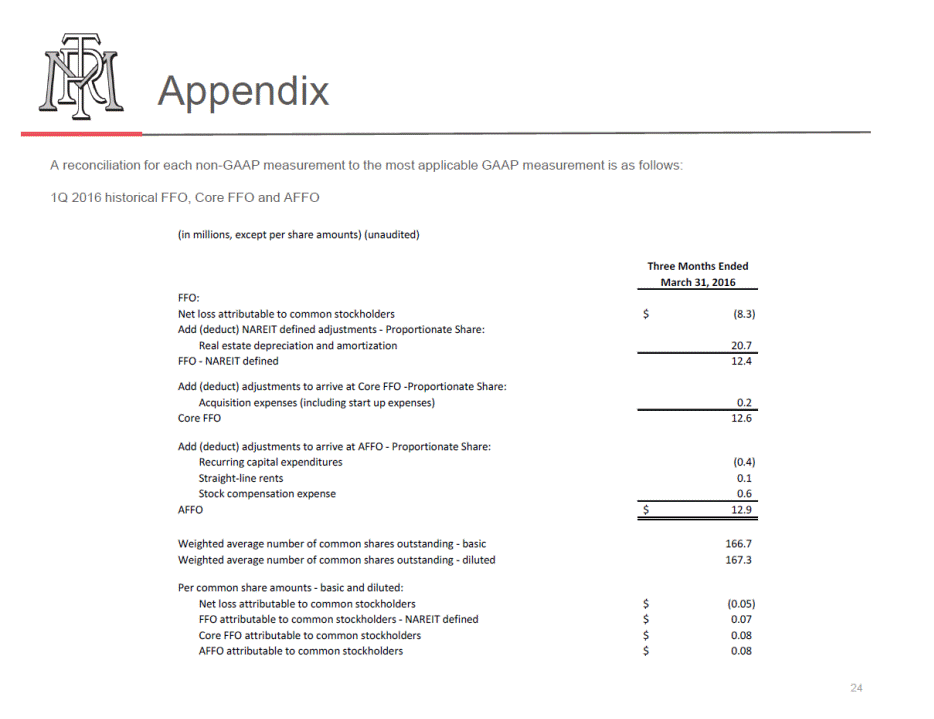
Appendix A reconciliation for each non-GAAP measurement to the most applicable GAAP measurement is as follows: 1Q 2016 historical FFO, Core FFO and AFFO (in millions, except per share amounts) (unaudited) Three Months Ended March 31, 2016 FFO: Net loss attributable to common stockholders Add (deduct) NAREIT defined adjustments - Proportionate Share: Real estate depreciation and amortization FFO - NAREIT defined $ (8.3) 20.7 12.4 Add (deduct) adjustments to arrive at Core FFO -Proportionate Share: Acquisition expenses (including start up expenses) Core FFO 0.2 12.6 Add (deduct) adjustments to arrive at AFFO - Proportionate Share: Recurring capital expenditures Straight-line rents Stock compensation expense AFFO (0.4) 0.1 0.6 $ 12.9 Weighted average number of common shares outstanding - basic Weighted average number of common shares outstanding - diluted 166.7 167.3 Per common share amounts - basic and diluted: Net loss attributable to common stockholders FFO attributable to common stockholders - NAREIT defined Core FFO attributable to common stockholders AFFO attributable to common stockholders $ $ $ $ (0.05) 0.07 0.08 0.08 24
Appendix Incremental growth potential Pro forma AFFO Annualized presented on page 5 represents incremental growth potential applicable to AFFO on an annualized basis for the period of the second half of 2017 on a pro forma basis. The incremental growth potential includes contributions projected to occur through the second half of 2017 from the stabilization of our lease up / development communities, acquisitions not stabilized in 1Q 2016, incremental same store growth only related to 2016 and interest expense (net of capitalized interest) each as described on page 5. The incremental growth potential does not include possible pro forma effects, including but not limited to, other operating results, interest income, general and administrative expenses or other factors affecting operations. Further, amounts for stabilized operations occur over different time periods. Accordingly, the incremental growth potential should not be considered a full projected operating projection for any single period. Because the amounts are based on Company projections, a range of amounts on a fully diluted per common share basis are presented. Amounts presented are per fully diluted common share Low Range High Range Proforma annualized net income (loss) attributable to common stockholders Add (deduct) NAREIT defined adjustments - Proportionate Share: Real estate depreciation and amortization Proforma FFO annualized - NAREIT defined $ (0.04) $ - 0.54 0.52 0.50 0.52 Add (deduct) adjustments to arrive at Proforma Core FFO annualized -Proportionate Share: Other (including acquisition expenses and start up costs) Proforma Core FFO annualized - - 0.50 0.52 Add (deduct) adjustments to arrive at Proforma AFFO annualized - Proportionate Share: Other (including recurring capital expenditures, straight-line rents and stock compensation expense) Proforma AFFO annualized - - $ 0.50 $ 0.52 Weighted average number of common shares outstanding - diluted (in millions) 167.3 167.3 25

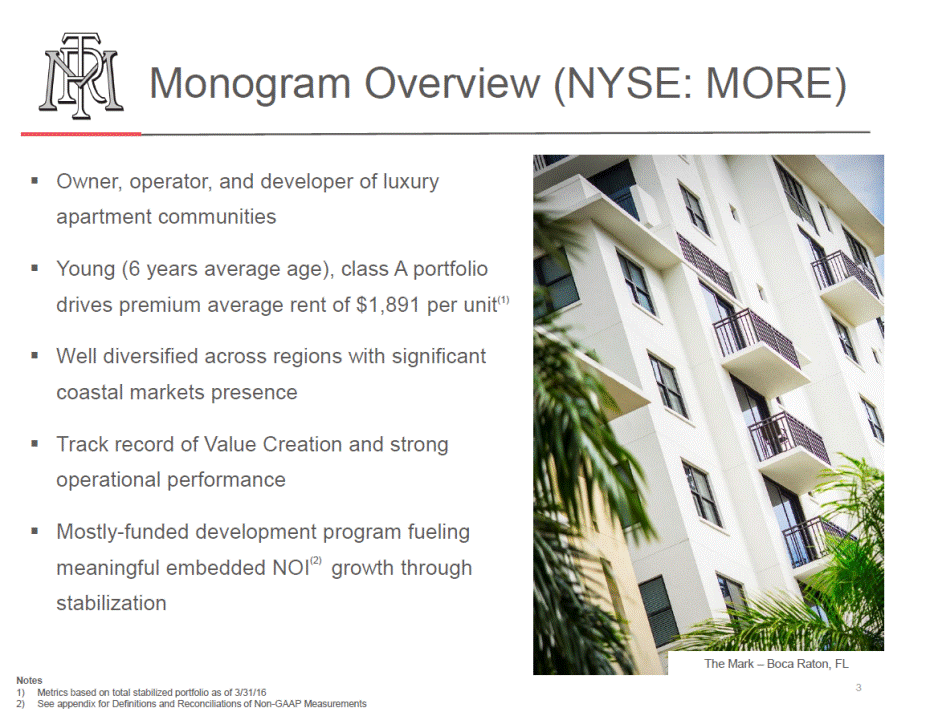
Appendix Net Operating Income (“NOI”) is calculated as total rental revenue less direct property operating expenses including real estate taxes. NOI does not include property management revenues, interest income, property management expenses, depreciation, interest and other finance expense, corporate general and administrative expenses, overhead allocations and other non-onsite operations. We provide NOI on a consolidated and Proportionate Share basis. The reconciliation of net income (loss) to proportionate share of NOI is provided below: (in thousands) (unaudited) Three Months Ended March 31, 2016 2015 Reconciliation of net loss to NOI, Same Store NOI and Same Store NOI - Proportionate Share: Net loss Adjustments to reconcile net loss to NOI: Corporate property management expenses General and administrative expenses Interest expense Amortization of deferred financing costs Depreciation and amortization Interest income Investment and other development expenses Other, net NOI Less: non-comparable Rental revenue Property operating expenses, including real estate taxes Same Store NOI Less: Adjustment to adjust above items to Proportionate Share Same Store NOI - Proportionate Share $ (11,060) $ (1,177) 2,601 6,510 10,366 1,536 30,056 (1,682) 155 238 1,814 4,776 5,997 831 24,549 (2,597) 231 (210) 38,720 34,214 (15,082) 9,003 (8,365) 4,713 32,641 (9,199) 30,562 (8,762) $ 23,442 $ 21,800 26
