Attached files
| file | filename |
|---|---|
| EX-10.1 - EX-10.1 - COUSINS PROPERTIES INC | d208068dex101.htm |
| 8-K - 8-K - COUSINS PROPERTIES INC | d208068d8k.htm |
 INVESTOR PRESENTATION
June 2016 Simple Platform. Trophy Assets. Opportunistic Investments. Exhibit 99.1 |
 Forward-Looking Statements
Cautionary Note Regarding Forward-Looking Statements
Additional Information about the Proposed Transactions and Where to Find
It This document may include “forward-looking
statements” within the meaning of the Private Securities Litigation Reform Act. All statements other than statements of historical fact are “forward-looking statements” for purposes
of federal and state securities laws. These forward-looking statements,
which are based on current expectations, estimates and projections about the industry and markets in which Cousins Properties Incorporated (“Cousins”) and Parkway Properties, Inc. (“Parkway”) operate and beliefs of and assumptions made by Cousins management and Parkway
management, involve uncertainties that could significantly affect the financial or operating results of Cousins, Parkway, the combined company or any company spun-off by the combined company. Words such as “expects,”
“anticipates,” “intends,” “plans,” “believes,” “seeks,” “estimates,” “will,” variations of such words and similar expressions are intended to identify such forward-looking statements. Such forward-looking statements include, but are not
limited to, statements about the benefits of the proposed transactions involving Cousins and Parkway, including future financial and operating results, plans, objectives, expectations and intentions. All statements that address
operating performance, events or developments that we expect or anticipate will occur in the future — including statements relating to creating value for stockholders, benefits of the proposed transactions to tenants,
employees, stockholders and other constituents of the combined company, integrating our companies, cost savings and the expected timetable for completing the proposed transactions — are forward-looking statements. These
statements are not guarantees of future performance and involve certain risks, uncertainties and assumptions that are difficult to predict. Although we believe the expectations reflected in any forward-looking statements are based
on reasonable assumptions, we can give no assurance that our expectations will be attained and, therefore, actual outcomes and results may differ materially from what is expressed or forecasted in such forward-looking
statements. For example, these forward-looking statements could be affected by factors including, without limitation, risks associated with the ability to consummate the proposed merger and the timing of the closing of the proposed
merger; risks associated with the ability to consummate the proposed spin-off of a company holding the Houston assets of Cousins and Parkway (“New Parkway”) and the timing of the closing of the proposed spin-off;
risks associated with the ability to list the common stock of New Parkway on the New York Stock Exchange following the proposed spin-off; risks associated with the ability to consummate certain asset sales contemplated by Parkway
and the timing of the closing of such proposed asset sales; risks associated with the ability to consummate the proposed reorganization of certain assets and liabilities of Cousins and Parkway, including the contemplated structuring
of Cousins and New Parkway as “UPREITs” following the consummation of the proposed transactions; the failure to obtain the necessary debt financing arrangements set forth in the commitment letter received in
connection with the proposed transactions; the ability to secure favorable interest rates on any borrowings incurred in connection with the proposed transactions; the impact of such indebtedness incurred in connection with the
proposed transactions; the ability to successfully integrate our operations and employees; the ability to realize anticipated benefits and synergies of the proposed transactions; the potential liability for a failure to meet
regulatory requirements, including the maintenance of REIT status; material changes in the dividend rates on securities or the ability to pay dividends on common shares or other securities; potential changes to tax legislation; changes in
demand for developed properties; adverse changes in financial condition of joint venture partner(s) or major tenants; risks associated with the acquisition, development, expansion, leasing and management of properties; risks
associated with the geographic concentration of Cousins, Parkway or New Parkway; risks associated with the industry concentration of tenants; the potential impact of announcement of the proposed transactions or consummation
of the proposed transactions on relationships, including with tenants, employees, customers and competitors; the unfavorable outcome of any legal proceedings that have been or may be instituted against Cousins, Parkway
or any company spun-off by the combined company; significant costs related to uninsured losses, condemnation, or environmental issues; the ability to retain key personnel; the amount of the costs, fees, expenses and
charges related to the proposed transactions and the actual terms of the financings that may be obtained in connection with the proposed transactions; changes in local, national and international financial market, insurance
rates and interest rates; and those additional risks and factors discussed in reports filed with the Securities and Exchange Commission (“SEC”) by Cousins and Parkway. Cousins and Parkway do not intend, and undertake no
obligation, to update any forward-looking statement. In connection with the proposed transactions, Cousins has filed
with the SEC a registration statement on Form S-4 that includes a preliminary joint proxy statement of Cousins and Parkway that also constitutes a prospectus of Cousins. Investors and security holders are urged to read the preliminary joint proxy statement/prospectus and other relevant documents
filed with the SEC, when they become available (including the definitive joint proxy statement/prospectus), because they contain important information about the proposed transactions. Investors and security holders may
obtain free copies of these documents, and other documents filed with the SEC, at www.sec.gov. In addition, investors and security holders may obtain free copies of the documents filed with the SEC by Cousins by
contacting Cousins Investor Relations at (404) 407-1898. Investors and security holders may obtain free copies of the documents filed with the SEC by Parkway by contacting Parkway Investor Relations at (407)
650-0593. Cousins and Parkway and their respective directors and executive officers and other members of management and employees may be deemed to
be participants in the solicitation of proxies in respect of the proposed transactions. Information about Cousins’ directors and executive officers is available in Cousins’ proxy statement for its 2016
Annual Meeting, which was filed with the SEC on March 22, 2016. Information about directors and executive officers of Parkway is available in the proxy statement for its 2016 Annual Meeting, which was filed with the SEC on March 28,
2016. Other information regarding the participants in the proxy solicitation and a description of their direct and indirect interests, by security holdings or otherwise, is contained in the preliminary joint proxy
statement/prospectus and other relevant materials filed with the SEC regarding the merger when they become available (including the definitive joint proxy statement/prospectus). Investors should read the definitive joint proxy
statement/prospectus carefully before making any voting or investment decisions when it becomes available. You may obtain free copies of these documents from Cousins or Parkway using the sources indicated above. This communication and
the information contained herein shall not constitute an offer to sell or the solicitation of an offer to buy any securities, nor shall there be any sale of securities in any jurisdiction in which such offer,
solicitation or sale would be unlawful prior to registration or qualification under the securities laws of any such jurisdiction. No offering of securities shall be made except by means of a prospectus meeting the requirements of Section 10 of the
U.S. Securities Act of 1933, as amended. |
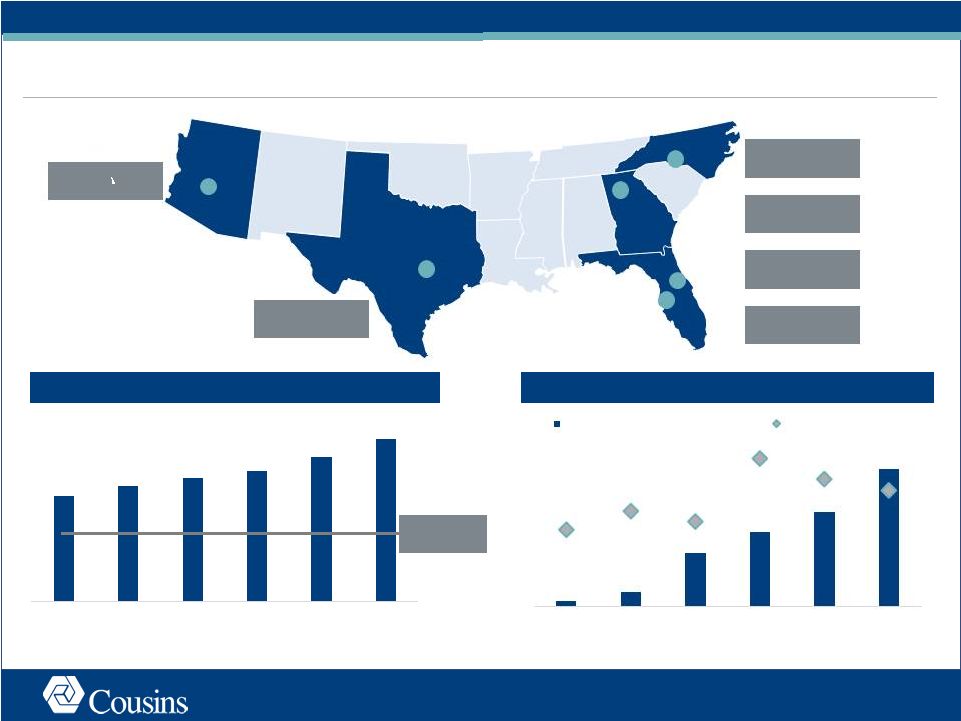
 Cousins
Overview Post-Transactions Class
A Office Portfolio » 41 first class assets » 15.8 million rentable square feet 2 » 81% urban 2 » Average 450,000 square feet per asset » Average year built 1996 » Average in-place cash rent per square foot $30.78 3 » 91% leased » Undepreciated book value ~$4.8 billion 4 High Growth Sunbelt Markets » Atlanta » Austin » Charlotte » Orlando » Phoenix » Tampa Strong, simple balance sheet » ~5.2x net debt/EBITDA 5 » Among best in the office REIT industry Value Creation Expertise 6 » $367 million development pipeline » Office portion 74% leased Source: Derived from Q1 2016 Cousins and Parkway filings. 1. Represents the combined categories of Cousins and Parkway as reported in 31-Mar-2016 company filings
adjusted for the spin-off of New Parkway, actual asset sales in 2016 and planned
asset sales in 2016. Includes Cousins mixed-use assets; excludes
Cousins assets under construction. 2.
Includes pro rata share of JV rentable square footage as of 31-Mar-2016. %
Urban is based on pro rata GAAP NOI.
3. Reflects contractual rent, includes pro rata share of JV. 4. Represents the combined undepreciated book value of Cousins and Parkway derived from 31-Dec-2015
company filings adjusted for the Houston spin-off, 2016 actual sales and 2016
projected sales. Undepreciated book value represents total assets in
accordance with GAAP plus accumulated depreciation of real estate assets
and accumulated depreciation of intangible assets. 5.
Represents management’s estimate of leverage and latest quarter annualized EBITDA
as of 31-Dec-2016 6.
As reported in Cousins 31-Mar-2016 filings. Also includes Dimensional Fund
Advisors build-to-suit. 7.
Geographic breakdown per 1Q 2016 GAAP NOI, includes pro rata share of JVs.
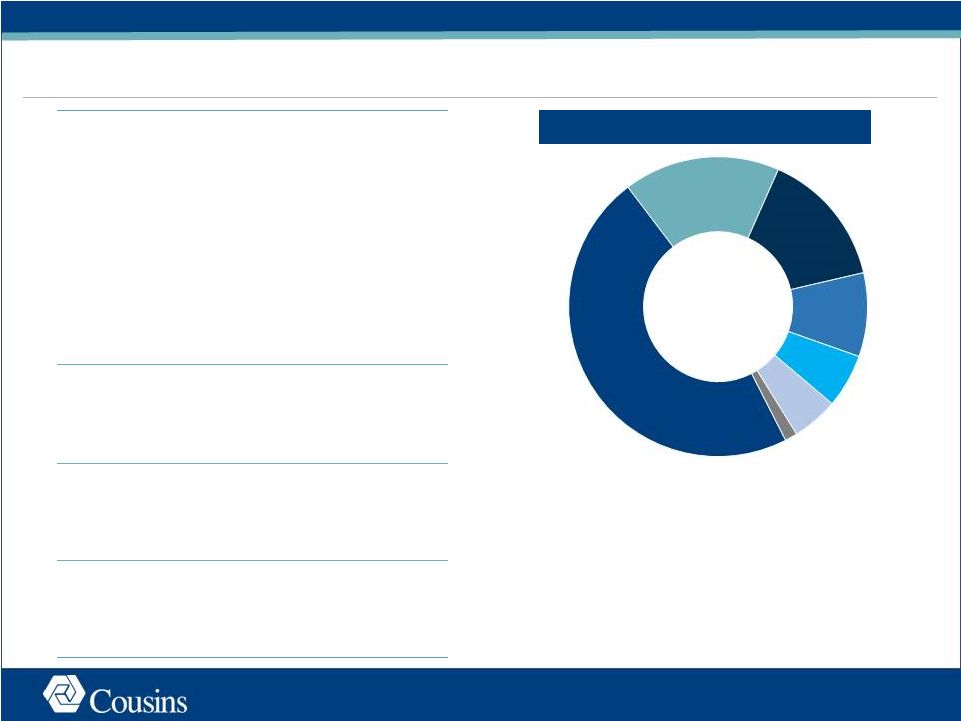
Market Concentration 7 1 Atlanta 47% Charlotte 17% Austin 15% Tampa 9% Phoenix 6% Orlando 5% Miami 1% 1 1 |
 Cousins
Strategic Objectives Assemble trophy office portfolio in high growth Sun
Belt markets Post
Transactions: 15.8 mm square feet 1 of Class A office towers in high growth urban Sun Belt markets Achieve compelling critical mass in leading urban submarkets Post Transactions: #1 Class A office owner 2 in four of the strongest urban submarkets in the Sun Belt Command premium rents in our markets Post Transactions: Cousins assets command 20% - 56% premium 3 in their respective markets Secure a diversified customer base with limited near-term lease expirations Post Transactions: No single industry
represents more than 20% of our customer base
4 and our weighted average lease term is ~6.5 years 5 . Maintain a conservative balance sheet positioned for growth Post Transactions: Increased scale,
simple capital structure and industry leading
leverage 1. Source: Derived from Q1 2016 Cousins and Parkway filings. Represents the combined categories of Cousins and Parkway as reported in
31-Mar-2016 company filings adjusted for the spin-off of New Parkway, actual asset sales in 2016 and planned asset sales in 2016. Includes pro rata share of JV rentable square footage as of 31-Mar-2016. Includes Cousins
mixed-use assets; excludes Cousins assets under construction.
2. Source: CoStar. Based on 100% of building square footage. Does not include owner occupied buildings Represents management’s estimate of
leverage and latest quarter annualized EBITDA as of 31-Mar-2016
3. Source: CoStar 1Q 2016 Market Reports. Represents weighted average gross rental rates; where net rents are quoted, operating expenses are added to
achieve gross rents. 4.
See slide 9 for source and data.
5. See slide 10 for source and data. 2 |
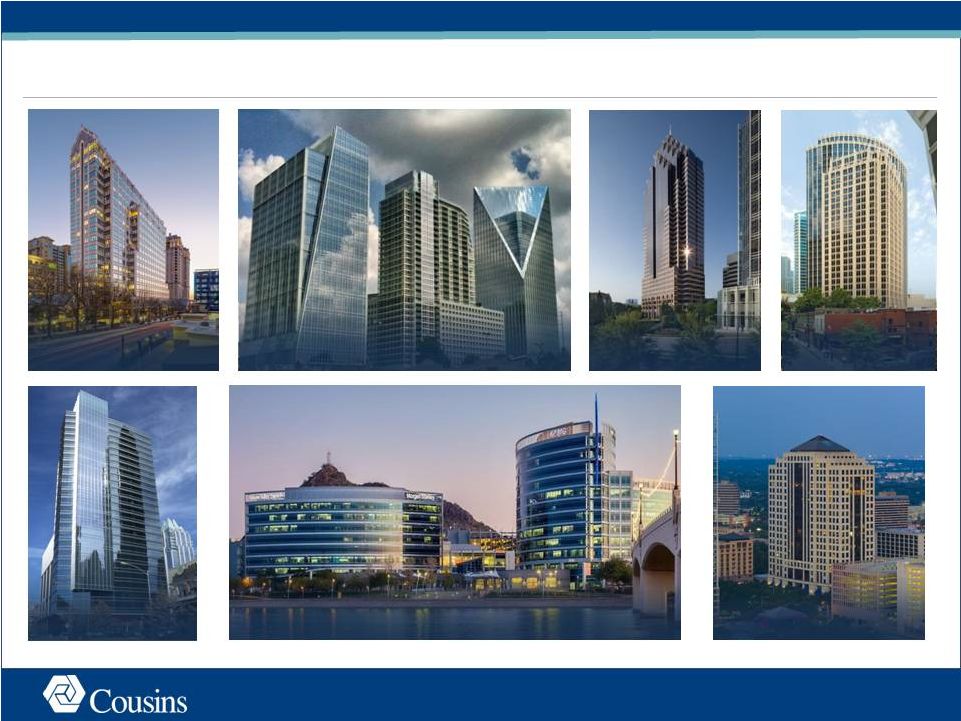 Assemble
Trophy Office Portfolio in High Growth Sun Belt Markets Source: Q1 2016
Cousins and Parkway filings. Promenade / Atlanta, GA
777,000 Sq. Ft.; 93% Leased Terminus / Atlanta, GA 1,225,000 Sq. Ft.; 92% Leased Fifth Third Center / Charlotte, NC 698,000 Sq. Ft.; 96% Leased Hayden Ferry Lakeside / Phoenix, AZ 788,000 Sq. Ft.; 93% Leased San Jacinto Plaza / Austin, TX 406,000 Sq. Ft.; 99% Leased One Buckhead Plaza / Atlanta, GA 464,000 Sq. Ft.; 95% Leased Colorado Tower / Austin, TX 373,000 Sq. Ft.; 100% Leased 3 |
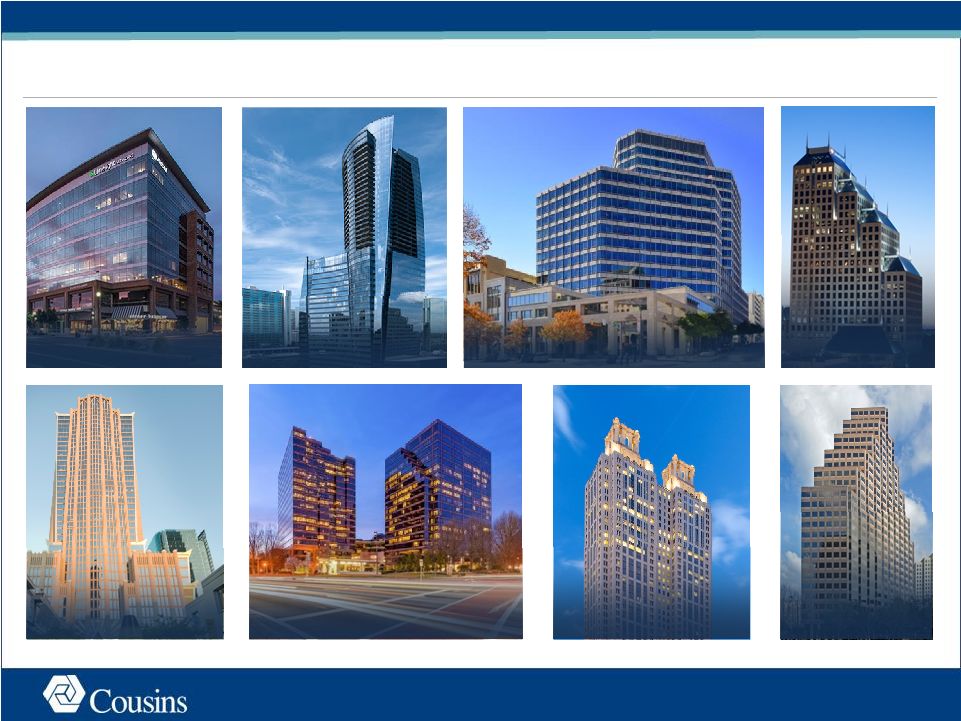 Assemble
Trophy Office Portfolio in High Growth Sun Belt Markets 4
Source: Q1 2016 Cousins and Parkway filings. Includes recently announced leasing at 191
Peachtree. 816 Congress / Austin, TX
435,000 Sq. Ft.; 99% Leased 3344 Peachtree / Atlanta, GA 485,000 Sq. Ft.; 98% Leased Bank of America Center / Orlando, FL 421,000 Sq. Ft.; 90% Leased Northpark Town Center / Atlanta, GA 1,528,000 Sq. Ft.; 84% Leased One Congress Plaza / Austin, TX 515,000 Sq. Ft.; 89% Leased Hearst Tower / Charlotte, NC 963,000 Sq. Ft.; 98% Leased 191 Peachtree / Atlanta, GA 1,225,000 Sq. Ft.; 92% Leased Tempe Gateway / Phoenix, AZ 264,000 Sq. Ft.; 99% Leased |
 Assemble
Trophy Office Portfolio in High Growth Sun Belt Markets Source: Derived
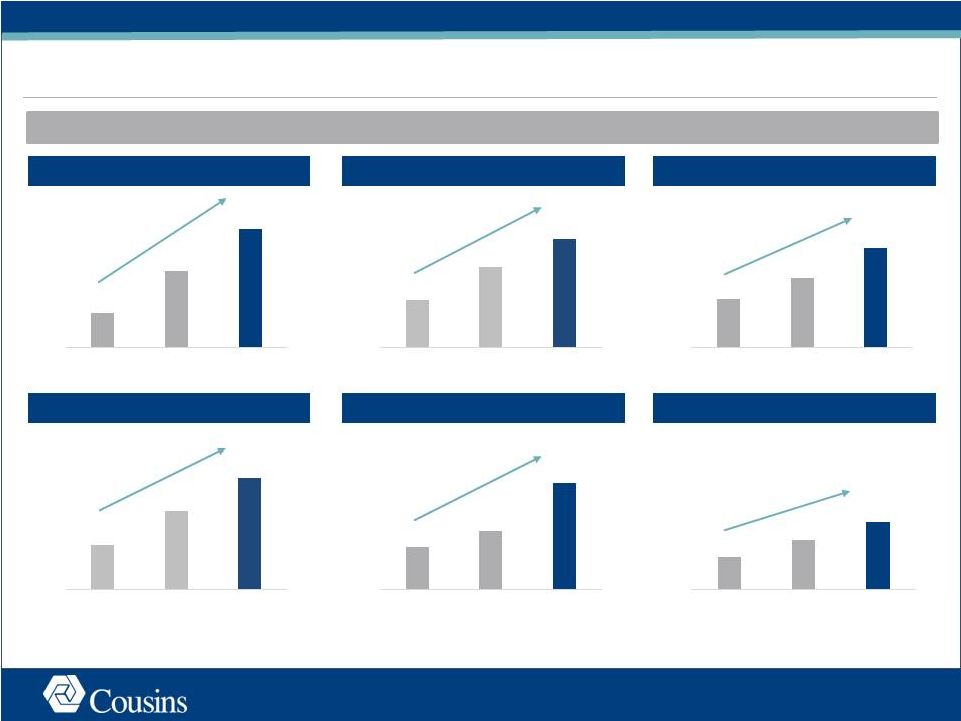
from Q1 2016 Cousins and Parkway filings at pro rata share includes mixed-use projects, BLS.gov employment growth as of April 2016, CoStar 1Q 2016 Market Report. 2.9% 3.2% 3.4% 3.6% 4.0% 4.5% Charlotte Atlanta Tampa Phoenix Austin Orlando Employment Growth Construction as a % of Total Inventory US Avg. 1.9% Phoenix, AZ Austin, TX Tampa, FL Orlando, FL Atlanta, GA Charlotte, NC Year-Over-Year 777,000 Sq. Ft. 95% Leased 1,902,000 Sq. Ft. 92% Leased 1,681,000 Sq. Ft. 85% Leased 7,790,000 Sq. Ft. 89% Leased 1,038,000 Sq. Ft. 90% Leased 2,588,000 Sq. Ft. 99% Leased 5 0.1% 0.3% 1.1% 1.5% 2.0% 2.9% Tampa Orlando Atlanta Phoenix Austin Charlotte % of Inventory Under Construction 10-Year Historical Avg. |
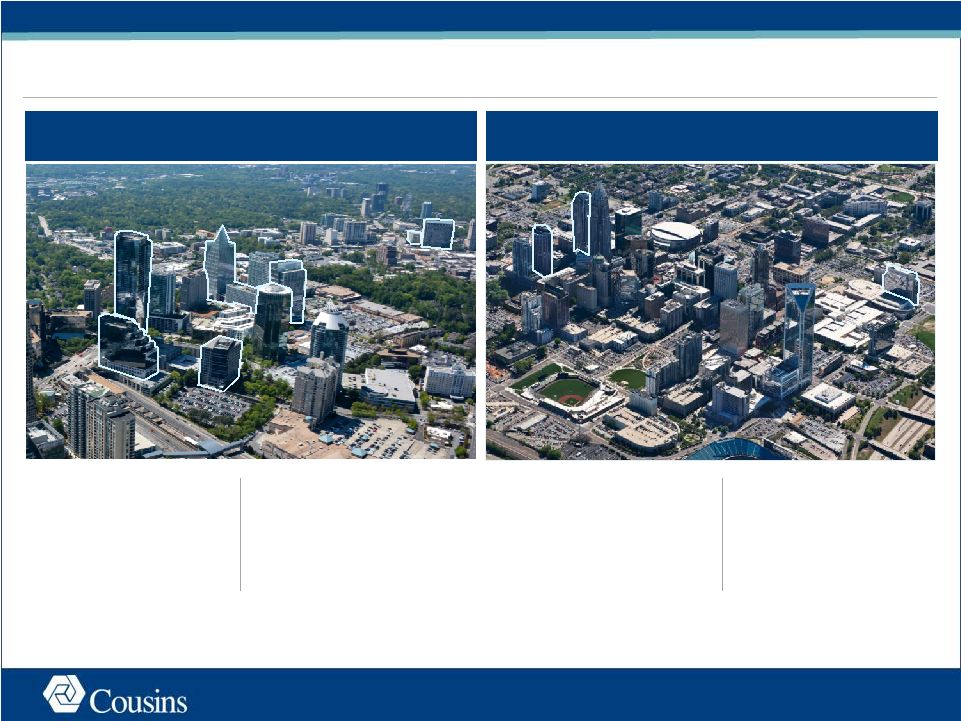 Achieve
Compelling Critical Mass in Leading Urban Submarkets Atlanta
- Buckhead
Charlotte - Uptown Source: CoStar. Based on 100% of building square footage. Does not include owner occupied buildings.
21% Market Share of Class A Office #1 Class A Office Owner by Sq. Ft. 20% Market Share of Class A Office #1 Class A Office Owner by Sq. Ft. 6 |
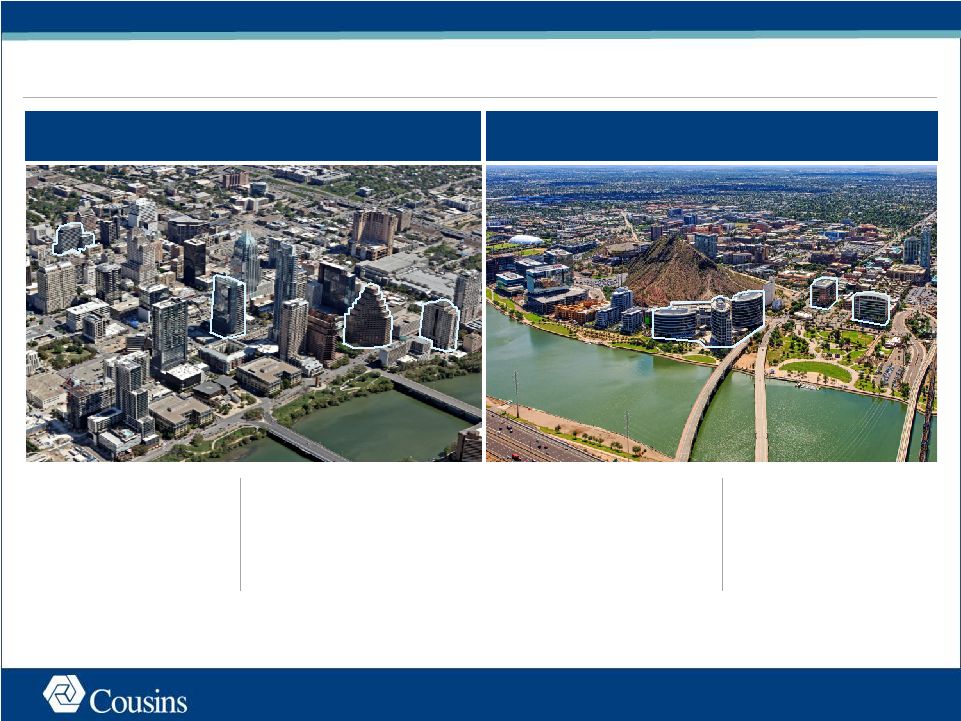 7 Austin - CBD Phoenix - Tempe 23% Market Share of Class A Office 28% Market Share of Class A Office #1 Class A Office Owner by Sq. Ft. #1 Class A Office Owner by Sq. Ft. Source: CoStar. Based on 100% of building square footage. Does not include owner occupied buildings.
Achieve Compelling Critical Mass in Leading Urban Submarkets
|
 Austin Charlotte Atlanta Command Premium Rents in Our Markets Orlando Phoenix Tampa 8 Source: CoStar 1Q 2016 Market Reports. 1. Represents weighted average gross rental rates; where net rents are quoted, operating expenses are added to achieve gross rents.
56% Higher 40% Higher 26% Higher 23% Higher 40% Higher 20% Higher Class A Asking Rent ($/Sq. Ft. ) 1 $23.03 $25.30 $27.53 Orlando CBD Cousins CBD $27.18 $29.94 $37.99 Phoenix Tempe Cousins Tempe $25.62 $28.47 $31.39 Tampa Bay Westshore Cousins Westshore $36.16 $44.01 $50.66 Austin CBD Cousins CBD $26.52 $29.31 $33.36 Charlotte Metro Uptown Cousins Uptown $25.75 $32.97 $40.05 Atlanta Buckhead Cousins Buckhead |
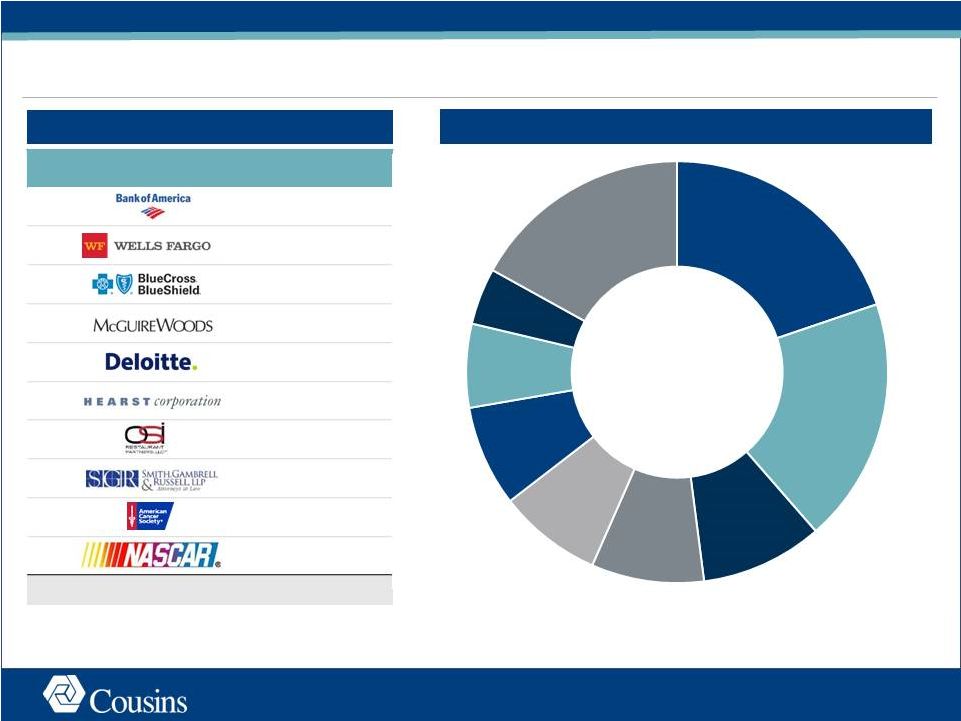 Secure a
Diversified Customer Base 9
Source: Q4 2015 Cousins and Parkway filings.
Note: Does not include NCR or Dimensional Fund Advisors developments.
1. Represents combined customers of Cousins and Parkway as a percentage of annual contractual rent as reported at 31-Dec-2016 adjusted for
the spin-off of New Parkway, asset sales in 2016 and planned asset
sales in 2016. Rank
Customer % of Annual Base Rent Leased Sq. Ft. 1 4.7% 1,210,877 2 2.3% 261,407 3 1.7% 227,592 4 1.5% 198,648 5 1.5% 259,998 6 1.5% 181,323 7 1.4% 167,723 8 1.3% 159,136 9 1.3% 275,160 10 1.3% 139,461 Total 18.4% 3,081,325 Other 17% Portfolio Top Customers Customers by Industry 1 1 Financial Services 20% Real Estate 4% Marketing & Media 6% Technology 8% Professional Services 8% Consumer Goods & Services 9% Healthcare Services 9% Legal Services 19% |
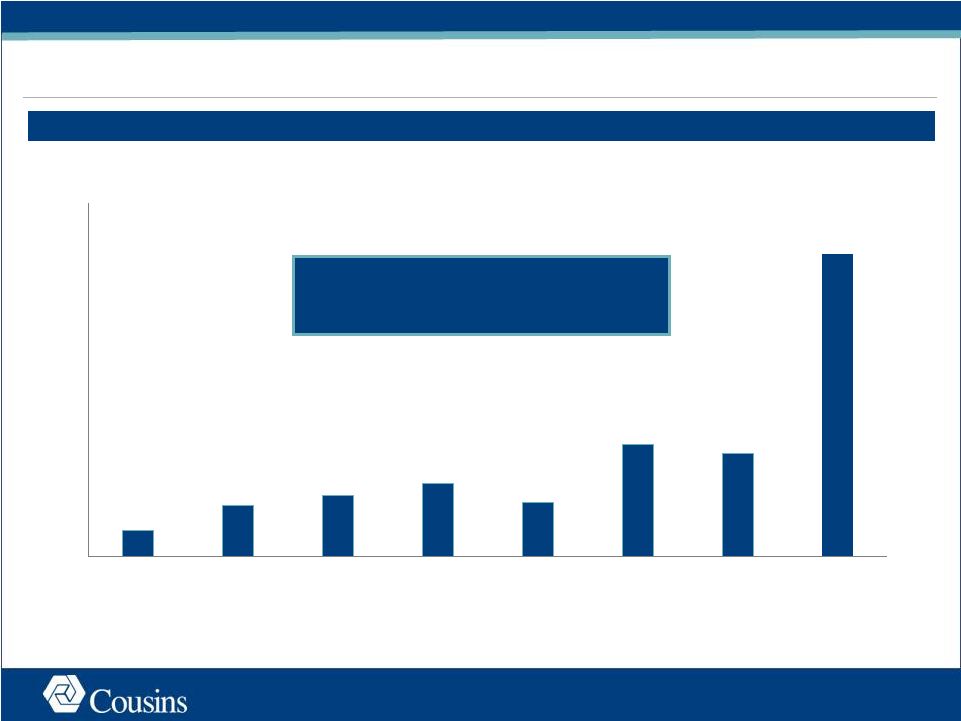 3% 7% 8% 9% 7% 14% 13% 39% 0% 5% 10% 15% 20% 25% 30% 35% 40% 45% 2016 2017 2018 2019 2020 2021 2022 2023 + Weighted Average Remaining Lease Term of ~6.5 years Limited Near-Term Lease Expirations Expiring % of Total Sq. Ft. Note: Information above represents combined lease expirations of Cousins and Parkway reported in Q1 2016 filings adjusted for the assets sold in 2016, planned asset sales of Parkway and the New Parkway spin-off. 1. Includes Hayden Ferry III development. 10 1 1 |
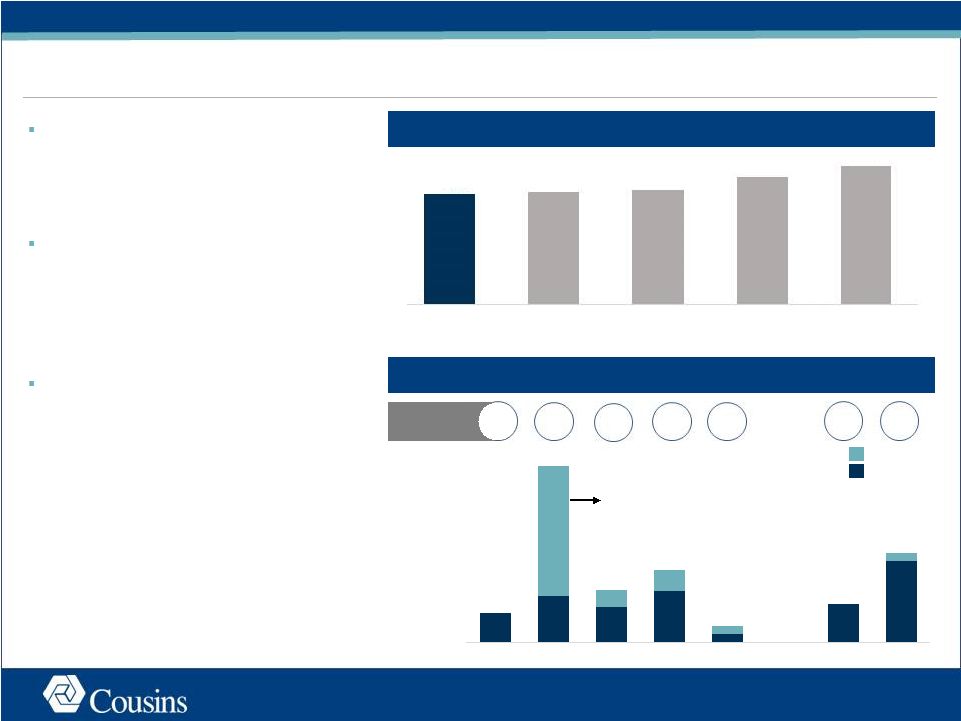 - $82MM $490MM $146MM $201MM $45MM $107MM $383MM 2016 2017 2018 2019 2020 2021 2022 2023+ Maintain a Conservative Balance Sheet Positioned for Growth Near-Term Refinance Opportunities Wtd. Avg. Interest Rate 6 2.2% 3.3% 6.1% 2.8% 6.3% 4.3% 4.2% Net Debt / EBITDA Debt Maturity Schedule (mm) 5 = Parkway = Cousins 1. HIW / BXP / KRC / SNL Office Index leverage represents net debt divided by latest
quarter annualized EBITDA per 1Q 2016 respective company filings.
2. Represents the combined undepreciated book value of Cousins and Parkway derived from 31-Dec-2015 company filings adjusted for the Houston spin-off, 2016
actual sales and 2016 projected sales. Undepreciated book value represents total
assets in accordance with GAAP plus accumulated depreciation of real
estate assets and accumulated depreciation of intangible
assets. 3.
Represents management’s estimate of leverage and latest quarter annualized
EBITDA as of 31-Dec-2016.
4. SNL Office Index is calculated as the weighted average net debt to EBITDA for companies that disclose such metrics in 1Q 2016 company filings. 5. Represents combined debt of Cousins and Parkway as reported in 1Q 2016 company filings adjusted for the repayment of Parkway term debt, the repayment of debt associated with the assumed asset sales and additional mortgage debt on currently unencumbered properties. 6. Weighted average interest rate represents existing debt only. Increased scale » ~$4.8 billion undepreciated book value » Improves access to capital Low leverage » ~5.2x net debt/EBITDA » Simple capital structure » Among best in the office REIT industry Refinance opportunities » ~$500mm 2017 debt maturities » Take advantage of historically low long-term rates 11 2 3 1 Cousins at Closing³ BXP HIW KRC SNL Office Index 4 ~5.2x 5.3x 5.4x 6.0x 6.5x |
 Appendix |
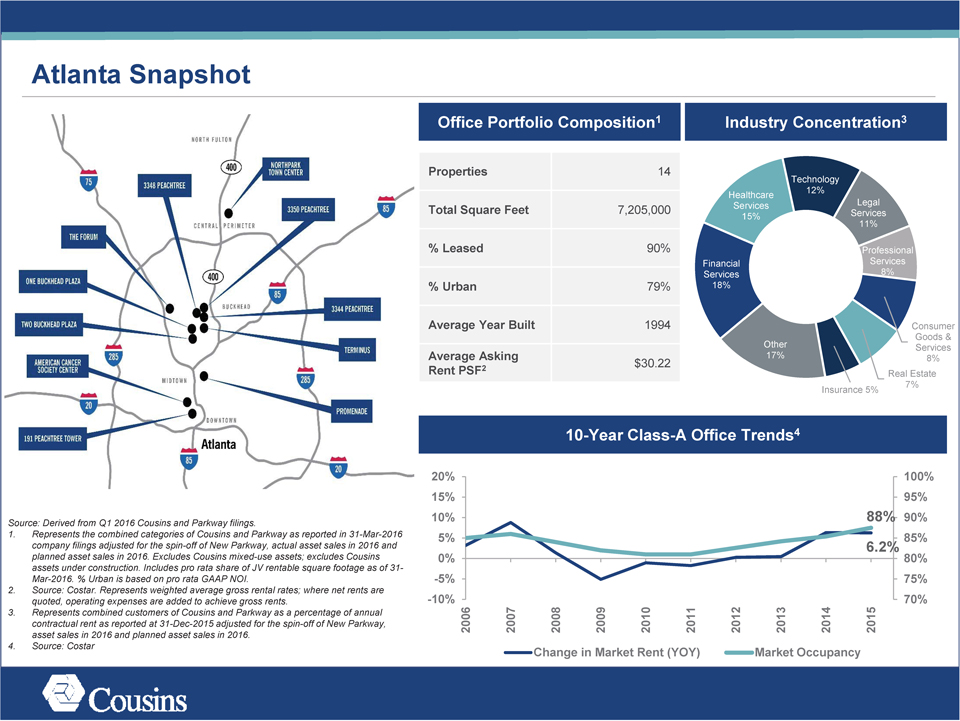
Atlanta Snapshot
Office
Portfolio Composition1 Industry Concentration3
Properties 14
Technology
Healthcare 12%
Legal
Total Square Feet 7,205,000 Services Services
15%
11%
% Leased 90% Professional
Financial Services
Services 8%
% Urban 79% 18%
Average Year Built 1994 Consumer
Goods &
Other Services
Average Asking 17% 8%
$30.22
Rent PSF2 Real Estate
Insurance 5% 7%
Source: Derived from Q1 2016 Cousins and Parkway filings.
1. Represents the combined
categories of Cousins and Parkway as reported in 31-Mar-2016 company filings adjusted for the spin-off of New Parkway, actual asset sales in 2016 and planned asset sales in 2016. Excludes Cousins mixed-use assets; excludes Cousins assets under
construction. Includes pro rata share of JV rentable square footage as of 31-Mar-2016. % Urban is based on pro rata GAAP NOI.
2. Source: Costar. Represents
weighted average gross rental rates; where net rents are quoted, operating expenses are added to achieve gross rents.
3. Represents combined customers of Cousins
and Parkway as a percentage of annual contractual rent as reported at 31-Dec-2015 adjusted for the spin-off of New Parkway, asset sales in 2016 and planned asset sales in 2016.
4. Source: Costar
10-Year Class-A Office Trends4
20% 100%
15% 95%
10% 88% 90%
5% 85%
0% 6.2% 80%
-5% 75%
-10% 70%
2006 2007 2008 2009 2010 2011 2012 2013 2014 2015
Change in Market Rent (YOY) Market Occupancy
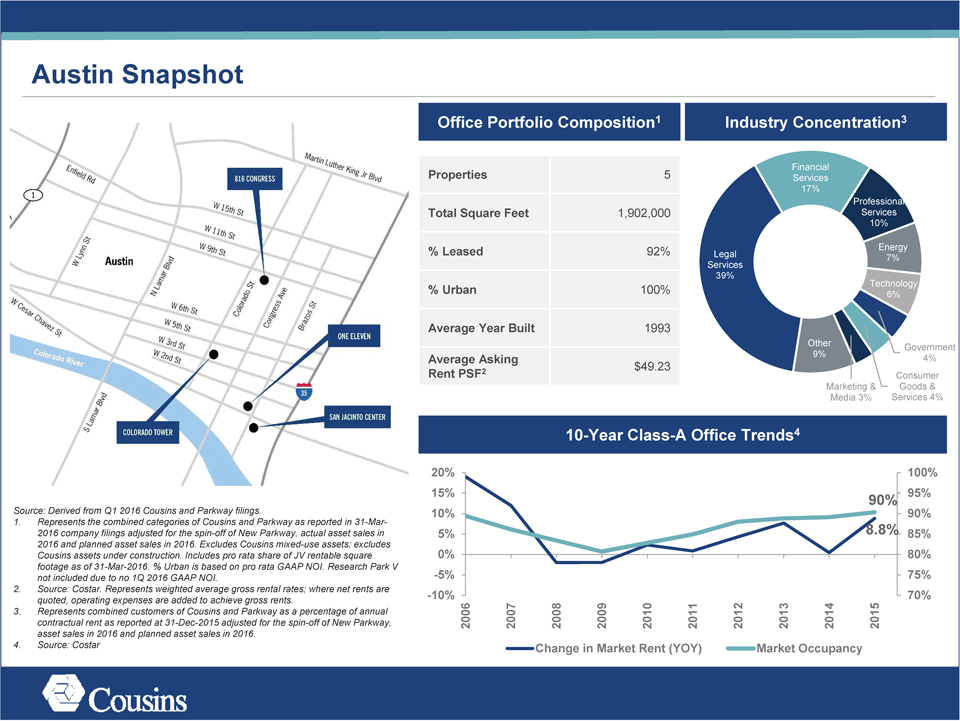
Austin Snapshot
Source:
Derived from Q1 2016 Cousins and Parkway filings.
1. Represents the combined categories of Cousins and Parkway as reported in 31-Mar-2016 company filings adjusted
for the spin-off of New Parkway, actual asset sales in 2016 and planned asset sales in 2016. Excludes Cousins mixed-use assets; excludes Cousins assets under construction. Includes pro rata share of JV rentable square footage as of 31-Mar-2016. %
Urban is based on pro rata GAAP NOI. Research Park V not included due to no 1Q 2016 GAAP NOI.
2. Source: Costar. Represents weighted average gross rental rates;
where net rents are quoted, operating expenses are added to achieve gross rents.
3. Represents combined customers of Cousins and Parkway as a percentage of annual
contractual rent as reported at 31-Dec-2015 adjusted for the spin-off of New Parkway, asset sales in 2016 and planned asset sales in 2016.
4. Source: Costar
Office Portfolio Composition1 Industry Concentration3
Financial
Properties 5 Services
17%
Professional
Total Square Feet 1,902,000 Services
10%
Energy
% Leased 92% Legal 7%
Services
39%
Technology
% Urban 100% 6%
Average Year Built 1993
Other Government
Average Asking 9% 4%
$49.23
Rent PSF2 Consumer
Marketing & Goods &
Media 3% Services 4%
10-Year Class-A Office Trends4
20% 100%
15% 95%
90%
10% 90%
5% 8.8% 85%
0% 80%
-5% 75%
-10% 70%
2006 2007 2008 2009 2010 2011 2012 2013 2014 2015
Change in Market Rent (YOY) Market Occupancy
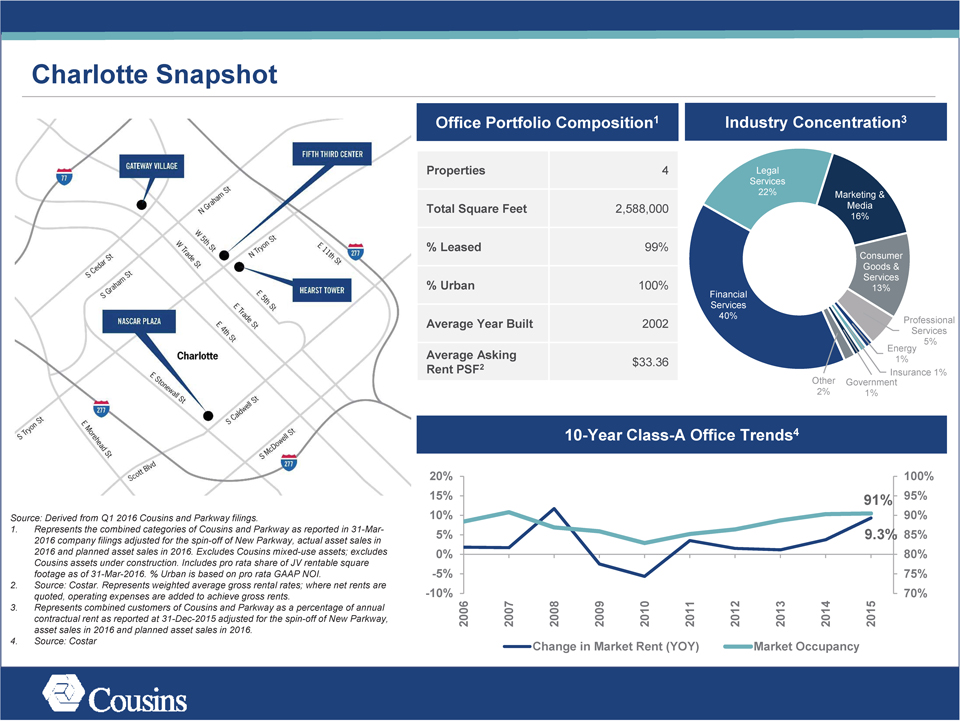
Charlotte Snapshot
Source: Derived from Q1 2016 Cousins and Parkway filings.
1. Represents the
combined categories of Cousins and Parkway as reported in 31-Mar-2016 company filings adjusted for the spin-off of New Parkway, actual asset sales in 2016 and planned asset sales in 2016. Excludes Cousins mixed-use assets; excludes Cousins assets
under construction. Includes pro rata share of JV rentable square footage as of 31-Mar-2016. % Urban is based on pro rata GAAP NOI.
2. Source: Costar. Represents
weighted average gross rental rates; where net rents are quoted, operating expenses are added to achieve gross rents.
3. Represents combined customers of Cousins
and Parkway as a percentage of annual contractual rent as reported at 31-Dec-2015 adjusted for the spin-off of New Parkway, asset sales in 2016 and planned asset sales in 2016.
4. Source: Costar
Office Portfolio Composition1 Industry Concentration3
Properties 4 Legal
Services
22% Marketing &
Total Square Feet 2,588,000 Media
16%
% Leased 99%
Consumer
Goods &
Services
% Urban 100% 13%
Financial
Services
40%
Average Year Built 2002 Professional
Services
Energy 5%
Average Asking
Rent PSF2 $33.36 Insurance 1% 1%
Other Government
2% 1%
10-Year Class-A Office Trends4
20% 100%
15% 91% 95%
10% 90%
5% 9.3% 85%
0% 80%
-5% 75%
-10% 70%
2006 2007 2008 2009 2010 2011 2012 2013 2014 2015
Change in Market Rent (YOY) Market Occupancy
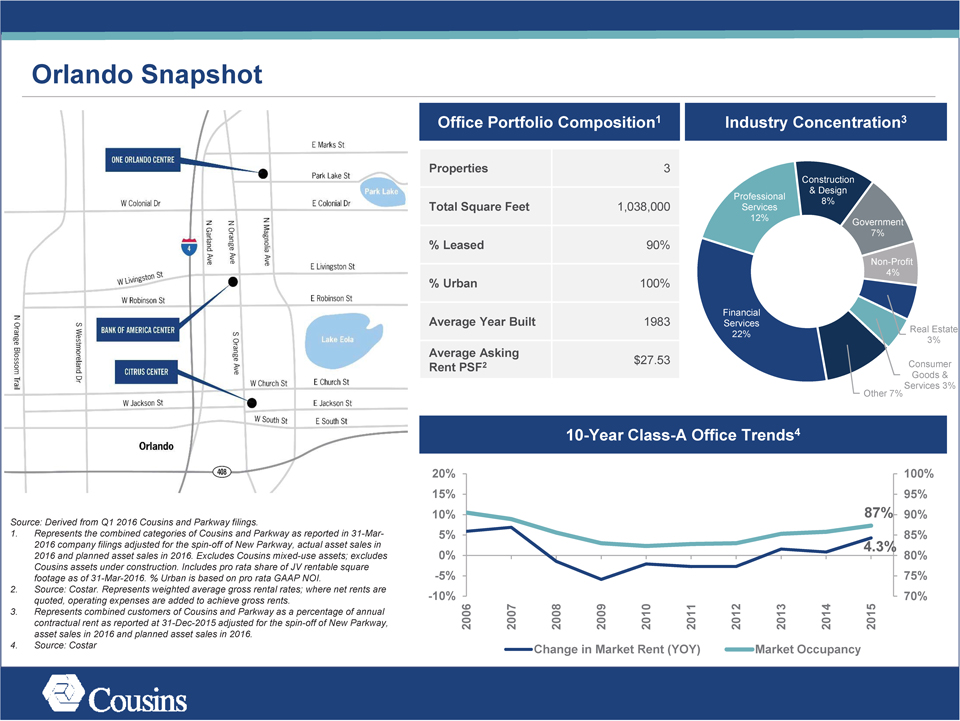
Orlando Snapshot
Source:
Derived from Q1 2016 Cousins and Parkway filings.
1. Represents the combined categories of Cousins and Parkway as reported in 31-Mar-2016 company filings adjusted
for the spin-off of New Parkway, actual asset sales in 2016 and planned asset sales in 2016. Excludes Cousins mixed-use assets; excludes Cousins assets under construction. Includes pro rata share of JV rentable square footage as of 31-Mar-2016. %
Urban is based on pro rata GAAP NOI.
2. Source: Costar. Represents weighted average gross rental rates; where net rents are quoted, operating expenses are added to
achieve gross rents.
3. Represents combined customers of Cousins and Parkway as a percentage of annual contractual rent as reported at 31-Dec-2015 adjusted for the
spin-off of New Parkway, asset sales in 2016 and planned asset sales in 2016.
4. Source: Costar
Office Portfolio Composition1 Industry Concentration3
Properties 3
Construction
& Design
Total Square Feet 1,038,000 Professional Services 8%
12% Government
7%
% Leased 90%
Non-Profit
4%
% Urban 100%
Financial
Average Year Built 1983 Services
22% Real Estate
3%
Average Asking $27.53
Rent PSF2 Consumer
Goods &
Services 3%
Other 7%
10-Year Class-A Office Trends4
20% 100%
15% 95%
10% 87% 90%
5% 85%
0% 4.3% 80%
-5% 75%
-10% 70%
2006 2007 2008 2009 2010 2011 2012 2013 2014 2015
Change in Market Rent (YOY) Market Occupancy
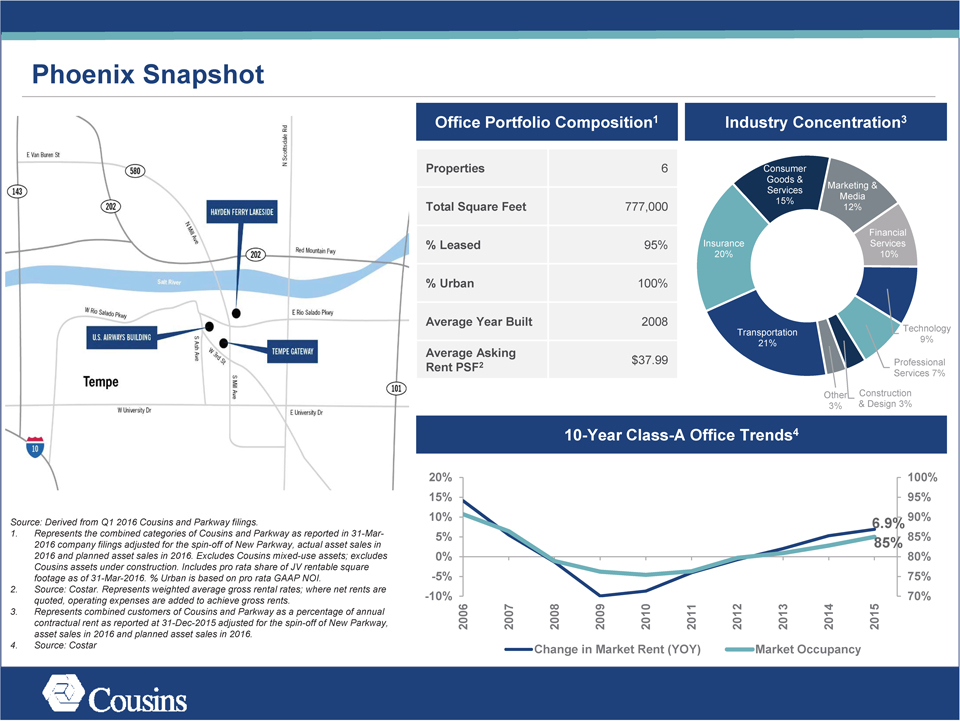
Phoenix Snapshot
Source:
Derived from Q1 2016 Cousins and Parkway filings.
1. Represents the combined categories of Cousins and Parkway as reported in 31-Mar-2016 company filings adjusted
for the spin-off of New Parkway, actual asset sales in 2016 and planned asset sales in 2016. Excludes Cousins mixed-use assets; excludes Cousins assets under construction. Includes pro rata share of JV rentable square footage as of 31-Mar-2016. %
Urban is based on pro rata GAAP NOI.
2. Source: Costar. Represents weighted average gross rental rates; where net rents are quoted, operating expenses are added to
achieve gross rents.
3. Represents combined customers of Cousins and Parkway as a percentage of annual contractual rent as reported at 31-Dec-2015 adjusted for the
spin-off of New Parkway, asset sales in 2016 and planned asset sales in 2016.
4. Source: Costar
Office Portfolio Composition1 Industry Concentration3
Properties 6 Consumer
Goods &
Services Marketing &
15% Media
Total Square Feet 777,000 12%
Financial
% Leased 95% Insurance Services
20% 10%
% Urban 100%
Average Year Built 2008
Transportation Technology
21% 9%
Average Asking
Rent PSF2 $37.99 Professional
Services 7%
Other Construction
3% & Design 3%
10-Year Class-A Office Trends4
20% 100%
15% 95%
10% 6.9% 90%
5% 85% 85%
0% 80%
-5% 75%
-10% 70%
2006 2007 2008 2009 2010 2011 2012 2013 2014 2015
Change in Market Rent (YOY) Market Occupancy
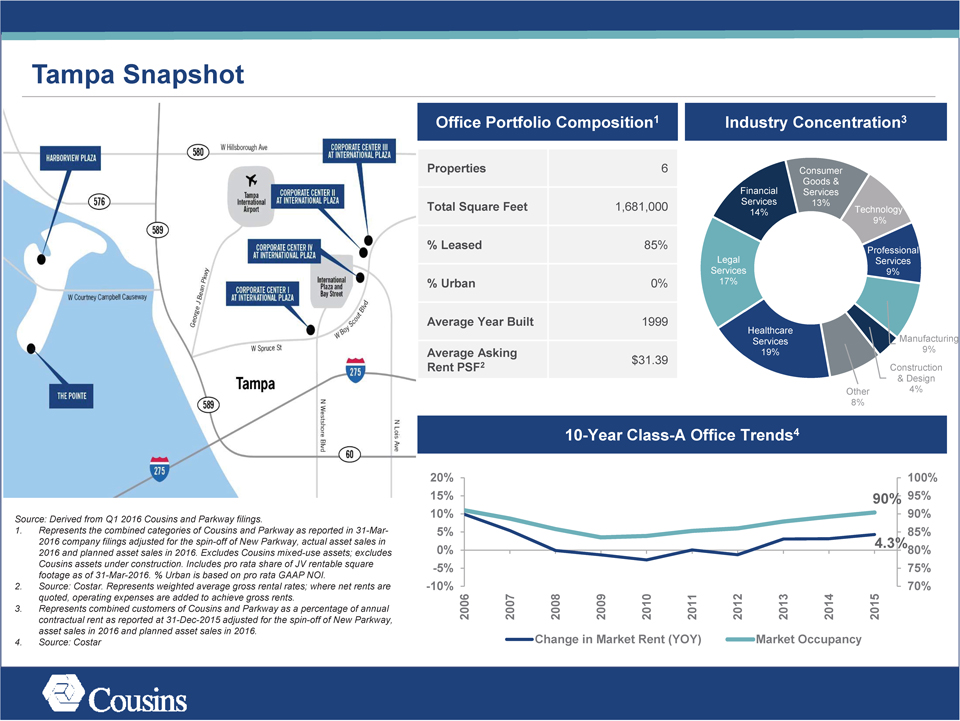
Tampa Snapshot
Source:
Derived from Q1 2016 Cousins and Parkway filings.
1. Represents the combined categories of Cousins and Parkway as reported in 31-Mar-2016 company filings adjusted
for the spin-off of New Parkway, actual asset sales in 2016 and planned asset sales in 2016. Excludes Cousins mixed-use assets; excludes Cousins assets under construction. Includes pro rata share of JV rentable square footage as of 31-Mar-2016. %
Urban is based on pro rata GAAP NOI.
2. Source: Costar. Represents weighted average gross rental rates; where net rents are quoted, operating expenses are added to
achieve gross rents.
3. Represents combined customers of Cousins and Parkway as a percentage of annual contractual rent as reported at 31-Dec-2015 adjusted for the
spin-off of New Parkway, asset sales in 2016 and planned asset sales in 2016.
4. Source: Costar
Office Portfolio Composition1 Industry Concentration3
Properties 6 Consumer
Goods &
Financial Services
Services 13%
Total Square Feet 1,681,000 14% Technology
9%
% Leased 85% Professional
Legal Services
Services 9%
% Urban 0% 17%
Average Year Built 1999
Healthcare
Services Manufacturing
Average Asking 19% 9%
$31.39
Rent PSF2 Construction
& Design
Other 4%
8%
10-Year Class-A Office Trends4
20% 100%
15% 90% 95%
10% 90%
5% 85%
0% 4.3%80%
-5% 75%
-10% 70%
2006 2007 2008 2009 2010 2011 2012 2013 2014 2015
Change in Market Rent (YOY) Market Occupancy