Attached files
| file | filename |
|---|---|
| 8-K - 8-K - Bluerock Residential Growth REIT, Inc. | v441895_8k.htm |
Exhibit 99.1
June 2016
Forward - Looking Statements - 2 - The information in this presentation has been prepared solely for informational purposes by Bluerock Residential Growth REIT, Inc . (“BRG”) and does not constitute an offer to sell or the solicitation of an offer to purchase any securities . This presentation is not, and should not be assumed to be, complete . This presentation has been prepared to assist interested parties in making their own evaluation of BRG and does not purport to contain all of the information that may be relevant . In all cases, interested parties should conduct their own investigation and analysis of BRG and the data set forth in this presentation and other information provided by or on behalf of BRG . In addition, certain of the information contained herein may be derived from information provided by industry sources . BRG believes that such information is accurate and that the sources from which it has been obtained are reliable . BRG cannot guarantee the accuracy of such information, however, and has not independently verified such information . The information presented herein remains subject to change . Statements in this presentation are made as of the date of this presentation unless stated otherwise . This presentation also contains statements that, to the extent they are not recitations of historical fact, constitute “forward - looking statements . ” Forward - looking statements are typically identified by the use of terms such as “may,” “should,” “expect,” “could,” “intend,” “plan,” “anticipate,” “estimate,” “believe,” “continue,” “predict,” “potential” or the negative of such terms and other comparable terminology . The forward - looking statements included herein are based upon BRG’s current expectations, plans, estimates, assumptions and beliefs that involve numerous risks and uncertainties . Assumptions relating to the foregoing involve judgments with respect to, among other things, future economic, competitive and market conditions and future business decisions, all of which are difficult or impossible to predict accurately and many of which are beyond BRG’s control . Although BRG believes that the expectations reflected in such forward - looking statements are based on reasonable assumptions, BRG’s actual results and performance and the value of its securities could differ materially from those set forth in the forward - looking statements due to the impact of many factors including, but not limited to, the uncertainties of real estate development, acquisition and disposition activity, the ability of our joint venture partners to satisfy their obligations, the costs and availability of financing, the effects of local economic and market conditions, the effects of acquisitions and dispositions, the impact of newly adopted accounting principles on BRG’s accounting policies and on period - to - period comparisons of financial results, regulatory changes and other risks and uncertainties detailed in the “Risk Factors” in Item 1 . A . Risk Factors section of the Company’s Annual Report on Form 10 - K filed with the U . S . Securities and Exchange Commission on February 24 , 2016 , and other discussions of risk factors contained in BRG’s periodic filings . BRG claims the safe harbor protection for forward looking statements contained in the Private Securities Litigation Reform Act of 1995 . BRG undertakes no obligation to update or revise any such information for any reason after the date of this presentation, unless required by law .
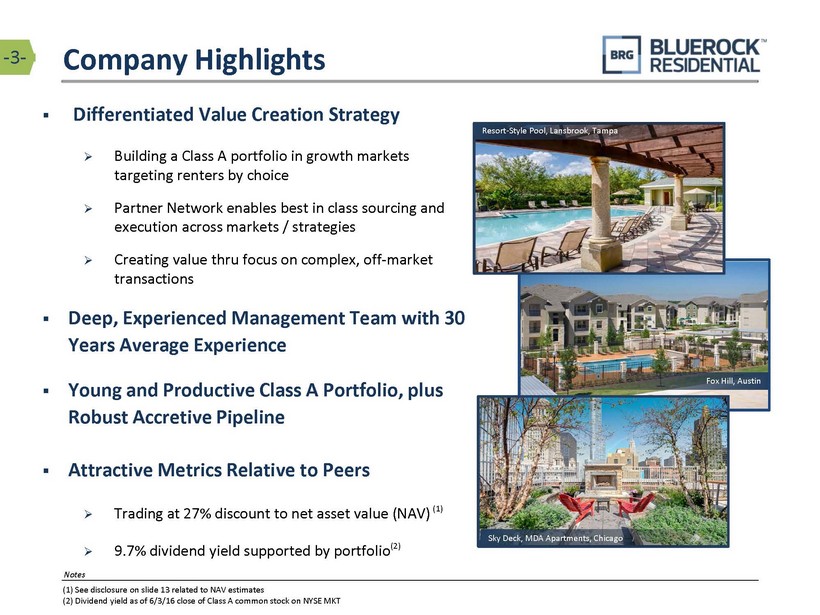
- 3 - Company Highlights ▪ Differentiated Value Creation Strategy » Building a Class A portfolio in growth markets targeting renters by choice » Partner Network enables best in class sourcing and execution across markets / strategies » Creating value thru focus on complex, off - market transactions ▪ Deep, Experienced Management Team with 30 Years Average Experience ▪ Young and Productive Class A Portfolio, plus Robust Accretive Pipeline ▪ Attractive Metrics Relative to Peers » Trading at 27% discount to net asset value (NAV) (1) » 9.7% dividend yield supported by portfolio (2) Fox Hill, Austin Resort - Style Pool, Lansbrook, Tampa Sky Deck, MDA Apartments, Chicago ( 1 ) See disclosure on slide 13 related to NAV estimates ( 2 ) Dividend yield as of 6/3/16 close of Class A common stock on NYSE MKT Notes - 3 -
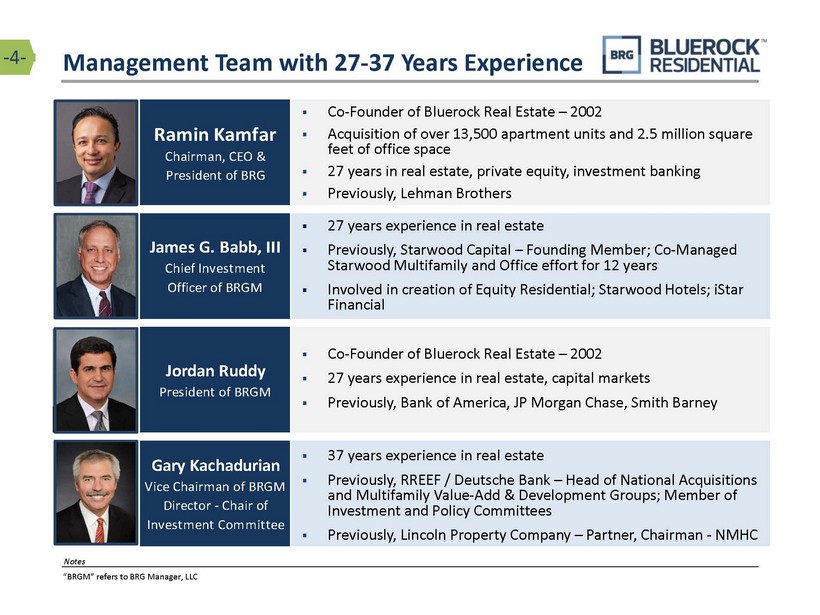
Management Team with 27 - 37 Years Experience Ramin Kamfar Chairman, CEO & President of BRG James G. Babb, III Chief Investment Officer of BRGM Jordan Ruddy President of BRGM Gary Kachadurian Vice Chairman of BRGM Director - Chair of Investment Committee ▪ Co - Founder of Bluerock Real Estate – 2002 ▪ Acquisition of over 13,500 apartment units and 2.5 million square feet of office space ▪ 27 years in real estate, private equity, investment banking ▪ Previously, Lehman Brothers ▪ 27 years experience in real estate ▪ Previously, Starwood Capital – Founding Member; Co - Managed Starwood Multifamily and Office effort for 12 years ▪ Involved in creation of Equity Residential; Starwood Hotels; iStar Financial ▪ Co - Founder of Bluerock Real Estate – 2002 ▪ 27 years experience in real estate, capital markets ▪ Previously, Bank of America, JP Morgan Chase, Smith Barney ▪ 37 years experience in real estate ▪ Previously, RREEF / Deutsche Bank – Head of National Acquisitions and Multifamily Value - Add & Development Groups; Member of Investment and Policy Committees ▪ Previously, Lincoln Property Company – Partner, Chairman - NMHC - 4 - “BRGM” refers to BRG Manager, LLC Notes
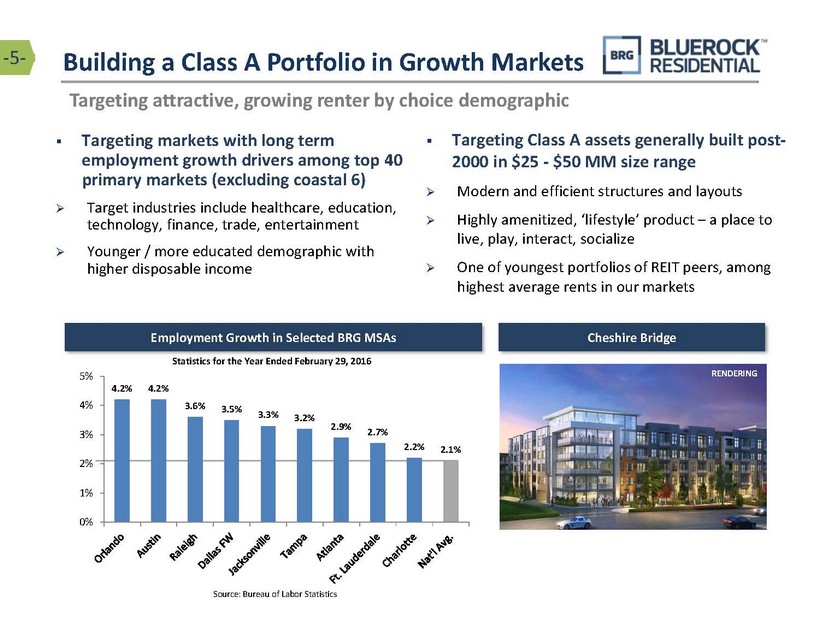
▪ Targeting Class A assets generally built post - 2000 in $25 - $50 MM size range » Modern and efficient structures and layouts » Highly amenitized , ‘lifestyle’ product – a place to live, play, interact, socialize » One of youngest portfolios of REIT peers, among highest average rents in our markets Source: Bureau of Labor Statistics Statistics for the Year Ended February 29, 2016 ▪ Targeting markets with long t erm e mployment g rowth drivers among top 40 primary markets (excluding coastal 6) » Target industries include healthcare , education, technology, finance, trade, entertainment » Younger / more educated demographic with higher disposable income Employment Growth in Selected BRG MSAs Cheshire Bridge Targeting attractive, growing renter by choice demographic Building a Class A Portfolio in Growth Markets - 5 - RENDERING 4.2% 4.2% 3.6% 3.5% 3.3% 3.2% 2.9% 2.7% 2.2% 2.1% 0% 1% 2% 3% 4% 5%
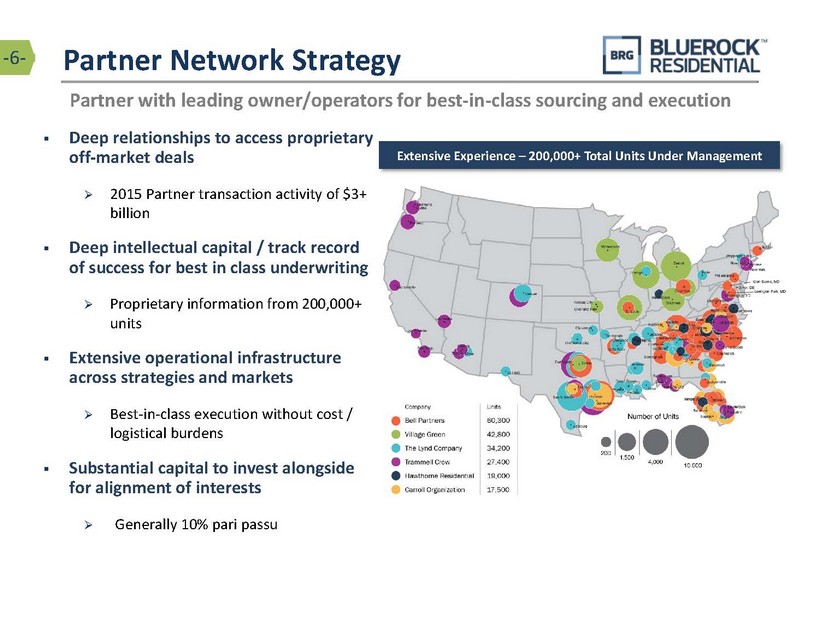
Partner Network Strategy Partner with leading owner/operators for best - in - class sourcing and execution Extensive Experience – 200,000+ Total Units Under Management - 6 - ▪ Deep relationships to access proprietary off - market deals » 2015 Partner transaction activity of $3+ billion ▪ Deep intellectual capital / track record of success for best in class underwriting » Proprietary information from 200,000+ units ▪ Extensive operational infrastructure across strategies and markets » Best - in - class execution without cost / logistical burdens ▪ Substantial capital to invest a longside for alignment of interests » Generally 10% pari passu
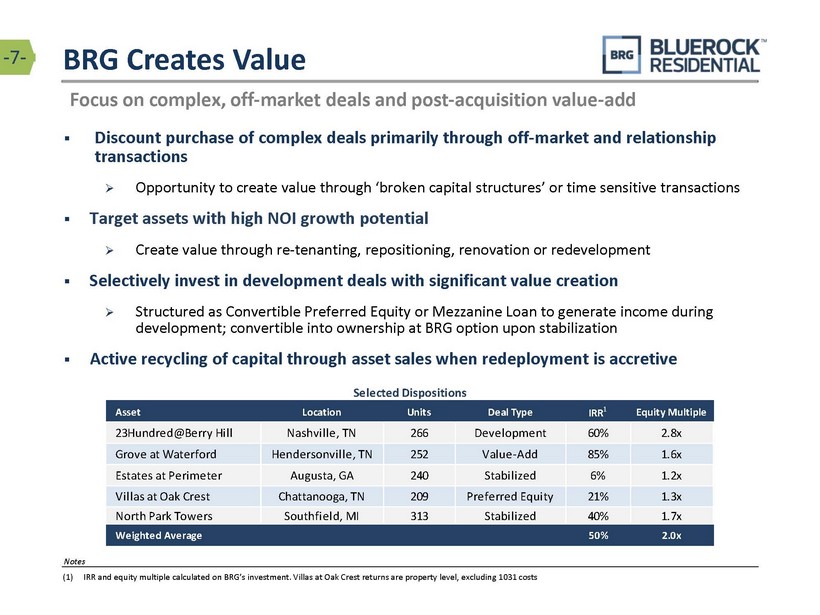
BRG Creates Value ▪ Discount purchase of complex deals primarily through off - market and relationship transactions » Opportunity to create value through ‘ broken capital structures’ or time sensitive transactions ▪ Target assets with high NOI growth potential » Create value through re - tenanting, repositioning, renovation or redevelopment ▪ Selectively invest in development deals with significant value creation » Structured as Convertible Preferred Equity or Mezzanine Loan to generate income during development; convertible into ownership at BRG option upon stabilization ▪ Active recycling of capital through asset sales when redeployment is accretive Focus on complex, off - market deals and post - acquisition value - add - 7 - (1) IRR and equity multiple calculated on BRG’s investment. Villas at Oak Crest returns are property level, excluding 1031 costs Notes Asset Location Units Deal Type IRR 1 Equity Multiple 23Hundred@Berry Hill Nashville, TN 266 Development 60% 2.8x Grove at Waterford Hendersonville, TN 252 Value-Add 85% 1.6x Estates at Perimeter Augusta, GA 240 Stabilized 6% 1.2x Villas at Oak Crest Chattanooga, TN 209 Preferred Equity 21% 1.3x North Park Towers Southfield, MI 313 Stabilized 40% 1.7x Weighted Average 50% 2.0x Selected Dispositions
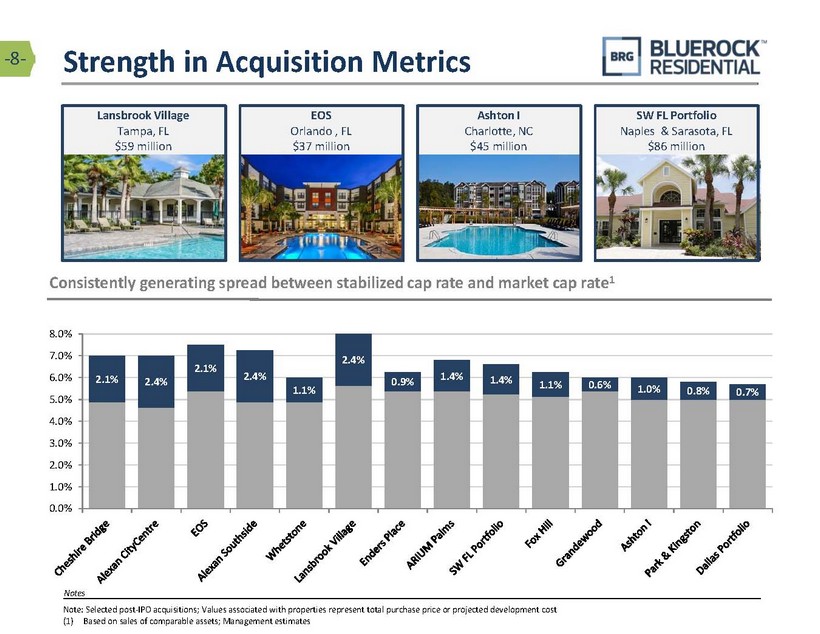
- 8 - Consistently generating spread between stabilized cap rate and market cap rate 1 2.1% 2.4% 2.1% 2.4% 1.1% 2.4% 0.9% 1.4% 1.4% 1.1% 0.6% 1.0% 0.8% 0.7% 0.0% 1.0% 2.0% 3.0% 4.0% 5.0% 6.0% 7.0% 8.0% Lansbrook Village Tampa, FL $59 million Strength in Acquisition Metrics Note: Selected post - IPO acquisitions; Values associated with properties represent total purchase price or projected development cost (1) Based on sales of comparable assets; Management estimates Notes EOS Orlando , FL $37 million Ashton I Charlotte, NC $45 million SW FL Portfolio Naples & Sarasota, FL $86 million
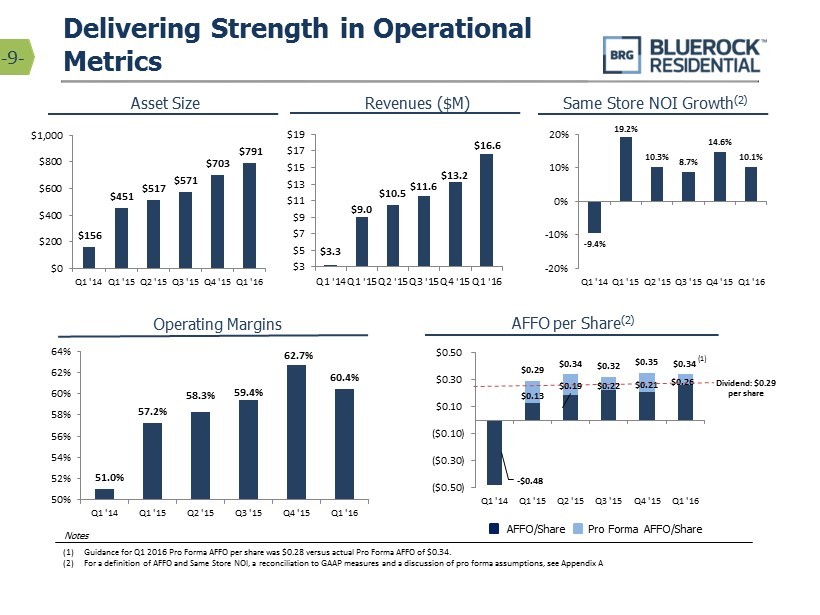
- $0.48 $0.13 $0.19 $0.22 $0.21 $0.26 $0.29 $0.34 $0.32 $0.35 $0.34 ($0.50) ($0.30) ($0.10) $0.10 $0.30 $0.50 Q1 '14 Q1 '15 Q2 '15 Q3 '15 Q4 '15 Q1 '16 - 9.4% 19.2% 10.3% 8.7% 14.6% 10.1% -20% -10% 0% 10% 20% Q1 '14 Q1 '15 Q2 '15 Q3 '15 Q4 '15 Q1 '16 51.0% 57.2% 58.3% 59.4% 62.7% 60.4% 50% 52% 54% 56% 58% 60% 62% 64% Q1 '14 Q1 '15 Q2 '15 Q3 '15 Q4 '15 Q1 '16 $3.3 $9.0 $10.5 $11.6 $13.2 $16.6 $3 $5 $7 $9 $11 $13 $15 $17 $19 Q1 '14 Q1 '15 Q2 '15 Q3 '15 Q4 '15 Q1 '16 $156 $451 $517 $571 $703 $791 $0 $200 $400 $600 $800 $1,000 Q1 '14 Q1 '15 Q2 '15 Q3 '15 Q4 '15 Q1 '16 Same Store NOI Growth Revenues ($M) Asset Size Operating Margins AFFO per Share Delivering Strength in Operational Metrics - 9 - (1) Guidance for Q1 2016 Pro Forma AFFO per share was $0.28 versus actual Pro Forma AFFO of $0.34. (2) For a definition of AFFO and Same Store NOI, a reconciliation to GAAP measures and a discussion of pro forma assumptions, see Appendix A Notes Dividend: $0.29 per share (1) AFFO/Share Pro Forma AFFO/Share
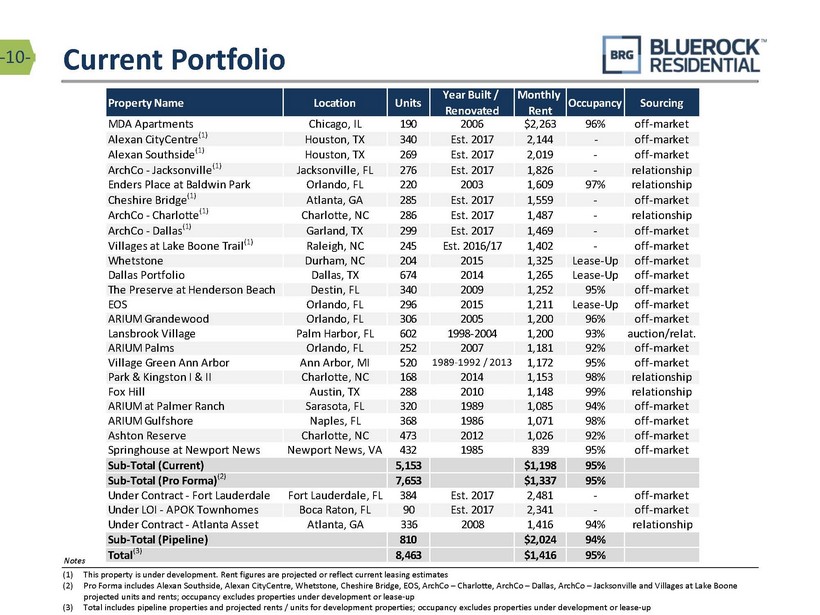
Property Name Location Units Year Built / Renovated Monthly Rent Occupancy Sourcing MDA Apartments Chicago, IL 190 2006 $2,263 96% off-market Alexan CityCentre (1) Houston, TX 340 Est. 2017 2,144 - off-market Alexan Southside (1) Houston, TX 269 Est. 2017 2,019 - off-market ArchCo - Jacksonville (1) Jacksonville, FL 276 Est. 2017 1,826 - relationship Enders Place at Baldwin Park Orlando, FL 220 2003 1,609 97% relationship Cheshire Bridge (1) Atlanta, GA 285 Est. 2017 1,559 - off-market ArchCo - Charlotte (1) Charlotte, NC 286 Est. 2017 1,487 - relationship ArchCo - Dallas (1) Garland, TX 299 Est. 2017 1,469 - off-market Villages at Lake Boone Trail (1) Raleigh, NC 245 Est. 2016/17 1,402 - off-market Whetstone Durham, NC 204 2015 1,325 Lease-Up off-market Dallas Portfolio Dallas, TX 674 2014 1,265 Lease-Up off-market The Preserve at Henderson Beach Destin, FL 340 2009 1,252 95% off-market EOS Orlando, FL 296 2015 1,211 Lease-Up off-market ARIUM Grandewood Orlando, FL 306 2005 1,200 96% off-market Lansbrook Village Palm Harbor, FL 602 1998-2004 1,200 93% auction/relat. ARIUM Palms Orlando, FL 252 2007 1,181 92% off-market Village Green Ann Arbor Ann Arbor, MI 520 1989-1992 / 2013 1,172 95% off-market Park & Kingston I & II Charlotte, NC 168 2014 1,153 98% relationship Fox Hill Austin, TX 288 2010 1,148 99% relationship ARIUM at Palmer Ranch Sarasota, FL 320 1989 1,085 94% off-market ARIUM Gulfshore Naples, FL 368 1986 1,071 98% off-market Ashton Reserve Charlotte, NC 473 2012 1,026 92% off-market Springhouse at Newport News Newport News, VA 432 1985 839 95% off-market 5,153 $1,198 95% 7,653 $1,337 95% Under Contract - Fort Lauderdale Fort Lauderdale, FL 384 Est. 2017 2,481 - off-market Under LOI - APOK Townhomes Boca Raton, FL 90 Est. 2017 2,341 - off-market Under Contract - Atlanta Asset Atlanta, GA 336 2008 1,416 94% relationship 810 $2,024 94% Total (3) 8,463 $1,416 95% Sub-Total (Current) Sub-Total (Pro Forma) (2) Sub-Total (Pipeline) Current Portfolio - 10 - (1) This property is under development. Rent figures are projected or reflect current leasing estimates (2) Pro Forma includes Alexan Southside, Alexan CityCentre , Whetstone, Cheshire Bridge, EOS, ArchCo – Charlotte, ArchCo – Dallas, ArchCo – Jacksonville and Villages at Lake Boone projected units and rents; occupancy excludes properties under development or lease - up (3) Total includes pipeline properties and projected rents / units for development properties; occupancy excludes properties unde r d evelopment or lease - up Notes
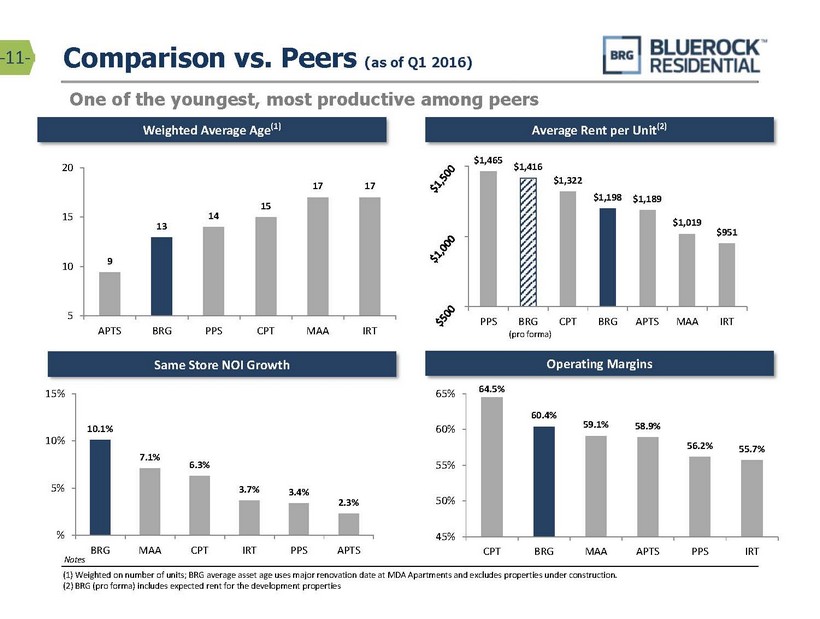
$1,465 $1,416 $1,322 $1,198 $1,189 $1,019 $951 PPS BRG CPT BRG APTS MAA IRT 64.5% 60.4% 59.1% 58.9% 56.2% 55.7% 45% 50% 55% 60% 65% CPT BRG MAA APTS PPS IRT 10.1% 7.1% 6.3% 3.7% 3.4% 2.3% % 5% 10% 15% BRG MAA CPT IRT PPS APTS 9 13 14 15 17 17 5 10 15 20 APTS BRG PPS CPT MAA IRT Same Store NOI Growth Weighted Average Age (1) Average Rent per Unit (2) One of the youngest, most productive among peers Comparison vs. Peers (as of Q1 2016) - 11 - (1) Weighted on number of units; BRG average asset age uses major renovation date at MDA Apartments and excludes properties under construction. (2) BRG (pro forma) includes expected rent for the development properties Notes (pro forma) Operating Margins
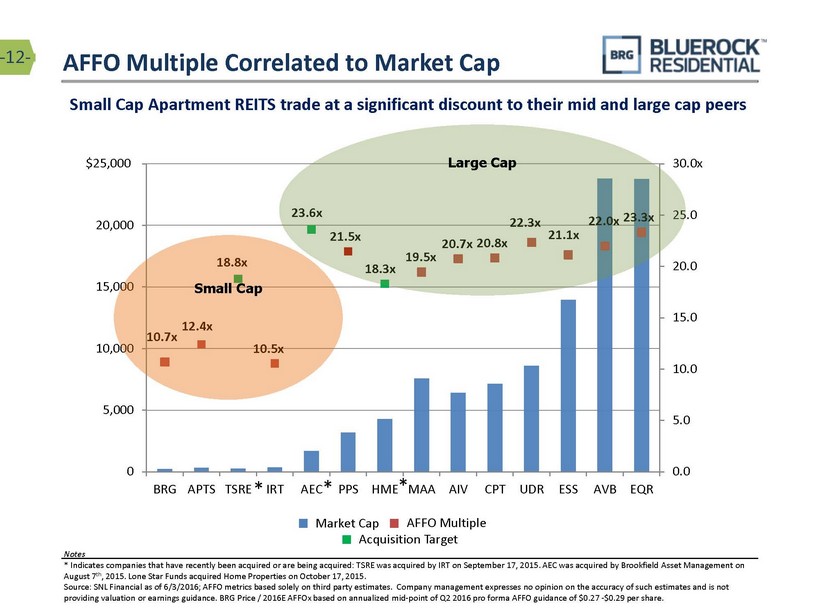
10.7x 12.4x 18.8x 10.5x 23.6x 21.5x 18.3x 19.5x 20.7x 20.8x 22.3x 21.1x 22.0x 23.3x 0.0 5.0 10.0 15.0 20.0 25.0 30.0x 0 5,000 10,000 15,000 20,000 $25,000 BRG APTS TSRE IRT AEC PPS HME MAA AIV CPT UDR ESS AVB EQR Small Cap Large Cap AFFO Multiple Correlated to Market Cap - 12 - Notes * Indicates companies that have recently been acquired or are being acquired: TSRE was acquired by IRT on September 17, 2015. AEC was acquired by Brookfield Asset Management on August 7 th , 2015. Lone Star Funds acquired Home Properties on October 17, 2015. Source : SNL Financial as of 6/3/2016; AFFO metrics based solely on third party estimates. Company management expresses no opinion on the accuracy of such estimates and is not providing valuation or earnings guidance. BRG Price / 2016E AFFOx based on annualized mid - point of Q2 2016 pro forma AFFO guidance of $ 0.27 - $ 0.29 per share. * * Acquisition Target Market Cap AFFO Multiple * Small Cap Apartment REITS trade at a significant discount to their mid and large cap peers
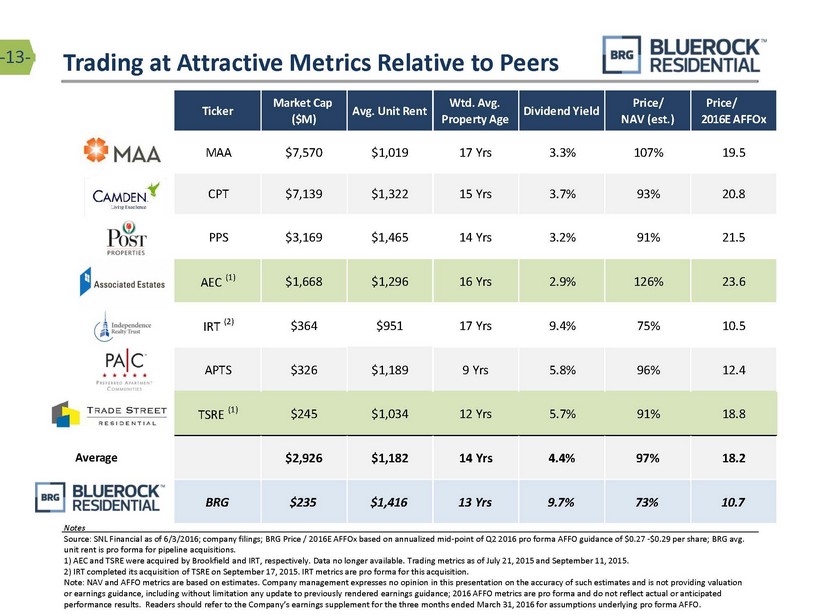
Ticker Market Cap ($M) Avg. Unit Rent Wtd. Avg. Property Age Dividend Yield Price/ NAV (est.) Price/ 2016E AFFOx MAA $7,570 $1,019 17 Yrs 3.3% 107% 19.5 CPT $7,139 $1,322 15 Yrs 3.7% 93% 20.8 PPS $3,169 $1,465 14 Yrs 3.2% 91% 21.5 AEC (1) $1,668 $1,296 16 Yrs 2.9% 126% 23.6 IRT (2) $364 $951 17 Yrs 9.4% 75% 10.5 APTS $326 $1,189 9 Yrs 5.8% 96% 12.4 TSRE (1) $245 $1,034 12 Yrs 5.7% 91% 18.8 Average $2,926 $1,182 14 Yrs 4.4% 97% 18.2 BRG $235 $1,416 13 Yrs 9.7% 73% 10.7 Trading at Attractive Metrics Relative to Peers - 13 - Notes Source: SNL Financial as of 6/3/2016; company filings; BRG Price / 2016E AFFOx based on annualized mid - point of Q2 2016 pro forma AFFO guidance of $0.27 - $0.29 per share ; BRG avg. unit rent is pro forma for pipeline acquisitions. 1) AEC and TSRE were acquired by Brookfield and IRT, respectively. Data no longer available. Trading metrics as of July 21, 2 015 and September 11, 2015. 2) IRT completed its acquisition of TSRE on September 17, 2015. IRT metrics are pro forma for this acquisition. Note : NAV and AFFO metrics are based on estimates. Company management expresses no opinion in this presentation on the accuracy o f s uch estimates and is not providing valuation or earnings guidance, including without limitation any update to previously rendered earnings guidance; 2016 AFFO metrics are pro forma and do not reflect actual or anticipated performance results. Readers should refer to the Company’s earnings supplement for the three months ended March 31, 2016 for assumptions underlying pro forma AFFO .
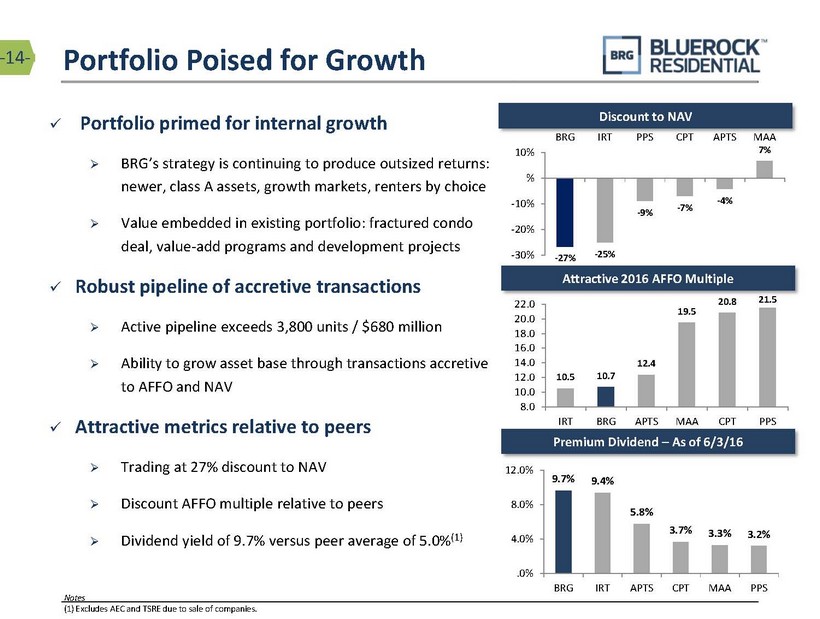
10.5 10.7 12.4 19.5 20.8 21.5 8.0 10.0 12.0 14.0 16.0 18.0 20.0 22.0 IRT BRG APTS MAA CPT PPS - 27% - 25% - 9% - 7% - 4% 7% -30% -20% -10% % 10% BRG IRT PPS CPT APTS MAA 9.7% 9.4% 5.8% 3.7% 3.3% 3.2% .0% 4.0% 8.0% 12.0% BRG IRT APTS CPT MAA PPS x Portfolio primed for internal growth » BRG’s strategy is continuing to produce outsized returns: newer, class A assets, growth markets, renters by choice » Value embedded in existing portfolio: fractured condo deal, value - add programs and development projects x Robust pipeline of accretive transactions » Active pipeline exceeds 3,800 units / $680 million » Ability to grow asset base through transactions accretive to AFFO and NAV x Attractive metrics relative to peers » Trading at 27% discount to NAV » Discount AFFO multiple relative to peers » Dividend yield of 9.7% versus peer average of 5.0% (1) Portfolio Poised for Growth Premium Dividend – As of 6/3/16 Discount to NAV Attractive 2016 AFFO Multiple - 14 - Notes (1) Excludes AEC and TSRE due to sale of companies.
APPENDIX A
FFO / AFFO - 16 - Funds from Operations and Adjusted Funds from Operations Funds from operations attributable to common stockholders (“FFO”), are non - GAAP financial measures that are widely recognized as a measure of REIT operating performance . We consider FFO attributable to common stockholders to be an appropriate supplemental measure of our operating performance as it is based on a net income analysis of property portfolio performance that excludes non - cash items such as depreciation . The historical accounting convention used for real estate assets requires straight - line depreciation of buildings and improvements, which implies that the value of real estate assets diminishes predictably over time . Since real estate values historically rise and fall with market conditions, presentations of operating results for a REIT, using historical accounting for depreciation, could be less informative . We define FFO, consistent with the National Association of Real Estate Investment Trusts, or (“NAREIT's”), definition, as net income, computed in accordance with GAAP, excluding gains (or losses) from sales of property, plus depreciation and amortization of real estate assets, plus impairment writedowns of depreciable real estate, and after adjustments for unconsolidated partnerships and joint ventures . Adjustments for unconsolidated partnerships and joint ventures will be calculated to reflect FFO on the same basis . In addition to FFO attributable to common stockholders, we use adjusted funds from operations attributable to common stockholders (“AFFO”) . AFFO is a computation made by analysts and investors to measure a real estate company's operating performance by removing the effect of items that do not reflect ongoing property operations . To calculate AFFO, we further adjust FFO by adding back certain items that are not added to net income in NAREIT's definition of FFO, such as acquisition expenses, equity based compensation expenses, and any other non - recurring or non - cash expenses, which are costs that do not relate to the operating performance of our properties, and subtracting recurring capital expenditures (and when calculating the quarterly incentive fee payable to our Manager only, we further adjust FFO to include any realized gains or losses on our real estate investments) . Our calculation of AFFO differs from the methodology used for calculating AFFO by certain other REITs and, accordingly, our AFFO may not be comparable to AFFO reported by other REITs . Our management utilizes FFO and AFFO as measures of our operating performance after adjustment for certain non - cash items, such as depreciation and amortization expenses, and acquisition expenses and pursuit costs that are required by GAAP to be expensed but may not necessarily be indicative of current operating performance and that may not accurately compare our operating performance between periods . Furthermore, although FFO, AFFO and other supplemental performance measures are defined in various ways throughout the REIT industry, we also believe that FFO and AFFO may provide us and our stockholders with an additional useful measure to compare our financial performance to certain other REITs . We also use AFFO for purposes of determining the quarterly incentive fee, if any, payable to our Manager . Neither FFO nor AFFO is equivalent to net income or cash generated from operating activities determined in accordance with GAAP . Furthermore, FFO and AFFO do not represent amounts available for management's discretionary use because of needed capital replacement or expansion, debt service obligations or other commitments or uncertainties . Neither FFO nor AFFO should be considered as an alternative to net income as an indicator of our operating performance or as an alternative to cash flow from operating activities as a measure of our liquidity .
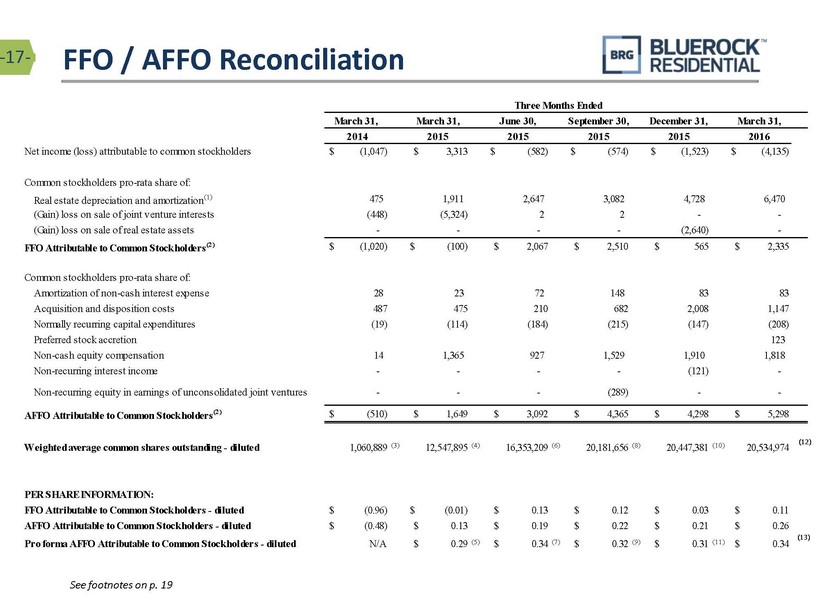
FFO / AFFO Reconciliation - 17 - See footnotes on p. 19 March 31, March 31, June 30, September 30, December 31, March 31, 2014 2015 2015 2015 2015 2016 Net income (loss) attributable to common stockholders $ (1,047) $ 3,313 $ (582) $ (574) $ (1,523) $ (4,135) Common stockholders pro-rata share of: Real estate depreciation and amortization (1) 475 1,911 2,647 3,082 4,728 6,470 (Gain) loss on sale of joint venture interests (448) (5,324) 2 2 - - (Gain) loss on sale of real estate assets - - - - (2,640) - FFO Attributable to Common Stockholders (2) $ (1,020) $ (100) $ 2,067 $ 2,510 $ 565 $ 2,335 Common stockholders pro-rata share of: Amortization of non-cash interest expense 28 23 72 148 83 83 Acquisition and disposition costs 487 475 210 682 2,008 1,147 Normally recurring capital expenditures (19) (114) (184) (215) (147) (208) Preferred stock accretion 123 Non-cash equity compensation 14 1,365 927 1,529 1,910 1,818 Non-recurring interest income - - - - (121) - Non-recurring equity in earnings of unconsolidated joint ventures - - - (289) - - AFFO Attributable to Common Stockholders (2) $ (510) $ 1,649 $ 3,092 $ 4,365 $ 4,298 $ 5,298 Weighted average common shares outstanding - diluted 1,060,889 (3) 12,547,895 (4) 16,353,209 (6) 20,181,656 (8) 20,447,381 (10) 20,534,974 (11) PER SHARE INFORMATION: FFO Attributable to Common Stockholders - diluted $ (0.96) $ (0.01) $ 0.13 $ 0.12 $ 0.03 $ 0.11 AFFO Attributable to Common Stockholders - diluted $ (0.48) $ 0.13 $ 0.19 $ 0.22 $ 0.21 $ 0.26 Pro forma AFFO Attributable to Common Stockholders - diluted N/A $ 0.29 (5) $ 0.34 (7) $ 0.32 (9) $ 0.31 (11) $ 0.34 (12) Three Months Ended (12) (13)
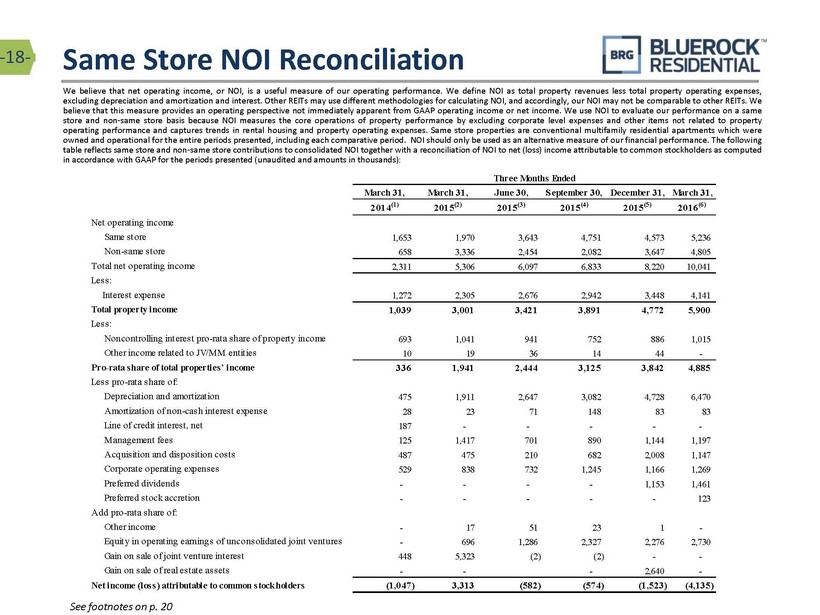
Same Store NOI Reconciliation - 18 - See footnotes on p. 20 We believe that net operating income, or NOI, is a useful measure of our operating performance . We define NOI as total property revenues less total property operating expenses, excluding depreciation and amortization and interest . Other REITs may use different methodologies for calculating NOI, and accordingly, our NOI may not be comparable to other REITs . We believe that this measure provides an operating perspective not immediately apparent from GAAP operating income or net income . We use NOI to evaluate our performance on a same store and non - same store basis because NOI measures the core operations of property performance by excluding corporate level expenses and other items not related to property operating performance and captures trends in rental housing and property operating expenses . Same store properties are conventional multifamily residential apartments which were owned and operational for the entire periods presented, including each comparative period . NOI should only be used as an alternative measure of our financial performance . The following table reflects same store and non - same store contributions to consolidated NOI together with a reconciliation of NOI to net (loss) income attributable to common stockholders as computed in accordance with GAAP for the periods presented (unaudited and amounts in thousands) : March 31, March 31, June 30, September 30, December 31, March 31, 2014 (1) 2015 (2) 2015 (3) 2015 (4) 2015 (5) 2016 (6) Net operating income Same store 1,653 1,970 3,643 4,751 4,573 5,236 Non-same store 658 3,336 2,454 2,082 3,647 4,805 Total net operating income 2,311 5,306 6,097 6,833 8,220 10,041 Less: Interest expense 1,272 2,305 2,676 2,942 3,448 4,141 Total property income 1,039 3,001 3,421 3,891 4,772 5,900 Less: Noncontrolling interest pro-rata share of property income 693 1,041 941 752 886 1,015 Other income related to JV/MM entities 10 19 36 14 44 - Pro-rata share of total properties’ income 336 1,941 2,444 3,125 3,842 4,885 Less pro-rata share of: Depreciation and amortization 475 1,911 2,647 3,082 4,728 6,470 Amortization of non-cash interest expense 28 23 71 148 83 83 Line of credit interest, net 187 - - - - - Management fees 125 1,417 701 890 1,144 1,197 Acquisition and disposition costs 487 475 210 682 2,008 1,147 Corporate operating expenses 529 838 732 1,245 1,166 1,269 Preferred dividends - - - - 1,153 1,461 Preferred stock accretion - - - - - 123 Add pro-rata share of: Other income - 17 51 23 1 - Equity in operating earnings of unconsolidated joint ventures - 696 1,286 2,327 2,276 2,730 Gain on sale of joint venture interest 448 5,323 (2) (2) - - Gain on sale of real estate assets - - - 2,640 - Net income (loss) attributable to common stockholders (1,047) 3,313 (582) (574) (1,523) (4,135) Three Months Ended
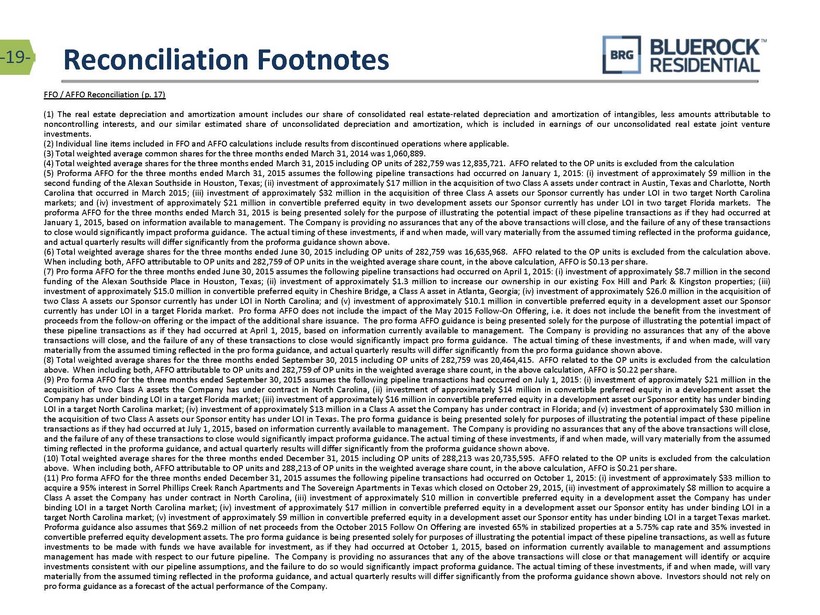
Reconciliation Footnotes - 19 - FFO / AFFO Reconciliation (p . 17 ) ( 1 ) The real estate depreciation and amortization amount includes our share of consolidated real estate - related depreciation and amortization of intangibles, less amounts attributable to noncontrolling interests, and our similar estimated share of unconsolidated depreciation and amortization, which is included in earnings of our unconsolidated real estate joint venture investments . ( 2 ) Individual line items included in FFO and AFFO calculations include results from discontinued operations where applicable . ( 3 ) Total weighted average common shares for the three months ended March 31 , 2014 was 1 , 060 , 889 . ( 4 ) Total weighted average shares for the three months ended March 31 , 2015 including OP units of 282 , 759 was 12 , 835 , 721 . AFFO related to the OP units is excluded from the calculation ( 5 ) Proforma AFFO for the three months ended March 31 , 2015 assumes the following pipeline transactions had occurred on January 1 , 2015 : ( i ) investment of approximately $ 9 million in the second funding of the Alexan Southside in Houston, Texas ; (ii) investment of approximately $ 17 million in the acquisition of two Class A assets under contract in Austin, Texas and Charlotte, North Carolina that occurred in March 2015 ; (iii) investment of approximately $ 32 million in the acquisition of three Class A assets our Sponsor currently has under LOI in two target North Carolina markets ; and (iv) investment of approximately $ 21 million in convertible preferred equity in two development assets our Sponsor currently has under LOI in two target Florida markets . The proforma AFFO for the three months ended March 31 , 2015 is being presented solely for the purpose of illustrating the potential impact of these pipeline transactions as if they had occurred at January 1 , 2015 , based on information available to management . The Company is providing no assurances that any of the above transactions will close, and the failure of any of these transactions to close would significantly impact proforma guidance . The actual timing of these investments, if and when made, will vary materially from the assumed timing reflected in the proforma guidance, and actual quarterly results will differ significantly from the proforma guidance shown above . ( 6 ) Total weighted average shares for the three months ended June 30 , 2015 including OP units of 282 , 759 was 16 , 635 , 968 . AFFO related to the OP units is excluded from the calculation above . When including both, AFFO attributable to OP units and 282 , 759 of OP units in the weighted average share count, in the above calculation, AFFO is $ 0 . 13 per share . ( 7 ) Pro forma AFFO for the three months ended June 30 , 2015 assumes the following pipeline transactions had occurred on April 1 , 2015 : ( i ) investment of approximately $ 8 . 7 million in the second funding of the Alexan Southside Place in Houston, Texas ; (ii) investment of approximately $ 1 . 3 million to increase our ownership in our existing Fox Hill and Park & Kingston properties ; (iii) investment of approximately $ 15 . 0 million in convertible preferred equity in Cheshire Bridge, a Class A asset in Atlanta, Georgia ; (iv) investment of approximately $ 26 . 0 million in the acquisition of two Class A assets our Sponsor currently has under LOI in North Carolina ; and (v) investment of approximately $ 10 . 1 million in convertible preferred equity in a development asset our Sponsor currently has under LOI in a target Florida market . Pro forma AFFO does not include the impact of the May 2015 Follow - On Offering, i . e . it does not include the benefit from the investment of proceeds from the follow - on offering or the impact of the additional share issuance . The pro forma AFFO guidance is being presented solely for the purpose of illustrating the potential impact of these pipeline transactions as if they had occurred at April 1 , 2015 , based on information currently available to management . The Company is providing no assurances that any of the above transactions will close, and the failure of any of these transactions to close would significantly impact pro forma guidance . The actual timing of these investments, if and when made, will vary materially from the assumed timing reflected in the pro forma guidance, and actual quarterly results will differ significantly from the pro forma guidance shown above . ( 8 ) Total weighted average shares for the three months ended September 30 , 2015 including OP units of 282 , 759 was 20 , 464 , 415 . AFFO related to the OP units is excluded from the calculation above . When including both, AFFO attributable to OP units and 282 , 759 of OP units in the weighted average share count, in the above calculation, AFFO is $ 0 . 22 per share . ( 9 ) Pro forma AFFO for the three months ended September 30 , 2015 assumes the following pipeline transactions had occurred on July 1 , 2015 : ( i ) investment of approximately $ 21 million in the acquisition of two Class A assets the Company has under contract in North Carolina, (ii) investment of approximately $ 14 million in convertible preferred equity in a development asset the Company has under binding LOI in a target Florida market ; (iii) investment of approximately $ 16 million in convertible preferred equity in a development asset our Sponsor entity has under binding LOI in a target North Carolina market ; (iv) investment of approximately $ 13 million in a Class A asset the Company has under contract in Florida ; and (v) investment of approximately $ 30 million in the acquisition of two Class A assets our Sponsor entity has under LOI in Texas . The pro forma guidance is being presented solely for purposes of illustrating the potential impact of these pipeline transactions as if they had occurred at July 1 , 2015 , based on information currently available to management . The Company is providing no assurances that any of the above transactions will close, and the failure of any of these transactions to close would significantly impact proforma guidance . The actual timing of these investments, if and when made, will vary materially from the assumed timing reflected in the proforma guidance, and actual quarterly results will differ significantly from the proforma guidance shown above . ( 10 ) Total weighted average shares for the three months ended December 31 , 2015 including OP units of 288 , 213 was 20 , 735 , 595 . AFFO related to the OP units is excluded from the calculation above . When including both, AFFO attributable to OP units and 288 , 213 of OP units in the weighted average share count, in the above calculation, AFFO is $ 0 . 21 per share . ( 11 ) Pro forma AFFO for the three months ended December 31 , 2015 assumes the following pipeline transactions had occurred on October 1 , 2015 : ( i ) investment of approximately $ 33 million to acquire a 95 % interest in Sorrel Phillips Creek Ranch Apartments and The Sovereign Apartments in Texas which closed on October 29 , 2015 , (ii) investment of approximately $ 8 million to acquire a Class A asset the Company has under contract in North Carolina, (iii) investment of approximately $ 10 million in convertible preferred equity in a development asset the Company has under binding LOI in a target North Carolina market ; (iv) investment of approximately $ 17 million in convertible preferred equity in a development asset our Sponsor entity has under binding LOI in a target North Carolina market ; (v) investment of approximately $ 9 million in convertible preferred equity in a development asset our Sponsor entity has under binding LOI in a target Texas market . Proforma guidance also assumes that $ 69 . 2 million of net proceeds from the October 2015 Follow On Offering are invested 65 % in stabilized properties at a 5 . 75 % cap rate and 35 % invested in convertible preferred equity development assets . The pro forma guidance is being presented solely for purposes of illustrating the potential impact of these pipeline transactions, as well as future investments to be made with funds we have available for investment, as if they had occurred at October 1 , 2015 , based on information currently available to management and assumptions management has made with respect to our future pipeline . The Company is providing no assurances that any of the above transactions will close or that management will identify or acquire investments consistent with our pipeline assumptions, and the failure to do so would significantly impact proforma guidance . The actual timing of these investments, if and when made, will vary materially from the assumed timing reflected in the proforma guidance, and actual quarterly results will differ significantly from the proforma guidance shown above . Investors should not rely on pro forma guidance as a forecast of the actual performance of the Company .
Reconciliation Footnotes - 20 - FFO / AFFO Reconciliation (p . 17 ), continued ( 12 ) Total weighted average shares for the three months ended March 31 , 2016 , including OP units of 305 , 568 was 20 , 840 , 542 . AFFO related to the OP units is excluded from the calculation above . When including both, AFFO attributable to OP units and 305 , 568 of OP units in the weighted average share count, in the above calculation, AFFO is $ 0 . 26 per share . ( 13 ) Pro forma AFFO for the three months ended March 31 , 2016 assumes the investment of $ 76 million (consisting of available cash, deposits, and expected loan proceeds) had occurred on January 1 , 2016 : ( i ) investment of approximately $ 30 million to acquire a 95 % interest in the Citation Club at Palmer Ranch Apartments and Summerwind Apartments in Florida, which closed on January 5 , 2016 ; (ii) initial investment of approximately $ 12 million in convertible preferred equity in the West Morehead development asset in Charlotte, North Carolina, which closed on January 6 , 2016 ; (iii) investment of approximately $ 10 million in convertible preferred equity in the Domain development asset in Garland, Texas ; (iv) investment of approximately $ 7 million in the Flagler Village development asset in Ft . Lauderdale, Florida ; and (v) investment of approximately $ 17 million to acquire a 100 % interest in The Preserve at Henderson Beach in Destin, Florida, which closed on March 15 , 2016 . The pro forma guidance is being presented solely for purposes of illustrating the potential impact of these pipeline transactions, as well as future investments to be made with funds we have available for investment, as if they had occurred at January 1 , 2016 , based on information currently available to management and assumptions management has made with respect to our future pipeline . The Company is providing no assurances that any of the above transactions will close or perform as forecasted or that management will identify or acquire investments consistent with our pipeline assumptions, and the failure to do so would significantly impact pro forma guidance . The actual timing of these investments, if and when made, will vary materially from the assumed timing reflected in the pro forma guidance, and actual quarterly results will differ significantly from the pro forma guidance shown above . Investors should not rely on pro forma guidance as a forecast of the actual performance of the Company . Same Store NOI Reconciliation (p . 18 ) ( 1 ) Same Store sales for the three months ended March 31 , 2014 related to the following properties : Springhouse at Newport News, Enders Place at Baldwin Park and MDA Apartments . ( 2 ) Same Store sales for the three months ended March 31 , 2015 related to the following properties : Springhouse at Newport News, Enders Place at Baldwin Park and MDA Apartments . ( 3 ) Same Store sales for the three months ended June 30 , 2015 related to the following properties : Springhouse at Newport News, Enders Place at Baldwin Park, MDA Apartments, Village Green of Ann Arbor and North Park Towers . ( 4 ) Same Store sales for the three months ended September 30 , 2015 related to the following properties : Springhouse at Newport News, Enders Place at Baldwin Park, MDA Apartments, Village Green of Ann Arbor, North Park Towers, and Lansbrook Village . ( 5 ) Same Store sales for the three months ended December 31 , 2015 related to the following properties : Springhouse at Newport News, Enders Place at Baldwin Park, MDA Apartments, Village Green of Ann Arbor, and Lansbrook Village . ( 6 ) Same Store sales for the three months ended March 31 , 2016 related to the following properties : Springhouse at Newport News, Enders Place at Baldwin Park, MDA Apartments, Village Green of Ann Arbor, Lansbrook Village, and ARIUM Grandewood .