Attached files
| file | filename |
|---|---|
| EX-23.4 - EX-23.4 - Blue Coat, Inc. | d121338dex234.htm |
| EX-23.3 - EX-23.3 - Blue Coat, Inc. | d121338dex233.htm |
| EX-23.2 - EX-23.2 - Blue Coat, Inc. | d121338dex232.htm |
| EX-23.1 - EX-23.1 - Blue Coat, Inc. | d121338dex231.htm |
Table of Contents
As filed with the Securities and Exchange Commission on June 7, 2016
Registration No. 333-211786
UNITED STATES
SECURITIES AND EXCHANGE COMMISSION
Washington, D.C. 20549
AMENDMENT NO. 1
TO
FORM S-1
REGISTRATION STATEMENT
Under
The Securities Act of 1933
Blue Coat, Inc.
(Exact name of Registrant as specified in its charter)
| Delaware | 7372 | 47-3317933 | ||
| (State or other jurisdiction of incorporation or organization) |
(Primary Standard Industrial Classification Code Number) |
(I.R.S. Employer Identification Number) |
384 Santa Trinita Ave.
Sunnyvale, CA 94085
(408) 220-2200
(Address, including zip code, and telephone number, including area code, of Registrant’s principal executive offices)
Gregory Clark, Chief Executive Officer
Nicholas Noviello, Chief Financial Officer
Blue Coat, Inc.
384 Santa Trinita Ave.
Sunnyvale, CA 94085
(408) 220-2200
(Name, address, including zip code, and telephone number, including area code, of agent for service)
Copies to
| Thomas Holden Ropes & Gray LLP 3 Embarcadero Center San Francisco, CA 94111-4006 (415) 315-6300 |
Matthew MacKenzie General Counsel Blue Coat, Inc. 384 Santa Trinita Ave. Sunnyvale, CA 94085 (408) 220-2200 |
Jeffrey D. Saper Allison B. Spinner Wilson Sonsini Goodrich & Rosati, P.C. 650 Page Mill Road Palo Alto, CA 94304-1050 (650) 493-9300 |
Approximate date of commencement of proposed sale to the public: As soon as practicable after this registration statement becomes effective.
If any of the securities being registered on this Form are to be offered on a delayed or continuous basis pursuant to Rule 415 under the Securities Act, check the following box: ¨
If this Form is filed to register additional securities for an offering pursuant to Rule 462(b) under the Securities Act, please check the following box and list the Securities Act registration statement number of the earlier effective registration statement for the same offering. ¨
If this Form is a post-effective amendment filed pursuant to Rule 462(c) under the Securities Act, check the following box and list the Securities Act registration statement number of the earlier effective registration statement for the same offering. ¨
If this Form is a post-effective amendment filed pursuant to Rule 462(d) under the Securities Act, check the following box and list the Securities Act registration statement number of the earlier effective registration statement for the same offering. ¨
Indicate by check mark whether the registrant is a large accelerated filer, an accelerated filer, a non-accelerated filer, or a smaller reporting company. See the definitions of “large accelerated filer,” “accelerated filer” and “smaller reporting company” in Rule 12b-2 of the Exchange Act. (Check one): ¨
| Large Accelerated Filer | ¨ | Accelerated Filer | ¨ | |||
| Non-accelerated filer | x (Do not check if a smaller reporting company) | Smaller reporting company | ¨ |
The Registrant hereby amends this registration statement on such date or dates as may be necessary to delay its effective date until the Registrant shall file a further amendment which specifically states that this registration statement shall thereafter become effective in accordance with Section 8(a) of the Securities Act of 1933 or until the registration statement shall become effective on such date as the Securities and Exchange Commission, acting pursuant to said Section 8(a), may determine.
Table of Contents
The information in this prospectus is not complete and may be changed. We may not sell these securities until the registration statement filed with the Securities and Exchange Commission is effective. This prospectus is not an offer to sell these securities and it is not soliciting an offer to buy these securities in any jurisdiction where the offer or sale is not permitted.
PROSPECTUS (Subject to Completion)
Issued June 7, 2016
Shares

COMMON STOCK
This is an initial public offering of shares of common stock of Blue Coat, Inc. Blue Coat, Inc. is offering shares of its common stock. Prior to this offering, there has been no public market for our common stock. We currently estimate that the initial public offering price per share will be between $ and $ .
We intend to apply to list our common stock on the New York Stock Exchange under the symbol “BLCT.”
Investing in our common stock involves risks. See “Risk Factors” beginning on page 14.
We are an “emerging growth company” as that term is used in the Jumpstart Our Business Startups Act of 2012 and, as such, may elect to comply with certain reduced public company reporting requirements in future reports after the completion of this offering.
Following this offering, investment funds controlled by Bain Capital Investors, LLC will continue to control a majority of the voting power of our outstanding common stock. As a result, we will be a “controlled company” within the meaning of the corporate governance rules of the New York Stock Exchange. See “Management—Board Composition and Director Independence.”
PRICE $ A SHARE
| Price to Public |
Underwriting Discounts and |
Proceeds to Blue Coat, Inc. |
||||||||||
| Per Share |
$ | $ | $ | |||||||||
| Total |
$ | $ | $ | |||||||||
| (1) | See the section titled “Underwriters” for a description of the compensation payable to the underwriters. |
We have granted the underwriters the right to purchase up to an additional shares of common stock to cover over-allotments.
Neither the Securities and Exchange Commission nor any other regulatory body has approved or disapproved of these securities or passed upon the accuracy or adequacy of this prospectus. Any representation to the contrary is a criminal offense.
The underwriters expect to deliver the shares of common stock to purchasers on , 2016.
| MORGAN STANLEY | J.P. MORGAN | |
| CREDIT SUISSE | GOLDMAN, SACHS & CO. | |
| JEFFERIES | UBS INVESTMENT BANK | RBC CAPITAL MARKETS | WELLS FARGO SECURITIES |
| COWEN AND COMPANY |
PACIFIC CREST SECURITIES a division of KeyBanc Capital Markets |
PIPER JAFFRAY | WILLIAM BLAIR |
, 2016
Table of Contents
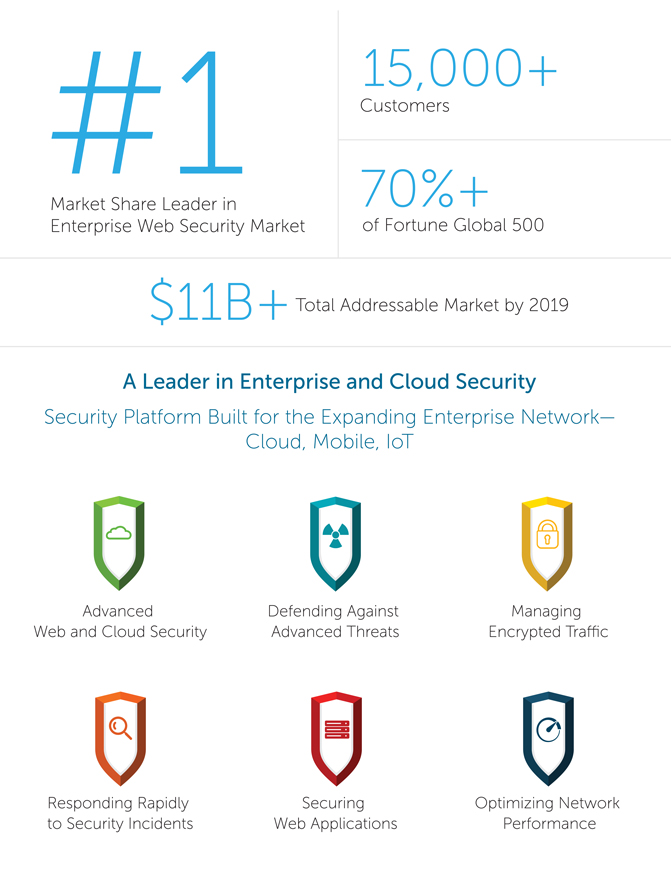
#1 Market Share Leader in Enterprise Web Security Market 15,000+ Customers 70%+ of Fortune Global 500 $11B+Total Addressable Market by 2019 Advanced Web and Cloud Security Responding Rapidly to Security Incidents Defending Against Advanced Threats Securing Web Applications Managing Encrypted Traffic Optimizing Network Performance
Table of Contents
Prospectus
We are responsible for the information contained in this prospectus and in any free writing prospectus we prepare or authorize. Neither we nor the underwriters have authorized anyone to provide you with different information, and neither we nor the underwriters take responsibility for any other information others may give you. We are not, and the underwriters are not, making an offer to sell these securities in any jurisdiction where the offer or sale is not permitted. You should not assume that the information contained in this prospectus is accurate as of any date other than the date of this prospectus.
Through and including , 2016 (the 25th day after the date of this prospectus), all dealers effecting transactions in these securities, whether or not participating in this offering, may be required to deliver a prospectus. This is in addition to a dealer’s obligation to deliver a prospectus when acting as an underwriter and with respect to an unsold allotment or subscription.
-i-
Table of Contents
This summary highlights material information about our business and about this offering. This is a summary of material information contained elsewhere in this prospectus and is not complete and does not contain all of the information that may be important to you. For a more complete understanding of our business and this offering, you should read this entire prospectus, including the sections entitled “Risk Factors,” “Cautionary Note Regarding Forward-Looking Statements,” “Management’s Discussion and Analysis of Financial Condition and Results of Operations” and our consolidated financial statements and related notes thereto, which are included elsewhere in this prospectus.
In this prospectus, unless otherwise stated or unless the context otherwise requires, “we,” “us,” “our” and the “Company” refer to Blue Coat, Inc. and its consolidated subsidiaries. References to “fiscal 2012,” “fiscal 2013,” “fiscal 2014,” “fiscal 2015,” and “fiscal 2016” refer to Blue Coat, Inc.’s fiscal years ended April 30, 2012, 2013, 2014, 2015 and 2016, respectively. Our “customers” refers to the end-users of our products and services that are typically purchased through our two-tiered indirect channel of solution providers, systems integrators, value-added resellers and distributors, or our “channel partners.”
BLUE COAT, INC.
Mission
We are a leading provider of advanced web security solutions for global enterprises and governments. Our mission is to protect enterprises and their users from cyber threats – whether they are on the enterprise network, on the web, in the cloud or mobile.
The Blue Coat Opportunity
The modern enterprise network is being redefined
Enterprises are experiencing a fundamental shift in the way their employees and customers consume technology. The influx of personally owned devices, ubiquitous high-speed Internet connectivity and cloud-based applications is redefining the enterprise network well beyond the traditional responsibilities of the chief information officer (“CIO”). This transformation is happening in nearly every vertical and region. This is sometimes referred to as a dissolving network perimeter, but in reality, it is an expansion of the traditional enterprise network. The IT infrastructure that enterprises have built is shrinking but is not disappearing; it is being augmented by cloud and mobile users, as well as the Internet of Things (“IoT”). For example, a portion of the corporate network is delivered through cloud applications such as Salesforce and Microsoft Office365, some of it is provided by cloud-based infrastructure such as Amazon Web Services and some of it is provided by an employee’s mobile device or an IoT device. We refer to this new enterprise reality as the expanding enterprise network. These major forces are rapidly redefining IT, which has many implications with respect to cyber security. The Blue Coat Security Platform is specifically designed to secure the expanding enterprise network.
At the same time, attacks are increasing in volume and sophistication
The volume and severity of attacks that target the enterprise are rapidly growing. Sophisticated user-oriented attacks have led to significant data breaches in every major industry, causing substantial financial, operational and brand damage. The result is that security has become a critical area of focus in the boardroom and a budgetary priority for corporate enterprises.
-1-
Table of Contents
The expanding enterprise network is shifting security budgets to user-centric solutions
Total spending on IT security reached $35 billion in 2015, according to International Data Corporation (“IDC”). Board awareness of cyber threats is shifting dollars within corporate IT budgets to address new risks. The rise of both sanctioned and non-sanctioned cloud applications that can be accessed by users from any location or device is increasing the complexity of securing the enterprise network and creating opportunities and budget for the Blue Coat Security Platform, which is designed around the following six solution areas:
| • | Advanced Web and Cloud Security—delivered on-premise and through the cloud via secure web gateways and cloud application security brokers |
| • | Advanced Threat Protection—powered by our content analysis, malware analysis and mail threat defense |
| • | Encrypted Traffic Management—enabled by our policy-based encrypted traffic visibility technology and cloud data protection |
| • | Incident Response, Analytics and Forensics—activated with our security analytics and remediation solutions |
| • | Protecting Web Applications—a web application firewall and reverse proxy to secure corporate-deployed web applications |
| • | Network Performance and Optimization—traffic flow, quality-of-service and caching solutions to optimize network performance |
Proxies are designed to protect the user regardless of location
The growth in cloud applications, mobility and IoT is driving the need for sophisticated proxy technology designed to protect the user. In the expanding enterprise network, users have multiple options for the devices they use and how they choose to connect to corporate applications. This gives rise to a critical need for a web proxy, or gatekeeper, that resides between users and the web and protects organizations from threats coming from a growing array of cloud applications and websites. Given the dynamic threat landscape, IT departments require an extensible approach, with an open architecture capable of integrating multiple layers of IT assets to secure the user. This approach protects users and secures both the traditional IT model and the expanding enterprise network.
We are the market leader in proxy technology
We are the market leader in proxy technology, which is a foundational element of the security architecture for global enterprise networks. Our industry-leading Secure Web Gateway sits in-line, or in the flow, with network traffic where it acts as a proxy and inspects web traffic in real time for malicious activity and implements policy-based controls to prevent the usage of inappropriate websites and to control the distribution of sensitive content. We are deeply embedded in our customers’ security infrastructure. Our in-line Secure Web Gateway solution positions us in a critical place to see all web traffic in real time and prevent or stop threats. The growth in cloud applications, mobility and IoT has driven the growth in usage of our proxy technology. As the volume and bandwidth requirements of Internet traffic increases through cloud application adoption, our customers have purchased more of our on-premise Secure Web Gateway products to handle their increased capacity demands. The increase in cloud applications along with employee mobility has also driven demand for our Cloud-Delivered Secure Web Gateway. Our Cloud-Delivered Secure Web Gateway service is deployed from over 40 locations across six continents. This hybrid deployment model gives our customers flexibility and allows us to support users that extend across multiple networks, computing platforms and application stacks across the globe. According to IDC, we were the worldwide leader in the web security market in 2014. We held a 43% share of the web security appliance market in 2014, up from 40% in 2013, which was more than two times larger
-2-
Table of Contents
than our closest competitor, as reported by IDC. We have been recognized as a “leader” in Gartner’s Magic Quadrant for Secure Web Gateway every year since 2007.
We grow with the biggest forces in IT: Cloud, Mobility and IoT
As cloud, mobile and IoT devices expand the enterprise network, the IT infrastructure that sits between users and the Internet is growing. These forces are driving increased Internet traffic and bandwidth requirements, which has fueled demand for our products and positions us to deliver the Blue Coat Security Platform to be a foundational security platform of the future for enterprises. Sales of our appliances have grown significantly in recent periods. As the number of cloud applications rises, we expect demand for web proxy technology and cloud security brokers that secure and govern cloud applications to increase. As the use of mobile devices increases, we expect demand for the Blue Coat Security Platform with extensible services that can be delivered from our cloud data centers around the globe to grow. As IoT grows, we expect demand for our Cloud-Delivered Secure Web Gateway will also grow to defend users from attack. During the year ended April 30, 2016, we added over 700 new customers, which we believe is an indicator of positive business momentum.
The Blue Coat Security Platform provides cloud security broker technology to enable customers to discover, manage and secure the use of cloud applications
Modern enterprises are using an increasingly large number of cloud-based applications, which are not typically covered by traditional network security solutions. We have invested in our platform to maintain a leadership position throughout this technology shift. The growth in cloud application usage has led to growth in our web proxy solutions and has also created demand for security technology that discovers, analyzes and governs the use of cloud applications outside of the traditional responsibilities of enterprise IT. Through our Cloud Access Security Broker (“CASB”) products, we give IT control over cloud access to mitigate the risk of employee use of non-sanctioned applications, or “shadow IT”, while enabling the secure use of sanctioned cloud applications. Forrester Research, Inc. (“Forrester”) estimates that the Cloud Security market was $572 million in 2015 and is projected to grow at a compound annual growth rate, or CAGR, of 36% through 2019. We are uniquely positioned in this market because of our trusted, in-line position within the network and our recent acquisitions of two leading CASB providers, Perspecsys, which specializes in protecting data stored in cloud applications, and Elastica, a leader in cloud application discovery, analytics and governance.
Encryption technology is disrupting the modern enterprise network and creating significant challenges for IT departments
Enterprises are facing significant challenges in managing an ever increasing flow of encrypted traffic. There has been a rapid increase in encrypted traffic on the network, which is being driven by the demand for consumer privacy following highly publicized data breaches. We believe as web traffic continues to grow exponentially, the proportion of web traffic that currently flows through the Secure Sockets Layer (“SSL”) as encrypted traffic will increase rapidly, and currently exceeds 50% of all web traffic in certain industries. The increased demand for consumer privacy has frequently come at the expense of enterprise security, as malware is increasingly hidden in encrypted traffic. Gartner, Inc. (“Gartner”) estimates that by 2017, over 50% of network attacks targeting enterprises will use encrypted traffic to bypass controls.
The increased flow of encrypted traffic is a key security challenge for the modern enterprise network. In order to detect and stop threats, while complying with data privacy standards, security solutions must be able to identify and decrypt all encrypted traffic that does not contain protected personal data. Many traditional security solutions either do not have decryption capabilities or offer solutions that significantly degrade the performance of the network, which results in increased reliance on endpoint-deployed security solutions. Effective endpoint security requires integration and support from network security solutions. Our Encrypted Traffic Management
-3-
Table of Contents
technology is purposefully built to perform the operations needed to decrypt, analyze, orchestrate and re-encrypt traffic while complying with data privacy standards and without degrading network performance.
The Blue Coat Security Platform strengthens endpoint protection
It is difficult to deploy and manage security technology on the many endpoints used in a modern enterprise, including personal devices that do not have corporate-deployed endpoint protection and many IoT devices. Many of these endpoints are not owned, and often are not managed, by the enterprise Chief Information Officer (“CIO”). Our platform incorporates a unique approach to augmenting the endpoint security in the network. This is delivered via our content analysis system, which integrates real time blocking of advanced threats with a variety of anti-malware technologies to scan network traffic for potentially malicious content before reaching the endpoint. For a deeper level of inspection, our malware analysis system utilizes our proprietary virtual sandboxing and emulation technologies to detect and block advanced persistent threats.
The Blue Coat Security Platform can detect security breaches and perform forensics to help enterprises expedite recovery from an attack
Given the increased severity and sophistication of attacks, enterprises have increased spending on technologies that help analyze and remediate breaches. In order to effect this type of incident response, enterprises need technology that can record network traffic, reconstruct an intrusion, quickly and accurately assess the impact of an attack and confirm that the threat has been mitigated. Without an accurate recording of network traffic history, the incident response is largely ineffective and may result in substantial financial, operational and brand damage. Our Security Analytics solution leverages threat data collected from our customers, our Global Intelligence Network and Blue Coat Labs, and gives our customers insight into where a threat came from and the potential damage that may be done to organizations. In addition, we apply remediation measures to resolve the existing threats and protect against new threats.
The Blue Coat Security Platform is powered by a “living map” of the Internet that allows us to accurately categorize the web
An essential part of protecting the user from Internet threats is maintaining a “living map” of the Internet, which categorizes the web according to the threat profile of a website or Internet Protocol (“IP”) address. New websites and IP addresses are constantly being added, changed and removed from the Internet, which makes maintaining an accurate living map of the Internet challenging and creates opportunities for hackers and cyber crime groups to exploit and repurpose web destinations to attack enterprises and users. We have been a pioneer in identifying and tracking malicious websites and networks and have developed industry-leading technology and analytics to categorize the web. We support and enhance the functionality of our products through our Global Intelligence Network services that offer global threat intelligence sharing amongst our customers to provide a globally distributed, real-time threat identification and analysis network. Our Global Intelligence Network collects and analyzes over a billion previously unseen and uncategorized websites a day from our 15,000 enterprise customers and their millions of users accessing the Internet daily. The network effect of having over 70% of the Fortune Global 500 as customers provides us valuable data to feed our analytics engines.
Our Proven Success
Our business has experienced strong growth in recent periods, including:
| • | Adjusted net revenue of $755.4 million and $642.9 million for fiscal 2016 and 2015, respectively, representing year-over-year growth of approximately 17%. |
| • | Adjusted EBITDA of $222.8 million and $196.5 million for the year ended April 30, 2016 and 2015, an increase of $26.4 million, or 13%. |
-4-
Table of Contents
Adjusted net revenue and adjusted EBITDA are financial measures that are not prepared in accordance with U.S. generally accepted accounting principles (“GAAP”). Refer to “Selected Consolidated Financial Data—Non-GAAP Financial Measures” and “—Reconciliation of Non-GAAP Financial Measures” for a description of adjusted net revenue and adjusted EBITDA, and a reconciliation of these measures to GAAP.
Our net revenue for fiscal 2016, 2015 and 2014 was $598.3 million, $631.3 million and $606.5 million, respectively. Our net loss for fiscal 2016, which includes the impact of purchase accounting implications of the 2015 Bain Acquisition, fiscal 2015 and fiscal 2014 was $289.1 million, $15.4 million and $51.3 million, respectively.
Our Competitive Strengths
We believe we have the following competitive strengths:
| • | Powerful technology with proven success in identifying and blocking sophisticated malware; |
| • | Industry leader with strong reputation and brand; |
| • | Global sales organization and market reach; |
| • | Long-term relationships with our blue chip customers; |
| • | Deeply integrated into our customers’ and security partners’ ecosystems; |
| • | Consistent innovation and technology expansion; and |
| • | An experienced management team of security experts and IT thought leaders. |
Our Growth Strategy
We intend to further strengthen our position as a trusted provider of advanced web security solutions for global enterprises and governments and expand our technology leadership in web security for the cloud generation. Our growth strategy includes the following key elements:
| • | Continue to invest in research and development to drive product innovation and technology expansion; |
| • | Increase sales to our existing customers; |
| • | Leverage our scale, global reach and partners to reach new customers; |
| • | Continue to invest in our direct sales force; and |
| • | Continue to pursue strategic acquisitions to expand our capabilities. |
Our Market Opportunity
There is an increasing demand for unified web and cloud security platforms as organizations seek to integrate currently fragmented security products. Given the changes in enterprise networks, with the proliferation of mobile and IoT devices and increase in encrypted traffic, the Blue Coat Security Platform, deployed in-line with visibility into all inbound and outbound web traffic, provides a key foundation for the incorporation of additional security solutions such as advanced malware detection and encrypted traffic management. Our Blue Coat Security Platform spans a number of large, established segments across the IT security market estimated at over $7 billion in 2015 and projected to reach over $11 billion by 2019, representing a 12% CAGR, based on research from industry analysts. Given our leadership in the secure web gateway market and our broad suite of solutions, we believe we are well positioned to capture additional share of the $35 billion IT security market, as estimated by IDC in 2015. See “Business—Market Opportunity.”
-5-
Table of Contents
Summary Risk Factors
Our business is subject to numerous risks and uncertainties, including those highlighted in the section titled “Risk Factors” immediately following this prospectus summary. These risks include, but are not limited to, the following:
| • | the information technology security market is rapidly evolving within the increasingly challenging cyber threat landscape and the industry might not develop as we anticipate; |
| • | our business depends substantially on our ability to retain customers and to expand our offerings to them, and a decline in our customer retention or in our ability to expand sales to existing customers could harm our future operating results; |
| • | if we are unable to successfully expand our sales force while maintaining sales productivity, sales of our products and services and our financial performance could be harmed; |
| • | if we are unable to increase sales of our products and services to new customers, our future revenue and operating results could be harmed; |
| • | our operating results may fluctuate significantly, be difficult to predict, and may not meet investor expectations; |
| • | the markets in which we compete are intensely competitive and certain of our competitors have greater resources and experience; |
| • | our sales cycles can be long and unpredictable, and our sales efforts require considerable time and expense; |
| • | we have experienced net losses in recent periods and may not achieve or maintain profitability in the future; |
| • | our gross margin is affected by a number of factors, and we may not be able to sustain it at present levels; |
| • | our business and operations have experienced rapid growth, and if we do not appropriately manage future growth, our business and financial performance may be adversely affected; and |
| • | our substantial indebtedness could adversely affect our financial condition. |
The Bain Acquisition
We operated as Project Barbour Holdings Corporation, which we refer to as the “Predecessor,” until May 22, 2015. On May 22, 2015, Blue Coat, Inc. (formerly Batman Holdings, Inc.), which we refer to as the “Successor,” acquired Project Barbour Holdings Corporation, which then changed its name to Blue Coat Holdings, Inc., in connection with an investment by investment funds controlled by Bain Capital Investors, LLC (the “Sponsor”) and certain co-investors, which we refer to as the “Bain Acquisition.” The Successor was created for the sole purpose of acquiring the Predecessor and had no prior operations. In connection with the Bain Acquisition, the Sponsor obtained a controlling interest in us.
Our Sponsor
Bain Capital is a global private investment firm that, together with its affiliates, manages several pools of capital including private equity, venture capital, public equity and credit products with more than $74 billion in assets under management. Since its inception in 1984, Bain Capital has made private equity, growth, and venture capital investments in over 400 companies in a variety of industries around the world. Headquartered in Boston, Bain Capital has offices in Chicago, Dublin, Hong Kong, London, Luxembourg, Melbourne, Mumbai, Munich, New York, Palo Alto, and Tokyo.
-6-
Table of Contents
Following the completion of this offering, the Sponsor will own approximately % of our common stock, or % if the underwriters’ option to purchase additional shares of our common stock is fully exercised. As a result, we expect to be a “controlled company” within the meaning of the corporate governance standards of the New York Stock Exchange (the “NYSE”) on which we have been approved to list our shares. See “Risk Factors—Risks Relating to Our Common Stock and This Offering.”
Corporate Information
Blue Coat, Inc. is a Delaware corporation. Its principal corporate offices are located at 384 Santa Trinita Ave., Sunnyvale, CA 94085. Our main telephone number is (408) 220-2200. Our website is located at www.bluecoat.com. Our website and the information contained on, or accessed through, our website are not part of this prospectus.
-7-
Table of Contents
THE OFFERING
| Common stock offered by us |
shares. | |
| Common stock to be outstanding immediately after this offering |
shares. | |
| Option to purchase additional shares of common stock from us |
shares. | |
| Use of proceeds |
We intend to use a portion of the anticipated net proceeds from this offering to repay certain of our existing indebtedness. We intend to use the remainder of the net proceeds from this offering, if any, for working capital and other general corporate purposes. We may also, in our discretion, use a portion of the net proceeds for the acquisition of, or investment in, businesses, products, services, or technologies that complement our business, although we have no current commitments or agreements to enter into any acquisitions or investments. See “Use of Proceeds.” | |
| Risk factors |
See “Risk Factors” and other information included in this prospectus for a discussion of factors you should carefully consider before deciding to invest in shares of our common stock. | |
| Proposed NYSE symbol |
“BLCT”. | |
The number of shares of our common stock that will be outstanding after this offering is based on shares of our common stock outstanding as of , 2016, and excludes:
| • | shares of our common stock issuable upon the exercise of options to purchase shares of our common stock outstanding as of , 2016, with a weighted-average exercise price of $ per share; |
| • | shares of our common stock reserved for future issuance under our stock-based compensation plans, consisting of (i) shares of common stock reserved for future awards under our 2015 Amended and Restated Equity Incentive Plan as of , 2016, (which will terminate as of the completion of this offering and no awards will be granted under our 2015 Amended and Restated Equity Incentive Plan thereafter), and (ii) shares of common stock reserved for issuance under our , which will become effective on the date of this prospectus. |
Except as otherwise indicated, all information in this prospectus assumes:
| • | the filing and effectiveness of our restated certificate of incorporation in Delaware and the adoption of our amended and restated bylaws, each of which will occur immediately prior to the completion of this offering; |
| • | no exercise of outstanding options subsequent to , 2016; and |
| • | no exercise by the underwriters of their option to purchase up to an additional shares of our common stock from us. |
-8-
Table of Contents
SUMMARY CONSOLIDATED FINANCIAL DATA
As a result of the Bain Acquisition, which occurred on May 22, 2015, we applied purchase accounting and a new basis of accounting beginning on the date of the acquisition. We refer to ourselves as Predecessor in the periods before the Bain Acquisition and Successor in the periods after.
The summary consolidated statements of operations and balance sheet data presented below as of April 30, 2015 and for the two years then ended and the period from May 1, 2015 to May 22, 2015 relate to the Predecessor and are derived from audited consolidated financial statements that are included in this prospectus. The summary consolidated statements of operations data for the period from May 23, 2015 to April 30, 2016, and the consolidated balance sheet data as of April 30, 2016 relate to the Successor and are derived from audited consolidated financial statements that are included in this prospectus.
Although the period from May 1, 2015 to May 22, 2015 relates to the Predecessor and the period from May 23, 2015 to April 30, 2016 relates to the Successor, in order to assist in the period to period comparison we have combined these periods as a sum of the amounts without any other adjustments and refer to the combined period as the combined year ended April 30, 2016.
The unaudited consolidated financial statements were prepared on a basis consistent with our audited financial statements and include all adjustments, consisting of normal and recurring adjustments that we consider necessary for a fair presentation of the financial position and results of operations as of and for such periods. Operating results for the periods presented are not necessarily indicative of the results that may be expected in future periods. The following summary consolidated financial data should be read with “Management’s Discussion and Analysis of Financial Condition and Results of Operations” and our consolidated financial statements and related notes included elsewhere in this prospectus.
-9-
Table of Contents
| Predecessor | Successor | |||||||||||||||||||||
|
Year Ended April 30, |
Period from May 1 to May 22, 2015 |
Period from May 23, 2015 to April 30, 2016 |
(Combined) Year Ended April 30, 2016 |
|||||||||||||||||||
| (In thousands, except per share data) | 2014 | 2015 | ||||||||||||||||||||
| (Unaudited) | ||||||||||||||||||||||
| Net revenue: |
||||||||||||||||||||||
| Product |
$ | 319,232 | $ | 274,373 | $ | 7,032 | $ | 306,787 | $ | 313,819 | ||||||||||||
| Service and subscription |
287,240 | 356,910 | 22,446 | 262,072 | 284,518 | |||||||||||||||||
|
|
|
|
|
|
|
|
|
|
|
|||||||||||||
| Total net revenue |
606,472 | 631,283 | 29,478 | 568,859 | 598,337 | |||||||||||||||||
|
|
|
|
|
|
|
|
|
|
|
|||||||||||||
| Cost of net revenue: |
||||||||||||||||||||||
| Product(2) |
106,188 | 106,904 | 4,687 | 131,119 | 135,806 | |||||||||||||||||
| Service and subscription(2) |
56,447 | 53,682 | 3,069 | 66,642 | 69,711 | |||||||||||||||||
|
|
|
|
|
|
|
|
|
|
|
|||||||||||||
| Total cost of net revenue |
162,635 | 160,586 | 7,756 | 197,761 | 205,517 | |||||||||||||||||
|
|
|
|
|
|
|
|
|
|
|
|||||||||||||
| Gross profit |
443,837 | 470,697 | 21,722 | 371,098 | 392,820 | |||||||||||||||||
|
|
|
|
|
|
|
|
|
|
|
|||||||||||||
| Operating expenses: |
||||||||||||||||||||||
| Sales and marketing(2) |
193,661 | 190,288 | 12,024 | 229,094 | 241,118 | |||||||||||||||||
| Research and development(2) |
110,886 | 110,591 | 7,050 | 124,317 | 131,367 | |||||||||||||||||
| General and administrative(2) |
69,266 | 68,131 | 21,649 | 126,520 | 148,169 | |||||||||||||||||
| Amortization of intangible assets |
37,814 | 33,111 | 1,738 | 121,019 | 122,757 | |||||||||||||||||
| Change in fair value of acquisition-related earn-out liability |
9,698 | — | — | (970 | ) | (970 | ) | |||||||||||||||
| Restructuring and other charges |
3,020 | 1,130 | — | 2,857 | 2,857 | |||||||||||||||||
|
|
|
|
|
|
|
|
|
|
|
|||||||||||||
| Total operating expenses |
424,345 | 403,251 | 42,461 | 602,837 | 645,298 | |||||||||||||||||
|
|
|
|
|
|
|
|
|
|
|
|||||||||||||
| Operating income (loss) |
19,492 | 67,446 | (20,739 | ) | (231,739 | ) | (252,478 | ) | ||||||||||||||
| Interest income |
44 | 38 | 1 | 143 | 144 | |||||||||||||||||
| Interest expense |
(63,015 | ) | (66,434 | ) | (3,986 | ) | (99,386 | ) | (103,372 | ) | ||||||||||||
| Debt extinguishment and refinancing costs |
(11,100 | ) | — | — | (3,406 | ) | (3,406 | ) | ||||||||||||||
| Other expense, net |
(1,973 | ) | (1,376 | ) | (349 | ) | (759 | ) | (1,108 | ) | ||||||||||||
|
|
|
|
|
|
|
|
|
|
|
|||||||||||||
| Loss before income taxes |
(56,552 | ) | (326 | ) | (25,073 | ) | (335,147 | ) | (360,220 | ) | ||||||||||||
| Income tax provision (benefit) |
(5,221 | ) | 15,104 | (7,596 | ) | (63,543 | ) | (71,139 | ) | |||||||||||||
|
|
|
|
|
|
|
|
|
|
|
|||||||||||||
| Net loss |
(51,331 | ) | (15,430 | ) | (17,477 | ) | (271,604 | ) | $ | (289,081 | ) | |||||||||||
|
|
|
|||||||||||||||||||||
| Cumulative dividends earned on Class A Common Stock |
(34,535 | ) | (32,838 | ) | (2,112 | ) | — | |||||||||||||||
|
|
|
|
|
|
|
|
|
|||||||||||||||
| Net loss attributable to common stockholders |
$ | (85,866 | ) | $ | (48,268 | ) | $ | (19,589 | ) | $ | (271,604 | ) | ||||||||||
|
|
|
|
|
|
|
|
|
|||||||||||||||
| Net loss per share attributable to common stockholders:(1) |
||||||||||||||||||||||
| Basic and diluted |
$ | (0.90 | ) | $ | (0.49 | ) | $ | (0.20 | ) | $ | (3.09 | ) | ||||||||||
|
|
|
|
|
|
|
|
|
|||||||||||||||
| Weighted-average shares used to compute net loss per share attributable to common stockholders:(1) |
||||||||||||||||||||||
| Basic and diluted |
95,082 | 97,927 | 98,376 | 87,823 | ||||||||||||||||||
|
|
|
|
|
|
|
|
|
|||||||||||||||
| (1) | Net loss per share information is not presented for the combined year ended April 30, 2016 due to changes in capital structure resulting from the Bain Acquisition on May 22, 2015. |
-10-
Table of Contents
| (2) | Includes stock-based compensation expense as follows: |
| Predecessor | Successor | |||||||||||||||||||||
| Year Ended April 30, | Period from May 1 to May 22, 2015 |
Period from May 23, 2015 to April 30, 2016 |
(Combined) Year Ended April 30, 2016 |
|||||||||||||||||||
| 2014 | 2015 | |||||||||||||||||||||
| (In thousands) | (Unaudited) | |||||||||||||||||||||
| Cost of product |
$ | 1 | $ | 22 | $ | 15 | $ | 76 | $ | 91 | ||||||||||||
| Cost of service and subscription |
21 | 90 | 44 | 484 | 528 | |||||||||||||||||
| Sales and marketing |
386 | 514 | 621 | 5,395 | 6,016 | |||||||||||||||||
| Research and development |
219 | 476 | 386 | 2,801 | 3,187 | |||||||||||||||||
| General and administrative |
2,612 | 1,594 | 2,585 | 10,158 | 12,743 | |||||||||||||||||
|
|
|
|
|
|
|
|
|
|
|
|||||||||||||
| Total stock-based compensation expense |
$ | 3,239 | $ | 2,696 | $ | 3,651 | $ | 18,914 | $ | 22,565 | ||||||||||||
|
|
|
|
|
|
|
|
|
|
|
|||||||||||||
| Predecessor | Successor | |||||||||
| April 30, 2015 |
April 30, 2016 |
|||||||||
| (In thousands) | ||||||||||
| Consolidated Balance Sheet Data: |
||||||||||
| Cash and cash equivalents |
$ | 202,665 | $ | 136,563 | ||||||
| Working capital |
92,949 | (20,337 | ) | |||||||
| Total assets |
1,558,581 | 3,001,607 | ||||||||
| Current and long-term deferred revenue |
353,943 | 364,223 | ||||||||
| Current and long-term debt, net of borrowing costs |
1,047,847 | 1,785,374 | ||||||||
| Total liabilities |
1,515,503 | 2,374,588 | ||||||||
| Total stockholders’ equity |
43,078 | 627,019 | ||||||||
Non-GAAP Financial Measures
In addition to our results determined in accordance with GAAP, we believe the following non-GAAP measures are useful in evaluating our operating performance because, in the case of adjusted product revenue, adjusted service and subscription revenue, adjusted net revenue and adjusted deferred revenue, they exclude the impact of purchase accounting, which we believe aids in the period to period comparability of our revenue and financial outlook of our business. In the case of adjusted EBITDA, we exclude certain material non-cash items and certain other adjustments we believe are not reflective of our ongoing operations. We believe adjusted EBITDA is a measure commonly used by investors to evaluate companies in our industry. Accordingly, we use these non-GAAP financial measures to measure our financial performance for business planning purposes and to compare our performance to that of our competitors.
| Predecessor | Successor | |||||||||||||||||||||
|
Year Ended April 30, |
Period from May 1 to May 22, 2015 |
Period from May 23, 2015 to April 30, 2016 |
(Combined) Year Ended April 30, 2016 |
|||||||||||||||||||
| 2014 | 2015 | |||||||||||||||||||||
| (In thousands) | (Unaudited) | (Unaudited) | (Unaudited) | (Unaudited) | ||||||||||||||||||
| Adjusted product revenue |
$ | 319,528 | $ | 274,930 | $ | 7,081 | $ | 312,494 | $ | 319,575 | ||||||||||||
| Adjusted service and subscription revenue |
312,240 | 367,954 | 22,778 | 413,021 | 435,799 | |||||||||||||||||
| Adjusted net revenue |
631,768 | 642,884 | 29,859 | 725,515 | 755,374 | |||||||||||||||||
| Adjusted EBITDA |
183,179 | 196,468 | 7,190 | 215,658 | 222,848 | |||||||||||||||||
| Adjusted deferred revenue ending balance |
305,846 | 359,079 | 347,797 | 443,818 | 443,818 | |||||||||||||||||
-11-
Table of Contents
Adjusted product revenue, adjusted service and subscription revenue and adjusted net revenue. We define adjusted product revenue, adjusted service and subscription revenue and adjusted net revenue as product revenue, service and subscription revenue, and net revenue, respectively, excluding the impact of purchase accounting. We regularly monitor these measures to assess our operating performance. On February 15, 2012, in connection with our acquisition by funds affiliated with Thoma Bravo, LLC (the “Thoma Bravo Acquisition”), and on May 22, 2015, as part of the Bain Acquisition, we were required to write down our deferred revenue balances due to purchase accounting in accordance with GAAP. In addition, in connection with our other acquisitions, we were also required to make similar adjustments to write down our deferred revenue balances due to purchase accounting in accordance with GAAP. See “Management’s Discussion and Analysis of Financial Condition and Results of Operations—Impact of Purchase Accounting Related to Mergers and Acquisitions.” The impact on revenue related to purchase accounting as a result of these transactions, particularly as a result of the Bain Acquisition, limits the comparability of our revenue between periods. While the deferred revenue written down in connection with our acquisitions will never be recognized as revenue under GAAP, we do not expect the Bain Acquisition to have an impact on future renewal rates of the contracts included within the deferred revenue write-down, nor do we expect revenue generated from new service and subscription contracts to be similarly impacted by purchase accounting adjustments. Accordingly, we believe presenting adjusted product revenue, adjusted service and subscription revenue and adjusted net revenue to exclude the impact of purchase accounting adjustments, including the deferred revenue write-down, aids in the comparability between periods and in assessing our overall operating performance. If these adjustments were not made, our future revenue growth rates could appear overstated. Adjusted product revenue, adjusted service and subscription revenue and adjusted net revenue have limitations as analytical tools, and you should not consider them in isolation or as substitutes for product revenue, service and subscription revenue or net revenue. Other companies in our industry may calculate these measures differently, which may limit their usefulness as a comparative measure.
Adjusted EBITDA. We regularly monitor adjusted EBITDA, as it is a measure we use to assess our operating performance. We define adjusted EBITDA as net income or loss, excluding the impact of purchase accounting on net revenue, amortization of intangible assets and purchased technology, litigation costs, depreciation expense, acquisition write-up of acquired inventory sold, stock-based compensation expense, restructuring and other charges, acquisition fair value adjustments to earn outs, acquisition transaction costs, acquisition integration, transition, retention and other costs, financial sponsor and debt fees, interest expense, net, debt extinguishment and refinancing costs, other expense, net, and income tax provision (benefit). Adjusted EBITDA has limitations as an analytical tool, and you should not consider it in isolation or as a substitute for analysis of our results as reported under GAAP. Some of these limitations are:
| • | although depreciation and amortization are non-cash charges, the assets being depreciated and amortized may have to be replaced in the future, and adjusted EBITDA does not reflect cash capital expenditure requirements for such replacements or for new capital expenditure requirements; |
| • | adjusted EBITDA excludes the impact of the write-down of deferred revenue due to purchase accounting in connection with our acquisition, and therefore includes revenue that will never be recognized under GAAP; |
| • | adjusted EBITDA does not reflect changes in, or cash requirements for, our working capital needs; |
| • | adjusted EBITDA does not reflect the significant interest expense, or the cash requirements necessary to service interest or principal payments, on our debt; |
| • | adjusted EBITDA does not reflect tax payments that may represent a reduction in cash available to us; and |
| • | other companies, including companies in our industry, may calculate adjusted EBITDA differently, which reduces its usefulness as a comparative measure. |
Because of these limitations, you should consider adjusted EBITDA alongside other financial performance measures, including net income (loss) and our other GAAP results. In evaluating adjusted EBITDA, you should be
-12-
Table of Contents
aware that in the future we may incur expenses that are the same as or similar to some of the adjustments in this presentation. Our presentation of adjusted EBITDA should not be construed as an inference that our future results will be unaffected by the types of items excluded from the calculation of adjusted EBITDA. Adjusted EBITDA is not a presentation made in accordance with GAAP and the use of the term varies from others in our industry.
Adjusted deferred revenue. We regularly monitor adjusted deferred revenue, as it provides visibility into our anticipated future revenue, primarily for our support and subscription contracts which we generally invoice in full up front and recognize revenue over the contract term, and is a key component in other measures we track to measure our financial performance. We define adjusted deferred revenue as deferred revenue, excluding the write-down of deferred revenue in connection with our acquisitions. While the deferred revenue written down in connection with our acquisitions will never be recognized as revenue under GAAP, we do not expect the Bain Acquisition to have an impact on future renewal rates of the contracts included within the deferred revenue write-down, nor do we expect revenue generated from new service and subscription contracts to be similarly impacted by purchase accounting adjustments. Accordingly, we believe presenting adjusted deferred revenue to exclude the impact of purchase accounting adjustments, including the deferred revenue write-down, aids in the comparability between periods. If these adjustments were not made, our future revenue growth rates could appear overstated. Adjusted deferred revenue has limitations as an analytical tool, and you should not consider it in isolation or as a substitute for deferred revenue. Other companies in our industry may calculate this measure differently, which may limit its usefulness as a comparative measure.
The foregoing financial measures are not intended to represent and should not be considered as alternatives to revenue, net income, operating income or any other performance measures derived in accordance with GAAP as measures of financial performance or operating cash flows or as measures of liquidity. See “Selected Consolidated Financial Data—Reconciliation of Non-GAAP Financial Measures” for a reconciliation of these measures to GAAP.
-13-
Table of Contents
This offering and investing in our common stock involves a high degree of risk. You should carefully consider the following risks, together with all of the other information contained in this prospectus, including our financial statements and related notes and the section titled “Special Note Regarding Forward-Looking Statements,” before making a decision to invest in our common stock. Any of the following risks could have a material adverse effect on our business, operating results and financial condition, and could cause the trading price of our common stock to decline, which would cause you to lose all or part of your investment. The risks and uncertainties described below are not the only ones we face. Additional risks and uncertainties not presently known to us or deemed to be material by us may impair our operations and performance.
Risks Related to Our Business
The IT security market is rapidly evolving within the increasingly challenging cyber threat landscape. If the industry does not continue to develop as we anticipate, our sales will not grow as quickly as expected.
The IT security needs of our customers continue to evolve rapidly. Many of our customers operate in markets characterized by rapidly changing technologies and business plans, which require them to adapt to increasingly complex enterprise networks, expand network access points and continuously update a variety of hardware, software applications, operating systems and networking protocols. The technology in our products and underlying our services offerings is especially complex because it must effectively identify and respond to new and increasingly sophisticated methods of attack, while minimizing the impact on network performance. Although the market expects rapid introduction of new products or product enhancements to respond to new threats, the development of these products requires significant investment, and the timing for commercial release and availability of new products and product enhancements is uncertain. We may experience unanticipated delays in the availability of new products and services and fail to meet customer expectations for such availability. If we fail to anticipate the evolving and rigorous needs of our customers, or do not respond quickly to shifting customer expectations or demands by developing and releasing on a timely basis new products and services or enhancements that can respond effectively and efficiently to new security threats, our competitive position and business prospects will be harmed. For example, we recently made investments in cloud security with our acquisitions of Perspecsys and Elastica, but we cannot be certain that the cloud security market will develop at the rate or in the manner we expect or that we will be able to compete successfully with more established competitors in the cloud security market.
The introduction of new products by others, market acceptance of products based on new or alternative technologies, or the emergence of new industry standards, could render our existing products obsolete or make it easier for other products to compete with our products. In addition, advanced cyber attackers are skilled at adapting to new technologies and developing new methods of gaining access to organizations’ sensitive business data. Changes in the nature of advanced cyber threats could result in a shift in IT budgets away from solutions such as ours. In addition, any changes in compliance standards or audit requirements that deemphasize the types of controls, monitoring and analysis that our solutions provide would adversely impact demand for our offerings. If solutions such as ours are not viewed by organizations as necessary, or if customers do not recognize the benefit of our solutions as a critical layer of an effective security strategy, then our revenues may not grow as quickly as expected, or may decline, and our business could suffer.
Our future success will depend in part upon our ability to:
| • | develop, acquire and maintain competitive products; |
| • | enhance our products by adding innovative features that differentiate our products from those of our competitors; |
| • | bring products to market on a timely basis at competitive prices; |
| • | identify and respond to emerging technological trends in the market; and |
| • | respond effectively to new technological changes or new product announcements by others. |
-14-
Table of Contents
We cannot be sure that we will accurately predict the direction the markets in which we compete or intend to compete will evolve. Failure on our part to anticipate the direction of our markets and to develop products, enhancements and service offerings that meet the demands of those markets will significantly impair our business, financial condition and results of operations.
Our business depends substantially on our ability to retain customers and to expand our offerings to them. A decline in our customer retention or in our ability to expand sales to existing customers could harm our future operating results.
Given the consequences of the loss of critical data, many organizations seek security solutions that are among the best available in the industry. In order for us to maintain or improve our operating results in an industry that is rapidly evolving and places a premium on market leading solutions, it is important that we retain existing customers and that our customers expand their use of our products and services. Our customers have no obligation to renew their service contracts with us upon their expiration, and even if they do, they may not renew with a similar contract period or with the same or a greater amount of committed revenue to us. Retention rates may decline or fluctuate as a result of a number of factors, including the level of our customers’ satisfaction with our solutions, services and support, our prices and the prices of competing solutions or products, mergers and acquisitions affecting our customer base, the effects of global economic conditions, new technologies, changes in our customers’ spending levels and changes in how our customers perceive the security threats to their organizations and the importance of our offerings to the security of their organizations.
Furthermore, because we collect critical data from our customers regarding attempted breaches, new vulnerabilities and emerging security threats, the loss of a small number of key customers or groups of customers may cause other existing customers to perceive the security intelligence underlying some of our solutions to have diminished value and to seek alternative security solutions from our competitors. If our customers do not renew their service contracts with us, or renew them on less favorable terms or for fewer of our products or services, our revenue may decline.
Our future success depends substantially on our ability to expand our sales to our existing customers with solutions we develop or acquire. If we are unable to expand our presence within our customer base by expanding the scope of their usage or adopting additional solutions, our business and revenue will be adversely affected.
If we are unable to successfully expand our sales force while maintaining sales productivity, sales of our products and services and the growth of our business and financial performance could be harmed.
We continue to be substantially dependent on our direct-touch sales force to obtain new customers and increase sales to existing customers, and we plan to continue to grow our sales force. There is significant competition for sales personnel with the skills and technical knowledge that we require. Our ability to achieve significant revenue growth profitably will depend, in large part, on our success in recruiting, training and retaining sufficient numbers of sales personnel to support our growth, particularly in international markets. In addition, certain of our current sales personnel are new to our company. New hires require significant training and may require a lengthy onboarding process before they achieve full productivity. Our recent hires and planned hires may not become productive as quickly as we expect, and we may be unable to hire or retain sufficient numbers of qualified individuals in the markets where we do business or plan to do business. If we are unable to recruit, train and retain a sufficient number of productive sales personnel, sales of our products and services and the growth of our business could be harmed. Additionally, if our efforts to expand our sales force do not result in increased revenues, our operating results could be negatively impacted due to increased operating expenses associated with an expanded sales force.
If we are unable to increase sales of our products and services to new customers, our future revenue and operating results may be harmed.
An important part of our growth strategy involves continued investment in our sales force, channel partner relationships and infrastructure to add new customers. The number and rate at which new customers may
-15-
Table of Contents
purchase products and services depends on a number of factors, including those outside of our control, such as customers’ perceived need for our solutions, competition and general economic conditions. If our efforts to sell our products and services to new customers are not successful, our business and operating results may suffer.
Our operating results may fluctuate significantly, be difficult to predict and may not meet investor expectations.
Our operating results have in the past varied, and may in the future vary, significantly from period to period due to a number of factors, many of which are outside of our control, including the macroeconomic environment. These factors limit our ability to accurately predict our operating results and include factors discussed throughout this “Risk Factors” section, including the following:
| • | macroeconomic conditions in our markets, both domestic and international, as well as the level of discretionary IT spending; |
| • | the timing, size and mix of orders from, and shipments to, customers, including the timing of large orders, and timing of shipments; |
| • | fluctuation in demand for our products and services; |
| • | evolving conditions in the markets in which we compete; |
| • | variability and unpredictability in the rate of growth in the markets in which we compete; |
| • | our ability to continue to acquire new customers and increase our market share; |
| • | our sales cycles, which may lengthen as the complexity of products and competition in our markets increases and in response to macroeconomic conditions; |
| • | the level of competition in our markets, including the effect of new entrants, consolidation and technological innovation; |
| • | market acceptance of our products and services; |
| • | product announcements, introductions, transitions and enhancements by us or our competitors, which could result in deferrals of customer orders; |
| • | technological changes in our markets; |
| • | the quality and level of our execution of our business strategy and operating plan, and the effectiveness of our sales and marketing programs; |
| • | the impact of future acquisitions or divestitures; |
| • | changes in accounting rules and policies; and |
| • | the need to recognize certain revenue ratably over a defined period or to defer recognition of revenue to a later period. |
Our business has historically experienced a major product refresh cycle approximately once every five years, as hardware appliances reach end of life. Customers typically refresh their install base of our hardware appliance products with our latest equipment, replacing older versions of the hardware that reach the end of their useful life and are no longer supported under service contracts. Historically, these refresh cycles triggered buying cycles for new versions of our hardware appliance products, which typically offer greater capacity and additional features, as well as new service contracts. In 2012, we launched a refresh program for our SWG 8100, our high-end ProxySG product, which we no longer supported as of March 2013 regardless of when a customer purchased this product. Following our SWG 8100 product refresh cycle in 2013, we changed the end-of-life policy for all of our hardware appliance products such that our hardware appliances now generally have an end-of-life date that is five years from the date of purchase, which we expect will extend refresh cycles over a multi-year period and reduce the impact of a product refresh cycle in any one period. We cannot be certain what impact our change in policy will have, if any, or whether we will continue to experience significant fluctuations in revenue as a result
-16-
Table of Contents
of these refresh cycles. If customers choose not to replace older versions of our products with newer products supported under our service contracts, our business and results of operations will be adversely affected.
A refresh cycle also creates an opportunity for our competitors to try to displace our existing product deployments at our customers, who may be more inclined to consider other product solutions when they otherwise have to replace our existing products that have reached the end of their useful life. The extent to which customers decide to refresh by purchasing products from our current or future competitors, as opposed to purchasing our new products, may significantly impact our current period product revenues, as well as future service revenue.
Furthermore, a high percentage of our expenses, including those related to overhead, service and maintenance, research and development, sales and marketing, and general and administrative functions are generally fixed in nature in the short term. As a result, if our net revenue is less than forecasted, we may not be able to effectively reduce such expenses to compensate for the revenue shortfall and our operating results will be adversely affected.
The markets in which we compete are intensely competitive and certain of our competitors have greater resources and experience.
Our products and services currently focus on the markets for Advanced Web and Cloud Security, Advanced Threat Protection, Encrypted Traffic Management, Incident Response, Analytics and Forensics, Web Application Protection, and Network Performance and Optimization. Each of these markets is intensely competitive, and the intensity of this competition is expected to increase, particularly given current economic pressures and industry consolidation. Service provider markets are especially volatile and typically have longer sales cycles. Competition in these markets may result in price reductions, reduced margins, loss of market share and inability to gain market share, any one of which could seriously impact our business, financial condition and results of operations. We may not be able to compete successfully against current or future competitors, including those resulting from consolidation in our historical and new markets, and we cannot be certain that the competitive pressures we face will not seriously impact our business.
Our participation in these markets requires careful resource allocation. If we are required to decrease our investment in any of these markets, we could become vulnerable to our competitors in those markets. Some of our current and potential competitors have longer operating histories; significantly greater financial, technical, sales and marketing resources; significantly greater name recognition; and a larger installed base of customers than we do. Such competitors also may have well-established relationships with our current and potential customers and extensive knowledge of our industry and the markets in which we compete and intend to compete. As a result, our competitors may be able to respond more quickly to new or emerging technologies and changes in customer requirements, or to devote greater resources to the development, marketing, promotion and sale of their products than we can with respect to our products. They also may make strategic acquisitions or establish cooperative relationships among themselves or with other providers, thereby increasing their ability to provide a broader suite of products, and potentially causing customers to decrease purchases of, or defer purchasing decisions with respect to, our products.
Finally, our competitors may engage in aggressive pricing strategies or discounting. Any of the foregoing may limit our ability to compete effectively in the market and adversely affect our business, financial condition and results of operations.
Our sales cycles can be long and unpredictable, and our sales efforts require considerable time and expense. As a result, our sales and the timing of our sales are difficult to predict and may vary substantially from period to period, which may cause our results of operations to fluctuate significantly.
Our customers are primarily IT departments that are managing a growing set of user and compliance demands, which increases the complexity of customer requirements to be met in the sales cycle. Additionally, a combination of legal, procurement, development and security departments are involved in testing, evaluating and
-17-
Table of Contents
finally approving purchases, which can also make the sales cycle longer and less predictable. Moreover, sales to large enterprise customers, which we target to grow our revenue, involve challenges that could further increase the complexity and length of the sales cycle.
We may not be able to accurately predict or forecast the timing of sales, which could cause our results to vary significantly. In addition, we might devote substantial time and effort to a particular unsuccessful sales effort, and as a result we could lose other sales opportunities or incur expenses that are not offset by an increase in revenue, which could harm our business.
We have experienced net losses in recent periods and may not achieve or maintain profitability in the future. If we cannot achieve or maintain profitability, our financial performance will be harmed.
We experienced net loss of $15.4 million and $289.1 million (combined predecessor and successor) for fiscal 2015 and fiscal 2016, respectively. While we have experienced revenue growth over these same periods, we may not be able to sustain or increase our growth or achieve profitability in the future or on a consistent basis. In recent years, we have expanded our portfolio of products through multiple technology acquisitions and invested alongside these acquisitions with research and development to enhance their capabilities and integrate them into our platform.
We also expect to continue to invest for future growth. In addition, as a public company, we will incur significant accounting, legal and other expenses that we did not incur as a private company. We will have to generate and sustain increased revenue to achieve future profitability. Achieving profitability will require us to increase revenues, manage our cost structure and avoid significant liabilities. Revenue growth may slow, revenue may decline, or we may incur significant losses in the future for a number of possible reasons, including general macroeconomic conditions, increasing competition, a decrease in the growth of the markets in which we operate, or if we fail for any reason to continue to capitalize on growth opportunities. Additionally, we may encounter unforeseen operating expenses, difficulties, complications, delays and other unknown factors that may result in losses in future periods. If these losses exceed our expectations or our revenue growth expectations are not met in future periods, our financial performance will be harmed and our stock price could experience volatility or decline.
Our gross margin is affected by a number of factors, and we may not be able to sustain it at present levels.
Our gross margin has been and will continue to be affected by a variety of factors, including:
| • | market acceptance of our products and fluctuations in demand for products with different gross margins; |
| • | the mix of products, services and subscriptions that we sell; |
| • | varying discounting rates among customers; |
| • | our ability to increase sales to and retain existing customers, and to sell to new customers; |
| • | increased price competition and changes in product pricing; |
| • | actions taken by our competitors; |
| • | new product introductions and enhancements; |
| • | manufacturing and component costs; |
| • | availability of sufficient inventory to meet demand; |
| • | purchase of inventory in excess of demand; |
| • | our execution of our strategy and operating plans; |
| • | changes in our sales model; |
| • | geographies in which sales are made; and |
| • | revenue recognition rules. |
-18-
Table of Contents
Macroeconomic factors and competitive pressures may also require us to lower prices or increase spending, and our business and results of operations may suffer. Even if we achieve our net revenue and operating expense objectives, our net income or loss and operating results may be below our expectations and the expectations of investors if our gross margin is below expectations.
Our business and operations have experienced rapid growth, and if we do not appropriately manage future growth, our business, financial condition, results of operations and prospects may be adversely affected.
We have experienced over the last several years, and it is our intention to continue to pursue, rapid growth, which has placed and will continue to place significant demands on our management, administrative, operational and financial infrastructure. As we have grown, we have had to manage an increasingly larger and more complex array of internal systems and processes to scale all aspects of our business in proportion to such rapid growth, including a new call center system, a new support entitlement system and a new software license management system, as well as increased administrative complexity related to managing increased headcount, particularly within our sales force. Our success will depend in part upon our ability to manage our growth effectively. To do so, we must continue to increase the productivity of our existing employees and continue to hire, train and manage new employees as needed.
To manage domestic and international growth of our operations and personnel, we will need to continue to improve our operational, financial and management controls and our reporting processes and procedures and implement more extensive and integrated financial and business information systems. For example, we are currently upgrading our enterprise resource planning and human resource management systems. We may not be able to successfully implement these or other improvements to our systems and processes in an efficient or timely manner, and we may discover deficiencies in their capabilities or effectiveness. We may experience difficulties in managing improvements to our systems and processes or in integrating with third-party technology. In addition, our systems and processes may not prevent or detect all errors, omissions or fraud. Our failure to improve our systems and processes, or their failure to operate effectively and in the intended manner, may result in disruption of our current operations and customer relationships, our inability to manage the growth of our business and our inability to accurately forecast and report our revenue, expenses and earnings and prevent certain losses.
Our revenue growth rate in recent periods may not be indicative of our future performance.
Our revenue growth rate in recent periods should not be used as an indication of our future performance. We may not achieve similar revenue growth rates in future periods. You should not rely on our revenue growth for any prior quarterly or annual periods as an indication of our future revenue or revenue growth. If we are unable to maintain consistent revenue or revenue growth, our stock price could experience volatility, and our ability to achieve and maintain profitability could be adversely affected.
Our substantial indebtedness could adversely affect our financial condition.
We have a significant amount of indebtedness. As of April 30, 2016, we and our subsidiaries had total outstanding indebtedness of $1,838 million, excluding approximately $100 million of unused commitments available to be borrowed under our senior secured revolving credit facility (excluding issued but undrawn letters of credit, if any) (the “Senior Secured Revolving Credit Facility”). Our substantial indebtedness increases the risk that we may be unable to generate cash sufficient to pay amounts due in respect of our indebtedness. Our substantial indebtedness could have other important consequences to you and significant effects on our business. For example, it could:
| • | increase our vulnerability to adverse changes in general economic, industry and competitive conditions; |
| • | require us to dedicate a substantial portion of our cash flow to pay principal and interest on our indebtedness, including on the senior notes and the Senior Secured Credit Facilities, thereby reducing |
-19-
Table of Contents
| the availability of our cash flow to fund working capital, capital expenditures, acquisitions, execution of our business strategy and other general corporate purposes; |
| • | limit our flexibility in planning for, or reacting to, changes in our business and the industry in which we operate; |
| • | require us to repatriate cash for debt service from our foreign subsidiaries, resulting in tax costs, or require us to adopt other disadvantageous tax structures to accommodate debt service payments; |
| • | restrict us from capitalizing on business opportunities; |
| • | make it more difficult to satisfy our financial obligations, including payments of principal and interest on the senior notes and the Senior Secured Credit Facilities; |
| • | place us at a competitive disadvantage compared to our competitors that have less debt; and |
| • | limit our ability to borrow additional funds for working capital, capital expenditures, acquisitions, debt service requirements, execution of our business strategy or other general corporate purposes. |
The terms of our indebtedness may restrict our current and future operations, particularly our ability to respond to changes or to take certain actions.
The credit agreement governing our Senior Secured Credit Facilities and the indenture, as supplemented, governing our senior notes contain a number of restrictive covenants that impose significant operating and financial restrictions on us and may limit our ability to engage in acts that may be in our long-term best interest, including our ability to, among other things:
| • | incur additional indebtedness and guarantee indebtedness; |
| • | pay dividends or make other distributions in respect of, or repurchase or redeem, capital stock; |
| • | prepay, redeem or repurchase certain debt; |
| • | make loans and investments; |
| • | sell or otherwise dispose of assets; |
| • | sell stock of our subsidiaries; |
| • | incur liens; |
| • | enter into transactions with affiliates; |
| • | enter into agreements restricting certain of our subsidiaries’ ability to pay dividends; and |
| • | consolidate, merge or sell all or substantially all of our assets. |
In addition, with respect to the Senior Secured Revolving Credit Facility, Blue Coat Holdings, Inc. is required to comply with a maximum consolidated first lien net leverage ratio. This financial covenant is tested quarterly on a trailing four quarter basis on the last day of the most recent four fiscal quarter period for which financial statements were required to be delivered under the Senior Secured Credit Facilities. However, this financial covenant is only tested if, as of the last day of any fiscal quarter of Blue Coat Holdings, Inc. (commencing January 29, 2016), revolving loans under the Senior Secured Revolving Credit Facility (including swingline loans) and certain letter of credit obligations (but excluding undrawn or cash collateralized letters of credit) are outstanding in an aggregate amount greater than 35% of the total commitments under the Senior Secured Revolving Credit Facility at such time. This financial covenant is subject to an equity cure and may be amended or waived with the consent of the lenders holding a majority of the commitments under the Senior Secured Revolving Credit Facility.
As a result of these and other covenants and restrictions, we are and will be limited in how we conduct our business, and we may be unable to raise additional debt or equity financing to compete effectively or to take advantage of new business opportunities. In addition, we may be required to maintain specified financial ratios and satisfy other financial condition tests. The terms of any future indebtedness we may incur could include more restrictive covenants. We cannot assure you that we will be able to maintain compliance with these covenants in the future and, if we fail to do so, that we will be able to obtain waivers from the lenders and/or amend the covenants.
-20-
Table of Contents
Our failure to comply with the restrictive covenants described above as well as others contained in our future debt instruments from time to time could result in an event of default, which, if not cured or waived, could result in our being required to repay these borrowings before their maturity. If we are forced to refinance these borrowings on less favorable terms, our results of operations and financial condition could be adversely affected. See “Description of Indebtedness.”
Our investments in new or enhanced products and services may not yield the benefits we anticipate.
The success of our business is predicated on our ability to develop new products and technologies and to anticipate future market requirements and applicable industry standards. We presently are investing in each of our six key solution areas. We intend to continue to invest in these solution areas by adding personnel and other resources to our research and development function. We will likely recognize costs associated with these investments earlier than the anticipated benefits. If we do not achieve the anticipated benefits from these investments, or if the achievement of these benefits is delayed, our business, financial condition and results of operations may be adversely affected.
The process of developing new technologies is time consuming, complex and uncertain, and requires the commitment of significant resources well in advance of being able to fully determine market requirements and industry standards. Furthermore, we may not be able to timely execute new product or technical initiatives because of errors in product planning or timing, technical difficulties that we cannot timely resolve, or a lack of appropriate resources. This could result in competitors bringing products to market before we do and a consequent decrease in our market share and net revenue. Our inability to timely and cost-effectively introduce new products and product enhancements, or the failure of these new products or enhancements to achieve market acceptance and comply with industry standards, could seriously harm our business, financial condition and results of operations. Additionally, products and technologies developed by others, and our own introduction of new products and product enhancements, could result in the obsolescence and write-off of previously purchased or committed inventory, which would reduce our net income or increase our net loss.
If we are unable to successfully develop and expand our cloud-based offerings, or if the market for cloud-based information technology security solutions does not evolve as we anticipate, our business and results of operations may be harmed.
We have invested considerable resources in developing our Cloud-Delivered Secure Web Gateway service, Global Intelligence Network and cloud-based offerings, and in building out the infrastructure supporting such offerings, including amounts spent on internal research and development, strategic acquisitions, equipment purchases and long-term leases or service agreements associated with acquiring space for the data centers that support such cloud-based offerings. We expect to continue to invest significant resources in our cloud-based offerings. In 2015, we extended our investment in our cloud-based offerings through our acquisitions of Elastica and Perspecsys. There is no assurance that we will generate sufficient revenue from sales of these products and services to recoup these investments. Given our limited history with our cloud-based offerings we can provide no assurance that we will be successful in continuing to grow revenue from our cloud-based offerings. Moreover, our entry into these and other new markets may adversely affect our gross margin, revenue and expenses as a consequence of the ratable recognition of subscription revenue for our cloud-based offerings and the corresponding requirement to recognize the expense associated with the sale thereof at the time of such sale.
The success of our investments in our cloud-based offerings will also depend to a significant extent on the willingness of organizations to increase their use of the cloud and to rely on cloud-based solutions for their IT security needs. The market for cloud-based IT security solutions is at an early stage relative to on-premise solutions, and as such, it is difficult to predict important market trends, including the potential growth, if any, of the market for these solutions. To date, some organizations have been reluctant to use cloud-based solutions because they have concerns regarding the risks associated with the reliability or security of the technology delivery model associated with these solutions. If other cloud-based service providers experience security incidents, loss of customer data, disruptions in service delivery or other problems, the market for cloud-based
-21-
Table of Contents
solutions as a whole, including our cloud-based offerings, may be negatively impacted. If the demand for our cloud-based offerings does not continue to grow for any of the reasons discussed above, our business, results of operations and financial condition may be harmed.
Real or perceived defects, errors or vulnerabilities in our products or services, the misconfiguration of our products, the failure of our products or services to block malware or prevent a security breach, or the failure of customers to take action on attacks identified by our products could harm our reputation and adversely impact our business, financial condition and results of operations.
Because our products and services are complex, they have contained and may contain design or manufacturing defects or errors that are not detected before their deployment. Our products also provide our customers with the ability to customize a multitude of settings, and it is possible that a customer could misconfigure our products or otherwise fail to configure our products in an optimal manner. Such defects, errors and misconfigurations of our products could cause our products or services to be vulnerable to security attacks, cause them to fail to secure networks and detect and block threats, or temporarily interrupt the networking traffic of our customers. In addition, because the techniques used by computer hackers to access or sabotage networks change frequently and generally are not recognized until widely deployed, there is a risk that an advanced attack could emerge that our products and services are unable to detect or prevent. Moreover, as our products and services are adopted by an increasing number of enterprises and governments, it is possible that the individuals and organizations behind cyber-attacks will begin to focus on finding ways to defeat our products and services. If this happens, our networks, products and services could be targeted by attacks specifically designed to disrupt our business and undermine the perception that our products and services are capable of providing superior IT security, which, in turn, could have a serious impact on our reputation. Any security vulnerability or perceived security vulnerability of our products or services could materially and adversely affect our business, financial condition and results of operations.
If any of our customers become infected with malware after using our products or services, such customer could be disappointed with our products and services or perceive that our products or services failed to perform their intended purpose, regardless of whether our products or services blocked the theft of any of such customer’s data or would have blocked such theft if configured properly. If any of our customers experience a security breach, such customers and the general public may believe that our products and services failed. Furthermore, if any enterprises or governments that are publicly known to use our products or services are the subject of a cyber-attack that becomes publicized, our other current or potential customers may purchase alternative solutions from our competitors. Real or perceived security breaches of our customers’ networks could cause disruption or damage to their networks or other negative consequences and could result in negative publicity about us, damage to our reputation, declining sales, increased expenses and customer relations problems.
Furthermore, our products and services may fail to detect or prevent malware, viruses, worms or similar threats for any number of reasons, including our failure to enhance and expand our products and services to reflect industry trends, new technologies and new operating environments, the complexity of our customers’ environment and the sophistication of malware, viruses and other threats. In addition, from time to time, firms test our products against other security products. Our products may fail to detect or prevent threats in any particular test for a number of reasons, including misconfiguration. To the extent potential customers, industry analysts or testing firms believe that the occurrence of a failure of our products or services to detect or prevent any particular threat is a flaw or indicates that our products or services do not provide significant value, our reputation and business could be harmed. Failure to keep pace with technological changes in the IT security industry and changes in the threat landscape could adversely affect our ability to protect against security breaches and could cause us to lose customers.
Any real or perceived defects, errors or vulnerabilities in our products and services, or any other failure of our products and services to detect or block threats, could result in:
| • | a loss of existing or potential customers or channel partners; |
-22-
Table of Contents
| • | delayed or lost revenue and harm to our financial condition and results of operations; |
| • | a delay in attaining, or the failure to attain, market acceptance for new products; |
| • | the expenditure of significant financial and product development resources in efforts to analyze, correct, eliminate, or work around errors or defects, to address and eliminate vulnerabilities, or to identify and ramp up production with alternative third-party manufacturers; |
| • | an increase in warranty claims, or an increase in the cost of servicing warranty claims, either of which would adversely affect our gross margins; |
| • | harm to our reputation or brand; and |
| • | litigation, regulatory inquiries, or investigations that may be costly and further harm our reputation. |
Disruptions or other business interruptions that affect the continuous availability of our cloud-based offerings, including disruptions at any third-party data centers upon which we rely, could adversely impact our business, financial condition and results of operations.
Our customers depend on the continuous availability of our cloud-based offerings. Our cloud-based offerings are vulnerable to damage or interruption from a variety of sources, including damage or interruption caused by telecommunications or computer systems failure, fire, earthquake, power loss, cyber-attack, human error, terrorist acts and war. Our data centers and networks may experience technical failures and downtime, may fail to distribute appropriate updates, or may fail to meet the increased requirements of a growing customer base, any of which could temporarily or permanently expose our customers’ networks, leaving their networks unprotected against the latest security threats or, in the case of technical failures and downtime of a customer’s security operation center, all security threats. Depending upon how customers have configured their use of our products and services, network downtime within our data centers may also prevent certain customers from being able to access the Internet during the period of such network downtime.
In addition, there may be system or network interruptions if customer systems are defective or not installed properly. Moreover, interruptions in our subscription updates could result in a failure of our Global Intelligence Network to effectively update our customers’ products and thereby leave our customers more vulnerable to attacks. Interruptions or failures in our service delivery could cause customers to terminate their subscriptions with us, could adversely affect our renewal rates, and could harm our ability to attract new customers. Our business would also be harmed if our customers believe that our cloud-based offerings are unreliable.
We provide our cloud-based offerings through third-party data center hosting facilities located in the United States and other countries. While we control and have access to our servers and all of the components of our network that are located in such third-party data centers, we do not control the operation of these facilities. Following expiration of the current agreement terms, the owners of the data center facilities have no obligation to renew their agreements with us on commercially reasonable terms, or at all. If we are unable to renew these agreements on commercially reasonable terms, or if one of our data center operators is acquired, we may be required to transfer our servers and other infrastructure to new data center facilities, and we may incur significant costs and possible service interruption in connection with doing so.
If our competitors incorporate security functionality similar to that offered by our products into their existing IT security products, organizations may stop using our products in their network, which would have an adverse effect on our business.
Large, well-established providers of networking equipment offer, and may continue to introduce, enterprise IT security features that compete with our products and services, either in stand-alone IT security products or as additional features in their network infrastructure products. The inclusion of, or the announcement of an intent to include, functionality perceived to be similar to that offered by our security solutions in networking products that are already generally accepted as necessary components of our existing or potential customers’ network architecture may have an adverse effect on our ability to market and sell our products and services.
-23-
Table of Contents
Furthermore, even if the functionality offered by network infrastructure providers is more limited than our products, current or prospective customers may elect to accept such limited functionality of their existing vendors’ products in lieu of adding our products. Many organizations have invested substantial personnel and financial resources to design and operate their networks and have established deep relationships with other providers of networking products with whom we may compete, which may make them reluctant to add new components such as the products we offer to their networks. In addition, an organization’s existing vendors or new vendors with a broader product offering than our own may be able to offer concessions that we are not able or willing to match. If organizations are reluctant to add additional network infrastructure to incorporate our products or otherwise decide to work with their existing vendors to address their enterprise IT security needs, our ability to increase our market share and improve our financial condition and operating results will be adversely affected.
Reliance on shipments at the end of the quarter could cause our revenue for the applicable period to fall below expected levels.
As a result of customer buying patterns and the efforts of our sales force and channel partners to meet or exceed their quarterly sales objectives, we have historically received a substantial portion of sales orders and generated a substantial portion of revenue during the last few weeks of each fiscal quarter. If expected revenue at the end of any fiscal quarter is delayed for any reason, including the failure of anticipated purchase orders to materialize, our logistics partners’ inability to ship products prior to fiscal quarter-end to fulfill purchase orders received near the end of the fiscal quarter, our failure to manage inventory to meet demand, our inability to release new products on schedule, any failure of our systems related to order review and processing, or any delays in shipments based on trade compliance requirements, our revenue for that quarter could fall below our expectations and the estimates of analysts, which could adversely impact our business and results of operations.
Seasonality may cause fluctuations in our revenue.
Our business is affected by seasonal fluctuations in customer spending patterns, which result in some seasonal trends in the sale of our solutions. Revenue in our third and fourth fiscal quarters is typically stronger due to the calendar year-end. Our first and second fiscal quarters typically experience lower sales, with revenue historically lowest in our first fiscal quarter. Furthermore, our rapid growth rate over recent years may have made seasonal fluctuations more difficult to detect. If our growth rate slows over time, seasonal or cyclical variations in our operations may become more pronounced, and our business, results of operations and financial position may be adversely affected.
A portion of our revenue is generated by sales to government entities, which are subject to a number of challenges and risks.
We currently sell our solutions to various government entities, and we may in the future increase sales to government entities. Sales to U.S. federal government agency customers accounted for 4% of our total revenue for fiscal 2016. Sales to government entities are subject to a number of risks. Selling to government entities can be highly competitive, expensive and time consuming, often requiring significant upfront time and expense without any assurance that we will complete a sale. Government demand and payment for our products and services may be impacted by public sector budgetary cycles and funding authorizations, with funding reductions or delays adversely affecting public sector demand for our products. Sales to government agencies are completed through our network of channel partners, and government entities may have statutory, contractual or other legal rights to terminate contracts with our distributors and resellers for convenience or due to a default. Finally, for purchases by the U.S. government, the government may require certain products to be manufactured in the United States and other high cost manufacturing locations, and we may not manufacture all products in locations that meet the requirements of the U.S. government, and as a result, our business and results of operations may suffer.
-24-
Table of Contents
We rely on revenue from support services and subscriptions, which may decline, and because we recognize revenue from services and subscriptions over the term of the relevant service period, downturns or upturns in sales of these services and subscriptions are not immediately reflected in full in our operating results.
Adjusted service and subscription revenue accounts for a significant portion of our total adjusted net revenue, comprising 58% of total adjusted net revenue in fiscal 2016, 57% of total adjusted net revenue in fiscal 2015 and 49% of total adjusted net revenue in fiscal 2014. Service and subscription revenue, including the impact of purchase accounting, accounted for 48% of total net revenue in fiscal 2016, 57% of total net revenue in fiscal 2015, and 47% of total net revenue in fiscal 2014. See “Selected Consolidated Financial Data—Reconciliation of Non-GAAP Financial Measures” for a description of adjusted service and subscription revenue, adjusted product revenue and adjusted net revenue, and a reconciliation of these measures to GAAP. Our service and subscription revenue primarily consists of sales of new and renewal support contracts, software subscriptions and our cloud-based offerings. Sales of new or renewal service and subscription contracts may decline and fluctuate as a result of a number of factors, including our customers’ level of satisfaction with our products and services, the prices of our products and services, the prices of products and services offered by our competitors, and reductions in our customers’ spending levels. If our sales of new or renewal service and subscription contracts decline, our revenue and revenue growth may decline and our business will suffer. In addition, we recognize service and subscription revenue over the term of the contract. These contracts typically have a term of one to three years for new support contracts and subscription contracts, with average terms of approximately two years, and one year for renewal support contracts. As a result, much of the service and subscription revenue we report each fiscal quarter is the recognition of deferred revenue from service and subscription and service contracts entered into during previous fiscal quarters. Consequently, a decline in new or renewed service or subscription contracts in any one fiscal quarter will not be fully or immediately reflected in revenue in that fiscal quarter but will negatively affect our revenue in future fiscal quarters. Accordingly, the effect of significant downturns in new or renewed sales of our services or subscriptions is not reflected in full in our operating results until future periods. Also, it is difficult for us to rapidly increase our service and subscription revenue through additional sales in any period, as revenue from new and renewal service and subscription contracts must be recognized over the applicable term of the contract. Furthermore, any increase in the average term of our services or subscriptions contracts would result in revenue for such contracts being recognized over longer periods of time.
Our acquisitions may not provide the benefits we anticipate and may disrupt our existing business.
Since December 2012, we have acquired Crossbeam Systems, Solera Networks, Norman Shark, the SSL Visibility appliance product line from Netronome Systems, Perspecsys and Elastica. It is likely we will acquire additional businesses or assets in the future. There is no guarantee that such acquisitions will yield the benefits we anticipate.
Acquisitions may also result in risks to our existing business, including:
| • | inability to successfully integrate the operations, technologies, products and personnel of the acquired companies; |
| • | diversion of management’s attention from daily operations of the business; |
| • | loss of key employees; |
| • | substantial transaction costs; |
| • | assumption of additional liabilities; |
| • | incurrence of additional debt or a decline in available cash; |
| • | adverse effects to our financial statements, such as the need to make large and immediate write-offs or the incurrence of restructuring and other related expenses; |
| • | liability for intellectual property infringement, other litigation claims or past violations of applicable laws, which we may or may not be aware of at the time of acquisition; |
-25-
Table of Contents
| • | creation of goodwill or other intangible assets that could result in significant amortization expense or impairment charges; and |
| • | incurrence of tax expense related to the effect of acquisitions on our intercompany research and development cost sharing arrangements and legal structure. |
The occurrence of any of the above risks could seriously impact our business, financial condition and results of operations.
If our products do not interoperate with our customers’ infrastructures, or if our customers implement certain proprietary encryption protocols, sales of our products could be adversely affected.
Our products must interoperate with our customers’ existing infrastructures, which often have different specifications, rapidly evolve, utilize multiple protocol standards, deploy products and applications from multiple vendors, and contain multiple generations of products that have been added to that infrastructure over time. In addition, our customers may implement proprietary encryption protocols that our products are unable to recognize, de-crypt or otherwise manage. If we are unable to successfully manage and interpret new protocol standards and versions, if we encounter problematic network configurations or settings, or if we encounter proprietary encryption protocols, we may have to modify our software or hardware so that our products will interoperate with our customers’ infrastructures and can manage our customers’ traffic in the manner intended. It may be necessary for us to obtain a license to implement proprietary encryption or other protocols, and there can be no assurance that we will be able to obtain such a license. As a consequence of any of the foregoing, we may suffer delays in the development of our products or our products may be unable to protect or manage our customers’ traffic in, our customers’ infrastructure, which could affect our ability to sell our products, and adversely affect our business, financial condition and results of operations.
We may be unable to raise additional capital on acceptable terms, or at all.
We believe that our available cash and cash equivalents, together with funds from this offering and generated from our operating activities and unused availability under our Senior Secured Revolving Credit Facility will be sufficient to meet our working and other capital requirements for at least the next 12 months. However, if cash is required for unanticipated needs, including in connection with a proposed acquisition of a company or technology, we may need additional capital during that period. The development and marketing of new products and our investment in sales and marketing efforts require a significant commitment of resources. If the markets for our products develop at a slower pace than anticipated, we could be required to raise additional capital. We cannot guarantee that, should it be required, sufficient debt or equity capital will be available to us under acceptable terms, if at all. If we were unable to raise additional capital when required, our business, financial condition and results of operations could be seriously harmed.
The security of our computer systems may be compromised and harm our business.
Increasingly, companies, including us, are subject to a wide variety of attacks on their networks on an ongoing basis. We may also be a more attractive target for cyber-attacks because we provide web security solutions. In addition to traditional computer hackers, malicious code (such as viruses and worms), employee theft or misuse (including threats posed by malicious insiders and other forms of cyber-espionage), denial of service attacks, and nation-state and nation-state supported actors now engage in intrusions and attacks (including advanced persistent threat intrusions), and add to the risks to our internal networks and the information they store and process. In the ordinary course of business, we collect, use, store, disclose, transfer, and otherwise process sensitive or personal information about our employees, customers, vendors, partners, and others. We may also process and store sensitive or personal information in cloud-based services for our or our customers’ purposes. These cloud-based services are hosted by third parties on infrastructure maintained by third parties. Despite efforts to create security barriers to such threats, it is impossible for us to entirely mitigate these risks. Any breach of our security measures or those of our partners, vendors, and service providers could compromise our networks, products or services, creating system disruptions or slowdowns, and the information
-26-
Table of Contents
stored or processed on our networks could be subject to unauthorized access or acquisition, corrupted, lost, or publicly disclosed, which could subject us to liability and cause us financial harm. Data breaches or security incidents that impact us could also exploit the security vulnerabilities of our products and further result in, or increase the likelihood of, a data breach or security incident that impacts the systems, networks, or data of our customers. Many of our customers have reporting obligations, which could result in increased publicity of any such breaches. As a result, any actual or perceived security breaches of our computer systems may result in damage to our reputation, negative publicity, loss of channel partners, customers and sales, increased costs to respond to and remedy any problem, and costly litigation or regulatory investigations and may therefore adversely impact market acceptance of our products, or our business, financial condition or results of operations.
We rely significantly on third-party channel partners to fulfill sales of our products.
We primarily market and sell our solutions to our customers through a two-tiered indirect channel of solution providers, systems integrators, value-added resellers and distributors worldwide. During fiscal 2015 and 2016, approximately 84% of our revenue was attributable to sales fulfilled through distributors, and 16% of our revenue was made through direct resellers. For fiscal 2016, our two largest distributors accounted for 27% and 26% of our revenue, respectively. For fiscal 2015, our two largest distributors accounted for 26% and 25% of our revenue, respectively. We also rely on a third party to solicit and obtain renewal contracts with existing customers. If we lost one of our distributors or if any of the channel partners responsible for a significant portion of our business becomes insolvent or suffers a deterioration in its financial or business condition and is unable to pay for our products, our results of operations could be harmed. Although we provide support to these channel partners through our direct sales and marketing activities, we depend upon these partners to generate sales opportunities and to independently manage the sales process for opportunities with which they are involved. In order to increase our revenue, we expect we will need to maintain our existing channel partners and continue to train and support them, as well as add new channel partners and effectively train, support and integrate them with our sales process. Additionally, our entry into any new markets will require us to develop appropriate channel partners and to train them to effectively address these markets. If we are unsuccessful in these efforts, this will limit our ability to grow our business and our business, financial condition and results of operations will be adversely affected.
Our current system of channel distribution may not prove effective in maximizing sales of our products and services. Our products are complex and certain sales can require substantial effort. It is possible that our channel partners will be unable or unwilling to dedicate appropriate resources to support those sales. Furthermore, most of our channel partners do not have minimum purchase or resale requirements, and may terminate our agreements with only a short notice period or otherwise cease selling our products at any time. They also may market, sell and support products and services that are competitive with ours, and may devote more resources to the marketing, sales and support of those competitive products. There is no assurance that we will retain these channel partners, or that we will be able to add additional or replacement channel partners in the future. The loss of one or more of our key channel partners in a given geographic area could harm our operating results within that area, as new channel partners typically require extensive training and take several months to achieve acceptable productivity.
We also depend on some of our channel partners to deliver first line service and support for our products. Once our products are deployed within our customers’ networks, our customers depend on the support of our channel partners to resolve any issues relating to the implementation and maintenance of our platform. If our channel partners do not effectively assist our customers in deploying our products, succeed in helping our customers quickly resolve post-deployment issues, or provide effective ongoing support, our customer satisfaction and future sales of our products could be adversely affected.
While we require that our channel partners comply with applicable laws and regulations, they could engage in behavior or practices that expose us to legal or reputational risk. For example, in 2011 we sold certain appliances in compliance with U.S. export law to a Middle Eastern affiliate of one of our channel partners, which thereafter unlawfully diverted the appliances to Syria without our knowledge. We received negative press
-27-
Table of Contents
coverage and incurred significant time and expense in connection with our internal investigation of the matter and our cooperation with the U.S. government in connection with its review of this third-party diversion of our products.
Our ability to maintain customer satisfaction depends in part on the quality of our customer support services, including the quality of the support provided on our behalf by certain channel partners. Failure to maintain high-quality customer support could have a material adverse effect on our business, financial condition and results of operations.
Once our products are deployed within our customers’ networks, our customers depend on our support and other technical services, as well as the support of our channel partners, to resolve any issues relating to the implementation and maintenance of our products. If we or our channel partners do not effectively assist our end customers in deploying our products, succeed in helping our customers quickly resolve post-deployment issues, or provide effective ongoing support, our ability to sell additional products or services to existing customers would be adversely affected and our reputation with potential customers could be damaged.
Many larger organizations have more complex networks and require higher levels of support than smaller customers. If we fail to meet the requirements of our larger customers, it may be more difficult to expand sales to these customers.
Our continued growth also depends on our ability to maintain high-quality support services for an increasing number of small and mid-sized enterprises. While small and mid-sized customers often have less complex networks and require lower levels of ongoing support, they are often subject to resource constraints that increase the importance of the cost and efficiency of support services. If we and our channel partners are unable to efficiently provide the same high-quality support services for sales made to smaller enterprises, our ability to expand our customer base may be adversely affected and the growth of our business may be harmed.
Additionally, if our channel partners do not effectively provide support to the satisfaction of our customers, we may be required to provide this level of support to those customers, which would require us to hire additional personnel and to invest in additional resources. It can take significant time and resources to recruit, hire, and train qualified support services and other technical support employees. We may not be able to hire such resources fast enough to keep up with demand, particularly when the sales of our products exceed our internal forecasts. To the extent that we or our channel partners are unsuccessful in hiring, training, and retaining adequate support resources, our ability and the ability of our channel partners to provide adequate and timely support to our customers will be negatively impacted, and our customers’ satisfaction with our offerings will be adversely affected.
If we fail to successfully promote or protect our brand, our business and competitive position may be harmed.
Due to the intensely competitive nature of our markets, we believe that building and maintaining our brand and reputation is critical to our success, and that the importance of positive brand recognition will increase as competition in our market further intensifies. We believe that we have a well-established brand and we have invested and expect to continue to invest substantial resources to promote and maintain our brand both domestically and internationally, but there is no guarantee that our brand development strategies will enhance the recognition of our brand or lead to increased revenue.
Furthermore, an increasing number of independent industry analysts and researchers regularly evaluate, compare and publish reviews regarding the functionality of IT security products and services, including our own solutions. The market’s perception of our solutions may be significantly influenced by these reviews. We do not have any control over the content of these independent industry analysts and researchers reports, and our brand could be harmed if they publish negative reviews of our solutions or do not view us as a market leader. The strength of our brand may also be negatively impacted by the marketing efforts of our competitors, which may include incomplete, inaccurate and misleading statements about us, or our products and services. If we are unable to maintain a strong brand and reputation, sales to new and existing customers could be adversely affected, and our financial performance could be harmed.
-28-
Table of Contents
Our ability to use our net operating loss carry-forwards may be subject to limitation and may result in increased future tax liability to us.
Generally, a change of more than 50% in the ownership of a corporation’s stock owned by certain shareholders, by value, over a three-year period constitutes an ownership change for U.S. federal income tax purposes. An ownership change may limit a company’s ability to use its net operating loss carry-forwards and certain other tax attributes attributable to the period prior to such change. We have previously undergone an ownership change under Section 382 of the Internal Revenue Code as a result of past transactions, including the Bain Acquisition. As a result, if we earn net taxable income, our ability to use our pre-ownership change net operating loss carry-forwards and certain other tax attributes to offset U.S. federal taxable income will be subject to limitations, which could potentially result in increased future tax liability to us. In addition, future changes in our stock ownership could result in additional ownership changes in the future.
Forecasting our estimated annual effective tax rate is complex and subject to uncertainty, and there may be material differences between our forecasted and actual tax rates.
Forecasts of our income tax position and effective tax rate are complex and subject to uncertainty because our income tax position for each year combines the effects of a mix of profits and losses earned by us and our subsidiaries in various tax jurisdictions with a broad range of income tax rates, as well as changes in the valuation of deferred tax assets and liabilities, the impact of various accounting rules and changes to these rules and tax laws, the results of examinations by various tax authorities, and the impact of any acquisition, business combination or other reorganization or financing transaction. For example, the Predecessor’s acquisition by Thoma Bravo in 2012 and the Bain Acquisition, as well as our recent acquisitions of Elastica and Perspecsys, each involved complex tax structuring, consequences and determinations. To forecast our global tax rate, we estimate our pre-tax profits and losses by jurisdiction and forecast our tax expense by jurisdiction. If our mix of profits and losses, our ability to use tax credits, or effective tax rates by jurisdiction is different than those estimated, our actual tax rate could be different than forecasted, which could have a material impact on our financial condition and results of operations.
As a multinational corporation, we conduct our business in many countries and are subject to taxation in many jurisdictions. The taxation of our business is subject to the application of multiple and conflicting tax laws and regulations as well as multinational tax conventions. Our effective tax rate is highly dependent upon the geographic distribution of our worldwide earnings or losses, the tax regulations in each geographic region, the availability of tax credits and carryforwards, and the effectiveness of our tax planning strategies. The application of tax laws and regulations is subject to legal and factual interpretation, judgment and uncertainty. Tax laws themselves are subject to change as a result of changes in fiscal policy, changes in legislation, and the evolution of regulations and court rulings. Consequently, taxing authorities may impose tax assessments or judgments against us that could materially impact our tax liability and/or our effective income tax rate. Furthermore, we may decide to repatriate a portion of our cash and cash equivalents held by our international subsidiaries for various reasons, including but not limited to servicing our debt obligations. If such cash and cash equivalents were to be repatriated, we may incur a United States federal income tax liability that is not currently accrued in our financial statements and could be material.
In addition, we are subject to examination of our income tax returns by the Internal Revenue Service and other tax authorities. If tax authorities challenge the relative mix of our U.S. and international income, our future effective income tax rates could be adversely affected. While we regularly assess the likelihood of adverse outcomes from such examinations and the adequacy of our provision for income taxes, there can be no assurance that such provision is sufficient and that a determination by a tax authority will not have an adverse effect on our business, financial condition and results of operations.
-29-
Table of Contents
We rely on technology that we license from third parties, including software that is integrated with internally developed software and used with our products.
We rely on technology that we license from third parties, including third-party commercial software and open source software, which is used with certain of our products. If we are unable to continue to license any of this software on commercially reasonable terms, we will face delays in releases of our software or we will be required to delete this functionality from our software until equivalent technology can be licensed or developed and integrated into our current product. In addition, our inability to obtain certain licenses or other rights might require us to engage in litigation regarding these matters, which could have a material adverse effect on our business, financial condition and results of operations.
Our use of open source software could negatively affect our ability to sell our solutions and subject us to possible litigation.
We use open source software in our products and our development environments and expect to continue to use open source software in the future. Open source software is typically provided without assurances of any kind. If open source software programmers do not continue to develop and enhance open source technologies, our development expenses could be increased and our product release and upgrade schedules could be delayed. In addition, we may face claims from others seeking to enforce the terms of open source licenses, including by demanding release of derivative works or our proprietary source code that was developed using such open source software. These claims could also result in litigation, require us to purchase a costly license or require us to devote additional research and development resources to change our products or services, any of which could have a negative effect on our business and operating results. In addition, if the license terms for the open source software we utilize change, we may be forced to reengineer our offerings or incur additional costs. Although we regulate the use and incorporation of open source software into our products, we cannot be certain that we have in all cases incorporated open source software in our products in a manner that is consistent with the applicable open source license terms.
If we fail to accurately predict our manufacturing requirements and manage our supply chain we could incur additional costs or experience manufacturing delays that could harm our business.
We generally provide forecasts of our requirements to our supply chain partners on a rolling basis. If our forecast exceeds our actual requirements, a supply chain partner may assess additional charges or we may have liability for excess inventory, each of which could negatively affect our gross margin. If our forecast is less than our actual requirements, the applicable supply chain partner may have insufficient time or components to produce or fulfill our product requirements, which could delay or interrupt manufacturing of our products or fulfillment of orders for our products, and result in delays in shipments, customer dissatisfaction, and deferral or loss of revenue. Further, we may be required to purchase sufficient inventory to satisfy our future needs in situations where a component or product is being discontinued. If we fail to accurately predict our requirements, we may be unable to fulfill those orders or we may be required to record charges for excess inventory. Any of the foregoing could adversely affect our business, financial condition or results of operations.
We are dependent on original design manufacturers, contract manufacturers and third-party logistics providers to design and manufacture our products and to fulfill orders for our products.
We depend primarily on original design manufacturers (each of which is a third-party original design manufacturer for numerous companies) to co-design and co-develop the hardware platforms for our products. We also depend on independent contract manufacturers (each of which is a third-party contract manufacturer for numerous companies) to manufacture and fulfill our products. These supply chain partners are not committed to design or manufacture our products, or to fulfill orders for our products, on a long-term basis in any specific quantity or at any specific price. In addition, certain of our products or key components of our products are currently manufactured by a single third-party supplier. There are alternative suppliers that could provide components, as our agreements do not provide for exclusivity or minimum purchase quantities, but the transition and qualification from one supplier to another could be lengthy, costly and difficult. Also, from time to time, we may be required to add new supply chain
-30-
Table of Contents
partner relationships or new manufacturing or fulfillment sites to accommodate growth in orders or the addition of new products. It is time consuming and costly to qualify and implement new supply chain partner relationships and new manufacturing or fulfillment sites, and such additions increase the complexity of our supply chain management. Our ability to ship products to our customers could be delayed, and our business and results of operations could be adversely affected if we fail to effectively manage our supply chain partner relationships; if one or more of our original design manufacturers does not meet our development schedules; if one or more of our independent contract manufacturers experiences delays, disruptions or quality control problems in manufacturing our products; if one or more of our third-party logistics providers experiences delays or disruptions or otherwise fails to meet our fulfillment schedules; or if we are required to add or replace original design manufacturers, independent contract manufacturers, third-party logistics providers or fulfillment sites.
In addition, these supply chain partners have access to certain of our critical confidential information and could wrongly disclose or misuse such information or be subject to a breach or other compromise that introduces a vulnerability or other defect in the products manufactured by our supply chain partners. While we take precautions to ensure that hardware manufactured by our independent contractors is reviewed, any espionage acts, malware attacks, theft of confidential information or other malicious cyber incidents perpetrated either directly or indirectly through our independent contractors, may compromise our system infrastructure, expose us to litigation and associated expenses and lead to reputational harm that could result in a material adverse effect on our financial condition and operating results. In addition, we are subject to risks resulting from the perception that certain jurisdictions, including China, do not comply with internationally recognized rights of freedom of expression and privacy and may permit labor practices that are deemed unacceptable under evolving standards of social responsibility. If manufacturing or logistics in these foreign countries is disrupted for any reason, including natural disasters, IT system failures, military or government actions or economic, business, labor, environmental, public health, or political issues, or if the purchase or sale of products from such foreign countries is prohibited or disfavored, our business, financial condition and results of operations could be adversely affected.
The Dodd-Frank Wall Street Reform and Consumer Protection Act of 2010 (the “Dodd-Frank Act”) includes disclosure requirements regarding the use of certain minerals mined from the Democratic Republic of Congo and adjoining countries (“DRC”) and procedures pertaining to a manufacturer’s efforts regarding the source of such minerals. SEC rules implementing these requirements and other international standards, such as the Organization for Economic Co-Operation and Development Due Diligence Guidance for Responsible Supply Chains of Minerals from Conflict-Affected and High Risk Areas may have the effect of reducing the pool of suppliers who can supply DRC “conflict free” components and parts, and we may not be able to obtain DRC conflict free products or supplies in sufficient quantities for our products. We may also face reputational challenges with our customers, stockholders and other stakeholders if we are unable to sufficiently verify the origins for the minerals used in our products.
If the protection of our proprietary technology is inadequate, our competitors may gain access to our technology.
Our success is dependent on our ability to create proprietary technology and to protect and enforce our intellectual property rights in that technology, as well as our ability to defend against adverse claims of third parties with respect to our technology and intellectual property. To protect our proprietary technology, we rely primarily on a combination of contractual provisions, confidentiality procedures, trade secrets, copyright and trademark laws, and patents. Despite our efforts to protect our proprietary rights, unauthorized parties may attempt to copy aspects of our products or obtain and use information that we regard as proprietary. Policing unauthorized use of our products is difficult. In addition, the laws of some foreign countries, including countries where we sell products and have operations, do not protect our proprietary rights to as great an extent as do the laws of the United States. Our means of protecting our proprietary rights may not be adequate and unauthorized third parties, including current and future competitors, may independently develop similar or superior technology, duplicate or reverse engineer aspects of our products, or design around our patented technology or other intellectual property.
-31-
Table of Contents
As of April 30, 2016, we had more than 230 issued patents and pending patent applications. There can be no assurance that any of our pending patent applications will issue or that the patent examination process will not result in our narrowing the claims applied for in our patent applications. Furthermore, there can be no assurance that we will be able to detect any infringement of our existing or future patents (if any) or, if infringement is detected, that our patents will be enforceable or that any damages awarded to us will be sufficient to adequately compensate us for the infringement.
There can be no assurance or guarantee that any products, services or technologies that we are presently developing, or will develop in the future, will result in intellectual property that is subject to legal protection under the laws of the United States or a foreign jurisdiction or that produces a competitive advantage for us.
Misuse of our products could harm our reputation and negatively affect our business, financial condition and results of operations.
Certain of our products enable the filtering of Internet content and provide our customer with the ability to selectively block access to certain Web sites. Certain of our products can also log the IP address of network connections that are processed by our products. It is possible that our customers or other third parties may examine or filter content or log IP addresses in a manner that is unlawful or that is believed or found to be contrary to the exercise of personal rights. If this occurs, our ability to distribute and sell those products as presently designed or as customers desire to use them may be negatively affected and our reputation may be harmed.
Our failure to adequately maintain and protect personal information in compliance with evolving legal requirements could have a material adverse effect on our business.
A wide variety of provincial, state, national, and international laws and regulations apply to the collection, use, retention, protection, disclosure, transfer, and other processing of personal information. These data protection and privacy-related laws and regulations are evolving and being tested in courts and may result in ever-increasing regulatory and public scrutiny and escalating levels of enforcement and sanctions. For example, the European Union recently adopted the General Data Protection Regulation (“GDPR”), which will take effect on May 25, 2018. The GDPR imposes new data processing and protection requirements that may limit how we are permitted to process data on behalf of ourselves and our clients, and we may be required to incur significant costs to comply with these new requirements. The GDPR also allows for the imposition of substantial fines for security breaches or failure to comply with the new regulations. Both the adoption of the GDPR and the recent invalidation of the U.S.-E.U. and U.S.-Swiss Safe Harbor Frameworks have caused us to review our business practices to consider whether to make changes to our personal data handling practices to ensure compliance with applicable European law. Our actual or alleged failure to comply with applicable laws and regulations, or to protect such data, could result in regulatory enforcement action against us, including fines, imprisonment of company officials and public censure, claims for damages by employees, customers and other affected individuals, damage to our reputation and loss of goodwill (both in relation to existing customers and prospective customers), any of which could have a material adverse effect on our business, financial condition and results of operations. Evolving and changing definitions of personal data and personal information, within the European Union, the United States, and elsewhere, especially relating to classification of IP addresses, machine identification, location data, and other information, may limit or inhibit our ability to operate or expand our business, including limiting strategic partnerships that may involve the sharing of data. Even the perception of privacy concerns, whether or not valid, may harm our reputation and inhibit adoption of our products by existing and potential customers.
Our international operations expose us to risks.
We currently have operations in a number of foreign countries and make sales to customers throughout the world. Our business is substantially dependent on economic conditions and IT spending in markets outside of North America and Latin America (the “Americas”). In fiscal 2015, approximately 48% of our revenue was derived from customers outside of the Americas and in fiscal 2016, approximately 45% of our revenue was derived from customers outside of the Americas. In addition, we currently perform certain of our research and
-32-
Table of Contents
development and other operations offshore in lower cost geographies, and we maintain data centers for our cloud-based offerings in geographically dispersed locations outside of the United States. Our international operations and sales into international markets require significant management attention and financial resources, and subject us to certain inherent risks including:
| • | technical difficulties and costs associated with product localization; |
| • | challenges associated with coordinating product development efforts among geographically dispersed areas; |
| • | potential loss of proprietary information due to piracy, misappropriation or laws that may inadequately protect our intellectual property rights; |
| • | greater difficulty in establishing, utilizing and enforcing our intellectual property rights; |
| • | our limited experience in establishing a sales and marketing presence, and research and development operations, together with the appropriate internal systems, processes and controls, in certain geographic markets; |
| • | political unrest or economic instability, regulatory changes, war or terrorism, and other unpredictable and potentially long-term events in the countries or regions where we or our customers do business, which could result in delayed or lost sales or interruption in our business operations; |
| • | longer payment cycles for sales in certain foreign countries; |
| • | seasonal reductions in business activity in the summer months in Europe and at other times in various countries; |
| • | the significant presence of some of our competitors in some international markets; |
| • | potentially adverse tax consequences or changes in applicable tax laws; |
| • | import and export restrictions and tariffs and other trade protection initiatives; |
| • | potential failures of our foreign employees and channel partners to comply with both U.S. and foreign laws and regulations, including antitrust laws, trade regulations and anti-bribery and corruption laws, including the U.S. Foreign Corrupt Practices Act; |
| • | compliance with foreign laws, regulations and other government controls, such as those affecting trade, privacy and data protection the environment, corporations and employment; |
| • | management, staffing, legal and other costs of operating a distributed enterprise spread over various countries; |
| • | fluctuations in foreign exchange rates, which we currently do not hedge against; and |
| • | fears concerning travel or health risks that may adversely affect our ability to sell our products and services in any country in which the business sales culture encourages face-to-face interactions. |
To the extent we are unable to effectively manage our international operations and these risks, our international sales or operations may be adversely affected, we may incur additional and unanticipated costs, and we may be subject to litigation or regulatory action. As a consequence, our business, financial condition and results of operations could be seriously harmed.
We face increased exposure to foreign currency exchange rate fluctuations.
Our sales contracts are primarily denominated in U.S. dollars, and therefore, substantially all of our revenue is not subject to foreign currency risk. However, a strengthening of the U.S. dollar could increase the real cost of our products to our customers outside of the United States, which could adversely affect our financial condition and operating results. In addition, increased international sales in the future, including through our channel partners and other partnerships, may result in greater foreign currency denominated sales, increasing our foreign
-33-
Table of Contents
currency risk. Moreover, an increasing portion of our operating expenses is incurred outside the United States, is denominated in foreign currencies, and is subject to fluctuations due to changes in foreign currency exchange rates, particularly changes in the Canadian Dollar, British Pound, Australian Dollar and Japanese Yen. If we are not able to successfully hedge against the risks associated with currency fluctuations, our financial condition and operating results could be adversely affected.
We do not currently maintain a program to hedge transactional exposures in foreign currencies. However, in the future, we may use derivative instruments, such as foreign currency forward and option contracts, to hedge certain exposures to fluctuations in foreign currency exchange rates. The use of such hedging activities may not offset any or more than a portion of the adverse financial effects of unfavorable movements in foreign exchange rates over the limited time the hedges are in place. Moreover, the use of hedging instruments may introduce additional risks if we are unable to structure effective hedges with such instruments.
We are subject to governmental export and import controls that could subject us to liability or impair our ability to compete in international markets.
Our products are subject to U.S. export controls, specifically the Export Administration Regulations and economic sanctions enforced by the Office of Foreign Assets Control. We incorporate standard encryption algorithms into our products, which, along with the underlying technology, may be exported outside of the U.S. only with the required export authorizations, including by license, license exception or other appropriate government authorizations, which may require the filing of an encryption registration and classification request. Furthermore, U.S. export control laws and economic sanctions prohibit the shipment of certain products and services to countries, governments, and persons targeted by U.S. sanctions. Even though we take precautions to ensure that we and our channel partners comply with all relevant regulations, any failure by us or our channel partners to comply with such regulations could have negative consequences, including reputational harm, government investigations and penalties. For example, in 2011 we sold certain appliances in compliance with U.S. export law to a Middle Eastern affiliate of one of our channel partners, which thereafter unlawfully diverted the appliances to Syria without our knowledge. We received negative press coverage and incurred significant time and expense in connection with our internal investigation of the matter and our cooperation with the U.S. government in connection with its review of this third-party diversion of our products.
In addition, various countries regulate the import of certain encryption technology, including through import, permit and license requirements, and have enacted laws that could limit our ability to distribute our products or could limit our customers’ ability to implement our products in those countries. Changes in our products or changes in export and import regulations may create delays in the introduction of our products into international markets, prevent our customers with international operations from deploying our products globally or, in some cases, prevent the export or import of our products to certain countries, governments or persons altogether. Any change in export or import regulations, economic sanctions or related legislation, shift in the enforcement or scope of existing regulations, or change in the countries, governments, persons or technologies targeted by such regulations, could result in decreased use of our products by, or in our decreased ability to export or sell our products to, existing or potential customers with international operations. Any decreased use of our products or limitation on our ability to export or sell our products would likely adversely affect our business, financial condition and results of operations.
Economic uncertainty and adverse macroeconomic conditions may harm our business.
Our revenue and margins are dependent on various economic factors, including rates of inflation, currency fluctuations, energy costs, levels of consumer sentiment and other macroeconomic factors, which may impact levels of business spending. These conditions may adversely affect spending for IT products and services in specific geographies or more broadly, and could result in:
| • | a significant reduction in our revenue, gross margin and operating margin; |
-34-
Table of Contents
| • | increased price competition for our products and services; |
| • | risk of excess and obsolete inventory; |
| • | higher overhead costs as a percentage of net revenue; |
| • | difficulty in accurately forecasting demand for our products and services; |
| • | insolvency or credit difficulties confronting our customers and channel partners, affecting their ability to purchase or pay for our products and services; and |
| • | insolvency or credit difficulties confronting our key suppliers, which could disrupt our supply chain. |
In addition, a significant percentage of our operating expenses are generally fixed in nature, particularly in the short term, which could limit our ability to mitigate any negative impact on our profit margins.
Third parties may assert that our products or services infringe their intellectual property rights.
Third parties have in the past, and may in the future, claim that our current or future products or services infringe their intellectual property rights, and these claims, even if without merit, could harm our business by increasing our costs, reducing our revenue or by creating customer concerns that result in delayed or reduced sales. This is particularly true in the patent area, as an increasing number of U.S. patents covering computer networking and Internet technology have been issued in recent years. Patent owners, including those that do not commercially manufacture or sell products, may claim that one or more of our products infringes a patent they own.
For example, we are currently involved in ongoing legal proceedings with Finjan, Inc. (“Finjan”). On August 28, 2013, Finjan filed a complaint (“Finjan Case 1”) in the U.S. District Court for the Northern District of California alleging that certain Blue Coat products infringe U.S. Patent Nos. 6,154,844, 6,804,780, 6,965,968, 7,058,822, 7,418,731 and 7,647,633. On August 4, 2015, the jury in Finjan Case 1 returned a verdict that certain Blue Coat products infringe five Finjan patents in suit and awarded Finjan lump-sum money damages of $39.5 million. On November 20, 2015, the trial court entered a judgment in Finjan Case 1 in favor of Finjan on the jury verdict and certain non-jury legal issues. Finjan has also filed motions seeking enhanced damages on the judgment, including treble damages, which refers to the tripling of a damages award, as well as interest and attorneys fees, which, if awarded, could be substantial. We intend to vigorously contest this judgment and investigate all available remedies for relief, including currently pending post-trial motions and, if necessary, an appeal. However, we cannot be certain that any of our motions or our appeal, if we choose to appeal, will be successful.
On July 15, 2015, Finjan filed a second complaint (“Finjan Case 2”) in the U.S. District Court for the Northern District of California alleging that certain Blue Coat products infringe U.S. Patent Nos. 6,154,844, 6,965,968, 7,418,731, 8,079,086, 8,225,408, 8,566,580 and 8,677,494. On March 1, 2016, Finjan amended its complaint to allege that certain Blue Coat products also infringe U.S. Patent Nos. 9,141,786, 9,189,621 and 9,219,755. Finjan’s complaint also seeks enhanced damages, including treble damages. We have sought a stay of Finjan Case 2 from the court because, among other reasons, we contest Finjan’s right to recover damages on three patents—6,154,844, 6,965,968 and 7,418,731—for which Finjan was awarded lump-sum money damages that we contend are for the life of such patents in Finjan Case 1. We believe this verdict was in error and intend to vigorously defend Finjan Case 2, regardless of whether the case is stayed. However, we cannot be certain that we will ultimately prevail. If we do not prevail in Finjan Case 2, another large damages payment may be imposed upon us and our business and results of operations may be harmed. Trial in Finjan Case 2 is currently scheduled for October 30, 2017.
We have not recorded a liability with respect to Finjan Case 1 based on our determination that a loss in that case is not probable under applicable accounting standards. Given the early stage of Finjan Case 2, we are unable to estimate the possible losses in that case. Accordingly, any damages payable as a result of a final judgment in
-35-
Table of Contents
these cases could materially adversely affect our financial condition and results of operations. In addition, any public announcements of the results of any proceedings in Finjan Case 1 or Finjan Case 2 could be negatively perceived by securities analysts and investors, and could cause our stock price to experience volatility or decline.
From time to time, the U.S. Supreme Court, other U.S. federal courts and the U.S. Patent and Trademark Appeals Board, and their foreign counterparts, have made and may continue to make changes to the interpretation of patent laws in their respective jurisdictions. We cannot predict future changes to the interpretation of existing patent laws or whether U.S. or foreign legislative bodies will amend such laws in the future. Any such changes may lead to uncertainties or increased costs and risks surrounding the prosecution, enforcement and defense of our patents and applications, the outcome of third-party patent infringement claims brought against us and the actual or enhanced damages (including treble damages) that may be awarded in connection with any such current or future claims, and could have a material adverse effect on our business and financial condition.
Third parties may bring legal actions against us.
In the past, third parties have brought legal actions against us and other parties to whom we provided indemnification. We incurred substantial costs to defend those lawsuits and related legal proceedings. It is likely that in the future other parties may bring legal actions against us. Such actions, even if without merit, could harm our business. Any material litigation or arbitration inevitably results in the diversion of the attention of our management and other relevant personnel. To the extent uninsured, such claims further require us to incur defense costs for us and for parties to whom we may have indemnification obligations. For example, we have received requests from our channel partners from time to time to indemnify them in response to a request they received from our customers for indemnification for patent litigation brought by third parties against our customers with regard to our customers’ use of products or services sold by our channel partners, including our own products. We also may be required to pay material amounts in settlement costs or damages. Furthermore, if the matter relates to intellectual property infringement, we may be required to enter into royalty or licensing agreements or to develop non-infringing technology, and injunctive relief could be entered against us. Customer concerns with respect to material litigation can result in delayed or lost sales. Any of the foregoing could seriously harm our business and have a material adverse effect on our business, financial condition and results of operations.
Our business operations and the use of our technology are subject to evolving legal regulation regarding privacy.
We currently operate our business in a number of jurisdictions where our operations are subject to evolving privacy or data protection laws and regulations. Certain of our cloud-based offerings also transmit and store customer data in various jurisdictions, which subjects the operation of that service to privacy or data protection laws and regulations in those jurisdictions. While we believe our cloud-based offerings comply with current regulatory and security requirements in the jurisdictions in which we operate these services, there can be no assurance that such requirements will not change or that we will not otherwise be subject to legal or regulatory actions. In addition, our appliances, when configured by our customers, may intercept and examine data in a manner that may subject the use of those appliances to privacy and data protection laws and regulations in those jurisdictions in which our customers operate.
Any failure or perceived failure by us or by our products or services to comply with these laws and regulations may subject us to legal or regulatory actions, damage our reputation or adversely affect our ability to sell our products or services in the jurisdiction that has enacted the law or regulation. Moreover, if these laws and regulations change, or are interpreted and applied in a manner that is inconsistent with our data practices or the operation of our products and services, we may need to expend resources in order to change our business operations, data practices or the manner in which our products or services operate. This could adversely affect our business, financial condition and results of operations.
-36-
Table of Contents
We and our service providers may also be subject to privacy laws and regulations related to telemarketing, such as the U.S. Telephone Consumer Protection Act, the U.S. Telemarketing Sales Rule, and international and state equivalents; and telephone call monitoring, such as the U.S. Wiretap Act and international and state equivalents. Such laws and regulations create a patchwork of compliance obligations that regularly change and may require us to expend resources to change our business operations to comply with the changes and may affect our ability to generate sales. Any failure by us or our service providers to comply with these laws and regulations may subject us to costly regulatory investigations and class action litigation, which could impact our financial condition.
Our business is subject to the risks of product defects, warranty claims, product returns and product liability.
Our products are highly complex and may contain undetected operating errors or quality problems, particularly when first introduced or as new versions or upgrades are released. Despite testing by us and by current and potential customers, errors or quality problems may not be found in our products or product updates until after commencement of commercial shipments, resulting in customer dissatisfaction and loss of or delay in market acceptance and sales opportunities. This could materially adversely affect our operating results. These errors and quality problems could also cause us to incur significant repair or replacement costs, divert the attention of our engineering personnel from our product development efforts and cause significant customer relations problems. We may also incur significant costs in connection with a product recall and any related indemnification obligations, which could materially adversely affect our operating results. In addition, many of our products operate on our internally developed operating system, and any error in the operating system may affect those products. We have experienced errors or quality problems in the past in connection with products and enhancements to existing products. We expect that errors or quality problems will be found from time to time in our products after commencement of commercial shipments, which could seriously harm our business.
Historically, the amount of warranty claims we have received has not been significant, but there are no assurances that the amount of such claims will not be material in the future. Since our customers install our appliances directly into their network infrastructures, any errors, defects or other problems with our products could negatively impact their networks or other Internet users, resulting in financial or other losses. While we typically seek by contract to limit our exposure to damages, liability limitation provisions in our standard terms and conditions of sale, and those of our channel partners, may not be enforceable under some circumstances or may not fully or effectively protect us from customer claims and related liabilities and costs, including indemnification obligations under our agreements with channel partners or customers. The sale and support of our products also entail the risk of product liability claims. We maintain insurance to protect against certain types of claims associated with the use of our products, but our insurance coverage may not adequately cover any such claims. In addition, even claims that ultimately are unsuccessful could require us to incur costs in connection with litigation and divert management’s time and other resources, and could seriously harm the reputation of our business and products.
We must attract, assimilate and retain key personnel on a cost-effective basis.
We depend on our ability to attract and retain highly qualified and skilled personnel on an ongoing basis. Our success will depend in part on our ability to recruit and retain key personnel. Changes in our executives and other high-level personnel may disrupt our business and could result in other employees leaving our Company.
The majority of our U.S.-based employees, including our executives, are employed on an “at-will” basis, which may make it easier for key employees to move to new employment. Our inability to timely hire replacement or additional employees may impact our operations, since new hires frequently require extensive training before they achieve desired levels of productivity. In addition, we may increase our hiring in locations outside of the U.S., which could subject us to additional geopolitical and exchange rate risks.
Competition for highly skilled personnel is often intense, especially in the San Francisco Bay Area, where we have a substantial presence and need for highly skilled personnel. We may not be successful in attracting, integrating, or retaining qualified personnel to fulfill our current or future needs. Also, to the extent we hire
-37-
Table of Contents
personnel from competitors, we may be subject to allegations that they have been improperly solicited, or that they have divulged proprietary or other confidential information, or that their former employers own their inventions or other work product.
Our future performance also depends on the continued services and continuing contributions of our senior management to execute our business plan and to identify and pursue new opportunities and product innovations. The loss of services of members of senior management could significantly delay or prevent the achievement of our strategic objectives, which could adversely affect our business, financial condition and results of operations.
We could be subject to additional tax liabilities.
We are subject to federal, state, local and sales taxes in the United States and foreign income taxes, withholding taxes and transaction taxes in numerous foreign jurisdictions. Significant judgment is required in evaluating our tax positions and our worldwide provision for taxes. During the ordinary course of business, there are many activities and transactions for which the ultimate tax determination is uncertain. For example, the Predecessor’s acquisition by Thoma Bravo in 2012 and the Bain Acquisition, as well as our recent acquisitions of Elastica and Perspecsys, each involved complex tax structuring, consequences and determinations. In addition, our tax obligations and effective tax rates could be adversely affected by changes in the relevant tax, accounting and other laws, regulations, principles and interpretations, including those relating to income tax nexus, by recognizing tax losses or lower than anticipated earnings in jurisdictions where we have lower statutory rates and higher than anticipated earnings in jurisdictions where we have higher statutory rates, by changes in foreign currency exchange rates, or by changes in the valuation of our deferred tax assets and liabilities. We may be audited in various jurisdictions, and such jurisdictions may assess additional taxes, sales taxes and value-added taxes against us. Although we believe our tax estimates are reasonable, the final determination of any tax audits or litigation could be materially different from our historical tax provisions and accruals, which could have a material adverse effect on our operating results or cash flows in the period or periods for which a determination is made.
The enactment of legislation implementing changes in the U.S. taxation of international business activities or the adoption of other tax reform policies could materially impact our financial position and results of operations.
Recent changes to U.S. tax laws, including limitations on the ability of taxpayers to claim and utilize foreign tax credits and the deferral of certain tax deductions until earnings outside of the United States are repatriated to the United States, as well as changes to U.S. tax laws that may be enacted in the future, possibly with retroactive effect, could impact the tax treatment of our foreign earnings. Due to expansion of our international business activities, any changes in the U.S. taxation of such activities may increase our worldwide effective tax rate and adversely affect our financial condition and results of operations.
If we fail to maintain an effective system of disclosure controls and internal control over financial reporting, our ability to produce timely and accurate financial statements or comply with applicable regulations could be impaired.
As a public company, we will be required to maintain internal control over financial reporting and to report any material weaknesses in such internal controls. Section 404 of the Sarbanes-Oxley Act requires that we evaluate and determine the effectiveness of our internal control over financial reporting and, beginning with our second annual report following this offering, provide a management report on internal control over financial reporting. However, while we remain an emerging growth company, we will not be required to include an attestation report on internal control over financial reporting issued by our independent registered public accounting firm.
Any failure to develop or maintain effective controls, or any difficulties encountered in their implementation or improvement, could harm our operating results, cause us to fail to meet our reporting obligations, result in a
-38-
Table of Contents
restatement of our financial statements for prior periods or adversely affect the results of management evaluations and independent registered public accounting firm audits of our internal control over financial reporting that we will eventually be required to include in our periodic reports that will be filed with the SEC. Ineffective disclosure controls and procedures and internal control over financial reporting could also cause investors to lose confidence in our reported financial and other information, which would likely have a negative effect on the trading price of our common stock.
We are in the process of designing and implementing the internal control over financial reporting required to comply with Section 404 of the Sarbanes-Oxley Act of 2002, as amended (the “Sarbanes-Oxley Act”). This process will be time consuming, costly and complicated. If we are unable to assert that our internal control over financial reporting is effective, or when required in the future, if our independent registered public accounting firm is unable to express an opinion as to the effectiveness of our internal control over financial reporting, investors may lose confidence in the accuracy and completeness of our financial reports, the market price of our common stock could be adversely affected and we could become subject to investigations by the stock exchange on which our securities are listed, the SEC, or other regulatory authorities, which could require additional financial and management resources.
If we fail to comply with environmental requirements, our business, financial condition, operating results, and reputation could be adversely affected.
Our operations and the sale of our products are subject to various federal, state, local and foreign environmental and safety regulations, including laws adopted by the European Union, such as the Waste Electrical and Electronic Equipment Directive (“WEEE Directive”), and the Restriction of the Use of Certain Hazardous Substances in Electrical and Electronic Equipment Directive (“EU RoHS Directive”) of certain metals from global hot spots. The WEEE Directive requires electronic goods producers to be responsible for marking, collection, recycling, and treatment of such products. Changes in the WEEE Directive of the interpretation thereof may cause us to incur additional costs or meet additional regulatory requirements, which could be material.
The EU RoHS Directive and similar laws of other jurisdictions limit the content of certain hazardous materials such as lead, mercury, and cadmium in the manufacture of electrical equipment, including our products. Currently, our products comply with the EU RoHS Directive requirements. However, if there are changes to this or other laws, or to their interpretation, or if new similar laws are passed in other jurisdictions, we may be required to reengineer our products or to use different components to comply with these regulations. This reengineering or component substitution could result in substantial costs to us or disrupt our operations or logistics.
We are also subject to environmental laws and regulations governing the management of hazardous materials, which we use in small quantities in our engineering labs. Our failure to comply with past, present, and future environmental and safety laws could result in increased costs, reduced sales of our products, substantial product inventory write-offs, reputational damage, penalties, third party property damage, remediation costs and other sanctions, any of which could harm our business and financial condition. To date, our expenditures for environmental compliance have not had a material impact on our results of operations or cash flows, and although we cannot predict the future impact of such laws or regulations, they will likely result in additional costs and may increase penalties associated with violations or require us to change the content of our products or how they are manufactured, which could have a material adverse effect on our business, financial condition our results of operations. We also expect that our business will be affected by new environmental laws and regulations on an ongoing basis, which may be more stringent, imposing greater compliance costs and increasing risks and penalties associated with violations which could harm our business.
Our operations could be significantly hindered by the occurrence of a natural disaster, terrorist attack or other catastrophic event.
Our business operations are susceptible to outages due to fire, floods, power loss, telecommunications failures, terrorist attacks and other events beyond our control, and our sales opportunities may also be affected by
-39-
Table of Contents
such events. In addition, a substantial portion of our facilities, including our headquarters, are located in Northern California, an area susceptible to earthquakes. We do not carry earthquake insurance for earthquake-related losses. Despite our implementation of network security measures, our servers are vulnerable to computer viruses, break-ins, and similar disruptions from unauthorized tampering with our computer systems. We may not carry sufficient business interruption insurance to compensate us for losses that may occur as a result of any of these events. To the extent that such events disrupt our business or the business of our current or prospective customers, or adversely impact our reputation, such events could adversely affect our business, financial condition and results of operations.
Risks Related to Ownership of Our Common Stock and this Offering
Our Sponsor will continue to have significant influence over us after this offering, including control over decisions that require the approval of stockholders, which could limit your ability to influence the outcome of matters submitted to stockholders for a vote.
We are currently controlled, and after this offering is completed will continue to be controlled, by the Sponsor. Upon completion of this offering, investment funds affiliated with the Sponsor will beneficially own % of our outstanding common stock (or % if the underwriters exercise in full their option to purchase additional shares from us). As long as the Sponsor owns or controls at least a majority of our outstanding voting power, it will have the ability to exercise substantial control over all corporate actions requiring stockholder approval, irrespective of how our other stockholders may vote, including the election and removal of directors and the size of our board of directors, any amendment of our certificate of incorporation or bylaws, or the approval of any merger or other significant corporate transaction, including a sale of substantially all of our assets. Even if its ownership falls below 50%, the Sponsor will continue to be able to strongly influence or effectively control our decisions.
Additionally, the Sponsor’s interests may not align with the interests of our other stockholders. The Sponsor is in the business of making investments in companies and may acquire and hold interests in businesses that compete directly or indirectly with us. The Sponsor may also pursue acquisition opportunities that may be complementary to our business, and, as a result, those acquisition opportunities may not be available to us.
Following this offering, our audit committee will be responsible for reviewing all related party transactions for potential conflict of interest situations and approving all such transactions. See “Certain Relationships and Related Party Transactions—Policies and Procedures for Related Party Transactions.” Our audit committee will consist of directors who are “independent” as required by SEC and NYSE rules, subject to the permitted phase-in period afforded by such rules. In addition, our code of ethics, following this offering, will contain provisions designed to address conflicts of interest. However, such provisions may not be effective in limiting the Sponsor’s significant influence over us. Further, our restated certificate of incorporation after this offering will provide that, to the fullest extent permitted by law, the doctrine of “corporate opportunity” will not apply to the Sponsor and its officers, directors, and other related parties in a manner that would prohibit them from investing in competing businesses or doing business with our partners or customers.
Certain of our directors have relationships with the Sponsor, which may cause conflicts of interest with respect to our business.
Following this offering, of our directors will be affiliated with the Sponsor. Our Sponsor-affiliated directors have fiduciary duties to us and, in addition, have duties to the Sponsor. As a result, these directors may face real or apparent conflicts of interest with respect to matters affecting both us and the Sponsor, whose interests may be adverse to ours in some circumstances.
-40-
Table of Contents
Upon the listing of our shares, we will be a “controlled company” within the meaning of the rules of the NYSE and, as a result, will qualify for, and intend to rely on, exemptions from certain corporate governance requirements; you will not have the same protections afforded to stockholders of companies that are subject to such requirements.
Because our Sponsor will continue to control a majority of the voting power of our outstanding common stock after completion of this offering, we will be a “controlled company” within the meaning of the corporate governance standards of the NYSE. Under these rules, a company of which more than 50% of the voting power for the election of directors is held by an individual, group or another company is a “controlled company” and may elect not to comply with certain corporate governance requirements, including the requirements that, within one year of the date of the listing of our common stock:
| • | we have a board of directors that is composed of a majority of “independent directors,” as defined under the rules of the NYSE; |
| • | we have a compensation committee that is composed entirely of independent directors; and |
| • | we have a nominating and governance committee that is composed entirely of independent directors. |
Provisions of our corporate governance documents could make an acquisition of our company more difficult and may prevent attempts by our stockholders to replace or remove our current management, even if beneficial to our stockholders.
In addition to the Sponsor’s beneficial ownership of a controlling percentage of our common stock, our certificate of incorporation and bylaws and the Delaware General Corporation Law (the “DGCL”) contain provisions that could make it more difficult for a third party to acquire us, even if doing so might be beneficial to our stockholders.
These provisions include:
| • | the division of our board of directors into three classes and the election of each class for three-year terms; |
| • | advance notice requirements for stockholder proposals and director nominations; |
| • | the ability of the board of directors to fill a vacancy created by the expansion of the board of directors; |
| • | the ability of our board of directors to issue new series of, and designate the terms of, preferred stock, without stockholder approval, which could be used to, among other things, institute a rights plan that would have the effect of significantly diluting the stock ownership of a potential hostile acquirer, likely preventing acquisitions that have not been approved by our board of directors; |
| • | limitations on the ability of stockholders to call special meetings and to take action by written consent following the date that investment funds advised by affiliates of Bain Capital, LP no longer beneficially own a majority of our common stock; and |
| • | the required approval of holders of at least 75% of the voting power of the outstanding shares of our capital stock to adopt, amend or repeal certain provisions of our certificate of incorporation and bylaws or remove directors for cause, in each case following the date that investment funds advised by affiliates of Bain Capital, LP no longer beneficially own a majority of our common stock. |
In addition, Section 203 of the DGCL may affect the ability of an “interested stockholder” to engage in certain business combinations, for a period of three years following the time that the stockholder becomes an “interested stockholder.” While we have elected in our certificate of incorporation not to be subject to Section 203 of the DGCL, our certificate of incorporation contains provisions that have the same effect as Section 203 of the DGCL, except that they provide that investment funds advised by affiliates of Bain Capital, LP will not be deemed to be an “interested stockholder,” and accordingly will not be subject to such restrictions.
-41-
Table of Contents
These provisions may frustrate or prevent any attempts by our stockholders to replace or remove our current management by making it more difficult for stockholders to replace members of our board. Because our board of directors is responsible for appointing the members of our management team, these provisions could in turn affect any attempt to replace current members of our management team. As a result, you may lose your ability to sell your stock for a price in excess of the prevailing market price due to these protective measures, and efforts by stockholders to change the direction or management of the Company may be unsuccessful. See “Description of Capital Stock.”
Our restated certificate of incorporation after this offering will designate courts in the State of Delaware as the sole and exclusive forum for certain types of actions and proceedings that may be initiated by our stockholders, which could limit our stockholders’ ability to obtain a favorable judicial forum for disputes with us or our directors, officers or employees.
Our restated certificate of incorporation will provide that, subject to limited exceptions, the Court of Chancery of the State of Delaware will be the sole and exclusive forum for:
| • | any derivative action or proceeding brought on our behalf; |
| • | any action asserting a claim of breach of a fiduciary duty owed by any of our directors, officers or other employees to us or our stockholders; |
| • | any action asserting a claim against us arising pursuant to any provision of the DGCL, our certificate of incorporation or our bylaws; |
| • | any action to interpret, apply, enforce or determine the validity of our certificate of incorporation or bylaws; or |
| • | any other action asserting a claim against us that is governed by the internal affairs doctrine (each, a “Covered Proceeding”). |
In addition, our restated certificate of incorporation will provide that if any action the subject matter of which is a Covered Proceeding is filed in a court other than the specified Delaware courts without the approval of our board of directors (each, a “Foreign Action”), the claiming party will be deemed to have consented to (i) the personal jurisdiction of the specified Delaware courts in connection with any action brought in any such courts to enforce the exclusive forum provision described above and (ii) having service of process made upon such claiming party in any such enforcement action by service upon such claiming party’s counsel in the Foreign Action as agent for such claiming party.
Any person or entity purchasing or otherwise acquiring any interest in shares of our capital stock shall be deemed to have notice of and to have consented to these provisions. These provisions may limit a stockholder’s ability to bring a claim in a judicial forum that it finds favorable for disputes with us or our directors, officers or other employees, which may discourage such lawsuits against us and our directors, officers and employees. Alternatively, if a court were to find these provisions of our certificate of incorporation inapplicable to, or unenforceable in respect of, one or more of the specified types of actions or proceedings, we may incur additional costs associated with resolving such matters in other jurisdictions, which could adversely affect our business and financial condition.
If you purchase shares of common stock in this offering, you will suffer immediate and substantial dilution of your investment.
The initial public offering price of our common stock is substantially higher than the net tangible book deficit per share of our common stock. Therefore, if you purchase shares of our common stock in this offering, you will pay a price per share that substantially exceeds our net tangible book deficit per share after this offering. Based on an assumed initial public offering price of $ per share, which is the midpoint of the price range on the cover of this prospectus, you will experience immediate dilution of $ per share, representing the difference between our as adjusted net tangible book deficit per share after giving effect to this offering and the initial public offering price. In addition, purchasers of common stock in this offering will have contributed % of the aggregate price
-42-
Table of Contents
paid by all purchasers of our stock but will own only approximately % of our common stock outstanding after this offering. We also have a large number of outstanding stock options to purchase common stock with exercise prices that are below the estimated initial public offering price of our common stock. To the extent that these options are exercised, you will experience further dilution. See “Dilution” for more detail.
Your percentage ownership in us may be diluted by future issuances of capital stock, which could reduce your influence over matters on which stockholders vote.
Pursuant to our certificate of incorporation and bylaws, our board of directors has the authority, without stockholder approvals, to issue all or any part of our authorized but unissued shares of common stock, including shares issuable upon the exercise of options, or shares of our authorized but unissued preferred stock. Issuances of common stock or voting preferred stock would reduce your influence over matters on which our stockholders vote and, in the case of issuances of preferred stock, would likely result in your interest in us being subject to the prior rights of holders of that preferred stock.
Market volatility may affect the price of our common stock and the value of your investment.
Following the completion of this offering, the price of our common stock is likely to be volatile, in part because our shares of common stock have not been previously traded publicly. The initial public offering price was determined by negotiations between us and the representatives for the underwriters. You may not be able to resell your shares of common stock above the initial public offering price and may suffer a loss on your investment. In addition, the price of our common stock may fluctuate significantly in response to a number of factors, most of which we cannot predict or control, including:
| • | actual or anticipated changes or fluctuations in our operating results and whether our operating results meet the expectations of securities analysts or investors; |
| • | actual or anticipated changes in securities analysts’ estimates and expectations of our financial performance; |
| • | announcements of new solutions, commercial relationships, acquisitions or other events by us or our competitors; |
| • | general market conditions, including volatility in the market price and trading volume of technology companies in general and of companies in the IT security industry in particular; |
| • | changes in how current and potential customers perceive the effectiveness of our platform in protecting against advanced cyber-attacks or other reputational harm; |
| • | sales of large blocks of our common stock, including sales by our executive officers, directors and significant stockholders; |
| • | announced departures of any of our key personnel; |
| • | lawsuits threatened or filed against us or involving our industry, or both; |
| • | changing legal or regulatory developments in the United States and other countries; |
| • | general economic conditions and trends; and |
| • | other events or factors, including those resulting from major catastrophic events, war, acts of terrorism or responses to these events. |
In addition, the stock markets have experienced extreme price and volume fluctuations that have affected and continue to affect the market prices of equity securities of many technology companies. Stock prices of many technology companies have fluctuated in a manner unrelated or disproportionate to the operating performance of those companies. In the past, stockholders have instituted securities class action litigation following periods of market volatility. If we were to become involved in securities litigation, it could subject us to substantial costs, divert resources and the attention of management from our business and adversely affect our business, operating results, financial condition and cash flows.
-43-
Table of Contents
An active, liquid trading market for our common stock may not develop, which may limit your ability to sell your shares.
Prior to this offering, there was no public market for our common stock. Although we intend to apply to list our common stock on the NYSE under the symbol “BLCT,” an active trading market for our shares may never develop or be sustained following this offering. The initial public offering price will be determined by negotiations between us and the underwriters and may not be indicative of market prices of our common stock that will prevail in the open market after the offering. A public trading market having the desirable characteristics of depth, liquidity and orderliness depends upon the existence of willing buyers and sellers at any given time, and its existence is dependent upon the individual decisions of buyers and sellers over which neither we nor any market maker has control. The failure of an active and liquid trading market to develop and continue would likely have a material adverse effect on the value of our common stock. The market price of our common stock may decline below the initial public offering price, and you may not be able to sell your shares of our common stock at or above the price you paid in this offering, or at all. An inactive market may also impair our ability to raise capital to continue to fund operations by selling shares and may impair our ability to acquire other companies or technologies by using our shares as consideration.
As a public company, we will become subject to additional laws, regulations and stock exchange listing standards, which will impose additional costs on us and may strain our resources and divert our management’s attention.
After this offering, we will be subject to the reporting requirements of the Securities Exchange Act of 1934, as amended (the “Exchange Act”), the Sarbanes-Oxley Act, the Dodd-Frank Act, the listing requirements of the NYSE, and other applicable securities laws and regulations. Compliance with these laws and regulations will increase our legal and financial compliance costs and make some activities more difficult, time-consuming or costly. For example, the Exchange Act will require us, among other things, to file annual, quarterly and current reports with respect to our business and operating results. We also expect that being a public company and being subject to new rules and regulations will make it more expensive for us to obtain director and officer liability insurance, and we may be required to accept reduced coverage or incur substantially higher costs to obtain coverage. These factors may therefore strain our resources, divert management’s attention and affect our ability to attract and retain qualified board members.
A significant portion of our total outstanding shares are restricted from immediate resale but may be sold into the market in the near future. This could cause the market price of our common stock to drop significantly, even if our business is doing well.
Sales of a substantial number of shares of our common stock in the public market could occur at any time. These sales, or the perception in the market that the holders of a large number of shares intend to sell shares, could reduce the market price of our common stock. After this offering, we will have outstanding shares of common stock based on the number of shares outstanding as of , 2016. This assumes no exercises of outstanding options after , 2016. Substantially all of the shares that are not being sold in this offering will be subject to a 180-day lock-up period provided under agreements executed in connection with this offering. These shares will, however, be able to be resold after the expiration of the lock-up agreements described in the “Shares Eligible for Future Sale” section of this prospectus. We also intend to file a Form S-8 under the Securities Act to register all shares of common stock that we may issue under our equity compensation plans. In addition, our Sponsor has certain demand registration rights that could require us in the future to file registration statements in connection with sales of our stock by our Sponsor. See “Certain Relationships and Related Party Transactions—Stockholders’ Agreement.” Such sales by our Sponsor could be significant. Once we register these shares, they can be freely resold in the public market, subject to legal or contractual restrictions, such as the lock-up agreements described in the “Underwriters” section of this prospectus. As restrictions on resale end, the market price of our stock could decline if the holders of currently restricted shares sell them or are perceived by the market as intending to sell them.
-44-
Table of Contents
Since we have no current plans to pay regular cash dividends on our common stock following this offering, you may not receive any return on investment unless you sell your common stock for a price greater than that which you paid for it.
We do not anticipate paying any regular cash dividends on our common stock following this offering. Any decision to declare and pay dividends in the future will be made at the discretion of our board of directors and will depend on, among other things, our results of operations, financial condition, cash requirements, contractual restrictions and other factors that our board may deem relevant. In addition, our ability to pay dividends is, and may be, limited by covenants of existing and any future outstanding indebtedness we or our subsidiaries incur, including under our Senior Secured Credit Facilities and the indentures governing our outstanding notes. Therefore, any return on investment in our common stock is solely dependent upon the appreciation of the price of our common stock on the open market, which may not occur. See “Dividend Policy” for more detail.
If securities or industry analysts do not publish research or reports about our business, if they adversely change their recommendations regarding our shares or if our results of operations do not meet their expectations, our share price and trading volume could decline.
The trading market for our shares will be influenced by the research and reports that industry or securities analysts publish about us or our business. We do not have any control over these analysts. If one or more of these analysts cease coverage of our company or fail to publish reports on us regularly, we could lose visibility in the financial markets, which in turn could cause our share price or trading volume to decline. Moreover, if one or more of the analysts who cover our Company downgrade our stock or senior notes, or if our results of operations do not meet their expectations, our share price could decline.
We are an “emerging growth company,” and the reduced disclosure requirements applicable to emerging growth companies may make our common stock less attractive to investors.
We are an “emerging growth company,” as defined in the JOBS Act, and may remain an emerging growth company for up to five years. For so long as we remain an emerging growth company, we are permitted and intend to rely on exemptions from certain disclosure requirements that are applicable to other public companies that are not emerging growth companies. These exemptions include not being required to comply with the auditor attestation requirements of Section 404 of the Sarbanes-Oxley Act, or Section 404, not being required to comply with any requirement that may be adopted by the Public Company Accounting Oversight Board regarding mandatory audit firm rotation or a supplement to the auditor’s report providing additional information about the audit and the financial statements, reduced disclosure obligations regarding executive compensation and exemptions from the requirements of holding a nonbinding advisory vote on executive compensation and shareholder approval of any golden parachute payments not previously approved. In this prospectus, we have not included all of the executive compensation-related information that would be required if we were not an emerging growth company. We cannot predict whether investors will find our common stock less attractive if we rely on these exemptions. If some investors find our common stock less attractive as a result, there may be a less active trading market for our common stock and our stock price may be more volatile.
In addition, the JOBS Act provides that an emerging growth company can take advantage of an extended transition period for complying with new or revised accounting standards. This allows an emerging growth company to delay the adoption of certain accounting standards until those standards would otherwise apply to private companies. We have irrevocably elected not to avail ourselves of this exemption from new or revised accounting standards and, therefore, we will be subject to the same new or revised accounting standards as other public companies that are not emerging growth companies. We will incur increased costs as a result of operating as a public company, and our management will be required to devote substantial time to new compliance initiatives and corporate governance practices.
-45-
Table of Contents
SPECIAL NOTE REGARDING FORWARD-LOOKING STATEMENTS
This prospectus contains forward-looking statements. Forward-looking statements are neither historical facts nor assurances of future performance. Instead, they are based on our current beliefs, expectations and assumptions regarding the future of our business, future plans and strategies, and other future conditions. These forward-looking statements speak only as of the date of this prospectus and are subject to a number of risks, uncertainties and assumptions described in the “Risk Factors” section and elsewhere in his prospectus. Forward-looking statements can be identified by words such as “anticipate,” “believe,” “envision,” “estimate,” “expect,” “intend,” “may,” “plan,” “predict,” “project,” “target,” “potential,” “will,” “would,” “could,” “should,” “continue,” “contemplate” and other similar expressions, although not all forward-looking statements contain these identifying words. Examples of forward-looking statements include, among others, statements we make regarding:
| • | plans to develop and offer new products and services and enter new markets; |
| • | our expectations with respect to the continued stability and growth of our customer base; |
| • | expectations with respect to future growth opportunities in domestic and international markets; |
| • | changes in and expectations with respect to revenues, including our expectation that we will continue to have meaningful visibility into future revenue; |
| • | our expectation regarding the impact of recent strategic acquisitions; |
| • | investments or potential investments in acquired businesses and technologies, as well as internally developed technologies; |
| • | the effectiveness of our sales force, distribution channel, and marketing activities; |
| • | the success of our business strategy and changes in our business model and operations; |
| • | the growth and development of our direct and indirect channels of distribution; |
| • | our response to emerging and future enterprise security risks; |
| • | risks associated with fluctuations in exchange rates of the foreign currencies in which we conduct business; |
| • | the impact of macroeconomic conditions on our business; and |
| • | the adequacy of our capital resources to fund operations and growth. |
We may not actually achieve the plans, intentions or expectations disclosed in our forward-looking statements, and you should not place undue reliance on our forward-looking statements. Actual results or events could differ materially from the plans, intentions and expectations disclosed in the forward-looking statements we make. Important factors that could cause actual results and events to differ materially from those indicated in the forward-looking statements include, among others, those described under “Risk Factors” and the following:
| • | the information technology security market is rapidly evolving within the increasingly challenging cyber threat landscape and the industry might not develop as we anticipate; |
| • | our business depends substantially on our ability to retain customers and to expand our offerings to them, and a decline in our customer retention or in our ability to expand sales to existing customers rates could harm our future operating results; |
| • | if we are unable to successfully expand our sales force while maintaining sales productivity, sales of our products and services and the growth of our business and financial performance could be harmed; |
| • | if we are unable to increase sales of our products and services to new customers, our future revenue and operating results will be harmed; |
-46-
Table of Contents
| • | our operating results may fluctuate significantly, be difficult to predict and may not meet investor expectations; |
| • | the markets in which we compete are intensely competitive and certain of our competitors have greater resources and experience; |
| • | our sales cycles can be long and unpredictable, and our sales efforts require considerable time and expense; |
| • | we have experienced net losses in recent periods and may not achieve or maintain profitability in the future. |
| • | our gross margin is affected by a number of factors, and we may not be able to sustain it at present levels; |
| • | our business and operations have experienced rapid growth, and if we do not appropriately manage future growth, our business, financial condition, results of operations and prospects may be adversely affected; |
| • | our substantial indebtedness could adversely affect our financial condition; and |
| • | other factors described under “Risk Factors.” |
The forward-looking statements in this prospectus represent our views as of the date of this prospectus. We undertake no obligation to publicly update any forward-looking statements whether as a result of new information, future developments or otherwise.
MARKET, INDUSTRY AND OTHER DATA
We obtained market, industry and other data in this prospectus from our own internal estimates and research as well as from industry and general publications and research, surveys and studies conducted by third parties, including IDC, Gartner, Forrester and Infinity Research Limited (“Technavio”). The Gartner Report(s) described herein, (the “Gartner Report(s)”) represent(s) research opinion or viewpoints published, as part of a syndicated subscription service, by Gartner, Inc. (“Gartner”), and are not representations of fact. Each Gartner Report speaks as of its original publication date (and not as of the date of this prospectus) and the opinions expressed in the Gartner Report(s) are subject to change without notice. Industry publications, studies and surveys generally state that they have been obtained from sources believed to be reliable, although they do not guarantee the accuracy or completeness of such information. While we believe that each of these studies and publications is reliable, we have not independently verified market and industry data from third-party sources. While we believe our internal company research is reliable and the market definitions are appropriate, neither such research nor these definitions have been verified by any independent source.
Several trademarks and tradenames appear in this prospectus. “Blue Coat,” “CacheFlow,” “ProxySG,” and “PacketShaper” are the exclusive properties of Blue Coat Systems, Inc., are registered with the U.S. Patent and Trademark Office, and may be registered or pending registration in other countries. Other trademarks and tradenames are used in this prospectus, which identify other entities claiming the marks and names of their products. We disclaim proprietary interest in such marks and names of others. Solely for convenience, the trademarks, service marks and trade names referred to in this prospectus are listed without the ®, (TM) and (sm) symbols, but we will assert, to the fullest extent under applicable law, our rights or the rights of the applicable licensors to these trademarks, service marks and trade names.
-47-
Table of Contents
We estimate that the net proceeds to us from the sale of shares of our common stock in this offering will be approximately $ , based upon the assumed initial public offering price of $ per share, which is the midpoint of the estimated offering price range set forth on the cover page of this prospectus, and after deducting estimated underwriting discounts and commissions and estimated offering expenses payable by us. If the underwriters’ option to purchase additional shares of our common stock from us is exercised in full, we estimate that the net proceeds to us would be approximately $ million, after deducting estimated underwriting discounts and commissions and estimated offering expenses payable by us.
Each $1.00 increase or decrease in the assumed initial public offering price of $ per share, which is the midpoint of the estimated offering price range set forth on the cover page of this prospectus, would increase or decrease, as applicable, the net proceeds to us from the sale of shares of our common stock in this offering by $ million, assuming that the number of shares offered by us, as set forth on the cover page of this prospectus, remains the same and after deducting estimated underwriting discounts and commissions and estimated offering expenses payable by us. Similarly, each increase or decrease of 1.0 million shares in the number of shares offered by us would increase or decrease, as applicable, the net proceeds to us from the sale of shares of our common stock in this offering by approximately $ million, assuming the assumed initial public offering price remains the same, and after deducting underwriting discounts and commissions and estimated offering expenses payable by us.
We intend to use a portion of the anticipated net proceeds from this offering to repay certain of our existing indebtedness. We intend to use the remainder of the net proceeds from this offering, if any, for working capital and other general corporate purposes. We may also, in our discretion, use a portion of the net proceeds for the acquisition of, or investment in, businesses, products, services, or technologies that complement our business, although we have no current commitments or agreements to enter into any acquisitions or investments. We will have broad discretion over the uses of the net proceeds of this offering.
-48-
Table of Contents
Following completion of the offering, our board of directors does not currently intend to pay dividends on our common stock. We currently intend to retain any future earnings to fund business development and growth, and we do not expect to pay any dividends in the foreseeable future. Any future determination to declare cash dividends will be made at the discretion of our board of directors, subject to applicable laws, and will depend on a number of factors, including our financial condition, results of operations, capital requirements, contractual restrictions, general business conditions and other factors that our board of directors may deem relevant. Currently, the provisions of our Senior Secured Credit Facilities place certain limitations on the amount of cash dividends we can pay. See “Description of Indebtedness.” On June 28, 2013, the Predecessor paid a dividend totaling $155.2 million in the aggregate to stockholders of record of its Class A, Class B and Class C common stock.
-49-
Table of Contents
The following table sets forth our cash and cash equivalents, as well as our capitalization, as of April 30, 2016:
| • | on an actual basis; |
| • | on a pro forma basis, giving effect to the sale by us of shares of our common stock in this offering, based upon the assumed initial public offering price of $ per share, which is the midpoint of the estimated offering price range set forth on the cover page of this prospectus, after deducting estimated underwriting discounts and commissions and the estimated offering expenses payable by us, and the application of the net proceeds from this offering to repay $ million of our long-term indebtedness and as otherwise described in “Use of Proceeds”. |
You should read this table together with our consolidated financial statements and related notes, and the sections titled “Selected Consolidated Financial Data” and “Management’s Discussion and Analysis of Financial Condition and Results of Operations” that are included elsewhere in this prospectus.
| As of April 30, 2016 | ||||||||
| Actual | Pro Forma | |||||||
| (in thousands, except share data) | ||||||||
| Consolidated Balance Sheet Data: |
||||||||
| Cash and cash equivalents |
$ | 136,563 | $ | |||||
|
|
|
|||||||
| Current and long-term debt, net of borrowing costs |
$ | 1,785,374 | ||||||
|
|
|
|||||||
| Stockholders’ Equity: |
||||||||
| Common stock: $0.001 par value; 150,000,000 shares authorized; 91,172,391 shares issued and outstanding at April 30, 2016 and shares issued and outstanding pro forma |
91 | |||||||
| Additional paid-in capital |
900,440 | |||||||
| Accumulated other comprehensive loss |
(1,908 | ) | ||||||
| Accumulated deficit |
(271,604 | ) | ||||||
|
|
|
|||||||
| Total stockholders’ equity |
627,019 | |||||||
|
|
|
|||||||
| Total capitalization |
$ | 2,412,393 | ||||||
|
|
|
|||||||
A $1.00 increase (decrease) in the assumed initial public offering price of $ per share, the midpoint of the price range set forth on the cover of this prospectus, would increase (decrease) the pro forma amount of each of cash and cash equivalents, additional paid-in capital and total stockholders’ equity by approximately $ million after deducting underwriting discounts and estimated offering expenses payable by us.
-50-
Table of Contents
If you invest in our common stock in this offering, your ownership interest will be diluted to the extent of the difference between the initial public offering price per share of our common stock and the pro forma net tangible book value per share of our common stock immediately after this offering. Net tangible book value dilution per share to new investors represents the difference between the amount per share paid by purchasers of shares of our common stock in this offering and the pro forma net tangible book value per share of our common stock immediately after completion of this offering.
Pro forma net tangible book value per share is determined by dividing our total tangible assets less our total liabilities by the number of shares of our common stock outstanding. Our pro forma net tangible book value as of was $ , or $ per share, based on the total number of shares of our common stock outstanding as of .
After giving effect to the sale by us of shares of our common stock in this offering at the assumed initial public offering price of $ per share, which is the midpoint of the estimated offering price range set forth on the cover page of this prospectus, and after deducting estimated underwriting discounts and commissions and estimated offering expenses payable by us, our pro forma net tangible book value as of would have been $ million, or $ per share. This represents an immediate increase in pro forma net tangible book value of $ per share to our existing stockholders and an immediate dilution in pro forma net tangible book value of $ per share to investors purchasing shares of our common stock in this offering at the assumed initial public offering price. The following table illustrates this dilution:
| Assumed initial public offering price per share |
$ | |||||||
| Pro forma net tangible book value per share as of |
$ | |||||||
| Increase in pro forma net tangible book value per share attributable to new investors in this offering |
||||||||
|
|
|
|||||||
| Pro forma net tangible book value per share immediately after this offering |
$ | |||||||
|
|
|
|||||||
| Dilution in pro forma net tangible book value per share to new investors in this offering |
$ |
Each $1.00 increase or decrease in the assumed initial public offering price of $ per share, which is the midpoint of the estimated offering price range set forth on the cover page of this prospectus, would increase or decrease, as applicable, our pro forma net tangible book value per share immediately after this offering by $ , and would increase or decrease, as applicable, dilution per share to new investors in this offering by $ , assuming that the number of shares offered by us, as set forth on the cover page of this prospectus, remains the same and after deducting estimated underwriting discounts and commissions payable by us. Similarly, each increase or decrease of 1.0 million shares in the number of shares offered by us would increase or decrease, as applicable, our pro forma net tangible book value by approximately $ per share and increase or decrease, as applicable, the dilution to new investors by $ per share, assuming the assumed initial public offering price remains the same, and after deducting underwriting discounts and commissions payable by us.
If the underwriters’ option to purchase additional shares of our common stock from us is exercised in full, the pro forma as adjusted net tangible book value per share of our common stock, as adjusted to give effect to this offering, would be $ per share, and the dilution in pro forma net tangible book value per share to new investors in this offering would be $ per share.
-51-
Table of Contents
The following table presents, as of , the differences between the existing stockholders and the new investors purchasing shares of our common stock in this offering with respect to the number of shares purchased from us, the total consideration paid or to be paid to us, which includes net proceeds received from the issuance of shares of our common stock and the average price per share paid or to be paid to us at the assumed initial public offering price of $ per share, which is the midpoint of the estimated offering price range set forth on the cover page of this prospectus, before deducting estimated underwriting discounts and commissions and estimated offering expenses payable by us:
| Shares Purchased | Total Consideration | Average Price | ||||||||||||||||
| Number | Percent | Amount | Percent | Per Share | ||||||||||||||
| Existing stockholders |
% | $ | % | $ | ||||||||||||||
| New investors |
% | % | ||||||||||||||||
| Total |
100 | % | $ | 100 | % | $ | ||||||||||||
Each $1.00 increase or decrease in the assumed initial public offering price of $ per share, which is the midpoint of the estimated offering price range set forth on the cover page of this prospectus, would increase or decrease, as applicable, the total consideration paid by new investors and total consideration paid by all stockholders by approximately $ million, assuming that the number of shares offered by us, as set forth on the cover page of this prospectus, remains the same and after deducting estimated underwriting discounts and commissions and estimated offering expenses payable by us.
If the underwriters’ option to purchase additional shares of our common stock were exercised in full, our existing stockholders would own % and our new investors would own % of the total number of shares of our common stock outstanding upon the completion of this offering.
The number of shares of our common stock that will be outstanding after this offering is based on shares of our common stock outstanding as of , and excludes:
| • | shares of our common stock issuable upon the exercise of options to purchase shares of our common stock outstanding as of , with a weighted-average exercise price of $ per share; |
| • | shares of our common stock reserved for future issuance under our stock-based compensation plans, consisting of (i) shares of common stock reserved for future awards under our 2015 Amended and Restated Equity Incentive Plan as of (which will terminate as of the completion of this offering and no awards will be granted under our 2015 Amended and Restated Equity Incentive Plan thereafter), and (ii) shares of common stock reserved for issuance under our , which will become effective on the date of this prospectus. |
To the extent that any outstanding options to purchase our common stock are exercised, or new awards are granted under our equity compensation plans, there will be further dilution to investors participating in this offering.
-52-
Table of Contents
SELECTED CONSOLIDATED FINANCIAL DATA
As a result of the Bain Acquisition, which occurred on May 22, 2015, we applied purchase accounting and a new basis of accounting beginning on the date of the acquisition. We refer to ourselves as Predecessor in the periods before the Bain Acquisition and Successor in the periods after.
The selected consolidated statements of operations and balance sheet data presented below as of April 30, 2015 and for the two years then ended and the period from May 1, 2015 to May 22, 2015 relate to the Predecessor and are derived from audited consolidated financial statements that are included in this prospectus. The selected consolidated statements of operations data for the period from May 23, 2015 to April 30, 2016, and the consolidated balance sheet data as of April 30, 2016, relate to the Successor and are derived from audited consolidated financial statements that are included in this prospectus.
Although the period from May 1, 2015 to May 22, 2015 relates to the Predecessor and the period from May 23, 2015 to April 30, 2016 relates to the Successor, in order to assist in the period to period comparison we have combined these periods as a sum of the amounts without any other adjustments and refer to the combined period as the combined year ended April 30, 2016.
The unaudited consolidated financial statements were prepared on a basis consistent with our audited financial statements and include all adjustments, consisting of normal and recurring adjustments that we consider necessary for a fair presentation of the financial position and results of operations as of and for such periods. Operating results for the periods presented are not necessarily indicative of the results that may be expected in future periods. The following selected consolidated financial data should be read with “Management’s Discussion and Analysis of Financial Condition and Results of Operations” and our consolidated financial statements and related notes included elsewhere in this prospectus.
-53-
Table of Contents
| Predecessor | Successor | |||||||||||||||||||||
|
Year Ended April 30, |
Period from May 1 to May 22, 2015 |
Period from May 23, 2015 to April 30, 2016 |
(Combined) Year Ended April 30, 2016 |
|||||||||||||||||||
| 2014 | 2015 | |||||||||||||||||||||
| (In thousands, except per share data) | (Unaudited) | |||||||||||||||||||||
| Net revenue: |
||||||||||||||||||||||
| Product |
$ | 319,232 | $ | 274,373 | $ | 7,032 | $ | 306,787 | $ | 313,819 | ||||||||||||
| Service and subscription |
287,240 | 356,910 | 22,446 | 262,072 | 284,518 | |||||||||||||||||
|
|
|
|
|
|
|
|
|
|
|
|||||||||||||
| Total net revenue |
606,472 | 631,283 | 29,478 | 568,859 | 598,337 | |||||||||||||||||
|
|
|
|
|
|
|
|
|
|
|
|||||||||||||
| Cost of net revenue: |
||||||||||||||||||||||
| Product(2) |
106,188 | 106,904 | 4,687 | 131,119 | 135,806 | |||||||||||||||||
| Service and subscription(2) |
56,447 | 53,682 | 3,069 | 66,642 | 69,711 | |||||||||||||||||
|
|
|
|
|
|
|
|
|
|
|
|||||||||||||
| Total cost of net revenue |
162,635 | 160,586 | 7,756 | 197,761 | 205,517 | |||||||||||||||||
|
|
|
|
|
|
|
|
|
|
|
|||||||||||||
| Gross profit |
443,837 | 470,697 | 21,722 | 371,098 | 392,820 | |||||||||||||||||
|
|
|
|
|
|
|
|
|
|
|
|||||||||||||
| Operating expenses: |
||||||||||||||||||||||
| Sales and marketing(2) |
193,661 | 190,288 | 12,024 | 229,094 | 241,118 | |||||||||||||||||
| Research and development(2) |
110,886 | 110,591 | 7,050 | 124,317 | 131,367 | |||||||||||||||||
| General and administrative(2) |
69,266 | 68,131 | 21,649 | 126,520 | 148,169 | |||||||||||||||||
| Amortization of intangible assets |
37,814 | 33,111 | 1,738 | 121,019 | 122,757 | |||||||||||||||||
| Change in fair value of acquisition-related earn-out liability |
9,698 | — | — | (970 | ) | (970 | ) | |||||||||||||||
| Restructuring and other charges |
3,020 | 1,130 | — | 2,857 | 2,857 | |||||||||||||||||
|
|
|
|
|
|
|
|
|
|
|
|||||||||||||
| Total operating expenses |
424,345 | 403,251 | 42,461 | 602,837 | 645,298 | |||||||||||||||||
|
|
|
|
|
|
|
|
|
|
|
|||||||||||||
| Operating income (loss) |
19,492 | 67,446 | (20,739 | ) | (231,739 | ) | (252,478 | ) | ||||||||||||||
| Interest income |
44 | 38 | 1 | 143 | 144 | |||||||||||||||||
| Interest expense |
(63,015 | ) | (66,434 | ) | (3,986 | ) | (99,386 | ) | (103,372 | ) | ||||||||||||
| Debt extinguishment and refinancing costs |
(11,100 | ) | — | — | (3,406 | ) | (3,406 | ) | ||||||||||||||
| Other expense, net |
(1,973 | ) | (1,376 | ) | (349 | ) | (759 | ) | (1,108 | ) | ||||||||||||
|
|
|
|
|
|
|
|
|
|
|
|||||||||||||
| Loss before income taxes |
(56,552 | ) | (326 | ) | (25,073 | ) | (335,147 | ) | (360,220 | ) | ||||||||||||
| Income tax provision (benefit) |
(5,221 | ) | 15,104 | (7,596 | ) | (63,543 | ) | (71,139 | ) | |||||||||||||
|
|
|
|
|
|
|
|
|
|
|
|||||||||||||
| Net loss |
(51,331 | ) | (15,430 | ) | (17,477 | ) | (271,604 | ) | $ | (289,081 | ) | |||||||||||
|
|
|
|||||||||||||||||||||
| Cumulative dividends earned on Class A Common Stock |
(34,535 | ) | (32,838 | ) | (2,112 | ) | — | |||||||||||||||
|
|
|
|
|
|
|
|
|
|||||||||||||||
| Net loss attributable to common stockholders |
$ | (85,866 | ) | $ | (48,268 | ) | $ | (19,589 | ) | $ | (271,604 | ) | ||||||||||
|
|
|
|
|
|
|
|
|
|||||||||||||||
| Net loss per share attributable to common stockholders:(1) |
||||||||||||||||||||||
| Basic and diluted |
$ | (0.90 | ) | $ | (0.49 | ) | $ | (0.20 | ) | $ | (3.09 | ) | ||||||||||
|
|
|
|
|
|
|
|
|
|||||||||||||||
| Weighted-average shares used to compute net loss per share attributable to common stockholders:(1) |
||||||||||||||||||||||
| Basic and diluted |
95,082 | 97,927 | 98,376 | 87,823 | ||||||||||||||||||
|
|
|
|
|
|
|
|
|
|||||||||||||||
| (1) | Net loss per share information is not presented for the combined year ended April 30, 2016 due to changes in capital structure resulting from the Bain Acquisition on May 22, 2015. |
-54-
Table of Contents
| (2) | Includes stock-based compensation expense as follows: |
| Predecessor | Successor | |||||||||||||||||||||
| Year Ended April 30, | Period from May 1 to May 22, 2015 |
Period from May 23, 2015 to April 30, 2016 |
(Combined) Year Ended April 30, 2016 |
|||||||||||||||||||
| 2014 | 2015 | |||||||||||||||||||||
| (In thousands) | (Unaudited) | |||||||||||||||||||||
| Cost of product |
$ | 1 | $ | 22 | $ | 15 | $ | 76 | $ | 91 | ||||||||||||
| Cost of service and subscription |
21 | 90 | 44 | 484 | 528 | |||||||||||||||||
| Sales and marketing |
386 | 514 | 621 | 5,395 | 6,016 | |||||||||||||||||
| Research and development |
219 | 476 | 386 | 2,801 | 3,187 | |||||||||||||||||
| General and administrative |
2,612 | 1,594 | 2,585 | 10,158 | 12,743 | |||||||||||||||||
|
|
|
|
|
|
|
|
|
|
|
|||||||||||||
| Total stock-based compensation expense |
$ | 3,239 | $ | 2,696 | $ | 3,651 | $ | 18,914 | $ | 22,565 | ||||||||||||
|
|
|
|
|
|
|
|
|
|
|
|||||||||||||
| Predecessor | Successor | |||||||||
| (In thousands) | April 30, 2015 | April 30, 2016 | ||||||||
| Consolidated Balance Sheet Data: |
||||||||||
| Cash and cash equivalents |
$ | 202,665 | $ | 136,563 | ||||||
| Working capital |
92,949 | (20,337 | ) | |||||||
| Total assets |
1,558,581 | 3,001,607 | ||||||||
| Current and long-term deferred revenue |
353,943 | 364,223 | ||||||||
| Current and long-term debt, net of borrowing costs |
1,047,847 | 1,785,374 | ||||||||
| Total liabilities |
1,515,503 | 2,374,588 | ||||||||
| Total stockholders’ equity |
43,078 | 627,019 | ||||||||
Non-GAAP Financial Measures
In addition to our results determined in accordance with GAAP, we believe the following non-GAAP measures are useful in evaluating our operating performance because, in the case of adjusted product revenue, adjusted service and subscription revenue, adjusted net revenue and adjusted deferred revenue, they exclude the impact of purchase accounting, which we believe aids in the period to period comparability of our revenue and financial outlook of our business. In the case of adjusted EBITDA, we exclude certain material non-cash items and certain other adjustments we believe are not reflective of our ongoing operations. We believe adjusted EBITDA is a measure commonly used by investors to evaluate companies in our industry. Accordingly, we use these non-GAAP financial measures to measure our financial performance for business planning purposes and to compare our performance to that of our competitors.
| Predecessor | Successor | |||||||||||||||||||||
| Year Ended April 30, | Period from May 1 to May 22, 2015 |
Period from May 23, 2015 to April 30, 2016 |
(Combined) Year Ended April 30, 2016 |
|||||||||||||||||||
| 2014 | 2015 | |||||||||||||||||||||
| (In thousands) | (Unaudited) | (Unaudited) | (Unaudited) | (Unaudited) | ||||||||||||||||||
| Adjusted product revenue |
$ | 319,528 | $ | 274,930 | $ | 7,081 | $ | 312,494 | $ | 319,575 | ||||||||||||
| Adjusted service and subscription revenue |
312,240 | 367,954 | 22,778 | 413,021 | 435,799 | |||||||||||||||||
| Adjusted net revenue |
631,768 | 642,884 | 29,859 | 725,515 | 755,374 | |||||||||||||||||
| Adjusted EBITDA |
183,179 | 196,468 | 7,190 | 215,658 | 222,848 | |||||||||||||||||
| Adjusted deferred revenue ending balance |
305,846 | 359,079 | 347,797 | 443,818 | 443,818 | |||||||||||||||||
-55-
Table of Contents
Adjusted product revenue, adjusted service and subscription revenue and adjusted net revenue. We define adjusted product revenue, adjusted service and subscription revenue and adjusted net revenue, as product revenue, service and subscription revenue, and net revenue, respectively, excluding the impact of purchase accounting. We regularly monitor these measures to assess our operating performance. On February 15, 2012, in connection with the Thoma Bravo Acquisition, and on May 22, 2015, as part of the Bain Acquisition, we were required to write down our deferred revenue balances due to purchase accounting in accordance with GAAP. In addition, in connection with our other acquisitions, we were also required to make similar adjustments to write down our deferred revenue balances due to purchase accounting in accordance with GAAP. See “Management’s Discussion and Analysis of Financial Condition and Results of Operations—Impact of Purchase Accounting Related to Mergers and Acquisitions.” The impact on revenue related to purchase accounting as a result of these transactions, particularly as a result of the Bain Acquisition, limits the comparability of our revenue between periods. While the deferred revenue written down in connection with our acquisitions will never be recognized as revenue under GAAP, we do not expect the Bain Acquisition to have an impact on future renewal rates of the contracts included within the deferred revenue write-down, nor do we expect revenue generated from new service and subscription contracts to be similarly impacted by purchase accounting adjustments. Accordingly, we believe presenting adjusted product revenue, adjusted service and subscription revenue and adjusted net revenue to exclude the impact of purchase accounting adjustments, including the deferred revenue write-down, aids in the comparability between periods and in assessing our overall operating performance. If these adjustments were not made, our future revenue growth rates could appear overstated. Adjusted product revenue, adjusted service and subscription revenue and adjusted net revenue have limitations as analytical tools, and you should not consider them in isolation or as substitutes for product revenue, service and subscription revenue or net revenue. Other companies in our industry may calculate these measures differently, which may limit their usefulness as a comparative measure.
Adjusted EBITDA. We regularly monitor adjusted EBITDA, as it is a measure we use to assess our operating performance. We define adjusted EBITDA as net income or loss, excluding the impact of purchase accounting on net revenue, amortization of intangible assets and purchased technology, litigation costs, depreciation expense, acquisition write-up of acquired inventory sold, stock-based compensation expense, restructuring and other charges, acquisition fair value adjustments to earn outs, acquisition transaction costs, acquisition integration, transition, retention and other costs, financial sponsor and debt fees, interest expense, net, debt extinguishment and refinancing costs, other expense, net, and income tax provision (benefit). Adjusted EBITDA has limitations as an analytical tool, and you should not consider it in isolation or as a substitute for analysis of our results as reported under GAAP. Some of these limitations are:
| • | although depreciation and amortization are non-cash charges, the assets being depreciated and amortized may have to be replaced in the future, and adjusted EBITDA does not reflect cash capital expenditure requirements for such replacements or for new capital expenditure requirements; |
| • | adjusted EBITDA excludes the impact of the write-down of deferred revenue due to purchase accounting in connection with our acquisition, and therefore includes revenue that will never be recognized under GAAP; |
| • | adjusted EBITDA does not reflect changes in, or cash requirements for, our working capital needs; |
| • | adjusted EBITDA does not reflect the significant interest expense, or the cash requirements necessary to service interest or principal payments, on our debt; |
| • | adjusted EBITDA does not reflect tax payments that may represent a reduction in cash available to us; and |
| • | other companies, including companies in our industry, may calculate adjusted EBITDA differently, which reduces its usefulness as a comparative measure. |
Because of these limitations, you should consider adjusted EBITDA alongside other financial performance measures, including net income (loss) and our other GAAP results. In evaluating adjusted EBITDA, you should be aware that in the future we may incur expenses that are the same as or similar to some of the adjustments in
-56-
Table of Contents
this presentation. Our presentation of adjusted EBITDA should not be construed as an inference that our future results will be unaffected by the types of items excluded from the calculation of adjusted EBITDA. Adjusted EBITDA is not a presentation made in accordance with GAAP and the use of the term varies from others in our industry.
Adjusted deferred revenue. We regularly monitor adjusted deferred revenue, as it provides visibility into our anticipated future revenue, primarily for our support and subscription contracts which we generally invoice in full up front and recognize revenue over the contract term, and is a key component in other measures we track to measure our financial performance. We define adjusted deferred revenue as deferred revenue, excluding the write-down of deferred revenue in connection with our acquisitions. While the deferred revenue written down in connection with our acquisitions will never be recognized as revenue under GAAP, we do not expect the Bain Acquisition to have an impact on future renewal rates of the contracts included within the deferred revenue write-down, nor do we expect revenue generated from new service and subscription contracts to be similarly impacted by purchase accounting adjustments. Accordingly, we believe presenting adjusted deferred revenue to exclude the impact of purchase accounting adjustments, including the deferred revenue write-down, aids in the comparability between periods. If these adjustments were not made, our future revenue growth rates could appear overstated. Adjusted deferred revenue has limitations as an analytical tool, and you should not consider it in isolation or as a substitute for deferred revenue. Other companies in our industry may calculate this measure differently, which may limit its usefulness as a comparative measure.
The foregoing financial measures are not intended to represent and should not be considered as alternatives to revenue, net income, operating income or any other performance measures derived in accordance with GAAP as measures of financial performance or operating cash flows or as measures of liquidity.
Reconciliation of Non-GAAP Financial Measures
The following tables reconcile the most directly comparable GAAP financial measure to each of these non-GAAP financial measures.
| Predecessor | Successor | |||||||||||||||||||||
| Year Ended April 30, | Period from May 1 to May 22, 2015 |
Period from May 23, 2015 to April 30, 2016 |
(Combined) Year Ended April 30, 2016 |
|||||||||||||||||||
| 2014 | 2015 | |||||||||||||||||||||
| (In thousands) | (Unaudited) | (Unaudited) | (Unaudited) | (Unaudited) | ||||||||||||||||||
| Product revenue |
$ | 319,232 | $ | 274,373 | $ | 7,032 | $ | 306,787 | $ | 313,819 | ||||||||||||
| Impact of purchase accounting on product revenue(1) |
296 | 557 | 49 | 5,707 | 5,756 | |||||||||||||||||
|
|
|
|
|
|
|
|
|
|
|
|||||||||||||
| Adjusted product revenue |
$ | 319,528 | $ | 274,930 | $ | 7,081 | $ | 312,494 | $ | 319,575 | ||||||||||||
|
|
|
|
|
|
|
|
|
|
|
|||||||||||||
| Service and subscription revenue |
$ | 287,240 | $ | 356,910 | $ | 22,446 | $ | 262,072 | $ | 284,518 | ||||||||||||
| Impact of purchase accounting on service and subscription revenue(1) |
25,000 | 11,044 | 332 | 150,949 | 151,281 | |||||||||||||||||
|
|
|
|
|
|
|
|
|
|
|
|||||||||||||
| Adjusted service and subscription revenue |
$ | 312,240 | $ | 367,954 | $ | 22,778 | $ | 413,021 | $ | 435,799 | ||||||||||||
|
|
|
|
|
|
|
|
|
|
|
|||||||||||||
| Net revenue |
$ | 606,472 | $ | 631,283 | $ | 29,478 | $ | 568,859 | $ | 598,337 | ||||||||||||
| Impact of purchase accounting on net revenue(1) |
25,296 | 11,601 | 381 | 156,656 | 157,037 | |||||||||||||||||
|
|
|
|
|
|
|
|
|
|
|
|||||||||||||
| Adjusted net revenue |
$ | 631,768 | $ | 642,884 | $ | 29,859 | $ | 725,515 | $ | 755,374 | ||||||||||||
|
|
|
|
|
|
|
|
|
|
|
|||||||||||||
-57-
Table of Contents
| Predecessor | Successor | |||||||||||||||||||||
| Year Ended April 30, | Period from May 1 to May 22, 2015 |
Period from May 23, 2015 to April 30, 2016 |
(Combined) Year Ended April 30, 2016 |
|||||||||||||||||||
| 2014 | 2015 | |||||||||||||||||||||
| (In thousands) | (Unaudited) | (Unaudited) | (Unaudited) | (Unaudited) | ||||||||||||||||||
| Net income (loss) |
$ | (51,331 | ) | $ | (15,430 | ) | $ | (17,477 | ) | $ | (271,604 | ) | $ | (289,081 | ) | |||||||
| Impact of purchase accounting on net revenue(1) |
25,296 | 11,601 | 381 | 156,656 | 157,037 | |||||||||||||||||
| Amortization of intangible assets and purchased technology |
80,050 | 77,006 | 4,314 | 161,012 | 165,326 | |||||||||||||||||
| Litigation costs |
960 | 4,423 | — | 9,468 | 9,468 | |||||||||||||||||
| Depreciation expense |
16,315 | 18,440 | 1,632 | 18,806 | 20,438 | |||||||||||||||||
| Acquisition write-up of acquired inventory sold(2) |
189 | — | — | 29,210 | 29,210 | |||||||||||||||||
| Stock-based compensation expense |
3,239 | 2,696 | 3,651 | 18,914 | 22,565 | |||||||||||||||||
| Restructuring and other charges |
3,020 | 1,130 | — | 2,857 | 2,857 | |||||||||||||||||
| Acquisition fair value adjustments to earn-outs(3) |
9,698 | — | — | (970 | ) | (970 | ) | |||||||||||||||
| Acquisition transaction costs(4) |
1,662 | 1,223 | 15,865 | 14,552 | 30,417 | |||||||||||||||||
| Acquisition integration, transition, retention and other costs(5) |
18,874 | 8,024 | 1,831 | 30,586 | 32,417 | |||||||||||||||||
| Financial sponsor and debt fees |
4,384 | 4,479 | 255 | 6,306 | 6,561 | |||||||||||||||||
| Interest expense, net |
62,971 | 66,396 | 3,985 | 99,243 | 103,228 | |||||||||||||||||
| Debt extinguishment and refinancing costs |
11,100 | — | — | 3,406 | 3,406 | |||||||||||||||||
| Other expense, net |
1,973 | 1,376 | 349 | 759 | 1,108 | |||||||||||||||||
| Income tax provision (benefit) |
(5,221 | ) | 15,104 | (7,596 | ) | (63,543 | ) | (71,139 | ) | |||||||||||||
|
|
|
|
|
|
|
|
|
|
|
|||||||||||||
| Adjusted EBITDA |
$ | 183,179 | $ | 196,468 | $ | 7,190 | $ | 215,658 | $ | 222,848 | ||||||||||||
|
|
|
|
|
|
|
|
|
|
|
|||||||||||||
| (1) | In connection with the Thoma Bravo Acquisition, the Bain Acquisition, and other acquisitions, we were required to write down our deferred revenue balances to fair value in purchase accounting in accordance with GAAP. See “Management’s Discussion and Analysis of Financial Condition and Results of Operations—Impact of Purchase Accounting Related to Mergers and Acquisitions.” Recording deferred revenue at fair value in purchase accounting had the effect of reducing acquired deferred revenue and thereby reducing the recognition of revenue in subsequent periods as compared to the amounts we would have otherwise recognized. |
| (2) | In connection with the Thoma Bravo Acquisition, the Bain Acquisition, and other acquisitions, we were required to write up our inventory balances to fair value in purchase accounting in accordance with GAAP. Recording inventory at fair value in purchase accounting had the effect of increasing inventory and thereby increasing the cost of revenue in subsequent periods as compared to the amounts we would have otherwise recognized. The acquisition write-up of acquired inventory sold represents the incremental cost of revenue that was recognized as a result of purchase accounting. |
| (3) | Acquisition earn-outs are required to be recorded at the acquisition-date fair value in purchase accounting, and re-measured at fair value in each subsequent period. Changes in fair value in subsequent periods are required to be recorded in earnings in the consolidated statement of operations in accordance with GAAP. The acquisition fair value adjustments to earn-outs adjustment represents the change in fair value recorded in earnings in the consolidated statement of operations in subsequent periods. |
| (4) | Acquisition transaction costs include financial advisory, legal and accounting professional services costs incurred as a result of our acquisitions during the period. |
-58-
Table of Contents
| (5) | Acquisition integration, transition, retention and other costs are employee-related integration, transition and retention costs, and the amortization of the write-up of our operating leases, that are incurred as a result of our acquisitions during the period. |
| Predecessor | Successor | |||||||||||||||||||||
| Year Ended April 30, | Period from May 1 to May 22, 2015 |
Period from May 23, 2015 to April 30, 2016 |
(Combined) Year Ended April 30, 2016 |
|||||||||||||||||||
| 2014 | 2015 | |||||||||||||||||||||
| (In thousands) | (Unaudited) | (Unaudited) | (Unaudited) | (Unaudited) | ||||||||||||||||||
| Deferred revenue beginning balance |
$ | 211,697 | $ | 289,109 | $ | 353,943 | $ | 343,042 | $ | 353,943 | ||||||||||||
| Acquisition write-down of deferred revenue beginning balance(6) |
37,406 | 16,737 | 5,136 | 4,755 | 5,136 | |||||||||||||||||
|
|
|
|
|
|
|
|
|
|
|
|||||||||||||
| Adjusted deferred revenue beginning balance |
$ | 249,103 | $ | 305,846 | $ | 359,079 | $ | 347,797 | $ | 359,079 | ||||||||||||
|
|
|
|
|
|
|
|
|
|
|
|||||||||||||
| Deferred revenue ending balance |
$ | 289,109 | $ | 353,943 | $ | 343,042 | $ | 364,223 | $ | 364,223 | ||||||||||||
| Acquisition write-down of deferred revenue ending balance(6) |
16,737 | 5,136 | 4,755 | 79,595 | 79,595 | |||||||||||||||||
|
|
|
|
|
|
|
|
|
|
|
|||||||||||||
| Adjusted deferred revenue ending balance |
$ | 305,846 | $ | 359,079 | $ | 347,797 | $ | 443,818 | $ | 443,818 | ||||||||||||
|
|
|
|
|
|
|
|
|
|
|
|||||||||||||
| Change in adjusted deferred revenue |
$ | 56,743 | $ | 53,233 | $ | (11,282 | ) | $ | 96,021 | $ | 84,739 | |||||||||||
|
|
|
|
|
|
|
|
|
|
|
|||||||||||||
| (6) | In connection with the Thoma Bravo Acquisition, the Bain Acquisition, and other acquisitions, we were required to write down our deferred revenue balances to fair value in purchase accounting in accordance with GAAP. See “Management’s Discussion and Analysis of Financial Condition and Results of Operations—Impact of Purchase Accounting Related to Mergers and Acquisitions.” Recording deferred revenue at fair value in purchase accounting had the effect of reducing acquired deferred revenue. The acquisition write-down of deferred revenue balance represents the adjustment to deferred revenue on the consolidated balance sheet as a result of purchase accounting. |
-59-
Table of Contents
MANAGEMENT’S DISCUSSION AND ANALYSIS OF
FINANCIAL CONDITION AND RESULTS OF OPERATIONS
The following Management’s Discussion and Analysis of Financial Condition and Results of Operations should be read together with our consolidated financial statements and accompanying notes included elsewhere within this prospectus. This discussion includes both historical information and forward-looking information that involves risk, uncertainties and assumptions. Our actual results may differ materially from management’s expectations as a result of various factors, including, but not limited to, those discussed in the section entitled “Risk Factors” and “Special Note Regarding Forward Looking Statements”.
Overview
We are a leading provider of advanced web security solutions for global enterprises and governments. We offer the leading web gateway product with enterprise features and scalability to secure the enterprise and its users. We operated as a public company listed on NASDAQ until our acquisition by Thoma Bravo, LLC in February 2012 and subsequent acquisition by funds controlled by Bain Capital Investors, LLC in May 2015.
We generate revenue from sales of our products, services and subscriptions. Our advanced web security solutions include: Advanced Web and Cloud Security, Advanced Threat Protection, Encrypted Traffic Management, Incident Response, Analytics and Forensics, Web Application Protection, and Network Performance and Optimization. We support and enhance the functionality of our products through our Global Intelligence Network, a part of our subscription services, which offers global threat intelligence sharing amongst our customers to provide a globally distributed, real-time threat identification and analysis network. We primarily market and sell our products and solutions through a direct-touch, channel-leveraged model, which includes solution providers, system integrators, value added resellers, and distributors worldwide whom we refer to as our channel partners. Substantially all of our sales are completed through our network of approximately 2,000 channel partners. When we sell our products, we generally recognize revenue up front, provided all revenue recognition criteria have been met. Our service and subscription revenue primarily consists of sales of new and renewal support contracts, software and subscriptions and cloud-based security-as-a-service solutions. For services and subscription sales, we recognize revenue over the term of the contract, provided all revenue recognition criteria have been met.
Since 2012, we have focused our investment on security product innovation and expanding our product portfolio. We have expanded our offerings from our core secure web gateway and performance products to include our Cloud-Delivered Secure Web Gateway, Encrypted Traffic Management, Incident Response, Analytics & Forensics, Advanced Threat Protection, Web Application Protection, and Cloud Access Security Broker offerings, which together provide our customers with a comprehensive suite of solutions that enhance our leading web security capabilities. We have expanded our portfolio of products through six technology acquisitions since 2012, and have invested alongside these acquisitions with research and development to enhance their capabilities and integrate them into our platform.
We have optimized and expanded our go-to-market model. We have made substantial investments in our sales force and have a disciplined approach to our sales strategy, which has allowed us to grow our business profitably over time. Over the past three years, we have grown our direct-touch salesforce to over 600 employees worldwide and have realigned our channel partner go-to-market strategy. This realignment allowed us to concentrate our sales efforts through a smaller number of higher quality and more focused channel partners. Our direct-touch, channel-leveraged model allows us to use our experienced sales force and the broad reach of our over 2,000 channel partners to expand our footprint in our existing customers’ environment and also capture new customers. During the year ended April 30, 2016, we added over 700 new customers.
These investments have translated into recent strong revenue growth. During the years ended April 30, 2016, 2015 and 2014, our net revenue, excluding the impact of purchase accounting, which we refer to as
-60-
Table of Contents
adjusted net revenue, was $755.4 million, $642.9 million and $631.8 million, respectively, representing year-over-year growth in fiscal 2016 and fiscal 2015 of approximately 17% and 2%, respectively. Our net revenue in fiscal 2016, 2015 and 2014, which includes the impact of purchase accounting, was $598.3 million, $631.3 million and $606.5 million, respectively. In fiscal 2014 there was approximately $50 million more refresh product revenue than fiscal 2015, related to the expected wind-down from our SWG 8100 refresh program.
Our business has historically experienced a major product refresh cycle approximately once every five years, as hardware appliances reach end of life. Customers typically refresh their installed base of our hardware appliance products with our latest equipment, replacing older versions of hardware that reach the end of their useful life and are no longer supported under service contracts. Historically, these refresh cycles trigger buying cycles for new versions of our products, which typically offer greater capacity and additional features, as well as new service contracts. In 2012, we launched a refresh program for our SWG 8100, our high-end ProxySG product, which we no longer supported as of March 2013 regardless of when a customer purchased this product. Following our SWG 8100 product refresh cycle in 2013, we changed the end-of-life policy for all of our hardware appliance products such that our hardware appliances now generally have an end-of-life date that is five years from the date of purchase, which we expect will extend refresh cycles over a multi-year period and reduce the impact of a product refresh cycle in any one period.
A growing portion of our revenues is shifting towards subscriptions and services. We sell our products through a combination of appliances, perpetual software licenses and software subscriptions. We have made significant investments recently in cloud- and subscription-based products through product development and technology acquisitions. We expect the proportion of our revenue derived from these offerings to continue to grow over time as we continue to leverage our direct-touch sales force to sell our newly developed and acquired products.
Nearly all of our customers enter into service contracts at the time they purchase our products. We typically bill in advance for our service and subscription contracts, which increases our deferred revenue balance and provides visibility into future revenue. Our adjusted revenue from services and subscriptions has grown from 49% of our adjusted net revenue in fiscal 2014 to 57% of our adjusted net revenue in fiscal 2015 to 58% of our adjusted net revenue in fiscal 2016, and our adjusted deferred revenue balance as of April 30, 2015 was $359.1 million and as of April 30, 2016 was $443.8 million. Our revenue from services and subscriptions, including the impact of purchase accounting, has changed from 47% of our net revenue in fiscal 2014 to 57% of our net revenue in fiscal 2015 and to 48% of our net revenue in fiscal 2016. Our deferred revenue balance as of April 30, 2015 was $353.9 million and as of April 30, 2016 was $364.2 million.
We have evolved our business while maintaining strong financial performance. As a result of our initiatives and strategic investments, our business has experienced strong growth in recent periods, while maintaining profitability and cash flows. Our adjusted EBITDA was $222.8 million, $196.5 million and $183.2 million for fiscal 2016, 2015 and 2014, respectively, representing approximately 30%, 31% and 29% of adjusted net revenue. Our net loss for fiscal 2016, which included the impact of purchase accounting adjustments related to the Bain Acquisition, fiscal 2015 and fiscal 2014 was $289.1 million, $15.4 million and $51.3 million, respectively.
Key Factors Affecting Our Performance
Customer Retention. We derive a significant and growing share of our total revenue from our existing customers, which we are able to retain at a high rate. Since fiscal 2012, we have maintained an annual customer retention rate for our top 1,000 customers of greater than 95%. Our top 1,000 customers accounted for approximately 53%, 58% and 61% of our adjusted net revenue in fiscal 2014, fiscal 2015 and fiscal 2016, respectively. We define our retention rate as the percentage of our top 1,000 customers in one fiscal year who contributed revenue to us in that fiscal year as well as in the subsequent fiscal year. We do not regularly monitor customer retention rates for customers not included within the top 1,000. We believe our installed base of customers purchase additional products from us and have a high rate of renewal for support contracts because our
-61-
Table of Contents
products are critical to them, thereby fostering strong customer loyalty. Our ability to maintain our existing customers during refresh cycles and maintain high renewal rates will have a material impact on our future financial performance. The chart below illustrates the importance of maintaining our existing customers, as the top 250 customers in fiscal 2012 continue to drive significant revenue through fiscal 2016. The chart below shows adjusted revenue derived from our top 250 customers beginning in fiscal 2012, along with the incremental amount of adjusted revenue generated from those same customers in each year thereafter through fiscal 2016.
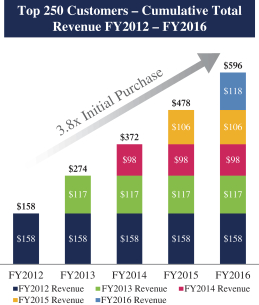
New Product Adoption. We have strategically expanded our offerings to include encryption management, advanced threat protection, cloud access security, cloud delivery, and threat intelligence, which together provide our customers with a comprehensive suite of solutions that enhance our leading web security capabilities on premises and in the cloud. We have been successful in selling new offerings to our existing customers, with over 70% of our current top 250 customers buying product lines that were introduced after fiscal 2012, including our Cloud-Delivered Secure Web Gateway, Encrypted Traffic Management, Incident Response, Analytics & Forensics, Advanced Threat Protection, Web Application Firewall, X-Series and Cloud Access Security Broker product lines. Our ability to sell products to our customers to address their needs, and our ability to upsell new products and technologies as new demands arise, will have a material impact on our future financial performance.
Sales Performance. We have made substantial investments in our sales force and have a disciplined approach to our sales strategy, which has allowed us to grow the business profitably, on an adjusted EBITDA basis. Our sales team focuses on named enterprise accounts and sells our portfolio of products into these accounts, eliminating the need for multiple, disparate touch points into our customers. We focus on our addressable market potential and our deep understanding of sales capacity per quota-carrying sales representative based on our tenured quota-carrying sales representatives and historical data, in order to set quota. We carefully manage our pipeline to determine opportunities and booking potential for future periods. Our ability to manage our sales productivity and yield are important factors to the success of our business.
Acquisition Strategy and Integration. We have a history of making targeted acquisitions that facilitate our growth by complementing our existing products and services and addressing new or adjacent market opportunities. Our ability to select the right technologies for our portfolio and integrate these acquisitions into our business will be important to our success. We believe our track record of integrating our previous six acquisitions over the past four years demonstrates our ability to successfully integrate acquisitions.
-62-
Table of Contents
Subscription-Based Offerings. We have made significant investments in cloud- and subscription-based products through product development and acquisitions, and expect the proportion of our revenue derived from these offerings to grow over time. Revenue recognition for cloud- and subscription-based products differs from revenue recognition for appliance and perpetual software licenses, in that revenue is recognized over the term of the contract for cloud and subscription products, instead of upfront in the case of appliance and perpetual software. Support, software subscriptions and cloud subscriptions typically have a term of one to three years, with average terms of approximately two years.
Impact of Purchase Accounting Related to Mergers and Acquisitions
On February 15, 2012, we were acquired by funds affiliated with Thoma Bravo, LLC, a private equity investment firm, and its co-investors and on May 22, 2015, we were acquired by funds controlled by Bain Capital Investors, LLC, a private equity investment firm, and its co-investors. As a result of these acquisitions, we were required by GAAP to record all assets and liabilities at their fair value, including our deferred revenue balances, as of the effective date of the respective acquisitions, which in some cases was different than the historical book values. In each case, adjusting our deferred revenue balance to fair value on the date of the relevant acquisition had the effect of reducing revenue from that which would have otherwise been recognized in subsequent periods.
In addition, we have acquired a number of companies and, as required by GAAP, recorded the acquired assets and liabilities at fair value on the date of acquisition, which similarly impacted deferred revenue balances and reduced revenue from that which would have otherwise been recognized in subsequent periods, including in fiscal 2014 and 2015, for the period from May 1, 2015 to May 22, 2015, and for the period from May 23, 2015 to April 30, 2016.
The impact on revenue related to purchase accounting for these acquisitions limits the comparability of our revenue between periods. As a result, we have presented adjusted net revenue, a non-GAAP financial measure, which represents the amount of revenue we would have recognized excluding the impact of purchase accounting. The table below provides a reconciliation of net revenue to adjusted net revenue for the periods indicated.
| Predecessor | Successor | |||||||||||||||||||||
| Year Ended April 30, | Period from May 1 to May 22, 2015 |
Period from May 23, 2015 to April 30, 2016 |
(Combined) Year Ended April 30, 2016 |
|||||||||||||||||||
| 2014 | 2015 | |||||||||||||||||||||
| (In thousands) | (Unaudited) | (Unaudited) | (Unaudited) | (Unaudited) | ||||||||||||||||||
| Product revenue |
$ | 319,232 | $ | 274,373 | $ | 7,032 | $ | 306,787 | $ | 313,819 | ||||||||||||
| Impact of purchase accounting on product revenue |
296 | 557 | 49 | 5,707 | 5,756 | |||||||||||||||||
|
|
|
|
|
|
|
|
|
|
|
|||||||||||||
| Adjusted product revenue |
$ | 319,528 | $ | 274,930 | $ | 7,081 | $ | 312,494 | $ | 319,575 | ||||||||||||
|
|
|
|
|
|
|
|
|
|
|
|||||||||||||
| Service and subscription revenue |
$ | 287,240 | $ | 356,910 | $ | 22,446 | $ | 262,072 | $ | 284,518 | ||||||||||||
| Impact of purchase accounting on service and subscription revenue |
25,000 | 11,044 | 332 | 150,949 | 151,281 | |||||||||||||||||
|
|
|
|
|
|
|
|
|
|
|
|||||||||||||
| Adjusted service and subscription revenue |
$ | 312,240 | $ | 367,954 | $ | 22,778 | $ | 413,021 | $ | 435,799 | ||||||||||||
|
|
|
|
|
|
|
|
|
|
|
|||||||||||||
| Net revenue |
$ | 606,472 | $ | 631,283 | $ | 29,478 | $ | 568,859 | $ | 598,337 | ||||||||||||
| Impact of purchase accounting on net revenue |
25,296 | 11,601 | 381 | 156,656 | 157,037 | |||||||||||||||||
|
|
|
|
|
|
|
|
|
|
|
|||||||||||||
| Adjusted net revenue |
$ | 631,768 | $ | 642,884 | $ | 29,859 | $ | 725,515 | $ | 755,374 | ||||||||||||
|
|
|
|
|
|
|
|
|
|
|
|||||||||||||
-63-
Table of Contents
Components of Financial Performance
Net Revenue
We generate revenue from the sales of our products, services and subscriptions. As discussed further in “Critical Accounting Policies and Estimates—Revenue Recognition” below, revenue is recognized when persuasive evidence of an arrangement exists, delivery or performance has occurred, the sales price is fixed or determinable, and collection is probable.
Our total net revenue is comprised of the following:
| • | Product revenue. Product revenue primarily consists of revenue from sales of our appliances, which primarily includes our Secure Web Gateway (including ProxySG), Encrypted Traffic Management and Network Performance Optimization product lines. Product revenue also includes our perpetual software sales and primarily includes licenses for our Incident Response, Analytics and Forensics products. We generally invoice for our product revenue up front and record revenue when the product is delivered, assuming all other revenue recognition criteria have been met. |
| • | Service and subscription revenue. Service and subscription revenue primarily consists of new and renewal support contracts, software subscriptions, cloud subscriptions, and to a lesser extent professional services and training. Virtually all of our new appliances are sold with support contracts due to our customers’ demand for support and maintenance. Our software subscriptions are primarily made up of sales of virtual appliance versions of substantially all of our hardware appliance products above. Our cloud subscriptions primarily include our Cloud-Delivered Secure Web Gateways, Cloud Access Security Broker solutions and subscriptions to our Global Intelligence Network services. Our professional services primarily include installation, implementation, training and consulting. We generally invoice in full up front for our support services, software subscriptions and cloud subscriptions, and record revenue over the life of the contract, assuming all other revenue recognition criteria have been met. Professional services are invoiced upon completion and accounted for less than 1% of net revenue in fiscal 2014, 2015 and 2016. |
Cost of Net Revenue
Our total cost of net revenue consists of cost of product revenue and cost of service and subscription revenue, which includes certain personnel and allocated costs, and amortization of acquired intangible assets. Personnel costs associated with our operations and global customer support organizations consist of salaries, benefits, bonuses, royalties and share-based compensation. Allocated costs consist of certain facilities, depreciation, benefits, recruiting, and IT costs allocated based on headcount.
| • | Cost of product revenue. Cost of product revenue primarily consists of third-party manufacturing costs of our appliances, personnel costs associated with our internal operations team, and amortization of acquired intangible assets. |
| • | Cost of service and subscription revenue. Cost of service and subscription revenue primarily consists of personnel, hosting and related costs associated with our technical support and cloud operations, and amortization of acquired intangible assets. |
Gross Margin
Gross margin, or gross profit as a percentage of net revenue, has been and will continue to be affected by a variety of factors, including the average sales price of our products, manufacturing costs, product mix, the mix of revenue between products and services, and the amount and timing of amortization of acquired intangible assets.
-64-
Table of Contents
Operating Expenses
Our operating expenses consist of sales and marketing, research and development and general and administrative expenses. In addition, we have incurred certain costs associated with our acquisitions and restructuring activities. Personnel costs are the most significant component of operating expenses and consist of salaries, benefits, bonuses, share-based compensation, and with regard to sales and marketing expense, sales commissions. We expect operating expenses to increase in absolute dollars, although they may fluctuate as a percentage of revenue from period to period, as we continue to grow to support expected demand for our products, services and subscriptions.
| • | Sales and Marketing. Sales and marketing expense consists primarily of personnel costs including commission costs. Sales and marketing expense also includes costs for market development programs, promotional and other marketing costs, travel costs, office equipment and software, depreciation of capital equipment, professional services, and allocated facilities costs. In the last 12 months, we have substantially increased the size of our sales force. We expect sales and marketing expense to continue to increase in absolute dollars as we continue to expand the size of our sales and marketing organizations in order to drive growth. |
| • | Research and Development. Research and development expense consists primarily of personnel costs. Research and development expense also includes prototype development related expenses, professional services and allocated facilities costs. We expect research and development expense to increase in absolute dollars as we continue to invest in our future products and services. |
| • | General and Administrative. General and administrative expense consists of personnel costs as well as professional services. General and administrative personnel include our executive, IT, finance, human resources, and legal organizations. Professional services consist primarily of legal, auditing, accounting, advisory and other consulting costs. We expect general and administrative expense to increase in absolute dollars following the completion of this offering due to additional legal fees and costs, and accounting, insurance, investor relations, and other costs associated with being a public company. Refer to the discussion under “Business-Legal Proceedings” for information related to pending litigation. |
| • | Amortization of Intangible Assets. Amortization of intangible assets includes the amortization of customer relationship assets associated with our acquisitions, including but not limited to the Bain Acquisition in May 2015, and the Thoma Bravo Acquisition in February 2012. |
| • | Change in Fair Value of Acquisition-related Earn-out Liability. In May 2013, we acquired the SSL Visibility business from Netronome for an upfront payment of $25.0 million followed by an additional contingent cash earn-out of $25.0 million. The initial estimated fair value of the earn-out of $8.4 million was recorded on the date of acquisition. In April 2014, the fair value of the earn-out was increased by $9.7 million to $18.1 million, and the adjustment was recognized through the consolidated statements of operations. In July 2015, we acquired Perspecsys, Inc. and estimated an acquisition date fair value of the contingent earn-out of $1.0 million, which was subsequently adjusted to zero and recognized through the consolidated statements of operations in the three months ended April 30, 2016. |
| • | Restructuring and Other Charges. In connection with certain acquisitions and global realignments intended to reduce our combined operating cost structure and eliminate operating redundancies, we incurred restructuring and other charges that primarily consisted of severance and related costs resulting from the reduction of headcount. |
Interest Income
Interest income consists of interest income earned on our cash and cash equivalents. Our cash historically has been invested in highly liquid investments such as time deposits held at major banks, commercial paper, U.S. government agency discount notes, money market mutual funds and other money market securities with maturities of 90 days or less at the date of purchase.
-65-
Table of Contents
Interest Expense
Interest expense primarily relates to outstanding indebtedness under our credit facilities and our 8.375% Senior Notes due 2023.
Debt Extinguishment and Refinancing Costs
Debt extinguishment and refinancing costs are fees associated with the refinancing of our term loans.
Other Expense, Net
Other expense, net, consists primarily of foreign currency exchange gains or losses, and non-recurring gains or losses realized outside our normal course of business.
Income Tax Provision (Benefit)
The provision for (benefit from) income taxes primarily reflects current and deferred U.S. federal and state taxes and foreign income taxes in taxable foreign jurisdictions. We have recorded a valuation allowance to reduce our deferred tax assets to the amount that is more likely than not to be realized in future periods. In addition, due to ownership change provisions of the Internal Revenue Code that limit the use of tax attributes in certain circumstances and similar state tax provisions, we have reduced our net operating losses carryforwards and credit carryforwards accordingly.
Consolidated Statements of Operations Data
On May 22, 2015, we were acquired in the Bain Acquisition. Although the period from May 1, 2015 to May 22, 2015 relates to the Predecessor and the period from May 23, 2015 to April 30, 2016 relates to the Successor, for the purpose of the comparisons below we have combined these periods as a sum of the amounts without any other adjustments and refer to the combined period as the combined year ended April 30, 2016.
-66-
Table of Contents
The following table sets forth, in dollar amounts, consolidated statements of operations data for the periods indicated:
| Predecessor | Successor | |||||||||||||||||||||
|
Year Ended April 30, |
Period from May 1 to May 22, 2015 |
Period from May 23, 2015 to April 30, 2016 |
(Combined) Year Ended April 30, 2016 |
|||||||||||||||||||
| 2014 | 2015 | |||||||||||||||||||||
| (In thousands, except per share data) | (Unaudited) | |||||||||||||||||||||
| Net revenue: |
||||||||||||||||||||||
| Product |
$ | 319,232 | $ | 274,373 | $ | 7,032 | $ | 306,787 | $ | 313,819 | ||||||||||||
| Service and subscription |
287,240 | 356,910 | 22,446 | 262,072 | 284,518 | |||||||||||||||||
|
|
|
|
|
|
|
|
|
|
|
|||||||||||||
| Total net revenue |
606,472 | 631,283 | 29,478 | 568,859 | 598,337 | |||||||||||||||||
|
|
|
|
|
|
|
|
|
|
|
|||||||||||||
| Cost of net revenue: |
||||||||||||||||||||||
| Product |
106,188 | 106,904 | 4,687 | 131,119 | 135,806 | |||||||||||||||||
| Service and subscription |
56,447 | 53,682 | 3,069 | 66,642 | 69,711 | |||||||||||||||||
|
|
|
|
|
|
|
|
|
|
|
|||||||||||||
| Total cost of net revenue |
162,635 | 160,586 | 7,756 | 197,761 | 205,517 | |||||||||||||||||
|
|
|
|
|
|
|
|
|
|
|
|||||||||||||
| Gross profit |
443,837 | 470,697 | 21,722 | 371,098 | 392,820 | |||||||||||||||||
|
|
|
|
|
|
|
|
|
|
|
|||||||||||||
| Operating expenses: |
||||||||||||||||||||||
| Sales and marketing |
193,661 | 190,288 | 12,024 | 229,094 | 241,118 | |||||||||||||||||
| Research and development |
110,886 | 110,591 | 7,050 | 124,317 | 131,367 | |||||||||||||||||
| General and administrative |
69,266 | 68,131 | 21,649 | 126,520 | 148,169 | |||||||||||||||||
| Amortization of intangible assets |
37,814 | 33,111 | 1,738 | 121,019 | 122,757 | |||||||||||||||||
| Change in fair value of acquisition-related earn-out liability |
9,698 | — | — | (970 | ) | (970 | ) | |||||||||||||||
| Restructuring and other charges |
3,020 | 1,130 | — | 2,857 | 2,857 | |||||||||||||||||
|
|
|
|
|
|
|
|
|
|
|
|||||||||||||
| Total operating expenses |
424,345 | 403,251 | 42,461 | 602,837 | 645,298 | |||||||||||||||||
|
|
|
|
|
|
|
|
|
|
|
|||||||||||||
| Operating income (loss) |
19,492 | 67,446 | (20,739 | ) | (231,739 | ) | (252,478 | ) | ||||||||||||||
| Interest income |
44 | 38 | 1 | 143 | 144 | |||||||||||||||||
| Interest expense |
(63,015 | ) | (66,434 | ) | (3,986 | ) | (99,386 | ) | (103,372 | ) | ||||||||||||
| Debt extinguishment and refinancing costs |
(11,100 | ) | — | — | (3,406 | ) | (3,406 | ) | ||||||||||||||
| Other expense, net |
(1,973 | ) | (1,376 | ) | (349 | ) | (759 | ) | (1,108 | ) | ||||||||||||
|
|
|
|
|
|
|
|
|
|
|
|||||||||||||
| Loss before income taxes |
(56,552 | ) | (326 | ) | (25,073 | ) | (335,147 | ) | (360,220 | ) | ||||||||||||
| Income tax provision (benefit) |
(5,221 | ) | 15,104 | (7,596 | ) | (63,543 | ) | (71,139 | ) | |||||||||||||
|
|
|
|
|
|
|
|
|
|
|
|||||||||||||
| Net loss |
(51,331 | ) | (15,430 | ) | (17,477 | ) | (271,604 | ) | $ | (289,081 | ) | |||||||||||
|
|
|
|||||||||||||||||||||
| Cumulative dividends earned on Class A Common Stock |
(34,535 | ) | (32,838 | ) | (2,112 | ) | — | |||||||||||||||
|
|
|
|
|
|
|
|
|
|||||||||||||||
| Net loss attributable to common stockholders |
$ | (85,866 | ) | $ | (48,268 | ) | $ | (19,589 | ) | $ | (271,604 | ) | ||||||||||
|
|
|
|
|
|
|
|
|
|||||||||||||||
| Net loss per share attributable to common stockholders: |
||||||||||||||||||||||
| Basic and diluted |
$ | (0.90 | ) | $ | (0.49 | ) | $ | (0.20 | ) | $ | (3.09 | ) | ||||||||||
|
|
|
|
|
|
|
|
|
|||||||||||||||
| Weighted-average shares used to compute net loss per share attributable to common stockholders: |
||||||||||||||||||||||
| Basic and diluted |
95,082 | 97,927 | 98,376 | 87,823 | ||||||||||||||||||
|
|
|
|
|
|
|
|
|
|||||||||||||||
-67-
Table of Contents
The following table sets forth, as a percentage of net revenue, consolidated statements of operations data for the periods indicated (totals may not foot due to rounding):
| Predecessor | Successor | |||||||||||||||||||||
| Year Ended April 30, | Period from May 1 to May 22, 2015 |
Period from May 23, 2015 to April 30, 2016 |
(Combined) Year Ended April 30, 2016 |
|||||||||||||||||||
| 2014 | 2015 | |||||||||||||||||||||
| (Unaudited) | ||||||||||||||||||||||
| Net revenue: |
||||||||||||||||||||||
| Product |
53 | % | 43 | % | 24 | % | 54 | % | 52 | % | ||||||||||||
| Service and subscription |
47 | % | 57 | % | 76 | % | 46 | % | 48 | % | ||||||||||||
| Total net revenue |
100 | % | 100 | % | 100 | % | 100 | % | 100 | % | ||||||||||||
| Cost of net revenue: |
||||||||||||||||||||||
| Product |
18 | % | 17 | % | 16 | % | 23 | % | 23 | % | ||||||||||||
| Service and subscription |
9 | % | 9 | % | 10 | % | 12 | % | 12 | % | ||||||||||||
| Total cost of net revenue |
27 | % | 25 | % | 26 | % | 35 | % | 34 | % | ||||||||||||
| Gross profit |
73 | % | 75 | % | 74 | % | 65 | % | 66 | % | ||||||||||||
| Operating expenses: |
||||||||||||||||||||||
| Sales and marketing |
32 | % | 30 | % | 41 | % | 40 | % | 40 | % | ||||||||||||
| Research and development |
18 | % | 18 | % | 24 | % | 22 | % | 22 | % | ||||||||||||
| General and administrative |
11 | % | 11 | % | 73 | % | 22 | % | 25 | % | ||||||||||||
| Amortization of intangible assets |
6 | % | 5 | % | 6 | % | 21 | % | 21 | % | ||||||||||||
| Change in fair value of acquisition-related earn-out liability |
2 | % | 0 | % | 0 | % | 0 | % | 0 | % | ||||||||||||
| Restructuring and other charges |
0 | % | 0 | % | 0 | % | 1 | % | 0 | % | ||||||||||||
| Total operating expenses |
70 | % | 64 | % | 144 | % | 106 | % | 108 | % | ||||||||||||
| Operating income (loss) |
3 | % | 11 | % | (70 | )% | (41 | )% | (42 | )% | ||||||||||||
| Interest income |
0 | % | 0 | % | 0 | % | 0 | % | 0 | % | ||||||||||||
| Interest expense |
(10 | )% | (11 | )% | (14 | )% | (17 | )% | (17 | )% | ||||||||||||
| Debt extinguishment and refinancing costs |
(2 | )% | 0 | % | 0 | % | (1 | )% | (1 | )% | ||||||||||||
| Other expense, net |
0 | % | 0 | % | (1 | )% | 0 | % | 0 | % | ||||||||||||
| Loss before income taxes |
(9 | )% | 0 | % | (85 | )% | (59 | )% | (60 | )% | ||||||||||||
| Income tax provision (benefit) |
(1 | )% | 2 | % | (26 | )% | (11 | )% | (12 | )% | ||||||||||||
| Net income (loss) |
(8 | )% | (2 | )% | (59 | )% | (48 | )% | (48 | )% | ||||||||||||
Comparison of the Fiscal Years Ended April 30, 2015 and April 30, 2016 (combined year ended April 30, 2016 is unaudited, dollars are in thousands, percentages may not foot due to rounding)
Revenue
| Year Ended April 30, | ||||||||||||||||||||||||
| 2015 | 2016 (Combined) | Change | ||||||||||||||||||||||
| Amount | % of Total Net Revenue |
Amount | % of Total Net Revenue |
Amount | % | |||||||||||||||||||
| (Unaudited) | ||||||||||||||||||||||||
| Net revenue: |
||||||||||||||||||||||||
| Product |
$ | 274,373 | 43 | % | $ | 313,819 | 52 | % | $ | 39,446 | 14 | % | ||||||||||||
| Service and subscription |
356,910 | 57 | % | 284,518 | 48 | % | (72,392 | ) | (20 | )% | ||||||||||||||
|
|
|
|
|
|
|
|||||||||||||||||||
| Total net revenue |
$ | 631,283 | 100 | % | $ | 598,337 | 100 | % | $ | (32,946 | ) | (5 | )% | |||||||||||
|
|
|
|
|
|
|
|||||||||||||||||||
-68-
Table of Contents
In connection with the Thoma Bravo Acquisition on February 15, 2012, the Bain Acquisition on May 22, 2015, and certain other acquisitions, we were required to write down our deferred revenue balances due to purchase accounting. See “—Impact of Purchase Accounting Related to Mergers and Acquisitions” above. The impact to net revenue as a result of these purchase accounting adjustments for the year ended April 30, 2015 and 2016 are shown in the table below:
| Year Ended April 30, | ||||||||||||
| 2015 | 2016 (Combined) | Change | ||||||||||
| (Unaudited) | ||||||||||||
| Impact to net revenue as a result of deferred revenue write down: |
||||||||||||
| Product |
$ | (557 | ) | $ | (5,756 | ) | $ | (5,199 | ) | |||
| Service and subscription |
(11,044 | ) | (151,281 | ) | (140,237 | ) | ||||||
|
|
|
|
|
|
|
|||||||
| Total impact to net revenue as a result of deferred revenue write down |
$ | (11,601 | ) | $ | (157,037 | ) | $ | (145,436 | ) | |||
|
|
|
|
|
|
|
|||||||
Total net revenue decreased $32.9 million, or 5%, from $631.3 million for the year ended April 30, 2015 to $598.3 million for the year ended April 30, 2016. The decrease is primarily due to the impact of the deferred revenue write down in connection with the purchase accounting adjustments, which resulted in a decrease to net revenue of $145.4 million. This decrease was partially offset by an increase of $112.5 million, driven by increases in our product and service and subscription revenues.
Product revenue increased $39.4 million, or 14%, from $274.4 million for the year ended April 30, 2015 to $313.8 million for the year ended April 30, 2016. This increase was driven by an increase of $44.6 million in product revenue, primarily due to an increase in our ProxySG product sales. This increase was partially offset by the impact of the deferred product revenue write down in connection with the purchase accounting adjustments, which resulted in a decrease of $5.2 million to product revenue.
Service and subscription revenue decreased $72.4 million, or 20%, from $356.9 million for the year ended April 30, 2015 to $284.5 million for the year ended April 30, 2016. The decrease is primarily due to the impact of the deferred revenue write down in connection with the purchase accounting adjustments, which resulted in a decrease of $140.2 million to service and subscription revenue. This decrease was partially offset by an increase of $67.8 million in service and subscription revenue, driven by increases in new support revenue of $23.8 million, support renewals of $26.7 million, and subscription and other service revenue of $17.3 million.
Cost of Net Revenue
| Year Ended April 30, | ||||||||||||||||||||||||
| 2015 | 2016 (Combined) | Change | ||||||||||||||||||||||
| Amount | Gross Margin |
Amount | Gross Margin |
Amount | % | |||||||||||||||||||
| (Unaudited) | ||||||||||||||||||||||||
| Cost of net revenue: |
||||||||||||||||||||||||
| Product |
$ | 106,904 | $ | 135,806 | $ | 28,902 | 27 | % | ||||||||||||||||
| Service and subscription |
53,682 | 69,711 | 16,029 | 30 | % | |||||||||||||||||||
|
|
|
|
|
|
|
|
|
|||||||||||||||||
| Total cost of net revenue |
$ | 160,586 | $ | 205,517 | $ | 44,931 | 28 | % | ||||||||||||||||
|
|
|
|
|
|
|
|
|
|||||||||||||||||
| Gross profit: |
||||||||||||||||||||||||
| Product |
$ | 167,469 | 61 | % | $ | 178,013 | 57 | % | $ | 10,544 | 6 | % | ||||||||||||
| Service and subscription |
303,228 | 85 | % | 214,807 | 75 | % | (88,421 | ) | (29 | )% | ||||||||||||||
|
|
|
|
|
|
|
|||||||||||||||||||
| Total gross profit |
$ | 470,697 | 75 | % | $ | 392,820 | 66 | % | $ | (77,877 | ) | (17 | )% | |||||||||||
|
|
|
|
|
|
|
|||||||||||||||||||
-69-
Table of Contents
Total cost of net revenue increased $44.9 million, or 28%, from $160.6 million for the year ended April 30, 2015 to $205.5 million for the year ended April 30, 2016. The increase in cost of revenue was partially driven by the fair value write-up to product inventory as a result of the Bain Acquisition completed on May 22, 2015. The effect of this write-up was an increase of $29.2 million to cost of net revenue in the year ended April 30, 2016 compared to the year ended April 30, 2015. Absent this effect, cost of net revenue increased $15.7 million, which is consistent with the increase in shipments during the same period.
Our overall gross margin decreased from 75% for the year ended April 30, 2015 to 66% for the year ended April 30, 2016 due primarily to the decrease in net revenues as a result of the deferred revenue write down of $145.4 million, and the increase in product costs as a result of the inventory fair value write up of $29.2 million in the year ended April 30, 2016. Excluding the impact of these purchase accounting adjustments, overall gross margin would have increased from 75% for the year ended April 30, 2015 to 77% for the year ended April 30, 2016.
Operating Expenses
| Year Ended April 30, | ||||||||||||||||||||||||
| 2015 | 2016 (Combined) | Change | ||||||||||||||||||||||
| Amount | % of Total Net Revenue |
Amount | % of Total Net Revenue |
Amount | % | |||||||||||||||||||
| (Unaudited) | ||||||||||||||||||||||||
| Operating expenses: |
||||||||||||||||||||||||
| Sales and marketing |
$ | 190,288 | 30 | % | $ | 241,118 | 40 | % | $ | 50,830 | 27 | % | ||||||||||||
| Research and development |
110,591 | 18 | % | 131,367 | 22 | % | 20,776 | 19 | % | |||||||||||||||
| General and administrative |
68,131 | 11 | % | 148,169 | 25 | % | 80,038 | 117 | % | |||||||||||||||
| Amortization of intangible assets |
33,111 | 5 | % | 122,757 | 21 | % | 89,646 | 271 | % | |||||||||||||||
| Change in fair value of acquisition-related earn-out liability |
— | — | % | (970 | ) | — | % | (970 | ) | (100 | )% | |||||||||||||
| Restructuring and other charges |
1,130 | — | % | 2,857 | — | % | 1,727 | 153 | % | |||||||||||||||
|
|
|
|
|
|
|
|||||||||||||||||||
| Total operating expenses |
$ | 403,251 | 64 | % | $ | 645,298 | 108 | % | $ | 242,047 | 60 | % | ||||||||||||
|
|
|
|
|
|
|
|||||||||||||||||||
Sales and Marketing
Sales and marketing expenses increased $50.8 million, or 27%, from $190.3 million for the year ended April 30, 2015 to $241.1 million for year ended April 30, 2016. The increase in sales and marketing expense was primarily attributable to a $18.2 million increase in salaries and related expenses associated with additional sales headcount, an increase in commission expense of $19.4 million, an increase of $5.5 million in stock-based compensation, and an increase of $7.7 million in various other sales expenses, including travel and sales events. We increased the size of our sales organization in the year ended April 30, 2016 compared to the year ended April 30, 2015 in order to drive growth.
Research and Development
Research and development expense increased $20.8 million, or 19%, from $110.6 million for the year ended April 30, 2015 to $131.4 million for the year ended April 30, 2016. The increase in research and development expense was largely attributable to an increase in personnel-related costs of $17.5 million driven by increases in bonus expense and acquisition-related headcount, an increase of $2.7 million in stock-based compensation and an increase of $3.0 million in project and other miscellaneous costs, partially offset by a decrease of $2.4 million in amortization of purchased licenses and other costs.
-70-
Table of Contents
General and Administrative
General and administrative expense increased $80.0 million, or 117%, from $68.1 million for the year ended April 30, 2015 to $148.2 million for the year ended April 30, 2016. The increase was driven primarily by an increase of $42.0 million in financial advisory, legal and accounting professional services costs primarily related to the Bain, Perspecsys and Elastica acquisitions. In addition, the increase was driven by an increase of $11.1 million in stock-based compensation, an increase of $1.5 million in fees paid to our sponsors under our management services agreement with their management companies, an increase in personnel-related costs of $20.6 million, primarily driven by an increase in bonus expense, and an increase of $4.8 million in miscellaneous costs, primarily driven by an increase in consulting costs.
Amortization of Intangible Assets
Amortization of intangible assets increased $89.6 million, or 271%, from $33.1 million for the year ended April 30, 2015 to $122.8 million for the year ended April 30, 2016, due to the increased amortization related to the intangible assets acquired as part of the Bain, Perspecsys, and Elastica acquisitions.
Change in Fair Value of Acquisition-Related Earn-Out Liability
Change in fair value of acquisition-related earn-out liability decreased $1.0 million, or 100%, from zero for the year ended April 30, 2015 to a benefit of $1.0 million for the year ended April 30, 2016, due to the subsequent adjustment to fair value of the contingent earn-out related to the Perspecsys acquisition, as we determined it was unlikely the net revenue targets would be met within the first year following the acquisition.
Restructuring and Other Charges
During the year ended April 30, 2015, we incurred $1.1 million of restructuring costs related to acquisitions and realignment. During the year ended April 30, 2016, we incurred $2.9 million of restructuring costs primarily related to the Bain and Perspecsys acquisitions and organization realignment, consisting primarily of severance and contract termination costs.
Interest and Other Income (Expense)
| Year Ended April 30, | Change | |||||||||||||||
| 2015 | 2016 (Combined) |
Amount | % | |||||||||||||
| (Unaudited) | ||||||||||||||||
| Interest income |
$ | 38 | $ | 144 | $ | 106 | 279 | % | ||||||||
| Interest expense |
(66,434 | ) | (103,372 | ) | (36,938 | ) | 56 | % | ||||||||
| Debt extinguishment and refinancing costs |
— | (3,406 | ) | (3,406 | ) | (100 | )% | |||||||||
| Other expense, net |
(1,376 | ) | (1,108 | ) | 268 | (19 | )% | |||||||||
Interest Income
Interest income related to our cash and cash equivalents was not material for the year ended April 30, 2015 and 2016.
Interest Expense
Interest expense increased $36.9 million, or 56%, from $66.4 million for the year ended April 30, 2015 to $103.4 million for the year ended April 30, 2016, due to additional net borrowings associated with the Bain and Elastica acquisitions.
-71-
Table of Contents
Debt Extinguishment and Refinancing Costs
We incurred debt extinguishment and refinancing costs of $3.4 million in the year ended April 30, 2016 related to the increase in our senior secured term loan facility in connection with the Elastica acquisition.
Other Expense, Net
Other expense, net decreased $0.3 million, or 19%, from $1.4 million for the year ended April 30, 2015 to $1.1 million for the year ended April 30, 2016. The decrease in other expense, net, primarily relates to the change in foreign currency exchange gains and losses.
Provision for (Benefit from) Income Taxes
The benefit for income taxes increased $86.2 million from a provision of $15.1 million for the year ended April 30, 2015 to a benefit of $71.1 million for the year ended April 30, 2016. The increase in the income tax benefit is primarily due to a larger pre-tax loss and more tax deductible transaction costs in the year ended April 30, 2016 compared to the year ended April 30, 2015. These benefits were partially offset by an increase in the tax provision related to a larger deemed dividend in the year ended April 30, 2016 compared to the year ended April 30, 2015.
Comparison of the Fiscal Years Ended April 30, 2014 and April 30, 2015 (dollars in thousands, percentages may not foot due to rounding)
Revenue
| Year Ended April 30, | ||||||||||||||||||||||||
| 2014 | 2015 | Change | ||||||||||||||||||||||
| Amount | % of Total Net Revenue |
Amount | % of Total Net Revenue |
Amount | % | |||||||||||||||||||
| Net revenue: |
||||||||||||||||||||||||
| Product |
$ | 319,232 | 53 | % | $ | 274,373 | 43 | % | $ | (44,859 | ) | (14 | )% | |||||||||||
| Service and subscription |
287,240 | 47 | % | 356,910 | 57 | % | 69,670 | 24 | % | |||||||||||||||
|
|
|
|
|
|
|
|||||||||||||||||||
| Total net revenue |
$ | 606,472 | 100 | % | $ | 631,283 | 100 | % | $ | 24,811 | 4 | % | ||||||||||||
|
|
|
|
|
|
|
|||||||||||||||||||
In connection with the Thoma Bravo Acquisition on February 15, 2012, and certain other acquisitions, we were required to write down our deferred revenue balances due to purchase accounting. See “—Impact of Purchase Accounting Related to Mergers and Acquisitions” above. The impact to net revenue as a result of these purchase accounting adjustments for the fiscal 2014 and fiscal 2015 are shown in the table below:
| Year Ended April 30, | ||||||||||||
| 2014 | 2015 | Change | ||||||||||
| Impact to net revenue as a result of deferred revenue write down: |
||||||||||||
| Product |
$ | (296 | ) | $ | (557 | ) | $ | (261 | ) | |||
| Service and subscription |
(25,000 | ) | (11,044 | ) | 13,956 | |||||||
|
|
|
|
|
|
|
|||||||
| Total impact to net revenue as a result of deferred revenue write down |
$ | (25,296 | ) | $ | (11,601 | ) | $ | 13,695 | ||||
|
|
|
|
|
|
|
|||||||
Total net revenue increased $24.8 million, or 4%, from $606.5 million for the year ended April 30, 2014 to $631.3 million for the year ended April 30, 2015. The increase was partially driven by the impact of the deferred revenue write down in connection with the purchase accounting adjustments, which resulted in an increase to net
-72-
Table of Contents
revenue of $13.7 million. In addition, the increase was due to an increase of $69.7 million in service and subscription revenue, which was partially offset by a $44.9 million decrease in product revenue, primarily due to the substantial completion of our SWG 8100 refresh program at the end of fiscal 2014.
Product revenue decreased $44.9 million, or 14%, from $319.2 million for the year ended April 30, 2014 to $274.4 million for the year ended April 30, 2015. The decrease was primarily due to approximately $50 million more refresh revenue for fiscal 2014 than for fiscal 2015 related to our SWG 8100 refresh program, which was substantially completed at the end of fiscal 2014. This decrease was partially offset by an increase in revenue from our Advanced Threat Protection products.
Service and subscription revenue increased $69.7 million, or 24%, from $287.2 million for the year ended April 30, 2014 to $356.9 million for the year ended April 30, 2015. The increase was partially driven by the impact of the deferred revenue write-down in connection with the purchase accounting adjustments, which resulted in an increase to net service and subscription revenue of $14.0 million. In addition to the impact of the deferred revenue write-down, new support revenue increased by $7.5 million, renewal support revenue increased by $40.0 million, and subscription and other service revenue increased by $8.2 million. The $40.0 million increase in renewal service revenue was driven by higher renewal rates and favorable pricing charged on our maintenance contracts.
Cost of Net Revenue
| Year Ended April 30, | ||||||||||||||||||||||||
| 2014 | 2015 | Change | ||||||||||||||||||||||
| Amount | Gross Margin |
Amount | Gross Margin |
Amount | % | |||||||||||||||||||
| Cost of net revenue: |
||||||||||||||||||||||||
| Product |
$ | 106,188 | $ | 106,904 | $ | 716 | 1 | % | ||||||||||||||||
| Service and Subscription |
56,447 | 53,682 | (2,765 | ) | (5 | )% | ||||||||||||||||||
|
|
|
|
|
|
|
|||||||||||||||||||
| Total cost of net revenue |
$ | 162,635 | $ | 160,586 | $ | (2,049 | ) | (1 | )% | |||||||||||||||
|
|
|
|
|
|
|
|||||||||||||||||||
| Gross profit: |
||||||||||||||||||||||||
| Product |
$ | 213,044 | 67 | % | $ | 167,469 | 61 | % | $ | (45,575 | ) | (21 | )% | |||||||||||
| Service and Subscription |
230,793 | 80 | % | 303,228 | 85 | % | 72,435 | 31 | % | |||||||||||||||
|
|
|
|
|
|
|
|||||||||||||||||||
| Total gross profit |
$ | 443,837 | 73 | % | $ | 470,697 | 75 | % | $ | 26,860 | 6 | % | ||||||||||||
|
|
|
|
|
|
|
|||||||||||||||||||
Total cost of net revenue decreased $2.0 million, or 1%, from $162.6 million for the year ended April 30, 2014 to $160.6 million for the year ended April 30, 2015. The overall decrease in cost of net revenue was primarily attributable to the decrease in cost of service and subscription revenue due to improved efficiency of our worldwide service delivery model through system and operations improvements. Product cost of revenue increased slightly, despite a decrease in product revenue, due primarily to changes in product mix and an increase in amortization of acquired intangibles and other costs of revenue. The change in product of mix was driven by the substantial completion of our SWG 8100 refresh in fiscal 2014, which resulted in increased sales of our high-end Secure Web Gateway appliances, which had higher gross margins in fiscal 2014 compared to fiscal 2015.
Overall gross margin increased from 73% for the year ended April 30, 2014 to 75% for the year ended April 30, 2015, due primarily to the mix between product and service and subscription revenue. Service and subscription revenue increased as a percentage of total revenue in fiscal 2015, which generally carries higher gross margins than product revenue. This was partially due to the increase in net service and subscription revenues as a result of the deferred revenue write down purchase accounting adjustment, which had a larger impact on fiscal 2014 net revenue.
-73-
Table of Contents
Operating Expenses
| Year Ended April 30, | ||||||||||||||||||||||||
| 2014 | 2015 | Change | ||||||||||||||||||||||
| Amount | % of Total Net Revenue |
Amount | % of Total Net Revenue |
Amount | % | |||||||||||||||||||
| Operating expenses: |
||||||||||||||||||||||||
| Sales and marketing |
$ | 193,661 | 32 | % | $ | 190,288 | 30 | % | $ | (3,373 | ) | (2 | )% | |||||||||||
| Research and development |
110,886 | 18 | % | 110,591 | 18 | % | (295 | ) | — | % | ||||||||||||||
| General and administrative |
69,266 | 11 | % | 68,131 | 11 | % | (1,135 | ) | (2 | )% | ||||||||||||||
| Amortization of intangible assets |
37,814 | 6 | % | 33,111 | 5 | % | (4,703 | ) | (12 | )% | ||||||||||||||
| Change in fair value of acquisition-related earn-out liability |
9,698 | 2 | % | — | — | % | (9,698 | ) | (100 | )% | ||||||||||||||
| Restructuring and other charges |
3,020 | — | % | 1,130 | — | % | (1,890 | ) | (63 | )% | ||||||||||||||
|
|
|
|
|
|
|
|||||||||||||||||||
| Total operating expenses |
$ | 424,345 | 70 | % | $ | 403,251 | 64 | % | $ | (21,094 | ) | (5 | )% | |||||||||||
|
|
|
|
|
|
|
|||||||||||||||||||
Sales and Marketing
Sales and marketing expenses decreased $3.4 million, or 2%, from $193.7 million for the year ended April 30, 2014 to $190.3 million for the year ended April 30, 2015. The decrease in sales and marketing expense was primarily due to a decrease in fiscal 2015 of $2.8 million in commissions and other variable compensation and $3.8 million in marketing programs. The decrease was partially offset by an increase in salaries and related benefits, and other miscellaneous costs of $3.2 million, which was driven by the increase in the sales force in fiscal 2015 compared to fiscal 2014.
Research and Development
Research and development expense decreased $0.3 million, or less than 1%, from $110.9 million for the year ended April 30, 2014 to $110.6 million for the year ended April 30, 2015. The decrease in research and development expense was primarily due to a decrease in employee-related costs in fiscal 2015, including bonus expense, of $2.9 million in fiscal 2015. The fiscal 2014 bonus expense was higher compared to fiscal 2015 due to over-performance versus plan in that year. The decrease in employee-related costs was partially offset by miscellaneous costs of $2.6 million in fiscal 2015, largely attributable to equipment expenses and depreciation.
General and Administrative
General and administrative expense decreased $1.1 million, or 2%, from $69.3 million for the year ended April 30, 2014 to $68.1 million for the year ended April 30, 2015. The decrease in general and administrative expense was primarily due to a decrease in employee-related costs of $0.6 million in fiscal 2015, largely attributable to a decrease in bonus expense, and a decrease in other miscellaneous expenses of $0.5 million. The fiscal 2014 bonus expense was higher compared to fiscal 2015 due to over-performance versus plan in that year.
Amortization of Intangible Assets
Amortization of intangible assets decreased $4.7 million, or 12%, from $37.8 million for the year ended April 30, 2014 to $33.1 million for the year ended April 30, 2015, due to certain customer relationship intangibles becoming fully amortized during the year ended April 30, 2014.
Change in Fair Value of Acquisition-Related Earn-Out Liability
In April 2014, the estimated fair value of the earn-out related to our acquisition of the SSL Visibility business from Netronome was increased by $9.7 million to $18.1 million, with the adjustment recognized through the consolidated statement of operations.
-74-
Table of Contents
Restructuring and Other Charges
During the year ended April 30, 2014, we incurred $3.0 million of restructuring costs related to our Netronome, Solera and Norman Shark acquisitions, consisting primarily of personnel-related severance and other headcount costs. During the year ended April 30, 2015, we incurred $1.1 million of restructuring costs related to our acquisitions and organization alignment, consisting primarily of personnel-related severance costs.
Interest and Other Income (Expense)
| Year Ended April 30, | ||||||||||||||||
| 2014 | 2015 | Change | % Change | |||||||||||||
| Interest income |
$ | 44 | $ | 38 | $ | (6 | ) | (14 | )% | |||||||
| Interest expense |
(63,015 | ) | (66,434 | ) | (3,419 | ) | 5 | % | ||||||||
| Debt extinguishment and refinancing costs |
(11,100 | ) | — | 11,100 | (100 | )% | ||||||||||
| Other expense, net |
(1,973 | ) | (1,376 | ) | 597 | (30 | )% | |||||||||
Interest Income
Interest income related to our cash and cash equivalents was not material for the years ended April 30, 2014 and 2015.
Interest Expense
Interest expense increased $3.4 million, or 5%, from $63.0 million for the year ended April 30, 2014 to $66.4 million for the year ended April 30, 2015, due to a full year of interest expense for the year ended April 30, 2015 related to additional borrowings during fiscal 2014.
Debt Extinguishment and Refinancing Costs
In June 2013 and February 2014, we entered into additional credit agreements and incurred transaction fees and expenses of $9.3 million and $10.0 million, respectively. Of these amounts, $11.1 million was recorded as expense in the statement of operations for the year ended April 30, 2014, and the remaining amount was capitalized. We did not incur any debt extinguishment or refinancing costs during the year ended April 30, 2015.
Other Expense, Net
Other expense, net decreased $0.6 million, or 30%, from $2.0 million for the year ended April 30, 2014 to $1.4 million for the year ended April 30, 2015. The fluctuation in other expense, net, primarily relates to the change in foreign currency exchange gains and losses.
Provision for (Benefit from) Income Taxes
The benefit for income taxes was $5.2 million for the year ended April 30, 2014, compared to a provision of $15.1 million for the year ended April 30, 2015. The change in the provision (benefit) for income taxes primarily relates to a provision of $13.9 million related to expected repatriation and the effect of deferred taxes from intercompany transactions for the year ended April 30, 2015. Income tax in the year ended April 30, 2014 benefited from a loss before income taxes driven in part by debt extinguishment and refinancing costs, and restructuring costs that are tax deductible in the United States. These benefits were partially offset by a tax provision in the United States related to a deferred tax expense associated with the gain on the sale of acquired intangibles to our foreign affiliate recognized in 2014. There were no such transactions in fiscal 2015.
-75-
Table of Contents
Quarterly Results of Operations
The following tables set forth selected unaudited quarterly statements of operations data for each of the eight fiscal quarters ended April 30, 2016, as well as the percentage that each line item represents of total revenue. The information for each of these quarters has been prepared on the same basis as the audited annual financial statements included elsewhere in this prospectus and, in the opinion of management, includes all adjustments, which include only normal recurring adjustments, necessary for the fair statement of the results of operations for these periods. This data should be read in conjunction with our audited consolidated financial statements and related notes included elsewhere in this prospectus. These quarterly operating results are not necessarily indicative of our operating results for a full year or any future period.
| Three Months Ended | Three Months Ended | |||||||||||||||||||||||||||||||||||||||
| (Predecessor) | (Predecessor) |
(Successor) |
(Combined) | (Successor) | ||||||||||||||||||||||||||||||||||||
| July 31, 2014 |
October 31, 2014 |
January 31, 2015 |
April 30, 2015 |
May 1 - May
22, 2015 |
May 23 -July
31, 2015 |
July 31, 2015 |
October 31, 2015 |
January 31, 2016 |
April 30, 2016 |
|||||||||||||||||||||||||||||||
| (In thousands, except per share data) |
(Unaudited) | (Unaudited) | (Unaudited) | (Unaudited) | ||||||||||||||||||||||||||||||||||||
| Net revenue: |
||||||||||||||||||||||||||||||||||||||||
| Product |
$ | 61,628 | $ | 64,812 | $ | 72,186 | $ | 75,747 | $ | 7,032 | $ | 59,494 | $ | 66,526 | $ | 75,025 | $ | 88,678 | $ | 83,590 | ||||||||||||||||||||
| Service and subscription |
81,939 | 88,299 | 92,403 | 94,269 | 22,446 | 35,357 | 57,803 | 60,356 | 76,151 | 90,208 | ||||||||||||||||||||||||||||||
|
|
|
|
|
|
|
|
|
|
|
|
|
|
|
|
|
|
|
|
|
|||||||||||||||||||||
| Total net revenue |
143,567 | 153,111 | 164,589 | 170,016 | 29,478 | 94,851 | 124,329 | 135,381 | 164,829 | 173,798 | ||||||||||||||||||||||||||||||
|
|
|
|
|
|
|
|
|
|
|
|
|
|
|
|
|
|
|
|
|
|||||||||||||||||||||
| Cost of net revenue: |
||||||||||||||||||||||||||||||||||||||||
| Product |
26,109 | 25,766 | 26,811 | 28,218 | 4,687 | 30,031 | 34,718 | 39,580 | 37,255 | 24,253 | ||||||||||||||||||||||||||||||
| Service and subscription |
13,698 | 12,764 | 13,131 | 14,089 | 3,069 | 11,893 | 14,962 | 15,512 | 18,994 | 20,243 | ||||||||||||||||||||||||||||||
|
|
|
|
|
|
|
|
|
|
|
|
|
|
|
|
|
|
|
|
|
|||||||||||||||||||||
| Total cost of net revenue |
39,807 | 38,530 | 39,942 | 42,307 | 7,756 | 41,924 | 49,680 | 55,092 | 56,249 | 44,496 | ||||||||||||||||||||||||||||||
|
|
|
|
|
|
|
|
|
|
|
|
|
|
|
|
|
|
|
|
|
|||||||||||||||||||||
| Gross profit |
103,760 | 114,581 | 124,647 | 127,709 | 21,722 | 52,927 | 74,649 | 80,289 | 108,580 | 129,302 | ||||||||||||||||||||||||||||||
|
|
|
|
|
|
|
|
|
|
|
|
|
|
|
|
|
|
|
|
|
|||||||||||||||||||||
| Operating expenses: |
||||||||||||||||||||||||||||||||||||||||
| Sales and marketing |
44,904 | 45,883 | 47,931 | 51,570 | 12,024 | 38,925 | 50,949 | 55,187 | 63,966 | 71,016 | ||||||||||||||||||||||||||||||
| Research and development |
28,627 | 26,180 | 26,907 | 28,877 | 7,050 | 20,890 | 27,940 | 28,675 | 34,888 | 39,864 | ||||||||||||||||||||||||||||||
| General and administrative |
16,933 | 16,296 | 17,492 | 17,410 | 21,649 | 26,153 | 47,802 | 23,950 | 41,346 | 35,071 | ||||||||||||||||||||||||||||||
| Amortization of intangible assets |
8,278 | 8,278 | 8,278 | 8,277 | 1,738 | 30,165 | 31,903 | 30,256 | 30,295 | 30,303 | ||||||||||||||||||||||||||||||
| Change in fair value of acquisition-related earn-out liability |
— | — | — | — | — | — | — | — | — | (970 | ) | |||||||||||||||||||||||||||||
| Restructuring and other charges |
16 | 244 | 13 | 857 | — | 813 | 813 | 593 | 1,258 | 193 | ||||||||||||||||||||||||||||||
|
|
|
|
|
|
|
|
|
|
|
|
|
|
|
|
|
|
|
|
|
|||||||||||||||||||||
| Total operating expenses |
98,758 | 96,881 | 100,621 | 106,991 | 42,461 | 116,946 | 159,407 | 138,661 | 171,753 | 175,477 | ||||||||||||||||||||||||||||||
|
|
|
|
|
|
|
|
|
|
|
|
|
|
|
|
|
|
|
|
|
|||||||||||||||||||||
| Operating income (loss) |
5,002 | 17,700 | 24,026 | 20,718 | (20,739 | ) | (64,019 | ) | (84,758 | ) | (58,372 | ) | (63,173 | ) | (46,175 | ) | ||||||||||||||||||||||||
| Interest income |
3 | 23 | 7 | 5 | 1 | 2 | 3 | 13 | 56 | 72 | ||||||||||||||||||||||||||||||
| Interest expense |
(17,051 | ) | (16,433 | ) | (16,542 | ) | (16,408 | ) | (3,986 | ) | (19,254 | ) | (23,240 | ) | (25,025 | ) | (27,546 | ) | (27,561 | ) | ||||||||||||||||||||
| Debt extinguishment and refinancing costs |
— | — | — | — | — | — | — | — | (3,406 | ) | — | |||||||||||||||||||||||||||||
| Other income (expense), net |
(617 | ) | (333 | ) | (562 | ) | 136 | (349 | ) | (436 | ) | (785 | ) | (571 | ) | 6 | 242 | |||||||||||||||||||||||
|
|
|
|
|
|
|
|
|
|
|
|
|
|
|
|
|
|
|
|
|
|||||||||||||||||||||
| Income (loss) before income taxes |
(12,663 | ) | 957 | 6,929 | 4,451 | (25,073 | ) | (83,707 | ) | (108,780 | ) | (83,955 | ) | (94,063 | ) | (73,422 | ) | |||||||||||||||||||||||
| Income tax provision (benefit) |
(9,918 | ) | 581 | 3,877 | 20,564 | (7,596 | ) | (11,871 | ) | (19,467 | ) | (11,474 | ) | (23,374 | ) | (16,824 | ) | |||||||||||||||||||||||
|
|
|
|
|
|
|
|
|
|
|
|
|
|
|
|
|
|
|
|
|
|||||||||||||||||||||
| Net income (loss) |
$ | (2,745 | ) | $ | 376 | $ | 3,052 | $ | (16,113 | ) | $ | (17,477 | ) | $ | (71,836 | ) | $ | (89,313 | ) | $ | (72,481 | ) | $ | (70,689 | ) | $ | (56,598 | ) | ||||||||||||
|
|
|
|
|
|
|
|
|
|
|
|
|
|
|
|
|
|
|
|
|
|||||||||||||||||||||
-76-
Table of Contents
The following table sets forth, as a percentage of net revenue, consolidated statements of operations data for the periods indicated (totals may not foot due to rounding):
| Three Months Ended | Three Months Ended | |||||||||||||||||||||||||||||||||||||||
| (Predecessor) | (Predecessor) | (Successor) | (Combined) | (Successor) | ||||||||||||||||||||||||||||||||||||
| July 31, 2014 |
October 31, 2014 |
January 31, 2015 |
April 30, 2015 |
May 1-May
22, 2015 |
May 23-July
31, 2015 |
July 31, 2015 |
October 31, 2015 |
January 31, 2016 |
April 30, 2016 |
|||||||||||||||||||||||||||||||
| (Unaudited) | (Unaudited) | (Unaudited) | (Unaudited) | |||||||||||||||||||||||||||||||||||||
| Net revenue: |
||||||||||||||||||||||||||||||||||||||||
| Product |
43 | % | 42 | % | 44 | % | 45 | % | 24 | % | 63 | % | 54 | % | 55 | % | 54 | % | 48 | % | ||||||||||||||||||||
| Service and subscription |
57 | % | 58 | % | 56 | % | 55 | % | 76 | % | 37 | % | 46 | % | 45 | % | 46 | % | 52 | % | ||||||||||||||||||||
|
|
|
|
|
|
|
|
|
|
|
|
|
|
|
|
|
|
|
|
|
|||||||||||||||||||||
| Total net revenue |
100 | % | 100 | % | 100 | % | 100 | % | 100 | % | 100 | % | 100 | % | 100 | % | 100 | % | 100 | % | ||||||||||||||||||||
|
|
|
|
|
|
|
|
|
|
|
|
|
|
|
|
|
|
|
|
|
|||||||||||||||||||||
| Cost of net revenue: |
||||||||||||||||||||||||||||||||||||||||
| Product |
18 | % | 17 | % | 16 | % | 17 | % | 16 | % | 32 | % | 28 | % | 29 | % | 23 | % | 14 | % | ||||||||||||||||||||
| Service and subscription |
10 | % | 8 | % | 8 | % | 8 | % | 10 | % | 13 | % | 12 | % | 11 | % | 12 | % | 12 | % | ||||||||||||||||||||
|
|
|
|
|
|
|
|
|
|
|
|
|
|
|
|
|
|
|
|
|
|||||||||||||||||||||
| Total cost of net revenue |
28 | % | 25 | % | 24 | % | 25 | % | 26 | % | 44 | % | 40 | % | 41 | % | 34 | % | 26 | % | ||||||||||||||||||||
|
|
|
|
|
|
|
|
|
|
|
|
|
|
|
|
|
|
|
|
|
|||||||||||||||||||||
| Gross profit |
72 | % | 75 | % | 76 | % | 75 | % | 74 | % | 56 | % | 60 | % | 59 | % | 66 | % | 74 | % | ||||||||||||||||||||
|
|
|
|
|
|
|
|
|
|
|
|
|
|
|
|
|
|
|
|
|
|||||||||||||||||||||
| Operating expenses: |
||||||||||||||||||||||||||||||||||||||||
| Sales and marketing |
31 | % | 30 | % | 29 | % | 30 | % | 41 | % | 41 | % | 41 | % | 41 | % | 39 | % | 41 | % | ||||||||||||||||||||
| Research and development |
20 | % | 17 | % | 16 | % | 17 | % | 24 | % | 22 | % | 22 | % | 21 | % | 21 | % | 23 | % | ||||||||||||||||||||
| General and administrative |
12 | % | 11 | % | 11 | % | 10 | % | 73 | % | 28 | % | 38 | % | 18 | % | 25 | % | 20 | % | ||||||||||||||||||||
| Amortization of intangible assets |
6 | % | 5 | % | 5 | % | 5 | % | 6 | % | 32 | % | 26 | % | 22 | % | 18 | % | 17 | % | ||||||||||||||||||||
| Change in fair value of acquisition-related earn-out liability |
— | % | — | % | — | % | — | % | — | % | — | % | — | % | — | % | — | % | (1 | )% | ||||||||||||||||||||
| Restructuring and other charges |
— | % | — | % | — | % | 1 | % | — | % | 1 | % | 1 | % | — | % | 1 | % | — | % | ||||||||||||||||||||
|
|
|
|
|
|
|
|
|
|
|
|
|
|
|
|
|
|
|
|
|
|||||||||||||||||||||
| Total operating expenses |
69 | % | 63 | % | 61 | % | 63 | % | 144 | % | 123 | % | 128 | % | 102 | % | 104 | % | 101 | % | ||||||||||||||||||||
|
|
|
|
|
|
|
|
|
|
|
|
|
|
|
|
|
|
|
|
|
|||||||||||||||||||||
| Operating income (loss) |
3 | % | 12 | % | 15 | % | 12 | % | (70 | )% | (67 | )% | (68 | )% | (43 | )% | (38 | )% | (27 | )% | ||||||||||||||||||||
| Interest income |
— | % | — | % | — | % | — | % | — | % | — | % | — | % | — | % | — | % | — | % | ||||||||||||||||||||
| Interest expense |
(12 | )% | (11 | )% | (10 | )% | (10 | )% | (14 | )% | (20 | )% | (19 | )% | (18 | )% | (17 | )% | (16 | )% | ||||||||||||||||||||
| Debt extinguishment and refinancing costs |
— | % | — | % | — | % | — | % | — | % | — | % | — | % | — | % | (2 | )% | — | % | ||||||||||||||||||||
| Other income (expense), net |
— | % | — | % | — | % | — | % | (1 | )% | — | % | (1 | )% | — | % | — | % | — | % | ||||||||||||||||||||
|
|
|
|
|
|
|
|
|
|
|
|
|
|
|
|
|
|
|
|
|
|||||||||||||||||||||
| Income (loss) before income taxes |
(9 | )% | 1 | % | 4 | % | 3 | % | (85 | )% | (88 | )% | (87 | )% | (62 | )% | (57 | )% | (42 | )% | ||||||||||||||||||||
| Income tax provision (benefit) |
(7 | )% | — | % | 2 | % | 12 | % | (26 | )% | (13 | )% | (16 | )% | (8 | )% | (14 | )% | (10 | )% | ||||||||||||||||||||
|
|
|
|
|
|
|
|
|
|
|
|
|
|
|
|
|
|
|
|
|
|||||||||||||||||||||
| Net income (loss) |
(2 | )% | — | % | 2 | % | (9 | )% | (59 | )% | (76 | )% | (72 | )% | (54 | )% | (43 | )% | (33 | )% | ||||||||||||||||||||
|
|
|
|
|
|
|
|
|
|
|
|
|
|
|
|
|
|
|
|
|
|||||||||||||||||||||
-77-
Table of Contents
Non-GAAP Financial Measures
The following tables present non-GAAP financial measures for each of the eight quarters in the period ended April 30, 2016. In addition to our results determined in accordance with GAAP, we believe the following non-GAAP measures are useful in evaluating our operating performance. Refer to “Selected Consolidated Financial Data—Non-GAAP Financial Measures” and “—Reconciliation of Non-GAAP Financial Measures” for a description of the non-GAAP measures and the adjustments to reconcile to GAAP.
| Three Months Ended | Three Months Ended | |||||||||||||||||||||||||||||||||||||||
| (Predecessor) | (Predecessor) | (Successor) | (Combined) | (Successor) | ||||||||||||||||||||||||||||||||||||
| July 31, 2014 |
October 31, 2014 |
January 31, 2015 |
April 30, 2015 |
May 1 - May
22, 2015 |
May 23 - July
31, 2015 |
July 31, 2015 |
October 31, 2015 |
January 31, 2016 |
April 30, 2016 |
|||||||||||||||||||||||||||||||
| (In thousands) | (Unaudited) |
(Unaudited) | (Unaudited) | (Unaudited) | (Unaudited) | |||||||||||||||||||||||||||||||||||
| Adjusted product revenue |
$ | 61,628 | $ | 64,951 | $ | 72,395 | $ | 75,956 | $ | 7,081 | $ | 62,016 | $ | 69,097 | $ | 76,881 | $ | 89,481 | $ | 84,116 | ||||||||||||||||||||
| Adjusted service and subscription revenue |
85,611 | 91,489 | 94,865 | 95,989 | 22,778 | 77,957 | 100,735 | 109,386 | 113,777 | 111,901 | ||||||||||||||||||||||||||||||
| Adjusted net revenue |
147,239 | 156,440 | 167,260 | 171,945 | 29,859 | 139,973 | 169,832 | 186,267 | 203,258 | 196,017 | ||||||||||||||||||||||||||||||
| Adjusted EBITDA |
37,304 | 50,218 | 55,469 | 53,477 | 7,190 | 46,243 | 53,433 | 58,505 | 66,055 | 44,855 | ||||||||||||||||||||||||||||||
| Adjusted deferred revenue ending balance |
303,277 | 309,858 | 338,124 | 359,079 | 347,797 | 359,811 | 359,811 | 369,542 | 421,024 | 443,818 | ||||||||||||||||||||||||||||||
The following tables reconcile the most directly comparable GAAP financial measure to each of these non-GAAP financial measures.
| Three Months Ended | Three Months Ended | |||||||||||||||||||||||||||||||||||||||
| (Predecessor) | (Predecessor) | (Successor) | (Combined) | (Successor) | ||||||||||||||||||||||||||||||||||||
| July 31, 2014 |
October 31, 2014 |
January 31, 2015 |
April 30, 2015 |
May 1 - May 22, 2015 |
May 23 - July 31, 2015 |
July 31, 2015 |
October 31, 2015 |
January 31, 2016 |
April 30, 2016 |
|||||||||||||||||||||||||||||||
| (In thousands) | (Unaudited) |
(Unaudited) | (Unaudited) | (Unaudited) | (Unaudited) | |||||||||||||||||||||||||||||||||||
| Product revenue |
$ | 61,628 | $ | 64,812 | $ | 72,186 | $ | 75,747 | $ | 7,032 | $ | 59,494 | $ | 66,526 | $ | 75,025 | $ | 88,678 | $ | 83,590 | ||||||||||||||||||||
| Impact of purchase accounting on product revenue |
— | 139 | 209 | 209 | 49 | 2,522 | 2,571 | 1,856 | 803 | 526 | ||||||||||||||||||||||||||||||
|
|
|
|
|
|
|
|
|
|
|
|
|
|
|
|
|
|
|
|
|
|||||||||||||||||||||
| Adjusted product revenue |
$ | 61,628 | $ | 64,951 | $ | 72,395 | $ | 75,956 | $ | 7,081 | $ | 62,016 | $ | 69,097 | $ | 76,881 | $ | 89,481 | $ | 84,116 | ||||||||||||||||||||
|
|
|
|
|
|
|
|
|
|
|
|
|
|
|
|
|
|
|
|
|
|||||||||||||||||||||
| Service and subscription revenue |
$ | 81,939 | $ | 88,299 | $ | 92,403 | $ | 94,269 | $ | 22,446 | $ | 35,357 | $ | 57,803 | $ | 60,356 | $ | 76,151 | $ | 90,208 | ||||||||||||||||||||
| Impact of purchase accounting on service and subscription revenue |
3,672 | 3,190 | 2,462 | 1,720 | 332 | 42,600 | 42,932 | 49,030 | 37,626 | 21,693 | ||||||||||||||||||||||||||||||
|
|
|
|
|
|
|
|
|
|
|
|
|
|
|
|
|
|
|
|
|
|||||||||||||||||||||
| Adjusted service and subscription revenue |
$ | 85,611 | $ | 91,489 | $ | 94,865 | $ | 95,989 | $ | 22,778 | $ | 77,957 | $ | 100,735 | $ | 109,386 | $ | 113,777 | $ | 111,901 | ||||||||||||||||||||
|
|
|
|
|
|
|
|
|
|
|
|
|
|
|
|
|
|
|
|
|
|||||||||||||||||||||
| Net revenue |
$ | 143,567 | $ | 153,111 | $ | 164,589 | $ | 170,016 | $ | 29,478 | $ | 94,851 | $ | 124,329 | $ | 135,381 | $ | 164,829 | $ | 173,798 | ||||||||||||||||||||
| Impact of purchase accounting on net revenue |
3,672 | 3,329 | 2,671 | 1,929 | 381 | 45,122 | 45,503 | 50,886 | 38,429 | 22,219 | ||||||||||||||||||||||||||||||
|
|
|
|
|
|
|
|
|
|
|
|
|
|
|
|
|
|
|
|
|
|||||||||||||||||||||
| Adjusted net revenue |
$ | 147,239 | $ | 156,440 | $ | 167,260 | $ | 171,945 | $ |
29,859 |
|
$ | 139,973 | $ | 169,832 | $ | 186,267 | $ | 203,258 | $ | 196,017 | |||||||||||||||||||
|
|
|
|
|
|
|
|
|
|
|
|
|
|
|
|
|
|
|
|
|
|||||||||||||||||||||
-78-
Table of Contents
| Three Months Ended | Three Months Ended | |||||||||||||||||||||||||||||||||||||||
| (Predecessor) |
(Predecessor) | (Successor) | (Combined) | (Successor) | ||||||||||||||||||||||||||||||||||||
| July 31, 2014 |
October 31, 2014 |
January 31, 2015 |
April 30, 2015 |
May 1 - May
22, 2015 |
May 23 - July
31, 2015 |
July 31, 2015 |
October 31, 2015 |
January 31, 2016 |
April 30, 2016 |
|||||||||||||||||||||||||||||||
| (In thousands) | (Unaudited) |
(Unaudited) | (Unaudited) | (Unaudited) | (Unaudited) | |||||||||||||||||||||||||||||||||||
| Net income (loss) |
$ | (2,745 | ) | $ | 376 | $ | 3,052 | $ | (16,113 | ) | $ | (17,477 | ) | $ | (71,836 | ) | $ | (89,313 | ) | $ | (72,481 | ) | $ | (70,689 | ) | $ | (56,598 | ) | ||||||||||||
| Impact of purchase accounting on net revenue |
3,672 | 3,329 | 2,671 | 1,929 | 381 | 45,122 | 45,503 | 50,886 | 38,429 | 22,219 | ||||||||||||||||||||||||||||||
| Amortization of intangible assets and purchased technology |
19,102 | 19,418 | 19,322 | 19,164 | 4,314 | 38,066 | 42,380 | 39,785 | 41,381 | 41,780 | ||||||||||||||||||||||||||||||
| Litigation costs |
394 | 842 | 1,082 | 2,105 | — | 4,091 | 4,091 | 1,492 | 1,186 | 2,699 | ||||||||||||||||||||||||||||||
| Depreciation expense |
4,404 | 4,493 | 4,859 | 4,684 | 1,632 | 3,287 | 4,919 | 4,941 | 5,245 | 5,333 | ||||||||||||||||||||||||||||||
| Acquisition write-up of acquired inventory sold |
— | — | — | — | — | 8,453 | 8,453 | 11,072 | 9,735 | (50 | ) | |||||||||||||||||||||||||||||
| Stock-based compensation expense |
734 | 803 | 456 | 703 | 3,651 | 1 | 3,652 | 3,937 | 8,005 | 6,971 | ||||||||||||||||||||||||||||||
| Restructuring and other charges |
16 | 244 | 13 | 857 | — | 813 | 813 | 593 | 1,258 | 193 | ||||||||||||||||||||||||||||||
| Acquisition fair value adjustments to earn-outs |
— | — | — | — | — | — | — | — | — | (970 | ) | |||||||||||||||||||||||||||||
| Acquisition transaction costs |
107 | 38 | 19 | 1,059 | 15,865 | 8,499 | 24,364 | 414 | 4,442 | 1,197 | ||||||||||||||||||||||||||||||
| Acquisition integration, transition, retention and other |
2,750 | 2,227 | 1,900 | 1,147 | 1,831 | 241 | 2,072 | 2,125 | 18,014 | 10,206 | ||||||||||||||||||||||||||||||
| Financial sponsor and debt fees |
1,123 | 1,124 | 1,121 | 1,111 |
|
255 |
|
|
1,689 |
|
1,944 | 1,632 | 1,533 | 1,452 | ||||||||||||||||||||||||||
| Interest expense, net |
17,048 | 16,410 | 16,535 | 16,403 | 3,985 | 19,252 | 23,237 | 25,012 | 27,490 | 27,489 | ||||||||||||||||||||||||||||||
| Debt extinguishment and refinancing costs |
— | — | — | — | — | — | — | — | 3,406 | — | ||||||||||||||||||||||||||||||
| Other income (expense), net |
617 | 333 | 562 | (136 | ) | 349 | 436 | 785 | 571 | (6 | ) | (242 | ) | |||||||||||||||||||||||||||
| Income tax provision (benefit) |
(9,918 | ) | 581 | 3,877 | 20,564 | (7,596 | ) | (11,871 | ) | (19,467 | ) | (11,474 | ) | (23,374 | ) | (16,824 | ) | |||||||||||||||||||||||
|
|
|
|
|
|
|
|
|
|
|
|
|
|
|
|
|
|
|
|
|
|||||||||||||||||||||
| Adjusted EBITDA |
$ | 37,304 | $ | 50,218 | $ | 55,469 | $ | 53,477 | $ | 7,190 | $ | 46,243 | $ | 53,433 | $ | 58,505 | $ | 66,055 | $ | 44,855 | ||||||||||||||||||||
|
|
|
|
|
|
|
|
|
|
|
|
|
|
|
|
|
|
|
|
|
|||||||||||||||||||||
| Three Months Ended | Three Months Ended | |||||||||||||||||||||||||||||||||||||||
| (Predecessor) |
(Predecessor) | (Successor) | (Combined) | (Successor) | ||||||||||||||||||||||||||||||||||||
| July 31, 2014 |
October 31, 2014 |
January 31, 2015 |
April 30, 2015 |
May 1 - May
22, 2015 |
May 23 - July
31, 2015 |
July 31, 2015 |
October 31, 2015 |
January 31, 2016 |
April 30, 2016 |
|||||||||||||||||||||||||||||||
| (In thousands) | (Unaudited) |
(Unaudited) | (Unaudited) | (Unaudited) | (Unaudited) | |||||||||||||||||||||||||||||||||||
| Deferred revenue beginning balance |
$ | 289,109 | $ | 290,212 | $ | 300,121 | $ | 331,059 | $ | 353,943 | $ | 343,042 | $ | 353,943 | $ | 170,903 | $ | 231,520 | $ | 319,209 | ||||||||||||||||||||
| Acquisition write-down of deferred revenue beginning balance |
16,737 | 13,065 | 9,737 | 7,065 | 5,136 | 4,755 | 5,136 | 188,908 | 138,022 | 101,815 | ||||||||||||||||||||||||||||||
|
|
|
|
|
|
|
|
|
|
|
|
|
|
|
|
|
|
|
|
|
|||||||||||||||||||||
| Adjusted deferred revenue beginning balance |
$ | 305,846 | $ | 303,277 | $ | 309,858 | $ | 338,124 | $ | 359,079 | $ | 347,797 | $ | 359,079 | $ | 359,811 | $ | 369,542 | $ | 421,024 | ||||||||||||||||||||
|
|
|
|
|
|
|
|
|
|
|
|
|
|
|
|
|
|
|
|
|
|||||||||||||||||||||
| Deferred revenue ending balance |
$ | 290,212 | $ | 300,121 | $ | 331,059 | $ | 353,943 | $ | 343,042 | 170,903 | $ | 170,903 | $ | 231,520 | $ | 319,209 | $ | 364,223 | |||||||||||||||||||||
| Acquisition write-down of deferred revenue ending balance |
13,065 | 9,737 | 7,065 | 5,136 | 4,755 | 188,908 | 188,908 | 138,022 | 101,815 | 79,595 | ||||||||||||||||||||||||||||||
|
|
|
|
|
|
|
|
|
|
|
|
|
|
|
|
|
|
|
|
|
|||||||||||||||||||||
| Adjusted deferred revenue ending balance |
$ | 303,277 | $ | 309,858 | $ | 338,124 | $ | 359,079 | $ | 347,797 | $ | 359,811 | $ | 359,811 | $ | 369,542 | $ | 421,024 | $ | 443,818 | ||||||||||||||||||||
|
|
|
|
|
|
|
|
|
|
|
|
|
|
|
|
|
|
|
|
|
|||||||||||||||||||||
| Change in adjusted deferred revenue |
$ | (2,569 | ) | $ | 6,581 | $ | 28,266 | $ | 20,955 | $ | (11,282 | ) | $ | 12,014 | $ | 732 | $ | 9,731 | $ | 51,482 | $ | 22,794 | ||||||||||||||||||
|
|
|
|
|
|
|
|
|
|
|
|
|
|
|
|
|
|
|
|
|
|||||||||||||||||||||
-79-
Table of Contents
Seasonality and Quarterly Trends
Our business is affected by seasonal fluctuations in customer spending patterns, which result in some seasonal trends in the sale of our solutions. Revenue in our third and fourth fiscal quarters is typically stronger due to the calendar year-end. Our first and second fiscal quarters typically experience lower sales, with revenue historically lowest in our first fiscal quarter. These fluctuations in quarterly total net revenue result in similar fluctuations in adjusted net revenue and adjusted EBITDA. Seasonal patterns may become more pronounced in the future, with our strongest sequential growth occurring in our third and fourth fiscal quarters.
In addition, total net revenue and service and subscription revenue each decreased on a year-over-year basis in each of the three-month periods ended July 31, 2015 and October 31, 2015, respectively, primarily due to the impact of the deferred revenue write down and other purchase accounting adjustments related to the Bain Acquisition. See “—Impact of Purchase Accounting Related to Mergers and Acquisitions.”
Liquidity and Capital Resources
Sources of Cash
At April 30, 2016, we had cash and cash equivalents of $136.6 million, of which approximately $118.1 million was held outside of the United States and not presently available to fund domestic operations and obligations. This cash and cash equivalents balance of $118.1 million represents cash generated outside the United States after the closing of the Bain Acquisition and is deemed to be permanently reinvested. If we were to repatriate cash held outside of the United States, it would likely be subject to U.S. income taxes, less any previously paid foreign income taxes. We do not enter into investments for trading or speculative purposes.
Our primary source of cash for funding operations and growth has been through cash flows generated from operating activities. In addition, we have funded acquisitions, capital expenditures, dividend payments, stock repurchases and to a lesser extent, our operations, through borrowings under our credit facilities, primarily in the form of long-term debt obligations. At April 30, 2016, we had $100.0 million of additional borrowing capacity under our revolving credit facility.
We believe that our existing cash on hand, expected future cash flows from operating activities, and additional borrowings available under our credit facilities will provide sufficient resources to fund our operating requirements as well as future capital expenditures, debt service requirements and investments in future growth for at least the next twelve months. Our future capital requirements will depend on many factors, including our growth rate, the timing and extent of spending to support development efforts, the expansion of sales and marketing activities, the introduction of new and enhanced product and service offerings, and the continuing market acceptance of our products. In the event that additional financing is required from outside sources, we may not be able to raise such financing on terms acceptable to us or at all. If we are unable to raise additional capital when desired, our business, operating results, and financial condition may be adversely affected.
Indebtedness
On May 22, 2015, in connection with the Bain Acquisition, we repaid our existing credit facilities in full and Blue Coat Holdings, Inc. (i) entered into a credit agreement that provides for borrowings of up to an initial aggregate principal amount of $1.25 billion, comprised of (a) a senior secured term loan facility in an aggregate principal amount of $1.15 billion (the “Initial Term Loans”), which was borrowed on May 22, 2015 and was increased on November 16, 2015 by $225.0 million aggregate principal amount of additional senior secured term loans (the “Incremental Term Loans” and, together with the Initial Term Loans, the “Senior Secured Term Loan Facility”) in connection with our acquisition of Elastica, and (b) a senior secured revolving facility in an aggregate principal amount of $100.0 million (the “Senior Secured Revolving Facility, and, together with the Senior Secured Term Loan Facility, the “Senior Secured Credit Facilities”) and (ii) issued unsecured senior notes
-80-
Table of Contents
due 2023 in an aggregate principal amount of $470.0 million (the “Senior Notes”). The Senior Secured Term Loan Facility matures on May 20, 2022. The Senior Secured Revolving Facility matures on May 22, 2020. The Senior Notes mature on June 1, 2023. Blue Coat Holdings, Inc.’s obligations under the Senior Secured Credit Facilities are guaranteed on a senior secured basis by Batman Intermediate Holdings B, Inc. and each existing and subsequently acquired or organized direct or indirect wholly-owned material domestic restricted subsidiary of Blue Coat Holdings, Inc., subject to certain customary exceptions and limitations set forth in the documentation governing the Senior Secured Credit Facilities, and the Senior Notes are guaranteed on an unsecured basis by each wholly-owned domestic subsidiary of Blue Coat Holdings, Inc. that guarantees the Senior Secured Credit Facilities. See the sections entitled “Senior Secured Credit Facilities” and “Senior Notes” below for further information on the Senior Secured Credit Facilities and Senior Notes.
As of April 30, 2016, our total outstanding indebtedness under the new credit facilities was $1.79 billion (net of $52.8 million debt issuance costs). No amounts were outstanding under the Senior Secured Revolving Facility as of April 30, 2016. Debt issuance costs are capitalized and included in the balance sheets as an asset or a direct deduction from the debt liability and are amortized into interest expense over the term of the respective borrowings using the effective interest method.
Senior Secured Credit Facilities
The principal amount of the Senior Secured Term Loan Facility amortizes in equal quarterly installments of $3.4 million, payable on the last business day of each April, July, October and January, commencing January 29, 2016, with the balance payable at maturity. The loans under the Senior Secured Credit Facilities bear interest, at the option of Blue Coat Holdings, Inc., at a rate per annum equal to (a) an adjusted LIBOR rate (with a floor of 1.00% per annum) plus an applicable margin of 3.50%, payable on the last day of the applicable interest period applicable thereto (and, in the case of an interest period in excess of three months, on each date occurring at three-month intervals after the first day of such interest period), or (b) the alternate base rate (with a floor of 2.00% per annum) plus an applicable margin of 2.50%, payable quarterly in arrears on the last business day of each April, July, October and January. The Initial Term Loans and the Incremental Term Loans under the Senior Secured Term Loan Facility were borrowed as LIBOR loans. The applicable margin for loans under the Senior Secured Revolving Facility is subject to two reductions of 0.25% below the applicable margin described above based upon Blue Coat Holdings, Inc.’s consolidated first lien net leverage ratio (which is the ratio of certain first lien secured debt, less unrestricted cash and cash equivalents of Blue Coat Holdings, Inc. and its restricted subsidiaries, to Consolidated EBITDA, as defined in the credit agreement governing the Senior Secured Credit Facilities) on a trailing four quarter basis on the last day of the most recent four fiscal quarter period for which financial statements were required to be delivered under the Senior Secured Credit Facilities.
Blue Coat Holdings, Inc. is required to comply with a maximum consolidated first lien net leverage ratio of 6.5 to 1.0 (decreasing to 5.0 to 1.0 on and after August 1, 2017) under the Senior Secured Revolving Facility. This financial covenant is tested quarterly on a trailing four quarter basis on the last day of the most recent four fiscal quarter period for which financial statements were required to be delivered under the Senior Secured Credit Facilities. However, this financial covenant is only tested if, as of the last day of the applicable fiscal quarter of Blue Coat Holdings, Inc. (commencing January 29, 2016), revolving loans under the Senior Secured Revolving Facility (including swingline loans) and certain letter of credit obligations (but excluding undrawn or cash collateralized letters of credit) are outstanding in an aggregate amount greater than 35% of the total commitments under the Senior Secured Revolving Facility at such time. If such outstanding amounts do not exceed 35% of the total commitments under the Senior Secured Revolving Facility at the end of the applicable fiscal quarter, no financial covenant is applicable.
Our first lien net leverage ratio as of April 30, 2016 was 3.9. Our first lien net leverage ratio is calculated as the ratio of certain first lien secured debt, less unrestricted cash and cash equivalents of Blue Coat Holdings, Inc. and its restricted subsidiaries to Consolidated EBITDA (as defined in the Senior Secured Revolving Facility). Consolidated EBITDA is calculated by adding the change in adjusted deferred revenue for the period, and certain
-81-
Table of Contents
strategic consulting, non-acquisition employee retention, and other public company costs that are permitted to be excluded under the agreements governing our Senior Secured Revolving Facility and the indenture governing our Senior Notes, to Adjusted EBITDA for the period. See “Selected Consolidated Financial Data—Non-GAAP Financial Measures” and “—Reconciliation of Non-GAAP Financial Measures” for a reconciliation of Adjusted EBITDA to net income (loss). Strategic consulting, non-acquisition employee retention, and other public company costs were $0.9 million, $3.1 million and $11.7 million, for the years ended April 30, 2014, 2015 and 2016, respectively. Quarterly strategic consulting, non-acquisition employee retention, and other public company costs were $0.9 million, $0.2 million, $1.6 million and $0.4 million in fiscal 2015 and $1.1 million, $3.7 million, $2.0 million and $4.9 million in fiscal 2016.
At April 30, 2016, the interest rate on the outstanding balances under the Senior Secured Term Loan Facility was 4.5%. At April 30, 2016, we had a total of $100.0 million of availability for additional borrowings under the Senior Secured Revolving Facility as we had no outstanding borrowings and no letters of credit outstanding which would reduce availability under the Senior Secured Revolving Facility on such date.
Senior Notes
The Senior Notes bear interest at a rate per annum of 8.375%, payable semi-annually. At any time and from time to time prior to June 1, 2018, Blue Coat Holdings, Inc. may, at its option, redeem up to 40% of the aggregate principal amount of the Senior Notes issued under the indenture governing the Senior Notes at a redemption price equal to 108.375% of the principal amount of the Senior Notes redeemed, plus accrued and unpaid interest to, but excluding, the redemption date with the net cash proceeds received by, or contributed to it or any of its restricted subsidiaries from certain equity offerings, including this offering; provided that: (1) in each case the redemption takes place not later than 180 days after the closing of the related equity offering, and (2) not less than 50% of the original aggregate principal amount of the Senior Notes issued under the indenture governing the Senior Notes remains outstanding immediately thereafter, excluding Senior Notes held by Blue Coat Holdings, Inc. or any of its restricted subsidiaries.
At any time and from time to time on and after June 1, 2018, we may redeem the Senior Notes at our option, in whole or in part, based on the following agreed-upon schedule of redemption prices if redeemed during the 12-month period beginning on June 1 of each of the years indicated below:
| Year |
Percentage | |||
| 2018 |
104.188 | % | ||
| 2019 |
102.094 | % | ||
| 2020 |
101.047 | % | ||
| 2021 and thereafter |
100.000 | % | ||
We and our subsidiaries, affiliates or significant stockholders may also from time to time seek to directly or indirectly retire or purchase our outstanding debt through cash purchases and/or exchanges for other securities or instruments, in open market purchases, privately negotiated transactions, by tender offer or otherwise. Such repurchases and/or exchanges, if any, will depend on prevailing market conditions, our liquidity requirements, contractual restrictions and other factors. The amounts involved may be material.
Consolidated Statements of Cash Flows
Our cash flows for years ended April 30, 2014, 2015 and 2016 were:
| Year Ended April 30, | (Combined) Year Ended April 30, 2016 |
|||||||||||
| 2014 | 2015 | |||||||||||
| Net cash provided by operating activities |
$ | 82,210 | $ | 95,209 | $ | 134,849 | ||||||
| Net cash used in investing activities |
(282,893 | ) | (25,299 | ) | (2,853,701 | ) | ||||||
| Net cash provided by (used in) financing activities |
231,538 | (8,023 | ) | 2,652,750 | ||||||||
|
|
|
|
|
|
|
|||||||
| Net increase (decrease) in cash and cash equivalents |
$ | 30,855 | $ | 61,887 | $ | (66,102 | ) | |||||
|
|
|
|
|
|
|
|||||||
-82-
Table of Contents
Operating Activities
For the year ended April 30, 2016, net cash provided by operations was $134.8 million, as a result of a net loss of $289.1 million, non-cash charges of $139.6 million, and a net change of $284.4 million in our net operating assets and liabilities. The net change in our net operating assets and liabilities was primarily due to a $234.9 million increase in deferred revenue as a result of increases in sales of support and maintenance and subscriptions, a decrease in inventory of $29.8 million and an increase in accounts payable, accrued expenses and other liabilities of $59.2 million. These amounts were partially offset by a $28.2 million increase in prepaid expenses and other assets and a $11.2 million increase in accounts receivable.
For the year ended April 30, 2015, net cash provided by operations was $95.2 million, as a result of a net loss of $15.4 million, non-cash charges of $109.6 million, and a net change of $1.0 million in our net operating assets and liabilities. The net change in our net operating assets and liabilities was primarily due to a $64.8 million increase in deferred revenue as a result of increases in sales of support and maintenance and subscriptions, and increases in inventory and prepaid expenses and other assets of $7.7 million and $6.0 million, respectively. These changes were partially offset by a decrease in accounts payable, accrued expenses and other liabilities of $36.1 million and an increase in accounts receivable of $41.4 million.
For the year ended April 30, 2014, net cash provided by operations was $82.2 million, as a result of a net loss of $51.3 million, non-cash charges of $117.3 million, and a net change of $16.2 million in our net operating assets and liabilities. The net change in our net operating assets and liabilities was primarily due to a $75.9 million increase in deferred revenue as a result of increases in sales of support and maintenance and subscriptions, partially offset by increases in accounts receivable, inventory and prepaid expenses and other assets of $23.3 million, $13.3 million and $21.2 million, respectively. In addition, net accounts payable, accrued expenses and other liabilities decreased $1.9 million.
Quarterly working capital, excluding deferred revenue, decreased $26.4 million, $23.0 million, $12.9 million and $1.5 million, respectively, for the first, second, third and fourth quarter of fiscal 2015, increased $49.0 million, $0.3 million and $10.9 million, respectively, for the first, second and fourth quarter of fiscal 2016, and decreased $10.6 million for the third quarter of fiscal 2016, in each case compared to the prior fiscal quarter. Quarterly cash received from income tax refunds was $2.7 million for the first fiscal quarter of fiscal 2015. Thereafter, quarterly cash paid for income taxes was $1.0 million, $0.8 million, $0.6 million, $1.1 million, $1.4 million, $7.1 million and $1.5 million, respectively, for the second quarter of fiscal 2015 through the fourth quarter of fiscal 2016.
Investing Activities
For the year ended April 30, 2016, net cash used in investing activities was $2.9 billion, which primarily related to the Bain, Perspecsys and Elastica acquisitions. In addition, we used $39.3 million for capital expenditures to purchase property, equipment and license agreements for use in our operations as well as for leasehold improvements on our new Sunnyvale headquarters. Quarterly capital expenditures were $8.1 million, $5.4 million, $2.7 million and $6.0 million in fiscal 2015 and $8.0 million, $15.7 million, $6.0 million and $9.5 million in fiscal 2016.
For the year ended April 30, 2015, net cash used in investing activities was $25.3 million, which primarily consisted of purchases of property, equipment and license agreements of $22.2 million, for use in our operations. In addition, we were required to increase the amount of restricted cash held in relation to security for letters of credit on facility leases in the amount of $3.1 million.
For the year ended April 30, 2014, net cash used in investing activities was $282.9 million, which primarily related to our Netronome, Solera, and Norman Shark acquisitions, for which we paid net cash of $262.9 million. In addition, we purchased $20.2 million in property, equipment and license agreements, for use in our operations.
-83-
Table of Contents
Financing Activities
For the year ended April 30, 2016, net cash provided by financing activities was $2.7 billion, which was primarily the result of net proceeds from (i) $1.4 billion aggregate principal amount of Initial Term Loans under our Senior Secured Credit Facilities, (ii) $470.0 million of Senior Notes and (iii) issuance of common stock to private equity and employee investors of $890.0 million, partially offset by debt issuance costs of $67.0 million.
For the year ended April 30, 2015, net cash used in financing activities was $8.0 million, which primarily related to repayments of $7.5 million on our debt obligations as well as net repurchases of our common stock of $0.5 million.
For the year ended April 30, 2014, net cash provided by financing activities was $231.5 million, which primarily related to May and June 2013 amendments to our former credit agreements whereby we repaid $1.2 billion of outstanding borrowings and borrowed $1.8 billion under the amended agreements. As part of these amendments, we also paid dividends to shareholders of $155.2 million in the aggregate and repurchased common stock for $163.7 million.
Contractual Obligations
The following is a summary of our contractual obligations at April 30, 2016 (in thousands):
| Payments Due by Fiscal Year | ||||||||||||||||||||||||
| 2017 | 2018-2019 | 2020-2021 | Thereafter | Other | Total | |||||||||||||||||||
| Long-term borrowings |
$ | 13,750 | $ | 27,500 | $ | 27,500 | $ | 1,769,375 | $ | — | $ | 1,838,125 | ||||||||||||
| Cash interest expense(1) |
100,696 | 199,536 | 197,061 | 160,021 | — | 657,314 | ||||||||||||||||||
| Operating lease obligations |
10,312 | 15,972 | 11,605 | 20,244 | — | 58,133 | ||||||||||||||||||
| Other purchase obligations |
3,054 | 4,108 | — | — | — | 7,162 | ||||||||||||||||||
| Acquisition guaranteed earn-out payments(2) |
4,500 | — | — | — | — | 4,500 | ||||||||||||||||||
| Reserve for uncertain tax positions(3) |
— | — | — | — | 16,530 | 16,530 | ||||||||||||||||||
|
|
|
|
|
|
|
|
|
|
|
|
|
|||||||||||||
| Total contractual obligations |
$ | 132,312 | $ | 247,116 | $ | 236,166 | $ | 1,949,640 | $ | 16,530 | $ | 2,581,764 | ||||||||||||
|
|
|
|
|
|
|
|
|
|
|
|
|
|||||||||||||
| (1) | Represents the estimated cash interest expense based upon (i) an interest rate of 4.5% on our new Senior Secured Credit Facilities and (ii) an interest rate of 8.375% on the Senior Notes. |
| (2) | Represents guaranteed earn-out payments related to the Perspecsys acquisition on July 30, 2015. In addition, there is an earn-out of $10.0 million contingent upon achieving certain net revenue targets within the first year of acquisition. The fair value of the contingent earn-out is zero as of April 30, 2016. |
| (3) | Reserves for uncertain tax positions of $16.5 million were included in other noncurrent liabilities in the consolidated balance sheets. At this time, we are unable to make a reasonably reliable estimate of the timing of payments related to this amount due to uncertainties in the timing of tax audit outcomes. |
Critical Accounting Policies and Estimates
The preparation of our consolidated financial statements requires us to make estimates and judgments that affect the reported amounts of assets, liabilities, revenue and expenses. On an on-going basis, we make and evaluate estimates and judgments, including those related to revenue recognition, share-based compensation, goodwill and intangible assets and accounting for income taxes. We base our estimates on historical experience and various other assumptions that we believe are reasonable under the circumstances, the results of which form the basis for making judgments about amounts and timing of revenue and expenses, the carrying values of assets and the recorded amounts of liabilities that are not readily apparent from other sources. Actual results may differ from these estimates, and such estimates may change if the underlying conditions or assumptions change. We have discussed the development and selection of the critical accounting policies with the audit committee of our board of directors, and the audit committee has reviewed the related disclosures below.
-84-
Table of Contents
Revenue recognition
We operate a multiple-tier channel distribution model that includes both distributors and value-added resellers. In most cases, we sell products to distributors, who in turn sell to value-added resellers and ultimately to end-users. In these cases, we generally ship products from fulfillment centers to value-added resellers, who provide configuration services for end-users. In some cases, we sell directly to value-added resellers, who in turn sell to end-users. In these cases, we generally ship products from fulfillment centers directly to end-users.
We recognize revenue when persuasive evidence of an arrangement exists, delivery or performance has occurred, the sales price is fixed or determinable, and collection is probable. The majority of our products are hardware appliances containing software components that operate together to provide the essential functionality of the product, and therefore, these hardware appliances are considered to be non-software deliverables. Our product revenue also includes add-on stand-alone software products, either on a perpetual or term basis, that operate on our hardware appliances but are not considered essential to their functionality, as our hardware appliances can function without the add-on software products and are frequently sold without them. Customers take possession of the add-on software products and run them on their appliances purchased from us. Revenue is recognized for these products in accordance with industry-specific software revenue recognition guidance. Additionally, we sell post-contract customer support and maintenance contracts, where unspecified software updates and upgrades are offered on a when-and-if-available basis.
We enter into multiple-element revenue arrangements in which a customer may purchase a combination of hardware, perpetual and subscription software licenses, hardware and software upgrades, hardware and software maintenance, and professional services. The revenue recognition guidance for multiple deliverable arrangements requires an entity to allocate arrangement consideration to each element based on a selling price hierarchy, where the selling price for an element is based on vendor-specific objective evidence (“VSOE”), if available; third-party evidence (“TPE”), if available, and VSOE is not available; or the best estimate of selling price (“BESP”), if neither VSOE or TPE is available. Under the guidance, we allocate the arrangement fee to each non-software element based upon the relative selling price of such element and, if software and software-related elements are also included in the arrangement, we allocate the arrangement fee to each of those software and software-related elements as a group based upon our BESP for those elements. When applying the relative selling price method, we determine the selling price for each element using VSOE of selling price, if it exists, or if not, TPE of selling price, if it exists. If neither VSOE nor TPE of selling price exists for an element, we use our BESP for that element. After such allocation is made, the amount of the arrangement fee allocated to the software and software-related elements is accounted for under the industry-specific software revenue recognition guidance. The revenue allocated to each non-software element is recognized when the basic revenue recognition criteria are met for that element. We account for multiple-element arrangements that contain only software and software-related elements under the industry-specific software revenue recognition guidance.
We determine VSOE for each element based on historical stand-alone transactions. VSOE of fair value is based on the price charged when the element is sold separately. We analyze our stand-alone hardware and software maintenance renewals by stratification of sales channel and service offering. We determine the VSOE of fair value for hardware and software maintenance by analyzing our stand-alone maintenance renewals and noting that a substantial majority of transactions fall within a narrow range for each stratum.
We typically are not able to determine TPE for our products, maintenance or professional services. TPE is determined based on competitor prices for similar elements when sold separately. Generally, our offerings contain a significant level of differentiation such that the comparable pricing of products with similar functionality cannot be obtained. Furthermore, our go-to-market strategy differs from that of our peers and we are unable to reliably determine what similar competitor products’ selling prices are on a stand-alone basis.
When we are unable to establish the selling price of an element using VSOE or TPE, we use BESP in the allocation of arrangement consideration. We determine BESP for a product or service by considering multiple
-85-
Table of Contents
factors, including, but not limited to, historical pricing practices by geography, current market trends, customer class and distribution channel, and gross margin objectives, such that we can make an estimate of the price at which we would transact a sale if the product or service was sold on a stand-alone basis.
Service and subscription revenue, which primarily consists of sales of new and renewal hardware and software support contracts, software subscriptions, cloud subscriptions, and to a lesser extent professional services and training, is recognized ratably over the term of the contract, with the related expenses recognized as incurred. Support, software subscriptions and cloud subscriptions typically have a term of one to three years, with average terms of approximately two years. Unearned service and subscription revenue is included in deferred revenue.
We recognize revenue from the sale of third-party anti-virus subscriptions, net of royalties paid, and classify this revenue as service and subscription revenue in our consolidated statements of operations.
Stock-based compensation
We issue equity awards to employees and non-employees, generally in the form of common stock options and restricted stock. We account for our equity awards in accordance with Financial Accounting Standards Board, or FASB, Accounting Standard Codification Topic 718, Compensation—Stock Compensation, or ASC 718, which requires all equity-based payments to employees to be recognized in the consolidated statements of operations based on their fair values. As there has been no public market for our common stock to date, the estimated fair value of our common stock has been determined by our board of directors or our compensation committee. We have periodically determined for financial reporting purposes the estimated fair value of our common stock at various dates using contemporaneous valuations performed in accordance with the guidance outlined in the American Institute of Certified Public Accountants Practice Aid, Valuation of Privately-Held Company Equity Securities Issued as Compensation, also known as the Practice Aid. We generally use the income and market approaches prescribed in the Practice Aid, in particular the income approach’s discounted cash flow method, which was based on our projections and estimated discount rate and the guideline public company, guideline transactions and precedent transaction methodologies, based on inputs from comparable public companies’ equity valuations, comparable acquisition transactions and transactions in our own equity securities, to estimate the enterprise value of our company. We performed these contemporaneous valuations quarterly. The assumptions underlying these valuations represent management’s best estimates, which involve inherent uncertainties and the application of management judgment. As a result, if factors or expected outcomes change and we use significantly different assumptions or estimates, our equity-based compensation could be materially different. Following the completion of this offering, we expect to use a market-based valuation to determine the grant date fair value of our common stock.
Acquisitions, goodwill and identifiable intangible assets
We account for acquired businesses using the acquisition method of accounting, which requires that the assets acquired, liabilities assumed, contractual contingencies and contingent consideration be recorded at the date of acquisition at their respective fair values. Goodwill is measured as a residual as of the acquisition date, which in most cases results in measuring goodwill as an excess of the purchase consideration transferred plus the fair value of any non-controlling interest in the acquiree over the fair value of net assets acquired, including any contingent consideration. It further requires acquisition-related costs to be recognized separately from the acquisition and expensed as incurred, restructuring costs to be expensed in periods subsequent to the acquisition date, and changes in accounting for deferred tax asset valuation allowances and acquired income tax uncertainties after the measurement period to impact the provision for income taxes. In addition, acquired in-process research and development is capitalized as an intangible asset and amortized over its estimated useful life.
The fair value of identifiable intangible assets is based on significant judgments made by management. We typically engage third-party valuation appraisal firms to assist us in determining the fair values and useful lives
-86-
Table of Contents
of the assets acquired. Such valuations and useful life determinations require us to make significant estimates and assumptions. These estimates and assumptions are based on historical experience and information obtained from the management of the acquired companies, and also include, but are not limited to, future expected cash flows earned from the product-related technology and discount rates applied in determining the present value of those cash flows. Unanticipated events and circumstances may occur that could affect the accuracy or validity of such assumptions, estimates or actual results. Acquisition-related identifiable intangible assets generally are amortized on a straight- line basis over their estimated economic lives. Developed technology comprises products that have reached technological feasibility and are a part of the acquisition’s product lines, and patents related to the design and development of those products. Customer relationships represent the acquisition’s underlying relationships with its customers. Service and product backlogs consist of customer commitments for the purchase of the acquired companies’ product and service offerings.
Our policy is to perform goodwill impairment tests annually in the fourth fiscal quarter, and whenever events or changes in circumstances indicate that the carrying amount of goodwill may not be recoverable. The first step of the test identifies whether potential impairment may have occurred, and the second step of the test measures the amount of the impairment, if any. An impairment of goodwill is recognized when the carrying amount of the assets exceeds their fair value. The process of evaluating the potential impairment of goodwill is highly subjective and requires the application of significant judgment. For purposes of the annual impairment test, we consider the estimated or appraised fair value of our privately held common equity compared with the carrying amount of our net assets on the date of the test, since we have only one reporting unit.
We evaluate long-lived assets, including identifiable intangible assets, for impairment whenever events or changes in circumstances indicate that the carrying amount of the assets may not be recoverable. Events or changes in circumstances that could result in an impairment review include, but are not limited to, significant under performance relative to historical or projected future operating results, significant changes in the manner of use of the acquired assets or the strategy for our overall business, and any significant negative industry or economic trends. Impairment is recognized when the carrying amount of an asset exceeds its fair value as calculated on a discounted cash flow basis.
Income taxes
We use the liability method to account for income taxes. As part of the process of preparing our consolidated financial statements, we are required to estimate income taxes in each of the jurisdictions in which we operate. This process involves determining our income tax expense and calculating the deferred income tax expense related to temporary differences resulting from the differing treatment of items for tax and accounting purposes, such as deferred revenue or deductibility of the amortization of certain intangible assets. These temporary differences result in deferred tax assets or liabilities, which are included within the consolidated balance sheets.
We record a valuation allowance to reduce certain deferred tax assets to an amount that we estimate is more likely than not to be realized. We consider estimated future taxable income and prudent tax planning strategies in determining the need for a valuation allowance. When we determine that it is more likely than not that some or all of our deferred tax assets will be realizable by either refundable income taxes or future taxable income, the valuation allowance will be reduced and the related tax impact will be recorded as a reduction to the tax provision in that period. Likewise, should we determine that we are not likely to realize all or part of our deferred tax assets in the future, an increase to the valuation allowance would be recorded as an increase to the tax provision in the period such determination was made.
As a multinational corporation, we conduct our business in many countries and are subject to taxation in many jurisdictions. The taxation of our business is subject to the application of multiple and conflicting tax laws and regulations, as well as multinational tax conventions. Our effective tax rate is highly dependent upon the geographic distribution of our worldwide earnings or losses, the tax regulations in each geographic region, the
-87-
Table of Contents
availability of tax credits and carryforwards, and the effectiveness of our tax planning strategies. The application of tax laws and regulations is subject to legal and factual interpretation, judgment and uncertainty. Tax laws themselves are subject to change as a result of changes in fiscal policy, changes in legislation, and the evolution of regulations and court rulings. Consequently, tax authorities may impose tax assessments or judgments against us that could materially impact our tax liability and/or our effective income tax rate.
We use a two-step approach to recognizing and measuring uncertain tax positions. The first step is to evaluate the tax position for recognition by determining if the weight of available evidence indicates that it is more likely than not that the position will be sustained on audit, including resolution of related appeals or litigation processes, if any. The second step is to measure the tax benefit as the largest amount that is more likely than not to be realized upon settlement. We review our uncertain tax benefits quarterly, and we may adjust such uncertain tax benefits because of proposed assessments by tax authorities, changes in facts and circumstances, issuance of new regulations or new case law, previously unavailable information obtained during the course of an examination, negotiations with tax authorities of different countries concerning our transfer pricing, resolution with respect to individual audit issues or audit years, or the expiration of statutes of limitations. In addition, our tax contingency reserve includes certain amounts for potential tax assessments for pre-acquisition tax years of acquired companies, which, if recognized, will be recorded to our provision for income taxes. We have elected to classify interest and penalties related to unrecognized tax benefits as a component of provision for income taxes.
Recent Accounting Pronouncements
In March 2016, the FASB issued Accounting Standard Update (“ASU”) 2016-09, Compensation-Stock Compensation (Topic 718): Improvements to Employee Share-Based Payment Accounting, related to simplifications of employee share-based payment accounting. This ASU eliminates the APIC pool concept and requires that excess tax benefits and tax deficiencies be recorded in the income statement when awards are settled. The ASU also addresses simplifications related to statement of cash flows classification, accounting for forfeitures, and minimum statutory tax withholding requirements. The ASU is effective for fiscal years and interim periods within those annual periods beginning after December 15, 2016. We are currently evaluating the impact that the adoption of this standard will have on our consolidated financial statements and related disclosures.
In February 2016, the FASB issued ASU 2016-02, Leases (Topic 842), which requires lessees to record most leases on their balance sheets. Lessees initially recognize a lease liability (measured at the present value of the lease payments over the lease term) and a right-of-use (“ROU”) asset (measured at the lease liability amount, adjusted for lease prepayments, lease incentives received and the lessee’s initial direct costs). Lessees can make an accounting policy election to not recognize ROU assets and lease liabilities for leases with a lease term of 12 months or less as long as the leases do not include options to purchase the underlying assets that the lessee is reasonably certain to exercise. For lessors, the guidance modifies the classification criteria and the accounting for sales-type and direct financing leases. The ASU is effective for fiscal years and interim periods within those fiscal years beginning after December 15, 2018. Early adoption is permitted for all entities. The standard requires the use of a modified retrospective approach for leases that exist or are entered into after the beginning of the earliest comparative period in the financial statements. Full retrospective application is prohibited. We are beginning to evaluate the impact that the adoption of this standard will have on our consolidated financial statements and related disclosures.
In November 2015, the FASB issued ASU 2015-17, Income Taxes (Topic 740): Balance Sheet Classification of Deferred Taxes on the classification of deferred tax assets and liabilities. This ASU, as part of the FASB’s simplification initiative, requires all companies that present a classified balance sheet to present all deferred tax assets and liabilities as noncurrent regardless of the timing of the expected reversal of the related deferred tax asset or liability. This ASU is effective for annual reporting periods beginning after December 16, 2016, but early adoption is permitted. We elected to adopt the guidance in the third quarter of fiscal 2016 on a prospective basis. As a result, we have presented all deferred tax assets and liabilities as noncurrent on our
-88-
Table of Contents
consolidated balance sheet as of April 30, 2016, but have not reclassified current deferred tax assets and liabilities on our consolidated balance sheet as of April 30, 2015. There was no impact on our results of operations as a result of the adoption of ASU 2015-17.
In September 2015, the FASB issued ASU No. 2015-16, Business Combinations (Topic 805): Simplifying the Accounting for Measurement-Period Adjustments, which eliminates the requirement for an acquirer in a business combination to account for measurement-period adjustments retrospectively. Under this ASU, acquirers must recognize measurement-period adjustments in the period in which they determine the amounts, including the effect on earnings of any amounts they would have recorded in previous periods if the accounting had been completed at the acquisition date. This guidance is effective for fiscal years beginning after December 15, 2016, with early adoption permitted. We are currently evaluating the impact that the adoption of this standard and do not expect the adoption to have a material effect on our consolidated financial statements.
In July 2015, the FASB issued ASU No. 2015-11 (Subtopic 330), Simplifying the Measurement of Inventory, which provides guidance to companies who account for inventory using either the first-in, first-out (“FIFO”) or average cost methods. The guidance states that companies should measure inventory at the lower of cost and net realizable value. Net realizable value is defined as the estimated selling prices in the ordinary course of business, less reasonably predictable costs of completion, disposal and transportation. This ASU is effective for fiscal years beginning after December 15, 2016. Early adoption is permitted. We are currently evaluating the effect of the adoption of the standard will have on our consolidated financial statements and related disclosures.
In May 2015, the FASB issued ASU 2015-08, Business Combinations (Topic 805): Pushdown Accounting- Amendments to SEC Paragraphs Pursuant to Staff Accounting Bulletin No. 115, which supersedes several paragraphs in ASC 805-50 in response to the November 2014 publication of Staff Accounting Bulletin (“SAB”) No. 115 by the SEC. The SEC issued SAB No. 115 in connection with the release of the FASB’s ASU No. 2014- 17, Pushdown Accounting. The standard provides an acquired entity with an option to apply pushdown accounting in its separate financial statements upon occurrence of an event in which an acquirer obtains control of the acquired entity. The guidance is effective immediately and had no impact on our consolidated financial statements and related disclosures.
In April 2015, the FASB issued ASU 2015-03, Interest-Imputation of Interest (Subtopic 835-30): Simplifying the Presentation of Debt Issuance Costs. ASU 2015-03 will require an entity to present debt issuance costs in the balance sheet as a direct deduction from the carrying amount of the related debt liability rather than as an asset, consistent with the treatment of debt discounts. The amendment does not change the recognition and measurement guidance for debt issuance costs, and the amortization of debt issuance costs will continue to be reported as interest expense. ASU 2015-03 is effective for annual reporting periods beginning after December 15, 2016. Early adoption is permitted. The new guidance will be applied retrospectively to each prior period presented. We do not expect the adoption to have a material effect on our consolidated financial statements.
In August 2014, the FASB issued ASU No. 2014-15, Presentation of Financial Statements-Going Concern (Subtopic 205-40): Disclosure of Uncertainties about an Entity’s Ability to Continue as a Going Concern. ASU 2014-15 will explicitly require management to assess the entity’s ability to continue as a going concern at each annual and interim period. Related footnote disclosures will be required if conditions give rise to substantial doubt about an entity’s ability to continue as a going concern within one year after the report issuance date. If conditions do not give rise to substantial doubt, no disclosures will be required that are specific to going concern uncertainties. ASU 2014-15 is effective for reporting periods ending after December 15, 2016, and early adoption is permitted. We are currently evaluating the impact of the future adoption of this standard, but we do not expect the adoption to have a material effect on our consolidated financial statements.
In June 2014, the FASB issued ASU No. 2014-12, Compensation-Stock Compensation (Topic 718): Accounting for Share-Based Payments When the Terms of an Award Provide that a Performance Target Could be Achieved after the Requisite Service Period. ASU 2014-12 requires that a performance target that affects
-89-
Table of Contents
vesting and that could be achieved after the requisite service period be treated as a performance condition. A reporting entity should apply existing guidance in Accounting Standards Codification (ASC) Topic No. 718, “Compensation-Stock Compensation,”as it relates to awards with performance conditions that affect vesting to account for such awards. ASU 2014-12 is effective for annual periods and interim periods within those annual periods beginning after December 15, 2015. Early adoption is permitted. We are currently assessing the potential impact of this accounting standard.
In May 2014, the FASB issued ASU 2014-09, Revenue from Contracts with Customers, which requires an entity to recognize the amount of revenue to which it expects to be entitled for the transfer of promised goods or services to customers. This ASU is based on the principle that revenue is recognized to depict the transfer of goods or services to customers in an amount that reflects the consideration to which the entity expects to be entitled in exchange for those goods or services. This ASU also requires additional disclosure about the nature, amount, timing and uncertainty of revenue and cash flows arising from customer contracts, including significant judgments and changes in judgments and assets recognized from costs incurred to obtain or fulfill a contract. In August 2015, the FASB issued ASU 2015-14 which deferred the effective date of the new revenue standard to annual periods beginning after December 15, 2018 for private companies and December 15, 2017 for public companies. In March 2016, the FASB issued ASU 2016-08, Revenue from Contracts with Customers: Principal versus Agent Considerations (Reporting Revenue Gross versus Net), which clarifies the guidance in the new revenue standard on assessing whether an entity is a principal or agent in a revenue transaction. This conclusion impacts whether an entity reports revenue on a gross or net basis. In April 2016, the FASB issued ASU 2016-10, Revenue from Contracts with Customers: Identifying Performance Obligations and Licensing, which clarifies the guidance in the new revenue standard regarding an entity’s identification of its performance obligations in a contract, as well as an entity’s evaluation of the nature of its promise to grant a license of intellectual property and whether or not that revenue is recognized over time or at a point in time. In May 2016, the FASB issued ASU 2016-12, Revenue from Contracts with Customers: Narrow-Scope Improvements and Practical Expedients, which amends the guidance in the new revenue standard on collectibility, non-cash consideration, presentation of sales tax, and transition. The amendments are intended to address implementation issues that were raised by stakeholders and provide additional practical expedients to reduce the cost and complexity of applying the new revenue standard. These pronouncements have the same effective date as the new revenue standard. We are currently evaluating the transition methods and the effect that these ASUs will have on our consolidated financial statements and related disclosures.
In July, 2013, the FASB issued ASU 2013-11, Liabilities (Topic 405): Income Taxes (Topic 740): Presentation of an Unrecognized Tax Benefit When a Net Operating Loss Carryforward, a Similar Tax Loss, or a Tax Credit Carryforward Exists. ASU 2013-11 provides explicit guidance on the financial statement presentation of an unrecognized tax benefit when a net operating loss carryforward or a tax credit carryforward exists. Under this ASU, our unrecognized tax benefit, or a portion of an unrecognized tax benefit, should be presented in the financial statements as a reduction to a deferred tax asset for a net operating loss carryforward or a tax credit carryforward. We adopted ASU 2013-11 during the third quarter of fiscal 2016. The adoption of the ASU did not have a material effect on our consolidated financial statements.
Quantitative and Qualitative Disclosures about Market Risk
We are exposed to certain risk arising from both our business operations and economic conditions. We principally manage our exposure to a wide variety of business and operational risks through management of our core business activities. We manage economic risks, including interest rate, liquidity, and credit risk primarily by managing the amount, sources, and duration of our debt funding and through the use of derivative financial instruments.
Foreign Currency Exchange Risk
Our sales contracts are primarily denominated in U.S. dollars. A portion of our operating expenses are incurred outside of the United States and are denominated in foreign currencies and are subject to fluctuations
-90-
Table of Contents
due to changes in foreign currency exchange rates, particularly changes in the Canadian Dollar, British Pound, Australian Dollar and Japanese Yen. Additionally, fluctuations in foreign currency exchange rates may cause us to recognize transaction gains and losses in our consolidated statement of operations. The effect of an immediate 10% adverse change in foreign exchange rates on monetary assets and liabilities at April 30, 2016 would not be material to our financial condition or results of operations. To date, foreign currency transaction gains and losses and exchange rate fluctuations have not been material to our financial statements, and we have not engaged in any foreign currency hedging transactions.
As our international operations continue to grow, our risks associated with fluctuation in currency rates will become greater, and we will continue to reassess our approach to managing this risk, such as using foreign currency forward and option contracts to hedge certain exposures to fluctuations in foreign currency exchange rates. In addition, currency fluctuations or a weakening U.S. dollar can increase the costs of our international expansion, and the currently strengthening U.S. dollar could slow international demand as products and services priced in U.S. dollars become more expensive.
Interest Rate Risk
We utilize long-term debt to, among other things, finance our acquisitions and, to a lesser extent, our operations. We are exposed to interest rate risk on our outstanding floating rate debt instruments which bear interest at rates that fluctuate with changes in certain short-term prevailing interest rates. Borrowings under the Senior Secured Credit Facilities bear interest, at our option, either at an alternate base rate (which is the highest of the “U.S. Prime Lending Rate” quoted in the Wall Street Journal print edition on the date of determination, the federal funds effective rate for the date of determination plus 1⁄2 of 1% or a one month Eurocurrency rate plus 1.00%), plus an applicable margin, or a Eurocurrency rate determined by reference to LIBOR, plus an applicable margin, subject to established floors of 2.00%, in the case of the alternate base rate, or 1.00%, in the case of the Eurocurrency rate. During the years ended April 30, 2016, 2015 and 2014, applicable interest rates have been substantially lower than the designated floors under our prior credit facilities and the Senior Secured Credit Facilities; therefore, interest rates under our prior credit facilities and the Senior Secured Credit Facilities have not been subject to change. Assuming that the rates remain below the applicable floors under the Senior Secured Credit Facilities, a 25 basis point increase or decrease in the applicable interest rates on our variable rate debt, excluding debt outstanding under the Senior Secured Credit Facilities, would result in a minor change in interest expense on an annual basis.
In September 2015, the Company entered into derivative financial instruments to manage exposures that arise from business activities that result in the payment of future known and uncertain cash amounts, the value of which are determined by interest rates. The Company’s derivative financial instruments are used to manage differences in the amount, timing, and duration of the Company’s known or expected cash payments principally related to the Company’s variable-rate borrowings.
A hypothetical 10% increase or decrease in interest rates during any of the periods presented would not have had a material impact on our interest expense.
Recent Acquisitions
On July 30, 2015 we completed the acquisition of Perspecsys, a leader in enterprise cloud data protection solutions. On November 16, 2015 we completed the acquisition of Elastica, a leader in CASB solutions.
We believe these acquisitions will position us as a leader in the CASB segment and enable us to offer the industry’s widest range of CASB capabilities within our market-leading Secure Web Gateway portfolio. When comparing Perspecsys’ and Elastica’s most recent full fiscal year pretax income (loss) to our most recent full fiscal year pretax income (loss), the acquisitions are considered individually significant for financial reporting purposes. As a result, elsewhere in this prospectus we have included the audited financial statements for the two
-91-
Table of Contents
most recent fiscal years, and applicable unaudited interim periods for each acquisition, as well as combined pro forma financial statements to reflect each acquisition as if it had occurred on May 1, 2015, the first day of our 2016 fiscal year. See “Consolidated Financial Statements - Unaudited Pro Forma Condensed Combined Financial Statements” for Perspecsys and Elastica.
We have made a number of other acquisitions, including Norman Shark on December 10, 2013, Solera Networks on May 31, 2013 and the SSL Visibility business from Netronome Systems on May 9, 2013. Results of operations from these acquisitions have been included in our consolidated financial statements since their respective dates of acquisition.
The following unaudited pro forma combined financial information presents the Company’s results as though the Bain Acquisition had occurred on May 1, 2015, but does not include the pro forma results of any of our other acquisitions. The unaudited pro forma results were derived from the Company’s audited historical consolidated statements of operations for the fiscal year ended April 30, 2016. Although the period from May 1, 2015 to May 22, 2015 relates to the Predecessor and the period from May 23, 2015 to April 30, 2016 relates to the Successor, in order to assist in the period to period comparison we have combined these periods as a sum of the amounts without any other adjustments and refer to the combined period as the combined year ended April 30, 2016. This information is for informational purposes only, is subject to a number of estimates, assumptions and other uncertainties, and may not be indicative of the results of operations that would have been achieved if the acquisition had taken place at May 1, 2015.
| Year Ended April 30, 2016 | ||||||||||||||
| Combined | Pro forma adjustments |
Pro forma combined |
||||||||||||
| (In thousands) | (Unaudited) | (Unaudited) | (Unaudited) | |||||||||||
| Net revenue: |
||||||||||||||
| Product |
$ | 313,819 | $ | (36 | ) | (1) | $ | 313,783 | ||||||
| Service and subscription |
284,518 | (3,343 | ) | (1) | 281,175 | |||||||||
|
|
|
|
|
|
|
|||||||||
| Total net revenue |
598,337 | (3,379 | ) | 594,958 | ||||||||||
|
|
|
|
|
|
|
|||||||||
| Cost of net revenue: |
||||||||||||||
| Product |
135,806 | (713 | ) | (2) | 135,093 | |||||||||
| Service and subscription |
69,711 | 378 | (2) | 70,089 | ||||||||||
|
|
|
|
|
|
|
|||||||||
| Total cost of net |
205,517 | (335 | ) | 205,182 | ||||||||||
|
|
|
|
|
|
|
|||||||||
| Gross profit |
392,820 | (3,044 | ) | 389,776 | ||||||||||
|
|
|
|
|
|
|
|||||||||
| Operating expenses: |
||||||||||||||
| Sales and marketing |
241,118 | — | 241,118 | |||||||||||
| Research and development |
131,367 | — | 131,367 | |||||||||||
| General and administrative |
148,169 | (24,007 | ) | (3) | 124,162 | |||||||||
| Amortization of intangible assets |
122,757 | 4,803 | (2) | 127,560 | ||||||||||
| Change in fair value of acquisition-related earn-out liability |
(970 | ) | — | (970 | ) | |||||||||
| Restructuring and other charges |
2,857 | — | 2,857 | |||||||||||
|
|
|
|
|
|
|
|||||||||
| Total operating expenses |
645,298 | (19,204 | ) | 626,094 | ||||||||||
|
|
|
|
|
|
|
|||||||||
| Operating income (loss) |
(252,478 | ) | 16,160 | (236,318 | ) | |||||||||
| Interest income |
144 | — | 144 | |||||||||||
| Interest expense |
(103,372 | ) | (6,236 | ) | (4) | (109,608 | ) | |||||||
| Debt extinguishment and refinancing costs |
(3,406 | ) | — | (3,406 | ) | |||||||||
| Other expense, net |
(1,108 | ) | — | (1,108 | ) | |||||||||
|
|
|
|
|
|
|
|||||||||
| Loss before income taxes |
(360,220 | ) | 9,924 | (350,296 | ) | |||||||||
| Income tax provision (benefit) |
(71,139 | ) | 3,771 | (5) | (67,368 | ) | ||||||||
|
|
|
|
|
|
|
|||||||||
| Net income (loss) |
$ | (289,081 | ) | $ | 6,153 | $ | (282,928 | ) | ||||||
|
|
|
|
|
|
|
|||||||||
The unaudited pro forma condensed combined statement of operations adjustments include:
-92-
Table of Contents
| (1) | Adjustments to product and service and subscription revenue to reflect (i) the impact of the write down of deferred revenue acquired and (ii) the reversal of the impact of the write-down of deferred revenue actually incurred over the periods presented. |
| (2) | Adjustments to reflect (i) the impact of the amortization of intangible assets acquired and (ii) the reversal of the amortization of intangible assets actually incurred over the periods presented. The adjustment to product cost of net revenue resulted in a benefit due to the fact that product-related intangible assets were written down in the Bain acquisition. The estimated amortization for each period reflects the amounts and estimated useful lives as recorded in purchase accounting. Intangible assets acquired and their estimated useful lives are shown below: |
| Intangible Type |
Fair Value (in thousands) |
Useful Life |
||||||
| Trade names, Blue Coat |
$ | 220,000 | Indefinite | |||||
| Customer relationships |
635,000 | 13 years | ||||||
| Product backlog |
1,600 | 3 months | ||||||
| Developed technology |
210,000 | 6 years | ||||||
| (3) | Adjustments to eliminate transaction costs incurred that are nonrecurring and directly attributable to the Bain Acquisition. |
| (4) | Adjustments to reflect the impact to interest expense of repaying our previous credit facilities and replacing them with new credit facilities and unsecured senior notes, as if the transaction occurred on May 1, 2015. The new sources of financing are: (i) new credit facilities in an initial aggregate principal amount of $1.25 billion, comprised of (a) a senior secured term loan facility in an aggregate principal amount of $1.15 billion, and (b) a senior secured revolving facility in an aggregate principal amount of $100.0 million, and (ii) unsecured senior notes due 2023 in an aggregate principal amount of $470.0 million. |
| (5) | Adjustments to reflect the estimated impact to the income tax provision (benefit) for the adjustments identified. |
-93-
Table of Contents
Overview
We are a leading provider of advanced web security solutions for global enterprises and governments. Our mission is to protect enterprises and their users from cyber threats – whether they are on the enterprise network, on the web, in the cloud or mobile.
Enterprise users have expanded beyond employees working exclusively in a corporate office operating behind a network firewall, to mobile workers capable of accessing many corporate applications in the corporate data center or in the cloud using any device. The expanding enterprise network has increased the vulnerability of corporate networks at a time when the number and severity of cyber-attacks has escalated significantly. Threats that target users are particularly damaging and increasing in frequency. We believe as web traffic continues to grow exponentially, the proportion of web traffic that currently flows through the SSL as encrypted traffic will increase rapidly, and currently exceeds 50% of all web traffic in certain industries. Many organizations do not have adequate decryption capabilities and therefore encrypted web traffic can be used to hide malicious activities. At the same time, organizations are undergoing fundamental shifts in technology, including rapid adoption of cloud-based applications, increased remote user connectivity, and consumerization of IT. These shifts have required a new paradigm in security that is focused on the user and user activities, as the traditional network- and device-centric security models face significant limitations. A security solution in the cloud generation must be able to continuously categorize changing websites, inspect all traffic running through an organization, allow users to utilize modern applications and technologies, and secure users wherever they are and however they access data in the expanding enterprise network.
Our Secure Web Gateway is based on our web proxy, which acts as a gatekeeper between a user and the Internet, ensuring that the web traffic flowing into or out of an organization is inspected and controlled. We are situated in-line, or in the flow, with network traffic for real-time inspection with the ability to block and prevent threats as they are detected. This technology is critical to securing the modern enterprise in the era of cloud-based applications, ubiquitous high-speed Internet connections, and mobile device proliferation. According to IDC, we were the worldwide leader in the web security market in 2014. We held a 43% share of the web security appliance market in 2014, up from 40% in 2013, which was more than two times larger than our closest competitor, as reported by IDC. We have been recognized as a “leader” in Gartner’s Magic Quadrant for Secure Web Gateway every year since 2007.
We have continued to expand our offerings to address evolving user needs and the changing threat landscape. We focus on innovation, as demonstrated through our investment in product development and new product offerings as well as our broad portfolio of over 230 patents and pending patent applications. Through continued investment in research and development and strategic technology acquisitions, we have designed the Blue Coat Security Platform around the following six solution areas:
| • | Advanced Web and Cloud Security—on-premise and cloud-delivered secure web gateway and cloud application security broker |
| • | Advanced Threat Protection—content analysis, malware analysis and mail threat defense |
| • | Encrypted Traffic Management—policy-based encrypted traffic visibility and cloud data protection |
| • | Incident Response, Analytics and Forensics—security analytics and remediation |
| • | Protecting Web Applications—a web application firewall and reverse proxy to secure corporate-deployed web applications |
| • | Network Performance and Optimization—optimization of traffic flow, quality-of-service and caching |
Our solutions share a common core software architecture that enables the configuration and deployment of a unified set of security policies quickly and efficiently across the expanding enterprise network. Our Blue Coat
-94-
Table of Contents
Security Platform utilizes insight from our Global Intelligence Network, a cloud-based service that analyzes and categorizes over a billion new web requests per day from users to websites, domains, and servers. We also provide open integration to the Blue Coat Security Platform, which allows third-party security assets to integrate with our products to reinforce our trusted position as a foundational part of our customers’ security infrastructure. Our extensive suite of solutions, advanced threat detection and analysis, and deep integration within network infrastructures are designed to enhance our value to our customers and the overall security market.
We offer our products on-premise, in the cloud, or through a virtual appliance to best suit the needs of our customers. Our solutions are delivered as appliances, perpetual software licenses, and subscription services. We have invested substantially in our cloud service, which now spans six continents. Our hybrid deployment supports our customers whether they want to deploy our solution on-premise, in the cloud or both.
We market and sell our products through a worldwide network of approximately 2,000 channel partners that collectively have a global reach, ranging from strategic and large enterprises to small and mid-sized businesses. We employ a direct-touch sales force that focuses on large accounts and collaborates with channel partners to provide products and support. Our sales are completed almost entirely through our channel partners, supported by our robust channel sales and marketing infrastructure. We have a disciplined approach to sales strategy that allows us to maximize resources while maintaining profitable growth.
As of April 30, 2016, we served over 15,000 organizations and government entities across over 120 countries, including over 70% of the Fortune Global 500. We have a loyal and long-term customer base, and since 2012 we have maintained an annual customer retention rate for our top 1,000 end user customers of greater than 95%.
Our business has experienced strong growth in recent periods. During fiscal 2016, 2015 and 2014, our net revenue, excluding the impact of purchase accounting, which we refer to as adjusted net revenue, was $755.4 million, $642.9 million and $631.8 million, respectively, representing year-over-year growth in fiscal 2016 and 2015 of approximately 17% and 2%, respectively. Fiscal 2014 included approximately $50 million more refresh product revenue than fiscal 2015, related to our SWG 8100 refresh program. Our adjusted EBITDA was $222.8 million, $196.5 million and $183.2 million for fiscal 2016, 2015 and 2014, respectively, representing approximately 30%, 31% and 29% of adjusted net revenue for fiscal 2016, 2015 and 2014, respectively. Adjusted net revenue and adjusted EBITDA are financial measures that are not prepared in accordance with GAAP. Refer to “Selected Consolidated Financial Data—Non-GAAP Financial Measures” and “—Reconciliation of Non-GAAP Financial Measures” for a description of adjusted net revenue and adjusted EBITDA, and a reconciliation of these measures to GAAP. Our net revenue for fiscal 2016, 2015 and 2014 was $598.3 million, $631.3 million and $606.5 million, respectively. Our net loss was $289.1 million, $15.4 million and $51.3 million for fiscal 2016, 2015 and 2014, respectively. Our net loss for fiscal 2016 includes the impact of purchase accounting adjustments related to the Bain Acquisition.
Industry Background
Sophisticated cyber-attacks and increased government regulation are placing pressure on IT organizations
Cyber-attacks have evolved from random activity conducted by individuals into highly sophisticated, organized and global attacks by malicious insiders, “hacktivists”, criminal syndicates and nation-states. The frequency and severity of these attacks is growing as individuals connect their entire lives to the Internet and as organizations generate and store more data and adopt new technologies.
Regulatory authorities are struggling worldwide to keep up with the pace of technological change and the amount of sensitive data shared and stored across the Internet. Existing statutes and regulations in the United States, the European Union and elsewhere impose restrictions on data use, mandate certain data security safeguards, and otherwise increase regulatory compliance requirements for organizations. However, there is no
-95-
Table of Contents
uniform global framework for addressing data privacy and security and the regulatory landscape is continuously shifting. High profile data breaches, such as Edward Snowden and the NSA, have only increased the emphasis on data privacy and security. As cyber-attacks and related data privacy and security regulation increase, organizations will need to carefully manage their IT infrastructure to reduce the risk of data exposures and regulatory noncompliance.
Despite increased visibility into cybercrime and significant efforts aimed to curb cyber-attacks, the number of detected incidents has increased by a compound annual growth rate (“CAGR”) of 66% between 2009 and 2014, to 42.8 million incidents annually, or 117,339 attacks per day, according to PricewaterhouseCoopers’ 2015 Global State of Information Security Survey.
Attacks are increasing at the same time organizations are experiencing fundamental shifts in technology
Organizations worldwide are rapidly adopting cloud-based applications and infrastructure to increase the flexibility of their computing environments, drive greater efficiency and lower costs. Traditional on-premise applications are being augmented with cloud-based versions of widely used technologies and applications such as e-mail, customer relationship management software, enterprise resource planning software, human capital management software, and employee productivity tools. By 2022, the proportion of business users provisioned, in whole or in part, with office system capabilities from the cloud will grow to 60%, or approximately 700 million users, up from 15% in 2015, according to Gartner. Additionally, organizations are beginning to move some of their computing and storage activities, which have traditionally been managed on-premise, to cloud-based computing and storage services such as Amazon Web Services and Microsoft Azure. While organizations and their IT departments are provisioning more cloud applications for employees, we believe approximately 80% of employees use cloud-based applications for work without their employer’s knowledge. As a result, we believe that IT departments are alert to only a fraction of the cloud services being used by individual employees, including non-sanctioned “shadow IT.” This use of third-party hosted applications often goes undetected, and is rarely managed by, traditional security solutions. In addition, to facilitate mobile users, many organizations perform security functions with existing on-premise tools before allowing access to cloud applications. This takes significant bandwidth and associated cost, results in latency issues, and requires the use of multiple on-premise security tools.
The modern enterprise network is being redefined
Enterprises are experiencing a fundamental shift in the way their employees and customers consume technology. The influx of personally owned devices, ubiquitous high-speed Internet connectivity and cloud-based applications is redefining the enterprise network well beyond the traditional responsibilities of the CIO. This transformation is happening in nearly every industry vertical and region. This is sometimes referred to as a dissolving network perimeter, but in reality, it is an expansion of the traditional enterprise network. The applications used by traditional office-based IT infrastructure that enterprises have built is shrinking, but is not disappearing; it is being augmented by cloud and mobile users and the growth of IoT. For example, a portion of the corporate network is delivered through cloud applications such as Salesforce and Microsoft Office365, some of it is provided by cloud-based infrastructure such as Amazon Web Services and some of it is provided by an employee’s mobile device or an IoT device. We refer to this new enterprise reality as the expanding enterprise network. These major forces are rapidly redefining IT, which has many implications with respect to cyber security.
The expanding enterprise network requires a user-centric approach to security
The new model of security needs to follow the user across any technology they use and any way they access technology. The definition of securing a user has evolved greatly in today’s cloud generation. There was a time when protecting a device equated to protecting the user; however as the user has evolved to activities beyond the device, so must their protection. User personas appear beyond their traditional computing devices, and now show up in the cloud, on social media, on mobile devices, and IoT connections. A hack into a user’s device now
-96-
Table of Contents
provides information about what that user has access to, how they access data and how they move around a network. The impact of these attacks can compromise security for millions of users as hackers gain access to credentials that enable them to access and export massive amounts of data from organizations. Users are also bringing their own devices and software into the enterprise, creating “shadow IT”, which can be accessed without oversight and control.
Network and device-centric approaches to security have limitations in the cloud generation. For example, an employee using VPN to access an enterprise network from a coffee shop to access corporate applications will be protected through a next-generation firewall and secure web gateway solution. However, an employee who connects directly to third party, cloud-based applications is not protected by the firewall. Next-generation firewalls can block or allow traffic depending on certain characteristics and are important elements of an enterprise’s network security strategy, but do not inspect everything traveling through a network and do not interpret the relationships between users and applications. Similarly, endpoint security technologies monitor devices and let organizations know when an endpoint has been breached and when an endpoint is connected to a network. However, endpoint products require an agent, or piece of software, to be installed on the device in order to inform organizations when a device is compromised. If agents are not installed on employee-owned and other networked devices, they cannot be protected against malware at the endpoint. This problem is further exacerbated as enterprises begin to deploy connected IoT devices to support new business models, many of which have very little capacity to support the installation of traditional software agents.
These technology transformations increase user-productivity while at the same time creating an expanding enterprise network that must be protected. Cloud-generation security must follow the user, regardless of their location, device, or application.
The secure web gateway is the critical control point in a modern user-centric security model
The following dynamics make sophisticated secure web gateway technology a foundational element of the security architecture for global enterprise networks:
The secure web gateway is positioned at a critical control point in the network where it has the ability to prevent potentially malicious threats from entering an organization
The web proxy, which sits within the secure web gateway, acts as a middleman between a user and the Internet, emulating a user and inspecting everything that enters a network in order to block or allow traffic based on certain characteristics. The secure web gateway sits in-line on the network, where it processes traffic in real time and is able to block threats as they are discovered. As web traffic and bandwidth requirements grow, the ability to process data efficiently, at line speed, will be critical to the success of enterprise security.
Users are accessing the web more frequently as applications move to the cloud
Web traffic is growing exponentially as traditional businesses go digital, more content is delivered over the web, and commerce moves online. In 2016, we expect global IP traffic to reach nearly one billion gigabytes per month, a fivefold increase over the past five years. Furthermore, we believe by 2019 traffic generated from non-PC devices will account for 66% of total traffic. As a result, securing the web has evolved from blocking illicit web pages and preventing employee web surfing, to protecting organizations against stealthy and malicious malware that enters through web interactions on a broad range of devices and can result in significant damage to organizations.
Threats that target websites and user connectivity to the web are particularly damaging
Advanced threats can enter an organization when a user does nothing more than visit a web page that has been compromised. According to the 2015 Internet Security Threat Report, approximately 75% of websites have
-97-
Table of Contents
some form of vulnerability and 20% of vulnerabilities discovered on websites were categorized as critical, or having the risk of spreading malware or causing data loss. Many hackers create new web pages that exist for 24 hours or less in order to bypass the static lists of known bad websites that some security products use to prevent users from clicking on such sites. Hackers hide activities inside these newly created websites in order to facilitate malware attacks.
Encrypted web traffic is increasing, as organizations seek to protect privacy, secure confidential information, and adhere to regulatory requirements
We believe as web traffic continues to grow exponentially, the proportion of web traffic that currently flows through SSL as encrypted traffic will increase rapidly, and currently exceeds 50% of all web traffic in certain industries. Encrypted traffic increases enterprise security risk as many web filtering systems cannot view its content and cannot set appropriate policies to selectively view traffic. As a result, Gartner believes that by 2017, more than 50% of network attacks targeting enterprises will use encrypted traffic to bypass controls.
The opportunity for an advanced web security platform that protects the expanding enterprise network
While traditional secure web gateway technology continues to be largely successful in preventing web borne threats for the traditional network and device-centric model, an advanced web security platform in the cloud generation requires the following key elements:
| • | Integrated platform approach to enable advanced user protection. An advanced web security platform for the cloud generation should offer integrated products that can be used to secure the enterprise network. Together, these products should be designed to leverage each other’s capabilities and enhance the overall value to customers. |
| • | Protection for the modern expanded network covering on-premise assets and cloud applications. Organizations and their users have different needs. Advanced web security solutions must scale to meet the needs of hundreds of thousands of users while preserving enterprise-class features and high performance delivery. Comprehensive solutions must also meet the needs of businesses that require cloud-based offerings and managed services with enterprise-class features. Organizations want flexible deployment options to fit their needs both on-premise and in the cloud. |
| • | Visibility and control over cloud applications. Organizations must be able to secure the business-critical data being accessed through the web-based and cloud applications used by their employees. An effective cloud solution requires the ability to discover, analyze, govern, and secure user access and interaction with cloud applications. |
| • | Constant categorization and assessment of websites. For web security to be effective, it must be able to detect malware in constantly changing websites and IP addresses. To classify the web, every site in every language must be categorized based on the content, topic, and risk in order to allow organizations to assign policies based on the website category. |
| • | Extensible environment to adapt with technology evolution through open-integrations. A key component of a modern security solution is an open integration platform for other security products. Enterprise security infrastructure is complex and highly integrated. Organizations want security solutions that are easy to integrate with other IT assets and that provide orchestration capabilities that automate responses between systems. |
| • | Improve security posture through productive use and understanding of encryption. We believe most organizations today lack visibility to over 30% of their network traffic because it is encrypted. Organizations need to have the ability to selectively decrypt traffic, while complying with privacy policies to secure their networks. They also must be able to do this at “line speed”, or at the speed of network traffic, to prevent degradation of network performance. |
-98-
Table of Contents
| • | Advanced analytics for incident response and forensics. As threat vectors continue to evolve and bypass defensive solutions, organizations must be able to monitor and detect threats, as well as remediate impact. Once a breach has been detected, organizations need to identify other points of vulnerability to prevent further breaches and minimize the time from detection to remediation. |
Our Solution
We provide an advanced web security solution for global enterprises and governments. From our inception, we have focused on delivering a best-in-class Secure Web Gateway solution with enterprise features and scalability to protect organizations from web-borne threats. We have made strategic investments to expand our offerings to include Cloud-Delivered Secure Web Gateway, Cloud Access Security Broker, Encrypted Traffic Management, Incident Response, Analytics & Forensics, Advanced Threat Protection and Web Application Firewall which together provide our customers with a comprehensive suite of solutions that enhance our leading web security capabilities. We are focused on protecting organizations as web traffic becomes a greater portion of overall network traffic, and enabling users to remain secure as they become untethered from traditional enterprise infrastructure.
Key benefits of our solutions include:
| • | Integrated security platform that utilizes combined product strengths to protect users. Our advanced web security solutions provide our customers a broad range of security functionality delivered through a single platform. Our integrated approach to security allows us to offer a comprehensive solution that combines the functional benefits of multiple products, without the overhead associated with deploying multiple solutions. For example, our Secure Web Gateway can broker web traffic to our Content Analysis and Malware Analysis products to find malware and can also update our Global Intelligence Network. Our Global Intelligence Network delivers categorization of websites to our SSL Visibility product so that our customers can selectively inspect traffic to certain classes of websites. For example, an enterprise may select not to decrypt personal healthcare information unless there is a file attachment that needs to be scanned for malware. Our SSL Visibility product can feed selected decrypted traffic to our Security Analytics product so that traffic can be recorded and analyzed. Our products leverage the technology benefits of each other, thereby increasing the overall value to customers. |
| • | Deployment and management flexibility to support IT needs across on-premise, cloud, and hybrid infrastructures. We are positioned to adapt our offerings for customers as their needs expand to embrace modern technologies. We offer our web security platform on-premise, in the cloud, or through a virtual appliance to best suit the unique needs of our customers. Each deployment option incorporates real-time threat information from our vast Global Intelligence Network to protect users’ interactions with the Internet. Users are secure when they connect directly to the cloud, without having organizations backhaul traffic to on-premise systems and constrain bandwidth. We have invested significantly in our cloud offering, which includes over 40 locations, service across six continents with 99.999% uptime and 10 follow-the-sun support centers. |
| • | Protect organizations and their users as they adopt cloud applications. We allow users to connect directly to the cloud securely and allow organizations visibility and governance over cloud usage. Through our CASB products, we give IT control over cloud access to mitigate the risk of employee use of non-sanctioned applications, or “shadow IT”, while enabling the secure use of sanctioned applications. Our customers gain an understanding of who is using which applications and what data is moving through applications, and can block access when needed. |
| • | We protect users from known and “zero day”, or previously unknown, threats by constantly monitoring and, in real-time, using our proprietary technologies to propagate defenses against those threats to our customers. We classify the web and IP addresses by content, topic and risk to determine what is safe or unsafe for organizations. We also leverage information from the millions of malware incidents captured daily within our Global Intelligence Network. This intelligence is updated constantly |
-99-
Table of Contents
| from the products deployed at our customers around the globe. When a customer visits a new malicious website, the event triggers an analysis by our Global Intelligence Network that protects other customers from that threat. This process is executed at scale, leveraging the information from the millions of malware incidents captured daily to improve the efficacy of our offerings. Finally, because we sit in-line with network traffic, we can terminate traffic in real-time when threats are detected. |
| • | Open architecture for extensible integration with third-party security assets. Our Blue Coat Security Platform offers an open and flexible approach enabling seamless integration with other technologies, which allows our customers the ability to make the best use of current and new solutions. The Secure Web Gateway is uniquely positioned in the network where it has all of the traffic and information organizations want in order to make decisions about what to allow in to users. Other technologies such as intrusion detection and prevention, data loss prevention, sandboxing and endpoint solutions can communicate with our gateway, where they receive the information needed to perform various security measures. Our customers can use best-of-breed technologies that they choose with our solution to deploy in a modular manner. |
| • | Management of encrypted data for network traffic and cloud usage. We allow organizations to control encrypted traffic through granular, policy-based controls. Organizations can have visibility into aspects of their encrypted traffic, while maintaining data privacy and compliance requirements. For example, organizations may choose to decrypt traffic related to their employees’ business email, while leaving traffic related to their medical records encrypted. Our customers can manage encrypted traffic at the speed of the Internet, resulting in significant return on investment. We also allow organizations to store corporate data in the cloud using encryption, which assures compliance with data residency laws while preserving the intended application functionality. |
| • | Advanced analytics and forensics for rapid incident remediation. We give our customers insight into where a threat came from and the potential damage done to organizations. In addition, we apply remediation measures to resolve the existing threat and protect against new threats. Our proprietary analytics capabilities leverage threat data collected from our customers, our Global Intelligence Network, and Blue Coat Labs. We also utilize our historical data to determine prior incidents of the threat vector, the profile of organizations that were breached, and how the breach occurred. Organizations benefit from full diagnostics on a breach to prevent future breaches and mitigate damages. Additionally, Blue Coat has enabled our customers to fully benefit from third-party security solutions. For example, in 2015 we launched our Endpoint Detection and Response alliance, integrating our products with the leading providers of endpoint malware detection, forensics and recovery technology to strengthen the security posture of our customers who use these third-party endpoint products in their network infrastructure. |
Market Opportunity
There is an increasing demand for unified web and cloud security platforms as organizations seek to integrate currently fragmented security products. Given the shift of traffic outside the network, proliferation of mobile and IoT devices, and increase in encrypted traffic, the secure web gateway, deployed in-line with visibility into all inbound and outbound web traffic, provides a key foundation for the incorporation of additional security solutions such as advanced malware detection and encrypted traffic management. Our solutions span a number of large, established segments across the IT security market estimated to be over $7 billion in 2015 based on research from industry analysts, and projected to reach over $11 billion by 2019, representing a 12% CAGR.
-100-
Table of Contents
| Market |
2015 Size |
2019 Size |
15-‘19 CAGR |
Source | ||||||||||
| Secure Web Gateway | 2,596 | 3,271 | 5.9% | Gartner, Forecast Enterprise Software Markets, Worldwide 2013-2020, 1Q16 Update — 17 Mar 2016 —“Secure Web Gateway” and “Appliance — Secure Web Gateway” Subsegments, constant currency basis | ||||||||||
| Data Loss Prevention | 715 | 1,039 | 9.8% | Gartner, Forecast Enterprise Software Markets, Worldwide 2013-2020, 1Q16 Update — 17 Mar 2016 —“Enterprise Content-Aware Data Loss Prevention” Subsegment, constant currency basis | ||||||||||
| Cloud Security | 572 | 1,974 | 36.3% | Forrester, Sizing the Cloud Security Market — 25 Aug 2015 | ||||||||||
| Specialized Threat Analysis and Protection (excl. Endpoint) | 1,322 | 2,423 | 16.4% | IDC, Worldwide Specialized Threat Analysis and Protection Forecast — May 2015 | ||||||||||
| WAN Optimization | 956 | 1,005 | 1.3% | IDC, Worldwide WAN Optimization Forecast — Aug 2015 | ||||||||||
| Forensics | 457 | 678 | 10.4% | IDC, Worldwide Security and Vulnerability Management Forecast — Oct 2015 | ||||||||||
| Web Application Firewall | 568 | 1,064 | 17.0% | Technavio, Global Web Application Firewall Market 2015-2019 — Nov 2015 | ||||||||||
Note: Table created by Blue Coat. Amounts in millions of dollars, except percentages.
We believe that over time, organizations will seek to consolidate fragmented point solutions into unified platforms which deeply integrate security capabilities to enhance defense as well as provide flexibility to adapt to evolving IT infrastructure requirements. Given our market leadership in the secure web gateway market and our broad suite of solutions, we believe we are well positioned to capture additional share of the IT security market, which was estimated to be $35 billion in 2015 by IDC.
Competitive Strengths
We believe we have several competitive advantages that will enable us to maintain and extend our position as a leading provider of advanced web security solutions for global enterprises and governments. Our competitive strengths include:
| • | Powerful technology with proven success in identifying and blocking sophisticated malware. Our solutions protect our customers from over four million previously unseen and uncategorized threats per day. Our analysis uncovers sophisticated malware and attack frameworks across geographies and platforms. For example, we recently exposed a highly sophisticated threat, where malware was customized to target specific victims across Russia and Europe and their specific operating platforms, including Microsoft Windows, Android, Apple iOS and Blackberry. This malware was delivered by a combination of legitimate cloud infrastructure, compromised home Internet routers, and infected websites. Our Global Intelligence Network collects and analyzes over a billion previously unseen and uncategorized websites a day, which provides us with intelligence to prevent and stop threats across our customer base. Our proven effectiveness of stopping malware has led to long-standing customer relationships and new customer adoption. |
| • | Industry leader with strong reputation and brand. According to IDC, we were the worldwide leader in the web security market in 2014. We held a 43% share of the web security appliance market in 2014, up from 40% in 2013, which was more than two times larger than our closest competitor, as reported |
-101-
Table of Contents
| by IDC. We have been recognized as a “leader” in Gartner’s Magic Quadrant for Secure Web Gateway every year since 2007. Our security solutions are deeply embedded within over 15,000 organizations that rely on our web security products as demonstrated by our customer renewal rate of over 95% for our top 1,000 customers in each of the last four years. We believe our market leadership, well-established brand recognition and product breadth position us well for future growth. |
| • | Global sales organization and market reach. We market and sell our solutions to our end-user customers through a two-tiered channel of approximately 2,000 solution providers, systems integrators, value-added resellers and distributors worldwide. The breadth of our channel partners provides us with broad customer reach, local language support, and unmatched distribution capabilities. We also employ a direct-touch sales force that focuses on large accounts and collaborates with our channel partners to provide products and support. Our sales team focuses on named enterprise accounts and sells our portfolio of products into these accounts, eliminating the need for multiple, disparate touch points for different products. |
| • | Blue chip customer base and shared threat intelligence drives network effect. Our customers include the largest, most vulnerable and visible enterprises and government organizations with significant budgets to allocate toward security. As a leading provider of advanced web security solutions to organizations across more than 120 countries, we have over 15,000 customers including over 70% of the Fortune Global 500 and a diverse array of civilian, military, and other branches of government organizations around the world. Our ability to collectively leverage real-time data from such an extensive customer base strengthens our ability to provide advanced threat protection and continuously increases the advantages provided by our Global Intelligence Network. Many of our customers share a common threat landscape, such as customers operating within the same industry, geographic region, or government-related entities. Our ability to use industry, organization, or other specific threat intelligence across our customer base increases our value and drives growth. |
| • | Deeply integrated into our customers’ and security partner ecosystem. We are deeply embedded in our customers’ security infrastructure. Our in-line Secure Web Gateway solution positions us in a critical place to see all web traffic in real-time and prevent or stop threats. As such, other providers have an incentive to integrate their security solutions with our Secure Web Gateway to share information and orchestrate responses to threats. We have built an open integration platform that allows us to integrate with other IT assets and enables organizations to leverage their existing investments in security. Our strategic position in the network and deep integrations with numerous technology partners has enabled us to enjoy long-term relationships with our customers and partners. |
| • | Consistent innovation and technology expansion. We have a longstanding focus on innovation, and have consistently invested in product development to address the evolving demands of the security market. Since fiscal 2013, we have invested over $300 million in research and development to drive innovation, excluding our strategic acquisitions, and continuously reinvested profits into our business for product upgrades, new features, and the development of key technologies. Our research and development spend is efficient and sustainable, enabling us to generate consistent profitability while investing in growth. We have demonstrated our commitment to innovation bringing new products to market and building a portfolio of 230 current patents and pending patent applications. Our research and development efforts have been augmented by a number of strategic acquisitions that have extended our capabilities in cloud data protection and brokerage, advanced analytics, and remediation. These investments have allowed us to expand our product portfolio and integrate and leverage acquired technologies across our entire Blue Coat Security Platform. |
| • | Experienced management team of security experts and IT thought leaders. We have a highly experienced management team with extensive security domain expertise and a proven track record in growing and building large, global and profitable businesses at scale. Our Chief Executive Officer, Gregory S. Clark, founded security software firm Dascom, which would later became the foundation for IBM’s Tivoli security product. At IBM, Mr. Clark was a Distinguished Engineer for Security |
-102-
Table of Contents
| Systems, served as Vice President of Tivoli Systems and was instrumental in defining and selling IBM’s suite of security and management products. Prior to Dascom, Mr. Clark held senior roles with AT&T Bell Labs, Unix Software Operation and Unix System Labs. Our President and Chief Operations Officer, Michael Fey, previously served as General Manager of Corporate Products for McAfee/Intel Security as well as Chief Technology Officer for the Intel Security Group. Our Chief Technology Officer, Hugh Thompson, was named one of the “Top 5 Most Influential Thinkers in IT security” by SC Magazine. Our Chief Financial Officer, Nicholas Noviello, has over twenty years of leadership experience and previously served as Chief Financial Officer of NetApp, where he led the finance and operations team of more than 1,500 professionals. Their security experience and thought leadership have led to a strong track record of success and positions us well to continue to lead the web and cloud security industry. |
Our Growth Strategy
We intend to maintain and extend our technology leadership in the market for advanced web security solutions by executing the following growth strategies:
| • | Continue to invest in research and development to drive product innovation and technology expansion. We plan to continue investing in product innovation to expand our Blue Coat Security Platform with new products and capabilities around cloud-based offerings, encrypted web traffic management, and data and analytics. We allocate a significant amount of resources in research and development to drive innovation and strategically reinvest a substantial portion of our profits into product upgrades, new features, and new product development. We have over 230 issued patents and patent applications pending. There were approximately 50 product features released in fiscal 2015 and 60 new features released in fiscal 2016. We have also increased our research and development headcount from 231 in the first quarter of fiscal 2013 to 651 as of April 30, 2016. |
| • | Increase sales to our existing customers. We plan to leverage our leadership position in advanced web security solutions to further increase sales to existing customers with additional security products and services. As our portfolio expands, we intend to sell additional products and services to our customers. For example, over 70% of our current top 250 customers have purchased product lines introduced after fiscal 2012. Additionally, we believe there is significant upsell opportunity with our current on-premise and Cloud-Delivered Secure Web Gateway products as the growth in web traffic drives bandwidth demand and a need for more of our appliances, and as organizations shift more of their business to the cloud. |
| • | Leverage scale, global reach and partners to reach new customers. We will continue to enter into new partnerships with service providers, to expand our market reach to new customers. For example, we recently announced a partnership with Dimension Data, a subsidiary of Nippon Telegraph and Telephone (“NTT”), that combines our leading web security technology with their global managed security services portfolio to provide their customers with real-time threat protection. Additionally, we have expanded our managed security service provider programs with AT&T, NTT and Telstra. |
| • | Continue to invest in our direct sales force. We plan to continue to invest in our sales force around the world to help drive growth and add new customers. We have a disciplined approach to sales strategy that allows us to maximize resources while maintaining a profitable business. Since 2012, we have more than doubled our direct sales force to 690 employees to help drive new customer wins with our solutions. As a result of these efforts, we sold our products to over 700 new customers during the year ended April 30, 2016. We anticipate that our sales to many of these new customers will continue to grow as they adopt additional products and services available on our platform. |
| • | Continue to pursue strategic acquisitions to expand our capabilities. We have and will continue to pursue select technology acquisitions to further extend our existing capabilities and portfolio of products and services that we can offer to our customers. We have successfully completed six key |
-103-
Table of Contents
| acquisitions over the past four years, which provided new capabilities in the areas of CASB (through our acquisitions of Perspecsys and Elastica), advanced analytics and remediation (through our acquisition of Solera), and SSL visibility (through our acquisition of the SSL Visibility business from Netronome). We intend to continue to utilize targeted acquisitions to expand capabilities on our platform and increase our addressable market. |
Our Products and Platform
Blue Coat Security Platform
The Blue Coat Security Platform is a series of advanced security products across six distinct solution areas that are uniquely built upon our competency and subject-matter-expertise across network, security and cloud technologies.
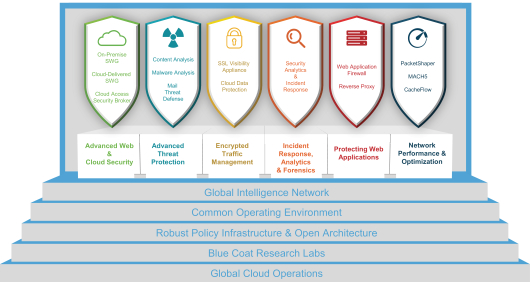
Advanced Web and Cloud Security
Advanced Web and Cloud Security is a category of technologies designed to sit between the user and the Internet to provide protection for the user and content regardless of the user’s location or device. There are several core capabilities which make up Advanced Web and Cloud Security:
| • | On-Premise Secure Web Gateway. Our Secure Web Gateway includes ProxySG, and sits between users and their interactions with the Internet to identify malicious payloads and to control sensitive content. Our Secure Web Gateway consolidates a broad feature-set to authenticate users, filter web traffic, identify cloud application usage, provide data loss prevention, deliver threat prevention, and ensure visibility into encrypted traffic. It also provides coaching and feedback to the user to ensure a strong and secure user experience when interacting with the Internet. Further it can provide consolidated policy management and reporting when deployed in-concert with our Cloud-Delivered Secure Web Gateway as a hybrid delivery model. |
| • | Cloud-Delivered Secure Web Gateway. Our Cloud-Delivered Secure Web Gateway provides similar functionality to the On-Premise Secure Web Gateway, yet is delivered as a cloud-based service from within our own global cloud datacenters. It is commonly deployed for mobile users as an inspection point to avoid the organization having to backhaul traffic to a central office. Our partners, including AT&T and Dimension Data, also deploy our cloud service as a managed security service. |
-104-
Table of Contents
| • | Cloud Access Security Broker. Our Cloud Access Security Broker provides visibility, control and data protection over employee use of third-party cloud applications. Our CASB product includes four key components: |
| • | Cloud Application Visibility and Risk Intelligence (“Audit”) allows organizations to discover and analyze cloud application usage within their organization for both sanctioned and non-sanctioned application usage. The Audit product delivers an understanding of who is using which applications, how much data is moving in and out, and where the risk lies across cloud application usage. |
| • | Cloud Application Control (“Gatelets”) provides the ability to deliver in-line granular control over user interactions with cloud applications by recognizing usage and applying policies to maintain data security. The Gatelets extend data loss prevention capabilities to applications to mitigate the risk of cloud application usage. |
| • | Cloud Application API Control (“Securelets”) protects applications and data within applications through direct integration to the API provided by the cloud application provider, and can exercise control over access activity and data within the cloud application. Securelets also enables incident response and forensics to monitor, log and capture activities that occur within cloud applications. |
Advanced Threat Protection
Our Advanced Threat Protection Solutions enable organizations to proactively prevent and detect sophisticated threats and to automate what is learned to continually improve defenses.
| • | Content Analysis. Our Content Analysis product incorporates our threat prevention technologies with best of breed industry solutions. It uses techniques such as file reputation and anti-malware technologies as well as static code analysis. In addition, it leverages our Global Intelligence Network to identify threats in real-time and delivers integration between our sandboxing function and in-line, real-time inspection. Our Content Analysis product integrates with endpoints via its built-in Endpoint Detection and Response capabilities to allow stronger protection using network/endpoint integration. Blue Coat’s Content Analysis product is designed to deliver a consolidated inspection point for a variety of Blue Coat threat prevention technologies. |
| • | Malware Analysis. Our Malware Analysis product combines virtual sandboxing and emulation to identify the nature of a particular payload and determine whether it is harmful. Our Malware Analysis product leverages custom profiles to replicate an organization’s production environments to quickly spot anomalies and behavioral differences which would only be seen in a production environment. The Malware Analysis product also identifies malware in real-time and feeds that information into other technologies, such as our Secure Web Gateway for in-line protection and our Security Analytics products for real-time threat forensics and analysis. This ensures that information from the sandbox can be used automatically to stop malware as it enters the environment. Our Secure Web Gateway can feed our Malware Analysis product and can stop traffic until the analysis is complete. |
| • | Mail Threat Defense. Our recently introduced Mail Threat Defense product provides advanced malware protection for both on-premise and cloud-based email infrastructure. It can detect and block email delivery and propagation of advanced threats by automatically analyzing and blocking suspicious email content across our proprietary and third-party sandboxes and conducting targeted risk scoring. In addition to analyzing attachments, it can inspect embedded file attachments and URL links for malware and leverages policy to stop threatening content. Positioned in-line after a SPAM filter, our Mail Threat Defense product integrates with other email security solutions, preserving and enhancing the value of prior email security and technology investments. |
-105-
Table of Contents
Encrypted Traffic Management
Our Encrypted Traffic Management solution enables organizations to meet business needs of maintaining privacy and compliance while enabling existing security solutions to see the traffic they were originally intended to inspect.
| • | SSL Visibility. Our SSL Visibility product offers complete visibility and control of encrypted traffic without requiring the re-architecture of network infrastructure. It allows organizations to add policy-based SSL inspection and management capability to the network security architecture enabling visibility to all SSL / TLS traffic—all ports and applications—without the need for complex scripting or configuration. Most importantly, it uses the web categorization content from our Global Intelligence Network to allow policy-driven decisions of when to selectively inspect encrypted traffic, which protects user privacy. |
| • | Cloud Data Protection. Our Cloud Data Protection solution ensures data protection for corporate data when it is stored in cloud applications through either encryption (mathematical transformation) or tokenization (random value substitution). Data gets transformed back into its original format when retrieved, allowing for a seamless user experience. |
Incident Response, Analytics and Forensics
Our Incident Response, Analytics and Forensics solution allows organizations to capture all traffic that passes through the network, inspect that traffic for malicious content or activity, identify the cause and impact of threats in order to remediate, and feed key findings back into the security infrastructure to more effectively protect the network environment in the future.
| • | Security Analytics and Incident Response. Our Security Analytics solution indexes and classifies all network traffic to give full forensic visibility into activities that have occurred in the environment. It can then provide visibility into potential risks using real-time threat intelligence provided by our Global Intelligence Network. This reduces time-to-resolution of an incident by profiling risk across millions of sites and applications globally. Where deeper inspection is required, our Security Analytics product integrates with our Malware Analysis product to allow automated playback of content within malware sandboxing to further determine the nature of the content. As it discovers malicious content, it highlights interactions and the impact to an environment. The integration of our Security Analytics product with Endpoint Detection and Incident Response technologies allows a full network-to-endpoint view of malicious activity to afford an immediate and precise response. |
Protecting Web Applications
Our web application protection capabilities leverage our extensive experience and technology for protecting web traffic and applies it to protecting web applications whether they reside in an on-premise datacenter or inside a cloud-based datacenter environment.
| • | Web Application Firewall. Our Web Application Firewall (“WAF”) product is designed to sit in front of corporate applications to protect against threats which may attempt to exploit weaknesses in the application environment. It delivers protection both through signature-based and signature-less attack detection engines and supports a broad range of authentication technology, allowing it to integrate to application needs across environments. In addition, our WAF product provides the ability to inspect encrypted SSL traffic and to deliver performance optimization to improve web application performance. Our WAF product integrates natively with our Global Intelligence Network to leverage real-time threat intelligence. |
| • | Reverse Proxy. The Secure Web Gateway serves as a proxy for users to the Internet. Another configuration known as reverse proxy provides a proxy for critical applications and networks to the Internet. This solution has grown in importance as organizations embrace cloud computing allowing |
-106-
Table of Contents
| companies the ability to provide a termination point where deep inspection for malware and policy can be deployed to the traffic before critical applications and networks engage with the traffic. Our reverse proxy allows organizations the ability to govern traffic and payloads on a wide variety of parameters, which makes it ideal for connecting network segments or applications to cloud infrastructure. |
Network Performance and Optimization
We deliver a portfolio of network performance products to assist with application performance visibility, network usage management, network optimization, bandwidth allocation control and network caching. These products provide benefits to our other offerings, thereby increasing the overall value to customers. This uniquely equips our products to improve performance while delivering stronger security.
| • | PacketShaper. PacketShaper helps organizations prioritize and reserve bandwidth for business critical applications. It is a highly scalable appliance which can deliver performance up to 10Gbps. With the advent of cloud applications, traffic prioritization is a necessary feature of the Blue Coat Security Platform. Powered by an on-board database and our Global Intelligence Network, PacketShaper supports auto-discovery and classification of more than 900 applications and tens of millions of URLs and web applications. Additionally PacketShaper provides real-time monitoring and reporting for application performance and bandwidth consumption to ensure networks and applications are always running at optimal performance. |
| • | MACH5. MACH5 is a powerful network appliance which allows organizations to accelerate the performance of key applications and network services. By leveraging protocol acceleration, compression, object caching, video processing and quality-of-service capabilities, MACH5 can accelerate file, email and web access, as well as storage replication and backup. MACH5 also provides specialized live and on-demand video optimization for Adobe Flash, Windows Media, Silverlight, HTML5 and other video formats. MACH5 cloud-caching engines enable faster cloud application access with no impact to cloud infrastructure. Video is an important element of the future of the web and associated cloud applications. Security and optimization of video content is valued by our customers. |
| • | CacheFlow. CacheFlow is a high-performance web caching solution designed to help content-rich industries save on bandwidth and accelerate the delivery of rich web content, including video. CacheFlow scales to support more users and greater traffic volumes over time, plus provides built-in tools for web traffic reporting and filtering to protect users. Our Global Intelligence Network delivers real-time intelligence for content categorization and caching and changes to the web, so as new sites emerge, new caching rules and instruction updates are automatically delivered from the Global Intelligence Network to the CacheFlow appliance. |
Integration of our Products Drives Customer Value
These solution areas contain products which are integrated to provide protection across the lifecycle of a threat. For example, our Secure Web Gateway can broker web traffic to our Content Analysis and Malware Analysis products to find malware and can also update our Global Intelligence Network. Our Global Intelligence Network delivers categorization of websites to our SSL Visibility product so that our customers can selectively inspect traffic to certain classes of websites. For example, an enterprise may select not to decrypt personal healthcare information unless there is a file attachment that needs to be scanned for malware. Our SSL Visibility Appliance can feed selected decrypted traffic to our Security Analytics product so that traffic can be recorded and analyzed. These examples demonstrate the importance and value of integration across our Blue Coat Security Platform.
-107-
Table of Contents
Our Technology
Our patent portfolio covers a breadth of technologies in the areas of cloud security, network security, advanced threat protection, encrypted traffic management and optimizing network connectivity to protect users and enhance their experience. The common technologies that power the products on our platform include:
Open Architecture and Robust Policy Infrastructure. Our platform provides support for open standards and a robust policy framework, which enables integration between our products and those of third parties. Our platform is built with sophisticated policy engines which allow fine-grain control of network traffic. These engines can support thousands of attributes, including those related to user, network, device, application and traffic characteristics. Numerous checkpoints execute context-based policies in real-time and at scale. We are heavily involved in helping to develop integration standards, including the Internet Content Adaptation Protocol, Structured Threat Information eXpression and Trusted Automated eXchange of Indicator Information.
Common Operating Environment. Our Common Operating Environment (“COE”) is a standards-based, highly extensible operating system layer that forms the foundation of much of our core product portfolio. Our COE allows our products to be delivered in a variety of environments including the cloud, hardware appliances and virtual appliances. Our COE provides a common set of tools and capabilities that allow our products to interoperate as part of our platform by standardizing core services. Our COE allows our products to intercept network traffic at scale, reduces support complexity, accelerates the adoption of new technologies on our platform, and simplifies the management of our products for customers.
Global Cloud Operations. Our Global Cloud Operations provide access to our Cloud-Delivered Secure Web Gateway from over 40 locations around the world, which are designed to provide resilience and to ensure 99.999% uptime for customers. Our Global Cloud Operations are integrated with Blue Coat’s on-premise web security platform to deliver a cloud-only or hybrid (on-premise plus cloud) set of security services that allow security policies and protections to follow the user across an expanding enterprise network. This cloud infrastructure can overlay corporate policies with country-specific policies and allows customers to adhere to evolving data sovereignty requirements and other regional regulatory requirements. Our Global Cloud Operations preserve the user’s experience by allowing policies to be enforced at local cloud points-of-presence, without having to backhaul all web requests to a corporate data center offshore.
Global Intelligence Network. Our Global Intelligence Network is a cloud-based service that analyzes websites, domains, servers and web services at scale and runs both real-time and background checks on over a billion previously unseen and uncategorized websites a day. All Blue Coat products are designed to interact with our Global Intelligence Network by using the intelligence it provides and contributing to its knowledgebase. As a result, each customer deployment can create a source of intelligence, enriching our Global Intelligence Network and enhancing the value of the services it provides to all customers. Our Global Intelligence Network contains patented technology to categorize sites into groups such as “Banking,” “Gambling,” “Pornography” and “News” based on linguistic analysis, inter-site relationships, host attribute analysis and reputation and history. Modules within our Global Intelligence Network analyze site content such as images, video and embedded links and can run in-depth content analysis in over 50 languages to help categorize sites and identify potential risk. The accuracy of the categorization provided by our Global Intelligence Network is critical in providing consistent policy application and logging across our platform. For products like our SSL Visibility Appliance for example, our Global Intelligence Network allows enterprises to enforce policies such as “decrypt all incoming data for analysis except for banking transactions and healthcare transactions.”
Blue Coat Labs. Blue Coat Labs consists of a group of experts from fields including computer science, mathematics, computational linguistics, data science and electrical engineering. The Labs team creates, maintains and executes the core analysis algorithms used to categorize websites and IP addresses. The Labs team also includes engineers that dissect malicious software, identify attributes of that software, and write modules to detect the behavior of malicious content. Upon identification of new malware, the Labs team incorporates the
-108-
Table of Contents
information into modules within our products, services, and our Global Intelligence Network. Examples of the advanced research and output include more than 300 real-time web rating libraries, hunters which constantly search for unique malware and traffic patterns, our server/site DNA scanning technologies, our malnet (malicious network) tracking technologies, our dynamic real-time rating and risk scoring technologies, and our ability to detect and block command and control traffic. Blue Coat Labs has helped create and shape some of the core network security protocols and standards that are in use today and researchers regularly contribute to the security community through standards committees, reports, articles and conference presentations.
Our Customers
As of April 30, 2016, we had over 15,000 customers, including over 70% of the Fortune Global 500. Our customers include many of the largest organizations across all verticals. Within the Fortune Global 100, our customers include 24 of the 29 oil, gas and energy companies, 14 of the 16 banks and eight of the 11 automotive companies. We have a diverse customer base and no single end-customer accounted for more than 10% of our total revenue in fiscal 2015 or fiscal 2016. Furthermore, in the year ended April 30, 2016, over 45% of our revenue was derived from international markets.
Sales and Marketing
Sales
We primarily market and sell our solutions to our end-user customers through a two-tiered channel of solution providers, systems integrators, value-added resellers and distributors worldwide, which we refer to collectively as our channel partners. We sell our solutions to our global distributor partners, who, in turn, sell our solutions to our indirect resellers who ultimately sell to our end-user customers. We also employ a direct-touch sales force that focuses on large accounts and collaborates with our channel partners to provide products and support. Our sales team focuses on named enterprise accounts and sells our portfolio of products into these accounts, eliminating the need for multiple, disparate touch points into our customers. In fiscal 2016, nearly all of our sales were completed through our network of approximately 2,000 channel partners. For fiscal 2016, our two largest distributors accounted for 27% and 26% of our revenue, respectively. For fiscal 2015, our two largest distributors accounted for 26% and 25% of our revenue, respectively. Sales completed through these distributors are governed by our standard, non-exclusive channel partner agreement, which provides for an initial term of one year, with one year automatic renewal terms, and may be terminated by either party for any reason upon 60 days’ prior written notice, or 30 days after providing notice of a material breach if such breach has not been cured.
We also have direct relationships with many of our customers who we strategically serve through internal sales representatives. These representatives focus on strengthening relationships through superior customer service, understanding our customers’ needs and identifying and executing on growth opportunities within these customers. We also have representatives who focus on helping our indirect channel partners succeed and grow. Our worldwide service and support organization provides a broad range of service options to our customers, including 24x7 technical support and product education.
Marketing
Our marketing strategy is focused on building our brand reputation and the market awareness of our platform and the security solutions we offer, driving customer demand and a strong sales pipeline and positioning our Company as a leader in key and emerging market segments. We make a variety of strategic marketing investments include brand advertising intended to increase awareness of our products among strategic enterprise security decision makers and targeted demand generation activities to stimulate demand for our products and services. Our worldwide marketing efforts include participation in industry trade shows, informational seminars and webinars, leveraging digital media through outreach, content syndication and online advertisements, public
-109-
Table of Contents
relations, and various other demand generation and marketing activities. In addition, we provide marketing support for our major channel partners and technology integration partners worldwide.
We also leverage the expertise of Blue Coat Labs, our internal research organization, to drive global thought leadership among the broader security community and raise our brand awareness. Blue Coat Labs produces a variety of compelling research and other resources regarding technological developments and emerging vulnerabilities and threats, and we share that research through our active online community, social media, eBooks and other content.
Competition
The market for web security solutions is highly fragmented, intensely competitive and constantly evolving in response to changes in the threat landscape and corporate network security infrastructures. The expanding capabilities of our advanced web security solutions have enabled us to address a growing array of customer needs, and as a result, we compete with a variety of security providers in the following categories:
| • | Our principal competitors in the web security gateway market are Intel through its acquisition of McAfee, Websense and Cisco Systems. In addition, we expect additional competition from other established and emerging companies as the web security gateway market continues to develop and expand through further consolidation. |
| • | Our principal competitors in the cloud security services market are Zscaler, Inc. and Cisco Systems, Inc. In addition, we expect additional competition from other established and emerging companies as the market for security-as-a-service continues to develop and expand and as consolidation occurs. |
| • | Our principal competitors in the advanced threat protection market and incident response, analytics and forensics market include Intel Corporation, IBM, and EMC as well as independent security vendors such as Palo Alto Networks, FireEye, Niksun and Trend Micro. Further, as new IT budgets are created to support next-generation threat protection, it will attract more highly specialized vendors as well as larger vendors that may continue to acquire or bundle their products. |
| • | Our principal competitors in the WAN optimization market are Riverbed Technology and Cisco Systems. In addition, we expect additional competition from other established and emerging companies as the WAN optimization market continues to develop and expand and as consolidation occurs. |
The principal competitive factors in the markets for our solutions include:
| • | product features, reliability, performance, and effectiveness; |
| • | breadth and extensibility of offerings; |
| • | ability to integrate with other technology infrastructures; |
| • | price and total cost of ownership; |
| • | strength of sales and marketing efforts; |
| • | brand awareness and reputation; and |
| • | quality of customer support. |
While we believe that we compete favorably on the basis of these factors, many of our competitors have substantially greater financial, technical and other resources, greater name recognition, larger sales and marketing budgets, broader distribution, more diversified product lines and larger and more mature intellectual property portfolios.
-110-
Table of Contents
Research and Development
We believe that innovation and strong internal product development capabilities are essential to our continued success and growth. We continue to add new features, strengthen existing features of our products and invest in exploring new and adjacent markets and products that build on our core competencies. Research and development expense was $131.4 million, $110.6 million and $110.9 million for fiscal 2016, 2015 and 2014, respectively.
Manufacturing
We currently outsource the manufacturing of our hardware appliances and principally use industry standard parts and components that are available from multiple vendors. This approach allows us to reduce our investment in manufacturing equipment, facilities and raw material inventory, and to take advantage of the expertise of our vendors. We have limited sources of supply for certain key components of our products, which exposes us to the risk of component shortages or unavailability.
We have contracted with third parties to design and manufacture certain of our current hardware appliance product offerings. We also have contracted with third parties to load our software on our hardware appliances, test our products prior to final delivery and provide fulfillment servicing for our hardware appliance products. Each of these agreements is non-exclusive.
Intellectual Property
Our success depends on our ability to create proprietary technology and to protect and enforce our intellectual property rights in that technology, as well as our ability to defend against adverse claims of third parties with respect to our technology and intellectual property. To protect our proprietary technology, we rely primarily on a combination of patents, copyright and trademark laws, contractual provisions and confidentiality procedures to protect trade secrets. Despite our efforts to protect our proprietary rights, unauthorized parties may attempt to copy aspects of our products or obtain and use information that we regard as proprietary. Policing unauthorized use of our products is difficult and can be expensive and time consuming. In addition, the laws of some foreign countries do not protect our proprietary rights to as great an extent as do the laws of the United States. Our means of protecting our proprietary rights may not be adequate and unauthorized third parties, including our competitors, may independently develop similar or superior technology, duplicate or reverse-engineer aspects of our products, or design around our patented technology or other intellectual property.
As of April 30, 2016, we had over 230 issued patents and pending patent applications. There can be no assurance that any of our pending patent applications will issue or that the patent examination process will not result in our narrowing the claims applied for. Furthermore, there can be no assurance that we will be able to detect any infringement of our patents or, if infringement is detected, that our patents will be enforceable or that any damages awarded to us will be sufficient to adequately compensate us.
Employees
As of April 30, 2016, we had a total of 1,924 employees, including approximately 690 sales employees, 46 marketing employees and 651 research and development employees.
None of our U.S. employees are currently subject to any collective bargaining agreements. However, certain of our international employees are subject to collective bargaining agreements, which typically are applicable to all employees of a designated industry located in the employing jurisdiction. All of our employees located in France, Brazil, Spain, Belgium, Italy and Argentina are currently covered by one of these industry-wide collective bargaining agreements. We have not experienced any material work stoppages or labor disruptions and we consider our relations with our employees to be good.
-111-
Table of Contents
Facilities
We are headquartered in Sunnyvale, California, where we lease one building consisting of an aggregate of approximately 104,000 square feet of office space pursuant to a lease effective through August 2025. We also lease space for research and development in Draper, Utah; Boxborough, Massachusetts; and Waterloo, Ontario in Canada. In addition, we lease space for sales and support services in several metropolitan areas in North America and in a number of countries outside the United States, including Malaysia, the United Kingdom and Japan. We believe that our existing facilities are adequate to meet our current requirements, and that suitable additional or substitute space will be available, if necessary.
Legal Proceedings
We are currently a party to, and may in the future be involved in, various litigation matters (including intellectual property litigation), legal claims, and government investigations. Notably, we are currently involved in ongoing legal proceedings with Finjan, Inc. (“Finjan”).
On August 28, 2013, Finjan filed a complaint (“Finjan Case 1”) in the U.S. District Court for the Northern District of California alleging that certain Blue Coat products infringe U.S. Patent Nos. 6,154,844, 6,804,780, 6,965,968, 7,058,822, 7,418,731 and 7,647,633. On August 4, 2015, the jury in Finjan Case 1 returned a verdict that certain Blue Coat products infringe five Finjan patents in suit and awarded Finjan lump-sum money damages of $39.5 million. On November 20, 2015, the trial court entered a judgment in Finjan Case 1 in favor of Finjan on the jury verdict and certain non-jury legal issues. Finjan has also filed motions seeking enhanced damages on the judgment, including treble damages, interest and attorneys fees, which, if awarded, could be substantial. We believe this verdict was in error and intend to vigorously contest this judgment and investigate all available remedies for relief, including currently pending post-trial motions and, if necessary, an appeal. However, we cannot be certain that any of our motions or our appeal, if we choose to appeal, will be successful.
On July 15, 2015, Finjan filed a second complaint (“Finjan Case 2”) in the U.S. District Court for the Northern District of California alleging that certain Blue Coat products infringe U.S. Patent Nos. 6,154,844, 6,965,968, 7,418,731, 8,079,086, 8,225,408, 8,566,580 and 8,677,494. On March 1, 2016, Finjan amended its complaint to allege that certain Blue Coat products also infringe U.S. Patent Nos. 9,141,786, 9,189,621 and 9,219,755. Finjan’s complaint also seeks enhanced damages, including treble damages. We have sought a stay of Finjan Case 2 from the court because, among other reasons, we contest Finjan’s right to recover damages that we contend are on three patents—6,154,844, 6,965,968 and 7,418,731—for which Finjan was awarded lump-sum money damages for the life of such patents in Finjan Case 1. We intend to vigorously defend Finjan Case 2, regardless of whether the case is stayed. However, we cannot be certain that we will ultimately prevail. If we do not prevail in Finjan Case 2, another large damages payment may be imposed upon us and our business and results of operations may be harmed. Trial in Finjan Case 2 is currently scheduled for October 30, 2017.
In a letter dated February 5, 2015, AT&T made an indemnification demand against Blue Coat in relation to a lawsuit pending in the United States District Court for the Northern District of Texas, Dallas Division, entitled Bascom Global Internet Services, Inc. v. AT&T Inc. The complaint alleges that AT&T has infringed U.S. Patent No. 5,987,606 by “making, using, selling, and/or offering for sale AT&T’s “Secure Network Gateway” service, “Web Security” service, “Cloud Web Security Service,” policy control functionality for wireless-device services, and/or other web-filtering and security offerings.” This matter is in an investigation phase. On or about May 21, 2015, AT&T prevailed on its motion to dismiss the case. Plaintiff has appealed the ruling.
On September 23, 2013, Protegrity Corporation (“Protegrity”) filed a complaint against Perspecsys USA, Inc. (“Perspecsys”) in the U.S. District Court for the District of Connecticut alleging patent infringement of U.S. Patent Nos. 6,321,201 and 8,402,281. The case was subsequently transferred to the U.S. District Court for the Northern District of California on February 23, 2015. Blue Coat acquired PerspecSys on July 30, 2015. The court has stayed the case pending resolution by the U.S. Patent and Trademark Appeals Board (“PTAB”) of petitions
-112-
Table of Contents
for Covered Business Method (“CBM”) review of the patents-in-suit. In its decision to institute a CBM review, the PTAB found every claim of the patents-in-suit more likely than not invalid under 35 U.S.C. §§ 101, 102, and/or 103. On March 2, 2016, the PTAB determined that all claims under Patent No. 8,402,281 were invalid. As a result of the PTAB findings regarding the invalidity of every claim of the patents-in-suit, we believe that the possibility of a loss with respect to the Perspecsys litigation is remote. In addition to our belief that the possibility of a loss is remote, Blue Coat has received indemnification from the former stockholders of Perspecsys for any losses relating to this suit, subject to certain limitations. Our right to indemnification for losses relating to this suit survives indefinitely, and is capped at the total consideration paid to the former stockholders of Perspecsys in connection with our acquisition of Perspecsys. We do not believe that the maximum amount of potential losses with respect to the Perspecsys litigation exceeds the indemnification available from the Perspecsys stockholders.
We have not recorded a liability with respect to Finjan Case 1 based on our determination that a loss in that case is not probable under applicable accounting standards. Given the early stages of Finjan Case 2 and the AT&T indemnification demand, we are unable to estimate the possible losses in those cases.
-113-
Table of Contents
Executive Officers and Directors
The names, ages, and current positions of the Company’s current executive officers and directors and are listed in the table below.
| Name |
Age |
Position | ||||
| Gregory Clark |
51 | Chief Executive Officer and Director | ||||
| Michael Fey |
41 | President and Chief Operating Officer | ||||
| Nicholas Noviello |
47 | Chief Financial Officer | ||||
| Matthew MacKenzie |
44 | General Counsel, Chief of Staff and Secretary | ||||
| Darren Abrahamson |
35 | Director | ||||
| David Humphrey |
39 | Director | ||||
| Ian Loring |
50 | Director | ||||
| Dwight Poler |
50 | Director | ||||
| Charles Robel |
67 | Director | ||||
Gregory Clark has served as the Chief Executive Officer of the Company and as a member of the Company’s board of directors since September 2011. Prior to joining the Company, Mr. Clark was President and Chief Executive Officer of Mincom, a global software and services provider to asset-intensive industries, from 2008 to August 2011. Mincom was acquired by the ABB Group in July 2011. Before joining Mincom, Mr. Clark was a founder and served as President and Chief Executive Officer of E2open, a provider of cloud-based supply chain software, from 2001 until 2008. Earlier in his career, Mr. Clark founded security software firm Dascom, which was acquired by IBM in 1999. Mr. Clark served as a Distinguished Engineer and Vice President of IBM’s Tivoli Systems, a division providing security and management products, from 1999 until 2001. Mr. Clark holds a B.S. from Griffith University.
Michael Fey has served as the Company’s President and Chief Operating Officer since December 2014. Prior to joining the Company, Mr. Fey held a variety of positions at the Intel Security Group from 2012 until 2014, including Executive Vice President, Chief Technology Officer, and General Manager of Corporate Products. Previously, Mr. Fey was Senior Vice President, Advanced Technologies and Field Engineering with McAfee, a software security company, from 2007 until 2012, where he oversaw key corporate acquisitions and engagement with global customer executives and prospects to develop, build, and implement strategic security solutions. Mr. Fey graduated magna cum laude from Embry-Riddle Aeronautical University with a B.S. in engineering physics and a minor in mathematics.
Nicholas Noviello has served as the Company’s Chief Financial Officer since January 2016. Prior to joining the Company, Mr. Noviello served as Executive Vice President, Finance and Operations, and Chief Financial Officer for NetApp, a publically traded global data management and storage company, from January 2012 through December 2015. From January 2008 until January 2012, Mr. Noviello held a variety of progressing finance positions at NetApp, including Controller and Global Controller. Prior to joining NetApp, Mr. Noviello spent eight years at Honeywell International, where he was Chief Financial Officer of two global business units, ran investor relations, and was a leader on the corporate mergers and acquisitions team. Mr. Noviello started his career at PricewaterhouseCoopers. Mr. Noviello is a Certified Public Accountant, and holds a B.S. degree in business administration from Boston University and an M.S. degree in taxation from Fairleigh Dickinson University.
Matthew MacKenzie has served as the Company’s General Counsel, Chief of Staff and Secretary since January 2016. From March 2012 until January 2016, Mr. MacKenzie served as the Company’s General Counsel, Chief Administrative Officer and Secretary. Prior to joining the Company, Mr. MacKenzie was General Counsel,
-114-
Table of Contents
Chief Administrative Officer and Secretary at Mincom, a global software and services provider to asset-intensive industries, from 2010 until 2011. Prior to Mincom, Mr. MacKenzie was SVP of Corporate & Legal Affairs and General Counsel at E2open, a provider of cloud-based supply chain software, from 2001 until 2009. Mr. MacKenzie also served as E2open’s acting Chief Financial Officer from 2005 to 2006. Mr. MacKenzie began his career as an attorney with Wilson Sonsini Goodrich & Rosati. Mr. MacKenzie holds a B.A. and J.D. from the University of California, Los Angeles, and an M.B.A. from The Wharton School at the University of Pennsylvania.
Darren Abrahamson has served as a Director of the Company since May 2015. Mr. Abrahamson is currently a Principal at Bain Capital, which he joined in 2005. Prior to joining Bain Capital, Mr. Abrahamson was a consultant at Monitor Group from 2003 to 2005. Mr. Abrahamson serves on the board of directors of Sungard Availability Services and Viewpoint Construction Software. Mr. Abrahamson graduated with a B.S. in economics from The Wharton School at the University of Pennsylvania, and received an M.B.A. from Harvard Business School.
David Humphrey has served as a Director of the Company since May 2015.Mr. Humphrey is currently a Managing Director of Bain Capital, which he joined in 2001. Prior to joining Bain Capital, Mr. Humphrey was an investment banker in the mergers and acquisitions group at Lehman Brothers from 1999 to 2001. Mr. Humphrey serves on the board of directors of BMC Software, Viewpoint Construction Software, Bright Horizons Family Solutions Inc., and Genpact. Mr. Humphrey previously served on the board of directors of Burlington Coat Factory Warehouse Corporation, Skillsoft plc. and Bloomin’ Brands. Mr. Humphrey received an M.B.A. from Harvard Business School and a B.A. from Harvard University.
Ian K. Loring has served as a Director since May 2015. Mr. Loring is currently a Managing Director of Bain Capital, which he joined in 1996. Prior to joining Bain Capital, Mr. Loring was a Vice President at Berkshire Partners. Previously, Mr. Loring worked in the corporate finance department at Drexel Burnham Lambert. Mr. Loring currently serves on the boards of directors of BMC Software, iHeartMedia, Inc, The Weather Channel, NXP Semiconductors and Viewpoint Construction Software. Mr. Loring previously served as a member of the boards of directors of Warner Music Group Corp., SMTC Corporation, Denon & Marantz and SunGard Data Systems. Mr. Loring received an M.B.A. from Harvard Business School and a B.A. from Trinity College.
Dwight Poler has served as a Director since May 2015. Mr. Poler currently serves as a Managing Director of Bain Capital, which he joined in 1994. Prior to joining Bain Capital, Mr. Poler was a consultant at Bain & Company and worked in the mergers and acquisitions department of Morgan Stanley. Mr. Poler currently serves on the board of directors of Brakes Group and the Edcon Group. Mr. Poler is a member of the Advisory Group, formed by the British Venture Capital Association. Mr. Poler received an M.B.A. from the Amos Tuck School at Dartmouth and a B.A. from Amherst College.
Charles Robel has served as a Director of the Company since May 2016. Mr. Robel has served as a member of the Board of Directors of GoDaddy Inc. since May 2014, and as its Chairman since March 2015. From June 2006 to February 2011, Mr. Robel served as the Chairman of the Board of Directors of McAfee, Inc. From June 2000 to December 2005, Mr. Robel served as General Partner and Chief of Operations of Hummer Winblad Venture Partners, a venture capital firm. From January 1974 to May 2000, Mr. Robel served in various roles at PricewaterhouseCoopers LLP, an accounting firm. Mr. Robel currently serves on the Boards of Directors of Jive Software, Inc., Model N, Inc. and several private companies. Mr. Robel holds a B.S. in accounting from Arizona State University.
-115-
Table of Contents
Director Qualifications
The board of directors seeks to ensure that it is composed of members whose particular experience, qualifications, attributes and skills, when taken together, will allow the board of directors to satisfy its oversight responsibilities effectively. In identifying candidates for membership on the board of directors, the board of directors considers (1) minimum individual qualifications, such as high ethical standards, integrity, mature and careful judgment, industry knowledge or experience and an ability to work collegially with the other members of the board of directors and (2) all other factors it considers appropriate, including alignment with our stockholders, especially investment funds affiliated with our Sponsor. While we have no specific diversity policies for considering board of directors candidates, we believe each director contributes to the board of directors’ overall diversity, which is broadly construed to mean a variety of opinions, perspectives, personal and professional experiences and backgrounds.
Each of the directors possesses high ethical standards, acts with integrity, and exercises careful, mature judgment. Each is committed to employing their skills and abilities to aid the long-term interests of the stakeholders of the Company. In addition, our directors are knowledgeable and experienced in one or more business, governmental, or civic endeavors, which further qualifies them for service as members of the board of directors.
As a group, the non-management directors possess experience in owning and managing enterprises like us and are familiar with corporate finance, strategic business planning activities and issues involving stakeholders.
Board Composition and Director Independence
Our business and affairs are managed under the direction of our board of directors. After the completion of this offering, our board of directors will be comprised of the following directors: . Currently, each director is elected for a one-year term.
Our restated certificate of incorporation that will be in effect upon closing of this offering provides that our board of directors shall consist of at least three directors but not more than 15 directors and that the number of directors may be fixed from time to time by resolution of our board of directors. Our board of directors will be divided into three classes, as follows:
| • | Class I, which will initially consist of Messrs. , whose terms will expire at our annual meeting of stockholders to be held in 2017; |
| • | Class II, which will initially consist of Messrs. , whose terms will expire at our annual meeting of stockholders to be held in 2018; and |
| • | Class III, which will initially consist of Messrs. , whose terms will expire at our annual meeting of stockholders to be held in 2019. |
Upon the expiration of the initial term of office for each class of directors, each director in such class shall be elected for a term of three years and serve until a successor is duly elected and qualified or until his or her earlier death, resignation or removal. Any additional directorships resulting from an increase in the number of directors or a vacancy may be filled by the directors then in office. Following the date on which investment funds advised by affiliates of Bain Capital, LP no longer beneficially own a majority of our common stock, directors may only be removed for cause by the affirmative vote of the holders of at least 75% of the voting power of our outstanding shares of capital stock.
Following the completion of this offering, we will be a “controlled company” under the rules of the NYSE because more than 50% of the voting power of our common stock will be held by investment funds affiliated with our Sponsor. See “Principal Stockholders.” We intend to rely upon the “controlled company” exception relating to the board of directors and committee independence requirements under the rules of the NYSE. Pursuant to this exception, we will be exempt from the rules that would otherwise require that our board of
-116-
Table of Contents
directors consist of a majority of independent directors and that our compensation committee and nominating and governance committee be composed entirely of independent directors. The “controlled company” exception does not modify the independence requirements for the audit committee, and we intend to comply with the requirements of the Exchange Act and the rules of the NYSE, which require that our audit committee have at least one independent director upon consummation of this offering, consist of a majority of independent directors within 90 days following the effective date of the registration statement of which this prospectus forms a part and exclusively of independent directors within one year following the effective date of the registration statement of which this prospectus forms a part.
Our board of directors has determined that and are independent directors under the rules of the NYSE. In making this determination, the board of directors considered the relationships that such directors have with our Company and all other facts and circumstances that the board of directors deemed relevant in determining such directors’ independence, including beneficial ownership of our common stock.
Board Committees
Upon the completion of this offering, our board of directors will have three standing committees: the audit committee; the compensation committee; and the nominating and governance committee. Each of the committees operates under its own written charter adopted by the board of directors, each of which will be available on our website upon closing of this offering.
Audit Committee
Following this offering, our audit committee will be composed of , with serving as chairperson of the committee. None of our audit committee members simultaneously serves on the audit committees of more than three public companies, including ours. Our board of directors has determined that is an “audit committee financial expert” within the meaning of the SEC’s regulations and applicable listing standards of the NYSE. The audit committee’s responsibilities upon completion of this offering will include:
| • | appointing, approving the compensation of, and assessing the qualifications, performance and independence of our independent registered public accounting firm; |
| • | pre-approving audit and permissible non-audit services, and the terms of such services, to be provided by our independent registered public accounting firm; |
| • | reviewing the audit plan with the independent registered public accounting firm and members of management responsible for preparing our financial statements; |
| • | reviewing and discussing with management our annual and quarterly financial statements and related disclosures as well as critical accounting policies and practices used by us; |
| • | reviewing the adequacy of our internal control over financial reporting; |
| • | establishing policies and procedures for the receipt and retention of accounting-related complaints and concerns; |
| • | recommending, based upon the audit committee’s review and discussions with management and the independent registered public accounting firm, the inclusion of our audited financial statements in our Annual Report on Form 10-K; |
| • | reviewing and assessing the adequacy of the committee charter and submitting any changes to the board of directors for approval; |
| • | monitoring our compliance with legal and regulatory requirements as they relate to our financial statements and accounting matters; |
| • | reviewing all related person transactions for potential conflict of interest situations and approving all such transactions; |
-117-
Table of Contents
| • | preparing the audit committee report required by the rules of the SEC to be included in our annual proxy statement; and |
| • | reviewing and discussing our earnings releases with management. |
Compensation Committee
Following this offering, our compensation committee will be composed of , with serving as chairperson of the committee. The compensation committee’s responsibilities upon completion of this offering will include:
| • | annually reviewing and approving corporate goals and objectives relevant to the compensation of our chief executive officer and our other executive officers; |
| • | evaluating the performance of our chief executive officer in light of such corporate goals and objectives and determining and approving the compensation of our chief executive officer; |
| • | reviewing and approving the compensation of our other executive officers; |
| • | appointing, compensating and overseeing the work of any compensation consultant, legal counsel or other advisor retained by the compensation committee; |
| • | conducting the independence assessment outlined in the NYSE rules with respect to any compensation consultant, legal counsel or other advisor retained by the compensation committee; |
| • | reviewing and assessing the adequacy of the committee charter and submitting any changes to the board of directors for approval; |
| • | reviewing and establishing our overall management compensation, philosophy and policy; |
| • | overseeing and administering our equity compensation and similar plans; |
| • | reviewing and approving our policies and procedures for the grant of equity-based awards; |
| • | reviewing and making recommendations to the board of directors with respect to director compensation; and |
| • | producing a compensation committee report for inclusion in our annual proxy statement in accordance with SEC proxy and disclosure rules. |
Nominating and Governance Committee
Following this offering, our nominating and governance committee will be composed of , with serving as chairperson of the committee. The nominating and governance committee’s responsibilities upon completion of this offering will include:
| • | developing and recommending to the board of directors criteria for board and committee membership; |
| • | establishing procedures for identifying and evaluating director candidates, including nominees recommended by stockholders; |
| • | identifying individuals qualified to become members of the board of directors; |
| • | recommending to the board of directors the persons to be nominated for election as directors and to each of the committees of the board of directors; |
| • | developing and recommending to the board of directors a set of corporate governance principles; |
| • | articulating to each director what is expected, including reference to the corporate governance principles and directors’ duties and responsibilities; |
| • | reviewing and recommending to the board of directors practices and policies with respect to directors; |
-118-
Table of Contents
| • | reviewing and recommending to the board of directors the compositions of the committees of the board of directors; |
| • | reviewing and assessing the adequacy of the committee charter and submitting any changes to the board of directors for approval; |
| • | providing for new director orientation and continuing education for existing directors on a periodic basis; |
| • | performing an evaluation of the performance of the committee; and |
| • | overseeing the evaluation of the board of directors and management. |
Compensation Committee Interlocks and Insider Participation
During the fiscal year ended April 30, 2016, our compensation committee was comprised of Messrs. Humphrey and Loring. None of the members of our compensation committee has at any time during the prior three years been one of our officers or employees. None of our executive officers currently serves, or in the past fiscal year has served, as a member of the board of directors or compensation committee of any entity that has one or more executive officers serving on our board of directors or compensation committee. For a description of transactions between us and members of our compensation committee and affiliates of such members, please see “Certain Relationships and Related Party Transactions.”
Board Oversight of Risk Management
While the full board of directors has the ultimate oversight responsibility for the risk management process, its committees oversee risk in certain specified areas. In particular, our audit committee oversees management of enterprise risks as well as financial risks. Our compensation committee is responsible for overseeing the management of risks relating to our executive compensation plans and arrangements and the incentives created by the compensation awards it administers. Our audit committee oversees risks associated with corporate governance, business conduct and ethics, and is responsible for overseeing the review and approval of related party transactions. Pursuant to the board of directors’ instruction, management regularly reports on applicable risks to the relevant committee or the full board of directors, as appropriate, with additional review or reporting on risks conducted as needed or as requested by the board of directors and its committees.
Code of Ethics
We have adopted a code of ethics that applies to all of our employees, officers and directors. Upon the closing of this offering, our code of ethics will be available on our website. We intend to disclose any amendments to our code, or any waivers of their requirements, on our website.
-119-
Table of Contents
Overview
The following tables and discussion relate to the compensation paid to or earned by our Chief Executive Officer, Gregory Clark, and our two most highly compensated executive officers (other than Mr. Clark) who were serving as executive officers on the last day of fiscal 2016. They are Michael Fey, who serves as our President and Chief Operating Officer, and Nicholas Noviello, who joined the Company on January 15, 2016 and serves as our Chief Financial Officer. Messrs. Clark, Fey, and Noviello are referred to collectively in this prospectus as our named executive officers.
Summary Compensation Table
The following table sets forth information about certain compensation awarded to, earned by, or paid to our named executive officers during fiscal years 2016 and 2015:
| Name and principal position |
Year | Salary ($)(1) |
Bonus ($) |
Stock awards ($)(2) |
Option awards ($)(2) |
Nonequity incentive plan compensation ($)(3) |
All
other compensation ($)(4) |
Total ($) |
||||||||||||||||||||||||
| Gregory Clark, |
2016 | 733,013 | 15,000,000 | (5) | 15,000,000 | 12,038,000 | 1,000,000 | 30,677 | 43,801,690 | |||||||||||||||||||||||
| Chief Executive Officer |
2015 | 500,000 | — | — | 421,850 | 3,000 | 924,850 | |||||||||||||||||||||||||
| Michael Fey, |
2016 | 500,000 | — | 9,100,000 | 500,000 | 3,000 | 10,103,000 | |||||||||||||||||||||||||
| President & Chief Operating Officer |
2015 | 204,808 | 450,000 | (6) | 1,043,200 | 173,503 | (7) | — | 1,871,511 | |||||||||||||||||||||||
| Nicholas Noviello, |
2016 | 192,083 | 487,500 | (8) | 5,827,465 | — | 3,000 | 6,510,048 | ||||||||||||||||||||||||
| Chief Financial Officer |
||||||||||||||||||||||||||||||||
| (1) | Amounts shown include contributions by our named executive officers to the Blue Coat Systems 401(k) Plan (referred to as our 401(k) plan and described below). |
| (2) | Amounts shown for fiscal 2016 for Messrs. Clark and Noviello reflect the grant date fair value of restricted shares, or options to purchase shares, of common stock of Blue Coat, Inc. granted to them in fiscal 2016. Amount shown for Mr. Fey for fiscal 2016 reflects a grant date fair value of $7,997,500 for options to purchase common stock of Blue Coat, Inc. and an incremental fair value of $1,102,500 arising from a modification to the vesting terms of his options in fiscal 2016. Amount shown for fiscal 2015 reflects the grant date fair value of options to purchase Class B common stock of Barbour Holdings granted to Mr. Fey in fiscal 2015. All values shown were determined in accordance with FASB ASC Topic 718. Assumptions used to calculate these amounts are included in Note 9 to our consolidated financial statements included elsewhere in this prospectus. |
| (3) | Amounts shown for fiscal 2016 reflect amounts earned by our named executive officers under our Fiscal 2016 Bonus Plan, as described below. |
| (4) | Amounts shown in this column include a Company contribution of $3,000 on behalf of each named executive officer under our 401(k) plan and, for Mr. Clark, the cost of Company-paid travel for Mr. Clark’s family members to our President’s Club and a reimbursement of the associated taxes. |
| (5) | Amount shown reflects a cash retention bonus paid to Mr. Clark as further described under “Agreements with our Named Executive Officers.” |
| (6) | Amount shown reflects a cash sign-on bonus paid to Mr. Fey in connection with his commencement of employment with us. |
| (7) | Mr. Fey’s fiscal 2015 bonus was pro-rated based on the date he commenced employment with us. |
| (8) | Under his employment letter, Mr. Noviello is entitled to receive an annual bonus under our Fiscal 2016 Bonus Plan of not less than $487,500. |
-120-
Table of Contents
2016 Base Salaries
Base salaries provide our named executive officers with a fixed amount of compensation each year. Base salary levels reflect the executive’s title, experience, level of responsibility, and performance. Initial base salaries for our named executive officers were set forth in their employment letters, as described below under “Agreements with our Named Executive Officers.”
2016 Bonuses
The target annual bonus for each named executive officer is specified as a percentage of base salary and is set forth in the executive’s employment letter, as described below under “Agreements with our Named Executive Officers.”
Each of our named executive officers was eligible to earn an annual bonus under our Fiscal 2016 Bonus Plan, a broad-based annual bonus plan for employees of the Company. Bonuses under the plan were calculated based on the achievement of pre-established revenue and EBITDA targets for fiscal 2016. In addition, a discretionary bonus pool (Discretionary Bonus Pool) was established by setting aside twenty percent (20%) of each eligible employee’s annual bonus. Revenue, for purposes of our Fiscal 2016 Bonus Plan, is the consolidated net revenues of the Company determined in accordance with GAAP. EBITDA, for purposes of our Fiscal 2016 Bonus Plan, is adjusted EBITDA, as defined elsewhere in this prospectus, plus certain strategic consulting, non-acquisition employee retention, and other costs. Bonuses are paid in two installments: the first installment was paid following the end of our second quarter of fiscal 2016 and the second will be paid on or around May 30, 2016.
A first installment of up to five percent (5%) (1H Revenue Payout Percentage) of each participant’s target annual bonus was payable based on achievement of the revenue target for the first six (6) months of fiscal 2016 (1H Revenue Target), and the remaining portion (2H Revenue Payout Percentage), which combined with the 1H Revenue Payout Percentage was not to exceed sixteen percent (16%) of each participant’s target annual bonus, was payable based on achievement of the revenue target for the full twelve (12) months of fiscal 2016 (Annual Revenue Target) and individual performance. A first installment of up to twenty percent (20%) (1H EBITDA Payout Percentage) of each participant’s target annual bonus was payable based on achievement of the EBITDA target for the first six (6) months of fiscal 2016 (1H EBITDA Target), and the remaining portion (2H EBITDA Payout Percentage), which combined with the 1H EBITDA Payout Percentage was not to exceed sixty-four percent (64%) of each participant’s target annual bonus, was payable based on achievement of the EBITDA target for the full twelve (12) months of fiscal 2016 (Annual EBITDA Target) and individual performance. At less than ninety percent (90%) achievement of the 1H Revenue Target or 1H EBITDA Target (each, a 1H Target), no amount would be paid to participants for the applicable first installment. For achievement of the applicable 1H Target between ninety percent (90%) and one hundred percent (100%), participants would be paid an applicable first installment of between twenty-five percent (25%) and one hundred percent (100%) of the 1H Revenue Payout Percentage or 1H EBITDA Payout Percentage (each, a 1H Payout Percentage) determined on a straight-line basis, of their target bonus. At less than ninety percent (90%) achievement of the Annual Revenue Target or Annual EBITDA Target (each, an Annual Target), no amount would be paid to participants for the second installment. For achievement of the applicable Annual Target between ninety percent (90%) and one hundred percent (100%), participants would be eligible to receive a second installment of between twenty-five percent (25%) and one hundred percent (100%) of the 2H Revenue Payout Percentage or 2H EBITDA Payout Percentage (each, a 2H Payout Percentage), determined on a straight-line basis, of their target bonuses, subject to adjustment based on individual performance. As part of the Company’s annual performance review process, employees receive a numeric performance rating of zero (0) to five (5) based on an assessment of their individual performance during the year. Employees rated two (2) or below were not eligible for the second installment. In addition, each participant who commenced employment prior to January 1, 2016 and received a performance rating of three (3) (meets expectations), four (4) (exceeds expectations) or five (5) (substantially exceeds expectations) was eligible to earn an additional two and a half percent (2.5%) of eighty percent (80%) of his or her target bonus for each additional one percent (1%) achievement of EBITDA over the Annual EBITDA Target
-121-
Table of Contents
up to one hundred twenty percent (120%) of the Annual EBITDA Target. In the Company’s sole discretion, the Company may fund the Discretionary Bonus Pool in an amount not to exceed two and a half percent (2.5%) of twenty percent (20%) of the annual bonus target for all eligible employees for each additional one percent (1%) achievement of EBITDA over the Annual EBITDA Target up to one hundred twenty percent (120%) of the Annual EBITDA Target.
The board of directors of Blue Coat Systems, Inc., one of our subsidiaries, is solely responsible for determining all financial calculations under the plan, including the calculation of revenue and EBITDA. The board of directors determined that payout amounts for the first and second installments of the annual bonus will be at one-hundred percent (100%). The annual bonus amounts earned by our named executive officers for fiscal 2016 are shown in the Summary Compensation Table above in the column titled “Non-Equity Incentive Plan Compensation.”
Equity-Based Compensation
During fiscal 2016, prior to the Bain Acquisition, Mr. Clark held restricted shares of Class B common stock of Barbour Holdings granted to him in May 2012, and Mr. Fey held options to purchase Class B common stock of Barbour Holdings granted to him in December 2014. In connection with the Bain Acquisition, 581,250 of Mr. Clark’s Barbour Holdings restricted shares vested and were cashed out, and 200,000 of Mr. Fey’s Barbour Holdings options vested, 146,065 of which were cashed out, and 53,935 of which he rolled over into 53,333.33 fully vested options to purchase common stock of Blue Coat, Inc.
In fiscal 2016, each named executive officer was granted options to purchase common stock of Blue Coat, Inc., half subject to time-based vesting and half subject to time-based and performance-based vesting—2,600,000 options in the case of Mr. Clark, 1,750,000 options in the case of Mr. Fey, and 997,000 options in the case of Mr. Noviello. Mr. Clark was also granted 1,500,000 shares of restricted common stock of Blue Coat, Inc., subject to time-based vesting. The options that are subject to time-based vesting will vest in full upon a change of control, generally subject to the executive’s continued employment through such transaction except as otherwise described below under “Severance.” In addition, the time-based options may receive additional vesting credit following this offering to the extent that our Sponsor sells shares in connection with or following such offering. The options that are subject to performance-based vesting are eligible to vest upon the achievement by our Sponsor of certain returns on its investment in the Company.
Employee Benefits
Our full-time employees, including our named executive officers, are eligible to participate in our health and welfare benefit plans, which include medical, dental, vision, basic and supplemental life, permanent life with long-term care, short-term and long-term disability, and critical illness insurance, flexible spending accounts, travel assistance, an employee assistance program, commuter benefits, and a group legal services plan. Our named executive officers participate in these plans on the same basis as our other eligible employees.
Retirement Plans
In fiscal 2016, Messrs. Clark, Fey and Noviello participated in our 401(k) plan, a broad-based defined contribution plan offered to all of our full-time U.S.-based employees (other than certain employees covered by a collective bargaining agreement). Participants may elect to defer up to 90% of their annual eligible compensation, subject to annual Internal Revenue Code limits, and the Company makes a matching contribution equal to the lower of a participant’s annual eligible compensation and $3,000 per calendar year. We do not sponsor or maintain any qualified or non-qualified defined benefit plans or supplemental executive retirement plans.
-122-
Table of Contents
Agreements with our Named Executive Officers
The Company and Blue Coat Systems, Inc. have entered into an employment letter with each of our named executive officers, which in the case of Messrs. Clark and Fey have subsequently been amended. The terms of the employment letters, as amended, are reflected below.
Base Salaries and Bonus Opportunities
Under his employment letter, Mr. Clark is entitled to an annual base salary of $1,000,000, effective November 12, 2015, subject to increase, but not decrease, and to be reviewed annually by our board of directors or one of its committees. Mr. Clark is also eligible for an annual incentive bonus targeted at one hundred percent (100%) of his annual base salary (and targeted at $1,000,000 for fiscal 2016). Mr. Clark was paid a retention bonus of $15 million in connection with entering into his amended employment letter that he will be required to repay in full if he resigns without good reason or if we terminate his employment for cause (each, a Qualifying Departure) prior to November 12, 2016. In the event of a Qualifying Departure on or after November 12, 2016 and before May 12, 2017, Mr. Clark will be required to repay $5 million of his retention bonus. Mr. Clark is also entitled under his employment letter to receive an additional retention bonus of $7.5 million on each of November 12, 2016 and November 12, 2017, subject to his remaining employed with us through each such date. If he resigns for good reason or we terminate his employment without cause (each, a Good Leaver Departure) prior to each such date, he will remain entitled to receive each of these retention bonuses, subject to his compliance with his restrictive covenants as described below under “Restrictive Covenants.” Mr. Clark will be required to repay each of these additional retention bonuses in full in the event of a Qualifying Departure between November 12, 2016 and November 12, 2017, and November 12, 2017 and November 12, 2018, respectively. Upon a change of control, Mr. Clark will be entitled to receive a lump-sum cash payment in the amount of any unpaid portion of these two additional retention bonuses, subject to his remaining employed with us through the change of control or if he experiences a Good Leaver Departure prior to such date and continues to comply with his restrictive covenants. In connection with this offering, Mr. Clark will be entitled to receive a grant of restricted shares of our common stock with an aggregate fair market value equal to the amount of the then unpaid portion of these retention bonuses, in lieu of any further cash payments in respect of these bonuses, subject to his remaining continuously employed with us through the closing of such offering. The restricted shares will be subject to the same vesting schedule as the retention bonuses, but will accelerate in full upon a Good Leaver Departure.
Under his employment letter, Mr. Fey is entitled to an annual base salary of $500,000, subject to adjustment by our board of directors or one of its committees. Mr. Fey’s base salary may not be decreased except as part of an across-the-board reduction applicable to all of our senior executives. Mr. Fey is also eligible to participate in our annual bonus plan and is entitled under his employment letter to an annual bonus target of at least one hundred percent (100%) of his annual base salary. Mr. Fey’s employment letter also entitled him to receive a cash sign-on bonus of $450,000 in connection with his hire.
Under his employment letter, Mr. Noviello is entitled to an annual base salary of $650,000, subject to increase, but not decrease, and to be reviewed annually by our board of directors or one of its committees. Mr. Noviello is also eligible for an annual incentive bonus targeted at one hundred percent (100%) of his annual base salary (but not less than $487,500 for fiscal 2016).
Severance
If Mr. Clark’s employment is terminated by the Company without cause or he resigns for good reason, he would be entitled under his employment letter to receive, in lieu of any severance provided under the Company’s policies, subject to his signing an effective release of claims, a lump-sum cash payment equal to two (2) years of his annual base salary and, for up to 18 months, monthly payments equal to the amount of our contribution toward the group medical plan on Mr. Clark’s behalf. Under such termination scenarios, Mr. Clark may also be
-123-
Table of Contents
entitled to receive certain payments in respect of his retention bonuses, as described above under “Agreements with our Named Executive Officers—Base Salaries and Bonus Opportunities,” and accelerated vesting of certain equity awards, as described below in footnote 2 to the Outstanding Equity Awards at Fiscal Year-End table.
If Mr. Fey’s employment is terminated by the Company without cause or he resigns for good reason, he will be entitled to receive under our Executive Separation Policy, which is a severance policy applicable to certain covered employees, subject to his signing an effective release of claims, a lump-sum cash amount equal to 52 weeks of annual base salary, plus an amount equal to his required payment amount for COBRA continuation coverage for 52 weeks. Under such termination scenarios, Mr. Fey may also be entitled to receive accelerated vesting of certain equity awards, as described below in footnote 4 to the Outstanding Equity Awards at Fiscal Year-End table. If such termination were to occur on or before May 22, 2016, subject to his signing an effective release of claims, he would also be entitled to receive a lump-sum cash amount equal to the difference between the value of his unvested Barbour Holdings options forfeited in the Bain Acquisition minus the value of his vested Blue Coat, Inc. time-based options as of his termination date.
If Mr. Noviello’s employment is terminated by the Company without cause or he resigns for good reason, he will be entitled to receive under our Executive Separation Policy, subject to his signing an effective release of claims, a lump-sum cash amount equal to 52 weeks of annual base salary, plus an amount equal to his required payment amount for COBRA continuation coverage for 52 weeks. Under such termination scenarios, Mr. Noviello may also be entitled to receive accelerated vesting of certain equity awards, as described below in footnote 6 to the Outstanding Equity Awards at Fiscal Year-End table. In addition, in the event of a termination of Mr. Noviello’s employment by the Company without cause or by Mr. Noviello for good reason, subject to his signing an effective release of claims, or by reason of his death or disability, Mr. Noviello will be entitled to receive a pro-rated, lump-sum payout of the accrued but unpaid portion of his target annual bonus for the fiscal year during which Mr. Noviello’s employment termination occurs.
Restrictive Covenants
Each of our named executive officers has entered into a Proprietary Information and Inventions Agreement with the Company. Under this agreement, the executives are subject to non-competition obligations during their employment with us, restrictions on soliciting employees or consultants of the Company for one year following their termination of employment with us, intellectual property assignment obligations, and confidentiality covenants.
In addition, as a condition to receiving their Blue Coat, Inc. option awards, Messrs. Clark, Fey, and Noviello entered into restrictive covenant agreements binding them to confidentiality, assignment of intellectual property, non-disparagement, and cooperation obligations during and after their employment with us, as well as non-competition and non-solicitation obligations with respect to customers, vendors, suppliers, and manufacturers during their employment with us, and non-solicitation obligations with respect to our employees and independent contractors during and for 12 months following the executives’ termination of employment with us.
-124-
Table of Contents
Outstanding Equity Awards at Fiscal Year-End
The following table sets forth information regarding equity awards held by our named executive officers as of April 30, 2016.
| OPTION AWARDS | STOCK AWARDS | |||||||||||||||||||||||||||
| Name |
Number of securities underlying unexercised options (#) exercisable |
Number of securities underlying unexercised options (#) unexercisable |
Equity incentive plan awards: Number of securities underlying unexercised unearned options (#) |
Option exercise price ($) |
Option expiration date |
Number of shares or units of stock that have not vested (#) |
Market value of shares or units of stock that have not vested ($)(1) |
|||||||||||||||||||||
| Gregory Clark(2) |
297,917 | 1,002,083 | 433,333 | 10.00 | 9/9/2025 | 1,312,500 | (3) | 21,262,500 | ||||||||||||||||||||
| Michael Fey(4) |
200,521 | 674,479 | 291,667 | 10.00 | 9/9/2025 | |||||||||||||||||||||||
| Michael Fey(5) |
53,333 | 2.50 | 12/15/2024 | |||||||||||||||||||||||||
| Nicholas Noviello(6) |
31,156 | 467,344 | 166,167 | 12.40 | 1/27/2026 | |||||||||||||||||||||||
| (1) | Values in this column assume a market value per share of common stock of Blue Coat, Inc. equal to $16.20, which reflects a third-party valuation dated as of January 31, 2016. |
| (2) | Mr. Clark was granted 2,600,000 options to purchase common stock of Blue Coat, Inc. on September 9, 2015, and his award was amended on October 30, 2015. Fifty percent (50%) of his options are subject to time-based vesting of 1/48th per month over four (4) years, subject to his continued employment with the Company, with a vesting start date of May 22, 2015 (Clark Time-Based Options). The remaining fifty percent (50%) of his options are subject to both time-based and performance-based vesting with the performance metrics reflecting a multiple of our Sponsor’s return on its investment in the Company (Clark Performance-Based Options). The Clark Performance-Based Options are subject to the same time-based vesting schedule as the Clark Time-Based Options. The time-vesting component of Mr. Clark’s options will accelerate in full upon a change of control. If Mr. Clark’s employment is terminated by the Company without cause or he resigns for good reason, an additional twenty-five percent (25%) of the Clark Time-Based Options will vest and an additional twenty-five percent (25%) of the time-vesting component of the Clark Performance-Based Options will vest. If such a termination occurs within three (3) months prior to the Company’s entry into definitive documentation to enter into a change-of-control transaction, Mr. Clark’s options will remain outstanding and eligible to vest in the change of control, subject to Mr. Clark’s continued compliance with his restrictive covenants. Following the consummation of an initial public offering (which includes the consummation of the transactions contemplated by this prospectus), the portion of the Clark Time-Based Options eligible to vest on an applicable vesting date may be increased such that the aggregate vested percentage of the Clark Time-Based Options will match the portion of our Sponsor’s investment in the Company that has been sold through such vesting date. Mr. Clark was granted 1,500,000 restricted shares of common stock of Blue Coat, Inc. on October 30, 2015. His restricted shares vest 1/48th per month over four (4) years from the date of grant, with an additional twenty-five percent (25%) of the restricted shares vesting upon an initial public offering (which would include the consummation of the transactions contemplated by this prospectus), and all of the restricted shares vesting upon a change of control, subject in each case to Mr. Clark’s continued employment with the Company through the applicable vesting date. If Mr. Clark’s employment is terminated by the Company without cause or he resigns for good reason, an additional twenty-five percent (25%) of the restricted shares would vest upon his employment termination. |
| (3) | On January 29, 2016, these restricted shares were transferred by Mr. Clark other than for value to GSC-OZ Investments LLC. |
| (4) | Mr. Fey was granted 1,750,000 options to purchase common stock of Blue Coat, Inc. on September 9, 2015, and his award was amended on November 24, 2015. Fifty percent (50%) of his options are subject to time-based vesting of 1/48th per month over four (4) years, subject to his continued employment with the Company, with a vesting start date of May 22, 2015 (Fey Time-Based Options). The remaining fifty percent (50%) of his options are subject to both time-based and performance-based vesting with the performance metrics reflecting a multiple of our Sponsor’s return on its investment in the Company (Fey Performance-Based Options). The Fey |
-125-
Table of Contents
| Performance-Based Options are subject to the same time-based vesting schedule as the Fey Time-Based Options. The time-vesting component of Mr. Fey’s options will accelerate in full upon a change of control. If Mr. Fey’s employment is terminated by the Company without cause or he resigns for good reason, an additional twenty-five percent (25%) of the Fey Time-Based Options will vest and an additional twenty-five percent (25%) of the time-vesting component of the Fey Performance-Based Options will vest. If such a termination occurs within three (3) months prior to the Company’s entry into definitive documentation to enter into a change-of-control transaction, Mr. Fey’s options will remain outstanding and eligible to vest in the change of control, subject to Mr. Fey’s continued compliance with his restrictive covenants. Following the consummation of an initial public offering (which includes the consummation of the transactions contemplated by this prospectus), the portion of the Fey Time-Based Options eligible to vest on an applicable vesting date, may be increased such that the aggregate vested percentage of the Fey Time-Based Options will match the portion of our Sponsor’s investment in the Company that has been sold through such vesting date. |
| (5) | In connection with the Bain Acquisition, Mr. Fey was granted 53,333 options to purchase common stock of Blue Coat, Inc. on May 22, 2015 in exchange for options to purchase Class B common stock of Barbour Holdings then held by him. His rollover options were fully vested upon grant. |
| (6) | Mr. Noviello was granted 997,000 options to purchase common stock of Blue Coat, Inc. on January 27, 2016. Fifty percent (50%) of his options are subject to time-based vesting of 1/48th per month over four (4) years, subject to his continued employment with the Company, with a vesting start date of January 15, 2016 (Noviello Time-Based Options). The remaining fifty percent (50%) of his options are subject to both time-based and performance-based vesting with the performance metrics reflecting a multiple of our Sponsor’s return on its investment in the Company (Noviello Performance-Based Options). The Noviello Performance-Based Options are subject to the same time-based vesting schedule as the Noviello Time-Based Options. The time-vesting component of Mr. Noviello’s options will accelerate in full upon a change of control. If Mr. Noviello’s employment is terminated by the Company without cause or he resigns for good reason, an additional twenty-five percent (25%) of the Noviello Time-Based Options will vest and an additional twenty-five percent (25%) of the time-vesting component of the Noviello Performance-Based Options will vest. If such a termination occurs within three (3) months prior to the Company’s entry into definitive documentation to enter into a change-of-control transaction, Mr. Noviello’s options will remain outstanding and eligible to vest in the change of control, subject to Mr. Noviello’s continued compliance with his restrictive covenants. Following the consummation of an initial public offering (which includes the consummation of the transactions contemplated by this prospectus), the portion of the Noviello Time-Based Options eligible to vest on an applicable vesting date, may be increased such that the aggregate vested percentage of the Noviello Time-Based Options will match the portion of our Sponsor’s investment in the Company that has been sold through such vesting date. |
Director Compensation
The following table sets forth information concerning the compensation earned by our Barbour Holdings directors during fiscal 2016 prior to the Bain Acquisition. Other than Mr. Clark, whose compensation is included with that of our other named executive officers, none of our directors following the Bain Acquisition received any compensation for their services during fiscal 2016. Mr. Robel did not serve as a director during fiscal 2016.
| Name |
Fees Earned or Paid in Cash ($) |
Total ($) |
||||||
| Marcel Bernard |
11,413 | 11,413 | ||||||
| James Lines |
8,560 | 8,560 | ||||||
-126-
Table of Contents
CERTAIN RELATIONSHIPS AND RELATED PARTY TRANSACTIONS
Stockholders Agreement
In connection with the Bain Acquisition, on May 22, 2015, we entered into a Stockholders Agreement, as amended and restated on September 9, 2015, with certain stockholders, including the Sponsor, Future Fund Investment Company No. 5 Pty Ltd. (“Future Fund”), our directors and officers who hold shares and certain other investors. The Stockholders Agreement sets forth certain provisions relating to their respective rights and obligations with respect to their capital stock, including the designation of certain director nominees, preemptive rights, rights of first refusal and first offer upon disposition of shares, permitted transferees, demand and piggyback registration rights, tag along rights, drag along rights, certain protective provisions and actions requiring the approval of stockholders. In connection with this offering, the provisions of the Stockholders Agreement other than certain transfer restrictions will terminate in accordance its terms.
Registration Rights Agreement
In connection with the Bain Acquisition, on May 22, 2015, we entered into a Registration Rights Agreement with certain of our stockholders, including the Sponsor and Future Fund. Pursuant to the Registration Rights Agreement, following this offering these stockholders will have demand registration rights, including shelf registration rights, in respect of any shares of common stock held by them, subject to certain conditions. In addition, in the event that we register additional shares of common stock for sale to the public following the completion of this offering, we will be required to give notice of such registration to these stockholders, and, subject to certain limitations, include shares of common stock held by them in such registration. We have agreed to pay certain expenses related to any such registration and to indemnify these stockholders against certain liabilities that may arise under the Securities Act.
Management Agreement
In connection with the Bain Acquisition, on May 22, 2015, we entered into a Management Agreement with certain entities related to the Sponsor (the “Managers”), pursuant to which the Managers provide us with certain business consulting services. In exchange for these services, we pay the Managers an aggregate annual management fee equal to $5.0 million, and we reimburse the Managers for out-of-pocket expenses incurred by them or their respective affiliates in connection with their provision of services. In addition, the Managers are entitled to a transaction fee in connection with any financing, acquisition, disposition or change of control transaction equal to 1% of the gross transaction value, including assumed liabilities, for such transaction. The Management Agreement includes customary exculpation and indemnification provisions in favor of the Managers, the Sponsor and their respective affiliates. The Management Agreement will terminate pursuant to its terms upon the consummation of this offering, at which time we will pay the Managers a lump sum amount of $ .
In connection with this offering, we will enter into a management agreement with the Managers, pursuant to which the Managers will continue to provide services on substantially similar terms. However, we will not pay annual management fees, transaction fees or termination fees under such agreement.
Former Advisory Services Agreement
In connection with the Thoma Bravo Acquisition, on February 15, 2012, the Predecessor entered into an Advisory Services Agreement with Thoma Bravo, LLC, pursuant to which Thoma Bravo, LLC provided certain financial and management consulting services to the Company in exchange for a quarterly management fee of $875,000. The Company paid a total of $3.5 million in fees to Thoma Bravo, LLC pursuant to the Advisory Services Agreement in each of fiscal 2013, 2014 and 2015, respectively. The Advisory Services Agreement was terminated on May 22, 2015 in connection with the Bain Acquisition.
-127-
Table of Contents
Certain Relationships
From time to time, our Sponsor and/or its affiliates have entered into, and may continue to enter into, arrangements with us to use our products and services. We believe that all such arrangements have been entered into in the ordinary course of business and have been negotiated on commercially reasonable terms. Messrs. Humphrey, Loring and Poler are Managing Directors, and Mr. Abrahamson is a Principal, of Bain Capital Investors, LLC.
Promissory Note
On November 16, 2015, Mr. Clark issued a promissory note to the Company in the amount of $8.3 million to cover certain taxes associated with restricted stock granted to him in connection with the Bain Acquisition. Mr. Clark repaid the outstanding principal balance of $8.3 million, together with accrued interest of $63,421.25, in full on May 11, 2016. We have agreed to reimburse approximately $150,000 of fees and expenses incurred in connection with the repayment of the note by Mr. Clark and GSC-OZ Investments LLC, a Delaware limited liability company, of which Mr. Clark is the manager.
Policies and Procedures for Related Party Transactions
Our amended and restated audit committee charter will be effective when we complete this offering. The charter states that our audit committee is responsible for reviewing and approving in advance any related party transaction. All of our directors, officers and employees are required to report to the audit committee prior to entering into any transaction, arrangement or relationship, or any series of similar transactions, arrangements or relationships, in which we are to be a participant, the amount involved exceeds $120,000 and a related person had or will have a direct or indirect material interest, including purchases of goods or services by or from the related person or entities in which the related person has a material interest, indebtedness, guarantees of indebtedness and employment by us of a related person. Prior to the completion of this offering, our full board of directors reviewed and approved our related party transactions.
-128-
Table of Contents
The following table sets forth information regarding beneficial ownership of our common stock as of April 30, 2016 and as adjusted to reflect the shares of common stock to be issued and sold in the offering assuming no exercise of the underwriters’ option to purchase additional shares from us in the offering, by:
| • | each person or group of affiliated persons known by us to be the beneficial owner of more than 5% of our common stock; |
| • | each of our named executive officers; |
| • | each of our directors; and |
| • | all executive officers and directors as a group. |
Applicable percentage ownership is based on 91,172,391 shares of our common stock outstanding at April 30, 2016. Shares of common stock subject to options currently exercisable or exercisable within 60 days of April 30, 2016 are deemed to be outstanding and beneficially owned by the person holding the options for the purpose of computing the percentage of beneficial ownership of that person and any group of which that person is a member, but are not deemed outstanding for the purpose of computing the percentage of beneficial ownership for any other person.
Unless otherwise indicated in the footnotes below, each stockholder named in the following table possesses sole voting and investment power over the shares listed. The information does not necessarily indicate beneficial ownership for any other purpose. Unless otherwise noted below, the address of each person listed on the table is c/o Blue Coat, Inc., 384 Santa Trinita Ave., Sunnyvale, CA 94085.
| Shares Beneficially Owned Prior to the Offering(1) |
Shares Beneficially Owned After the Offering(1) |
|||||||||||||
| Name and Address of Beneficial Owner |
Shares | Percentage | Shares | Percentage | ||||||||||
| 5% Stockholders: |
||||||||||||||
| Bain Capital Entities(2) |
69,000,000 | 75.6 | % | % | ||||||||||
| Future Fund Investment Company No. 5 Pty Ltd.(3) |
7,000,000 | 7.7 | % | |||||||||||
| Named Executive Officers and Directors: |
||||||||||||||
| Gregory Clark(4) |
3,852,083 | 4.2 | % | |||||||||||
| Michael Fey(5) |
290,312 | * | ||||||||||||
| Nicholas Noviello(6) |
112,409 | * | ||||||||||||
| Darren Abrahamson(7) |
— | — | ||||||||||||
| David Humphrey(7) |
— | — | ||||||||||||
| Ian Loring(7) |
— | — | ||||||||||||
| Dwight Poler(7) |
— | — | ||||||||||||
| Charles Robel |
— | — | ||||||||||||
| All Directors and Executive Officers as a Group (8 Persons) |
4,254,804 | 4.6 | % | % | ||||||||||
| * | Less than 1%. |
| (1) | For purposes of the tabular disclosure above, all fractional shares have been rounded down to the nearest whole share. |
| (2) | Bain Capital Entities beneficially own 69,000,000 shares, consisting of (a) 47,418,490.52 shares of common stock held by Bain Capital Fund XI, L.P. (“Fund XI”); (b) 19,426,974.78 shares of common stock held by Bain Capital Europe Fund IV, L.P. (“Europe Fund IV”); (c) 1,750,461 shares of common stock held by BCIP Associates IV (US), L.P. (“BCIP IV”); (d) 80,642.40 shares of common stock held by BCIP Associates IV-B (US), L.P (“BCIP IV-B”); (e) 300,163.90 shares of common stock held by BCIP T Associates IV (US), L.P. (“BCIP T IV”) and (f) 23,267.40 shares of common stock held by BCIP T Associates IV-B (US), L.P. (“BCIP T IV-B” and, together with Fund XI, Europe Fund IV, BCIP IV, |
-129-
Table of Contents
| BCIP IV-B and BCIP T IV, the “Bain Capital Entities”). The governance, investment strategy and decision-making process with respect to investments held by all of the Bain Capital Entities is directed by the Global Private Equity Board (“GPEB”) of Bain Capital Investors, LLC (“BCI”), which consists of the following individuals: Steven Barnes, Joshua Bekenstein, John Connaughton, David Gross-Loh, Stephen Pagliuca, Michel Plantevin, Dwight Poler and Jonathan Zhu. By virtue of the relationships described in this footnote, BCI may be deemed to exercise voting and dispositive power with respect to the shares held by the Bain Capital Entities. Each of the Bain Capital Entities has an address c/o Bain Capital Private Equity, LP, John Hancock Tower, 200 Clarendon Street, Boston, MA 02116. |
| (3) | Future Fund Investment Company No. 5 Pty Ltd. (“Future Fund”) beneficially owns 7,000,000 shares of common stock. Future Fund is a wholly owned subsidiary of the Future Fund Board of Guardians, whose directors are Peter Costello, Carol Austin, Stephen Fitzgerald, Steven Harker, Carolyn Kay, John Poynton and Jane Wilson. The address of Future Fund is 120 Collins Street, Melbourne VIC 3000, Australia. |
| (4) | Includes 352,083 shares underlying stock options that are exercisable within 60 days of April 30, 2016, and 3,500,000 shares held by GSC-OZ Investments LLC, a Delaware limited liability company (“GSC-OZ Investments”). Mr. Clark, as manager of GSC-OZ Investments, has sole voting and investment power with respect to the shares held by GSC-OZ Investments. In connection with a loan, GSC-OZ Investments entered into a security and pledge agreement pursuant to which it granted to the lender a security interest in 2,000,000 shares of our common stock. See “Underwriters.” |
| (5) | Includes 290,312 shares underlying stock options that are exercisable within 60 days of April 30, 2016. |
| (6) | Includes 20,770 shares underlying stock options exercisable within 60 days of April 30, 2016, 30,241 shares held by the Catherine G. Noviello 2016 Annuity Trust (the “CN Trust”), of which Mr. Noviello is trustee, and 30,241 shares held by the Nicholas R. Noviello, Jr., 2016 Annuity Trust (the “NN Trust” and, together with the CN Trust, the “Noviello Trusts”), of which Mr. Noviello is trustee. Mr. Noviello, as trustee of the Noviello Trusts, has voting and investment power with respect to the shares held by the Noviello Trusts. |
| (7) | Does not include shares of common stock held by the Bain Capital Entities. Mr. Poler is a Managing Director of BCI and a member of GPEB. Messrs. Humphrey and Loring are Managing Directors of BCI. Mr. Abrahamson is a Principal of BCI. As a result, and by virtue of the relationships described in footnote 2 above, each of Messrs. Poler, Humphrey, Loring and Abrahamson may be deemed to share beneficial ownership of the shares of common stock held by the Bain Capital Entities. The address of each of Messrs. Poler, Humphrey, Loring and Abrahamson is c/o Bain Capital Private Equity, LP, John Hancock Tower, 200 Clarendon Street, Boston, MA 02116. |
-130-
Table of Contents
We summarize below the principal terms of the agreements that govern our existing indebtedness. We refer you to the exhibits to the registration statement of which this prospectus forms a part for copies of agreements governing the indebtedness described below. The below descriptions are qualified in their entirety by reference to these exhibits.
Senior Secured Credit Facilities
On May 22, 2015, Blue Coat Holdings, Inc. entered into a credit agreement with Jefferies Finance LLC, as lead arranger and bookrunner, the administrative agent, the collateral agent, a letter of credit issuer, a swingline lender and a lender that provided for a senior secured term loan facility (the “Senior Secured Term Loan Facility”) in an aggregate initial principal amount of $1,150 million and a senior secured revolving facility (the “Senior Secured Revolving Facility”, and, together with the Senior Secured Term Loan Facility, the “Senior Secured Credit Facilities”) in an aggregate principal committed amount equal to $100 million including a swingline subfacility and a letter of credit subfacility. On November 16, 2015 (the “Incremental Closing Date”), Blue Coat Holdings, Inc. entered into an amendment which increased the aggregate principal amount of the Senior Secured Term Loan Facility by $225 million.
Maturity and Prepayments
The Senior Secured Term Loan Facility has a seven year maturity and the Senior Secured Revolving Facility has a five year maturity. Blue Coat Holdings, Inc. is required to prepay the Senior Secured Term Loan Facility with the proceeds of certain issuances of indebtedness (other than certain permitted debt) and certain non-ordinary course asset sales and casualty and condemnation events (subject to certain exceptions and customary reinvestment rights). A percentage (to be determined based upon the consolidated first lien net leverage ratio as of the most recent fiscal year end) of Blue Coat Holdings, Inc.’s excess cash flow must also be applied to prepay the Senior Secured Term Loan Facility commencing with the fiscal year ending April 30, 2016 (with the excess cash flow measurement period for the fiscal year ending April 30, 2016 commencing August 1, 2015).
Voluntary prepayments of the Senior Secured Credit Facilities may be made without premium or penalty, other than customary “breakage” costs, if applicable, except that in the event that within the first six months after the Incremental Closing Date (i) any prepayment or repayment of the initial term loans borrowed under the Senior Secured Term Loan Facility on May 22, 2015 and the incremental term loans borrowed on the Incremental Closing Date (collectively, the “Initial Term Loans”) occurs with the proceeds of, or any conversion is made of such Initial Term Loans into, any new or replacement tranche of senior secured first lien term loans the primary purpose of which is to reduce the all-in-yield applicable to such Initial Term Loans or (ii) there is an amendment to the Senior Secured Term Loan Facility, in each case, the primary purpose of which is to reduce the all-in-yield applicable to such Initial Term Loans, then the Initial Term Loans so prepaid, repaid or amended will be subject to a prepayment premium of 1.00% of the principal amount thereof, in each case, unless such prepayment, repayment or amendment occurs in connection with an initial public offering, change of control or acquisition transaction permitted under the credit agreement governing the Senior Secured Credit Facilities. Blue Coat Holdings, Inc. is able to voluntarily reduce the unutilized portion of the commitment amount and repay outstanding loans under the Senior Secured Revolving Facility at any time (subject to minimum repayment amounts and customary notice periods) without premium or penalty, other than customary “breakage” costs, if applicable.
Security and Guarantees
The obligations of Blue Coat Holdings, Inc. under the Senior Secured Credit Facilities and, at its election, its obligations under any interest rate protection or other hedging arrangements, any bank products or any cash
-131-
Table of Contents
management arrangements, in each case, provided by any agent or lender under the Senior Secured Credit Facilities or any of their respective affiliates (collectively, the “Hedging and Cash Management Obligations”) are guaranteed by Batman Intermediate Holdings B, Inc. (“Holdings”) and each existing and subsequently acquired or organized direct or indirect wholly-owned material domestic restricted subsidiary of Blue Coat Holdings, Inc., subject to certain customary exceptions and limitations set forth in the documentation governing the Senior Secured Credit Facilities (the “Bank Guarantors”). The obligations of Blue Coat Holdings, Inc. under the Senior Secured Credit Facilities and the Hedging and Cash Management Obligations are secured on a first priority basis by Blue Coat Holdings, Inc.’s stock and substantially all the tangible and intangible assets of Blue Coat Holdings, Inc. and the Bank Guarantors (subject to certain exceptions), including 65% of Blue Coat Holdings, Inc.’s and any Bank Guarantor’s equity ownership in directly owned foreign subsidiaries, all fee-owned real property located in the United States with a book value in excess of $15 million, registered United States intellectual property, inventory, equipment, investment property and intercompany notes, in each case, subject to certain exceptions and thresholds.
Interest and Fees
With respect to each of the Senior Secured Term Loan Facility and the Senior Secured Revolving Facility, the initial interest rate was, at the option of Blue Coat Holdings, Inc., the adjusted LIBOR rate (which is subject to a minimum rate of 1.00%) plus an applicable margin of 3.50%, or the alternative base rate (which is subject to a minimum rate of 2.00%) plus an applicable margin of 2.50%. The applicable margin for loans under the Senior Secured Revolving Facility is subject to two reductions of 0.25% based upon Blue Coat Holdings, Inc.’s consolidated first lien net leverage ratio.
In addition, Blue Coat Holdings, Inc. is required to pay certain upfront and recurring fees with respect to the Senior Secured Credit Facilities, including fees on the unused commitments of the lenders under the Senior Secured Revolving Facility in the amount of 0.50% per annum (which fee is subject to reduction to 0.375% per annum based upon Blue Coat Holdings, Inc.’s consolidated first lien net leverage ratio); and to pay letter of credit fees on the aggregate face amounts of outstanding letters of credit plus a fronting fee to the issuing banks.
Incremental Facility
At the closing of the Senior Secured Credit Facilities, the credit agreement governing the Senior Secured Credit Facilities permitted Blue Coat Holdings, Inc., subject to certain other conditions described in the credit agreement governing the Senior Secured Credit Facilities, to request that the Senior Secured Credit Facilities (in the aggregate) be increased by up to (i) the greater of (x) $245 million and (y) Blue Coat Holdings, Inc.’s Consolidated EBITDA (as defined in the credit agreement governing the Senior Secured Credit Facilities) for the most recent four fiscal quarter period, plus (ii) all voluntary prepayments of the Senior Secured Term Loan Facility and permanent commitment reductions of the Senior Secured Revolving Facility (except to the extent funded with proceeds from incurrences of long-term indebtedness (other than revolving indebtedness)), plus (iii) an unlimited amount so long as, under this clause (iii) only, such amount at such time could be incurred without causing, (x) in the case of debt secured on a pari passu basis with the Senior Secured Credit Facilities, the pro forma consolidated first lien net leverage ratio to exceed 4.35 to 1.00 or (y) in the case of debt that is unsecured or secured on a junior basis to the Senior Secured Credit Facilities, 6.20 to 1.00. On the Incremental Closing Date, Blue Coat Holdings, Inc. entered into an amendment which increased the aggregate principal amount of the Senior Secured Term Loan Facility by $225 million, which reduced the availability for future borrowings under clause (i) described in the preceding sentence.
Amortization
The Senior Secured Term Loan Facility amortizes in equal quarterly installments in an aggregate annual amount equal to 1% of its original principal amount, commencing January 29, 2016, with the balance payable on the seventh anniversary of the closing date of the Senior Secured Credit Facilities.
-132-
Table of Contents
Covenants
The Senior Secured Credit Facilities contain a number of customary affirmative and negative covenants that, among other things, limit or restrict Blue Coat Holdings, Inc.’s ability and its restricted subsidiaries’ ability and, solely in the case of the passive activity covenant described below, Batman Intermediate Holdings B, Inc.’s ability, to (each subject to certain exceptions):
| • | incur additional indebtedness (including guarantee obligations); |
| • | incur liens; |
| • | engage in certain fundamental changes, including changes in the nature of the business, mergers, liquidations and dissolutions; |
| • | sell assets; |
| • | pay dividends, and make stock repurchases and redemptions; |
| • | make acquisitions, investments, loans and advances; |
| • | pay and modify the terms of certain subordinated indebtedness and organizational documents; |
| • | engage in certain transactions with affiliates; |
| • | change our fiscal year; |
| • | in the case of Batman Intermediate Holdings B, Inc., engage in activities other than as a passive holding company; and |
| • | enter into negative pledge clauses and clauses restricting subsidiary distributions. |
In addition, with respect to the Senior Secured Revolving Facility, Blue Coat Holdings, Inc. is required to comply with a maximum consolidated first lien net leverage ratio. This financial covenant is tested quarterly on a trailing four quarter basis on the last day of the most recent four fiscal quarter period for which financial statements were required to be delivered under the Senior Secured Credit Facilities. However, this financial covenant is only tested if, as of the last day of the applicable fiscal quarter of Blue Coat Holdings, Inc. (commencing January 29, 2016), revolving loans under the Senior Secured Revolving Facility (including Swingline Loans,) and certain letter of credit obligations (but excluding undrawn or cash collateralized Letters of Credit) are outstanding in an aggregate amount greater than 35% of the total commitments under the Senior Secured Revolving Facility at such time. The financial covenant is subject to an equity cure and may be amended or waived with the consent of the lenders holding a majority of the commitments under the Senior Secured Revolving Facility. At April 30, 2016, Blue Coat Holdings, Inc. was in compliance with all the covenants under the credit agreement governing the Senior Secured Credit Facilities.
Events of Default
The Senior Secured Credit Facilities contain customary events of default (subject to customary grace periods, baskets and materiality thresholds). Failure to comply with the consolidated first lien net leverage ratio described above or the other provisions of the credit agreement for the Senior Secured Credit Facilities (subject to certain grace periods) could, absent a waiver or an amendment from the applicable lenders, restrict the availability of the Senior Secured Revolving Facility and/or permit the acceleration of all outstanding borrowings under the Senior Secured Credit Facilities.
Senior Notes
Blue Coat Holdings, Inc. issued unsecured senior notes (the “Senior Notes”) having an aggregate principal amount of $470 million in a private offering on May 22, 2015. The Senior Notes bear interest at the rate of 8.375% per annum, payable semi-annually in arrears on June 1 and December 1. The Senior Notes mature
-133-
Table of Contents
May 22, 2023. There are no registration rights associated with the Senior Notes. At April 30, 2016, the outstanding principal balance of the Senior Notes was $470 million and the carrying amount was $451.8 million, net of unamortized discount.
The Senior Notes are guaranteed on an unsecured basis by each wholly-owned domestic subsidiary of Blue Coat Holdings, Inc. that guarantees the Senior Secured Credit Facilities.
At any time and from time to time prior to June 1, 2018, Blue Coat Holdings, Inc. may redeem the Senior Notes, in whole or in part, at a price equal to 100% of the principal amount thereof, plus a “make-whole” premium, plus accrued and unpaid interest. In addition, at any time and from time to time prior to June 1, 2018, Blue Coat Holdings, Inc. may, at its option, redeem up to 40% of the aggregate principal amount of the Senior Notes issued under the indenture governing the Senior Notes at a redemption price equal to 108.375% of the principal amount of the Senior Notes redeemed, plus accrued and unpaid interest to, but excluding, the redemption date with the net cash proceeds received by, or contributed to it or any of its restricted subsidiaries from certain equity offerings, including this offering; provided that: (1) in each case the redemption takes place not later than 180 days after the closing of the related equity offering, and (2) not less than 50% of the original aggregate principal amount of the Senior Notes issued under the indenture governing the Senior Notes remains outstanding immediately thereafter, excluding Senior Notes held by Blue Coat Holdings, Inc. or any of its restricted subsidiaries.
At any time and from time to time on and after June 1, 2018, Blue Coat Holdings, Inc. may redeem the Senior Notes at its option, in whole or in part, based on the following agreed-upon schedule of redemption prices if redeemed during the 12-month period beginning on June 1 of each of the years indicated below:
| Year |
Percentage | |||
| 2018 |
104.188 | % | ||
| 2019 |
102.094 | % | ||
| 2020 |
101.047 | % | ||
| 2021 and thereafter |
100.000 | % | ||
The indenture governing the Senior Notes contains customary affirmative and negative covenants. The negative covenants in the indenture governing the Senior Notes are substantially similar to, but generally less restrictive than, those in our Senior Secured Credit Facilities. In addition, the indenture governing the Senior Notes contains a number of events of default (many of which are subject to applicable cure periods), including, among others, the failure to make payments when due, defaults under other agreements or instruments of indebtedness and non-compliance with covenants. Upon the occurrence of an event of default, the holders of the Senior Notes may declare all amounts outstanding to be immediately due and payable. Under the indenture governing the Senior Notes, we are and will be permitted to enter into certain additional borrowing arrangements, subject to certain limitations. At April 30, 2016, Blue Coat Holdings, Inc. was in compliance with all of the covenants under the indenture governing the Senior Notes.
-134-
Table of Contents
The following description summarizes the material terms of our capital stock. Because it is only a summary, it does not contain all the information that may be important to you. For a complete description of our capital stock, you should refer to our restated certificate of incorporation and our amended and restated bylaws, which are included as exhibits to the registration statement of which this prospectus forms a part, and to the provisions of applicable Delaware law.
Immediately following the closing of this offering, our authorized capital stock will consist of shares of common stock, $0.001 par value. As of , 2016, there were shares of our common stock issued and outstanding held of record by stockholders.
Common Stock
Voting Rights
Each holder of our common stock is entitled to one vote for each share on all matters submitted to a vote of the stockholders, including the election of directors. Under our restated certificate of incorporation and amended and restated bylaws, our stockholders will not have cumulative voting rights. Because of this, the holders of a majority of the shares of common stock entitled to vote in any election of directors can elect all of the directors standing for election, if they should so choose.
Dividends
Holders of common stock are entitled to receive ratably those dividends, if any, as may be declared from time to time by the board of directors out of legally available funds.
Liquidation
In the event of our liquidation, dissolution or winding up, holders of common stock will be entitled to share ratably in the net assets legally available for distribution to stockholders after the payment of all of our debts and other liabilities.
Rights and Preferences
Holders of shares of common stock have no preemptive, conversion or subscription rights and there are no redemption or sinking fund provisions applicable to the common stock. The rights, preferences and privileges of the holders of shares of common stock are subject to, and may be adversely affected by, the rights of the holders of shares of any series of preferred stock that we may designate in the future.
Preferred Stock
No shares of our preferred stock are currently outstanding. Under our restated certificate of incorporation, our board of directors, without further action by our stockholders, will be authorized to issue shares of preferred stock in one or more classes or series. The board may fix or alter the rights, preferences and privileges of the preferred stock, along with any limitations or restrictions, including voting rights, dividend rights, conversion rights, redemption privileges and liquidation preferences of each class or series of preferred stock. The preferred stock could have voting or conversion rights that could adversely affect the voting power or other rights of holders of our common stock. The issuance of preferred stock could also have the effect, under certain circumstances, of delaying, deferring or preventing a change of control of our company. We currently have no plans to issue any shares of preferred stock.
-135-
Table of Contents
Anti-Takeover Effects of Delaware Law and Our Certificate of Incorporation and Bylaws
Our restated certificate of incorporation and our amended and restated bylaws will contain certain provisions that could have the effect of delaying, deferring or discouraging another party from acquiring control of us. These provisions are also designed, in part, to encourage persons seeking to acquire control of us to negotiate first with our board of directors. We believe that the benefits of increased protection of our potential ability to negotiate more favorable terms with an unfriendly or unsolicited acquirer outweigh the disadvantages of discouraging a proposal to acquire us.
These provisions include:
| • | Classified board. Our restated certificate of incorporation provides that our board of directors will be divided into three classes of directors. As a result, approximately one-third of our board of directors will be elected each year. The classification of directors will have the effect of making it more difficult for stockholders to change the composition of our board. |
| • | Requirements for removal of directors. Following the date on which investment funds advised by affiliates of Bain Capital, LP no longer beneficially own a majority of our common stock, directors may only be removed for cause by the affirmative vote of the holders of at least 75% of the voting power of our outstanding shares of capital stock. |
| • | Advance notice procedures. Our bylaws establish an advance notice procedure for stockholder proposals to be brought before an annual meeting of our stockholders, including proposed nominations of persons for election to the board of directors. Stockholders at an annual meeting will only be able to consider proposals or nominations specified in the notice of meeting or brought before the meeting by or at the direction of the board of directors or by a stockholder who was a stockholder of record on the record date for the meeting, who is entitled to vote at the meeting and who has given our secretary timely written notice, in proper form, of the stockholder’s intention to bring that business before the meeting. Although the bylaws do not give the board of directors the power to approve or disapprove stockholder nominations of candidates or proposals regarding other business to be conducted at a special or annual meeting, the bylaws may have the effect of precluding the conduct of certain business at a meeting if the proper procedures are not followed or may discourage or deter a potential acquiror from conducting a solicitation of proxies to elect its own slate of directors or otherwise attempting to obtain control of our company. |
| • | Actions by written consent; special meetings of stockholders. Our restated certificate of incorporation provides that, following the date on which investment funds advised by affiliates of Bain Capital, LP no longer beneficially own a majority of our common stock, stockholder action can be taken only at an annual or special meeting of stockholders and cannot be taken by written consent in lieu of a meeting. Our restated certificate of incorporation also provides that, except as otherwise required by law, special meetings of the stockholders can only be called by or at the direction of the chairperson or vice chairperson of the board, the chief executive officer, a majority of the board of directors, or, until the date on which investment funds advised by affiliates of Bain Capital, LP no longer beneficially own a majority of our common stock, by the secretary at the request of the holders of 50% or more of our outstanding shares of common stock. |
| • | Supermajority approval requirements. Following the date on which investment funds advised by affiliates of Bain Capital, LP no longer beneficially own a majority of our common stock, certain amendments to our certificate of incorporation and shareholder amendments to our bylaws will require the affirmative vote of at least 75% of the voting power of the outstanding shares of our capital stock. |
| • | Authorized but unissued shares. Our authorized but unissued shares of preferred stock will be available for future issuance without stockholder approval. The existence of authorized but unissued shares of preferred stock could render more difficult or discourage an attempt to obtain control of a majority of our common stock by means of a proxy contest, tender offer, merger or otherwise. |
-136-
Table of Contents
| • | Business combinations with interested stockholders. We have elected in our restated certificate of incorporation not to be subject to Section 203 of the DGCL, an antitakeover law. In general, Section 203 prohibits a publicly held Delaware corporation from engaging in a business combination, such as a merger, with a person or group owning 15% or more of the corporation’s voting stock for a period of three years following the date the person became an interested stockholder, unless (with certain exceptions) the business combination or the transaction in which the person became an interested stockholder is approved in a prescribed manner. While we will not be subject to any anti-takeover effects of Section 203, our certificate of incorporation contains provisions that have the same effect as Section 203, except that they provide that investment funds advised by affiliates of Bain Capital, LP will not be deemed to be an “interested stockholder,” regardless of the percentage of our voting stock owned by such investment funds, and accordingly will not be subject to such restrictions. |
Choice of Forum
Our restated certificate of incorporation will provide that unless we consent to the selection of an alternate forum, the Court of Chancery of the State of Delaware is the sole and exclusive forum for any derivative action or proceeding brought on our behalf; any action asserting a breach of fiduciary duty; any action asserting a claim against us arising pursuant to the DGCL, our certificate of incorporation or amended and restated bylaws; or any action asserting a claim against us that is governed by the internal affairs doctrine. Any person or entity purchasing or otherwise acquiring any interest in our shares of common stock shall be deemed to have notice of and consented to the forum provisions in our restated certificate of incorporation or amended and restated bylaws. See “Risk Factors—Risks Related to Ownership of Our Common Stock and this Offering—Our restated certificate of incorporation after this offering will designate courts in the State of Delaware as the sole and exclusive forum for certain types of actions and proceedings that may be initiated by our stockholders, which could limit our stockholders’ ability to obtain a favorable judicial forum for disputes with us or our directors, officers or employees.”
Corporate Opportunities
Our restated certificate of incorporation provides that we renounce any interest or expectancy in the business opportunities of the investment funds advised by affiliates of Bain Capital, LP and all of their respective partners, principals, directors, officers, members, managers, managing directors, operating partners and/or employees, including any of the foregoing who serves as a director or officer of our company, and each such party will not have, to the fullest extent permitted by applicable law, any obligation to offer us those opportunities unless presented to one of our directors or officers in his or her capacity as a director or officer.
Limitations on Liability and Indemnification of Directors and Officers
Our restated certificate of incorporation limits the liability of our directors to the fullest extent permitted by the DGCL and provides that we may indemnify them. We expect to enter into customary indemnification agreements with each of our directors that provide them, in general, with customary indemnification in connection with their service to us or on our behalf. We also maintain officers’ and directors’ liability insurance that insures against liabilities that our officers and directors may incur in such capacities.
Transfer Agent and Registrar
Upon the completion of this offering, the transfer agent and registrar for our common stock will be Computershare, Inc.
Listing
We intend to apply to list our common stock for quotation on the NYSE under the trading symbol “BLCT”.
-137-
Table of Contents
SHARES ELIGIBLE FOR FUTURE SALE
No public market currently exists for our common stock, and we cannot predict the effect, if any, that sales of shares or availability of any shares for sale will have on the market price of our common stock prevailing from time to time. Sales of substantial amounts of common stock (including shares issued on the exercise of options, warrants or convertible securities, if any) or the perception that such sales could occur, could adversely affect the market price of our common stock and our ability to raise additional capital through a future sale of securities.
Upon completion of this offering, we will have shares of common stock issued and outstanding. All of the shares of our common stock offered by us pursuant to this prospectus will be freely tradable without restriction or further registration under the Securities Act unless such shares are purchased by “affiliates” as that term is defined in Rule 144 under the Securities Act. Upon completion of this offering, approximately % of our outstanding common stock will be held by our existing stockholders. These shares will be “restricted securities” as that phrase is defined in Rule 144. Subject to certain contractual restrictions, including the lock-up agreements described below, holders of restricted shares will be entitled to sell those shares in the public market if they qualify for an exemption from registration under Rule 144 or any other applicable exemption under the Securities Act. Subject to the lock-up agreements described below and the provisions of Rules 144 and 701, additional shares will be available for sale as set forth below.
Lock-up Agreements
In connection with this offering, we and substantially all of our stockholders have agreed, subject to certain exceptions, not to offer, sell, or transfer any common stock or securities convertible into or exchangeable for our common stock for 180 days after the date of this prospectus without the prior written consent of on behalf of the underwriters. In addition to the restrictions contained in the lock-up agreements described above, we have entered into agreements with certain of our security holders, including our registration rights agreement and our standard forms of option agreements under our equity incentive plans, that contain market stand-off provisions imposing restrictions on the ability of such security holders to offer, sell or transfer our equity securities for a period of 180 days following the date of this prospectus. After the offering, certain of our employees, executive officers and directors may enter into written trading plans that are intended to comply with Rule 10b5-1 under the Securities Exchange Act of 1934. Sales under these trading plans would not be permitted until the expiration of the lock-up agreements relating to the offering described above.
Rule 144
In general, under Rule 144, beginning 90 days after the date of this prospectus, any person who is not our affiliate and has held their shares for at least six months, including the holding period of any prior owner other than one of our affiliates, may sell shares without restriction, subject to the availability of current public information about us. In addition, under Rule 144, any person who is not our affiliate and has not been our affiliate at any time during the preceding three months and has held their shares for at least one year, including the holding period of any prior owner other than one of our affiliates, would be entitled to sell an unlimited number of shares immediately upon the closing of this offering without regard to whether current public information about us is available.
Beginning 90 days after the date of this prospectus, a person who is our affiliate or who was our affiliate at any time during the preceding three months and who has beneficially owned restricted securities for at least six months, including the holding period of any prior owner other than one of our affiliates, is entitled to sell a number of shares within any three-month period that does not exceed the greater of: (i) 1% of the number of shares of our common stock outstanding, which will equal approximately shares immediately after this offering; and (ii) the average weekly trading volume of our common stock on the NYSE during the four calendar weeks preceding the filing of a notice on Form 144 with respect to the sale.
-138-
Table of Contents
Sales under Rule 144 by our affiliates are also subject to certain manner of sale provisions, notice requirements and the availability of current public information about us.
Rule 701
Rule 701 generally allows a stockholder who purchased shares of our common stock pursuant to a written compensatory plan or contract and who is not deemed to have been an affiliate of our company during the immediately preceding 90 days to sell these shares in reliance upon Rule 144, but without being required to comply with the public information, holding period, volume limitation, or notice provisions of Rule 144. Rule 701 also permits affiliates of our company to sell their Rule 701 shares under Rule 144 without complying with the holding period requirements of Rule 144. All holders of Rule 701 shares, however, are required to wait until 90 days after the date of this prospectus before selling such shares pursuant to Rule 701.
Equity Incentive Plans
Following this offering, we intend to file with the SEC a registration statement on Form S-8 under the Securities Act covering the shares of common stock that are subject to outstanding options and other awards issuable pursuant to our equity incentive plans. Shares covered by such registration statement will be available for sale in the open market following its effective date, subject to certain limitations applicable to affiliates and the terms of lock-up restrictions applicable to those shares.
Registration Rights
When this offering is complete, the holders of an aggregate of shares of our common stock, or their transferees, will be entitled to rights with respect to the registration of their shares under the Securities Act. Registration of these shares under the Securities Act would result in these shares becoming freely tradable without restriction under the Securities Act immediately upon the effectiveness of such registration. For a further description of these rights, see “Certain Relationships and Related Party Transactions—Registration Rights Agreement.”
-139-
Table of Contents
MATERIAL U.S. FEDERAL INCOME TAX CONSEQUENCES TO NON-U.S. HOLDERS OF OUR COMMON STOCK
The following is a summary of the material U.S. federal income tax and certain estate tax consequences of the ownership and disposition of our common stock to non-U.S. holders, but does not purport to be a complete analysis of all the potential tax considerations relating thereto. This summary is based upon the provisions of the Internal Revenue Code of 1986, as amended, or the Code, Treasury regulations promulgated thereunder, administrative rulings and judicial decisions, all as of the date hereof. These authorities may be changed, possibly retroactively, and are subject to differing interpretations, which could result in U.S. federal income tax consequences different from those set forth below. We have not sought any ruling from the Internal Revenue Service, or the IRS, with respect to the statements made and the conclusions reached in the following summary, and there can be no assurance that the IRS will agree with such statements and conclusions.
This summary also does not address the tax considerations arising under the laws of any non-U.S., state or local jurisdiction or other U.S. federal laws, including gift and estate tax laws, except to the limited extent set forth below. In addition, this discussion does not address tax considerations applicable to an investor’s particular circumstances or to investors that may be subject to special tax rules, including, without limitation:
| • | banks, insurance companies or other financial institutions; |
| • | persons subject to the alternative minimum tax or the Medicare tax on net investment income; |
| • | tax-exempt organizations or governmental organizations; |
| • | controlled foreign corporations, passive foreign investment companies, and corporations that accumulate earnings to avoid U.S. federal income tax; |
| • | dealers in securities or currencies; |
| • | traders in securities that elect to use a mark-to-market method of accounting for their securities holdings; |
| • | persons that own, or are deemed to own, more than five percent of our common stock (except to the extent specifically set forth below); |
| • | certain former citizens or long-term residents of the United States; |
| • | persons who hold our common stock as a position in a hedging transaction, “straddle,” “conversion transaction” or other risk reduction transaction; |
| • | persons who hold or receive our common stock pursuant to the exercise of any employee stock option or otherwise as compensation; |
| • | partnerships or other entities or arrangements treated as partnerships for U.S. federal income tax purposes, or investors in any such entities; |
| • | pension plans; |
| • | persons who do not hold our stock as a capital asset within the meaning of Section 1221 of the Code; and |
| • | persons deemed to sell our common stock under the constructive sale provisions of the Code. |
If a partnership or entity classified as a partnership for U.S. federal income tax purposes holds our common stock, the tax treatment of a partner generally will depend on the status of the partner and upon the activities of the partnership. Accordingly, partnerships that hold our common stock, and partners in such partnerships, should consult their tax advisors regarding the U.S. federal income tax consequences to them of the purchase, ownership, and disposition of our common stock.
-140-
Table of Contents
YOU ARE URGED TO CONSULT YOUR TAX ADVISOR WITH RESPECT TO THE APPLICATION OF THE U.S. FEDERAL INCOME TAX LAWS TO YOUR PARTICULAR SITUATION, AS WELL AS ANY TAX CONSEQUENCES OF THE PURCHASE, OWNERSHIP AND DISPOSITION OF OUR COMMON STOCK ARISING UNDER THE U.S. FEDERAL ESTATE OR GIFT TAX RULES OR UNDER THE LAWS OF ANY STATE, LOCAL, NON-U.S. OR OTHER TAXING JURISDICTION OR UNDER ANY APPLICABLE TAX TREATY.
Non-U.S. Holder Defined
For purposes of this discussion, you are a non-U.S. holder if you are the beneficial owner of our common stock and are , for U.S. federal income tax purposes, an individual, corporation, estate or trust other than:
| • | an individual citizen or resident of the United States (for U.S. tax purposes); |
| • | a corporation or other entity taxable as a corporation created or organized in the United States or under the laws of the United States or any political subdivision thereof or treated as such for U.S. federal income tax purposes; |
| • | an estate whose income is subject to U.S. federal income tax regardless of its source; or |
| • | a trust if (x) a court within the United States is able to exercise primary supervision over the administration of the trust and one or more U.S. persons (within the meaning of Section 7701(a)(30) of the Code) have the authority to control all substantial decisions of the trust or (y) which has in effect a valid election under the applicable Treasury regulations to be treated as a U.S. person. |
A modified definition of non-U.S. holder applies for federal estate tax purposes (as discussed below).
Distributions
As discussed under “Dividend Policy” above, we do not currently anticipate paying cash dividends on shares of our common stock in the foreseeable future. However, if we do make distributions of cash or property on our common stock, those distributions will constitute dividends for U.S. tax purposes to the extent paid from our current or accumulated earnings and profits, as determined under U.S. federal income tax principles, and will be subject to withholding as described above. To the extent those distributions exceed both our current and our accumulated earnings and profits, they will constitute a return of capital and will first reduce your adjusted basis in our common stock, but not below zero, and then will be treated as gain from the sale of stock that will be treated as described below in the section entitled “Gain on Disposition of Common Stock.”
Subject to the discussion below on effectively connected income, any dividend paid to you generally will be subject to U.S. withholding tax either at a rate of 30% of the gross amount of the dividend (or such lower rate as may be specified by an applicable income tax treaty). In order to receive a reduced treaty rate, you must provide us with an IRS Form W-8BEN, IRS Form W-8BEN-E or other appropriate version of IRS Form W-8 certifying qualification for the reduced rate. A non-U.S. holder of shares of our common stock eligible for a reduced rate of U.S. withholding tax pursuant to an income tax treaty may obtain a refund of any excess amounts withheld by timely filing an appropriate claim for refund with the IRS. If the non-U.S. holder holds the stock through a financial institution or other agent acting on the non-U.S. holder’s behalf, the non-U.S. holder will be required to provide appropriate documentation to the agent, which then will be required to provide certification to us or our paying agent, either directly or through other intermediaries.
Dividends received by you that are effectively connected with your conduct of a U.S. trade or business, and, if required by a tax treaty, are attributable to a permanent establishment that you maintain in the United States, are generally exempt from such withholding tax. In order to obtain this exemption, you must provide us with an IRS Form W-8ECI or other appropriate IRS Form W-8 properly certifying such exemption. Such effectively connected dividends, although not subject to withholding tax, are taxed at the same graduated rates applicable to
-141-
Table of Contents
U.S. persons, net of certain deductions and credits. In addition, if you are a corporate non-U.S. holder, dividends you receive that are effectively connected with your conduct of a U.S. trade or business may also be subject to a branch profits tax at a rate of 30% or such lower rate as may be specified by an applicable income tax treaty. You should consult your tax advisor regarding any applicable tax treaties that may provide for different rules.
The certification requirements described above may also require a non-U.S. holder that provides an IRS form or that claims treaty benefits to provide its U.S. taxpayer identification number.
For additional withholding rules that may apply to dividends, see the discussions below under the headings “—Backup Withholding and Information Reporting” and “—Foreign Account Tax Compliance Act (FATCA).”
Gain on Disposition of Common Stock
Subject to discussions below regarding backup withholding and FATCA, you generally will not be required to pay U.S. federal income tax on any gain realized upon the sale, exchange or other taxable disposition of our common stock (including a redemption, but only if the redemption is treated as a sale or exchange rather than a distribution for U.S. federal income tax purposes) unless:
| • | the gain is effectively connected with your conduct of a U.S. trade or business, and, if required by an applicable income tax treaty, the gain is attributable to a permanent establishment that you maintain in the United States; |
| • | you are an individual non-resident alien who is present in the United States for a period or periods aggregating 183 days or more during the calendar year in which the sale or disposition occurs and certain other conditions are met; or |
| • | our common stock constitutes a U.S. real property interest by reason of our status as a “United States real property holding corporation”, or USRPHC, for U.S. federal income tax purposes at any time within the shorter of the five-year period preceding your disposition of, or your holding period for, our common stock. |
If you are a non-U.S. holder described in the first bullet above, you will be required to pay tax on the net gain derived from the sale under regular graduated U.S. federal income tax rates, and corporate non-U.S. holders described in the first bullet above may be subject to the branch profits tax at a 30% rate (or such lower rate as may be specified by an applicable income tax treaty) on such effectively connected gain.
If you are an individual non-U.S. holder described in the second bullet above, you will be required to pay a flat 30% tax (or such lower rate specified by an applicable income tax treaty) on the gain derived from the sale, which tax may be offset by U.S. source capital losses (even though you are not considered a resident of the United States), provided you have timely filed U.S. federal income tax returns with respect to such losses. You should consult any applicable income tax or other treaties that may provide for different rules.
With respect to the third bullet above, we believe that we are not currently and will not become a USRPHC. However, because the determination of whether we are a USRPHC depends on the fair market value of our U.S. real property relative to the fair market value of our other business assets and our foreign real property interests, there can be no assurance that we will not become a USRPHC in the future. Even if we become a USRPHC, however, as long as our common stock is regularly traded on an established securities market (with the meaning of the Code), such common stock will be treated as U.S. real property interests only if you actually or constructively hold more than five percent of such regularly traded common stock at any time during the shorter of the five-year period preceding your disposition of, or your holding period for, our common stock. If our common stock is a U.S. real property interest in the hands of a non-U.S. holder, such non-U.S. holder generally will be subject to tax on gain on the disposition of share of our common stock in the same manner as on gain that is effectively connected with the conduct of a U.S. trade or business, except the “branch profits tax” will not apply.
-142-
Table of Contents
For additional withholding rules that may apply to proceeds from the sale or other disposition of our common stock, see the discussions below under the headings “- Backup Withholding and Information Reporting” and “—Foreign Account Tax Compliance Act (FATCA).”
Federal Estate Tax
Common stock beneficially owned by an individual who is not a citizen or resident of the United States (as defined for U.S. federal estate tax purposes) at the time of death will generally be included in such decedent’s gross estate for U.S. federal estate tax purposes, unless an applicable estate tax or other treaty provides otherwise, and therefore may be subject to tax. You are urged to consult your own tax advisors regarding the U.S. federal estate tax consequences of the ownership or disposition of our common stock.
Backup Withholding and Information Reporting
We must report annually to the IRS and to each non-U.S. holder the gross amount of the distributions on our common stock paid to such holder and the tax withheld, if any, with respect to such distributions, regardless of whether withholding was required. A non-U.S. holder will generally be subject to backup withholding on dividends paid to such holder unless such holder furnishes a valid IRS Form W-8BEN or W-8BEN-E, as applicable, (or such other applicable form and documentation as required by the Code or the Treasury regulations) certifying under penalties of perjury that it is a non-U.S. holder (and the payor does not have actual knowledge or reason to know that such holder is a United States person as defined under the Code), or such holder otherwise establishes an exemption. Dividends paid to non-U.S. holders subject to the United States federal withholding tax, as described above in ‘‘-Distributions,’’ generally will be exempt from U.S. backup withholding.
Information reporting and, depending on the circumstances, backup withholding will apply to the payment of the proceeds from a sale or other disposition of shares of our common stock by a non-U.S. holder effected by or through the United States office of any broker, United States or foreign, unless the holder certifies that it is not a United States person (as defined under the Code) and satisfies certain other requirements, or otherwise establishes an exemption. Generally, information reporting and backup withholding will not apply to a payment of disposition proceeds to a non-U.S. holder where the transaction is effected outside the United States through a non-United States office of a broker. However, for information reporting purposes, dispositions effected through a non-United States office of a broker with substantial United States ownership or operations generally will be treated in a manner similar to dispositions effected through a United States office of a broker. Prospective investors should consult their own tax advisors regarding the application of the information reporting and backup withholding rules to them.
Copies of the information returns may be made available to the tax authorities in the country in which the non-U.S. holder resides or is incorporated under the provisions of an applicable treaty or agreement.
Foreign Account Tax Compliance Act (FATCA)
Legislation (commonly referred to as ‘‘FATCA’’) imposes United States federal withholding at a rate of 30% on payments to certain non-U.S. entities (including financial intermediaries), including dividends on, and the gross proceeds from, dispositions of our common stock, unless various information reporting and due diligence requirements, which are different from and in addition to the certification requirements described elsewhere in this discussion, have been satisfied (generally relating to ownership by U.S. persons of interests in or accounts with those entities). The withholding rules currently apply to payments of dividends on our common stock and will apply to gross proceeds from dispositions of our common stock beginning January 1, 2017 (which date, under recent Treasury guidance, is expected to be delayed until on or after January 1, 2019). Although Treasury regulations implementing FATCA have been finalized, certain aspects of these rules remain unclear and subject to change. An intergovernmental agreement between the United States and a foreign country where a
-143-
Table of Contents
holder or intermediary is located may modify the requirements in this paragraph. Non-U.S. holders should consult their tax advisors regarding the possible implications of FATCA on their investment in our common stock.
The preceding discussion of U.S. federal tax considerations is for general information only. It is not tax advice. Each prospective investor should consult its own tax advisor regarding the particular U.S. federal, state and local and non-U.S. tax consequences of purchasing, holding and disposing of our common stock, including the consequences of any proposed change in applicable laws.
-144-
Table of Contents
Under the terms and subject to the conditions in an underwriting agreement dated the date of this prospectus, the underwriters named below, for whom Morgan Stanley & Co. LLC, J.P. Morgan Securities LLC, Credit Suisse Securities (USA) LLC and Goldman, Sachs & Co. are acting as representatives, have severally agreed to purchase, and we have agreed to sell to them, severally, the number of shares indicated below:
| Name |
Number of | |
| Morgan Stanley & Co. LLC |
||
| J.P. Morgan Securities LLC |
||
| Credit Suisse Securities (USA) LLC |
||
| Goldman, Sachs & Co. |
||
| Jefferies LLC |
||
| UBS Securities LLC |
||
| RBC Capital Markets, LLC |
||
| Wells Fargo Securities, LLC |
||
| Cowen and Company, LLC |
||
| Pacific Crest Securities, a division of KeyBanc Capital Markets Inc. |
||
| Piper Jaffray & Co. |
||
| William Blair & Company, L.L.C. |
||
|
| ||
| Total: |
The underwriters and the representatives are collectively referred to as the “underwriters” and the “representatives,” respectively. The underwriters are offering the shares of common stock subject to their receipt and acceptance of the shares from us and subject to prior sale and the underwriters’ right to reject any order in whole or in part. The underwriting agreement provides that the obligations of the several underwriters to pay for and accept delivery of the shares of common stock offered by this prospectus are subject to the approval of certain legal matters by their counsel and to certain other conditions. The underwriters are obligated to take and pay for all of the shares of common stock offered by this prospectus if any such shares are taken. However, the underwriters are not required to take or pay for the shares covered by the underwriters’ option to purchase additional shares described below.
The underwriters initially propose to offer part of the shares of common stock directly to the public at the offering price listed on the cover page of this prospectus and part to certain dealers. After the initial offering of the shares of common stock, the offering price and other selling terms may from time to time be varied by the representatives. Sales of shares made outside of the United States may be made by affiliates of the underwriters.
We have granted to the underwriters an option, exercisable for 30 days from the date of this prospectus, to purchase up to additional shares of common stock at the public offering price listed on the cover page of this prospectus, less underwriting discounts and commissions. To the extent the option to purchase additional shares is exercised, each underwriter will become obligated, subject to certain conditions, to purchase about the same percentage of the additional shares of common stock as the number listed next to the underwriter’s name in the preceding table bears to the total number of shares of common stock listed next to the names of all underwriters in the preceding table.
The following table shows the per share and total public offering price, underwriting discounts and commissions, and proceeds before expenses to us. These amounts are shown assuming both no exercise and full exercise of the underwriters’ option to purchase up to an additional shares of common stock.
| Per Share |
Total | |||||||||||
| No Exercise | Full Exercise | |||||||||||
| Public offering price |
$ | $ | $ | |||||||||
| Underwriting discounts and commissions to be paid by us: |
||||||||||||
| Proceeds, before expenses, to us |
$ | $ | $ | |||||||||
-145-
Table of Contents
The estimated offering expenses payable by us, exclusive of the underwriting discounts and commissions, are approximately $ . We have agreed to reimburse the underwriters for expense relating to clearance of this offering with the Financial Industry Regulatory Authority up to $ .
The underwriters have informed us that they do not intend sales to discretionary accounts to exceed 5% of the total number of shares of common stock offered by them.
We intend to apply to list our common stock for quotation on the NYSE under the trading symbol “BLCT”.
We and all directors and officers and certain holders of our outstanding stock and stock options have agreed that, without the prior written consent of a majority of the representatives on behalf of the underwriters, we and they will not, during the period ending 180 days after the date of this prospectus (the “restricted period”):
| • | offer, pledge, sell, contract to sell, sell any option or contract to purchase, purchase any option or contract to sell, grant any option, right or warrant to purchase, lend or otherwise transfer or dispose of, directly or indirectly, any shares of common stock or any securities convertible into or exercisable or exchangeable for shares of common stock; |
| • | enter into any swap or other arrangement that transfers to another, in whole or in part, any of the economic consequences of ownership of the common stock; or |
| • | in our case, file any registration statement with the Securities and Exchange Commission relating to the offering of any shares of common stock or any securities convertible into or exercisable or exchangeable for common stock, |
whether any such transaction described above is to be settled by delivery of common stock or such other securities, in cash or otherwise.
The restrictions described in the immediately preceding paragraph do not apply to:
| • | transactions relating to shares of our common stock or other securities acquired in open market transactions after the completion of this offering, provided that no filing under Section 16(a) of the Exchange Act is required or is voluntarily made in connection with subsequent sales of shares of our common stock or other securities acquired in such open market transactions; |
| • | transfers of shares of our common stock or any security convertible into shares of our common stock as a bona fide gift; |
| • | transfers by a security holder of shares of our common stock or any security convertible into shares of our common stock by will or intestate succession or by operation of law or by court order, including pursuant to a domestic order or divorce settlement, provided that each donee, transferee or distributee must sign and deliver a lock-up agreement substantially in the form of the lock-up agreement signed by our directors and officers and certain holders of our outstanding stock and stock options; |
| • | transfers by a security holder of shares of our common stock or any security convertible into our common stock to any member of its immediate family or to any trust or estate planning vehicle for the direct or indirect benefit of the security holder or its immediate family; |
| • | distributions of shares of our common stock or any security convertible into our common stock to partners, members or stockholders of a security holder; |
| • | transfers by a security holder of shares of our common stock or any securities convertible into our common stock to a corporation, partnership, limited liability company, investment fund or other entity that controls, is controlled by or managed by or is under common control or common management with the director, officer, or other stockholder; |
-146-
Table of Contents
| • | charitable gifts by certain security holders; |
| • | transfers by a security holder of shares of our common stock or any security convertible into our common stock to us upon a vesting event of our securities or upon the exercise of options or other equity awards to purchase our securities, in each case on a “cashless” basis or to cover tax withholding obligations of the security holder in connection with such vesting or exercise, provided that no filing under Section 16(a) of the Exchange Act reporting a disposition of shares of common stock shall be required or shall be voluntarily made within 90 days after the date of this prospectus except in the case of transfers upon termination of employment or board service following death, disability or other than for cause if such equity awards would otherwise expire; |
| • | transfers by a security holder of shares of our common stock or any security convertible into our common stock to us, pursuant to agreements under which we have the option to repurchase or reacquire such shares; |
| • | transfers by a security holder of shares of our common stock or any security convertible into our common stock pursuant to a bona fide third party tender offer, merger, consolidation or other similar transaction made to all holders of our securities involving a change of control of our company; |
| • | the establishment of a trading plan pursuant to Rule 10b5-1 under the Exchange Act for the transfer of shares of our common stock, provided that such plan does not provide for the transfer of shares of our common stock during the restricted period and no public announcement or filing under the Exchange Act regarding the establishment of such plan shall be required of or voluntarily made by or on behalf of us or the security holder; and |
| • | transfers by certain security holders that have pledged shares of our common stock to third parties as collateral to secure obligations pursuant to lending or other arrangements existing on or before the date of this prospectus, provided that any such pledgee has also signed and delivered a lock-up agreement substantially in the form of the lock-up agreement signed by our directors and officers and certain holders of our outstanding stock and stock options. |
In the case of any transfer or distribution pursuant to the second, fourth, fifth and sixth bullet immediately above, (i) each donee, transferee or distributee must sign and deliver a lock-up agreement substantially in the form of the lock-up agreement signed by our directors and officers and certain holders of our outstanding stock and stock options and (ii) no filing under Section 16(a) of the Exchange Act, reporting a reduction in beneficial ownership of shares of our common stock, is required or shall be voluntarily made during the 180-day restricted period.
A majority of the representatives may, at their sole discretion, release the common stock and other securities subject to the lock-up agreements described above in whole or in part at any time.
In order to facilitate the offering of the common stock, the underwriters may engage in transactions that stabilize, maintain or otherwise affect the price of the common stock. Specifically, the underwriters may sell more shares than they are obligated to purchase under the underwriting agreement, creating a short position. A short sale is covered if the short position is no greater than the number of shares available for purchase by the underwriters under the option to purchase additional shares. The underwriters can close out a covered short sale by exercising the option to purchase additional shares or purchasing shares in the open market. In determining the source of shares to close out a covered short sale, the underwriters will consider, among other things, the open market price of shares compared to the price available under the option to purchase additional shares. The underwriters may also sell shares in excess of the option to purchase additional shares, creating a naked short position. The underwriters must close out any naked short position by purchasing shares in the open market. A naked short position is more likely to be created if the underwriters are concerned that there may be downward pressure on the price of the common stock in the open market after pricing that could adversely affect investors who purchase in this offering. As an additional means of facilitating this offering, the underwriters may bid for,
-147-
Table of Contents
and purchase, shares of common stock in the open market to stabilize the price of the common stock. These activities may raise or maintain the market price of the common stock above independent market levels or prevent or retard a decline in the market price of the common stock. The underwriters are not required to engage in these activities and may end any of these activities at any time.
We and the underwriters have agreed to indemnify each other against certain liabilities, including liabilities under the Securities Act.
A prospectus in electronic format may be made available on websites maintained by one or more underwriters participating in this offering. The representatives may agree to allocate a number of shares of common stock to underwriters for sale to their online brokerage account holders. Internet distributions will be allocated by the representatives to underwriters that may make Internet distributions on the same basis as other allocations.
The underwriters and their respective affiliates are full service financial institutions engaged in various activities, which may include securities trading, commercial and investment banking, financial advisory, investment management, commercial and investment research, principal investment, hedging, financing and brokerage activities. Certain of the underwriters and their respective affiliates have, from time to time, performed, and may in the future perform, various financial advisory and investment banking services for us, for which they received or will receive customary fees and expenses. For example, since 2015, Jefferies Finance LLC, an affiliate of Jefferies LLC, acted as lead arranger and bookrunner for financing transactions under the Company’s senior secured credit facilities. Jefferies LLC acted as initial purchaser in connection with the issuance of the Senior Notes.
In addition, in the ordinary course of their various business activities, the underwriters and their respective affiliates may make or hold a broad array of investments and actively trade debt and equity securities (or related derivative securities) and financial instruments (including bank loans) for their own account and for the accounts of their customers and may at any time hold long and short positions in such securities and instruments. Such investment and securities activities may involve our securities and instruments. The underwriters and their respective affiliates may also make investment recommendations or publish or express independent research views in respect of such securities or instruments and may at any time hold, or recommend to clients that they acquire, long or short positions in such securities and instruments.
Goldman Sachs Bank USA, an affiliate of Goldman, Sachs & Co., has entered into a term loan agreement with GSC-OZ Investments LLC, a Delaware limited liability company (“GSC-OZ Investments”). Mr. Clark, our Chief Executive Officer, is the manager GSC-OZ Investments. Under the loan agreement, Goldman Sachs Bank USA agreed to loan $8.1 million to GSC-OZ Investments, subject to certain conditions. Goldman Sachs Bank USA received customary fees and expense reimbursements in connection with this loan. As a regulated entity, Goldman Sachs Bank USA makes decisions regarding making and managing its loans independent of Goldman, Sachs & Co. This loan is secured under a security and pledge agreement by a pledge of all of the shares of our common stock currently owned by GSC-OZ Investments. We are not a party to the loan or the security and pledge agreement. The terms of this loan were negotiated directly between GSC-OZ Investments and Goldman Sachs Bank USA. Goldman Sachs Bank USA entered into a lock-up agreement with the underwriters as described above.
Pricing of the Offering
Prior to this offering, there has been no public market for our common stock. The initial public offering price was determined by negotiations between us and the representatives. Among the factors considered in determining the initial public offering price were our future prospects and those of our industry in general, our sales, earnings and certain other financial and operating information in recent periods, and the price-earnings ratios, price-sales ratios, market prices of securities, and certain financial and operating information of companies engaged in activities similar to ours.
-148-
Table of Contents
Other than in the United States, no action has been taken by us or the underwriters that would permit a public offering of the securities offered by this prospectus in any jurisdiction where action for that purpose is required. The securities offered by this prospectus may not be offered or sold, directly or indirectly, nor may this prospectus or any other offering material or advertisements in connection with the offer and sale of any such securities be distributed or published in any jurisdiction, except under circumstances that will result in compliance with the applicable rules and regulations of that jurisdiction. Persons into whose possession this prospectus comes are advised to inform themselves about and to observe any restrictions relating to the offering and the distribution of this prospectus. This prospectus does not constitute an offer to sell or a solicitation of an offer to buy any securities offered by this prospectus in any jurisdiction in which such an offer or a solicitation is unlawful.
Selling Restrictions
European Economic Area
In relation to each Member State of the European Economic Area which has implemented the Prospectus Directive (each, a “Relevant Member State”), an offer to the public of any shares of our common stock may not be made in that Relevant Member State, except that an offer to the public in that Relevant Member State of any shares of our common stock may be made at any time under the following exemptions under the Prospectus Directive, if they have been implemented in that Relevant Member State:
(a) to any legal entity which is a qualified investor as defined in the Prospectus Directive;
(b) to fewer than 100 or, if the Relevant Member State has implemented the relevant provision of the 2010 PD Amending Directive, 150, natural or legal persons (other than qualified investors as defined in the Prospectus Directive), as permitted under the Prospectus Directive, subject to obtaining the prior consent of the representatives for any such offer; or
(c) in any other circumstances falling within Article 3(2) of the Prospectus Directive, provided that no such offer of shares of our common stock shall result in a requirement for the publication by us or any underwriter of a prospectus pursuant to Article 3 of the Prospectus Directive.
For the purposes of this provision, the expression an “offer to the public” in relation to any shares of our common stock in any Relevant Member State means the communication in any form and by any means of sufficient information on the terms of the offer and any shares of our common stock to be offered so as to enable an investor to decide to purchase any shares of our common stock, as the same may be varied in that Member State by any measure implementing the Prospectus Directive in that Member State. The expression “Prospectus Directive” means Directive 2003/71/EC (and amendments thereto, including the 2010 PD Amending Directive, to the extent implemented in the Relevant Member State), and includes any relevant implementing measure in the Relevant Member State, and the expression “2010 PD Amending Directive” means Directive 2010/73/EU.
United Kingdom
Each underwriter has represented and agreed that:
(a) it has only communicated or caused to be communicated and will only communicate or cause to be communicated an invitation or inducement to engage in investment activity (within the meaning of Section 21 of the Financial Services and Markets Act 2000, as amended (the “FSMA”) received by it in connection with the issue or sale of the shares of our common stock in circumstances in which Section 21(1) of the FSMA does not apply to us; and
(b) it has complied and will comply with all applicable provisions of the FSMA with respect to anything done by it in relation to the shares of our common stock in, from or otherwise involving the United Kingdom.
-149-
Table of Contents
Hong Kong
Each underwriter has represented and agreed that:
(a) it has not offered or sold and will not offer or sell in Hong Kong, by means of any document, any of our common stock other than (i) to “professional investors” as defined in the Securities and Futures Ordinance (Cap. 571) of Hong Kong and any rules made under that Ordinance; or (ii) in other circumstances which do not result in the document being a “prospectus” as defined in the Companies Ordinance (Cap. 32) of Hong Kong or which do not constitute an offer to the public within the meaning of that Ordinance; and
(b) it has not issued or had in its possession for the purposes of issue, and will not issue or have in its possession for the purposes of issue, whether in Hong Kong or elsewhere, any advertisement, invitation or document relating to our common stock, which is directed at, or the contents of which are likely to be accessed or read by, the public of Hong Kong (except if permitted to do so under the securities laws of Hong Kong) other than with respect to shares of our common stock which are or are intended to be disposed of only to persons outside Hong Kong or only to “professional investors” as defined in the Securities and Futures Ordinance and any rules made under that Ordinance.
Singapore
This prospectus has not been registered as a prospectus with the Monetary Authority of Singapore. Accordingly, this prospectus and any other document or material in connection with the offer or sale, or invitation for subscription or purchase, of the shares may not be circulated or distributed, nor may the shares be offered or sold, or be made the subject of an invitation for subscription or purchase, whether directly or indirectly, to persons in Singapore other than (i) to an institutional investor under Section 274 of the Securities and Futures Act, Chapter 289 of Singapore (the “SFA”), (ii) to a relevant person pursuant to Section 275(1), or any person pursuant to Section 275(1A), and in accordance with the conditions specified in Section 275 of the SFA or (iii) otherwise pursuant to, and in accordance with the conditions of, any other applicable provision of the SFA, in each case subject to compliance with conditions set forth in the SFA.
Where the shares are subscribed or purchased under Section 275 of the SFA by a relevant person which is:
| • | a corporation (which is not an accredited investor (as defined in Section 4A of the SFA)) the sole business of which is to hold investments and the entire share capital of which is owned by one or more individuals, each of whom is an accredited investor; or |
| • | a trust (where the trustee is not an accredited investor) whose sole purpose is to hold investments and each beneficiary of the trust is an individual who is an accredited investor, |
shares, debentures and units of shares and debentures of that corporation or the beneficiaries’ rights and interest (howsoever described) in that trust shall not be transferred within six months after that corporation or that trust has acquired the shares pursuant to an offer made under Section 275 of the SFA except:
| • | to an institutional investor (for corporations, under Section 274 of the SFA) or to a relevant person defined in Section 275(2) of the SFA, or to any person pursuant to an offer that is made on terms that such shares, debentures and units of shares and debentures of that corporation or such rights and interest in that trust are acquired at a consideration of not less than S$200,000 (or its equivalent in a foreign currency) for each transaction, whether such amount is to be paid for in cash or by exchange of securities or other assets, and further for corporations, in accordance with the conditions specified in Section 275 of the SFA; |
| • | where no consideration is or will be given for the transfer; or |
| • | where the transfer is by operation of law. |
-150-
Table of Contents
Japan
No registration pursuant to Article 4, paragraph 1 of the Financial Instruments and Exchange Law of Japan (Law No. 25 of 1948, as amended) (the “FIEL”) has been made or will be made with respect to the solicitation of the application for the acquisition of the shares of common stock.
Accordingly, the shares of common stock have not been, directly or indirectly, offered or sold and will not be, directly or indirectly, offered or sold in Japan or to, or for the benefit of, any resident of Japan (which term as used herein means any person resident in Japan, including any corporation or other entity organized under the laws of Japan) or to others for re-offering or re-sale, directly or indirectly, in Japan or to, or for the benefit of, any resident of Japan except pursuant to an exemption from the registration requirements, and otherwise in compliance with, the FIEL and the other applicable laws and regulations of Japan.
Switzerland
The shares may not be publicly offered in Switzerland and will not be listed on the SIX Swiss Exchange (“SIX”) or on any other stock exchange or regulated trading facility in Switzerland. This document has been prepared without regard to the disclosure standards for issuance prospectuses under art. 652a or art. 1156 of the Swiss Code of Obligations or the disclosure standards for listing prospectuses under art. 27 ff. of the SIX Listing Rules or the listing rules of any other stock exchange or regulated trading facility in Switzerland. Neither this document nor any other offering or marketing material relating to the shares or the offering may be publicly distributed or otherwise made publicly available in Switzerland.
Neither this document nor any other offering or marketing material relating to the offering, the Company, or the shares have been or will be filed with or approved by any Swiss regulatory authority. In particular, this document will not be filed with, and the offer of shares will not be supervised by, the Swiss Financial Market Supervisory Authority FINMA (“FINMA”), and the offer of shares has not been and will not be authorized under the Swiss Federal Act on Collective Investment Schemes (“CISA”). The investor protection afforded to acquirers of interests in collective investment schemes under the CISA does not extend to acquirers of shares.
Dubai International Financial Centre
This prospectus relates to an Exempt Offer in accordance with the Offered Securities Rules of the Dubai Financial Services Authority (“DFSA”). This prospectus is intended for distribution only to persons of a type specified in the Offered Securities Rules of the DFSA. It must not be delivered to, or relied on by, any other person. The DFSA has no responsibility for reviewing or verifying any documents in connection with Exempt Offers. The DFSA has not approved this prospectus nor taken steps to verify the information set forth herein and has no responsibility for the prospectus. The shares to which this prospectus relates may be illiquid and/or subject to restrictions on their resale. Prospective purchasers of the shares offered should conduct their own due diligence on the shares. If you do not understand the contents of this prospectus you should consult an authorized financial advisor.
Australia
No placement document, prospectus, product disclosure statement or other disclosure document has been lodged with the Australian Securities and Investments Commission (“ASIC”), in relation to the offering. This prospectus does not constitute a prospectus, product disclosure statement or other disclosure document under the Corporations Act 2001 (the “Corporations Act”), and does not purport to include the information required for a prospectus, product disclosure statement or other disclosure document under the Corporations Act.
Any offer in Australia of the shares may only be made to persons (the “Exempt Investors”) who are “sophisticated investors” (within the meaning of section 708(8) of the Corporations Act), “professional investors” (within the meaning of section 708(11) of the Corporations Act) or otherwise pursuant to one or more exemptions contained in section 708 of the Corporations Act so that it is lawful to offer the shares without disclosure to investors under Chapter 6D of the Corporations Act.
-151-
Table of Contents
The shares applied for by Exempt Investors in Australia must not be offered for sale in Australia in the period of 12 months after the date of allotment under the offering, except in circumstances where disclosure to investors under Chapter 6D of the Corporations Act would not be required pursuant to an exemption under section 708 of the Corporations Act or otherwise or where the offer is pursuant to a disclosure document which complies with Chapter 6D of the Corporations Act. Any person acquiring shares must observe such Australian on-sale restrictions.
This prospectus contains general information only and does not take account of the investment objectives, financial situation or particular needs of any particular person. It does not contain any securities recommendations or financial product advice. Before making an investment decision, investors need to consider whether the information in this prospectus is appropriate to their needs, objectives and circumstances, and, if necessary, seek expert advice on those matters.
New Zealand
The shares offered hereby have not been offered or sold, and will not be offered or sold, directly or indirectly in New Zealand and no offering materials or advertisements have been or will be distributed in relation to any offer of shares in New Zealand, in each case other than:(a) to persons whose principal business is the investment of money or who, in the course of and for the purposes of their business, habitually invest money; or (b) to persons who in all the circumstances can properly be regarded as having been selected otherwise than as members of the public; or (c) to persons who are each required to pay a minimum subscription price of at least NZ$500,000 for the shares before the allotment of those shares (disregarding any amounts payable, or paid, out of money lent by the issuer or any associated person of the issuer); or (d) in other circumstances where there is no contravention of the Securities Act 1978 of New Zealand (or any statutory modification or re-enactment of, or statutory substitution for, the Securities Act 1978 of New Zealand).
Canada
The securities may be sold only to purchasers purchasing, or deemed to be purchasing, as principal that are accredited investors, as defined in National Instrument 45-106 Prospectus Exemptions or subsection 73.3(1) of the Securities Act (Ontario), and are permitted clients, as defined in National Instrument 31-103 Registration Requirements, Exemptions and Ongoing Registrant Obligations. Any resale of the securities must be made in accordance with an exemption from, or in a transaction not subject to, the prospectus requirements of applicable securities laws.
Securities legislation in certain provinces or territories of Canada may provide a purchaser with remedies for rescission or damages if this prospectus (including any amendment thereto) contains a misrepresentation, provided that the remedies for rescission or damages are exercised by the purchaser within the time limit prescribed by the securities legislation of the purchaser’s province or territory. The purchaser should refer to any applicable provisions of the securities legislation of the purchaser’s province or territory for particulars of these rights or consult with a legal advisor.
Pursuant to section 3A.3 (or, in the case of securities issued or guaranteed by the government of a non-Canadian jurisdiction, section 3A.4) of National Instrument 33-105 Underwriting Conflicts (“NI 33-105”), the underwriters are not required to comply with the disclosure requirements of NI 33-105 regarding underwriter conflicts of interest in connection with this offering.
Chile
The shares are not registered in the Securities Registry (Registro de Valores) or subject to the control of the Chilean Securities and Exchange Commission (Superintendencia de Valores y Seguros de Chile). This prospectus supplement and other offering materials relating to the offer of the shares do not constitute a public offer of, or an invitation to subscribe for or purchase, the shares in the Republic of Chile, other than to individually identified purchasers pursuant to a private offering within the meaning of Article 4 of the Chilean Securities Market Act (Ley de Mercado de Valores) (an offer that is not “addressed to the public at large or to a certain sector or specific group of the public”).
-152-
Table of Contents
The validity of the issuance of our common stock offered in this prospectus will be passed upon for us by Ropes & Gray LLP, San Francisco, CA. Certain legal matters in connection with this offering will be passed upon for the underwriters by Wilson Sonsini Goodrich & Rosati, Professional Corporation, Palo Alto, CA. Ropes & Gray LLP and some of its attorneys are limited partners of RGIP, LP, which is an investor in certain investment funds affiliated with the Sponsor and often a co-investor with such funds. Upon the consummation of the offering, RGIP, LP will directly or indirectly own less than 1% of the outstanding shares of our common stock.
The consolidated financial statements of Blue Coat, Inc. and its subsidiaries as of April 30, 2016 and for the period from May 23, 2015 through April 30, 2016 included in this prospectus have been so included in reliance on the report of PricewaterhouseCoopers LLP, an independent registered public accounting firm, given on the authority of said firm as experts in auditing and accounting.
The audited consolidated financial statements of Project Barbour Holdings Corporation and subsidiaries, Predecessor to Blue Coat, Inc., as of April 30, 2015 and for the two years then ended and for the 22-day period ended May 22, 2015, have been audited by RSM US LLP (“RSM”), an independent registered public accounting firm, as stated in their audit report thereon and included in this prospectus in reliance upon such report and upon the authority of such firm as experts in accounting and auditing.
The consolidated financial statements of Elastica, Inc. and its subsidiaries as of November 16, 2015 and December 31, 2014 and for the period January 1, 2015 through November 16, 2015 and the year ended December 31, 2014, included in this prospectus have been so included in reliance on the report of PricewaterhouseCoopers LLP, an independent registered public accounting firm, given on the authority of said firm as experts in auditing and accounting.
The consolidated financial statements of Perspecsys, Inc. as of and for the years ended December 31, 2014 and 2013, included in this prospectus have been audited by Deloitte LLP, independent auditors, as stated in their report appearing herein, and are included in reliance upon the report of such firm given upon their authority as experts in accounting and auditing.
RSM has informed us that RSM previously entered into a reseller agreement with a third-party entity (the “Third Party”) formerly under common control with us by virtue of Thoma Bravo, LLC’s ownership interest in us and the Third Party from the time of the Thoma Bravo Acquisition until the Bain Acquisition. Pursuant to the reseller agreement, RSM paid the Third Party less than $30,000 in each of 2012, 2013 and 2014, respectively, for products that were subsequently resold by RSM to third parties for an aggregate mark-up of less than $20,000 in each of 2012, 2013 and 2014, respectively. RSM terminated the reseller agreement effective November 1, 2015, and RSM has informed us that no product was purchased or resold by RSM in 2015. In November 2015, RSM communicated these matters to the audit committee of our board of directors, and informed us that the foregoing business relationship between RSM and the Third Party was not in accordance with the auditor independence standards of Regulation S-X and the Public Company Accounting Oversight Board (PCAOB).
Our audit committee and RSM have separately considered the impact that the reseller agreement between RSM and the Third Party may have had on RSM’s independence with respect to us. Both our audit committee and RSM have concluded that there has been no impairment of RSM’s ability to exercise objective and impartial judgment on issues encompassed within RSM’s audit of our financial statements. In making this determination, both our audit committee and RSM considered, among other things, that the amounts paid and received by RSM
-153-
Table of Contents
with respect to the products purchased and resold by RSM pursuant to the reseller agreement were immaterial to both RSM and the Third Party and had no financial impact on us.
CHANGE IN CERTIFYING ACCOUNTANTS
Effective August 25, 2015, we dismissed RSM as our independent auditor. The decision was approved by our audit committee upon completion of a competitive process to review the appointment of our independent registered public accounting firm for the fiscal year ending April 30, 2016.
During the fiscal years ended April 30, 2015 and 2014, and during the period thereafter prior to the date of the dismissal of RSM, there was no “disagreement” (as such term is defined in Item 304(a)(1)(iv) of Regulation S-K) with RSM on any matter of accounting principles or practices, financial statement disclosure or auditing scope or procedures, which disagreement, if not resolved to RSM’s satisfaction, would have caused RSM to make reference to the subject matter of such disagreement in connection with its reports on our financial statements for such years. RSM’s reports on our financial statements as of and for the fiscal years ended April 30, 2015 and 2014 did not contain any adverse opinion or disclaimer of opinion and were not qualified or modified as to uncertainty, audit scope or accounting principles.
On August 25, 2015, we appointed PricewaterhouseCoopers LLP (“PwC”), as our registered independent public accountant to audit our consolidated financial statements as of and for the fiscal year ending April 30, 2016. The decision was approved by our audit committee. During the fiscal years ended April 30, 2015 and 2014, and during the period thereafter prior to our engagement of PwC, neither we nor anyone acting on our behalf consulted with PwC regarding (a) (i) the application of accounting principles to a specific transaction or (ii) the type of audit opinion that might be rendered on our financial statements by PwC, in either case where PwC provided a written report or oral advice that was an important factor considered by us in reaching a decision as to any accounting, auditing or financial reporting issues, or (b) any other matter that was the subject of any disagreement or “reportable event” (as such term is described in Item 304(a)(1)(v) of Regulation S-K).
We delivered a copy of this disclosure to RSM and requested that they furnish us a letter addressed to the SEC stating whether they agree with the above statements. In their letter to the SEC dated January 29, 2016, attached as Exhibit 16.1 to the Registration Statement of which this prospectus is a part, RSM states that they agree with the statements above concerning their firm.
WHERE YOU CAN FIND MORE INFORMATION
We have filed with the SEC a registration statement on Form S-1 under the Securities Act with respect to the shares of common stock offered by this prospectus. This prospectus, which constitutes a part of the registration statement, does not contain all of the information set forth in the registration statement, some of which is contained in exhibits to the registration statement as permitted by the rules and regulations of the SEC. For further information with respect to us and our common stock, we refer you to the registration statement, including the exhibits filed as a part of the registration statement. Statements contained in this prospectus concerning the contents of any contract or any other document are not necessarily complete. If a contract or document has been filed as an exhibit to the registration statement, please see the copy of the contract or document that has been filed. A copy of the registration statement and the exhibits filed therewith may be inspected without charge at the public reference room maintained by the SEC, located at 100 F Street, N.E., Room 1580, Washington, D.C. 20549, and copies of all or any part of the registration statement may be obtained from that office at prescribed rates. You may obtain information on the operation of the SEC’s public reference room by calling the SEC at 1-800-SEC-0330. The SEC also maintains an Internet website that contains reports, proxy statements and other information about issuers that file electronically with the SEC. The address of that website is www.sec.gov.
-154-
Table of Contents
As a result of this offering, we will become subject to the information and reporting requirements of the Exchange Act and, in accordance with this law, will file periodic reports, proxy statements and other information with the SEC. These periodic reports, proxy statements and other information will be available for inspection and copying at the SEC’s public reference room and accessible through the SEC’s Internet website referenced above. We also maintain an Internet website at www.bluecoat.com. Upon completion of this offering, you may access these materials free of charge as soon as reasonably practicable after they are electronically filed with, or furnished to, the SEC. Information contained on, or that can be accessed through, our website does not constitute a part of this prospectus or the registration statement of which this prospectus forms a part, and is not incorporated by reference herein. We have included our website address in this prospectus solely for informational purposes and you should not consider any information contained on, or that can be accessed through, our website as part of this prospectus or in deciding whether to purchase shares of our common stock.
-155-
Table of Contents
BLUE COAT, INC.
INDEX TO CONSOLIDATED FINANCIAL STATEMENTS
| Page | ||||
| Blue Coat, Inc. |
||||
| F-2 | ||||
| F-3 | ||||
| F-4 | ||||
| F-5 | ||||
| F-6 | ||||
| F-7 | ||||
| F-8 | ||||
| F-9 | ||||
| Elastica, Inc. |
||||
| F-51 | ||||
| F-52 | ||||
| Consolidated Statements of Operations and Comprehensive Loss |
F-53 | |||
| Consolidated Statements of Convertible Preferred Stock and Stockholders’ Deficit |
F-54 | |||
| F-55 | ||||
| F-56 | ||||
| Unaudited Pro Forma Condensed Combined Financial Information—Blue Coat, Inc. and Elastica, Inc. |
||||
| Unaudited Pro Forma Condensed Combined Financial Information |
F-69 | |||
| F-71 | ||||
| Perspecsys, Inc. |
||||
| F-74 | ||||
| F-75 | ||||
| Consolidated Statements of Operations and Comprehensive Loss |
F-76 | |||
| F-77 | ||||
| F-78 | ||||
| F-79 | ||||
| Unaudited Pro Forma Condensed Combined Financial Information—Blue Coat, Inc. and Perspecsys, Inc. |
||||
| Unaudited Pro Forma Condensed Combined Statements of Operations |
F-100 | |||
| Notes to Unaudited Pro Forma Condensed Combined Financial Information |
F-101 | |||
| Other Financial Information: |
||||
| Schedule I - Condensed Financial Information of Blue Coat, Inc. |
F-102 | |||
F-1
Table of Contents
REPORT OF INDEPENDENT REGISTERED PUBLIC ACCOUNTING FIRM
To The Board of Directors and Stockholders of
Blue Coat, Inc.
In our opinion, the accompanying consolidated balance sheet and the related consolidated statements of operations, comprehensive loss, stockholders’ equity and cash flows present fairly, in all material respects, the financial position of Blue Coat, Inc. and its subsidiaries at April 30, 2016, and the results of their operations and their cash flows for the period from May 23, 2015 through April 30, 2016 in conformity with accounting principles generally accepted in the United States of America. In addition, in our opinion, the financial statement schedule in the accompanying index presents fairly, in all material respects, the information set forth therein when read in conjunction with the related consolidated financial statements. These financial statements and the financial statement schedule are the responsibility of the Company’s management. Our responsibility is to express an opinion on these financial statements and financial statement schedule based on our audit. We conducted our audit of these statements in accordance with the standards of the Public Company Accounting Oversight Board (United States). Those standards require that we plan and perform the audit to obtain reasonable assurance about whether the financial statements are free of material misstatement. An audit includes examining, on a test basis, evidence supporting the amounts and disclosures in the financial statements, assessing the accounting principles used and significant estimates made by management, and evaluating the overall financial statement presentation. We believe that our audit provides a reasonable basis for our opinion.
As discussed in Note 1 to the consolidated financial statements, the Company changed the manner in which it classifies deferred taxes in 2016.
/s/ PricewaterhouseCoopers LLP
San Francisco, California
June 2, 2016
F-2
Table of Contents
REPORT OF INDEPENDENT REGISTERED PUBLIC ACCOUNTING FIRM
To the Board of Directors and Stockholders
Blue Coat, Inc.
We have audited the accompanying consolidated balance sheet of Project Barbour Holdings Corporation and subsidiaries, Predecessor to Blue Coat, Inc. (the Company), as of April 30, 2015, and the related consolidated statements of operations, comprehensive loss, stockholders’ equity and cash flows for the two years then ended and for the 22-day period ended May 22, 2015. These financial statements are the responsibility of the Company’s management. Our responsibility is to express an opinion on these financial statements based on our audits.
We conducted our audits in accordance with the standards of the Public Company Accounting Oversight Board (United States). Those standards require that we plan and perform the audit to obtain reasonable assurance about whether the financial statements are free of material misstatement. The Company is not required to have, nor were we engaged to perform, an audit of its internal control over financial reporting. Our audits included consideration of internal control over financial reporting as a basis for designing audit procedures that are appropriate in the circumstances, but not for the purpose of expressing an opinion on the effectiveness of the Company’s internal control over financial reporting. Accordingly, we express no such opinion. An audit also includes examining, on a test basis, evidence supporting the amounts and disclosures in the financial statements, assessing the accounting principles used and significant estimates made by management, as well as evaluating the overall financial statement presentation. We believe that our audits provide a reasonable basis for our opinion.
In our opinion, the consolidated financial statements referred to above present fairly, in all material respects, the financial position of Project Barbour Holdings Corporation and subsidiaries as of April 30, 2015, and the results of their operations and their cash flows for the two years then ended and for the 22-day period ended May 22, 2015, in conformity with U.S. generally accepted accounting principles.
/s/ RSM US LLP
San Jose, California
January 29, 2016
F-3
Table of Contents
BLUE COAT, INC.
(In thousands, except share and per share data)
| Predecessor | Successor | |||||||||
| April 30, 2015 | April 30, 2016 | |||||||||
| ASSETS |
||||||||||
| Current Assets: |
||||||||||
| Cash and cash equivalents |
$ | 202,665 | $ | 136,563 | ||||||
| Accounts receivable, net |
154,488 | 166,472 | ||||||||
| Inventory |
26,323 | 25,421 | ||||||||
| Prepaid expenses and other current assets |
20,965 | 45,740 | ||||||||
| Deferred income tax assets |
9,363 | — | ||||||||
|
|
|
|
|
|||||||
| Total current assets |
413,804 | 374,196 | ||||||||
| Property and equipment, net |
35,819 | 55,028 | ||||||||
| Restricted cash |
3,664 | 4,223 | ||||||||
| Goodwill |
584,356 | 1,580,592 | ||||||||
| Identifiable acquisition-related intangible assets, net |
503,641 | 971,201 | ||||||||
| Other assets |
17,297 | 16,367 | ||||||||
|
|
|
|
|
|||||||
| Total assets |
$ | 1,558,581 | $ | 3,001,607 | ||||||
|
|
|
|
|
|||||||
| LIABILITIES AND STOCKHOLDERS’ EQUITY |
||||||||||
| Current Liabilities: |
||||||||||
| Accounts payable |
$ | 17,852 | $ | 35,945 | ||||||
| Accrued payroll and related benefits |
31,710 | 54,440 | ||||||||
| Deferred revenue |
246,334 | 249,215 | ||||||||
| Current portion of long-term debt |
7,500 | 13,750 | ||||||||
| Other current liabilities |
17,459 | 41,183 | ||||||||
|
|
|
|
|
|||||||
| Total current liabilities |
320,855 | 394,533 | ||||||||
| Deferred revenue, less current portion |
107,609 | 115,008 | ||||||||
| Deferred rent, less current portion |
740 | 9,683 | ||||||||
| Long-term income taxes payable |
18,277 | 16,530 | ||||||||
| Deferred income taxes |
26,845 | 63,805 | ||||||||
| Other noncurrent liabilities |
830 | 3,405 | ||||||||
| Long-term debt, less current portion, net of borrowing costs |
1,040,347 | 1,771,624 | ||||||||
|
|
|
|
|
|||||||
| Total liabilities |
1,515,503 | 2,374,588 | ||||||||
|
|
|
|
|
|||||||
| Commitments and Contingencies (Note 13) |
||||||||||
| Stockholders’ Equity: |
||||||||||
| Common stock: $0.001 par value; 150,000,000 shares authorized; zero and 91,172,391 shares issued and outstanding at April 30, 2015 and April 30, 2016, respectively |
— | 91 | ||||||||
| Class A common stock: $0.01 par value; 750,000 shares authorized; 336,865 and zero shares issued and outstanding at April 30, 2015 and April 30, 2016, respectively ($1,000 liquidation value per share with 9% cumulative dividends) |
3 | — | ||||||||
| Class B common stock: $0.01 par value; 125,000,000 shares authorized; 98,966,849 and zero shares issued and outstanding at April 30, 2015 and April 30, 2016, respectively |
990 | — | ||||||||
| Class C common stock: $0.01 par value; 125,000,000 shares authorized; 1,937,456, and zero shares issued and outstanding at April 30, 2015 and April 30, 2016, respectively |
19 | — | ||||||||
| Additional paid-in capital |
339,747 | 900,440 | ||||||||
| Accumulated other comprehensive loss |
— | (1,908 | ) | |||||||
| Accumulated deficit |
(297,681 | ) | (271,604 | ) | ||||||
|
|
|
|
|
|||||||
| Total stockholders’ equity |
43,078 | 627,019 | ||||||||
|
|
|
|
|
|||||||
| Total liabilities and stockholders’ equity |
$ | 1,558,581 | $ | 3,001,607 | ||||||
|
|
|
|
|
|||||||
See accompanying notes to consolidated financial statements.
F-4
Table of Contents
BLUE COAT, INC.
CONSOLIDATED STATEMENTS OF OPERATIONS
(In thousands, except per share data)
| Predecessor | Successor | |||||||||||||||||||
| Year Ended April 30, | Period from May 1 to May 22, 2015 |
Period from May 23, 2015 to April 30, 2016 |
||||||||||||||||||
| 2014 | 2015 | |||||||||||||||||||
| Net revenue: |
||||||||||||||||||||
| Product |
$ | 319,232 | $ | 274,373 | $ | 7,032 | $ | 306,787 | ||||||||||||
| Service and subscription |
287,240 | 356,910 | 22,446 | 262,072 | ||||||||||||||||
|
|
|
|
|
|
|
|
|
|||||||||||||
| Total net revenue |
606,472 | 631,283 | 29,478 | 568,859 | ||||||||||||||||
|
|
|
|
|
|
|
|
|
|||||||||||||
| Cost of net revenue: |
||||||||||||||||||||
| Product |
106,188 | 106,904 | 4,687 | 131,119 | ||||||||||||||||
| Service and subscription |
56,447 | 53,682 | 3,069 | 66,642 | ||||||||||||||||
|
|
|
|
|
|
|
|
|
|||||||||||||
| Total cost of net revenue |
162,635 | 160,586 | 7,756 | 197,761 | ||||||||||||||||
|
|
|
|
|
|
|
|
|
|||||||||||||
| Gross profit |
443,837 | 470,697 | 21,722 | 371,098 | ||||||||||||||||
|
|
|
|
|
|
|
|
|
|||||||||||||
| Operating expenses: |
||||||||||||||||||||
| Sales and marketing |
193,661 | 190,288 | 12,024 | 229,094 | ||||||||||||||||
| Research and development |
110,886 | 110,591 | 7,050 | 124,317 | ||||||||||||||||
| General and administrative |
69,266 | 68,131 | 21,649 | 126,520 | ||||||||||||||||
| Amortization of intangible assets |
37,814 | 33,111 | 1,738 | 121,019 | ||||||||||||||||
| Change in fair value of acquisition-related earn-out liability |
9,698 | — | — | (970 | ) | |||||||||||||||
| Restructuring and other charges |
3,020 | 1,130 | — | 2,857 | ||||||||||||||||
|
|
|
|
|
|
|
|
|
|||||||||||||
| Total operating expenses |
424,345 | 403,251 | 42,461 | 602,837 | ||||||||||||||||
|
|
|
|
|
|
|
|
|
|||||||||||||
| Operating income (loss) |
19,492 | 67,446 | (20,739 | ) | (231,739 | ) | ||||||||||||||
| Interest income |
44 | 38 | 1 | 143 | ||||||||||||||||
| Interest expense |
(63,015 | ) | (66,434 | ) | (3,986 | ) | (99,386 | ) | ||||||||||||
| Debt extinguishment and refinancing costs |
(11,100 | ) | — | — | (3,406 | ) | ||||||||||||||
| Other expense, net |
(1,973 | ) | (1,376 | ) | (349 | ) | (759 | ) | ||||||||||||
|
|
|
|
|
|
|
|
|
|||||||||||||
| Loss before income taxes |
(56,552 | ) | (326 | ) | (25,073 | ) | (335,147 | ) | ||||||||||||
| Income tax provision (benefit) |
(5,221 | ) | 15,104 | (7,596 | ) | (63,543 | ) | |||||||||||||
|
|
|
|
|
|
|
|
|
|||||||||||||
| Net loss |
(51,331 | ) | (15,430 | ) | (17,477 | ) | (271,604 | ) | ||||||||||||
| Cumulative dividends earned on Class A Common Stock |
(34,535 | ) | (32,838 | ) | (2,112 | ) | — | |||||||||||||
|
|
|
|
|
|
|
|
|
|||||||||||||
| Net loss attributable to common stockholders |
$ | (85,866 | ) | $ | (48,268 | ) | $ | (19,589 | ) | $ | (271,604 | ) | ||||||||
|
|
|
|
|
|
|
|
|
|||||||||||||
| Net loss per share attributable to common stockholders: |
||||||||||||||||||||
| Basic and diluted |
$ | (0.90 | ) | $ | (0.49 | ) | $ | (0.20 | ) | $ | (3.09 | ) | ||||||||
|
|
|
|
|
|
|
|
|
|||||||||||||
| Weighted-average shares used to compute net loss per share attributable to common stockholders: |
||||||||||||||||||||
| Basic and diluted |
95,082 | 97,927 | 98,376 | 87,823 | ||||||||||||||||
|
|
|
|
|
|
|
|
|
|||||||||||||
| Cash dividends declared per share |
$ | 0.89 | $ | — | $ | — | $ | — | ||||||||||||
|
|
|
|
|
|
|
|
|
|||||||||||||
See accompanying notes to consolidated financial statements.
F-5
Table of Contents
BLUE COAT, INC.
CONSOLIDATED STATEMENTS OF COMPREHENSIVE LOSS
(In thousands)
| Predecessor | Successor | |||||||||||||||||
| Year Ended April 30, | Period from May 1 to May 22, 2015 |
Period from May 23, 2015 to April 30, 2016 |
||||||||||||||||
| 2014 | 2015 | |||||||||||||||||
| Net loss |
$ | (51,331 | ) | $ | (15,430 | ) | $ | (17,477 | ) | $ | (271,604 | ) | ||||||
| Other comprehensive loss, before tax: |
||||||||||||||||||
| Unrealized loss on cash flow hedges |
— | — | — | (3,055 | ) | |||||||||||||
| Reclassification adjustments for gain (loss) included in net loss |
— | — | — | 1 | ||||||||||||||
|
|
|
|
|
|
|
|
|
|||||||||||
| Other comprehensive loss, before tax |
— | — | — | (3,054 | ) | |||||||||||||
| Tax effect related to other comprehensive loss items |
— | — | — | 1,146 | ||||||||||||||
|
|
|
|
|
|
|
|
|
|||||||||||
| Other comprehensive loss, net of tax |
— | — | — | (1,908 | ) | |||||||||||||
|
|
|
|
|
|
|
|
|
|||||||||||
| Comprehensive loss |
$ | (51,331 | ) | $ | (15,430 | ) | $ | (17,477 | ) | $ | (273,512 | ) | ||||||
|
|
|
|
|
|
|
|
|
|||||||||||
See accompanying notes to consolidated financial statements.
F-6
Table of Contents
BLUE COAT, INC.
CONSOLIDATED STATEMENTS OF STOCKHOLDERS’ EQUITY
(In thousands)
| Class A Common Stock |
Class B Common Stock |
Class C Common Stock |
Common Stock | Additional Paid-In Capital |
Accumulated Other Comprehensive Loss |
Accumulated Deficit |
Total | |||||||||||||||||||||||||||||||||||||||||
| Shares | Amount | Shares | Amount | Shares | Amount | Shares | Amount | |||||||||||||||||||||||||||||||||||||||||
| Balance as of April 30, 2013, Predecessor |
501 | $ | 5 | 99,531 | $ | 994 | 1,937 | $ | 19 | — | $ | — | $ | 497,946 | $ | — | $ | (75,652 | ) | $ | 423,312 | |||||||||||||||||||||||||||
| Net loss |
— | — | — | — | — | — | — | — | — | — | (51,331 | ) | (51,331 | ) | ||||||||||||||||||||||||||||||||||
| Dividends paid on Class A shares |
— | — | — | — | — | — | — | — | — | — | (65,233 | ) | (65,233 | ) | ||||||||||||||||||||||||||||||||||
| Dividends paid on Class B and C shares |
— | — | — | — | — | — | — | — | — | — | (90,000 | ) | (90,000 | ) | ||||||||||||||||||||||||||||||||||
| Stock-based compensation expense |
— | — | — | — | — | — | — | — | 3,239 | — | — | 3,239 | ||||||||||||||||||||||||||||||||||||
| Common shares issued in connection with equity co-investments |
2 | — | 9 | — | — | — | — | — | 1,772 | — | — | 1,772 | ||||||||||||||||||||||||||||||||||||
| Common shares issued in connection with stock grants |
— | — | 150 | 2 | — | — | — | — | 278 | — | — | 280 | ||||||||||||||||||||||||||||||||||||
| Common shares repurchased in connection with equity co-investments |
— | — | (66 | ) | (1 | ) | — | — | — | — | (371 | ) | — | — | (372 | ) | ||||||||||||||||||||||||||||||||
| Common shares repurchased in connection with stock grants |
— | — | (631 | ) | (5 | ) | — | — | — | — | (254 | ) | — | — | (259 | ) | ||||||||||||||||||||||||||||||||
| Redemption of Class A shares |
(165 | ) | (2 | ) | — | — | — | — | — | — | (165,069 | ) | — | — | (165,071 | ) | ||||||||||||||||||||||||||||||||
|
|
|
|
|
|
|
|
|
|
|
|
|
|
|
|
|
|
|
|
|
|
|
|
|
|||||||||||||||||||||||||
| Balance as of April 30, 2014, Predecessor |
338 | 3 | 98,993 | 990 | 1,937 | 19 | — | — | 337,541 | — | (282,216 | ) | 56,337 | |||||||||||||||||||||||||||||||||||
| Net loss |
— | — | — | — | — | — | — | — | — | — | (15,430 | ) | (15,430 | ) | ||||||||||||||||||||||||||||||||||
| Dividends paid on Class A shares |
— | — | — | — | — | — | — | — | — | — | (35 | ) | (35 | ) | ||||||||||||||||||||||||||||||||||
| Stock-based compensation expense |
— | — | — | — | — | — | — | — | 2,696 | — | — | 2,696 | ||||||||||||||||||||||||||||||||||||
| Exercise of stock options |
— | — | 25 | — | — | — | — | — | 46 | — | — | 46 | ||||||||||||||||||||||||||||||||||||
| Common shares repurchased in connection with equity co-investments |
(1 | ) | — | (37 | ) | — | — | — | — | — | (509 | ) | — | — | (509 | ) | ||||||||||||||||||||||||||||||||
| Common shares repurchased in connection with stock grants |
— | — | (14 | ) | — | — | — | — | — | (27 | ) | — | — | (27 | ) | |||||||||||||||||||||||||||||||||
|
|
|
|
|
|
|
|
|
|
|
|
|
|
|
|
|
|
|
|
|
|
|
|
|
|||||||||||||||||||||||||
| Balance as of April 30, 2015, Predecessor |
337 | 3 | 98,967 | 990 | 1,937 | 19 | — | — | 339,747 | — | (297,681 | ) | 43,078 | |||||||||||||||||||||||||||||||||||
| Net loss |
— | — | — | — | — | — | — | — | — | — | (17,477 | ) | (17,477 | ) | ||||||||||||||||||||||||||||||||||
| Stock-based compensation expense |
— | — | — | — | — | — | — | — | 3,651 | — | — | 3,651 | ||||||||||||||||||||||||||||||||||||
|
|
|
|
|
|
|
|
|
|
|
|
|
|
|
|
|
|
|
|
|
|
|
|
|
|||||||||||||||||||||||||
| Balance as of May 22, 2015, Predecessor |
337 | 3 | 98,967 | 990 | 1,937 | 19 | — | — | 343,398 | — | (315,158 | ) | 29,252 | |||||||||||||||||||||||||||||||||||
| Elimination of predecessor common stock, additional paid-in capital, and accumulated deficit |
(337 | ) | (3 | ) | (98,967 | ) | (990 | ) | (1,937 | ) | (19 | ) | — | — | (343,398 | ) | — | 315,158 | (29,252 | ) | ||||||||||||||||||||||||||||
| Net loss |
— | — | — | — | — | — | — | — | — | — | (271,604 | ) | (271,604 | ) | ||||||||||||||||||||||||||||||||||
| Common shares issued in connection with Bain Acquisition |
— | — | — | — | — | — | 84,075 | 84 | 840,666 | — | — | 840,750 | ||||||||||||||||||||||||||||||||||||
| Employee vested stock option rollover |
— | — | — | — | — | — | — | — | 1,173 | — | — | 1,173 | ||||||||||||||||||||||||||||||||||||
| Common shares issued in connection with equity co-investments, net of repurchases |
— | — | — | — | — | — | 4,597 | 5 | 48,026 | — | — | 48,031 | ||||||||||||||||||||||||||||||||||||
| Stock-based compensation expense |
— | — | — | — | — | — | — | — | 18,914 | — | — | 18,914 | ||||||||||||||||||||||||||||||||||||
| Accumulated other comprehensive loss |
— | — | — | — | — | — | — | — | — | (1,908 | ) | — | (1,908 | ) | ||||||||||||||||||||||||||||||||||
| Restricted stock awards granted |
— | — | — | — | — | — | 2,500 | 2 | (2 | ) | — | — | — | |||||||||||||||||||||||||||||||||||
| Equity effect of officer loan |
— | — | — | — | — | — | — | — | (8,337 | ) | — | — | (8,337 | ) | ||||||||||||||||||||||||||||||||||
|
|
|
|
|
|
|
|
|
|
|
|
|
|
|
|
|
|
|
|
|
|
|
|
|
|||||||||||||||||||||||||
| Balance as of April 30, 2016, Successor |
— | $ | — | — | $ | — | — | $ | — | 91,172 | $ | 91 | $ | 900,440 | $ | (1,908 | ) | $ | (271,604 | ) | $ | 627,019 | ||||||||||||||||||||||||||
|
|
|
|
|
|
|
|
|
|
|
|
|
|
|
|
|
|
|
|
|
|
|
|
|
|||||||||||||||||||||||||
See accompanying notes to consolidated financial statements.
F-7
Table of Contents
BLUE COAT, INC.
CONSOLIDATED STATEMENTS OF CASH FLOWS
(In thousands)
| Predecessor | Successor | |||||||||||||||||
| Year Ended April 30, | Period from May 1 to May 22, 2015 |
Period from May 23, 2015 to April 30, 2016 |
||||||||||||||||
| 2014 | 2015 | |||||||||||||||||
| Operating Activities: |
||||||||||||||||||
| Net loss |
$ | (51,331 | ) | $ | (15,430 | ) | $ | (17,477 | ) | $ | (271,604 | ) | ||||||
| Adjustments to reconcile net loss to net cash provided by operating activities: |
||||||||||||||||||
| Depreciation |
16,315 | 18,440 | 1,632 | 18,806 | ||||||||||||||
| Amortization of intangible assets and purchased technology |
80,436 | 77,406 | 4,313 | 161,013 | ||||||||||||||
| Accretion of debt borrowing costs |
4,256 | 4,502 | 265 | 8,038 | ||||||||||||||
| Debt extinguishment and refinancing costs |
11,100 | — | — | 3,406 | ||||||||||||||
| Stock-based compensation |
3,239 | 2,696 | 3,651 | 18,914 | ||||||||||||||
| Deferred income taxes |
2,001 | 6,602 | (8,285 | ) | (72,219 | ) | ||||||||||||
| Loss on disposition of property and equipment |
2 | — | — | 17 | ||||||||||||||
| Changes in operating assets and liabilities, net of acquisitions: |
||||||||||||||||||
| Accounts receivable, net |
(23,269 | ) | (41,395 | ) | 25,714 | (36,894 | ) | |||||||||||
| Inventory |
(13,342 | ) | 7,666 | (3,565 | ) | 33,315 | ||||||||||||
| Prepaid expenses and other assets |
(21,187 | ) | 6,026 | 1,741 | (29,988 | ) | ||||||||||||
| Accounts payable |
(4,259 | ) | (6,998 | ) | 1,589 | 15,858 | ||||||||||||
| Accrued expenses and other liabilities |
2,380 | (29,140 | ) | 5,172 | 36,549 | |||||||||||||
| Deferred revenue |
75,869 | 64,834 | (10,901 | ) | 245,789 | |||||||||||||
|
|
|
|
|
|
|
|
|
|||||||||||
| Net cash provided by operating activities |
82,210 | 95,209 | 3,849 | 131,000 | ||||||||||||||
|
|
|
|
|
|
|
|
|
|||||||||||
| Investing Activities: |
||||||||||||||||||
| Acquisitions, net of cash acquired |
(262,900 | ) | — | — | (2,609,402 | ) | ||||||||||||
| Change in restricted cash |
165 | (3,073 | ) | — | (24 | ) | ||||||||||||
| Purchase of license agreements |
(600 | ) | (5,250 | ) | — | (650 | ) | |||||||||||
| Purchases of property and equipment, and technology licenses |
(19,558 | ) | (16,976 | ) | (1,531 | ) | (37,111 | ) | ||||||||||
|
|
|
|
|
|
|
|
|
|||||||||||
| Net cash used in investing activities |
(282,893 | ) | (25,299 | ) | (1,531 | ) | (2,647,187 | ) | ||||||||||
|
|
|
|
|
|
|
|
|
|||||||||||
| Financing Activities: |
||||||||||||||||||
| Repayment of debt obligations |
(1,220,125 | ) | (7,500 | ) | — | (6,875 | ) | |||||||||||
| Proceeds from issuance of debt, net of issuance costs |
1,770,547 | — | — | 1,778,010 | ||||||||||||||
| Net proceeds from private equity investors |
— | — | — | 840,750 | ||||||||||||||
| Net proceeds from employee investors |
2,050 | 46 | — | 52,482 | ||||||||||||||
| Dividends paid to shareholders |
(155,233 | ) | (35 | ) | — | — | ||||||||||||
| Repurchases of common stock |
(165,701 | ) | (534 | ) | — | (3,280 | ) | |||||||||||
| Loan to officer |
— | — | — | (8,337 | ) | |||||||||||||
|
|
|
|
|
|
|
|
|
|||||||||||
| Net cash provided by (used in) financing activities |
231,538 | (8,023 | ) | — | 2,652,750 | |||||||||||||
|
|
|
|
|
|
|
|
|
|||||||||||
| Net increase in cash and cash equivalents |
30,855 | 61,887 | 2,318 | 136,563 | ||||||||||||||
| Cash and cash equivalents, beginning of period |
109,923 | 140,778 | 202,665 | — | ||||||||||||||
|
|
|
|
|
|
|
|
|
|||||||||||
| Cash and cash equivalents, end of period |
$ | 140,778 | $ | 202,665 | $ | 204,983 | $ | 136,563 | ||||||||||
|
|
|
|
|
|
|
|
|
|||||||||||
| Supplemental Disclosures of Cash Flow Information: |
||||||||||||||||||
| Cash paid for interest on debt |
$ | 58,255 | $ | 61,871 | $ | 268 | $ | 74,573 | ||||||||||
|
|
|
|
|
|
|
|
|
|||||||||||
| Cash paid for income taxes, net |
$ | 9,564 | $ | (311 | ) | $ | 277 | $ | 10,779 | |||||||||
|
|
|
|
|
|
|
|
|
|||||||||||
See accompanying notes to consolidated financial statements.
F-8
Table of Contents
NOTES TO CONSOLIDATED FINANCIAL STATEMENTS
Note 1. Description of Business and Summary of Significant Accounting Policies
Description of business
Blue Coat, Inc. (the “Company”) is a Delaware corporation and leading provider of advanced web security solutions for global enterprises and governments. The Company offers its products on-premise, in the cloud, or through a virtual appliance to best suit the needs of its customers. The Company’s solutions are delivered as appliances, perpetual software licenses, and support and subscription services. The Company has invested significantly in developing its cloud business, which now spans six continents. The Company’s hybrid deployment supports its customers any way they want to deploy the solution with the same level of service and scalability.
The Company markets and sells its products through a worldwide network of approximately 2,000 channel partners that collectively have a broad reach, ranging from strategic and large enterprises to small and mid-sized businesses. The Company employs a direct-touch sales force that focuses on large accounts and collaborates with channel partners to provide products and support. The Company’s sales are fulfilled almost entirely through its channel partner relationships, supported by its robust channel sales and marketing infrastructure.
Basis of Presentation and Consolidation
On May 22, 2015, the Company was acquired by funds controlled by Bain Capital Investors, LLC, a private equity investment firm, and its co-investors (the “Bain Acquisition”). The Bain Acquisition was consummated through a merger of Batman Merger Sub, Inc. with Project Barbour Holdings Corporation, at which point, Project Barbour Holdings Corporation (herein referred to as the “Predecessor”) changed its name to Blue Coat Holdings, Inc., continuing as the surviving corporation and a 100 percent-owned indirect subsidiary of Batman Holdings, Inc. (herein referred to as the “Successor”), which has since changed its name to Blue Coat, Inc.
The Company’s consolidated financial statements have been prepared in accordance with U.S. generally accepted accounting principles (“U.S. GAAP”). All intercompany balances and transactions have been eliminated. The Company records all acquisitions using the acquisition method of accounting and, accordingly, includes the acquired company’s results of operations in its consolidated results from the date of each acquisition.
As a result of the Bain Acquisition, the Company applied purchase accounting and a new basis of accounting beginning on the date of the acquisition. The Company was required by U.S. GAAP to record all assets and liabilities at fair value as of the effective date of the acquisition, which in some cases was different than their historical book values. The consolidated financial statements of the Predecessor include the accounts of Project Barbour Holdings Corporation and its wholly owned subsidiaries through May 22, 2015, the date on which it was acquired. The consolidated financial statements of the Successor include the accounts of Blue Coat, Inc. and its wholly owned subsidiaries from May 23, 2015 through April 30, 2016.
Use of Estimates
The preparation of consolidated financial statements and related disclosures in conformity with U.S. GAAP requires management to make estimates and assumptions that affect the reported amounts of assets and liabilities, and disclosure of contingent assets and liabilities, at the dates of the consolidated financial statements, and the reported amounts of net revenue and expenses during the reporting periods. Such management estimates include the best estimate of selling price for the Company’s products and services, commission expense, share-based compensation including the fair value of the Company’s common stock, valuation allowance for deferred tax assets, uncertainties in income taxes, litigation and settlement costs and other loss contingencies, warranty liabilities, and the purchase price allocation of acquired businesses. The Company bases estimates on historical
F-9
Table of Contents
experience and also on assumptions that the Company believes are reasonable. Actual results may differ from these estimates, and such differences could be material to the Company’s consolidated financial condition and results of operations.
Reclassifications
Certain prior period amounts in the consolidated financial statements have been reclassified to conform to current period presentation. These reclassifications had no impact on previously reported total assets, liabilities, stockholders’ equity, net revenue, cost of net revenue, results of operations or cash flows.
Foreign Currency Translation and Transactions
The functional currency of the Company’s foreign subsidiaries is the U.S. dollar. The Company translates all monetary assets and liabilities denominated in foreign currencies into U.S. dollars using the exchange rates in effect at the balance sheet dates and non-monetary assets and liabilities using historical exchange rates.
Foreign currency denominated revenue and expenses have been re-measured using the average exchange rates in effect during each period. Foreign currency re-measurement gains and losses have been included in other income (expense) and have not been significant for any periods presented.
Concentration and Other Risks
Financial instruments that potentially subject the Company to credit risk consist of money market accounts and trade receivables. The Company maintains demand deposit and money market accounts with financial institutions of high credit standing. Such deposits generally are in excess of insured limits. The Company invests only in high-quality, investment grade securities and limits investment exposure in any one issue. Such investments are classified as cash equivalents in the Company’s consolidated balance sheets at April 30, 2016 and 2015. The Company believes the financial risks associated with these financial instruments are not material, and the Company has not experienced material losses from investments in these instruments.
The Company does not require collateral for sales to customers. However, the Company performs ongoing credit evaluations of its customers’ financial condition and maintains an allowance for doubtful accounts.
Cash and Cash Equivalents, and Restricted Cash
The Company considers all highly liquid investments with insignificant interest rate risk and original maturities of three months or less to be cash equivalents.
As of April 30, 2015 and April 30, 2016 restricted cash comprised $3.7 million and $4.2 million, respectively, in cash and cash equivalents pledged as collateral for irrevocable letters of credit primarily related to the Company’s office leases.
As of April 30, 2016, these letters of credit currently expire at various dates through August 2016, and provide for automatic annual extensions for a period of one year on each successive expiration date, but no later than the respective lease expirations. The time deposits securing the renewable letters of credit are classified as long-term restricted cash and those that will expire within one year are classified as prepaid expenses and other current assets in the accompanying consolidated balance sheets.
Fair Value of Financial Instruments
The Company defines fair value as the price that would be received from selling an asset or paid to transfer a liability in an orderly transaction between market participants at the measurement date. When determining the
F-10
Table of Contents
fair value measurements for assets and liabilities that are required to be recorded at fair value, the Company considers the principal or most advantageous market in which to transact and the market-based risk. The Company applies fair value accounting for all financial assets and liabilities that are recognized or disclosed at fair value in the financial statements on a recurring basis. The carrying amounts reported in the consolidated financial statements approximate the fair value for cash and cash equivalents, accounts receivable, accounts payable, and accrued liabilities, due to their short-term nature. The carrying amount of the Company’s long term debt is stated at the carrying value as the stated interest rate approximates the market rate currently available to the Company.
Allowance for Doubtful Accounts
The Company records trade receivables when customer accounts are billed. The Company performs ongoing credit evaluations of its customers’ financial condition and records an allowance when collection of a receivable becomes doubtful. The Company analyzes accounts receivable and historical bad debts, customer geographic concentrations, customer solvency, current economic and geographic trends, and changes in customer payment terms and practices when evaluating the adequacy of the allowance, and records any required changes in the allowance account to general and administrative expenses. The Company writes off accounts receivable when they are deemed to be uncollectible. The Company’s allowance for doubtful accounts was not significant as of April 30, 2015 and April 30, 2016.
Supply Chain Liabilities and Valuation of Inventory
The Company outsources its manufacturing, product fulfillment and repair operations to contract manufacturers and third-party logistics providers, and a significant portion of the Company’s cost of net revenue is a result of these activities. The Company currently purchases several key parts and components used in the manufacture of its products from a limited number of suppliers. If those supply sources were to become unavailable, the Company’s cost or ability to produce certain products may be adversely affected. Generally, the Company has been able to obtain an adequate supply of such parts and components. The Company’s contract manufacturers procure components and manufacture products based on demand forecasts that the Company prepares. These forecasts are based on estimates of future product demand. The Company’s supply chain liability was $0.5 million and $0.3 million as of April 30, 2015 and April 30, 2016, respectively, and is included in other current liabilities in the Company’s consolidated balance sheets.
Inventory consists of raw materials and finished goods. Inventory is recorded at the lower of cost (using the first-in, first-out method) or market, after obsolescence and inventory in excess of anticipated future demand is considered. In assessing the ultimate recoverability of inventory for the purpose of valuing inventory at the lower of cost or market, the Company is required to make estimates regarding future customer demand, last-time buy decisions, the timing of new product introductions, economic trends and market conditions.
Property and Equipment
Property and equipment are stated at cost, subject to adjustments for impairment, less accumulated depreciation and amortization. Depreciation and amortization are provided on a straight-line basis over the following estimated useful lives:
| Type of Assets |
Estimated Useful Lives | |
| Software |
3 years | |
| Computer and office equipment |
3-5 years | |
| Furniture and fixtures |
5 years | |
| Leasehold improvements |
2-10 years (Shorter of facility life or remaining lease term) |
F-11
Table of Contents
Impairment of Long-Lived Assets
The Company evaluates long-lived assets, including identifiable, finite-lived intangible assets, for impairment whenever events or changes in circumstances indicate that the carrying amount of the assets may not be recoverable. Events or changes in circumstances that could result in an impairment review include, but are not limited to, significant underperformance relative to historical or projected future operating results, significant changes in the manner of use of the acquired assets or the strategy for the Company’s overall business, and any significant negative industry or economic trends. Impairment is recognized when the carrying amount of an asset exceeds its fair value.
Acquisitions, Goodwill and Identifiable Intangible Assets
The Company accounts for acquired businesses using the acquisition method of accounting, which requires that the assets acquired, liabilities assumed, contractual contingencies and contingent consideration be recorded at the date of acquisition at their respective fair values. Goodwill represents the purchase price over estimated fair value of net assets of businesses acquired in a business combination.
The fair value of identifiable intangible assets is based on significant judgments made by management. The Company typically engages third-party valuation appraisal firms to assist the Company in determining the fair values and useful lives of the assets acquired. Such valuations and useful life determinations require the Company to make significant estimates and assumptions. These estimates and assumptions are based on historical experience and information obtained from the management of the acquired companies, and also include, but are not limited to, future expected cash flows earned from the product-related technology and discount rates applied in determining the present value of those cash flows. Unanticipated events and circumstances may occur that could affect the accuracy or validity of such assumptions, estimates or actual results. Acquisition-related identifiable intangible assets are amortized over the estimated economic lives of the assets. For intangible assets determined to have indefinite useful lives, including trade names, in-process R&D and goodwill, the Company tests for impairment annually, or more frequently if events or circumstances indicate that assets might be impaired. The Company uses a variety of methodologies in conducting impairment assessments of indefinite-lived intangible assets, including, but not limited to, discounted cash flow models, which are based on the assumptions the Company believes hypothetical marketplace participants would use. For indefinite-lived intangible assets, other than goodwill, if the carrying amount exceeds the fair value, an impairment charge is recognized in an amount equal to that excess.
The Company’s policy is to perform goodwill impairment tests annually in the fiscal fourth quarter, and whenever events or changes in circumstances indicate that the carrying amount of goodwill may not be recoverable. The Company can opt to perform a qualitative assessment to test a reporting unit’s goodwill for impairment or the Company can directly perform the two step impairment test. Based on the Company’s qualitative assessment, if the Company determines that the fair value of a reporting unit is more likely than not (i.e., a likelihood of more than 50 percent) to be less than its carrying amount, the two step impairment test will be performed. In the first step, the Company compares the fair value of each reporting unit to its carrying value. If the fair value of the reporting unit exceeds the carrying value of the net assets assigned to that unit, goodwill is not considered impaired and the Company is not required to perform further testing. If the carrying value of the net assets assigned to the reporting unit exceeds the fair value of the reporting unit, the Company must perform the second step of the impairment test in order to determine the implied fair value of the reporting unit’s goodwill. In the second step of the impairment test, the Company would determine the fair value of the goodwill by comparing the implied fair value to the carrying value of the goodwill in the same manner as if the reporting unit were being acquired in a business combination. Specifically, the Company would allocate the fair value to all of its assets and liabilities, including any unrecognized intangibles, in a hypothetical analysis that would calculate the implied fair value of goodwill. If the implied fair value of goodwill is less than the recorded goodwill, an impairment charge would be recorded to earnings in the consolidated statements of operations. The process of evaluating the potential impairment of goodwill is highly subjective and requires the application of
F-12
Table of Contents
significant judgment. For purposes of the annual impairment test, the Company considers the estimated or appraised fair value of the Company’s privately held common equity compared with the carrying amount of the Company’s net assets on the date of the test, since the Company has only one reporting unit. The Company did not recognize any goodwill impairment charges for all periods presented.
Recoverability of finite lived intangible assets is measured by comparison of the carrying amount of the asset to the future undiscounted cash flows the asset is expected to generate. Recoverability of indefinite lived intangible assets is measured by comparison of the carrying amount of the asset to its fair value. If the asset is considered to be impaired, the amount of any impairment is measured as the difference between the carrying value and the fair value of the impaired asset. The Company did not recognize any intangible asset impairment charges for all periods presented.
Deferred Rent
Certain of the Company’s operating leases contain credits for tenant improvements, rent holidays, and rent escalation clauses. For these leases, the Company recognizes the related rent expense on a straight-line basis at the earlier of the first rent payment or the date of possession of the leased property. The difference between the amounts charged to expense and the rent paid is recorded as deferred lease incentives and amortized over the lease term.
Derivative Instruments and Hedging Activities
The Company’s derivative financial instruments are used to manage differences in the amount, timing, and duration of the Company’s known or expected cash payments related to the Company’s variable-rate borrowings. The Company’s objectives in using interest rate derivatives are to add stability to interest expense and to manage its exposure to interest rate movements. To accomplish this objective, the Company uses interest rate caps as part of its interest rate risk management strategy.
As required by Financial Accounting Standard Board’s (the “FASB”) Accounting Standards Codification (“ASC”) 815, Derivatives and Hedging, the Company records all derivatives on the balance sheet at fair value. The accounting for changes in the fair value of derivatives depends on the intended use of the derivative, whether the Company has elected to designate a derivative in a hedging relationship and apply hedge accounting and whether the hedging relationship has satisfied the criteria necessary to apply hedge accounting. Derivatives designated and qualifying as a hedge of the exposure to variability in expected future cash flows, or other types of forecasted transactions, such as the Company’s interest rate caps, are considered cash flow hedges. Hedge accounting generally provides for the matching of the timing of gain or loss recognition on the hedging instrument with the earnings effect of the hedged forecasted transactions in a cash flow hedge.
The fair value of the Company’s interest rate cap contracts is determined using the market standard methodology of discounting the future expected cash receipts that would occur if variable interest rates rise above the strike rate of the caps in conjunction with the cash payments related to financing the premium of the interest rate caps. The variable interest rates used in the calculation of projected receipts on the cap are based on an expectation of future interest rates derived from observable market interest rate curves and volatilities. The effective portion of changes in the fair value of derivatives designated and that qualify as cash flow hedges is recorded in accumulated other comprehensive income (loss) and is subsequently reclassified into earnings in the period that the hedged forecasted transaction affects earnings. The ineffective portion of the change in fair value of the derivatives is recognized directly in earnings. Refer to Note 5, Derivative Financial Instruments, for further discussion.
In accordance with the FASB’s fair value measurement guidance in Accounting Standards Update (“ASU”) 2011-04, the Company made an accounting policy election to measure the credit risk of its derivative financial instruments that are subject to master netting agreements on a net basis by counterparty portfolio.
F-13
Table of Contents
Research and Development
Costs related to research, design and development of the Company’s products are expensed as incurred. When significant, software development costs are capitalized after establishment of technological feasibility and marketability until product is available for general release to customers. Generally, the Company’s products are released soon after technological feasibility has been established. Costs subsequent to achieving technological feasibility were not material to the Company’s consolidated financial statements and all internally developed software costs were expensed as incurred during all periods presented.
Warranty Obligations
The Company maintains a warranty accrual for estimated future warranty obligations using anticipated future warranty costs based on the historical warranty rates. The Company generally provides a one-year warranty on hardware products.
Legal and Other Contingencies
The Company is currently involved in various claims and legal proceedings. The Company reviews the status of each significant matter and assesses its potential financial exposure on a quarterly basis. The Company records a charge equal to at least the minimum estimated liability for damages arising from litigation or other loss contingencies only when both of the following conditions are met: (i) information available prior to issuance of the Company’s consolidated financial statements indicates that it is probable that a liability had been incurred at the date of the consolidated financial statements, and (ii) the range of loss can be reasonably estimated. As additional information becomes available, the Company reassesses the potential liability related to pending loss contingencies and may revise its estimates. Such revisions in the estimates of the potential liabilities could have a material impact on the Company’s consolidated results of operations and financial position.
Revenue Recognition
The Company operates a multiple-tier channel distribution model that includes both distributors and value-added resellers. In most cases, the Company sells products to distributors, who in turn sell to value-added resellers and ultimately to end-users. In these cases, the Company generally ships products from fulfillment centers to value-added resellers, who provide configuration services for end-users. In some cases, the Company sells directly to value-added resellers, who in turn sell to end-users. In these cases, the Company generally ships products from fulfillment centers directly to end-users.
The Company recognizes revenue when persuasive evidence of an arrangement exists, delivery or performance has occurred, the sales price is fixed or determinable, and collection is probable. The majority of the Company’s products are hardware appliances containing software components that operate together to provide the essential functionality of the product and, therefore, these hardware appliances are considered to be non-software deliverables. The Company’s product revenue also includes add-on stand-alone software products, either on a perpetual or term basis, that operate on the Company’s hardware appliances but are not considered essential to their functionality as the hardware appliances can function without the add-on software products and are frequently sold without them. Customers take possession of the add-on software products and run them on their hardware appliances purchased from the Company. Revenue is recognized for these products in accordance with industry-specific software revenue recognition guidance. Additionally, the Company sells post-contract customer support and maintenance contracts, where unspecified software updates and upgrades are offered on a when-and-if-available basis.
The Company enters into multiple-element revenue arrangements in which a customer may purchase a combination of hardware, perpetual and subscription software licenses, hardware and software upgrades, hardware and software maintenance, and/or professional services. The revenue recognition guidance for multiple
F-14
Table of Contents
deliverable arrangements requires an entity to allocate arrangement consideration to each element based on a selling price hierarchy, where the selling price for an element is based on vendor-specific objective evidence (VSOE), if available; third-party evidence (TPE), if available, and VSOE is not available; or the best estimate of selling price (BESP), if neither VSOE or TPE is available. Under the guidance, the Company allocates the arrangement fee to each non-software element based upon the relative selling price of such element and, if software and software-related elements are also included in the arrangement, the Company allocates the arrangement fee to each of those software and software-related elements as a group based upon the Company’s BESP for those elements. When applying the relative selling price method, the Company determines the selling price for each element using VSOE of selling price, if it exists, or if not, TPE of selling price, if it exists. If neither VSOE nor TPE of selling price exists for an element, the Company uses the Company’s BESP for that element. After such allocation is made, the amount of the arrangement fee allocated to the software and software-related elements is accounted for under the industry-specific software revenue recognition guidance. The revenue allocated to each non-software element is recognized when the basic revenue recognition criteria are met for that element. The Company accounts for multiple-element arrangements that contain only software and software-related elements under the industry-specific software revenue recognition guidance.
The Company determines VSOE for each element based on historical stand-alone transactions. VSOE of fair value is based on the price charged when the element is sold separately. The Company analyzes the Company’s stand-alone hardware and software maintenance renewals by stratification of sales channel and service offering. The Company determines the VSOE of fair value for hardware and software maintenance by analyzing the Company’s stand-alone maintenance renewals and noting that a substantial majority of transactions fall within a narrow range for each stratum.
The Company typically is not able to determine TPE for the Company’s products, support and maintenance or professional services. TPE is determined based on competitor prices for similar elements when sold separately. Generally, the Company’s offerings contain a significant level of differentiation such that the comparable pricing of products with similar functionality cannot be obtained. Furthermore, the Company’s go-to-market strategy differs from that of its peers and unable to reliably determine what similar competitor products’ selling prices are on a stand-alone basis.
When the Company is unable to establish the selling price of an element using VSOE or TPE, the Company uses BESP in the Company’s allocation of arrangement consideration. The Company determines BESP for a product or service by considering multiple factors, including, but not limited to, historical pricing practices by geography, current market trends, customer class and distribution channel, and gross margin objectives, such that it can make an estimate of the price at which the Company would transact a sale if the product or service was sold on a stand-alone basis.
Service and subscription revenue, which primarily consists of sales of new and renewal hardware and software support contracts, software subscriptions, cloud subscriptions, and to a lesser extent professional services and training, is recognized ratably over the life of the contract, with the related expenses recognized as incurred. Support, software subscriptions and cloud subscriptions typically have a term of one to three years, with average terms of approximately two years. Unearned service and subscription revenue is included in deferred revenue. The standard terms and conditions for the Company’s service and subscription contracts do not provide for cancellation, termination or refund for any reason other than for cause, such as a party’s failure to comply with a material provision of such contract.
The Company recognizes revenue from the sale of third-party anti-virus software subscriptions, net of royalties paid, and classifies this revenue as service and subscription revenue in the Company’s consolidated statements of operations.
F-15
Table of Contents
Stock-Based Compensation
The Company issues equity awards to employees and non-employees, generally in the form of common stock options and restricted stock. The Company accounts for its equity awards in accordance with FASB’s ASC 718, Compensation—Stock Compensation, which requires all equity-based payments to employees to be recognized in the consolidated statements of operations based on their fair values. As there has been no public market for the Company’s common stock to date, the estimated fair value of common stock has been determined by the board of directors. The Company has periodically determined for financial reporting purposes the estimated fair value of its common stock at various dates using contemporaneous valuations performed in accordance with the guidance outlined in the American Institute of Certified Public Accountants Practice Aid, Valuation of Privately-Held Company Equity Securities Issued as Compensation, also known as the Practice Aid. The Company generally uses the income and market approaches prescribed in the Practice Aid, in particular the income approach’s discounted cash flow method, which was based on the Company’s projections and estimated discount rate and the guideline public company, guideline transactions and precedent transaction methodologies, based on inputs from comparable public companies’ equity valuations, comparable acquisition transactions and transactions in the Company’s own equity securities, to estimate the enterprise value of the company. The Company performed these contemporaneous valuations quarterly. The assumptions underlying these valuations represent management’s best estimates, which involve inherent uncertainties and the application of management judgment. As a result, if factors or expected outcomes change and we use significantly different assumptions or estimates, equity-based compensation could be materially different. Following the completion of this offering, the Company expects to use a market-based valuation to determine the grant date fair value of its common stock. Refer to Note 9, Stockholders’ Equity, for further discussion.
Income Taxes
The Company uses the liability method to account for income taxes. As part of the process of preparing the consolidated financial statements, the Company is required to estimate income taxes in each of the jurisdictions in which it operates. This process involves determining income tax expense and calculating the deferred income tax expense related to temporary differences resulting from the differing treatment of items for tax and accounting purposes, such as deferred revenue or deductibility of the amortization of certain intangible assets. These temporary differences result in deferred tax assets or liabilities, which are included within the consolidated balance sheets.
The Company records a valuation allowance to reduce certain deferred tax assets to an amount that the Company estimates is more likely than not to be realized. The Company considers estimated future taxable income and prudent tax planning strategies in determining the need for a valuation allowance. When the Company determines that it is more likely than not that some or all of the Company’s deferred tax assets will be realizable by either refundable income taxes or future taxable income, the valuation allowance will be reduced and the related tax impact will be recorded as a reduction to the tax provision in that period. Likewise, should the Company determine that the Company is not likely to realize all or part of deferred tax assets in the future, an increase to the valuation allowance would be recorded as an increase to the tax provision in the period such determination was made.
As a multinational corporation, the Company conducts business in many countries and is subject to taxation in many jurisdictions. The taxation of the business is subject to the application of multiple and conflicting tax laws and regulations, as well as multinational tax conventions. The effective tax rate is highly dependent upon the geographic distribution of worldwide earnings or losses, the tax regulations in each geographic region, the availability of tax credits and carryforwards, and the effectiveness of tax planning strategies. The application of tax laws and regulations is subject to legal and factual interpretation, judgment and uncertainty. Tax laws themselves are subject to change as a result of changes in fiscal policy, changes in legislation, and the evolution of regulations and court rulings. Consequently, tax authorities may impose tax assessments or judgments against the Company that could materially impact its tax liability and/or the effective income tax rate.
F-16
Table of Contents
The Company uses a two-step approach to recognizing and measuring uncertain tax positions. The first step is to evaluate the tax position for recognition by determining if the weight of available evidence indicates that it is more likely than not that the position will be sustained on audit, including resolution of related appeals or litigation processes, if any. The second step is to measure the tax benefit as the largest amount that is more likely than not to be realized upon settlement. The Company reviews uncertain tax benefits quarterly, and may adjust such uncertain tax benefits because of proposed assessments by tax authorities, changes in facts and circumstances, issuance of new regulations or new case law, previously unavailable information obtained during the course of an examination, negotiations with tax authorities of different countries concerning the Company’s transfer pricing, resolution with respect to individual audit issues/audit years, or the expiration of statutes of limitations. In addition, the Company’s tax contingency reserve includes certain amounts for potential tax assessments for pre-acquisition tax years of acquired companies, which, if recognized, will be recorded to the provision for income taxes.
Recent Accounting Pronouncements
In March 2016, the FASB issued ASU 2016-09, Compensation—Stock Compensation (Topic 718): Improvements to Employee Share-Based Payment Accounting, related to simplifications of employee share-based payment accounting. This ASU eliminates the APIC pool concept and requires that excess tax benefits and tax deficiencies be recorded in the income statement when awards are settled. The ASU also addresses simplifications related to statement of cash flows classification, accounting for forfeitures, and minimum statutory tax withholding requirements. The ASU is effective for fiscal years and interim periods within those annual periods beginning after December 15, 2016. The Company is currently evaluating the impact that the adoption of this standard will have on its consolidated financial statements and related disclosures.
In February 2016, the FASB issued ASU 2016-02, Leases (Topic 842), which requires lessees to record most leases on their balance sheets. Lessees initially recognize a lease liability (measured at the present value of the lease payments over the lease term) and a right-of-use (“ROU”) asset (measured at the lease liability amount, adjusted for lease prepayments, lease incentives received and the lessee’s initial direct costs). Lessees can make an accounting policy election to not recognize ROU assets and lease liabilities for leases with a lease term of 12 months or less as long as the leases do not include options to purchase the underlying assets that the lessee is reasonably certain to exercise. For lessors, the guidance modifies the classification criteria and the accounting for sales-type and direct financing leases. The ASU is effective for fiscal years and interim periods within those fiscal years beginning after December 15, 2018. Early adoption is permitted for all entities. The standard requires the use of a modified retrospective approach for leases that exist or are entered into after the beginning of the earliest comparative period in the financial statements. Full retrospective application is prohibited. The Company is beginning to evaluate the impact that the adoption of this standard will have on its consolidated financial statements and related disclosures.
In November 2015, the FASB issued ASU 2015-17, Income Taxes (Topic 740): Balance Sheet Classification of Deferred Taxes on the classification of deferred tax assets and liabilities. This ASU, as part of the FASB’s simplification initiative, requires all companies that present a classified balance sheet to present all deferred tax assets and liabilities as noncurrent regardless of the timing of the expected reversal of the related deferred tax asset or liability. This ASU is effective for annual reporting periods beginning after December 16, 2016, but early adoption is permitted. The Company elected to adopt the guidance in the third quarter of fiscal year 2016 on a prospective basis. As a result, the Company has presented all deferred tax assets and liabilities as noncurrent on its consolidated balance sheet as of April 30, 2016, but has not reclassified current deferred tax assets and liabilities on its consolidated balance sheet as of April 30, 2015. There was no impact on the Company’s results of operations as a result of the adoption of ASU 2015-17.
In September 2015, the FASB issued ASU No. 2015-16, Business Combinations (Topic 805): Simplifying the Accounting for Measurement-Period Adjustments, which eliminates the requirement for an acquirer in a business combination to account for measurement-period adjustments retrospectively. Under this ASU, acquirers
F-17
Table of Contents
must recognize measurement-period adjustments in the period in which they determine the amounts, including the effect on earnings of any amounts they would have recorded in previous periods if the accounting had been completed at the acquisition date. This guidance is effective for fiscal years beginning after December 15, 2016, with early adoption permitted. The Company is currently evaluating the impact that the adoption of this standard and does not expect the adoption to have a material effect on its consolidated financial statements.
In July 2015, the FASB issued ASU No. 2015-11 (Subtopic 330), Simplifying the Measurement of Inventory, which provides guidance to companies who account for inventory using either the first-in, first-out (“FIFO”) or average cost methods. The guidance states that companies should measure inventory at the lower of cost and net realizable value. Net realizable value is defined as the estimated selling prices in the ordinary course of business, less reasonably predictable costs of completion, disposal and transportation. This ASU is effective for fiscal years beginning after December 15, 2016. Early adoption is permitted. The Company is currently evaluating the effect of the adoption of the standard will have on its consolidated financial statements and related disclosures.
In May 2015, the FASB issued ASU 2015-08, Business Combinations (Topic 805): Pushdown Accounting—Amendments to SEC Paragraphs Pursuant to Staff Accounting Bulletin No. 115, which supersedes several paragraphs in ASC 805-50 in response to the November 2014 publication of Staff Accounting Bulletin (“SAB”) No. 115 by the SEC. The SEC issued SAB No. 115 in connection with the release of the FASB’s ASU No. 2014-17, Pushdown Accounting. The standard provides an acquired entity with an option to apply pushdown accounting in its separate financial statements upon occurrence of an event in which an acquirer obtains control of the acquired entity. The guidance is effective immediately and had no impact on the Company’s consolidated financial statements and related disclosures.
In April 2015, the FASB issued ASU 2015-03, Interest—Imputation of Interest (Subtopic 835-30): Simplifying the Presentation of Debt Issuance Costs. ASU 2015-03 will require an entity to present debt issuance costs in the balance sheet as a direct deduction from the carrying amount of the related debt liability rather than as an asset, consistent with the treatment of debt discounts. The amendment does not change the recognition and measurement guidance for debt issuance costs, and the amortization of debt issuance costs will continue to be reported as interest expense. ASU 2015-03 is effective for annual reporting periods beginning after December 15, 2016. Early adoption is permitted. The new guidance will be applied retrospectively to each prior period presented. The Company does not expect the adoption to have a material effect on its consolidated financial statements.
In August 2014, the FASB issued ASU No. 2014-15, Presentation of Financial Statements—Going Concern (Subtopic 205-40): Disclosure of Uncertainties about an Entity’s Ability to Continue as a Going Concern. ASU 2014-15 will explicitly require management to assess the entity’s ability to continue as a going concern at each annual and interim period. Related footnote disclosures will be required if conditions give rise to substantial doubt about an entity’s ability to continue as a going concern within one year after the report issuance date. If conditions do not give rise to substantial doubt, no disclosures will be required that are specific to going concern uncertainties. ASU 2014-15 is effective for reporting periods ending after December 15, 2016, and early adoption is permitted. The Company is currently evaluating the impact of the future adoption of this standard and does not expect the adoption to have a material effect on the Company’s consolidated financial statements.
In June 2014, the FASB issued ASU No. 2014-12, Compensation—Stock Compensation (Topic 718): Accounting for Share-Based Payments When the Terms of an Award Provide that a Performance Target Could be Achieved after the Requisite Service Period. ASU 2014-12 requires that a performance target that affects vesting and that could be achieved after the requisite service period be treated as a performance condition. A reporting entity should apply existing guidance in ASC Topic No. 718, “Compensation—Stock Compensation,” as it relates to awards with performance conditions that affect vesting to account for such awards. ASU 2014-12 is effective for annual periods and interim periods within those annual periods beginning after December 15, 2015. Early adoption is permitted. The Company is currently assessing the potential impact of this accounting standard.
F-18
Table of Contents
In May 2014, the FASB issued ASU 2014-09, Revenue from Contracts with Customers, which requires an entity to recognize the amount of revenue to which it expects to be entitled for the transfer of promised goods or services to customers. This ASU is based on the principle that revenue is recognized to depict the transfer of goods or services to customers in an amount that reflects the consideration to which the entity expects to be entitled in exchange for those goods or services. This ASU also requires additional disclosure about the nature, amount, timing and uncertainty of revenue and cash flows arising from customer contracts, including significant judgments and changes in judgments and assets recognized from costs incurred to obtain or fulfill a contract. In August 2015, the FASB issued ASU 2015-14 which deferred the effective date of the new revenue standard to annual periods beginning after December 15, 2018 for private companies and December 15, 2017 for public companies. In March 2016, the FASB issued ASU 2016-08, Revenue from Contracts with Customers: Principal versus Agent Considerations (Reporting Revenue Gross versus Net), which clarifies the guidance in the new revenue standard on assessing whether an entity is a principal or agent in a revenue transaction. This conclusion impacts whether an entity reports revenue on a gross or net basis. In April 2016, the FASB issued ASU 2016-10, Revenue from Contracts with Customers: Identifying Performance Obligations and Licensing, which clarifies the guidance in the new revenue standard regarding an entity’s identification of its performance obligations in a contract, as well as an entity’s evaluation of the nature of its promise to grant a license of intellectual property and whether or not that revenue is recognized over time or at a point in time. In May 2016, the FASB issued ASU 2016-12, Revenue from Contracts with Customers: Narrow-Scope Improvements and Practical Expedients, which amends the guidance in the new revenue standard on collectibility, non-cash consideration, presentation of sales tax, and transition. The amendments are intended to address implementation issues that were raised by stakeholders and provide additional practical expedients to reduce the cost and complexity of applying the new revenue standard. These pronouncements have the same effective date as the new revenue standard. The Company is currently evaluating the transition methods and the effect that these ASUs will have on its consolidated financial statements and related disclosures.
In July 2013, the FASB issued ASU 2013-11, Liabilities (Topic 405): Income Taxes (Topic 740): Presentation of an Unrecognized Tax Benefit When a Net Operating Loss Carryforward, a Similar Tax Loss, or a Tax Credit Carryforward Exists. ASU 2013-11 provides explicit guidance on the financial statement presentation of an unrecognized tax benefit when a net operating loss carryforward or a tax credit carryforward exists. Under this ASU, the Company’s unrecognized tax benefit, or a portion of an unrecognized tax benefit, should be presented in the financial statements as a reduction to a deferred tax asset for a net operating loss carryforward or a tax credit carryforward. The Company adopted ASU 2013-11 during the third quarter of fiscal 2016. The adoption of the ASU did not have a material effect on the Company’s consolidated financial statements.
Note 2. Business Combinations
Elastica Acquisition (Successor)
On November 16, 2015, the Company completed the acquisition of 100% of the voting equity interest in Elastica, Inc. (“Elastica”), a leader in the Cloud Access Security Broker (“CASB”) segment. The total purchase price was $239.2 million consisting of cash consideration. Results of operations for Elastica were included in the Company’s consolidated financial statements from the date of acquisition. For the period from May 23, 2015 to April 30, 2016, the Company incurred approximately $7.8 million of transaction expenses directly related to the acquisition and the related issuance of debt, which was included in general and administrative expenses in the Company’s statements of operations. Revenue and earnings subsequent to the acquisition date are not presented, as the business was fully integrated subsequent to the acquisition and therefore impracticable for the Company to quantify.
F-19
Table of Contents
The following table summarizes the preliminary allocation of the purchase price, based on the estimated acquisition date fair value of the assets acquired and liabilities assumed (in thousands):
| November 16, 2015 | ||||
| Fair value of net assets acquired: |
||||
| Cash and cash equivalents |
$ | 3,530 | ||
| Accounts receivable, net |
102 | |||
| Restricted cash |
535 | |||
| Property and equipment |
717 | |||
| Prepaid and other assets |
4,300 | |||
| Intangible assets |
54,450 | |||
| Goodwill |
179,004 | |||
|
|
|
|||
| Total assets acquired |
242,638 | |||
| Accounts payable and accruals |
(997 | ) | ||
| Deferred revenue |
(135 | ) | ||
| Other liabilities |
(2,338 | ) | ||
|
|
|
|||
| Total liabilities assumed |
(3,470 | ) | ||
|
|
|
|||
| Net assets acquired |
$ | 239,168 | ||
|
|
|
|||
Intangible assets acquired and their estimated useful lives are shown below:
| Intangible Type |
Fair Value (in thousands) |
Useful Life | ||||||
| Backlog |
$ | 100 | 0.5 years | |||||
| Trade names |
300 | 2 years | ||||||
| Customer relationships |
250 | 6 years | ||||||
| Developed technology |
53,800 | 6 years | ||||||
The intangible assets are being amortized on a straight-line basis, which reflects the pattern in which the economic benefits of the intangible assets are being utilized. The goodwill is primarily attributable to expected synergies resulting from the transaction. None of the goodwill is deductible for tax purposes.
Perspecsys Acquisition (Successor)
On July 30, 2015 the Company completed the acquisition of 100% of the voting equity interest in Perspecsys, Inc., a leader in enterprise cloud data protection solutions. The Company believes the acquisition will enable it to expand in the CASB segment. The purchase price of $45.5 million consists of a cash payment of $29.7 million, a guaranteed earn out of $15.0 million and an earn out of $10.0 million contingent upon achieving certain net revenue targets within the first year. The guaranteed earn out and contingent earn out had an acquisition date fair value of $14.8 million and $1.0 million, respectively. The contingent earn out was subsequently adjusted to zero and recognized through the consolidated statements of operations in the three months ended April 30, 2016, as the Company determined it was unlikely the net revenue targets would be met within the first year. For the period from May 23, 2015 to April 30, 2016, the Company incurred approximately $1.2 million of transaction expenses directly related to the acquisition, which was included in general and administrative expenses in the Company’s statements of operations. Revenue and earnings subsequent to the acquisition date are not presented, as the business was fully integrated subsequent to the acquisition and therefore impracticable for the Company to quantify.
F-20
Table of Contents
The following table summarizes the allocation of the purchase price, based on the estimated fair value of the assets acquired and liabilities assumed at the acquisition date (in thousands):
| July 30, 2015 | ||||
| Fair value of net assets acquired: |
||||
| Cash and cash equivalents |
$ | 739 | ||
| Accounts receivable, net |
598 | |||
| Property and equipment |
303 | |||
| Prepaid and other assets |
4,783 | |||
| Intangible assets |
11,080 | |||
| Goodwill |
32,839 | |||
|
|
|
|||
| Total assets acquired |
50,342 | |||
| Accounts payable and accruals |
(1,053 | ) | ||
| Deferred revenue |
(254 | ) | ||
| Notes payable |
(537 | ) | ||
| Other long-term liabilities |
(3,035 | ) | ||
|
|
|
|||
| Total liabilities assumed |
(4,879 | ) | ||
|
|
|
|||
| Net assets acquired |
$ | 45,463 | ||
|
|
|
|||
Intangible assets acquired and their estimated useful lives are shown below:
| Intangible Type |
Fair Value (in thousands) |
Useful Life | ||||||
| Trade names |
$ | 20 | 2 years | |||||
| Non-competition agreements |
360 | 2 years | ||||||
| Customer relationships |
1,400 | 10 years | ||||||
| Developed technology |
9,300 | 6 years | ||||||
Trade names, non-competition agreements, and developed technology are being amortized on a straight-line basis, which reflects the pattern in which the economic benefits of the intangible assets are being utilized. Customer relationships are being amortized based on the expected earnings pattern of those customer relationships, which reflects the pattern in which the economic benefits are being utilized. The goodwill is primarily attributable to expected synergies resulting from the transaction. None of the goodwill is deductible for tax purposes.
Bain Acquisition (Successor)
On May 22, 2015, the Company was acquired by funds controlled by Bain Capital Investors, LLC (“Bain Capital”), a private equity investment firm, and its co-investors. The purchase price of $2.5 billion was funded by $0.9 billion in cash and the issuance of $470 million of senior notes under an indenture and $1.15 billion of senior secured term loans under a senior secured credit facility. For the period from May 1, 2015 through May 22, 2015 and the period from May 23, 2015 through April 30, 2016, the Company incurred approximately $15.3 million and $10.7 million, respectively, of transaction expenses directly related to the merger, which was included in general and administrative expenses in the Company’s statements of operations.
In connection with the Bain Acquisition, the Company repaid its existing credit facilities in full and replaced them with new credit facilities and unsecured senior notes. The Company also incurred an aggregated $25.6 million of costs related to the extinguishment of its existing debts, including the write-off of unamortized borrowing costs and an early extinguishment fee paid to its lenders. These costs were contingent upon the closing of the Bain Acquisition and were not included in the Predecessor’s consolidated statements of operations for the period from May 1, 2015 through May 22, 2015. See Note 4, Debt, for further discussion of the new senior secured credit facilities and unsecured senior notes.
F-21
Table of Contents
The following table summarizes the allocation of the purchase price, based on the estimated fair value of the assets acquired and liabilities assumed at the acquisition date (in thousands):
| May 22, 2015 | ||||
| Fair value of net assets acquired: |
||||
| Cash and cash equivalents |
$ | 204,983 | ||
| Accounts receivable, net |
128,774 | |||
| Inventory |
58,736 | |||
| Property and equipment |
35,742 | |||
| Prepaid and other assets |
31,371 | |||
| Intangible assets |
1,066,600 | |||
| Goodwill |
1,367,112 | |||
|
|
|
|||
| Total assets acquired |
2,893,318 | |||
| Accounts payable and accruals |
(68,671 | ) | ||
| Deferred revenue |
(118,045 | ) | ||
| Deferred income taxes |
(142,872 | ) | ||
| Other long-term liabilities |
(14,503 | ) | ||
|
|
|
|||
| Total liabilities assumed |
(344,091 | ) | ||
|
|
|
|||
| Net assets acquired |
$ | 2,549,227 | ||
|
|
|
|||
Intangible assets acquired and estimated useful lives of the intangible assets are shown below:
| Intangible Type |
Fair Value (in thousands) |
Useful Life | ||||||
| Trade names, Blue Coat |
$ | 220,000 | Indefinite | |||||
| Customer relationships |
635,000 | 13 years | ||||||
| Product backlog |
1,600 | 3 months | ||||||
| Developed technology |
210,000 | 6 years | ||||||
Product backlog and developed technology are being amortized on a straight-line basis, which reflects the pattern in which the economic benefits of the intangible assets are being utilized. Customer relationships are being amortized based on the expected earnings pattern of those customer relationships, which reflects the pattern in which the economic benefits are being utilized. Goodwill is primarily attributable to expected synergies resulting from the transaction. None of the goodwill is deductible for tax purposes.
The following unaudited pro forma and pro forma combined financial information presents the Company’s results as though the Bain Acquisition had occurred on May 1, 2014 (in thousands).
| Year Ended April 30, | ||||||||
| 2015 | 2016 | |||||||
| Pro Forma | Pro Forma Combined |
|||||||
| Total net revenue |
$ | 507,379 | $ | 714,988 | ||||
| Net loss |
(182,187 | ) | (190,919 | ) | ||||
Norman Shark AS Business Acquisition (Predecessor)
On December 10, 2013, the Company entered into a purchase agreement to acquire 100% of the voting equity interest of Norman Shark AS (Norman Shark), a Norwegian privately owned limited liability company. Norman Shark was engaged in developing network security solutions and forensic malware tools and providing enterprise customers security solutions for building defense networks against cyber threats. The total cash purchase price was $25.8 million and was accounted for as a business combination using the acquisition method.
F-22
Table of Contents
The Company incurred costs of approximately $0.2 million related to the acquisition. These costs were included in general and administrative expenses in the Company’s consolidated statements of operations. Revenue and earnings subsequent to the acquisition date are not presented, as the business was fully integrated subsequent to the acquisition and therefore impracticable for the Company to quantify.
The purchase price was allocated based on estimated fair values as follows (in thousands):
| December 10, 2013 | ||||
| Fair value of net assets acquired: |
||||
| Cash |
$ | 2,076 | ||
| Accounts receivable |
1,455 | |||
| Goodwill |
13,929 | |||
| Identifiable intangible assets (other than goodwill) |
9,250 | |||
| Property, plant and equipment |
400 | |||
| Accounts payable |
(718 | ) | ||
| Accrued liabilities |
(1,155 | ) | ||
| Deferred revenue |
(300 | ) | ||
| Other assets |
863 | |||
|
|
|
|||
| Total purchase price |
$ | 25,800 | ||
|
|
|
|||
Intangible assets acquired and estimated useful lives were shown below:
| Intangible Type |
Fair Value (in thousands) |
Useful Life | ||||||
| Developed technology |
$ | 8,700 | 5 years | |||||
| Customer relationships |
550 | 2 years | ||||||
Developed technology were being amortized on a straight-line basis, which reflected the pattern in which the economic benefits of the intangible assets were being utilized. Customer relationships were being amortized based on the expected earnings pattern of those customer relationships, which reflected the pattern in which the economic benefits are being utilized. Goodwill was primarily attributable to expected synergies resulting from the transaction. None of the goodwill was deductible for tax purposes.
Solera Networks, Inc. Acquisition (Predecessor)
On May 31, 2013, the Company acquired 100% of the voting equity interest in Solera Networks, Inc. (“Solera”) for $222.7 million in cash to expand its security analytics and forensic capabilities. The Company entered into retention arrangements with certain key employees totaling $15.0 million, which was recognized as expense over a 36-month period. The Company incurred costs of approximately $0.4 million related to the acquisition. These costs were included in general and administrative expenses in the Company’s consolidated statements of operations. Revenue and earnings subsequent to the acquisition date are not presented, as the business was fully integrated subsequent to the acquisition and therefore impracticable for the Company to quantify.
F-23
Table of Contents
The acquisition was accounted for as a business combination using the acquisition method. The purchase price was allocated based on estimated fair values as follows (in thousands):
| May 31, 2013 | ||||
| Fair value of net assets acquired: |
||||
| Cash |
$ | 4,322 | ||
| Accounts receivable |
3,312 | |||
| Property, plant and equipment |
2,236 | |||
| Goodwill |
158,823 | |||
| Identifiable intangible assets (other than goodwill) |
59,450 | |||
| Deferred tax asset |
5,737 | |||
| Deferred revenue |
(1,093 | ) | ||
| Debt |
(7,000 | ) | ||
| Accrued liabilities |
(2,074 | ) | ||
| Accounts payable |
(877 | ) | ||
| Other assumed liabilities, net |
(132 | ) | ||
|
|
|
|||
| Total purchase price |
$ | 222,704 | ||
|
|
|
|||
Intangible assets acquired and estimated useful lives were shown below:
| Intangible Type |
Fair Value (in thousands) |
Useful Life | ||||||
| Developed technology |
$ | 47,300 | 6 years | |||||
| Customer relationships |
9,100 | 7 years | ||||||
| Trade names |
2,200 | 5 years | ||||||
| Product backlog |
850 | 3 months | ||||||
Developed technology, trade names and product backlog and were being amortized on a straight-line basis, which reflected the pattern in which the economic benefits of the intangible assets were being utilized. Customer relationships were being amortized based on the expected earnings pattern of those customer relationships, which reflected the pattern in which the economic benefits were being utilized. Goodwill was primarily attributable to expected synergies resulting from the transaction. None of the goodwill was deductible for tax purposes.
Netronome Systems, Inc. Appliances Business Acquisition (Predecessor)
On May 9, 2013, the Company acquired the Security Sockets Layer (“SSL”) appliances business from Netronome Systems, Inc. (Netronome) for an upfront payment of $25.0 million followed by an additional contingent cash earn-out of $25.0 million. The total purchase price was $32.9 million, which includes an estimated fair value of the contingent earn-out. In April 2014, the fair value of the earn-out was increased by $9.7 million to $18.1 million, with the adjustment recognized through the consolidated statement of operations. The Company incurred costs of approximately $65,000 related to the transaction. These costs were included in general and administrative expenses in the Company’s consolidated statements of operations. Revenue and earnings subsequent to the acquisition date are not presented, as the business was fully integrated subsequent to the acquisition and therefore impracticable for the Company to quantify.
The acquisition was accounted for as a business combination using the acquisition method. The purchase price was allocated based on estimated fair values as follows (in thousands):
| May 9, 2013 | ||||
| Fair value of net assets acquired: |
||||
| Inventory |
$ | 180 | ||
| Goodwill |
23,856 | |||
| Identifiable intangible assets (other than goodwill) |
9,010 | |||
| Deferred revenue |
(150 | ) | ||
|
|
|
|||
| Total purchase price |
$ | 32,896 | ||
|
|
|
|||
F-24
Table of Contents
Intangible assets acquired and estimated useful lives were shown below:
| Intangible Type |
Fair Value (in thousands) |
Useful Life | ||||||
| Developed technology |
$ | 7,100 | 5 years | |||||
| Supply agreements |
910 | 5 years | ||||||
| Customer relationships |
700 | 7 years | ||||||
| Non-competition agreements |
300 | 5 years | ||||||
Developed technology, non-competition agreements and supply agreements were being amortized on a straight-line basis, which reflected the pattern in which the economic benefits of the intangible assets were being utilized. Customer relationships were being amortized based on the expected earnings pattern of those customer relationships, which reflected the pattern in which the economic benefits were being utilized. Goodwill was primarily attributable to expected synergies resulting from the transaction and was deductible for tax purposes.
Note 3. Goodwill and Identifiable Acquisition-Related Intangible Assets
Goodwill
The total changes in carrying amount of the Company’s goodwill during the years ended April 30, 2015 and 2016 were as follows (in thousands):
| Predecessor | Successor | |||||||
| April 30, 2015 | April 30, 2016 | |||||||
| Beginning balance |
$ | 584,356 | $ | 584,356 | ||||
| Addition to goodwill related to acquisitions (predecessor) |
— | — | ||||||
| Elimination of predecessor goodwill |
— | (584,356 | ) | |||||
| Addition to goodwill related to acquisitions (successor) |
— | 1,580,592 | ||||||
|
|
|
|
|
|||||
| Ending balance |
$ | 584,356 | $ | 1,580,592 | ||||
|
|
|
|
|
|||||
During the period from May 23, 2015 through April 30, 2016, the Company made a measurement period adjustment to goodwill of $25.5 million primarily related to its updated tax integration plan for the Elastica acquisition.
Identifiable Acquisition-Related Intangible Assets
The Company’s identifiable acquisition-related intangible assets are as follows (in thousands):
| As of April 30, 2015 (Predecessor) | ||||||||||||||
| Amortization Period | Gross Amount | Accumulated Amortization |
Net Carrying Value | |||||||||||
| Developed technology and patents |
4-10 years | $ | 322,500 | $ | (108,627 | ) | $ | 213,873 | ||||||
| In-process research and development |
Indefinite | 13,900 | — | 13,900 | ||||||||||
| Customer relationships |
2-18 years | 281,950 | (114,430 | ) | 167,520 | |||||||||
| Product backlog |
3 months | 3,310 | (3,310 | ) | — | |||||||||
| Service backlog |
3 years | 2,500 | (2,500 | ) | — | |||||||||
| Favorable lease interest |
46 months | 1,517 | (1,284 | ) | 233 | |||||||||
| Non-compete agreements |
5 years | 300 | (118 | ) | 182 | |||||||||
| Supply agreement |
5 years | 910 | (359 | ) | 551 | |||||||||
| Trade names, other |
4-5 years | 4,900 | (2,518 | ) | 2,382 | |||||||||
| Trade names, Blue Coat |
Indefinite | 105,000 | — | 105,000 | ||||||||||
|
|
|
|
|
|
|
|||||||||
| $ | 736,787 | $ | (233,146 | ) | $ | 503,641 | ||||||||
|
|
|
|
|
|
|
|||||||||
F-25
Table of Contents
| As of April 30, 2016 (Successor) | ||||||||||||||
| Amortization Period | Gross Amount |
Accumulated Amortization |
Net Carrying Value | |||||||||||
| Developed technology and patents |
6 years | $ | 273,100 | $ | (38,202 | ) | $ | 234,898 | ||||||
| Customer relationships |
10-13 years | 636,650 | (120,816 | ) | 515,834 | |||||||||
| Product backlog |
3-5.5 months | 1,700 | (1,700 | ) | — | |||||||||
| Non-compete agreements |
2 years | 360 | (135 | ) | 225 | |||||||||
| Trade names, other |
2 years | 320 | (76 | ) | 244 | |||||||||
| Trade names, Blue Coat |
Indefinite | 220,000 | — | 220,000 | ||||||||||
|
|
|
|
|
|
|
|||||||||
| $ | 1,132,130 | $ | (160,929 | ) | $ | 971,201 | ||||||||
|
|
|
|
|
|
|
|||||||||
Amortization expense for the Company’s purchased intangible assets was as follows (in thousands):
| Predecessor | Successor | |||||||||||||||||
| Year Ended April 30, | Period from May 1 to May 22, 2015 |
Period from May 23, 2015 to April 30, 2016 |
||||||||||||||||
| 2014 | 2015 | |||||||||||||||||
| Included in cost of net revenue |
$ | 40,599 | $ | 41,322 | $ | 2,405 | $ | 39,910 | ||||||||||
| Included in operating expenses |
37,814 | 33,111 | 1,738 | 121,019 | ||||||||||||||
|
|
|
|
|
|
|
|
|
|||||||||||
| Total amortization |
$ | 78,413 | $ | 74,433 | $ | 4,143 | $ | 160,929 | ||||||||||
|
|
|
|
|
|
|
|
|
|||||||||||
As of April 30, 2016, the estimated amortization expense related to the Company’s identifiable acquisition-related intangible assets in future periods was as follows (in thousands):
| Year Ending April 30, |
Cost of Net Revenue |
Operating Expenses |
Total | |||||||||
| 2017 |
$ | 45,527 | $ | 111,167 | $ | 156,694 | ||||||
| 2018 |
45,519 | 92,127 | 137,646 | |||||||||
| 2019 |
45,517 | 69,263 | 114,780 | |||||||||
| 2020 |
45,517 | 55,690 | 101,207 | |||||||||
| 2021 |
45,517 | 44,746 | 90,263 | |||||||||
| 2022 and thereafter |
7,314 | 143,297 | 150,611 | |||||||||
|
|
|
|
|
|
|
|||||||
| Total amortization |
$ | 234,911 | $ | 516,290 | $ | 751,201 | ||||||
|
|
|
|
|
|
|
|||||||
Note 4. Debt
Prior to the Bain Acquisition, the Predecessor’s credit facilities included first and second lien term loans and a revolving credit facility with borrowing capacity of $40.0 million. As of April 30, 2015, principal amounts borrowed were $737.1 million with respect to the first lien term loan, $330.0 million with respect to the second lien term loan and none with respect to the revolving credit facility. The proceeds from these financings were primarily used in funding the Solera acquisition in May 2013 and payments of dividends and repurchases of Class A common stock in June 2013. At April 30, 2015, the first lien term loan bore interest at a rate of 4.0% per annum and the second lien term loan bore interest at a rate of 9.5% per annum, both payable quarterly. Borrowing costs that were capitalized were reflected on the consolidated balance sheets as a reduction to long-term debt liability and amortized to interest expense over the term of each debt facility using the effective interest method. As of April 30, 2015, the Company reported in its consolidated balance sheet a liability of $1,047.8 million (net of unamortized borrowing costs of $19.3 million) for outstanding term loan borrowings, of which $7.5 million was included in current liabilities and $1,040.3 million was reported as long-term debt.
F-26
Table of Contents
On May 22, 2015, in connection with the Bain Acquisition, the Company repaid the Predecessor’s existing credit facilities in full and replaced them with the following: (i) new credit facilities in an initial aggregate principal amount of $1.25 billion, comprised of (a) a senior secured term loan facility in an aggregate principal amount of $1.15 billion (the “Initial Term Loans”), which was borrowed on May 22, 2015 and which was increased on November 16, 2015 by $225.0 million aggregate principal amount of additional senior secured term loans (the “Incremental Term Loans” and, together with the Initial Term Loans, the “Senior Secured Term Loan Facility”) in connection with the Elastica acquisition and (b) a senior secured revolving facility in an aggregate principal committed amount of $100.0 million (the “Senior Secured Revolving Facility”, and, together with the Senior Secured Term Loan Facility, the “Senior Secured Credit Facilities”) and (ii) issued unsecured senior notes due 2023 in an aggregate principal amount of $470.0 million (the “Senior Notes”). The Senior Secured Term Loan Facility matures on May 20, 2022. The Senior Secured Revolving Facility matures on May 22, 2020. The Senior Notes mature on June 1, 2023. Blue Coat Holdings, Inc. obligations under the Senior Secured Credit Facilities are guaranteed on a senior secured basis by Batman Intermediate Holdings B, Inc. and each existing and subsequently acquired or organized direct or indirect wholly-owned material domestic restricted subsidiary of Blue Coat Holdings, Inc., subject to certain customary exceptions and limitations set forth in the documentation governing the Senior Secured Credit Facilities, and the Senior Notes are guaranteed on an unsecured basis by each wholly-owned domestic subsidiary of Blue Coat Holdings, Inc. that guarantees the Senior Secured Credit Facilities. See the sections entitled “Senior Secured Credit Facilities” and “Senior Notes” below for further information on the Senior Secured Credit Facilities and Senior Notes.
As of April 30, 2016, the Company’s total outstanding indebtedness under the new credit facilities was $1.79 billion (net of $52.8 million of debt issuance costs), of which $13.8 million was included in current liabilities and $1.77 billion was reported as long-term debt. Debt issuance costs are capitalized and included in the consolidated balance sheet as an asset or a direct deduction from the long-term debt liability and are amortized into interest expense over the term of the respective borrowings using the effective interest method. As of April 30, 2016, outstanding principal amounts were $1.37 billion with respect to the Senior Secured Term Loan Facility and $470.0 million with respect to the Senior Notes. The remaining contractual principal payments related to these borrowings in future fiscal years as of April 30, 2016 were as follows (in thousands):
| Year Ending April 30, |
||||
| 2017 |
$ | 13,750 | ||
| 2018 |
13,750 | |||
| 2019 |
13,750 | |||
| 2020 |
13,750 | |||
| 2021 |
13,750 | |||
| 2022 and thereafter |
1,769,375 | |||
|
|
|
|||
| Total principal payments |
$ | 1,838,125 | ||
|
|
|
|||
Senior Secured Credit Facilities
The principal amount of the Senior Secured Term Loan Facility amortizes in equal quarterly installments of $3.4 million, payable on the last business day of each April, July, October and January, commencing January 29, 2016, with the balance payable at maturity. The loans under the Senior Secured Credit Facilities bear interest, at the option of Blue Coat Holdings, Inc., at a rate per annum equal to (a) an adjusted LIBOR rate (with a floor of 1.00% per annum) plus an applicable margin of 3.50%, payable on the last day of the applicable interest period applicable thereto (and, in the case of an interest period in excess of three months, on each date occurring at three-month intervals after the first day of such interest period), or (b) the alternate base rate (with a floor of 2.00% per annum) plus an applicable margin of 2.50%, payable quarterly in arrears on the last business day of each April, July, October and January. The Initial Term Loans and the Incremental Term Loans under the Senior Secured Term Loan Facility were borrowed as LIBOR loans. The applicable margin for loans under the Senior Secured Revolving Facility is subject to two reductions of 0.25% below the applicable margin described above based upon the consolidated first lien net leverage ratio of Blue Coat Holdings, Inc. (which is the ratio of certain
F-27
Table of Contents
first lien secured debt, less cash and cash equivalents, of Blue Coat Holdings, Inc. and its restricted subsidiaries, to Consolidated EBITDA, as defined in the credit agreement governing the Senior Secured Credit Facilities) on a trailing four quarter basis on the last day of the most recent four fiscal quarter period for which financial statements were required to be delivered under the Senior Secured Credit Facilities.
Blue Coat Holdings, Inc. is required to comply with a maximum consolidated first lien net leverage ratio of 6.50 to 1.00 (decreasing to 5.00 to 1.00 on and after August 1, 2017) under the Senior Secured Revolving Facility. This financial covenant is tested quarterly on a trailing four quarter basis on the last day of the most recent four fiscal quarter period for which financial statements were required to be delivered under the Senior Secured Credit Facilities only if, as of the last day of the applicable fiscal quarter of Blue Coat Holdings, Inc. (commencing January 29, 2016), revolving loans under the Senior Secured Revolving Facility (including swingline loans) and certain letter of credit obligations (but excluding undrawn or cash collateralized letters of credit) are outstanding in an aggregate amount greater than 35% of the total commitments under the Senior Secured Revolving Facility at such time. If such outstanding amounts do not exceed 35% of the total commitments under the Senior Secured Revolving Facility at the end of the applicable any fiscal quarter, no financial covenant is applicable. As of April 30, 2016, the Company was in compliance with the financial covenants under the Senior Secured Credit Facilities.
At April 30, 2016, the interest rate on the outstanding balances under the Senior Secured Term Loan Facility was 4.5%. At April 30, 2016, Blue Coat Holdings, Inc. had a total of $100.0 million of availability for additional borrowings under the Senior Secured Revolving Facility, as Blue Coat Holdings, Inc. had no outstanding borrowings and no letters of credit outstanding which would reduce availability under the Senior Secured Revolving Facility on such date.
Senior Notes
The Senior Notes bear interest at a rate per annum of 8.375%, payable semi-annually. At any time and from time to time prior to June 1, 2018, Blue Coat Holdings, Inc. may, at its option, redeem up to 40% of the aggregate principal amount of the Senior Notes issued under the indenture governing the Senior Notes at a redemption price equal to 108.375% of the principal amount of the Senior Notes redeemed, plus accrued and unpaid interest to, but excluding, the redemption date, with the net cash proceeds received by, or contributed to, it or its restricted subsidiaries from certain equity offerings; provided that: (1) in each case the redemption takes place not later than 180 days after the closing of the related equity offering, and (2) not less than 50% of the original aggregate principal amount of the Senior Notes issued under the indenture governing the Senior Notes remains outstanding immediately thereafter, excluding Senior Notes held by the Company or any of its restricted subsidiaries.
At any time and from time to time on and after June 1, 2018, the Company may redeem the Senior Notes at its option, in whole or in part, based on the following agreed-upon schedule of redemption prices if redeemed during the 12-month period beginning on June 1 of each of the years indicated below:
| Year |
Percentage | |||
| 2018 |
104.188 | % | ||
| 2019 |
102.094 | % | ||
| 2020 |
101.047 | % | ||
| 2021 and thereafter |
100.000 | % | ||
Note 5. Derivative Financial Instruments
The Company is exposed to certain risk arising from both its business operations and economic conditions. The Company principally manages its exposures to a wide variety of business and operational risks through management of its core business activities. The Company manages economic risks, including interest rate, liquidity, and credit risk primarily by managing the amount, sources, and duration of its debt funding and the use of derivative financial instruments.
F-28
Table of Contents
The Company’s use of derivative financial instruments is limited to the utilization of interest rate caps to manage its exposure to interest rates. In September 2015, the Company entered into interest rate cap agreements to reduce exposure to future interest rate fluctuations and the resulting payments associated with its variable interest rate debts under the Senior Secured Term Loan Facility. The Company elected to finance the cap purchase premium over the respective term of the interest rate caps rather than pay the cash premium up-front. As of April 30, 2016 the undiscounted value of the remaining deferred premium payments was $4.2 million which will be paid from July 29, 2016 to September 30, 2020.
The following table presents the Company’s qualifying cash flow hedges outstanding as of April 30, 2016:
| Derivative Type |
Number of Instruments |
Notional Amount (in thousands) |
Variable Rate | Fixed Cap Rate | Effective Date | Maturity | ||||||||||||||||||
| Interest rate caps |
3 | $ | 500,000 | 3-Month LIBOR | 2% to 4% | October 31, 2015 | September 30, 2020 | |||||||||||||||||
For derivatives that are designated and qualify as cash flow hedges such as the Company’s interest rate caps, the effective portion of changes in the fair value of the derivatives is recorded in accumulated other comprehensive income (loss) (“AOCI”). The ineffective portion of the change in fair value of the derivatives is recognized directly in earnings. During the period from May 23, 2015 through April 30, 2016, the Company recorded $0.1 million of hedge ineffectiveness in earnings attributable to the financing of the premium rather than paying the premium up-front. Amounts reported in AOCI related to derivatives will be reclassified to interest expense as interest payments are made on the Company’s variable-rate debt. As of April 30, 2016, the Company expects that $0.3 million of derivative net loss recorded in AOCI will be reclassified to interest expense over the next twelve months.
The Company has agreements with each of its derivative counterparties that contain a provision where if the Company either defaults or is capable of being declared in default on any of its indebtedness, the Company could also be declared in default on its derivative obligations. If the Company had breached any of these provisions at April 30, 2016, it could have been required to settle its obligations under the agreements at their termination value of $3.2 million. As of April 30, 2016, the fair value of derivatives in a net liability position, which includes accrued interest and an adjustment for nonperformance risk, was $2.9 million. As of April 30, 2016, the Company has not posted any collateral related to these agreements. The table below presents the fair value of the Company’s derivative financial instruments as well as their classification on the consolidated balance sheet as of April 30, 2016 (the Company did not have derivative instruments in any Predecessor periods):
| Asset Derivatives as of April 30, 2016 | Liability Derivatives as of April 30, 2016 | |||||||||||||||
| Balance Sheet Location | Fair Value | Balance Sheet Location | Fair Value | |||||||||||||
| (In thousands) | ||||||||||||||||
| Derivatives designated as hedging instruments: |
||||||||||||||||
| Interest rate caps |
Other current assets | $ | — | Other current liabilities | $ | 406 | ||||||||||
| Interest rate caps |
Other noncurrent assets | — | Other noncurrent liabilities | 2,512 | ||||||||||||
|
|
|
|
|
|||||||||||||
| Total derivatives |
$ | — | $ | 2,918 | ||||||||||||
|
|
|
|
|
|||||||||||||
F-29
Table of Contents
The table below presents the effect of the Company’s derivative financial instruments on the consolidated statements of operations and the consolidated statements of comprehensive income (loss) (in thousands):
| Predecessor | Successor | |||||||||
| Period from May 1 to May 22, 2015 |
Period from May 23, 2015 to April 30, 2016 |
|||||||||
| (In thousands) | ||||||||||
| Derivatives designated as hedging instruments (Interest rate caps): |
||||||||||
| Effective portion: |
||||||||||
| Loss recognized in AOCI on derivative |
N/A | $ | (3,055 | ) | ||||||
| Gain (loss) reclassified from AOCI into interest expense |
N/A | 1 | ||||||||
| Ineffective portion and amount excluded from effectiveness testing: |
||||||||||
| Loss recognized in other expense |
N/A | (77 | ) | |||||||
Note 6. Fair Value of Financial Instruments
The Company determines the fair values of its financial instruments based on a fair value hierarchy. The classification of a financial asset or liability within the hierarchy is based upon the lowest level input that is significant to the fair value measurement. The fair value hierarchy prioritizes the inputs into three levels that may be used to measure fair value:
| Level 1 | — | Observable inputs, such as quoted prices in active markets, | ||
| Level 2 | — | Inputs other than the quoted prices in active markets that are observable directly, or | ||
| Level 3 | — | Unobservable inputs in which there is little or no market data, which requires the Company to develop its own assumptions. | ||
This hierarchy requires the Company to use observable market data, when available, and to minimize the use of unobservable inputs when determining fair value. On a recurring basis, the Company measures its financial assets at fair value. The fair value estimates are based on information available to management and are not necessarily indicative of the amounts the Company could ultimately realize.
The following table represents the Company’s financial instruments measured at fair value as of April 30, 2015 and 2016 (in thousands):
| Predecessor | Successor | |||||||||||||||||||||
| April 30, 2015 | April 30, 2016 | |||||||||||||||||||||
| Carrying Amount |
Fair Value | Carrying Amount |
Fair Value | Valuation Inputs |
||||||||||||||||||
| Assets: |
||||||||||||||||||||||
| Cash and cash equivalents |
$ | 202,665 | $ | 202,665 | $ | 136,563 | $ | 136,563 | Level 1 | |||||||||||||
| Liabilities: |
||||||||||||||||||||||
| Interest rate hedges |
$ | — | $ | — | $ | 2,918 | $ | 2,918 | Level 2 | |||||||||||||
The Company’s cash and cash equivalents are classified within Level 1 of the fair value hierarchy because they are valued using quoted prices in active markets.
The Company uses interest rate caps (options) to manage its interest rate risk. The fair values of interest rate caps are determined using the market standard methodology of discounting the future expected cash receipts that would occur if variable interest rates rise above the strike rate of the caps. This analysis reflects the contractual terms of the derivatives, including the period to maturity, and uses observable market-based inputs, including
F-30
Table of Contents
interest rate curves and implied volatilities. The variable interest rates used in the calculation of projected receipts on the cap, as well as the present value of the deferred premium payments, are based on an expectation of future interest rates derived from observable market interest rate curves and volatilities.
To comply with the provisions of ASC 820, the Company incorporates credit valuation adjustments to appropriately reflect both the Company’s own nonperformance risk and the respective counterparty’s nonperformance risk in the fair value measurements. In adjusting the fair value of the Company’s derivative contracts for the effect of nonperformance risk, the Company has considered the impact of netting and any applicable credit enhancements, such as collateral postings, thresholds, mutual puts and guarantees. In accordance with the FASB’s fair value measurement guidance in ASU 2011-04, the Company made an accounting policy election to measure the credit risk of its derivative financial instruments that are subject to master netting agreements on a net basis by counterparty portfolio.
Although the Company has determined that the majority of the inputs used to value the Company’s derivatives fall within Level 2 of the fair value hierarchy, the credit valuation adjustments associated with the Company’s derivatives utilize Level 3 inputs, such as estimates of current credit spreads to evaluate the likelihood of default by ourselves and the Company’s counterparties. The Company has determined that, based on the significance of the impact of the credit valuation adjustments made to the Company’s derivative contracts relative to the fair value of each individual contract, the credit valuation adjustments were not significant to the overall valuation. As a result, all of the Company’s derivatives held as of April 30, 2016 were classified as Level 2 in the fair value hierarchy. The Company did not hold any derivatives as of April 30, 2015.
Note 7. Restructuring and Other Charges
The following table summarizes the Company’s restructuring and other charges incurred (in thousands):
| Predecessor | Successor | |||||||||||||||||
| Year Ended April 30, |
Period from May 1 to May 22, 2015 |
Period from May 23, 2015 to April 30, 2016 |
||||||||||||||||
| 2014 | 2015 | |||||||||||||||||
| Severance and benefits |
$ | 3,020 | $ | 1,130 | $ | — | $ | 2,835 | ||||||||||
| Facilities and other |
— | — | — | 22 | ||||||||||||||
|
|
|
|
|
|
|
|
|
|||||||||||
| $ | 3,020 | $ | 1,130 | $ | — | $ | 2,857 | |||||||||||
|
|
|
|
|
|
|
|
|
|||||||||||
Fiscal 2014 Restructuring Activities
In connection with the Company’s Netronome, Solera and Norman Shark acquisitions, the Company initiated certain restructuring activities that resulted in reductions to the Company’s headcount. During fiscal 2014, the Company recognized expenses of approximately $3.0 million primarily related to severance costs.
Fiscal 2015 Restructuring Activities
In connection with the Company’s 2014 acquisitions and realignment, the Company initiated certain restructuring activities that resulted in reductions to the Company’s headcount. During fiscal 2015, the Company recognized expenses of approximately $1.1 million primarily related to severance costs.
Fiscal 2016 Restructuring Activities
In connection with the Bain and Perspecsys acquisitions and organization realignment, the Company initiated certain restructuring activities that resulted in reductions to headcount. The Company recognized expenses of approximately $2.9 million in the period from May 23, 2015 through April 30, 2016, primarily related to severance and contract termination costs.
F-31
Table of Contents
Accrued Restructuring and Other Charges Summary
The following table provides a summary of accrued restructuring activity for the years ended April 30, 2014, 2015 and 2016 (in thousands):
| Predecessor: |
||||
| Restructuring liabilities as of April 30, 2013 |
$ | 1,116 | ||
| Current period restructuring and other charges |
3,020 | |||
| Cash payments |
(3,545 | ) | ||
|
|
|
|||
| Restructuring liabilities as of April 30, 2014 |
591 | |||
| Current period restructuring and other charges |
1,130 | |||
| Cash payments |
(1,721 | ) | ||
|
|
|
|||
| Restructuring liabilities as of April 30, 2015 |
— | |||
| Successor: |
||||
| Current period restructuring and other charges |
2,857 | |||
| Cash payments |
(2,857 | ) | ||
|
|
|
|||
| Restructuring liabilities as of April 30, 2016 |
$ | — | ||
|
|
|
Note 8. Balance Sheet Components
Inventory
Inventory consisted of the following (in thousands):
| Predecessor | Successor | |||||||||
| April 30, 2015 | April 30, 2016 | |||||||||
| Raw materials |
$ | 3,794 | $ | 9,449 | ||||||
| Finished goods |
22,529 | 15,972 | ||||||||
|
|
|
|
|
|||||||
| $ | 26,323 | $ | 25,421 | |||||||
|
|
|
|
|
|||||||
Property and Equipment
Net property and equipment consisted of the following (in thousands):
| Predecessor | Successor | |||||||||
| April 30, 2015 | April 30, 2016 | |||||||||
| Computer and office equipment |
$ | 56,160 | $ | 36,741 | ||||||
| Software |
12,781 | 12,057 | ||||||||
| Furniture and fixtures |
1,913 | 2,415 | ||||||||
| Leasehold improvements |
10,126 | 18,661 | ||||||||
| Construction in progress |
1,934 | 4,735 | ||||||||
|
|
|
|
|
|||||||
| 82,914 | 74,609 | |||||||||
| Less: accumulated depreciation and amortization |
(47,095 | ) | (19,581 | ) | ||||||
|
|
|
|
|
|||||||
| $ | 35,819 | $ | 55,028 | |||||||
|
|
|
|
|
|||||||
F-32
Table of Contents
The following table summarizes the Company’s depreciation expense incurred (in thousands):
| Predecessor | Successor | |||||||||||||||||
| Year Ended April 30, | Period from May 1 to May 22, 2015 |
Period from May 23, 2015 to April 30, 2016 |
||||||||||||||||
| 2014 | 2015 | |||||||||||||||||
| Depreciation expense |
$ | 16,315 | $ | 18,440 | $ | 1,632 | $ | 18,806 | ||||||||||
Other Current Liabilities
Other current liabilities consisted of the following (in thousands):
| Predecessor | Successor | |||||||||
| April 30, 2015 | April 30, 2016 | |||||||||
| Accrued professional and consulting fees |
$ | 917 | $ | 3,567 | ||||||
| Accrued royalties |
3,246 | 2,551 | ||||||||
| Warranty obligations |
101 | 51 | ||||||||
| Supply chain liability |
500 | 268 | ||||||||
| Foreign taxes payable |
2,614 | 1,464 | ||||||||
| Accrued interest expense |
— | 16,573 | ||||||||
| Accrued acquisition costs |
— | 4,500 | ||||||||
| Other |
10,081 | 12,209 | ||||||||
|
|
|
|
|
|||||||
| $ | 17,459 | $ | 41,183 | |||||||
|
|
|
|
|
|||||||
Deferred Revenue
Deferred revenue consisted of the following (in thousands):
| Predecessor | Successor | |||||||||
| April 30, 2015 | April 30, 2016 | |||||||||
| Current: |
||||||||||
| Deferred product revenue |
$ | 5,640 | $ | 9,614 | ||||||
| Deferred service and subscription revenue |
240,694 | 239,601 | ||||||||
|
|
|
|
|
|||||||
| Total deferred revenue, current |
246,334 | 249,215 | ||||||||
|
|
|
|
|
|||||||
| Noncurrent: |
||||||||||
| Deferred product revenue |
2,186 | 6,759 | ||||||||
| Deferred service and subscription revenue |
105,423 | 108,249 | ||||||||
|
|
|
|
|
|||||||
| Total deferred revenue, noncurrent |
107,609 | 115,008 | ||||||||
|
|
|
|
|
|||||||
| Total deferred revenue |
$ | 353,943 | $ | 364,223 | ||||||
|
|
|
|
|
|||||||
Note 9. Stockholders’ Equity
Blue Coat, Inc. Common Stock (Successor)
On May 22, 2015, the Company and Project Barbour Holdings Corporation completed the Bain Acquisition in which Batman Holdings, Inc., acquired 100 percent of the capital stock of Project Barbour Holdings Corporation. Project Barbour Holdings Corporation changed its name to Blue Coat Holdings, Inc., continuing as the surviving corporation and a 100 percent owned indirect subsidiary of Batman Holdings, Inc, which has since changed its name to Blue Coat, Inc. In connection with the merger, Blue Coat, Inc. authorized 150,000,000 shares of common stock at $0.001 par value per share. Each share of common stock is entitled to one vote. As of
F-33
Table of Contents
April 30, 2016, the Company had 150,000,000 shares of common stock authorized and 91,172,391 issued and outstanding.
Class A Common Stock (Predecessor)
All Class A common stock was extinguished as part of the Bain Acquisition on May 22, 2015.
As of April 30, 2015, the Company had 750,000 shares of Class A common stock authorized and 336,865 shares issued and outstanding. Upon any liquidation, dissolution or winding up of the Company, each holder of Class A common stock was entitled to be paid, before any distribution or payment was made to any other equity security holders, an amount in cash equal to the aggregate liquidation value of all shares of Class A common stock held by such holder, plus all accrued and unpaid dividends. The Class A common stock would not participate in any remaining distributable amounts. The liquidation value per share of Class A common stock was $1,000 (Liquidation Value). If, upon any liquidation, dissolution or winding up of the Company, the amounts available for distribution to Class A common stockholders are less than the full amount Class A common stockholders are entitled to, then the entire amount of assets available to be distributed would be distributed pro rata among the Class A common stockholders based upon the aggregate Liquidation Value, plus all accrued and unpaid dividends, of the Class A common stock held by each holder. The Class A common stock accrued dividends on each share on a daily basis at the rate of 9 percent per annum on the sum of the Liquidation Value plus all accumulated and unpaid dividends. Dividends for Class A common stock would accrue whether or not they have been declared and whether or not the Company has the capacity to pay dividends. The Class A common stock was automatically convertible into Class B common stock, or Class C common stock in the case of certain regulated stockholders, on a one-for-one basis immediately prior to the effectiveness of a registration statement with respect to any initial public offering of shares by the Company. The Class A common stock was fully redeemable by the Company at the Company’s election and the Class A common stock had no voting rights except for voting rights pertaining to matters that adversely affect the powers, preferences or special rights of holders of the Class A common stock. Given the liquidation preferences and dividend terms noted above, the Company is treating Class A common stock as preferred stock for the purpose of calculating net income (loss) attributable to common stockholders and net income (loss) per share attributable to common stockholders.
On June 28, 2013, the Company paid a dividend to Class A common stockholders totaling $65.2 million and repurchased 165,071 shares of Class A common stock for $165.1 million using proceeds obtained from its credit facilities. As of April 30, 2015, the aggregate liquidation value of the Class A common stock was $336.9 million. The aggregate accumulated and unpaid Class A common stock dividend as of April 30, 2015 was $60.7 million.
Class B Common Stock (Predecessor)
All Class B common stock was extinguished as part of the Bain Acquisition on May 22, 2015.
As of April 30, 2015, the Company had 125,000,000 shares of Class B common stock authorized and 98,966,849 shares issued and outstanding. Each holder of Class B common stock was entitled to one vote per share on all matters. Class B common stockholders were entitled to receive dividends, if and when declared by the Company’s Board of Directors and subject to the preferences of the Class A shares. In the event of a liquidation, dissolution or winding up of the Company, and subject to the preferences of the Class A common stock, the holders of Class B common stock and Class C common stock were entitled to receive, ratably, on a per-share basis, all of the remaining assets of the Company available for distribution to stockholders.
On June 28, 2013, the Company paid a dividend totaling $88.3 million, or $0.89 per share, to Class B common stockholders using proceeds obtained from its credit facilities.
F-34
Table of Contents
Class C Common Stock (Predecessor)
All Class C common stock was extinguished as part of the Bain Acquisition on May 22, 2015.
As of April 30, 2015, the Company had 125,000,000 shares of Class C common stock authorized and 1,937,456 shares issued and outstanding. Class C common stock had no voting rights except for voting rights pertaining to matters that adversely affect the powers, preferences or special rights of holders of the Class C common stock. Class C common stockholders were entitled to receive dividends, if and when declared by the Company’s Board of Directors and subject to the preferences of the Class A shares. In the event of a liquidation, dissolution or winding up of the Company, and subject to the preferences of the Class A common stock, the holders of Class B common stock and Class C common stock were entitled to receive, ratably, on a per-share basis, all of the remaining assets of the Company available for distribution to stockholders. Subject to certain limitations, shares of Class C common stock were fully convertible into shares of Class B common stock on a one-for-one basis.
On June 28 2013, the Company paid a dividend totaling $1.7 million, or $0.89 per share, to Class C common stockholders using proceeds obtained from its credit facilities.
2015 Equity Incentive Plan (Successor)
In May 2015, the Board of Directors adopted the Batman Holdings, Inc. 2015 Equity Incentive Plan (the “2015 Plan”). The 2015 Plan provides for the granting of stock options, stock appreciation rights, restricted stock, unrestricted stock, stock units, and performance awards, to provide incentives for certain employees, directors, consultants and advisers to the Company. Upon adoption of the 2015 Plan, the Company reserved a maximum of 14,375,000 shares of common stock for issuance, excluding 158,801 shares of common stock issuable upon exercise of stock options that were rolled over in connection with the Bain Acquisition. In January 2016, the Company amended the 2015 Plan to reserve a maximum of 16,817,000 shares of common stock for issuance, excluding 158,801 shares of common stock issuable upon exercise of stock options that were rolled over in connection with the Bain Acquisition.
2012 Securities Purchase Plan (Predecessor)
On May 22, 2015, in connection with the Bain Acquisition, all awards under the 2012 Securities Purchase Plan were repurchased or cancelled. There are no remaining awards authorized or outstanding.
On April 17, 2012, the Board of Directors adopted a stock ownership plan (the “2012 Securities Purchase Plan”) to provide incentives for certain employees, directors, consultants and advisers to the Company. The 2012 Securities Purchase Plan provided for the sale or grant of Class A common stock and/or Class B common stock to plan participants and also allowed for the granting of stock options. Pursuant to the plan, certain key employees and directors of the Company purchased shares of Class A common stock and Class B common stock as a co-investment and on substantially the same terms as those received by the financial sponsor and co-investors. Additionally, pursuant to the plan, certain employees purchased shares of Class B common stock at a stated purchase price (the “Carry Grants”). The Carry Grants vest over a four-year period from the initial vesting date. The first vesting amount for employees generally occurs one year following date of grant, whereupon 25 percent of the granted shares become vested. The remaining nonvested portion will vest monthly thereafter over the remaining vesting term. All of the Carry Grants purchased by non-employee directors of the Company vest over four years based on continuous service as a director. All shares purchased under the Securities Purchase Plan are subject to repurchase by the Company upon employment or service termination at its discretion. The maximum number of shares of common stock that were authorized for sale or grant under the Securities Purchase Plan during any 12-month period was the greater of (1) $1.0 million fair value, (2) 15 percent of the net assets of the Company, or (3) 15 percent of the outstanding amount of each share of Class A common stock and Class B common stock. The Company’s Board of Directors had allocated a total pool of 10,000,000 shares of Class B common stock to be purchased under the plan.
F-35
Table of Contents
Carry Grants
A summary of Carry Grant activity, based on grant date, is as follows (in thousands, except per share amounts):
| Shares | Weighted Average Grant Date Fair Value Per Share |
|||||||
| Predecessor: |
||||||||
| Carry Grants nonvested, April 30, 2013 |
7,145 | $ | 1.45 | |||||
| Granted and nonvested |
150 | $ | 2.59 | |||||
| Vested |
(2,204 | ) | $ | 1.44 | ||||
| Repurchased |
(631 | ) | $ | 1.38 | ||||
|
|
|
|||||||
| Carry Grants nonvested, April 30, 2014 |
4,460 | $ | 1.50 | |||||
| Granted and nonvested |
— | |||||||
| Vested |
(1,781 | ) | $ | 1.47 | ||||
| Repurchased |
(14 | ) | $ | 1.36 | ||||
|
|
|
|||||||
| Carry Grants nonvested, April 30, 2015 |
2,665 | $ | 1.51 | |||||
| Granted and nonvested |
— | |||||||
| Vested |
(2,247 | ) | $ | 1.43 | ||||
| Repurchased |
(418 | ) | $ | 1.75 | ||||
|
|
|
|||||||
| Carry Grants nonvested, May 22, 2015 |
— | |||||||
|
|
|
|||||||
No Carry Grants remained outstanding subsequent to the Bain Acquisition. The total fair value of Carry Grants that vested during the fiscal years ended April 30, 2014 and 2015 was $3.4 million and $2.4 million, respectively.
Employee Stock Options and Restricted Stock Awards (“RSA”)
Pursuant to the 2012 Securities Purchase Plan, the Company granted options to certain employees to purchase shares of the Company’s Class B common stock in the years ended April 30, 2014 and 2015. Under the 2012 Securities Purchase Plan, options vest 25 percent upon the one-year anniversary date from initial vesting date, with the remainder vesting monthly over the following three years.
Beginning on May 23, 2015, the Company granted options and restricted stock awards pursuant to the 2015 Plan. Options and restricted stock awards granted under the 2015 Plan may contain performance and market conditions, and vest over a period of up to five years depending on achievement of the various market and performance conditions.
F-36
Table of Contents
A summary of stock option activity follows (in thousands, except per share amounts):
| Shares | Weighted Average Exercise price |
|||||||
| Predecessor: |
||||||||
| Options outstanding as of April 30, 2013 |
376 | $ | 1.92 | |||||
| Granted |
137 | $ | 2.26 | |||||
| Exercised |
— | |||||||
| Cancelled |
— | |||||||
|
|
|
|||||||
| Options outstanding as of April 30, 2014 |
513 | $ | 2.01 | |||||
| Granted |
1,310 | $ | 3.24 | |||||
| Exercised |
(25 | ) | $ | 1.92 | ||||
| Cancelled |
— | |||||||
|
|
|
|||||||
| Options outstanding as of April 30, 2015 |
1,798 | $ | 2.90 | |||||
| Granted |
— | |||||||
| Exercised |
(641 | ) | $ | 2.56 | ||||
| Cancelled |
(1,157 | ) | $ | 3.10 | ||||
|
|
|
|||||||
| Options outstanding as of May 22, 2015 |
— | |||||||
| Successor: |
||||||||
| Granted |
13,667 | $ | 11.05 | |||||
| Exercised |
(7 | ) | $ | 2.35 | ||||
| Cancelled |
(157 | ) | $ | 14.58 | ||||
|
|
|
|||||||
| Options outstanding as of April 30, 2016 |
13,503 | $ | 11.01 | |||||
|
|
|
|||||||
A summary of RSA activity follows (in thousands, except per share amounts):
| Shares | Weighted Average Grant Date Fair Value Per Share |
|||||||
| RSAs unvested as of May 22, 2015 |
— | |||||||
| Successor: |
||||||||
| Granted |
2,500 | $ | 9.28 | |||||
| Vested |
(187 | ) | $ | 10.00 | ||||
| Cancelled |
— | |||||||
|
|
|
|||||||
| RSAs unvested, April 30, 2016 |
2,313 | $ | 9.22 | |||||
|
|
|
|||||||
Stock-Based Compensation Expense
The Company measures stock-based compensation at the grant date based on the estimated fair value of the award and recognizes the expense over the requisite service period which is generally the vesting term of the grant. The fair value of the Carry Grants and stock options granted under the Company’s 2012 Securities Purchase Plan and the 2012 Stock Option Plan, respectively, were determined using the Black-Scholes-Merton option valuation model with the assumptions noted in the table below. Estimated compensation cost relating to RSAs granted under the 2015 Plan is based upon the most recent valuation of the Company’s equity on a per share basis on the date of grant. For options with performance and market-based conditions granted under the 2015 Plan, the Company employs a Monte Carlo simulation and determines the fair value based on the most probable outcome of the market condition and recognizes the compensation cost when the performance condition becomes probable. For options without market conditions granted under the 2015 Plan, the fair value of each option award is estimated on the date of grant using a Black-Scholes-Merton option valuation model that uses the assumptions noted in the table below. The estimated expected term of options granted is derived using the simplified method, which calculates the expected term equal to the vesting period plus the midpoint of the
F-37
Table of Contents
remaining contractual term. The risk free interest rate is based on the implied yield currently available on U.S. Treasury securities with a remaining term commensurate with the estimated expected term. Expected volatility is based on comparing peer companies with similar leverage ratios over the period commensurate with the estimated expected term. The Company recognizes compensation expense net of the estimated forfeitures.
The following table sets forth the weighted-average assumptions used as inputs for the option pricing model and Black-Scholes-Merton model to determine the fair value of the Carry Grants and stock option grants:
| Predecessor | Successor | |||||||||||||||
| Year Ended April 30, | Period from May 1 to May 22, 2015 |
Period from May 23, 2015 to April 30, 2016 |
||||||||||||||
| 2014 | 2015 | |||||||||||||||
| Risk-free interest rate |
0.80 | % | 1.07 | % | NA | 1.76 | % | |||||||||
| Expected term, in years |
3.0 | 3.0 | NA | 6.2 | ||||||||||||
| Dividend yield |
— | % | — | % | NA | — | % | |||||||||
| Volatility |
50 | % | 50 | % | NA | 69 | % | |||||||||
The following table presents stock-based compensation expense included in the Company’s consolidated statements of operations (in thousands):
| Predecessor | Successor | |||||||||||||||
| Year Ended April 30, | Period from May 1 to May 22, 2015 |
Period from May 23, 2015 to April 30, 2016 |
||||||||||||||
| 2014 | 2015 | |||||||||||||||
| Stock-based compensation expense: |
||||||||||||||||
| Cost of net revenue |
$ | 22 | $ | 112 | $ | 59 | $ | 560 | ||||||||
| Sales and marketing |
386 | 514 | 621 | 5,395 | ||||||||||||
| Research and development |
219 | 476 | 386 | 2,801 | ||||||||||||
| General and administrative |
2,612 | 1,594 | 2,585 | 10,158 | ||||||||||||
|
|
|
|
|
|
|
|
|
|||||||||
| $ | 3,239 | $ | 2,696 | $ | 3,651 | $ | 18,914 | |||||||||
|
|
|
|
|
|
|
|
|
|||||||||
As of April 30, 2016, $26.5 million and $12.4 million of unrecognized compensation cost related to stock options and RSAs, respectively, adjusted for estimated forfeitures, is expected to be recognized over a weighted-average period of 3.6 years and 3.8 years, respectively.
Note 10. Net Loss Per Share
Basic net loss per common share is computed by dividing net loss attributable to common stockholders by basic weighted-average shares outstanding during the period. Diluted net loss per share attributable to common stockholders is computed by dividing net loss attributable to common stockholders by diluted weighted-average shares outstanding, including potentially dilutive securities. Given the liquidation preferences and dividend terms as described in Note 9, Stockholders’ Equity, the Company is treating Class A common stock as preferred stock for the purpose of calculating net loss attributable to common stockholders and net loss per share attributable to common stockholders. While Class B and Class C common stock were participating securities, the Company has presented net loss per share on a combined basis.
F-38
Table of Contents
The following Class A Common Stock and outstanding stock options were excluded from the computation of diluted net loss per common share applicable to common stockholders for the periods presented as their effect would have been anti-dilutive (in thousands):
| Predecessor | Successor | |||||||||||||||
| Year Ended April 30, | Period from May 1 to May 22, 2015 |
Period from May 23, 2015 to April 30, 2016 |
||||||||||||||
| 2014 | 2015 | |||||||||||||||
| Class A common stock |
337 | 337 | 337 | — | ||||||||||||
| Outstanding stock options |
513 | 1,798 | — | 13,503 | ||||||||||||
| Nonvested Carry Grants |
4,460 | 2,665 | 419 | — | ||||||||||||
| RSAs |
— | — | — | 2,313 | ||||||||||||
|
|
|
|
|
|
|
|
|
|||||||||
| Potential common shares excluded from diluted net loss per share |
5,310 | 4,800 | 756 | 15,816 | ||||||||||||
|
|
|
|
|
|
|
|
|
|||||||||
Note 11. Income Taxes
The income tax provision includes U.S. federal, state and local, and foreign income taxes. The domestic and foreign components of loss before income taxes are as follows (in thousands):
| Predecessor | Successor | |||||||||||||||
| Year Ended April 30, | Period from May 1 to May 22, 2015 |
Period from May 23, 2015 to April 30, 2016 |
||||||||||||||
| 2014 | 2015 | |||||||||||||||
| United States |
$ | 13,590 | $ | (16,634 | ) | $ | 35,495 | $ | (222,776 | ) | ||||||
| Foreign |
(70,142 | ) | 16,308 | (60,568 | ) | (112,371 | ) | |||||||||
|
|
|
|
|
|
|
|
|
|||||||||
| Loss before income taxes |
$ | (56,552 | ) | $ | (326 | ) | $ | (25,073 | ) | $ | (335,147 | ) | ||||
|
|
|
|
|
|
|
|
|
|||||||||
The income tax provision (benefit) was as follows (in thousands):
| Predecessor | Successor | |||||||||||||||
| Year Ended April 30, | Period from May 1 to May 22, 2015 |
Period from May 23, 2015 to April 30, 2016 |
||||||||||||||
| 2014 | 2015 | |||||||||||||||
| United States federal taxes: |
||||||||||||||||
| Current |
$ | 338 | $ | (431 | ) | $ | 26 | $ | 8,511 | |||||||
| Deferred |
(9,304 | ) | 13,293 | (7,919 | ) | (60,049 | ) | |||||||||
| Foreign taxes: |
||||||||||||||||
| Current |
1,653 | 3,815 | 471 | 1,183 | ||||||||||||
| Deferred |
2,270 | (2,465 | ) | (39 | ) | (8,253 | ) | |||||||||
| State taxes: |
||||||||||||||||
| Current |
1,993 | 589 | 63 | 998 | ||||||||||||
| Deferred |
(2,171 | ) | 303 | (198 | ) | (5,933 | ) | |||||||||
|
|
|
|
|
|
|
|
|
|||||||||
| Income tax provision (benefit) |
$ | (5,221 | ) | $ | 15,104 | $ | (7,596 | ) | $ | (63,543 | ) | |||||
|
|
|
|
|
|
|
|
|
|||||||||
F-39
Table of Contents
A reconciliation of the income tax provision (benefit) to the amount computed by applying the statutory federal income tax rate to net loss before income tax provision (benefit) is summarized as follows (in thousands):
| Predecessor | Successor | |||||||||||||||
| Year Ended April 30, | Period from May 1 to May 22, 2015 |
Period from May 23, 2015 to April 30, 2016 |
||||||||||||||
| 2014 | 2015 | |||||||||||||||
| Provision at statutory rate |
$ | (19,782 | ) | $ | (114 | ) | $ | (8,776 | ) | $ | (117,348 | ) | ||||
| State and local income taxes, net of federal benefit |
(1,176 | ) | 650 | (378 | ) | (5,331 | ) | |||||||||
| Deemed dividend |
4,595 | 873 | — | 33,170 | ||||||||||||
| Foreign tax credit |
(1,320 | ) | (1,116 | ) | — | (6,502 | ) | |||||||||
| Foreign tax rate difference |
13,379 | (131 | ) | 1,622 | 28,567 | |||||||||||
| Effect of intercompany transactions |
(1,899 | ) | 3,946 | 127 | 2,225 | |||||||||||
| Stock-based compensation |
1,134 | 943 | 966 | 442 | ||||||||||||
| Research tax credit |
(331 | ) | (1,030 | ) | — | (1,489 | ) | |||||||||
| Release of net operating loss |
(1,188 | ) | (1,501 | ) | (394 | ) | — | |||||||||
| Tax reserves (settlement of tax position) |
856 | (422 | ) | 123 | 995 | |||||||||||
| Domestic production activities |
— | (1,041 | ) | — | — | |||||||||||
| Foreign earnings repatriated as part of Bain Acquisition |
— | 13,908 | — | — | ||||||||||||
| Transaction costs |
— | — | (707 | ) | 2,130 | |||||||||||
| Other |
511 | 139 | (179 | ) | (402 | ) | ||||||||||
|
|
|
|
|
|
|
|
|
|||||||||
| Income tax provision (benefit) |
$ | (5,221 | ) | $ | 15,104 | $ | (7,596 | ) | $ | (63,543 | ) | |||||
|
|
|
|
|
|
|
|
|
|||||||||
For the Predecessor period from May 1, 2015 through May 22, 2015, the Company recorded a benefit of $7.6 million. For the successor period from May 23, 2015 through April 30, 2016, the Company recorded a benefit from income taxes of $63.5 million.
For the Predecessor period from May 1, 2015 through May 22, 2015, the difference between the recorded benefit from income taxes and an income tax provision based on the federal statutory rate of 35% was primarily due to jurisdictional mix of income between U.S. and foreign sources, stock-based compensation charges, taxes on foreign income, various non-deductible items and previously taxed income repatriated to the U.S. For the Successor period from May 23, 2015 through April 30, 2016, the difference between the recorded benefit from income taxes and an income tax provision based on the federal statutory rate of 35% was primarily due to foreign rate detriment, deemed dividend, non-deductible amortization, non-deductible transactions costs, benefits from foreign tax credits and R&D credits, reserve of uncertain tax positions, the effect of intercompany transactions and state taxes. The deemed dividend that affected the Company’s income taxes in the period from May 23, 2015 to April 30, 2016 arose from the average intercompany loan balance outstanding between Blue Coat and its foreign subsidiary, subject to income inclusion pursuant to Section 956 of the Internal Revenue Code, and the related gross-up pursuant to Section 78 of the Internal Revenue Code, as of April 30, 2016, net of previously taxed income.
For the year ended April 30, 2015, the difference between the recorded benefit from income taxes and an income tax provision based on the federal statutory rate of 35% was primarily attributable to foreign earnings repatriated as part of the Bain Acquisition, non-deductible amortization on foreign intangibles, jurisdictional mix of income between U.S. and foreign, taxes on foreign income and various nondeductible items, offset by the tax benefit of releasing uncertain tax positions during the fiscal year.
F-40
Table of Contents
Deferred income taxes reflect the net tax effects of temporary differences between the carrying amounts of assets and liabilities for financial reporting purposes and the amounts used for income tax purposes. Significant components of the Company’s deferred tax assets and liabilities were as follows (in thousands):
| Predecessor | Successor | |||||||
| April 30, 2015 | April 30, 2016 | |||||||
| Deferred tax assets: |
||||||||
| Net operating loss carryforward |
$ | 43,198 | $ | 44,735 | ||||
| Other accruals and reserves |
8,579 | 7,796 | ||||||
| Accrued bonuses |
— | 9,754 | ||||||
| Inventory |
— | 2,173 | ||||||
| Fixed assets |
1,922 | 316 | ||||||
| Stock-based compensation expense |
— | 1,002 | ||||||
| Deferred revenue |
12,668 | 2,507 | ||||||
| Tax credits |
30,974 | 22,605 | ||||||
| Capitalized research and development |
1,883 | 1,504 | ||||||
| Other comprehensive income |
— | 1,146 | ||||||
| Borrowing cost |
— | 3,951 | ||||||
| Goodwill |
— | 9,083 | ||||||
|
|
|
|
|
|||||
| Gross deferred tax assets |
99,224 | 106,572 | ||||||
| Valuation allowance |
(11,984 | ) | (16,031 | ) | ||||
|
|
|
|
|
|||||
| Total deferred tax assets |
87,240 | 90,541 | ||||||
|
|
|
|
|
|||||
| Deferred tax liabilities: |
||||||||
| Foreign earnings repatriated as part of Bain Acquisition |
(13,908 | ) | — | |||||
| Prepaid expenses |
(2,273 | ) | (5,474 | ) | ||||
| Borrowing costs |
(3,609 | ) | — | |||||
| Definite life intangible assets |
(61,169 | ) | (111,320 | ) | ||||
| Indefinite life intangible assets |
|
(20,620 |
) |
|
(37,552 |
) | ||
| Goodwill |
(3,143 | ) | — | |||||
|
|
|
|
|
|||||
| Total deferred tax liabilities |
(104,722 | ) | (154,346 | ) | ||||
|
|
|
|
|
|||||
| Net deferred tax liabilities |
$ | (17,482 | ) | $ | (63,805 | ) | ||
|
|
|
|
|
|||||
The Company recorded a valuation allowance to reduce the Company’s deferred tax assets to the amount that is more likely than not to be realized in future periods. In evaluating the Company’s ability to recover the Company’s deferred tax assets, the Company considers all available positive and negative evidence, including operating results, the Company’s history of losses and forecasts of future taxable income. As of April 30, 2015 and 2016, the Company was in a net deferred tax liability position.
The Company’s estimate of future taxable income considers available positive and negative evidence regarding the Company’s current and future operations, including projections of income in various states and foreign jurisdictions. The Company believes the estimate of future taxable income is reasonable; however it is inherently uncertain, and if the Company’s future operations generate taxable income greater than projected, the Company may record reductions to the Company’s valuation allowance. Conversely, if the Company’s ability to generate future taxable income necessary to realize a portion of the deferred tax asset is materially reduced, the Company may record additions to the Company’s valuation allowance.
A valuation allowance has been placed against certain of the Company’s state deferred tax assets and certain deferred tax assets from its acquired entities as the Company cannot conclude that it is more likely than not that these assets will be realized. As of April 30, 2015 and 2016, we had valuation allowances of $12.0 million and $16.0 million, respectively. The valuation allowance increased by $4.9 million and $4.0 million for the fiscal years ended April 30, 2015 and April 30, 2016, respectively.
F-41
Table of Contents
Due to ownership change provisions of the Internal Revenue Code and similar state provisions, the Company has reduced the Company’s net operating loss carryforwards and credit carryforwards accordingly. As of April 30, 2016, the Company had net operating loss carryforwards for federal income tax purposes of approximately $124.9 million, which will expire beginning in fiscal year 2019, if not utilized. The Company also had net operating loss carryforwards for state income tax purposes of approximately $138.5 million, which will expire beginning in fiscal year 2017, if not utilized. In the foreign jurisdiction, the Company had net operating losses of $4.6 million, which will expire beginning in fiscal year 2033, if not utilized. The Company also had federal and California research and development tax credits of approximately $18.8 million and $20.2 million, respectively. The federal research credit carryforwards will expire starting in 2030 if not utilized. The California research credits do not expire. The Company also had federal and California alternative minimum tax credit carryforwards of $1.1 million and $0.2 million, respectively. These credits are not subject to expiration. Finally, the Company has a federal foreign tax credit carryforward of $2.8 million, which will expire in fiscal year 2026. Additionally, the Company has $0.7 million of Canadian R&D credits that will begin expiring in 2029, if not utilized.
The Company’s total gross unrecognized tax benefits as of April 30, 2016 are $39.9 million. Included in the Company’s gross unrecognized tax benefits as of April 30, 2016 are approximately $36.8 million of tax benefits that, if recognized, would result in an adjustment to the Company’s effective tax rate.
The total amount of gross unrecognized tax benefits were as follows (in thousands):
| Unrecognized tax benefit as of April 30, 2013 (Predecessor) |
$ | 26,291 | ||
| Increase in balance due to prior fiscal year tax positions |
145 | |||
| Increase in balance due to current fiscal year tax positions |
2,152 | |||
| Reductions for prior fiscal year tax positions |
(417 | ) | ||
|
|
|
|||
| Unrecognized tax benefit as of April 30, 2014 (Predecessor) |
28,171 | |||
| Increase in balance due to prior fiscal year tax positions |
201 | |||
| Increase in balance due to current fiscal year tax positions |
2,477 | |||
| Reductions for prior fiscal year tax positions |
(933 | ) | ||
|
|
|
|||
| Unrecognized tax benefit as of April 30, 2015 (Predecessor) |
29,916 | |||
| Increase in balance due to prior fiscal year tax positions |
— | |||
| Increase in balance due to current period tax positions |
61 | |||
| Reductions for prior fiscal year tax positions |
— | |||
|
|
|
|||
| Unrecognized tax benefit as of May 22, 2015 (Predecessor) |
29,977 | |||
| Increase in balance due to prior fiscal year tax positions |
129 | |||
| Increase in balance due to current period tax positions |
17,004 | |||
| Reductions for prior fiscal year tax positions |
(7,229 | ) | ||
|
|
|
|||
| Unrecognized tax benefit as of April 30, 2016 (Successor) |
$ | 39,881 | ||
|
|
|
During the successor period from May 23, 2015 through April 30, 2016, the Company released unrecognized tax benefits of $7.2 million as a result of foreign entities’ statute of limitations expiring, and a measurement period adjustment resulting from business combinations.
The Company has elected to classify interest and penalties related to unrecognized tax benefits as a component of the Company’s provision for income taxes. Accrued interest and penalties relating to the Company’s unrecognized tax benefits was approximately $2.9 million and $2.5 million as of April 30, 2015 and April 30, 2016, respectively.
Due to the Company’s taxable loss position from inception through fiscal year 2012, all tax years are subject to examinations in U.S. federal and state jurisdictions. The Company is also subject to examinations in various foreign jurisdictions for tax years 2009 forward, none of which are individually material. The Company estimates
F-42
Table of Contents
a potential decrease in its unrecognized tax benefits of up to $6.1 million which may occur within the next 12 months.
At April 30, 2015 and 2016, the Company had a liability for uncertain tax positions of $18.3 million and $16.5 million, respectively. Due to uncertainties with respect to the timing of future cash flows associated with the Company’s unrecognized tax benefits, the Company was unable to make reasonably reliable estimates of the period of cash settlement with the applicable taxing authorities.
Under the contractual terms of the Bain Acquisition agreement, the Company was required to repatriate all foreign cash with the exception of certain minimum amounts required for working capital needs to run its existing foreign operations. In connection with the terms of the Bain Acquisition agreement, as of April 30, 2015 the Company had established a deferred tax liability of $13.9 million on all non-U.S. earnings, with the exception of the working capital needs of its foreign entities. Immediately prior to the closing of the Bain Acquisition in May 2015, the Company fulfilled this contractual obligation and repatriated the foreign cash available at the time, with the exception of certain minimal working capital needs.
As of April 30, 2016, undistributed foreign earnings of the Company’s foreign subsidiaries are not significant and, accordingly, the amounts of unrecognized deferred tax liability for temporary differences related to investment in these non-U.S. subsidiaries are not material. The Company is neither contractually required, nor does it intend to repatriate any of its foreign earnings.
Note 12. Defined Contribution and Other Post-Retirement Plans
The Company has a defined contribution benefit plan under Section 401(k) of the Internal Revenue Code, which covers substantially all U.S. employees (the “401(k) Plan”). U.S. employees are automatically enrolled in the Company’s 401(k) Plan when they meet eligibility requirements, unless they decline participation. Eligible employees may contribute pretax amounts to the plan via payroll withholding, subject to certain limitations. The Company matches participant contributions on a dollar-for-dollar basis up to the lower of three percent of a participant’s eligible compensation or $3,000 per calendar year. Matching contributions are invested in accordance with a participant’s existing investment elections and become fully vested after four years of service. Certain of the Company’s foreign subsidiaries also have defined contribution or other post-retirement plans in which a majority of their employees participate. The total amount of employer expenses, including the employer contributions to the Company’s 401(k) Plan and foreign subsidiaries’ plans was as follows (in thousands):
| Predecessor | Successor | |||||||||||||||||
| Year Ended April 30, | Period from May 1 to May 22, 2015 |
Period from May 23, 2015 to April 30, 2016 |
||||||||||||||||
| 2014 | 2015 | |||||||||||||||||
| Employer contributed expenses |
$ | 5,833 | $ | 6,066 | $ | 536 | $ | 6,208 | ||||||||||
Note 13. Commitments and Contingencies
Guarantees, Indemnifications and Warranty Obligations
The Company’s customer agreements generally include certain provisions for indemnifying such customers against certain liabilities, including if the Company’s products infringe a third party’s intellectual property rights. The Company has also agreed in certain circumstances to indemnify for customer costs that would be incurred in connection with a product recall and to indemnify certain suppliers in connection with liabilities they may incur in connection with the provision of services to the Company. Through April 30, 2016, the Company has not incurred any material costs as a result of such indemnification provisions and the Company has not accrued any liabilities related to such obligations in the accompanying consolidated financial statements.
The Company’s Bylaws provide that the Company shall indemnify the Company’s directors and officers to the fullest extent permitted by Delaware law, including in circumstances in which indemnification is otherwise
F-43
Table of Contents
discretionary under Delaware law. The Company has also entered into indemnification agreements or other contractual arrangements with current and former executive officers and directors of the Company and of certain of the Company’s subsidiaries, which contain provisions that may require the Company, among other things, to indemnify such officers and directors against certain liabilities that may arise by reason of their status or service as directors or officers and to advance their expenses incurred as a result of any proceeding against them as to which they could be indemnified.
The Company maintains a warranty accrual for estimated future warranty obligations using anticipated future warranty costs based on the historical warranty rates. The Company generally provides a one-year warranty on hardware products.
Changes in the Company’s warranty obligations, which are included in other current liabilities in the Company’s consolidated balance sheets, were as follows (in thousands):
| Predecessor | Successor | |||||||||||||
| April 30, | April 30, 2016 |
|||||||||||||
| 2014 | 2015 | |||||||||||||
| Balance as of the beginning of period |
$ | 113 | $ | 230 | $ | 101 | ||||||||
| Warranty provision recorded during the period |
715 | 757 | 282 | |||||||||||
| Consumption during the period |
(598 | ) | (886 | ) | (332 | ) | ||||||||
|
|
|
|
|
|
|
|||||||||
| Balance as of the end of period |
$ | 230 | $ | 101 | $ | 51 | ||||||||
|
|
|
|
|
|
|
|||||||||
Operating Lease Commitments
The Company leases certain office equipment and office facilities under non-cancelable operating leases that expire at various dates through fiscal 2026. The facility leases generally require the Company to pay operating costs, including property taxes, insurance and maintenance, and may contain scheduled rent increases and certain other rent escalation clauses. Rent expense is recognized in the Company’s consolidated financial statements on a straight-line basis over the terms of the respective leases after consideration of rent holidays and improvement allowances, if applicable, with any assets purchased using a lessee improvement allowance capitalized as fixed assets and depreciated over the shorter of their useful lives or the lease term.
The Company leased a building with approximately 116,600 square feet of office space in Sunnyvale, California as its corporate headquarters until November 30, 2015. In January 2015, the Company entered into a ten-year lease for a new corporate headquarters location consisting of approximately 104,500 square feet of office space in Sunnyvale, California. Annualized base rent under this lease ranges from $3.5 million to $4.4 million.
In connection with the facility leases for the Company’s corporate headquarters and certain other facility locations, the Company is required to maintain irrevocable standby letters of credit with a major financial institution as a form of security. The aggregate amount of the facility-related letters of credit was $4.0 million at April 30, 2016 and the letters of credit have expiration dates through August 2016. The letters of credit are secured by deposits and provide for automatic annual extensions, without amendment, for a period of one year on each successive expiration date, but no later than the respective lease expirations. The deposits securing the letters of credit are primarily classified as long-term restricted cash in the accompanying consolidated balance sheets.
F-44
Table of Contents
As of April 30, 2016, future minimum lease payments under noncancelable operating leases with an initial lease term in excess of one year were as follows (in thousands):
| Fiscal Years Ending April 30, |
Amount | |||
| 2017 |
$ | 10,312 | ||
| 2018 |
8,843 | |||
| 2019 |
7,129 | |||
| 2020 |
6,156 | |||
| 2021 |
5,449 | |||
| Thereafter |
20,244 | |||
|
|
|
|||
| Total |
$ | 58,133 | ||
|
|
|
|||
Rental expense for operating leases, including rentals on a month-to-month basis, was as follows (in thousands):
| Predecessor | Successor | |||||||||||||||||
|
Year Ended April 30, |
Period from May 1 to May 22, 2015 |
Period from May 23, 2015 to April 30, 2016 |
||||||||||||||||
| 2014 | 2015 | |||||||||||||||||
| Rent expense |
$ | 10,122 | $ | 10,339 | $ | 792 | $ | 10,318 | ||||||||||
Purchase Commitments and Other
The Company purchases components from a variety of suppliers and uses several contract manufacturers to provide manufacturing services for the Company’s products. During the normal course of business, in order to manage manufacturing lead times and help ensure adequate component supply, the Company entered into agreements with contract manufacturers and suppliers that either allow them to procure inventory based upon criteria as defined by the Company or that establish the parameters defining the Company’s requirements. A significant portion of the Company’s reported purchase commitments arising from these agreements consists of firm, noncancelable and unconditional commitments. In certain instances, these agreements allow the Company the option to cancel, reschedule and adjust the Company’s requirements based on the Company’s business needs prior to firm orders being placed. These agreements are enforceable and legally binding against the Company in the short term and all amounts under these arrangements are due to be paid by the end of fiscal 2016. As of April 30, 2014, 2015 and 2016, the Company’s total purchase commitments for inventory were not significant. In addition, the Company had contractual obligations of approximately $7.2 million associated with license and service agreements as of April 30, 2016.
Legal Proceedings
The Company is currently a party to, and may in the future be involved in, various litigation matters (including intellectual property litigation), legal claims, and government investigations. Notably, the Company is currently involved in ongoing legal proceedings with Finjan, Inc. (“Finjan”).
On August 28, 2013, Finjan filed a complaint (“Finjan Case 1”) in the U.S. District Court for the Northern District of California alleging that certain Blue Coat products infringe U.S. Patent Nos. 6,154,844, 6,804,780, 6,965,968, 7,058,822, 7,418,731 and 7,647,633. On August 4, 2015, the jury in Finjan Case 1 returned a verdict that certain Blue Coat products infringe five Finjan patents in suit and awarded Finjan lump-sum money damages of $39.5 million. On November 20, 2015, the trial court entered a judgment in Finjan Case 1 in favor of Finjan on the jury verdict and certain non-jury legal issues. Finjan has also filed motions seeking enhanced damages on the judgment, including treble damages, interest and attorneys fees, which, if awarded, could be substantial. The Company intends to vigorously contest this judgment and investigate all available remedies for relief, including
F-45
Table of Contents
currently pending post-trial motions and, if necessary, an appeal. However, the Company cannot be certain that any of its motions or its appeal, if it chooses to appeal, will be successful.
On July 15, 2015, Finjan filed a second complaint (“Finjan Case 2”) in the U.S. District Court for the Northern District of California alleging that certain Blue Coat products infringe U.S. Patent Nos. 6,154,844, 6,965,968, 7,418,731, 8,079,086, 8,225,408, 8,566,580 and 8,677,494. On March 1, 2016, Finjan amended its complaint to allege that certain Blue Coat products also infringe U.S. Patent Nos. 9,141,786, 9,189,621 and 9,219,755. Finjan’s complaint also seeks enhanced damages, including treble damages. The Company has sought a stay of Finjan Case 2 from the court because, among other reasons, the Company contests Finjan’s right to recover damages on three patents—6,154,844, 6,965,968 and 7,418,731—for which Finjan was awarded lump-sum money damages that the Company contends are for the life of such patents in Finjan Case 1. The Company believes the jury’s verdict in Finjan Case 1 is in error and intends to vigorously defend Finjan Case 2, regardless of whether the case is stayed. However, the Company cannot be certain that it will ultimately prevail. If the Company does not prevail in Finjan Case 2, another large damages payment may be imposed upon it and the Company’s business and results of operations may be harmed. Trial in Finjan Case 2 is currently scheduled for October 30, 2017.
In a letter dated February 5, 2015, AT&T made an indemnification demand against Blue Coat in relation to a lawsuit pending in the United States District Court for the Northern District of Texas, Dallas Division, entitled Bascom Global Internet Services, Inc. v. AT&T Inc. The complaint alleges that AT&T has infringed U.S. Patent No. 5,987,606 by “making, using, selling, and/or offering for sale AT&T’s “Secure Network Gateway” service, “Web Security” service, “Cloud Web Security Service,” policy control functionality for wireless-device services, and/or other web-filtering and security offerings.” This matter is in an investigation phase. On or about May 21, 2015, AT&T prevailed on its motion to dismiss the case. Plaintiff has appealed the ruling.
On September 23, 2013, Protegrity Corporation (“Protegrity”) filed a complaint against Perspecsys USA, Inc. (“Perspecsys”) in the U.S. District Court for the District of Connecticut alleging patent infringement of U.S. Patent Nos. 6,321,201 and 8,402,281. The case was subsequently transferred to the U.S. District Court for the Northern District of California on February 23, 2015. Blue Coat acquired Perspecsys on July 30, 2015. The court has stayed the case pending resolution by the U.S. Patent and Trademark Appeals Board (“PTAB”) of petitions for Covered Business Method (“CBM”) review of the patents-in-suit. In its decision to institute a CBM review, the PTAB found every claim of the patents-in-suit more likely than not invalid under 35 U.S.C. §§ 101, 102, and/or 103. As a result of the PTAB findings regarding the invalidity of every claim of the patents-in-suit, the Company has determined that the possibility of a loss with respect to the Perspecsys litigation is remote. In addition to the Company’s belief that the possibility of a loss is remote, Blue Coat has received indemnification from the former stockholders of Perspecsys for any losses relating to this suit, subject to certain limitations. The Company’s right to indemnification for losses relating to this suit survives indefinitely, and is capped at the total consideration paid to the former stockholders of Perspecsys in connection with the Company’s acquisition of Perspecsys. The Company does not believe that the maximum amount of potential losses with respect to the Perspecsys litigation exceeds the indemnification available from the Perspecsys stockholders.
The Company has estimated that the amount of loss that is reasonably possible under applicable accounting standards with respect to Finjan Case 1 is between $0, the loss if none of the jury’s verdict is upheld on appeal, and $39.5 million, the amount of loss that would be incurred if the jury’s verdict were upheld on appeal in all respects. The Company has not recorded a liability with respect to Finjan Case 1 based on management’s determination that a loss in that case is not probable under applicable accounting standards. Given the early stages of Finjan Case 2 and the AT&T indemnification demand, management has determined that it is unable to estimate the possible losses in those cases.
Legal settlement expenses and legal settlement net gains are included in general and administrative expenses in the consolidated statements of operations.
F-46
Table of Contents
Note 14. Segment, Geographic and Customer Concentration Information
The Company conducts business in one operating segment that provides advanced web security solutions for global enterprises and governments and the expanding IT network. The Company’s chief operating decision maker allocates resources and makes operating decisions based on financial information presented on a consolidated basis, which is consistent with the presentation in the accompanying consolidated financial statements.
Net revenue is attributed to the following geographic areas based on the location of the Company’s customers. The following is a summary of net revenue by geographic area (dollars in thousands):
| Predecessor | Successor | |||||||||||||||||
| Year Ended April 30, | Period from May 1 to May 22, 2015 |
Period from May 23, 2015 to April 30, 2016 |
||||||||||||||||
| 2014 | 2015 | |||||||||||||||||
| United States (“U.S.”) |
$ | 274,768 | $ | 288,347 | $ | 14,652 | $ | 274,997 | ||||||||||
| Americas (excluding U.S.)(1) |
28,894 | 40,092 | 1,468 | 36,108 | ||||||||||||||
| United Kingdom (“U.K.”) |
42,636 | 50,756 | 2,953 | 58,684 | ||||||||||||||
| EMEA (excluding U.K.)(2) |
146,522 | 137,595 | 5,672 | 82,237 | ||||||||||||||
| APAC(3) |
113,652 | 114,493 | 4,733 | 116,833 | ||||||||||||||
|
|
|
|
|
|
|
|
|
|||||||||||
| Total net revenue |
$ | 606,472 | $ | 631,283 | $ | 29,478 | $ | 568,859 | ||||||||||
|
|
|
|
|
|
|
|
|
|||||||||||
| As percentage of net revenue: |
||||||||||||||||||
| United States |
45 | % | 46 | % | 50 | % | 48 | % | ||||||||||
| Americas (excluding U.S.)(1) |
5 | % | 6 | % | 5 | % | 6 | % | ||||||||||
| United Kingdom |
7 | % | 8 | % | 10 | % | 10 | % | ||||||||||
| EMEA (excluding U.K.)(2) |
24 | % | 22 | % | 19 | % | 14 | % | ||||||||||
| APAC(3) |
19 | % | 18 | % | 16 | % | 22 | % | ||||||||||
|
|
|
|
|
|
|
|
|
|||||||||||
| Total net revenue |
100 | % | 100 | % | 100 | % | 100 | % | ||||||||||
|
|
|
|
|
|
|
|
|
|||||||||||
| (1) | North America, Central America and Latin America (“Americas”) |
| (2) | Europe, Middle East and Africa (“EMEA”) |
| (3) | Asia and Pacific regions (“APAC”) |
The following table presents a summary of global customers, including their various affiliates, that accounted for more than 10% of the Company’s total revenue and accounts receivable:
| Revenue | Accounts Receivable | |||||||||||||||||||||||||||
| Predecessor | Successor | Predecessor | Successor | |||||||||||||||||||||||||
| Year Ended April 30, |
Period from May 1 to May 22, 2015 |
Period from May 23, 2015 to April 30, 2016 |
April 30, 2015 |
April 30, 2016 |
||||||||||||||||||||||||
| 2014 | 2015 | |||||||||||||||||||||||||||
| Customer A |
23 | % | 26 | % | 25 | % | 26 | % | 23 | % | 24 | % | ||||||||||||||||
| Customer B |
18 | % | 25 | % | 29 | % | 27 | % | 28 | % | 31 | % | ||||||||||||||||
| Customer C |
13 | % | * | % | * | % | * | % | * | % | * | % | ||||||||||||||||
| * | Accounted for less than 10% of the Company’s total net revenue or accounts receivable. |
F-47
Table of Contents
The following table presents a summary of long-lived assets by geographic area (in thousands):
| Predecessor | Successor | |||||||||
| April 30, 2015 |
April 30, 2016 |
|||||||||
| Property and equipment, net: |
||||||||||
| United states |
$ | 28,560 | $ | 47,631 | ||||||
| International |
7,259 | 7,397 | ||||||||
|
|
|
|
|
|||||||
| $ | 35,819 | $ | 55,028 | |||||||
|
|
|
|
|
|||||||
| Identifiable intangible assets, net: |
||||||||||
| United states |
$ | 265,588 | $ | 469,927 | ||||||
| International |
238,053 | 501,274 | ||||||||
|
|
|
|
|
|||||||
| $ | 503,641 | $ | 971,201 | |||||||
|
|
|
|
|
|||||||
Note 15. Related Party Transactions
The Company had a management agreement with Thoma Bravo LLC, the majority owner of the Predecessor, which required a payment of an annual management fee of $3.5 million, due on a quarterly basis. In connection with the Bain Acquisition, the Thoma Bravo agreement was terminated and a new management agreement with a management company associated with Bain Capital, the majority owner of the Successor, was entered into in May 2015. Under the Bain Capital management agreement, the Company is required to make a payment of an annual management fee of $5.0 million, due on a quarterly basis, until the Company completes an initial public offering. In addition, under the Bain Capital management agreement, the Company is required to make payments for transaction fees associated with acquisitions. The Company incurred expenses related to Thoma Bravo and Bain Capital management fees as follows (in thousands):
| Predecessor | Successor | |||||||||||||||||
| Year Ended April 30, |
Period from May 1 to May 22, 2015 |
Period from May 23, 2015 to April 30, 2016 |
||||||||||||||||
| 2014 | 2015 | |||||||||||||||||
| Thoma Bravo and Bain Capital management fees |
$ | 3,500 | $ | 3,500 | $ | 200 | $ | 4,776 | ||||||||||
| Acquisition transaction fees |
— | — | — | 2,800 | ||||||||||||||
|
|
|
|
|
|
|
|
|
|||||||||||
| Total fees |
$ | 3,500 | $ | 3,500 | $ | 200 | $ | 7,576 | ||||||||||
|
|
|
|
|
|
|
|
|
|||||||||||
During the last quarter of fiscal 2016, Bain Capital, LP purchased certain products and services from the Company. Revenue from Bain Capital, LP was $0.3 million in the period from May 23, 2015 through April 30, 2016. As of April 30, 2016, the Company’s accounts receivable and deferred revenue related to sales to Bain Capital, LP were $0.8 million and $0.5 million, respectively. The transaction was entered into in the ordinary course of business and was negotiated on commercially reasonable terms.
On November 16, 2015, the Company loaned $8.3 million to an officer in the form of a promissory note, which bears interest daily at the annual rate of 1.58%. The repayment of the promissory note is secured by certain shares of the Company’s common stock equity in the Company owned by the officer. As of April 30, 2016, the total unpaid principal balance was $8.3 million and was included in additional paid in capital on the consolidated balance sheet. The promissory note was repaid in full, including accrued interest, on May 11, 2016.
Note 16. Subsequent Events
We evaluated subsequent events that occurred through June 2, 2016, the date the April 30, 2016 consolidated financial statements were available to be issued, noting no additional matters for disclosure.
F-48
Table of Contents
ELASTICA, INC.
Consolidated Financial Statements
November 16, 2015 and December 31, 2014
F-49
Table of Contents
ELASTICA, INC.
November 16, 2015 and December 31, 2014
| Page(s) | ||||
| F-51 | ||||
| Consolidated Financial Statements |
||||
| F-52 | ||||
| Consolidated Statements of Operations and Comprehensive Loss |
F-53 | |||
| Consolidated Statements of Convertible Preferred Stock and Stockholders’ Deficit |
F-54 | |||
| F-55 | ||||
| F-56–F-68 | ||||
F-50
Table of Contents
To the Stockholder of
Elastica, Inc.
We have audited the accompanying consolidated financial statements of Elastica, Inc. and its subsidiaries which comprise the consolidated balance sheets as of November 16, 2015 and December 31, 2014 and the related consolidated statements of operations and comprehensive loss, of convertible preferred stock and stockholders’ deficit and of cash flows for the period from January 1, 2015 through November 16, 2015 and for the year ended December 31, 2014.
Management’s Responsibility for the Financial Statements
Management is responsible for the preparation and fair presentation of the consolidated financial statements in accordance with accounting principles generally accepted in the United States of America; this includes the design, implementation, and maintenance of internal control relevant to the preparation and fair presentation of consolidated financial statements that are free from material misstatement, whether due to fraud or error.
Auditor’s Responsibility
Our responsibility is to express an opinion on the consolidated financial statements based on our audits. We conducted our audits in accordance with auditing standards generally accepted in the United States of America. Those standards require that we plan and perform the audit to obtain reasonable assurance about whether the consolidated financial statements are free from material misstatement.
An audit involves performing procedures to obtain audit evidence about the amounts and disclosures in the consolidated financial statements. The procedures selected depend on our judgment, including the assessment of the risks of material misstatement of the consolidated financial statements, whether due to fraud or error. In making those risk assessments, we consider internal control relevant to the Company’s preparation and fair presentation of the consolidated financial statements in order to design audit procedures that are appropriate in the circumstances, but not for the purpose of expressing an opinion on the effectiveness of the Company’s internal control. Accordingly, we express no such opinion. An audit also includes evaluating the appropriateness of accounting policies used and the reasonableness of significant accounting estimates made by management, as well as evaluating the overall presentation of the consolidated financial statements. We believe that the audit evidence we have obtained is sufficient and appropriate to provide a basis for our audit opinion.
Opinion
In our opinion, the consolidated financial statements referred to above present fairly, in all material respects, the financial position of Elastica, Inc. and its subsidiaries at November 16, 2015 and December 31, 2014 and the results of their operations and their cash flows for the periods then ended in accordance with accounting principles generally accepted in the United States of America.
/s/ PricewaterhouseCoopers LLP
San Jose, California
January 28, 2016
F-51
Table of Contents
ELASTICA, INC.
November 16, 2015 and December 31, 2014
| (in thousands, except share and per share data) | November 16, 2015 |
December 31, 2014 |
||||||
| Assets |
||||||||
| Current assets: |
||||||||
| Cash and cash equivalents |
$ | 3,529 | $ | 12,554 | ||||
| Accounts receivable |
327 | — | ||||||
| Prepaid expenses and other current assets |
768 | 166 | ||||||
|
|
|
|
|
|||||
| Total current assets |
4,624 | 12,720 | ||||||
| Restricted cash |
545 | 535 | ||||||
| Property and equipment, net |
717 | 196 | ||||||
| Other assets |
206 | 93 | ||||||
|
|
|
|
|
|||||
| Total assets |
$ | 6,092 | $ | 13,544 | ||||
|
|
|
|
|
|||||
| Liabilities, Convertible Preferred Stock and Stockholders’ Deficit |
||||||||
| Current liabilities: |
||||||||
| Accounts payable |
$ | 136 | $ | 539 | ||||
| Accrued liabilities |
909 | 572 | ||||||
| Preferred stock warrants |
48 | — | ||||||
| Line of credit |
2,500 | — | ||||||
| Deferred revenue |
2,356 | 7 | ||||||
| Other liabilities |
221 | 222 | ||||||
|
|
|
|
|
|||||
| Total liabilities |
6,170 | 1,340 | ||||||
|
|
|
|
|
|||||
| Commitments and contingencies (Note 5) |
||||||||
| Convertible preferred stock: |
||||||||
| Series A preferred stock, $0.0001 par value; 8,747,786 shares authorized, issued and outstanding at November 16, 2015 and December 31, 2014 (Aggregate liquidation preference of $6,482) |
6,267 | 6,267 | ||||||
| Series B preferred stock, $0.0001 par value; 8,808,052 shares authorized, issued and outstanding at November 16, 2015 and December 31, 2014 (Aggregate liquidation preference of $20,000) |
19,893 | 19,893 | ||||||
| Series B-1 preferred stock, $0.001 par value; 3,113,208 shares authorized, 3,087,480 issued and outstanding at November 16, 2015, no shares authorized, issued or outstanding at December 31, 2014 (Aggregate liquidation preference of $9,000) |
8,973 | — | ||||||
| Stockholders’ deficit: |
||||||||
| Common stock, $0.0001 par value; 43,000,000 shares authorized, 11,694,141 and 11,643,582 shares issued and outstanding at November 16, 2015 and December 31, 2014, respectively |
1 | 1 | ||||||
| Additional paid-in capital |
1,488 | 118 | ||||||
| Accumulated deficit |
(36,700 | ) | (14,075 | ) | ||||
|
|
|
|
|
|||||
| Total stockholders’ deficit |
(35,211 | ) | (13,956 | ) | ||||
|
|
|
|
|
|||||
| Total liabilities, convertible preferred stock and stockholders’ deficit |
$ | 6,092 | $ | 13,544 | ||||
|
|
|
|
|
|||||
The accompanying notes are an integral part of these consolidated financial statements.
F-52
Table of Contents
ELASTICA, INC.
CONSOLIDATED STATEMENTS OF OPERATIONS AND COMPREHENSIVE LOSS
Periods Ended November 16, 2015 and December 31, 2014
| (in thousands) | Period from January 1, 2015 to November 16, 2015 |
Year Ended December 31, 2014 |
||||||
| Revenue |
$ | 395 | $ | 16 | ||||
| Cost of goods sold |
93 | — | ||||||
|
|
|
|
|
|||||
| Gross profit |
302 | 16 | ||||||
| Operating expenses |
||||||||
| Research and development |
11,660 | 6,546 | ||||||
| Sales and marketing |
8,413 | 2,530 | ||||||
| General and administrative |
2,753 | 1,745 | ||||||
|
|
|
|
|
|||||
| Total operating expenses |
22,826 | 10,821 | ||||||
|
|
|
|
|
|||||
| Loss from operations |
(22,524 | ) | (10,805 | ) | ||||
| Other/interest income (expense), net |
(70 | ) | 3 | |||||
|
|
|
|
|
|||||
| Loss before provision for income taxes |
(22,594 | ) | (10,802 | ) | ||||
| Provision for income taxes |
(31 | ) | — | |||||
|
|
|
|
|
|||||
| Net loss and comprehensive loss |
$ | (22,625 | ) | $ | (10,802 | ) | ||
|
|
|
|
|
|||||
The accompanying notes are an integral part of these consolidated financial statements.
F-53
Table of Contents
ELASTICA, INC.
CONSOLIDATED STATEMENTS OF CONVERTIBLE PREFERRED STOCK AND STOCKHOLDERS’ DEFICIT
Periods Ended November 16, 2015 and December 31, 2014
| (in thousands, except share and per share data) |
Convertible Preferred Stock |
Common Stock | Additional Paid-In Capital |
Accumulated Deficit |
Total Stockholders’ Deficit |
|||||||||||||||||||||||||
| Shares | Amount | Shares | Amount | |||||||||||||||||||||||||||
| Balances at December 31, 2013 |
8,747,786 | $ | 6,267 | 10,980,000 | $ | 1 | $ | 14 | $ | (3,273 | ) | $ | (3,258 | ) | ||||||||||||||||
| Issuance of common stock from exercise of stock options |
— | — | 663,582 | — | 183 | — | 183 | |||||||||||||||||||||||
| Early exercise of stock options |
— | — | — | — | (146 | ) | — | (146 | ) | |||||||||||||||||||||
| Issuance of Series B convertible prefered stock, net of issuance costs of $80 |
8,576,228 | 19,393 | — | — | — | — | — | |||||||||||||||||||||||
| Conversion of convertible promissory note into Series B convertible preferred stock |
231,824 | 500 | — | — | — | — | — | |||||||||||||||||||||||
| Stock-based compensation expense, employee |
— | — | — | — | 37 | — | 37 | |||||||||||||||||||||||
| Stock-based compensation expense, non-employee |
— | — | — | — | 30 | — | 30 | |||||||||||||||||||||||
| Net loss |
— | — | — | — | — | (10,802 | ) | (10,802 | ) | |||||||||||||||||||||
|
|
|
|
|
|
|
|
|
|
|
|
|
|
|
|||||||||||||||||
| Balances at December 31, 2014 |
17,555,838 | 26,160 | 11,643,582 | 1 | 118 | (14,075 | ) | (13,956 | ) | |||||||||||||||||||||
| Issuance of common stock from exercise of stock options |
— | — | 736,268 | — | 127 | — | 127 | |||||||||||||||||||||||
| Early exercise of stock options |
— | — | — | — | 188 | — | 188 | |||||||||||||||||||||||
| Repurchase of unvested restricted stock |
— | — | (685,709 | ) | — | (201 | ) | — | (201 | ) | ||||||||||||||||||||
| Issuance of Series B-1 prefered stock, net of issuance costs of $27 |
3,087,480 | 8,973 | — | — | — | — | — | |||||||||||||||||||||||
| Stock-based compensation expense, employee |
— | — | — | — | 250 | — | 250 | |||||||||||||||||||||||
| Stock-based compensation expense, non-employee |
— | — | — | — | 1,006 | — | 1,006 | |||||||||||||||||||||||
| Net loss |
— | — | — | — | — | (22,625 | ) | (22,625 | ) | |||||||||||||||||||||
|
|
|
|
|
|
|
|
|
|
|
|
|
|
|
|||||||||||||||||
| Balances at November 16, 2015 |
20,643,318 | $ | 35,133 | 11,694,141 | $ | 1 | $ | 1,488 | $ | (36,700 | ) | $ | (35,211 | ) | ||||||||||||||||
|
|
|
|
|
|
|
|
|
|
|
|
|
|
|
|||||||||||||||||
The accompanying notes are an integral part of these consolidated financial statements.
F-54
Table of Contents
ELASTICA, INC.
CONSOLIDATED STATEMENTS OF CASH FLOWS
Periods Ended November 16, 2015 and December 31, 2014
| (in thousands) | Period from January 1, 2015 to November 16, 2015 |
Year Ended December 31, 2014 |
||||||
| Cash flows from operating activities |
||||||||
| Net loss |
$ | (22,625 | ) | $ | (10,802 | ) | ||
| Adjustments to reconcile net loss to net cash used in operating activities: |
||||||||
| Depreciation and amortization |
183 | 62 | ||||||
| Stock-based compensation |
1,256 | 67 | ||||||
| Issuance of convertible preferred stock warrants |
48 | — | ||||||
| Changes in operating assets and liabilities: |
||||||||
| Accounts receivable |
(327 | ) | — | |||||
| Prepaid expenses and other assets |
(728 | ) | (196 | ) | ||||
| Accounts payable |
(403 | ) | 528 | |||||
| Accrued and other liabilities |
523 | 407 | ||||||
| Deferred revenue |
2,350 | 7 | ||||||
|
|
|
|
|
|||||
| Net cash used in operating activities |
(19,723 | ) | (9,927 | ) | ||||
|
|
|
|
|
|||||
| Cash flows from investing activities |
||||||||
| Purchases of property and equipment |
(691 | ) | (140 | ) | ||||
| Change in restricted cash |
(10 | ) | (535 | ) | ||||
|
|
|
|
|
|||||
| Net cash used in investing activities |
(701 | ) | (675 | ) | ||||
|
|
|
|
|
|||||
| Cash flows from financing activities |
||||||||
| Proceeds from issuance of convertible preferred stock, net of issuance costs |
8,973 | 19,393 | ||||||
| Proceeds from convertible promissary note |
— | 500 | ||||||
| Proceeds from exercise of stock options |
127 | 183 | ||||||
| Repurchase of unvested restricted stock |
(201 | ) | — | |||||
| Proceeds from line of credit |
2,500 | — | ||||||
|
|
|
|
|
|||||
| Net cash provided by financing activities |
11,399 | 20,076 | ||||||
|
|
|
|
|
|||||
| Net change in cash and cash equivalents |
(9,025 | ) | 9,474 | |||||
| Cash and cash equivalents at beginning of period |
12,554 | 3,080 | ||||||
|
|
|
|
|
|||||
| Cash and cash equivalents at end of period |
$ | 3,529 | $ | 12,554 | ||||
|
|
|
|
|
|||||
| Supplemental disclosure of cash activities |
||||||||
| Cash paid during the period for income taxes |
$ | 6 | $ | 5 | ||||
| Supplemental disclosure of non cash activities |
||||||||
| Conversion of convertible promissary note to Series B convertible preferred stock |
$ | — | $ | 500 | ||||
| Early exercise of stock option liability |
$ | 188 | $ | 146 | ||||
The accompanying notes are an integral part of these consolidated financial statements.
F-55
Table of Contents
NOTES TO CONSOLIDATED FINANCIAL STATEMENTS
1. The Company and Basis of Presentation
Elastica, Inc. (the “Company”) was incorporated in the state of Delaware in January 2012. The Company provides web based security services that enable enterprise users to scale security for cloud based apps. The Company’s primary product is CloudSoc. The Company is headquartered in San Jose, CA.
As discussed in Note 12, the Company was acquired by Blue Coat Systems, Inc. on November 16, 2015 and became a wholly-owned subsidiary of Blue Coat Systems, Inc. at that date.
2. Summary of Significant Accounting Policies
Basis of Consolidation
The consolidated financial statements as of November 16, 2015 and December 31, 2014 and for the fiscal periods then ended include the accounts of the Company and its wholly owned subsidiaries and have been prepared in conformity with accounting principles generally accepted in the United States of America (“GAAP”). All intercompany balances and transactions have been eliminated upon consolidation.
Use of Estimates
The preparation of the consolidated financial statements in conformity with GAAP requires management to make certain estimates and assumptions that affect the reported amounts of assets, liabilities, and of contingent assets and liabilities at the date of the financial statements and the reported amounts of revenue and expenses during the reporting periods covered by the consolidated financial statements and the accompanying notes. On an ongoing basis, the Company evaluates these estimates, including those related to the allowance for doubtful accounts, useful lives of property, plant and equipment, income taxes, valuation of equity instruments, commitments and contingencies and litigation, among others. The Company bases estimates on historical experience and on various assumptions that are believed to be reasonable under the circumstances. The Company is subject to uncertainties such as the impact of future events, economic and political factors and changes in the Company’s business environment; therefore, actual results could differ from those estimates.
Revenue Recognition
The Company generally sells Software-as-a-Service (“SaaS”)-based security solutions and recognizes revenue in accordance with Accounting Standards Codification (“ASC”) 605, Revenue Recognition. Revenue is recognized when there is evidence of an arrangement, the services have been provided, the fees are fixed or determinable and collection is reasonably assured. Revenue is recognized ratably over the service period.
When the Company sells software licenses, revenue is recognized under ASC 985-605, Software Revenue Recognition. In such cases, the Company will generally enter into multiple-element revenue arrangements in which a customer purchases a combination of a software license, maintenance and/or professional services. Vendor-specific objective evidence (“VSOE”) of fair value for each contract element is required to support revenue recognition for each element. The Company has a limited history of selling software licenses, and has therefore not established VSOE for any elements. Accordingly, the Company recognizes revenue ratably over the longest of the service periods when all revenue criteria have been met, namely there is evidence of an arrangement, the license or service is delivered, the fee is fixed or determinable and the collection of the receivable is probable.
The Company also sells non-recurring engineering services and recognizes revenue under ASC 605 under the completed performance method for these services.
F-56
Table of Contents
Cash and Cash Equivalents
The Company considers all highly liquid investments with remaining maturities at the date of purchase of three months or less to be cash equivalents. The Company deposits cash and cash equivalents with financial institutions that management believes are of high credit quality. As of November 16, 2015 and December 31, 2014, cash and cash equivalents consist of cash deposited with banks and money market account. Deposits in these financial institutions may, from time to time, exceed federally insured limits.
As of November 16, 2015 and December 31, 2014, the Company has restricted cash of $545,000 and $535,000, respectively, serving as security for the letter of credit issued to the Company’s landlord with respect to its lease obligation for its corporate offices which will be released upon the expiration of the lease.
Concentration of Credit Risk and Other Risks and Uncertainties
Financial instruments, which potentially subject the Company to significant concentrations of credit risk, consist primarily of cash and cash equivalents and accounts receivable. During the periods ended November 16, 2015 and December 31, 2014 the Company held cash amounts in excess of federally insured limits. The Company has not experienced any losses on its deposits of cash.
For the period ended November 16, 2015, one customer accounted for 79% of revenue. For the year ended December 31, 2014, two single customers accounted for more than 10% of revenue, at 65% and 27%. At November 16, 2015, one customer accounted for 69% of accounts receivable. No single customer accounted for more than 10% of accounts receivable at December 31, 2014.
The Company is subject to all of the risks inherent in an early stage company developing new products and services. These risks include, but are not limited to, limited management resources, intense competition, dependence upon customer acceptance of the product in development and the changing nature of the software industries. The Company’s operating results may be materially affected by the above factors.
Property and Equipment
Property and equipment are stated at cost, net of accumulated depreciation and amortization. Depreciation is computed using the straight-line method over the estimated useful lives of the assets, which is as follows:
| Computer equipment and software |
3 years | |||
| Furniture and fixtures |
5 years |
Leasehold improvements are amortized over the lesser of their useful life or the remaining life of the lease. When assets are retired or otherwise disposed of, the cost and accumulated depreciation and amortization are removed from the accounts and any resulting gain or loss is reflected in operations in the period realized. Maintenance and repairs, which are not considered improvements and do not extend the useful life of an asset, are charged to operations as incurred.
Leases
The Company leases its facilities under cancelable and non-cancelable operating leases. For leases that contain rent escalation or rent concession provisions, the Company records the total rent expense during the lease term on a straight-line basis over the term of lease. The Company records the difference between the rent paid and the straight-line rent as a deferred rent liability in the accompanying consolidated balance sheets.
Software Development Costs
Software development costs are included in research and development and are expensed as incurred. ASC 985-20, Costs of Software to be Sold, Leased, or Marketed, requires the capitalization of certain software
F-57
Table of Contents
development costs subsequent to establishment of technological feasibility. Based on the Company’s product development process, technological feasibility is established upon completion of a working model. Costs incurred by the Company between the completion of the working model and the point at which the product is ready for general release have been insignificant. Accordingly, the Company has charged all such costs to research and development expense in the accompanying consolidated statements of operations.
Research and Development
Research and development costs include personnel costs, including stock-based compensation expense, associated with the Company’s engineering personnel and consultants responsible for the design, development and testing of the Company’s product, depreciation of equipment used in research and development and allocated facilities and information technology costs. Research and development costs are expensed as incurred.
Income Taxes
The Company accounts for income taxes under the asset and liability method, which requires, among other things, that deferred income taxes be provided for temporary differences between the tax basis of the Company’s assets and liabilities and their financial statement reported amounts. In addition, deferred tax assets are recorded for the future benefit of utilizing net operating losses and research and development credit carryforwards. A valuation allowance is provided against deferred tax assets unless it is more likely than not that they will be realized.
The Company uses a two-step approach to recognizing and measuring uncertain tax positions. The first step is to evaluate the tax position for recognition by determining if the weight of available evidence indicates that it is more likely than not that the position will be sustained on audit, including resolution of related appeals or litigation processes, if any. The second step is to measure the tax benefit as the largest amount that is more likely than not to be realized upon settlement. The Company reviews uncertain tax benefits and may adjust such uncertain tax benefits because of proposed assessments by tax authorities, changes in facts and circumstances, issuance of new regulations or new case law, previously unavailable information obtained during the course of an examination, negotiations with tax authorities of different countries concerning the Company’s transfer pricing or the expiration of statutes of limitations.
Stock-Based Compensation
The Company accounts for stock-based compensation in accordance with the provisions of ASC 718, Compensation—Stock Compensation. ASC 718 requires the recognition of compensation expense, using a fair value based method, for costs related to all employee share based payments including stock options. ASC 718 requires companies to estimate the fair value of share-based payment awards on the date of the grant using an option pricing model. The Company recognizes stock-based compensation expense on a straight-line basis over the award’s vesting period, adjusted for estimated forfeitures.
The Company values stock options using the Black-Scholes option-pricing model, which was developed for use in estimating the fair value of traded options that are fully transferable and have no vesting restrictions. In applying the Black-Scholes option pricing model, the Company’s determination of the fair value of the share-based payment award on the date of grant is affected by the Company’s estimated fair value of its common stock, as well as assumptions regarding a number of subjective variables. These variables include, but are not limited to, the Company’s expected stock price volatility over the term of the stock options based on peer companies and the option holders’ actual and projected stock option exercise and pre-vesting employment termination behaviors. Stock options are granted with exercise prices not less than the fair market value of the Company’s common stock at the date of grant. Options generally vest ratably over a four-year period, except those options granted to nonemployees, portions of which may vest immediately or ratably over the period of service. Options expire ten years from the date of grant.
F-58
Table of Contents
The Company accounts for equity instruments issued to nonemployees in accordance with the provisions of ASC 718, Accounting for Stock Compensation, and ASC 505, Accounting for Equity Instruments that are Issued to Other than Employees for Acquiring, or in Conjunction with Selling, Good or Services. Compensation expense for equity instruments granted to nonemployees is measured on the date of performance at the fair value of the consideration received or the fair value of the equity instruments issued, whichever is more reliably measured. Compensation expense for equity instruments granted to nonemployees is periodically remeasured as the underlying equity instruments vest.
Preferred Stock Warrants
Freestanding warrants and other similar instruments related to shares that are redeemable are accounted for in accordance with ASC 480, Distinguishing Liabilities from Equity. The freestanding warrants that are related to the Company’s convertible preferred stock are classified as liabilities on the consolidated balance sheets. The warrants are subject to remeasurement at each balance sheet date and any change in fair value is recognized as a component of other/interest income (expense), net. The Company will continue to adjust the liability for changes in fair value until the earlier of the exercise or expiration of the warrants or the completion of a liquidation event, including the completion of an initial public offering, at which time all preferred stock warrants will be converted into warrants to purchase common stock and, accordingly, the liability will be reclassified to equity.
Impairment of Long-Lived Assets
The Company evaluates it long-lived assets for indicators of possible impairment by comparison of the carrying amount to future net undiscounted cash flows expected to be generated by such assets when events or changes in circumstances indicate the carrying amount of an asset may not be recoverable. Should an impairment exist, the impairment loss would be measured based on the excess carrying value of the asset over the asset’s fair value generally determined by estimates of future discounted cash flows. The Company has not identified any such impairment losses through November 16, 2015.
Comprehensive Loss
Comprehensive loss is defined as the change in equity from transactions and other events and circumstances other than those resulting from investments by owners and distributions to owners. Net loss was equal to comprehensive loss for the periods ended November 16, 2015 and December 31, 2014.
Recent Accounting Pronouncements
In November 2015, the Financial Accounting Standards Board (“FASB”) issued Accounting Standards Update (ASU) 2015-17, Income Taxes (Topic 740): Balance Sheet Classification of Deferred Taxes on the classification of deferred tax assets and liabilities. This ASU, as part of the FASB’s simplification initiative, requires all companies that present a classified balance sheet to present all deferred tax assets and liabilities as noncurrent regardless of the timing of the expected reversal of the related deferred tax asset or liability. This ASU is effective for annual reporting periods beginning after December 16, 2016, but early adoption is permitted. The Company will apply the guidance in fiscal year 2017, and it is not expected to have a material impact on its consolidated financial position or results of operations.
In April 2015, the FASB issued ASU 2015-03, Interest—Imputation of Interest (Subtopic 835-30): Simplifying the Presentation of Debt Issuance Costs. ASU 2015-03 will require an entity to present debt issuance costs in the balance sheet as a direct deduction from the carrying amount of the related debt liability rather than as an asset, consistent with the treatment of debt discounts. The amendment does not change the recognition and measurement guidance for debt issuance costs, and the amortization of debt issuance costs will continue to be reported as interest expense. ASU 2015-03 is effective for annual reporting periods beginning after December 15, 2016. Early adoption is permitted. The new guidance will be applied retrospectively to each prior period presented. The Company is currently evaluating the impact of the future adoption of this standard, but the Company does not expect the adoption to have a material effect on the Company’s consolidated financial statements.
F-59
Table of Contents
In August 2014, the FASB issued ASU No. 2014-15, Presentation of Financial Statements—Going Concern (Subtopic 205-40): Disclosure of Uncertainties about an Entity’s Ability to Continue as a Going Concern. ASU 2014-15 will explicitly require management to assess the entity’s ability to continue as a going concern at each annual and interim period. Related footnote disclosures will be required if conditions give rise to substantial doubt about an entity’s ability to continue as a going concern within one year after the report issuance date. If conditions do not give rise to substantial doubt, no disclosures will be required that are specific to going concern uncertainties. ASU 2014-15 is effective for reporting periods ending after December 15, 2016, and early adoption is permitted. The Company is currently evaluating the impact of the future adoption of this standard, but the Company does not expect the adoption to have a material effect on the Company’s consolidated financial statements.
In June 2014, the FASB issued ASU No. 2014-12, Compensation—Stock Compensation (Topic 718): Accounting for Share-Based Payments When the Terms of an Award Provide that a Performance Target Could be Achieved after the Requisite Service Period. ASU 2014-12 requires that a performance target that affects vesting and that could be achieved after the requisite service period be treated as a performance condition. A reporting entity should apply existing guidance in ASC Topic No. 718, Compensation—Stock Compensation, as it relates to awards with performance conditions that affect vesting to account for such awards. ASU 2014-12 is effective for annual periods beginning after December 15, 2015. Early adoption is permitted. The Company is currently assessing the potential impact of this accounting standard.
In May 2014, the FASB issued ASU 2014-09, Revenue from Contracts with Customers, which impacts the way in which some entities recognize revenue for certain types of transactions. The new standard will become effective for annual periods beginning after December 15, 2018 for private companies and December 15, 2017 for public companies. The Company is currently assessing the potential impact of this accounting standard and the effect it might have on the Company’s revenue recognition policy upon adoption.
3. Fair Value Measurement
The Company measures and reports its cash equivalents and the liability associated with the warrants to purchase convertible preferred stock at fair value. Fair value is defined as the price that would be received to sell an asset or paid to transfer a liability (an exit price) in an orderly transaction between market participants at the reporting date. The accounting guidance establishes a three-tiered hierarchy, which prioritizes the inputs used in the valuation methodologies in measuring fair value:
Level 1—Quoted prices in active markets for identical assets or liabilities.
Level 2—Inputs other than Level 1 that are observable, either directly or indirectly, such as quoted prices in markets that are not active, or other inputs that are observable or can be corroborated by observable market data for substantially the full term of the assets or liabilities.
Level 3—Unobservable inputs that are supported by little or no market activity and that are significant to the fair value of the assets or liabilities.
At November 16, 2015 and December 31, 2014, the Company’s cash and cash equivalents have been valued in accordance with the fair value hierarchy specified in ASC 820, Fair Value Measurements as Level 1 assets. The Company’s warrants are classified within Level 3 of the fair value hierarchy as they are measured using the Black-Scholes option pricing model.
Preferred Stock Warrants
Preferred stock warrants are accounted for in accordance with ASC 480, Distinguishing Liabilities from Equity. Under the guidance, the preferred stock warrants are classified as liabilities on the consolidated balance sheet. The warrants are subject to re-measurement at each balance sheet date and any change in fair value is recognized as a component of other/interest income (expense), net. The fair value of these warrants is determined by the Company based on the Black-Scholes option valuation model, which utilizes the estimated fair value of the underlying convertible preferred stock at the valuation measurement date, the remaining contractual term of
F-60
Table of Contents
the warrant, risk-free interest rates, and expected dividends and expected volatility of the price of the underlying convertible preferred stock. The Company will continue to adjust the liability for changes in fair value until the earlier of the exercise or expiration of the warrants or the completion of a liquidation event, at which time all convertible preferred stock warrants will be converted into warrants to purchase common stock and, accordingly, the liability will be reclassified into stockholders’ deficit.
Because the warrants are measured at fair value on a recurring basis, the measurement is subject to the provisions of ASC 820. The measurement of the warrants falls under Level 3 of the fair value measurement hierarchy. The warrants were issued during the period ended November 16, 2015 and remain outstanding as of that date. There was no material change in the value of the warrants from issuance through the remeasurement date.
The fair value of the preferred stock warrant liability measured at fair value using Level 3 inputs was $48.
The following table illustrates a reconciliation of the beginning and ending balances of the warrant liability measured under Level 3 of the fair value measurement hierarchy of ASC 820 (in thousands):
| Fair value at December 31, 2014 |
$ | — | ||
| Issuance of warrants in connection with issuance of line of credit |
48 | |||
| Change in fair value included in earnings |
— | |||
|
|
|
|||
| Fair value at November 16, 2015 |
$ | 48 | ||
|
|
|
There were no financial assets measured at fair value on a recurring basis as of November 16, 2015, and there were no financial assets or liabilities measured at fair value on a recurring basis as of December 31, 2014.
4. Balance Sheet Components
Property and Equipment, net
Property and equipment, net consists of the following (in thousands):
| November 16, 2015 |
December 31, 2014 |
|||||||
| Computer equipment and software |
$ | 588 | $ | 250 | ||||
| Furniture and fixtures |
164 | 12 | ||||||
| Leasehold improvements |
211 | 10 | ||||||
|
|
|
|
|
|||||
| 963 | 272 | |||||||
| Less: Accumulated depreciation |
(246 | ) | (76 | ) | ||||
|
|
|
|
|
|||||
| $ | 717 | $ | 196 | |||||
|
|
|
|
|
|||||
Depreciation expense for the periods ended November 16, 2015 and December 31, 2014 was $170,000 and $62,000, respectively.
Accrued Liabilities
Accrued liabilities consist of the following (in thousands):
| November 16, 2015 |
December 31, 2014 |
|||||||
| Payroll and employee related expenses |
$ | 711 | $ | 327 | ||||
| Other accruals |
198 | 245 | ||||||
|
|
|
|
|
|||||
| $ | 909 | $ | 572 | |||||
|
|
|
|
|
|||||
F-61
Table of Contents
5. Commitments and Contingencies
Leases
The Company has operating leases agreements for its primary headquarters in the United States and research and development facilities in India and Pakistan which expire at various dates through July 2020. The Company recognizes rent expense on a straight-line basis over the lease term and records the difference between cash rent payments and the recognition of rent expense as a deferred rent liability.
Rent expense for the periods ended November 16, 2015 and December 31, 2014 was $489,000 and $186,000, respectively.
Future minimum lease payments under non-cancelable operating leases are as follows (in thousands) :
| Operating Leases |
||||
| Year Ending December 31, |
||||
| 2015 (November 17 - December 31, 2015) |
$ | 56 | ||
| 2016 |
604 | |||
| 2017 |
607 | |||
| 2018 |
613 | |||
| 2019 |
617 | |||
| 2020 |
317 | |||
|
|
|
|||
| Total minimum lease payments |
$ | 2,814 | ||
|
|
|
|||
Legal contingencies
The Company is subject to legal proceedings, claims and litigation arising in the ordinary course of business, including intellectual property litigation. The Company accrues a liability for such matters when it is probable that future expenditures will be made and such expenditures can be reasonably estimated.
Indemnification
The Company enters into standard indemnification arrangements in the ordinary course of business. Pursuant to these arrangements, the Company indemnifies, holds harmless, and agrees to reimburse the indemnified parties for losses suffered or incurred by the indemnified party, in connection with any trade secret, copyright, patent or other intellectual property infringement claim by any third-party with respect to its technology. The term of these indemnification agreements is generally perpetual. The maximum potential amount of future payments the Company could be required to make under these agreements is not determinable because it involves claims that may be made against the Company in the future, but have not yet been made. The Company has not incurred costs to defend lawsuits or settle claims related to these indemnification agreements.
The Company has entered into indemnification agreements with its directors and officers that may require the Company to indemnify its directors and officers against liabilities that may arise by reason of their status or service as directors or officers, other than liabilities arising from willful misconduct of the individual.
No liability associated with such indemnifications has been recorded at November 16, 2015 and December 31, 2014.
Line of Credit
In September 2015, the Company entered into a line of credit agreement with a bank in an aggregate principal amount of up to $6,000 at an interest rate of 4%. The line of credit facility expires in 2019. The
F-62
Table of Contents
Company incurred $4,000 of line of credit fees associated with entering into the agreement. Borrowings made under this line of credit are collateralized by all assets of the Company except for intellectual property. At November 16, 2015, the Company was in compliance with all covenants related to the line of credit facility. At November 16, 2015 there was $2,500,000 outstanding under this agreement.
6. Common Stock
The Company’s Certificate of Incorporation, as amended, authorizes the Company to issue 43,000,000 shares of $0.0001 par value common stock.
Common stockholders are entitled to dividends when and if declared by the Board of Directors, subject to the prior rights of the preferred stockholders. As of November 16, 2015, no dividends have been declared. The holder of each share of common stock is entitled to one vote. The common stockholders voting as a class are entitled to elect two members to the Company’s Board of Directors.
In February 2015, the Company’s board of directors approved a two-for-one stock split of the outstanding common stock, preferred stock and options. All share numbers, share prices and exercise prices have been adjusted within these consolidated financial statements to reflect the stock split.
Certain common stock option holders have the right to exercise unvested options, subject to a repurchase right held by the Company at the lower of the original exercise price or the then current fair market value, in the event of voluntary or involuntary termination of employment of the stockholder. The proceeds related to unvested common stock are recorded as liabilities until the stock vests, at which point they are transferred to equity. Shares issued upon the early exercise of options are legally issued and outstanding and are included in issued and outstanding shares.
At November 16, 2015 and December 31, 2014, the Company had 261,459 and 1,085,375 shares of common stock subject to repurchase, respectively.
In January 2012, the Company issued the founder 10,000,000 restricted shares of common stock. The Company has the right, but not the obligation, to repurchase unvested shares of this restricted common stock upon the termination of the individual’s service to the Company at the lesser of the fair market value at the time the option to purchase is exercised or the original purchase price. The right of repurchase by the Company is subject to vesting of the shares, which is over a four-year period from the date of stock purchase agreement. At November 16, 2015 and December 31, 2014, 625,000 and 2,708,333 shares of common stock issued to the founder are subject to repurchase, respectively.
At November 16, 2015, the Company has reserved 861,033 shares of common stock for issuance upon conversion of preferred stock and exercise of stock options.
7. Convertible Preferred Stock
The Company has authorized 20,669,046 shares of convertible preferred stock (“preferred stock”), designated in series, with the rights and preferences of each designated series to be determined by the Company’s Board of Directors.
A summary of preferred stock at November 16, 2015 consists of the following:
| Series |
Shares Authorized |
Shares Issued and Outstanding |
Carrying Amount |
Aggregate Liquidation Preference |
||||||||||||
| A |
8,747,786 | 8,747,786 | $ | 6,267 | $ | 6,482 | ||||||||||
| B |
8,808,052 | 8,808,052 | 19,893 | 20,000 | ||||||||||||
| B-1 |
3,113,208 | 3,087,480 | 8,973 | 9,000 | ||||||||||||
|
|
|
|
|
|
|
|
|
|||||||||
| 20,669,046 | 20,643,318 | $ | 35,133 | $ | 35,483 | |||||||||||
|
|
|
|
|
|
|
|
|
|||||||||
F-63
Table of Contents
The rights, preferences and privileges of the preferred stock are as follows:
Voting
The holders of preferred stock are entitled to vote on all matters and are entitled to the number of votes equal to the number of shares of common stock into which the shares of preferred stock could be converted to as of the record date.
Dividends
The holders of shares of preferred stock are entitled to receive noncumulative dividends when, as, and if declared by the Board of Directors. The dividends are at an annual rate of $0.0593 per share for Series A preferred stock, $0.1817 per share for Series B preferred stock, and $0.2332 per share for Series B-1 preferred stock. No dividends have been declared from inception through November 16, 2015.
Conversion
Convertible preferred stock shall have the right to convert at any time into shares of common stock at the applicable conversion ration arrived at by dividing the original issuance price by the conversion price (currently $0.7410, $2.2707, and $2.915 per share for Series A, Series B, and Series B-1, respectively). Each share of preferred stock shall automatically be converted into fully-paid, non-assessable shares of common stock at the then effective conversion rate for such share (i) immediately prior to the closing of a firm commitment underwritten public offering of at least $50.0 million at a price per share of at least $11.6600, or (ii) into shares of common stock upon the consent of at least a majority of the outstanding preferred stockholders voting as a single class.
Liquidation
In the event of any liquidation, dissolution or winding up of the Company, either voluntary or involuntary, the holders of the preferred stock shall be entitled to receive, prior and in preference to any distribution of any of the assets of the Company to the holders of the common stock by reason of their ownership of such stock, an amount per share for each share of preferred stock held by them equal to the sum of (i) the liquidation preference specified for each series (currently $0.7410, $2.2707, and $2.915 per share for Series A, Series B, and Series B-1, respectively), and (ii) all dividends declared but unpaid thereon (if any). The remaining funds are distributed to common shareholders.
Preferred Stock Warrants
In conjunction with the bank line of credit, the Company issued fully vested warrants to purchase 25,728 shares of Series B-1 preferred stock at an exercise price of $2.92 per share, expiring in September 2025. The fair value of the warrants was estimated on the date of issuance at $48 using the Black-Scholes option pricing model.
The Company used a Black-Sholes option pricing model to value the preferred stock warrants at period end and upon initial adoption of the standard. The fair value of the warrants was estimated using the following range of assumptions:
| As of November 16, 2015 |
||||
| Expected term (years) |
5.00 | |||
| Volatility |
55.0 | % | ||
| Risk free interest rate |
1.43 | % | ||
| Dividend yield |
0 | % | ||
F-64
Table of Contents
Convertible Bridge Note
In May 2014, the Company issued a convertible promissory note totaling $500,000. The note bore interest at 0.5% per annum and had conversion rights contingent upon the Company’s next equity financing. The principal amount and interest was to automatically convert into shares of preferred stock at the next equity financing at a predetermined conversion. In connection with the Company’s issuance of Series B convertible preferred stock in 2014, the principal of $500,000 and accrued cash interest of $68,000 was converted into 231,824 shares of Series B convertible preferred stock.
8. Stock Option Plans
The Company has issued options under the 2012 Equity Incentive Plan (the “2012 Plan”), which was adopted in January 2012. Under the 2012 Plan, the Company has the ability to issue incentive stock options, nonqualified stock options, and stock purchase rights. The Board of Directors has the authority to approve the employees and nonemployees to whom stock awards are granted and determine the terms of each award. Such options are to be exercisable at prices, as determined by the Board of Directors, generally equal to the fair value of the Company’s common stock at the date of grant and have a term of ten years. Options granted to employees generally vest over a four-year period. Options are exercisable upon vesting and vested options generally expire 90 days after termination of the optionee’s employment or relationship as a consultant or director, unless otherwise extended by the terms of the stock option agreement. Any unvested options or vested but unexercised options are returned to the Company.
Activity under the 2012 Plan is set forth below:
| Number of Shares Outstanding |
Weighted Average Exercise Price |
Weighted Average Contractual Remaining Life (years) |
Aggregate Intrinsic Value |
|||||||||||||
| Balances, December 31, 2013 |
2,051,414 | $ | 0.10 | 9.8 | $ | — | ||||||||||
| Options granted |
4,366,190 | 0.23 | ||||||||||||||
| Options exercised |
(663,582 | ) | 0.28 | — | ||||||||||||
| Options forfeited |
(605,918 | ) | 0.12 | |||||||||||||
|
|
|
|
|
|||||||||||||
| Balances, December 31, 2014 |
5,148,104 | 0.18 | 9.4 | 676 | ||||||||||||
| Options granted |
4,167,039 | 0.41 | ||||||||||||||
| Options exercised |
(736,268 | ) | 0.17 | 88 | ||||||||||||
| Options forfeited |
(1,657,917 | ) | 0.19 | |||||||||||||
|
|
|
|
|
|
|
|||||||||||
| Balances, November 16, 2015 |
6,920,958 | $ | 0.32 | 9.2 | $ | 47,222 | ||||||||||
|
|
|
|
|
|
|
|
|
|||||||||
| Options exercisable, vested, and expected to vest as of November 16, 2015 |
1,327,237 | $ | 0.20 | 8.5 | $ | 9,215 | ||||||||||
|
|
|
|
|
|
|
|
|
|||||||||
The intrinsic value of stock options exercised is the difference between the exercise price of the stock option awards and the estimated fair value of the Company’s underlying common stock as of the exercise date.
The weighted-average fair values on the date of grant for options granted during the periods ended November 16, 2015 and December 31, 2014 were $0.20 and $0.14, respectively. At November 16, 2015 and December 31, 2014, 1,327,237 and 641,811 shares of options currently exercisable were vested, with a total fair value of $259,000 and $98,000, respectively.
F-65
Table of Contents
Stock-Based Compensation
Stock-based compensation expense related to options granted to employees for the periods ended November 16, 2015 and December 31, 2014 is as follows (in thousands):
| November 16, 2015 |
December 31, 2014 |
|||||||
| Research and development |
$ | 166 | $ | 36 | ||||
| Sales and marketing |
74 | — | ||||||
| General and administrative |
10 | 1 | ||||||
|
|
|
|
|
|||||
| $ | 250 | $ | 37 | |||||
|
|
|
|
|
|||||
As of November 16, 2015, there was $841,000 of total unrecognized compensation cost related to unvested stock options. That cost is expected to be recognized over a weighted average period of 3.2 years.
Stock-based compensation expense related to options granted to non-employees for the periods ended November 16, 2015 and December 31, 2014 is as follows (in thousands):
| November 16, 2015 |
December 31, 2014 |
|||||||
| Research and development |
$ | 112 | $ | — | ||||
| Sales and marketing |
178 | 27 | ||||||
| General and administrative |
716 | 3 | ||||||
|
|
|
|
|
|||||
| $ | 1,006 | $ | 30 | |||||
|
|
|
|
|
|||||
Stock-Based Awards to Employees
All stock-based compensation granted to employees and directors is measured at the grant date fair value of the award. The Company estimated the fair value of its common stock utilizing periodic contemporaneous valuations prepared by an independent third-party appraiser based upon several factors, including its operating and financial performance, progress and milestones attained in its business, and past sales of convertible preferred stock.
The Company estimates the fair value of each option award on the date of grant using the Black-Scholes option-pricing model and using the assumptions noted in the table below. Expected volatility is based upon the historical volatility of a peer group of publicly traded companies. The expected term represents the period that the Company’s share-based awards are expected to be outstanding. The expected term assumptions were determined based on the vesting terms, exercise terms and contractual lives of the options. The risk-free rate for the expected term of the options is based on U.S. Treasury zero-coupon issues at the time of grant. The weighted average assumptions used to value options granted were as follows:
| November 16, 2015 |
December 31, 2014 |
|||||||
| Expected term (years) |
5.00 | 5.00 | ||||||
| Volatility |
55 | % | 55 | % | ||||
| Risk free interest rate |
1.43 | % | 1.37 | % | ||||
| Dividend yield |
0 | % | 0 | % | ||||
The Company recognized employee stock-based compensation expense for the periods ended November 16, 2015 and December 31, 2014, which was calculated based upon awards ultimately expected to vest, and thus, this expense was reduced for estimated forfeitures. Forfeitures are estimated at the time of grant and revised, if necessary, in subsequent periods if actual forfeitures differ from those estimates.
F-66
Table of Contents
Stock-Based Awards to Non-employees
The Company granted options to purchase shares of common stock to non-employees in conjunction with services performed. The Company revalues the unvested portion of stock-based compensation using the Black-Scholes option-pricing model until performance is complete. As a result, the stock-based compensation will fluctuate as the fair value of the Company’s common stock fluctuates. During the periods ended November 16, 2015 and December 31, 2014, the Company granted options to purchase 105,039 and 219,190 shares of common stock, respectively, to non-employees in conjunction with services performed. The weighted average assumptions used to value options granted to non-employees are as follows:
| November 16, 2015 |
December 31, 2014 |
|||||||
| Expected term (years) |
0.10 | 10.00 | ||||||
| Volatility |
55 | % | 55 | % | ||||
| Risk free interest rate |
1.43 | % | 1.37 | % | ||||
| Dividend yield |
0 | % | 0 | % | ||||
9. Income Taxes
Deferred tax assets (liabilities) consist of the following (in thousands):
| November 16, 2015 |
December 31, 2014 |
|||||||
| Current deferred tax assets |
||||||||
| Accruals/reserves |
$ | 110 | $ | 102 | ||||
| Stock-based compensation |
413 | 12 | ||||||
| State income taxes |
— | — | ||||||
|
|
|
|
|
|||||
| Gross current deferred tax assets |
523 | 114 | ||||||
|
|
|
|
|
|||||
| Non-current deferred tax assets |
||||||||
| Deferred revenue |
850 | 3 | ||||||
| Net operating loss carryforwards |
12,893 | 5,438 | ||||||
| R&D credits |
398 | 398 | ||||||
|
|
|
|
|
|||||
| Gross non-current deferred tax assets |
14,141 | 5,839 | ||||||
|
|
|
|
|
|||||
| Total gross deferred tax asset |
14,664 | 5,953 | ||||||
| Valuation allowance |
(14,664 | ) | (5,953 | ) | ||||
|
|
|
|
|
|||||
| Net deferred tax assets |
— | — | ||||||
|
|
|
|
|
|||||
Management believes that, based on a number of factors, it is more likely than not that the deferred tax assets will not be utilized, such that a full valuation allowance has been recorded.
Total unrecognized income tax benefits as of November 16, 2015 related to uncertain tax positions were $141,000. The Company does not anticipate the total amount of unrecognized tax benefits will significantly increase or decrease in the next 12 months.
The Company’s policy is to include interest and penalties related to unrecognized tax benefits within the provision for taxes. Management determined that no accrual for interest and penalties was required as of November 16, 2015.
As of November 16, 2015, the Company had approximately $32,434,000 of federal and $32,331,000 of state net operating loss carryforwards available to offset future taxable income which expire in varying amounts beginning in 2022, respectively. Some of these net operating loss carry forwards may be subject to annual limitations under Internal Revenue Code Section 382.
F-67
Table of Contents
As of November 16, 2015, the Company had research and development credit carryforwards of approximately $468,000 and $94,000 available to reduce future taxable income, if any, for both federal and California state income tax purposes, respectively. The federal credit carryforwards expire beginning 2024 and California credits can be carried forward indefinitely. The Federal research credit expired as of December 31, 2014 and was not reenacted until post November 16, 2015.
The Company files income tax returns in the U.S. federal jurisdiction and various state and foreign jurisdictions. In the normal course of business, the Company is subject to examination by taxing authorities through the world. These audits include, among other things, questioning the timing and amount of deductions; the nexus of income among various tax jurisdictions; compliance with federal, state, local, and foreign tax laws. The Company is not currently under audit by the Internal Revenue Service or other similar state, local, and foreign authorities. All tax years remain open to examination by major taxing jurisdictions to which the Company is subject.
10. Retirement Plans
The Company has a 401(k) plan to provide tax deferred salary deductions for all eligible employees. Participants may make voluntary contributions to the 401(k) plan, limited by certain Internal Revenue Service restrictions. The Company is responsible for the administrative costs of the 401(k) plan. The Company does not match employee contributions.
11. Related Parties
The Company has a revenue contract with a customer who is also an investor in Series B convertible preferred stock. As of November 16, 2015 the Company has recognized revenue of approximately $288,000 under this agreement and there is $225,000 of accounts receivable outstanding.
12. Subsequent Events
On November 16, 2015, the Company was acquired by Blue Coat, Inc. in an all-stock purchase for $280,000,000.
The Company has evaluated subsequent events through January 28, 2016, which represents the date the consolidated financial statements were issued.
F-68
Table of Contents
UNAUDITED PRO FORMA CONDENSED COMBINED FINANCIAL INFORMATION
On November 16, 2015 the Company completed the acquisition of Elastica, Inc., a leader in the Cloud Access Security Broker (“CASB”) segment. The Company believes the acquisition will enable it to expand in the CASB segment.
The following unaudited pro forma condensed combined financial information is based on the historical financial statements of the Company and Elastica and the assumptions and adjustments described in the accompanying notes to the unaudited pro forma condensed combined financial information.
The allocations of the Elastica preliminary purchase price to the identifiable intangible assets used in the unaudited pro forma condensed combined financial information are based on preliminary third-party valuation reports, estimates and currently available information.
The unaudited pro forma condensed combined financial information is presented for illustration purposes only and is not intended to represent what the Company’s results of operations would actually have been if the acquisition had occurred on those dates or to project the Company’s results of operations for any future period. The unaudited pro forma condensed combined financial information does not include any adjustments for liabilities resulting from integration planning. The Company is in the process of assessing the costs associated with integration.
The unaudited pro forma condensed combined financial information should be read in conjunction with the accompanying notes to the unaudited pro forma condensed combined information as well as the Company’s and Elastica’s historical consolidated financial statements and accompanying notes included in this prospectus.
The unaudited pro forma condensed combined financial information included herein does not give effect to any potential cost reductions or other operating efficiencies that could result from the acquisition, including but not limited to, those associated with potential (i) reductions of corporate overhead, (ii) eliminations of duplicate functions and (iii) increased operational efficiencies through the adoption of best practices and capabilities from each company.
The unaudited pro forma condensed combined statement of operations for the year ended April 30, 2016, has been prepared to reflect the acquisition of Elastica as if it had occurred on May 1, 2015, the first day of the Company’s 2016 fiscal year. The unaudited pro forma condensed combined statement of operations was derived from the Company’s audited historical consolidated statements of operations for the period from May 1, 2015 through May 22, 2015 and the period from May 23, 2015 through April 30, 2016. Although the period from May 1, 2015 to May 22, 2015 relates to the Predecessor and the period from May 23, 2015 to April 30, 2016 relates to the Successor, in order to assist in the period to period comparison, we have combined these periods as a sum of the amounts without any other adjustments and refer to the combined period as the combined year ended April 30, 2016. In addition, the unaudited pro forma condensed combined statement of operations was derived from Elastica’s unaudited statements of operations for the period April 1, 2015 through November 16, 2015. The Company’s fiscal year end is April 30, while Elastica’s fiscal year end is December 31. Accordingly, the Company has aligned Elastica’s reporting period to the Company’s fiscal year.
F-69
Table of Contents
UNAUDITED PRO FORMA CONDENSED COMBINED STATEMENT OF OPERATIONS
(in thousands)
| Blue Coat, Inc. | Elastica, Inc. | |||||||||||||||||||
| Year Ended April 30, 2016 |
Period from April 1, 2015 to November 16, 2015 |
Pro Forma Adjustments |
Pro Forma Combined |
|||||||||||||||||
| Net revenue: |
||||||||||||||||||||
| Product |
$ | 313,819 | $ | — | $ | — | $ | 313,819 | ||||||||||||
| Service and subscription |
284,518 | 381 | (343 | ) | A | 284,556 | ||||||||||||||
|
|
|
|
|
|
|
|
|
|||||||||||||
| Total net revenue |
598,337 | 381 | (343 | ) | 598,375 | |||||||||||||||
|
|
|
|
|
|
|
|
|
|||||||||||||
| Cost of net revenue: |
||||||||||||||||||||
| Product |
135,806 | — | — | 135,806 | ||||||||||||||||
| Service and subscription |
69,711 | 65 | 4,857 | B | 74,633 | |||||||||||||||
|
|
|
|
|
|
|
|
|
|||||||||||||
| Total cost of net revenue |
205,517 | 65 | 4,857 | 210,439 | ||||||||||||||||
|
|
|
|
|
|
|
|
|
|||||||||||||
| Gross profit |
392,820 | 316 | (5,200 | ) | 387,936 | |||||||||||||||
|
|
|
|
|
|
|
|
|
|||||||||||||
| Operating expenses: |
||||||||||||||||||||
| Sales and marketing |
241,118 | 6,748 | — | 247,866 | ||||||||||||||||
| Research and development |
131,367 | 9,093 | — | 140,460 | ||||||||||||||||
| General and administrative |
148,169 | 2,473 | (4,408 | ) | C | 146,234 | ||||||||||||||
| Amortization of intangible assets |
122,757 | — | 104 | B | 122,861 | |||||||||||||||
| Change in fair value of acquisition-related earn-out liability |
(970 | ) | — | — | (970 | ) | ||||||||||||||
| Restructuring and other charges |
2,857 | — | — | 2,857 | ||||||||||||||||
|
|
|
|
|
|
|
|
|
|||||||||||||
| Total operating expenses |
645,298 | 18,314 | (4,304 | ) | 659,308 | |||||||||||||||
|
|
|
|
|
|
|
|
|
|||||||||||||
| Operating income (loss) |
(252,478 | ) | (17,998 | ) | (896 | ) | (271,372 | ) | ||||||||||||
| Interest income |
144 | 10 | — | 154 | ||||||||||||||||
| Interest expense |
(103,372 | ) | — | (5,447 | ) | D | (108,819 | ) | ||||||||||||
| Debt extinguishment and refinancing costs |
(3,406 | ) | — | 3,406 | C | — | ||||||||||||||
| Other expense, net |
(1,108 | ) | — | — | (1,108 | ) | ||||||||||||||
|
|
|
|
|
|
|
|
|
|||||||||||||
| Loss before income taxes |
(360,220 | ) | (17,988 | ) | (2,937 | ) | (381,145 | ) | ||||||||||||
| Income tax provision (benefit) |
(71,139 | ) | 31 | (1,116 | ) | E | (72,224 | ) | ||||||||||||
|
|
|
|
|
|
|
|
|
|||||||||||||
| Net loss |
$ | (289,081 | ) | $ | (18,019 | ) | $ | (1,821 | ) | $ | (308,921 | ) | ||||||||
|
|
|
|
|
|
|
|
|
|||||||||||||
| * | Net loss per share information is not presented for the year ended April 30, 2016 due to changes in capital structure resulting from the Bain Acquisition on May 22, 2015. |
F-70
Table of Contents
NOTES TO UNAUDITED PRO FORMA CONDENSED COMBINED FINANCIAL INFORMATION
Note 1. Basis of Pro Forma Presentation
On November 16, 2015 the Company completed the acquisition of Elastica, Inc., a leader in the CASB segment. The total purchase price was approximately $239.2 million consisting of cash consideration. To facilitate the acquisition, the Company increased by $225.0 million the aggregate principal amount of senior secured term loans under its credit facilities.
The unaudited pro forma condensed combined statements of operations for the year ended April 30, 2016, has been prepared to reflect the acquisition of Elastica as if it had occurred on May 1, 2015, the first day of the Company’s 2016 fiscal year. The unaudited pro forma condensed combined statement of operations was derived from the Company’s audited historical consolidated statement of operations for the period from May 1, 2015 through May 22, 2015 and the period from May 23, 2015 through April 30, 2016. Although the period from May 1, 2015 to May 22, 2015 relates to the Predecessor and the period from May 23, 2015 to April 30, 2016 relates to the Successor, in order to assist in the period to period comparison, we have combined these periods as a sum of the amounts without any other adjustments and refer to the combined period as the combined year ended April 30, 2016. In addition, the unaudited pro forma condensed combined statements of operations were derived from Elastica’s unaudited statement of operations for the period April 1, 2015 through November 16, 2015. The Company’s fiscal year end is April 30, while Elastica’s fiscal year end is December 31. Accordingly, the Company has aligned Elastica’s reporting period to the Company’s fiscal year.
The historical consolidated results of operations of Elastica have been prepared in accordance with U.S. GAAP.
Note 2. Unaudited Pro Forma Condensed Combined Statement of Operations Adjustments
The unaudited pro forma condensed combined statement of operations adjustments include:
| A. | Adjustments to service and subscription revenue to reflect (i) the impact of the write down of deferred revenue acquired, and (ii) the reversal of the impact of the write-down of deferred revenue actually incurred over the periods presented. |
| B. | Adjustments to reflect the net impact of the amortization of intangible assets acquired. The estimated amortization for each period reflects the amounts and estimated useful lives as recorded in purchase accounting. Intangible assets acquired and their estimated useful lives are shown below: |
| Intangible Type |
Fair Value (in thousands) |
Useful Life | ||||||
| Backlog |
$ | 100 | 0.5 years | |||||
| Trade names |
300 | 2 years | ||||||
| Customer relationships |
250 | 6 years | ||||||
| Developed technology |
53,800 | 6 years | ||||||
| C. | Adjustments to eliminate transaction costs incurred that are nonrecurring and directly attributable to the Elastica acquisition. |
| D. | Adjustments to reflect the net additional interest expense incurred related to the increase of $225.0 million in the aggregate principal amount of senior secured term loans under its credit facilities, as if the increase had occurred on May 1, 2015. |
| E. | Adjustments to reflect the estimated impact to the income tax provision (benefit) for the adjustments identified. |
F-71
Table of Contents
Consolidated financial statements of
Perspecsys Inc.
As of and the years ended December 31, 2014 and 2013, and as of
June 30, 2015 (unaudited) and the six months periods ended
June 30, 2015 and 2014 (unaudited)
(Expressed in U.S. dollars)
F-72
Table of Contents
Perspecsys Inc.
As of and the years ended December 31, 2014 and 2013, and as of June 30, 2015 (unaudited) and the six months periods ended June 30, 2015 and 2014 (unaudited)
Table of contents
| F-74 | ||||
| F-75 | ||||
| Consolidated statements of operations and comprehensive loss |
F-76 | |||
| F-77 | ||||
| F-78 | ||||
| F-79 |
F-73
Table of Contents
Deloitte LLP
5140 Yonge Street
Suite 1700
Toronto ON M2N 6L7
Canada
Tel: 416-601-6150
Fax: 416-601-6151
www.deloitte.ca
To the Board of Directors of
Perspecsys Inc.
We have audited the accompanying consolidated financial statements of Perspecsys Inc. and its subsidiaries (the “Company”), which comprise the consolidated balance sheets as of December 31, 2014 and 2013, and the related consolidated statements of operations and comprehensive loss, deficiency, and cash flows for the years then ended, and the related notes to the consolidated financial statements.
Management’s Responsibility for the Financial Statements
Management is responsible for the preparation and fair presentation of these consolidated financial statements in accordance with accounting principles generally accepted in the United States of America; this includes the design, implementation and maintenance of internal control relevant to the preparation and fair presentation of consolidated financial statements that are free from material misstatement, whether due to fraud or error.
Auditor’s Responsibility
Our responsibility is to express an opinion on these consolidated financial statements based on our audits. We conducted our audits in accordance with auditing standards generally accepted in the United States of America. Those standards require that we comply with ethical requirements and plan and perform the audit to obtain reasonable assurance about whether the consolidated financial statements are free from material misstatement.
An audit involves performing procedures to obtain audit evidence about the amounts and disclosures in the consolidated financial statements. The procedures selected depend on the auditor’s judgment, including the assessment of the risks of material misstatement of the consolidated financial statements, whether due to fraud or error. In making those risk assessments, the auditor considers internal control relevant to the company’s preparation and fair presentation of the consolidated financial statements in order to design audit procedures that are appropriate in the circumstances, but not for the purpose of expressing an opinion on the effectiveness of the company’s internal control. Accordingly, we express no such opinion. An audit also includes evaluating the appropriateness of accounting policies used and the reasonableness of significant accounting estimates made by management, as well as evaluating the overall presentation of the consolidated financial statements.
We believe that the audit evidence we have obtained in our audits is sufficient and appropriate to provide a basis for our audit opinion.
Opinion
In our opinion, the consolidated financial statements referred to above present fairly, in all material respects, the financial position of Perspecsys Inc. and its subsidiaries as of December 31, 2014 and 2013, and the results of their operations and their cash flows for the years then ended in accordance with accounting principles generally accepted in the United States of America.
/s/ Deloitte LLP
Chartered Professional Accountants
Licensed Public Accountants
Toronto, Canada
March 10, 2016
F-74
Table of Contents
Perspecsys Inc.
(expressed in US dollars)
| June 30, 2015 |
December 31, 2014 |
December 31, 2013 |
||||||||||
| (Unaudited) | ||||||||||||
| $ | $ | $ | ||||||||||
| Assets |
||||||||||||
| Current assets |
||||||||||||
| Cash |
1,058,541 | 3,920,223 | 5,847,681 | |||||||||
| Accounts receivable |
1,171,072 | 2,593,555 | 415,692 | |||||||||
| Other receivables |
115,255 | 60,234 | 52,993 | |||||||||
| Prepaid expenses and deposits |
234,453 | 135,674 | 107,396 | |||||||||
|
|
|
|
|
|
|
|||||||
| Total current assets |
2,579,321 | 6,709,686 | 6,423,762 | |||||||||
| Property and equipment (Note 3) |
338,685 | 346,328 | 72,750 | |||||||||
| Long-term deposits |
22,582 | 23,036 | 8,697 | |||||||||
|
|
|
|
|
|
|
|||||||
| Total assets |
2,940,588 | 7,079,050 | 6,505,209 | |||||||||
|
|
|
|
|
|
|
|||||||
| Liabilities |
||||||||||||
| Current liabilities |
||||||||||||
| Accounts payable and accrued liabilities |
952,012 | 1,220,647 | 490,418 | |||||||||
| Income taxes payable |
— | — | 27,548 | |||||||||
| Deferred revenue |
3,087,205 | 2,509,297 | 894,701 | |||||||||
| Convertible debentures (Note 6) |
7,340,583 | 6,958,487 | — | |||||||||
| Current portion, obligations under capital lease (Note 4) |
35,571 | 35,571 | — | |||||||||
| Current portion, note payable (Note 5) |
104,510 | 106,672 | — | |||||||||
|
|
|
|
|
|
|
|||||||
| Total current liabilities |
11,519,881 | 10,830,674 | 1,412,667 | |||||||||
| Long-term portion, deferred rent |
44,020 | 40,745 | — | |||||||||
| Long-term portion, deferred revenue |
2,145,346 | 1,971,591 | 629,612 | |||||||||
| Long-term portion, obligations under capital lease (Note 4) |
36,470 | 53,562 | — | |||||||||
| Long-term note payable (Note 5) |
337,419 | 387,119 | 487,541 | |||||||||
|
|
|
|
|
|
|
|||||||
| Total liabilities |
14,083,136 | 13,283,691 | 2,529,820 | |||||||||
|
|
|
|
|
|
|
|||||||
| Commitments and contingencies (Note 8, 11) |
||||||||||||
| Deficiency |
||||||||||||
| Common shares |
357 | 357 | 36 | |||||||||
| Class A preferred shares |
1,813 | 1,813 | 3,997 | |||||||||
| Class B preferred shares |
7,975 | 7,975 | 9,550 | |||||||||
| Warrants |
448,442 | 448,442 | 484,696 | |||||||||
| Accumulated other comprehensive income (loss) |
905,177 | 905,177 | (613,463 | ) | ||||||||
| Additional Paid in Capital |
14,885,045 | 14,850,728 | 21,109,672 | |||||||||
| Accumulated deficit |
(32,688,126 | ) | (27,715,902 | ) | (17,019,099 | ) | ||||||
| Non-controlling interest (Note 7) |
5,296,769 | 5,296,769 | — | |||||||||
|
|
|
|
|
|
|
|||||||
| Total deficiency |
(11,142,548 | ) | (6,204,641 | ) | 3,975,389 | |||||||
|
|
|
|
|
|
|
|||||||
| Total liabilities and deficiency |
2,940,588 | 7,079,050 | 6,505,209 | |||||||||
|
|
|
|
|
|
|
|||||||
See accompanying notes to consolidated financial statements.
F-75
Table of Contents
Perspecsys Inc.
Consolidated statements of operations and comprehensive loss
(expressed in US dollars)
| Six months ended June 30, 2015 |
Six months ended June 30, 2014 |
Year ended December 31, 2014 |
Year ended December 31, 2013 |
|||||||||||||
| (Unaudited) | (Unaudited) | |||||||||||||||
| $ | $ | $ | $ | |||||||||||||
| Revenue |
2,015,940 | 845,565 | 2,193,874 | 1,028,499 | ||||||||||||
| Cost of revenue |
471,932 | 411,788 | 818,758 | 256,356 | ||||||||||||
|
|
|
|
|
|
|
|
|
|||||||||
| Gross profit |
1,544,008 | 433,777 | 1,375,116 | 772,143 | ||||||||||||
|
|
|
|
|
|
|
|
|
|||||||||
| Operating expenses |
||||||||||||||||
| Sales and marketing |
3,589,995 | 2,861,415 | 6,419,973 | 3,487,856 | ||||||||||||
| Research and development |
1,271,951 | 1,364,251 | 2,479,288 | 1,779,565 | ||||||||||||
| General and administration |
1,153,162 | 1,117,599 | 2,456,825 | 1,536,183 | ||||||||||||
|
|
|
|
|
|
|
|
|
|||||||||
| Total operating expenses |
6,015,108 | 5,343,265 | 11,356,086 | 6,803,604 | ||||||||||||
|
|
|
|
|
|
|
|
|
|||||||||
| Operating loss |
(4,471,100 | ) | (4,909,488 | ) | (9,980,970 | ) | (6,031,461 | ) | ||||||||
| Interest expense and accretion on note payable and convertible debentures |
(373,679 | ) | (24,145 | ) | (350,636 | ) | (52,599 | ) | ||||||||
| Interest income |
650 | 24,368 | 27,851 | 57,329 | ||||||||||||
| Foreign exchange loss |
(120,240 | ) | (155,722 | ) | (369,461 | ) | (79,399 | ) | ||||||||
|
|
|
|
|
|
|
|
|
|||||||||
| Loss before income taxes |
(4,964,369 | ) | (5,064,987 | ) | (10,673,216 | ) | (6,106,130 | ) | ||||||||
| Income tax provision |
7,855 | 30,035 | 23,587 | 70,901 | ||||||||||||
|
|
|
|
|
|
|
|
|
|||||||||
| Net loss |
(4,972,224 | ) | (5,095,022 | ) | (10,696,803 | ) | (6,177,031 | ) | ||||||||
| Cumulative translation adjustment |
— | — | — | (189,494 | ) | |||||||||||
|
|
|
|
|
|
|
|
|
|||||||||
| Comprehensive Loss |
(4,972,224 | ) | (5,095,022 | ) | (10,696,803 | ) | (6,366,525 | ) | ||||||||
|
|
|
|
|
|
|
|
|
|||||||||
See accompanying notes to consolidated financial statements.
F-76
Table of Contents
Perspecsys Inc.
Consolidated statements of deficiency
(expressed in US Dollars)
| Common shares | Class A Preferred Shares |
Class B Preferred Shares |
Warrants | Accumulated Other Comprehensive Income (Loss) |
Additional Paid in Capital |
Accumulated Deficit |
Non- Controlling Interest |
Total Deficiency |
||||||||||||||||||||||||||||||||||||||||||||
| Shares | Amount | Shares | Amount | Shares | Amount | Shares | Amount | |||||||||||||||||||||||||||||||||||||||||||||
|
|
$ |
|
$ |
|
$ |
|
$ | $ | $ | $ | $ | $ | ||||||||||||||||||||||||||||||||||||||||
| Balances, December 31, 2012 |
10,363,611 | 1,036 | 39,936,824 | 3,997 | — | — | 2,463,054 | 484,696 | (423,969 | ) | 9,657,314 | (10,842,068 | ) | — | (1,118,994 | ) | ||||||||||||||||||||||||||||||||||||
|
|
|
|
|
|
|
|
|
|
|
|
|
|
|
|
|
|
|
|
|
|
|
|
|
|
|
|||||||||||||||||||||||||||
| Stock-based compensation (Note 7) |
218,841 | 218,841 | ||||||||||||||||||||||||||||||||||||||||||||||||||
| Exchange of Common for Preferred shares (Note 7) |
(10,000,000 | ) | (1,000 | ) | 4,640,370 | 464 | 536 | — | ||||||||||||||||||||||||||||||||||||||||||||
| Share issuance (Note 7) |
90,862,989 | 9,086 | 11,232,981 | 11,242,067 | ||||||||||||||||||||||||||||||||||||||||||||||||
| Cumulative translation adjustment |
(189,494 | ) | (189,494 | ) | ||||||||||||||||||||||||||||||||||||||||||||||||
| Net loss |
(6,177,031 | ) | (6,177,031 | ) | ||||||||||||||||||||||||||||||||||||||||||||||||
|
|
|
|
|
|
|
|
|
|
|
|
|
|
|
|
|
|
|
|
|
|
|
|
|
|
|
|||||||||||||||||||||||||||
| Balances, December 31, 2013 |
363,611 | 36 | 39,936,824 | 3,997 | 95,503,359 | 9,550 | 2,463,054 | 484,696 | (613,463 | ) | 21,109,672 | (17,019,099 | ) | — | 3,975,389 | |||||||||||||||||||||||||||||||||||||
|
|
|
|
|
|
|
|
|
|
|
|
|
|
|
|
|
|
|
|
|
|
|
|
|
|
|
|||||||||||||||||||||||||||
| Corporate reorganization (Note 7) |
(16,631,346 | ) | (1,663 | ) | (8,374,799 | ) | (837 | ) | (821,018 | ) | (161,566 | ) | (5,132,703 | ) | 5,296,769 | — | ||||||||||||||||||||||||||||||||||||
| Foreign Translation Adjustment (Note 7) |
(20 | ) | (243 | ) | (738 | ) | (27,688 | ) | 1,518,640 | (1,489,951 | ) | — | ||||||||||||||||||||||||||||||||||||||||
| Stock-based compensation (Note 7) |
164,337 | 164,337 | ||||||||||||||||||||||||||||||||||||||||||||||||||
| Common Shares Issuance from Stock Option Exchange (Note 7) |
633,670 | 63 | 28,629 | 28,692 | ||||||||||||||||||||||||||||||||||||||||||||||||
| Issuance of Convertible Debentures (Note 6) |
1,742,332 | 153,000 | 170,744 | 323,744 | ||||||||||||||||||||||||||||||||||||||||||||||||
| Conversion of Preferred shares into Common shares (Note 7) |
2,780,027 | 278 | (2,780,027 | ) | (278 | ) | — | |||||||||||||||||||||||||||||||||||||||||||||
| Net loss |
(10,696,803 | ) | (10,696,803 | ) | ||||||||||||||||||||||||||||||||||||||||||||||||
|
|
|
|
|
|
|
|
|
|
|
|
|
|
|
|
|
|
|
|
|
|
|
|
|
|
|
|||||||||||||||||||||||||||
| Balances, December 31, 2014 |
3,777,308 | 357 | 20,525,451 | 1,813 | 87,128,560 | 7,975 | 3,384,368 | 448,442 | 905,177 | 14,850,728 | (27,715,902 | ) | 5,296,769 | (6,204,641 | ) | |||||||||||||||||||||||||||||||||||||
|
|
|
|
|
|
|
|
|
|
|
|
|
|
|
|
|
|
|
|
|
|
|
|
|
|
|
|||||||||||||||||||||||||||
| Stock-based compensation (Note 7) (unaudited) |
34,317 | 34,317 | ||||||||||||||||||||||||||||||||||||||||||||||||||
| Net loss (unaudited) |
(4,972,224 | ) | (4,972,224 | ) | ||||||||||||||||||||||||||||||||||||||||||||||||
|
|
|
|
|
|
|
|
|
|
|
|
|
|
|
|
|
|
|
|
|
|
|
|
|
|
|
|||||||||||||||||||||||||||
| Balances, June 30, 2015(unaudited) |
3,777,308 | $ | 357 | 20,525,451 | $ | 1,813 | 87,128,560 | $ | 7,975 | 3,384,368 | $ | 448,442 | $ | 905,177 | $ | 14,885,045 | $ | (32,688,126 | ) | $ | 5,296,769 | $ | (11,142,548 | ) | ||||||||||||||||||||||||||||
|
|
|
|
|
|
|
|
|
|
|
|
|
|
|
|
|
|
|
|
|
|
|
|
|
|
|
|||||||||||||||||||||||||||
See accompanying notes to consolidated financial statements.
F-77
Table of Contents
Perspecsys Inc.
Consolidated statement of cash flows
(expressed in US dollars)
| Six months ended June 30, 2015 |
Six months ended June 30, 2014 |
Year ended December 31, 2014 |
Year ended December 31, 2013 |
|||||||||||||
| (Unaudited) | (Unaudited) | |||||||||||||||
| $ | $ | $ | $ | |||||||||||||
| Operating activities |
||||||||||||||||
| Net loss |
(4,972,224 | ) | (5,095,022 | ) | (10,696,803 | ) | (6,177,031 | ) | ||||||||
| Items not affecting cash |
||||||||||||||||
| Depreciation of property and equipment |
68,557 | 39,450 | 110,876 | 52,241 | ||||||||||||
| Stock based compensation expense |
34,317 | 81,027 | 164,337 | 218,841 | ||||||||||||
| Fair value adjustment of note payable (Note 5) |
— | — | — | (241,734 | ) | |||||||||||
| Depreciation of deferred financing costs |
32,217 | — | 25,251 | 9,515 | ||||||||||||
| Interest and accretion expense |
373,679 | 24,145 | 350,636 | 52,599 | ||||||||||||
| Changes in non-cash operating working capital items |
||||||||||||||||
| Accounts receivable |
1,422,483 | (428,887 | ) | (2,177,863 | ) | (131,762 | ) | |||||||||
| Investment tax credit refundable |
— | — | — | 609,394 | ||||||||||||
| Other receivables |
(55,021 | ) | (3,834 | ) | (7,241 | ) | (21,801 | ) | ||||||||
| Prepaid expenses and deposits |
(98,325 | ) | (131,938 | ) | (42,617 | ) | (46,033 | ) | ||||||||
| Accounts payable and accrued liabilities |
(268,635 | ) | 496,801 | 730,229 | (384,322 | ) | ||||||||||
| Income taxes payable |
— | (27,548 | ) | (27,548 | ) | 5,426 | ||||||||||
| Deferred revenue |
751,663 | 639,689 | 2,956,575 | 776,339 | ||||||||||||
| Deferred rent |
3,275 | 24,726 | 40,745 | — | ||||||||||||
|
|
|
|
|
|
|
|
|
|||||||||
| Net cash used in operating activities |
(2,708,014 | ) | (4,381,391 | ) | (8,573,423 | ) | (5,278,328 | ) | ||||||||
|
|
|
|
|
|
|
|
|
|||||||||
| Investing activity |
||||||||||||||||
| Purchase of property and equipment (Note 3) |
(60,914 | ) | (217,421 | ) | (280,440 | ) | (54,278 | ) | ||||||||
|
|
|
|
|
|
|
|
|
|||||||||
| Net cash used in investing activities |
(60,914 | ) | (217,421 | ) | (280,440 | ) | (54,278 | ) | ||||||||
|
|
|
|
|
|
|
|
|
|||||||||
| Financing activities |
||||||||||||||||
| Repayment of due to shareholder |
— | — | — | (36,810 | ) | |||||||||||
| Repayment of note payable |
(39,632 | ) | — | — | — | |||||||||||
| Proceeds from convertible debentures, net |
— | — | 6,957,952 | — | ||||||||||||
| Proceeds from exercised stock options |
— | — | 28,692 | — | ||||||||||||
| Proceeds from note payable |
— | — | — | 704,836 | ||||||||||||
| Proceeds from issuance of Class B preferred shares, net |
— | — | — | 9,694,495 | ||||||||||||
| Repayment of obligations under capital lease |
(17,092 | ) | — | (14,871 | ) | — | ||||||||||
|
|
|
|
|
|
|
|
|
|||||||||
| Net cash (used in) provided by financing activites |
(56,724 | ) | — | 6,971,773 | 10,362,521 | |||||||||||
|
|
|
|
|
|
|
|
|
|||||||||
| Effect of exchange rate changes on cash |
(36,030 | ) | (4,713 | ) | (45,368 | ) | (280,704 | ) | ||||||||
|
|
|
|
|
|
|
|
|
|||||||||
| Net (decrease) increase in cash |
(2,861,682 | ) | (4,603,526 | ) | (1,927,458 | ) | 4,749,210 | |||||||||
| Cash, beginning of year |
3,920,223 | 5,847,681 | 5,847,681 | 1,098,470 | ||||||||||||
|
|
|
|
|
|
|
|
|
|||||||||
| Cash, end of year |
$ | 1,058,541 | $ | 1,244,155 | $ | 3,920,223 | $ | 5,847,681 | ||||||||
|
|
|
|
|
|
|
|
|
|||||||||
See accompanying notes to consolidated financial statements.
F-78
Table of Contents
Perspecsys Inc.
Notes to the consolidated financial statements
For the six months ended as at June 30, 2015 and 2014 (unaudited)
For the years ended as at December 31, 2014 and 2013 (audited)
(Expressed in U.S. Dollars)
1. Organization
Perspecsys Inc. and its subsidiaries (the “Company”), a Delaware Corporation with offices in the United States, Europe and Canada, is a leading provider of cloud data protection solutions that enable mission critical cloud applications to be adopted throughout an enterprise. Perspecsys enables organizations to better find their clouds, protect their clouds, and use their clouds.
2. Significant accounting policies
Basis of presentation
For the year ended December 31, 2014 and 2013, the accompanying consolidated financial statements have been prepared under the assumption of going concern, in accordance with accounting principles generally accepted in the United States of America (“GAAP”). All intercompany balances and transactions have been eliminated. There is a non-controlling interest held in one of the Company’s subsidiaries, Perspecsys Corp., and all other subsidiaries are wholly-owned. The consolidated financial statements are presented in U.S. dollars, which is the Company’s reporting currency.
For the six month periods ended June 30, 2015 and 2014, the accompanying interim consolidated financial statements have been prepared under the assumption of going concern, in accordance with GAAP. The interim consolidated financial statements are presented in U.S. dollars, which is the Company’s reporting currency. Certain information and disclosures normally included in the annual financial statements prepared in accordance with GAAP have been condensed or omitted as permitted for interim financial statements and should only be read in conjunction with the annual financial statements accompanying them. The unaudited interim financial statements reflect all adjustments (consisting only of normal recurring adjustments) which are, in the opinion of management, necessary to present fairly the results for the interim periods presented.
As described in more detail in Note 7, the Company completed a corporate reorganization on February 28, 2014. As a result of the reorganization, the former parent company, a Canadian operating company changed its name from Perspecsys Inc. to Perspecsys Corp., and a new parent company, Perspecsys Inc., domiciled in the United States was incorporated under the laws of Delaware. Perspecsys Inc. now consolidates Perspecsys Corp. This reorganization was treated as a reorganization under common control for financial reporting purposes and as such, there was no change in basis for Perspecsys Inc. and recorded based on the historical cost basis of Perspecsys Corp. It also resulted in a non-controlling interest of Perspecsys Corp., as certain shareholders of the former parent company, Perspecsys Inc., exchanged their shares for new non-voting shares of Perspecsys Corp. The accompanying consolidated financial statements and related notes were retrospectively adjusted to consolidate Perspecsys Corp. for all periods. The comparative share capital and shareholder’s deficiency are accounted as though the newly created entity, Perspecsys Inc., was always the parent company.
Use of estimates
The preparation of consolidated financial statements in conformity with GAAP requires management to make estimates and assumptions that affect the reported amounts of asset and liabilities and the disclosure of contingent assets and liabilities at the date of the consolidated financial statements, and the reported amounts of revenue and expenses for the reporting period. Actual results could differ from these estimates. These estimates are reviewed periodically and, as adjustments become necessary, they are recorded in the accounting period in which these adjustments are determined.
F-79
Table of Contents
Perspecsys Inc.
Notes to the consolidated financial statements
For the six months ended as at June 30, 2015 and 2014 (unaudited)
For the years ended as at December 31, 2014 and 2013 (audited)
(Expressed in U.S. Dollars)
During the periods presented, management has made a number of estimates and valuation assumptions in the determination of the bifurcation of convertible debentures, allowance for doubtful accounts, the useful lives of property and equipment, accrued liabilities, the fair value of stock-based compensation, the valuation of financial instruments, the evaluation of long-lived assets for impairment, the valuation allowance of uncertain income tax positions, and temporary tax differences.
Translation of foreign currencies
Prior to January 1, 2014, the functional currencies of the Company’s wholly owned Canadian and US subsidiaries were determined to be Canadian dollars. The financial statements of the US subsidiary were first translated from the books and records of US dollars to Canadian dollar functional currency by remeasuring monetary assets and liabilities at the current rate and non-monetary assets and liabilities at the historical rate. Revenues and expenses were remeasured at the monthly average rates. The resulting foreign exchange differences were recognized in the consolidated statement of operations. Assets and liabilities of the Canadian and US subsidiaries were then translated to the reporting currency of US dollars using the rate of exchange in effect at the balance sheet date. Revenues and expenses were translated using monthly average exchange rates. Exchange gains and losses arising from translation of functional currencies to the Company’s US dollar reporting currency were included in other comprehensive income in the consolidated statement of operations and comprehensive loss and as a cumulative translation adjustment as one component included in the accumulated other comprehensive loss in the statement of deficiency.
Subsequent to January 1, 2014, the functional currency of the Company’s wholly owned subsidiaries changed due to a significant change in economic facts and circumstances that indicated that the functional currency had changed to the US dollar. The change was due to a corporate reorganization on February 28, 2014 as described in Note 7. As a matter of convenience and as a practical matter the Company has decided to use a date at the beginning of the most recent reporting period of January 1, 2014 as the effective date of the change in functional currency. The impact was determined to not be material. As a result, the change in functional currency was applied prospectively from January 1, 2014. Monetary assets and liabilities of the Canadian subsidiary have been remeasured to the US dollar at current exchange rates. The new cost basis for non-monetary assets and liabilities and components of shareholders’ deficiency existing at January 1, 2014 were the translated amounts at the end of the previous period. As a result of this change in functional currency, the Company recorded a $1,518,640 cumulative translation adjustment included in opening accumulated other comprehensive loss for the year ended December 31, 2014.
Subsequent to January 1, 2014, the books and records of the entities were translated from their foreign currencies to the US dollar functional currency by remeasuring monetary assets and liabilities at the current rate. Non-monetary items were translated at historical rates and the new historical rates referred to above, as applicable. Revenues and expenses were remeasured at the monthly average exchange rates. The resulting foreign exchange differences were recognized in the consolidated statements of operations. There were no cumulative translation adjustments subsequent to January 1, 2014 as the functional currency was the same as the reporting currency of US dollars.
F-80
Table of Contents
Perspecsys Inc.
Notes to the consolidated financial statements
For the six months ended as at June 30, 2015 and 2014 (unaudited)
For the years ended as at December 31, 2014 and 2013 (audited)
(Expressed in U.S. Dollars)
Fair value of financial instruments
The Company follows ASC 820-10, Fair Value Measurements and Disclosures for fair value measurements of financial and nonfinancial assets and liabilities and for fair value measurements of nonfinancial items that are recognized or disclosed at fair value in the financial statements on a recurring or nonrecurring basis.
ASC 820-10 establishes a fair value hierarchy that prioritizes the inputs to valuation techniques used to measure fair value. The hierarchy gives the highest priority to unadjusted quoted prices in active markets for identical assets or liabilities (Level 1 measurements) and the lowest priority to measurements involving significant unobservable inputs (Level 3 measurements). The three levels of the fair value hierarchy are as follows:
| • | Level 1—Quoted prices in active markets for identical assets or liabilities. |
| • | Level 2—Inputs, other than quoted prices in active markets, that are observable either directly or indirectly. |
| • | Level 3—Unobservable inputs based on the Company’s assumptions. |
The Company’s financial assets and financial liabilities consist of those amounts referred to in Note 9.
Accounts receivable
Trade receivables are carried at their original invoice amounts less any allowance for doubtful accounts, and do not bear interest. The Company specifically analyzes trade accounts receivable and historical bad debts, customer credit-worthiness, current economic trends, and changes in its customer payment terms and collection trends when evaluating the adequacy of its allowance for doubtful accounts. Any change in the assumptions used to analyze a specific account receivable may result in an additional allowance for doubtful accounts being recognized in the period in which the change occurs. The Company’s allowance for doubtful accounts totaled $Nil for June 30, 2015 (unaudited), December 31, 2014 and December 31, 2013.
Other receivables
Other receivables are comprised of corporate tax and indirect tax refund amounts, and are carried at their fair value.
Prepaid expenses and deposits
Prepaid expense and deposits are comprised of commercial insurance, paid on an annual basis, along with sponsorships for marketing related events/tradeshows, and prepaid subscriptions for software as a service, memberships and dues paid on a term basis. All amounts are carried at their amortized cost.
F-81
Table of Contents
Perspecsys Inc.
Notes to the consolidated financial statements
For the six months ended as at June 30, 2015 and 2014 (unaudited)
For the years ended as at December 31, 2014 and 2013 (audited)
(Expressed in U.S. Dollars)
Property and equipment
Property and equipment are recorded at cost less accumulated depreciation. Depreciation is calculated over the estimated useful lives of the related assets as indicated below:
| Computer hardware |
Straight-line | 3 years | ||
| Computer software |
Straight-line | 2 years | ||
| Office furniture and equipment |
Straight-line | 5 years | ||
| Marketing equipment |
Straight-line | 5 years | ||
| Leasehold improvements |
Straight-line | Lesser of useful life or lease term |
Impairment of long-lived assets
The Company accounts for the impairment of long-lived assets in accordance with ASC 360-10, Accounting for the Impairment of Long-Lived Assets. This statement requires that long-lived assets be reviewed for impairment whenever events or changes in circumstances indicate that the assets’ carrying amounts may not be recoverable. For assets that are to be held and used, impairment is recognized when the estimated undiscounted cash flows associated with the asset or group of assets is less than their carrying values. If impairment exists, an adjustment is made to write the asset down to its fair value, and a loss is recorded as the difference between the carrying value and fair value. Fair values are determined based on quoted market values, discounted cash flows or internal and external appraisals, as applicable. Assets to be disposed of are carried at the lower of carrying value and estimated net realizable value. During the reported periods, there was no impairment of long-lived assets.
Convertible debentures with beneficial conversion feature
In accounting for convertible debentures, proceeds from the sale of convertible debentures with detachable warrants are allocated to the two elements based on relative fair values of the debt instrument without the warrants and of the warrants themselves at time of issuance. The portions of the proceeds allocated to the warrants are accounted for as a separate component in shareholders’ deficiency with an offset to debt discount. The remainder of the proceeds are allocated to the debt instrument portion of the transaction as prescribed by ASC 470-20, Debt with Conversion and Other Options. The Company then calculates the effective conversion price of the debentures based on the relative fair value allocated to the debt instrument to determine the fair value of any beneficial conversion feature associated with the convertible debenture. The beneficial conversion feature is recorded in additional paid-in capital with an offset to debt discount. Both the debt discount related to the issuance of warrants and related to the beneficial conversion feature is amortized over the life of the debenture using the effective interest method.
Long term debt
Long term debt is initially recognized at fair value at inception and is subsequently measured at amortized cost using the effective interest method.
The effective interest method is a method of calculating the amortized cost of a financial liability and of allocating interest expense over the relevant period. The effective interest rate is the rate that exactly discounts
F-82
Table of Contents
Perspecsys Inc.
Notes to the consolidated financial statements
For the six months ended as at June 30, 2015 and 2014 (unaudited)
For the years ended as at December 31, 2014 and 2013 (audited)
(Expressed in U.S. Dollars)
estimated future cash payments that form an integral part of the effective interest rate (transaction costs and other premiums or discounts) through the expected life of the financial liability. The Company presents debt issuance costs in the balance sheet as a direct deduction from the carrying amount of the debt.
Warrants
Warrants issued for the purchase of convertible preferred stock are assessed as having the same equity characteristics as the preferred stock. Warrants are recorded at fair value at the date of issuance.
Deferred rent
Rent expense is charged to operations ratably over the term of the lease, which results in deferred rent payable and represents the cumulative rent expense charged to operations from inception of the lease in excess of the required lease payments.
Revenue recognition
The Company provides services to enterprises that seek data protection solutions for their cloud based applications. The Company recognized revenues following the accounting guidelines and recommendations contained in ASC Topic 605, Revenue Recognition. The Company recognized revenues for Subscription sales and service revenues when all the following criteria are met:
| • | There is persuasive evidence of an arrangement; |
| • | The product or services have been provided to the customer; |
| • | The amount of fees to be paid by the customer is fixed or determinable; and |
| • | The collection of the related fees is reasonably assured. |
Subscription sales
Subscription sales are recognized ratably over the contract terms beginning on (1) the commencement date of each contract, which is the date the Company’s service is made available to customers when there is no free trial period, or (2) the service start date, which is the date the Company starts to charge its customers after the free trial period is completed. Amounts that have been invoiced are recorded in accounts receivable and in deferred revenue or revenue, depending on whether the revenue recognition criteria have been met.
Services revenues
The Company’s professional services contracts are on a time and material basis. When these services are not combined with subscription sales as a single unit of accounting, as discussed below, these revenues are recognized as the services are rendered for time and material contracts, and when the milestones are achieved and accepted by the customer for fixed price contracts. Training revenues are recognized as the services are performed.
F-83
Table of Contents
Perspecsys Inc.
Notes to the consolidated financial statements
For the six months ended as at June 30, 2015 and 2014 (unaudited)
For the years ended as at December 31, 2014 and 2013 (audited)
(Expressed in U.S. Dollars)
Multiple element arrangements
The Company enters into multiple-element revenue arrangements in which a customer may purchase a combination of subscription services and professional services. The revenue recognition guidance for multiple deliverable arrangements requires an entity to allocate arrangement consideration to each element based on a selling price hierarchy, where the selling price for an element is based on vendor-specific objective evidence (VSOE), if available; third-party evidence (TPE), if available, and VSOE is not available; or the best estimate of selling price (BESP), if neither VSOE or TPE is available. In accordance with that guidance, the Company allocates the arrangement fee to each element based upon the relative selling price of such element. After such allocation is made, the amount of the arrangement fee allocated to each element is recognized when the basic revenue recognition criteria are met for that element.
The Company determines VSOE for each element based on historical stand-alone transactions. VSOE of fair value is based on the price charged when the element is sold separately. The Company determines the VSOE of fair value for subscription and professional services by analyzing the stand-alone sales and determining whether a substantial majority of transactions fall within a narrow range for each stratum.
The Company typically is not able to determine TPE for its subscriptions or professional services. TPE is determined based on competitor prices for similar elements when sold separately. Generally, the Company’s offerings contain a significant level of differentiation such that the comparable pricing of products with similar functionality cannot be obtained.
When the Company is unable to establish the selling price of an element using VSOE or TPE, the Company uses BESP in the Company’s allocation of arrangement consideration. The Company determines BESP for subscription and professional services by considering multiple factors, including, but not limited to, historical pricing practices, current market trends, customer class, and gross margin objectives, such that it can make an estimate of the price at which the Company would transact a sale if the services were sold on a stand-alone basis.
Stock-based compensation
The Company applies the provisions of ASC 718, Stock Compensation, which requires companies to measure all employee stock-based compensation awards using a fair value method and record such expense in their financial statements. The Company recognizes stock-based compensation ratably on a straight-line basis, net of estimated forfeitures, over the shorter of the vesting or requisite service periods. The use of this valuation model involves assumptions that are judgmental and highly sensitive in the determination of compensation expense and include the expected life of the option, stock price volatility, risk-free interest rate, dividend yield, exercise price, and forfeiture rates.
The Company’s stock-based compensation plan is described in Note 7. The fair value of stock options issued to directors, officers, employees and consultants is determined upon the date of grant and recognized as compensation expense over the vesting period for directors, officers or employees and over the period of service for consultants.
When options are exercised, the corresponding additional paid in capital and the proceeds received by the Company are credited to share capital. If stock options are repurchased from directors, officers or employees, the excess of the consideration paid over the carrying amount of the stock or stock options repurchased is charged to additional paid in capital.
F-84
Table of Contents
Perspecsys Inc.
Notes to the consolidated financial statements
For the six months ended as at June 30, 2015 and 2014 (unaudited)
For the years ended as at December 31, 2014 and 2013 (audited)
(Expressed in U.S. Dollars)
Scientific Research & Experimental Development
Refundable tax credits are accounted for in the period in which the related expenditures are incurred as a direct reduction of research and development or capitalized costs. Non-refundable tax credits, which may only be used to reduce future taxes otherwise payable, are recorded as an income tax recovery in the period in which their realization is considered more likely than not. As described in Note 10, Perspecsys Corp. ceased to qualify as a Canadian Controlled Private Corporation following April 5, 2013, and is no longer eligible for refundable tax credits under Scientific Research & Experimental Development (“SR&ED”).
Income taxes
The Company accounts for income taxes in accordance with the provisions of ASC 740, Income Taxes, which requires that the Company recognize deferred tax liabilities and assets for the expected future tax consequences of events that have been included in the financial statements or tax returns. Under this method, deferred tax assets and liabilities are determined on the basis of the difference between the tax bases of assets and liabilities and their respective financial reporting amounts (“temporary differences”) at enacted tax rates in effect for the years in which the temporary differences are expected to reverse. A valuation allowance is established for deferred tax assets for which realization is uncertain.
Uncertain tax positions are accounted for in accordance with ASC 740, Income Taxes, which prescribes a comprehensive model for the manner in which a company should recognize, measure, present and disclose in its financial statements all material uncertain tax positions that the company has taken or expects to take on a tax return. ASC 740 applies to income taxes and is not intended to be applied by analogy to other taxes, such as sales taxes, value-add taxes, or property taxes. The Company reviews its nexus in various tax jurisdictions and the Company’s tax positions related to all open tax years for events that could change the status of its ASC 740 liability, if any, or require an additional liability to be recorded. Such events may be the resolution of issues raised by a taxing authority, expiration of the statute of limitations for a prior open tax year or new transactions for which a tax position may be deemed to be uncertain. Those positions, for which management’s assessment is that there is more than a 50 percent probability of sustaining the position upon challenge by a taxing authority based upon its technical merits, are subjected to the measurement criteria of ASC 740.
The Company records the largest amount of tax benefit that is greater than 50 percent likely of being realized upon ultimate settlement with a taxing authority having full knowledge of all relevant information. Any ASC 740 liabilities for which the Company expects to make cash payments within the next twelve months are classified as “short term.”
The Company recognizes interest and penalties accrued related to unrecognized tax benefits or liabilities in income tax expense.
Recently issued accounting pronouncements
In September 2015, the Financial Accounting Standards Board (“FASB”) issued Accounting Standards Update (“ASU”) No. 2015-16, Business Combinations (Topic 805): Simplifying the Accounting for Measurement-Period Adjustments, which eliminates the requirement for an acquirer in a business combination to account for measurement-period adjustments retrospectively. Under this ASU, acquirers must recognize
F-85
Table of Contents
Perspecsys Inc.
Notes to the consolidated financial statements
For the six months ended as at June 30, 2015 and 2014 (unaudited)
For the years ended as at December 31, 2014 and 2013 (audited)
(Expressed in U.S. Dollars)
measurement-period adjustments in the period in which they determine the amounts, including the effect on earnings of any amounts they would have recorded in previous periods if the accounting had been completed at the acquisition date. This guidance is effective for fiscal years beginning after December 15, 2016, with early adoption permitted. The Company is currently evaluating the impact of the future adoption of this standard and does not expect the adoption to have a material effect on the Company’s consolidated financial statements.
In August 2014, the FASB issued ASU No. 2014-15, Presentation of Financial Statements—Going Concern (Subtopic 205-40): Disclosure of Uncertainties about an Entity’s Ability to Continue as a Going Concern. ASU 2014-15 will explicitly require management to assess the entity’s ability to continue as a going concern at each annual and interim period. Related footnote disclosures will be required if conditions give rise to substantial doubt about an entity’s ability to continue as a going concern within one year after the report issuance date. If conditions do not give rise to substantial doubt, no disclosures will be required that are specific to going concern uncertainties. ASU 2014-15 is effective for reporting periods ending after December 15, 2016, and early adoption is permitted. The Company is currently evaluating the impact of the future adoption of this standard and does not expect the adoption to have a material effect on the Company’s consolidated financial statements.
In June 2014, the FASB issued ASU No. 2014-12, Compensation—Stock Compensation (Topic 718): Accounting for Share-Based Payments When the Terms of an Award Provide that a Performance Target Could be Achieved after the Requisite Service Period. ASU 2014-12 requires that a performance target that affects vesting and that could be achieved after the requisite service period be treated as a performance condition. A reporting entity should apply existing guidance in Accounting Standards Codification (ASC) Topic No. 718, Compensation—Stock Compensation, as it relates to awards with performance conditions that affect vesting to account for such awards. ASU 2014-12 is effective for annual periods and interim periods within those annual periods beginning after December 15, 2015. Early adoption is permitted. The Company is currently assessing the potential impact of this accounting standard.
In May 2014, the FASB issued ASU 2014-09, Revenue from Contracts with Customers, which requires an entity to recognize the amount of revenue to which it expects to be entitled for the transfer of promised goods or services to customers. This ASU is based on the principle that revenue is recognized to depict the transfer of goods or services to customers in an amount that reflects the consideration to which the entity expects to be entitled in exchange for those goods or services. This ASU also requires additional disclosure about the nature, amount, timing and uncertainty of revenue and cash flows arising from customer contracts, including significant judgments and changes in judgments and assets recognized from costs incurred to obtain or fulfill a contract. In August 2015, the FASB issued ASU 2015-14 which deferred the effective date of the new revenue standard to annual periods beginning after December 15, 2018 for private companies and December 15, 2017 for public companies. The Company is currently evaluating the transition methods and the effect that this ASU will have on its consolidated financial statements and related disclosures.
In April 2015, the FASB issued ASU 2015-03, Interest—Imputation of Interest (Subtopic 835-30): Simplifying the Presentation of Debt Issuance Costs. ASU 2015-03 will require an entity to present debt issuance costs in the balance sheet as a direct deduction from the carrying amount of the related debt liability rather than as an asset, consistent with the treatment of debt discounts. The amendment does not change the recognition and measurement guidance for debt issuance costs, and the depreciation of debt issuance costs will continue to be reported as interest expense. ASU 2015-03 is effective for annual reporting periods beginning after December 15, 2016. Early adoption is permitted. The Company has elected to early adopt the guidance and has applied it retrospectively to each prior period presented.
F-86
Table of Contents
Perspecsys Inc.
Notes to the consolidated financial statements
For the six months ended as at June 30, 2015 and 2014 (unaudited)
For the years ended as at December 31, 2014 and 2013 (audited)
(Expressed in U.S. Dollars)
3. Property and equipment
| June 30, 2015 (unaudited) |
||||||||||||||
| Cost |
|
Accumulated depreciation |
Net book value |
|||||||||||
| $ | $ | $ | ||||||||||||
| Computer hardware |
320,333 | 188,117 | 132,216 | |||||||||||
| Computer software |
18,078 | 11,076 | 7,002 | |||||||||||
| Office furniture and equipment |
161,780 | 35,799 | 125,981 | |||||||||||
| Marketing equipment |
35,945 | 31,086 | 4,859 | |||||||||||
| Leasehold improvements |
95,582 | 26,955 | 68,627 | |||||||||||
|
|
|
|
|
|
|
|
||||||||
| 631,718 | 293,033 | 338,685 | ||||||||||||
|
|
|
|
|
|
|
|
||||||||
| Dec 31, 2014 | ||||||||||||||
| Cost |
|
Accumulated depreciation |
Net book value |
|||||||||||
| $ | $ | $ | ||||||||||||
| Computer hardware |
301,284 | 151,168 | 150,116 | |||||||||||
| Computer software |
16,215 | 7,960 | 8,255 | |||||||||||
| Office furniture and equipment |
142,896 | 21,038 | 121,858 | |||||||||||
| Marketing equipment |
35,945 | 26,533 | 9,412 | |||||||||||
| Leasehold improvements |
74,463 | 17,776 | 56,687 | |||||||||||
|
|
|
|
|
|
|
|
||||||||
|
|
|
|
|
|
|
|
||||||||
| 570,802 | 224,475 | 346,328 | ||||||||||||
|
|
|
|
|
|
|
|
||||||||
| Dec 31, 2013 | ||||||||||||||
| Cost |
|
Accumulated depreciation |
Net book value |
|||||||||||
| $ | $ | $ | ||||||||||||
| Computer hardware |
148,281 | 81,209 | 67,072 | |||||||||||
| Computer software |
5,152 | 5,152 | — | |||||||||||
| Office furniture and equipment |
6,334 | 4,256 | 2,078 | |||||||||||
| Marketing equipment |
17,582 | 17,582 | — | |||||||||||
| Leasehold improvements |
9,000 | 5,400 | 3,600 | |||||||||||
|
|
|
|
|
|
|
|
||||||||
| 186,349 | 113,599 | 72,750 | ||||||||||||
|
|
|
|
|
|
|
|
||||||||
The Company acquired equipment at a net cost after capital lease obligations of $60,914, $280,440, and $54,278 during the period ended June 30, 2015 (unaudited), the year ended December 31, 2014, and December 31, 2013, respectively.
The Company recognized depreciation expense of $68,557, $39,450, $110,876, and $52,241 during the six months ended June 30, 2015 (unaudited), the six months ended June 30, 2014 (unaudited), the year ended December 31, 2014, and December 31, 2013, respectively.
F-87
Table of Contents
Perspecsys Inc.
Notes to the consolidated financial statements
For the six months ended as at June 30, 2015 and 2014 (unaudited)
For the years ended as at December 31, 2014 and 2013 (audited)
(Expressed in U.S. Dollars)
4. Obligations under capital lease
The Company has obligations under capital lease totaling $72,041 (unaudited) as at June 30, 2015 (December 31, 2014 - $89,133; December 31, 2013 - $nil). Monthly repayments of interest and principal range from $727 to $2,206 and the obligations bear interest at rates ranging from 0% to 2.2%. The obligations are secured by the underlying assets.
The total payments for obligations under capital leases due in each of the next five years, are as follows:
| As of December 31, 2014 |
||||
| 2015 |
$ | 35,571 | ||
| 2016 |
35,571 | |||
| 2017 |
20,015 | |||
| 2018 |
— | |||
| 2019 |
— | |||
|
|
|
|||
| 91,157 | ||||
| Less: amount representing interest |
2,024 | |||
|
|
|
|||
| $ | 89,133 | |||
|
|
|
|||
5. Note Payable
In October 2012, Perspecsys Corp. entered into a Contribution Agreement with the Federal Development Economic Agency (“FedDev”) Investing in Business Innovation (“IBI”), in which funding occurred in June 2013, for a non-interest bearing loan in the amount of $704,836, repayable in 60 equal monthly instalments, commencing March 30, 2015 and due by March 30, 2020. The Company received monthly contributions as a percentage of operational expenses incurred, in arrears. The period of eligibility was May 16, 2012 through to March 30, 2014. Eligible operating expenses of zero, zero and $408,971 were incurred during the period ended June 30, 2015 (unaudited), the year ended December 31, 2014, and December 31, 2013, respectively. During the year ended December 31, 2013 the Company received total eligible FedDev payments in the amount of $704,836. Refer to subsequent event Note 12 for further details post acquisition.
As the loan is non-interest bearing, the Company recorded the loan at its fair value based on the Company’s estimated borrowing rate of 9%. An adjustment of $241,734 to reflect this fair value adjustment was recorded as government assistance and included in general and administrative expenses in the year ended December 31, 2013 within the consolidated statement of operations. The fair value of the note payable was accreted into interest expense over the remaining life of the loan.
F-88
Table of Contents
Perspecsys Inc.
Notes to the consolidated financial statements
For the six months ended as at June 30, 2015 and 2014 (unaudited)
For the years ended as at December 31, 2014 and 2013 (audited)
(Expressed in U.S. Dollars)
| $ | ||||
| Total proceeds received June 30, 2013, date of issuance |
704,836 | |||
| Fair value adjustment at June 30, 2013, date of issuance |
(241,734 | ) | ||
|
|
|
|||
| Balance, June 30, 2013 |
463,102 | |||
| Accretion from June 30, 2013 to December 31, 2013 |
24,439 | |||
|
|
|
|||
| Current portion, December 31, 2013 |
— | |||
| Long term portion, December 31, 2013 |
487,541 | |||
|
|
|
|||
| Balance as at December 31, 2013 |
487,541 | |||
| Accretion from January 1, 2014 to December 31, 2014 |
51,608 | |||
| Translation gain resulting from conversion to US functional currency |
(45,358 | ) | ||
|
|
|
|||
| Current portion, December 31, 2014 |
106,672 | |||
| Long term portion, December 31, 2014 |
387,119 | |||
|
|
|
|||
| Balance as at December 31, 2014 |
493,791 | |||
| Principal repayments |
(39,632 | ) | ||
| Accretion from January 1, 2015 to June 30, 2015 |
23,800 | |||
| Translation gain resulting from conversion to US functional currency |
(36,030 | ) | ||
|
|
|
|||
| Balance, June 30, 2015 (unaudited) |
441,929 | |||
|
|
|
|||
| Current portion, June 30, 2015 |
104,510 | |||
| Long term portion, June 30, 2015 |
337,419 | |||
|
|
|
|||
At the end of each reporting period, the note payable is translated based on the current foreign currency exchange rate at the ending of each reporting period. This gives rise to a change in fair value that is recognized through the statement of operations.
Principal payments required in each of the next five years and thereafter are as follows:
| As of December 31, 2014 |
||||
| 2015 |
$ | 117,456 | ||
| 2016 |
140,947 | |||
| 2017 |
140,947 | |||
| 2018 |
140,947 | |||
| 2019 |
140,947 | |||
| Thereafter |
23,592 | |||
|
|
|
|||
| $ | 704,836 | |||
|
|
|
|||
6. Convertible Debentures with beneficial conversion feature
In July 2014, the Company issued convertible debentures of $6,465,052 and an additional tranche of convertible debentures in August 2014 of $550,117, for total proceeds of $7,015,420, bearing non-cumulative interest at a rate of five percent (5%) per annum. For proceeds received, the Company is obligated to pay principal together with accrued interest on June 30, 2015 (the “Maturity Date”), unless the convertible debentures
F-89
Table of Contents
Perspecsys Inc.
Notes to the consolidated financial statements
For the six months ended as at June 30, 2015 and 2014 (unaudited)
For the years ended as at December 31, 2014 and 2013 (audited)
(Expressed in U.S. Dollars)
are converted into shares of the lowest price per share in the next equity financing. The conversion price is $0.1293 per Class B preferred share, subject to appropriate adjustment in the event of any stock dividend, stock split, combination or other similar recapitalization. The debenture is convertible at any time: (i) on or after the Maturity Date or (ii) immediately prior to and conditional upon the dissolution, liquidation or winding up of the Company or the closing of an Exit event. Refer to subsequent event Note 12 for further details post maturity date.
The Company also issued in conjunction with the debentures, 1,742,332 warrant certificates in July 2014 granting the holder the right to acquire Class B preferred shares at $0.1293 per share. The warrants expire at the earlier of certain specified future events or seven years after the date of issuance.
In accordance with ASC 470-20, the Company allocated total proceeds of $7,015,169 to the debentures and the warrants based on the relative fair values of the debentures and warrants. The Company then calculated the effective conversion price of the debentures based on the relative fair value allocated to the debt instrument to determine the fair value of any beneficial conversion feature associated with the convertible debenture. The beneficial conversion feature was recorded in additional paid-in capital with an offset to debt discount.
The convertible debentures were allocated a fair value of $6,691,676 using an interest rate of 9% and the warrants were allocated a fair value of $153,000. The remaining proceeds were allocated between the value of the debenture and the beneficial conversion feature of $170,744 to additional paid-in capital and a discount against the debenture. Both the debt discount related to the issuance of warrants and related to the beneficial conversion feature is amortized over the life of the debenture using the effective interest method.
The fair value of the convertible debentures will be accreted into accretion expense over the remaining life of the debenture:
| $ | ||||
| Convertible debentures at inception (July 25, 2014) |
6,159,303 | |||
| Convertible debenture issuance (August 15, 2014) |
532,373 | |||
| Deferred financing costs |
(57,468 | ) | ||
| Accretion expense |
147,809 | |||
| Accrued interest expense |
151,219 | |||
| Amortization of deferred financing costs |
25,251 | |||
|
|
|
|||
| Balance, December 31, 2014 |
6,958,487 | |||
|
|
|
|||
| Accretion expense |
175,935 | |||
| Accrued interest expense |
173,944 | |||
| Amortization of deferred financing costs |
32,217 | |||
|
|
|
|||
| Balance, June 30, 2015 |
7,340,583 | |||
|
|
|
|||
F-90
Table of Contents
Perspecsys Inc.
Notes to the consolidated financial statements
For the six months ended as at June 30, 2015 and 2014 (unaudited)
For the years ended as at December 31, 2014 and 2013 (audited)
(Expressed in U.S. Dollars)
The fair value of the warrants granted was estimated using the Black-Scholes pricing model on the date of grant using the following assumptions:
| Exercise price |
||||
| Risk-free interest rate |
2.14 | % | ||
| Expected volatility |
70 | % | ||
| Dividend yield |
0 | % | ||
| Weighted average expected life |
7.00 | |||
The Company recognized total accretion expense on the amortization of the discount of $175,935 and $147,809 for the six month period ended June 30, 2015 (unaudited) and the year ended December 31, 2014, respectively. Accretion expense on the amortization of the discount was not applicable for the year ended December 31, 2013.
The Company recognized total interest expense on convertible debentures of $173,944 and $151,219 for the six month period ended June 30, 2015 (unaudited) and the year ended December 31, 2014, respectively. Interest expense on convertible debentures was not applicable for the year ended December 31, 2013.
7. Share capital
Authorized, unlimited number
Common shares: $0.0001 par value; 234,261,699 shares authorized
Class A preferred shares: $0.0001 par value; 42,399,880 shares authorized; non-redeemable and non-retractable; convertible to common shares at the option of the holder; voting
Class B preferred shares: $0.0001 par value; 161,175,187 shares authorized; non-redeemable and non-retractable; convertible to common shares at the option of the holder; voting
During the period ended June 30, 2015, no common shares (year ended December 31, 2014, 633,670 common shares for proceeds of $28,692) were issued in relation to the exercise of stock options.
On July 25, 2014, the Company issued 2,780,027 common shares upon conversion of the same number of Class A preferred shares. This resulted in the reclassification of $278 from Class A preferred shares to Common shares in the consolidated financial statements.
On February 28, 2014, the Company completed a corporate reorganization whereby the former Canadian operating parent Company’s name, Perspecsys Inc., was changed to Perspecsys Corp., and a new US resident parent Company was incorporated under the laws of Delaware as Perspecsys Inc.
Various shareholders of Perspecsys Corp. exchanged their common and preferred shares and stock options and warrants for equivalent common and preferred shares and stock options and warrants of Perspecsys Inc. Other shareholders exchanged their common and preferred shares in Perspecsys Corp. for non-voting, but otherwise equivalent common and preferred shares in Perspecsys Corp. As a result, the Company now reflects a non-controlling interest in the amount of $5,296,769 in the consolidated Balance Sheets. Preferred shares issued to non-controlling interest holders are non-participating.
F-91
Table of Contents
Perspecsys Inc.
Notes to the consolidated financial statements
For the six months ended as at June 30, 2015 and 2014 (unaudited)
For the years ended as at December 31, 2014 and 2013 (audited)
(Expressed in U.S. Dollars)
As a result of changing its functional currency from Canadian dollars to US dollars on January 1, 2014, share capital was reduced and the opening 2014 year’s accumulated other comprehensive loss was decreased by $1,518,640 as reflected as one component included in the accumulated other comprehensive loss in the statement of deficiency.
On April 26, 2013, the Company exchanged 10,000,000 common shares for 4,640,370 Class B preferred shares.
On April 26, 2013, the Company concluded a share issuance transaction with the issuance of 90,862,989 Class B preferred shares in exchange for a total consideration of $11,381,381 (less Class B preferred share issuance costs of $139,314). Total cash proceeds from the share issuance was $9,833,809, and the remaining $1,547,572 from a conversion of convertible debt and interest accrued.
Stock option plan
The Company has adopted a stock option plan (the “Plan”) for the Company’s employees and directors. Under the plan, the option exercise price is to be set by the Board of Directors at the time of grant but shall not be lower than the market price as defined in the option plan at the time of grant. The term of the option cannot exceed 5 years from the date of the grant.
For options granted prior to May 17, 2011, one third of the options granted will vest and become exercisable following the twelve month anniversary from the date of grant. The remaining options vest and become exercisable on a pro-rated basis each month for a period of twenty-four months following the twelve month anniversary date, unless otherwise specified by the Board on the date of the grant.
For all options granted on or after May 17, 2011, twenty-five percent of the options granted will vest and become exercisable following the twelve month anniversary from the date of grant. The remaining options vest and become exercisable on a pro-rated basis each month for a period of thirty-six months following the twelve month anniversary date, unless otherwise specified by the Board on the date of the grant. The Plan limits the maximum number of options outstanding to 30,323,023.
The fair value of each option granted was estimated using the Black-Scholes option pricing model on the date of grant using the following assumptions:
| Exercise price |
June 30, 2015 | December 31, 2014 | December 31, 2013 | |||||||||
| (unaudited) | ||||||||||||
| Risk-free interest rate | 1.04% -2.45% | 1.04% - 2.45% | 1.04% - 2.45% | |||||||||
| Expected volatility | 70% | 70% | 70% | |||||||||
| Dividend yield | 0% | 0% | 0% | |||||||||
| Weighted average expected life | 3.95 - 8.07 | 4.45 - 8.40 | 5.45 - 9.00 | |||||||||
F-92
Table of Contents
Perspecsys Inc.
Notes to the consolidated financial statements
For the six months ended as at June 30, 2015 and 2014 (unaudited)
For the years ended as at December 31, 2014 and 2013 (audited)
(Expressed in U.S. Dollars)
A summary of the stock option plan activity is presented below:
| Options | Weighted average exercise price |
|||||||
| $ | ||||||||
| Outstanding, January 1, 2013 |
7,228,389 | 0.06 | ||||||
| Options forfeited |
(555,000 | ) | 0.05 | |||||
| Options exercised |
— | |||||||
| Options granted |
16,022,073 | 0.05 | ||||||
|
|
|
|
|
|||||
| Outstanding, December 31, 2013 |
22,695,462 | 0.05 | ||||||
|
|
|
|
|
|||||
| Options forfeited |
(1,534,520 | ) | 0.05 | |||||
| Options exercised |
(633,670 | ) | 0.05 | |||||
| Options granted |
4,810,323 | 0.05 | ||||||
|
|
|
|
|
|||||
| Outstanding, December 31, 2014 |
25,337,595 | 0.05 | ||||||
|
|
|
|
|
|||||
| Options forfeited |
(1,565,144 | ) | 0.05 | |||||
| Options exercised |
— | |||||||
| Options granted |
2,185,899 | 0.05 | ||||||
|
|
|
|
|
|||||
| Outstanding, June 30, 2015 (unaudited) |
25,958,350 | 0.05 | ||||||
|
|
|
|
|
|||||
| June 30, 2015 | ||||||||
| (unaudited) | ||||||||
| Exercise price |
Weighted average remaining contractual life |
|||||||
| # | Years | |||||||
| 0.05 |
25,818,350 | 8.06 | ||||||
| 0.20 |
140,000 | 3.90 | ||||||
During the periods noted below, stock-based compensation has been recorded in the consolidated statement of operations in respect of stock option awards with a corresponding credit to additional paid in capital.
| June 30, 2015 | December 31, 2014 |
December 31, 2013 |
||||||||||
| $ | $ | $ | ||||||||||
| (unaudited) |
|
|
||||||||||
| Stock based compensation |
||||||||||||
| Cost of sales |
551 | 3,308 | 7,860 | |||||||||
| Sales and marketing |
748 | 17,941 | 46,542 | |||||||||
| Research and development |
6,808 | 69,789 | 32,116 | |||||||||
| General and administration |
26,210 | 73,299 | 132,322 | |||||||||
|
|
|
|
|
|
|
|||||||
| 34,317 | 164,337 | 218,841 | ||||||||||
|
|
|
|
|
|
|
|||||||
F-93
Table of Contents
Perspecsys Inc.
Notes to the consolidated financial statements
For the six months ended as at June 30, 2015 and 2014 (unaudited)
For the years ended as at December 31, 2014 and 2013 (audited)
(Expressed in U.S. Dollars)
8. Commitments
The Company’s head office, entered into a seven year facilities lease agreement with a commencement date of June 1, 2014 through February 26, 2021. Future lease commitments are as follows:
| As of December 31, 2014 | ||||
| 2015 |
$ | 278,000 | ||
| 2016 |
239,000 | |||
| 2017 |
244,000 | |||
| 2018 |
248,000 | |||
| 2019 |
251,000 | |||
| Thereafter |
359,000 | |||
|
|
|
|||
| $ | 1,619,000 | |||
|
|
|
|||
9. Financial instruments
Fair value measurement
The estimated fair values of the Company’s financial instruments are summarized as follows:
| As of June 30, 2015 | ||||||||||||||||
| (unaudited) | ||||||||||||||||
| Total | Quoted market prices in active markets (Level 1) |
Significant other observable inputs (Level 2) |
Significant unobservable inputs (Level 3) |
|||||||||||||
| $ | $ | $ | ||||||||||||||
| Financial assets |
||||||||||||||||
| Cash |
1,058,541 | 1,058,541 | — | — | ||||||||||||
| Financial liabilities |
||||||||||||||||
| Convertible debentures |
7,340,583 | — | 7,340,583 | — | ||||||||||||
| Note payable |
441,929 | — | 441,929 | — | ||||||||||||
| As of December 31, 2014 | ||||||||||||||||
| Total | Quoted market prices in active markets (Level 1) |
Significant other observable inputs (Level 2) |
Significant unobservable inputs (Level 3) |
|||||||||||||
| $ | $ | $ | ||||||||||||||
| Financial assets |
||||||||||||||||
| Cash |
3,920,223 | 3,920,223 | — | — | ||||||||||||
| Financial liabilities |
||||||||||||||||
| Convertible debentures |
6,958,487 | — | 6,958,487 | — | ||||||||||||
| Note payable |
493,791 | — | 493,791 | — | ||||||||||||
F-94
Table of Contents
Perspecsys Inc.
Notes to the consolidated financial statements
For the six months ended as at June 30, 2015 and 2014 (unaudited)
For the years ended as at December 31, 2014 and 2013 (audited)
(Expressed in U.S. Dollars)
| As of December 31, 2013 | ||||||||||||||||
| Total | Quoted market prices in active markets (Level 1) |
Significant other observable inputs (Level 2) |
Significant unobservable inputs (Level 3) |
|||||||||||||
| $ | $ | $ | ||||||||||||||
| Financial assets |
||||||||||||||||
| Cash |
5,847,681 | 5,847,681 | — | — | ||||||||||||
The fair values of cash, accounts receivable, accounts payable and accrued liabilities, and obligations under capital leases approximate their carrying values due to the short-term nature of these financial instruments.
The carrying amount of the long-term note payable and convertible debenture approximates fair value. The fair value is determined using the present value of future cash flows under current financing agreements, based on the Company’s current estimated borrowing rate for loans with similar terms and conditions.
Credit risk
Credit risk arises from the potential that a counterparty will fail to perform its obligations. The Company is exposed to credit risk from customers. However, the Company has a significant number of customers, which minimizes the concentration of credit risk. As at June 30, 2015 (unaudited), three customers accounted for 75% of the Company’s accounts receivable, at 40%, 23%, and 12%, respectively. As at December 31, 2014, three customers accounted for more than 75% of the Company’s accounts receivable, at 44%, 21%, and 10%, respectively. As at December 31, 2013, five customers accounted for more than 93% of the Company’s accounts receivable, at 30%, 26%, 14%, 12%, and 10%, respectively.
Liquidity risk
The Company’s objective is to have sufficient liquidity to meet its liabilities when due. The Company monitors its cash balances and cash flows generated from operations to meet its requirements. As at June 30, 2015, the most significant financial liabilities are: accounts payable and accrued liabilities, obligations under capital lease, convertible debentures and note payable.
Foreign exchange risk
The Company earns revenue and incurs expenses denominated in Canadian dollars, U.S. dollars and other currencies, and is exposed to foreign exchange risk from fluctuations in these foreign currency rates on monetary working capital balances.
F-95
Table of Contents
Perspecsys Inc.
Notes to the consolidated financial statements
For the six months ended as at June 30, 2015 and 2014 (unaudited)
For the years ended as at December 31, 2014 and 2013 (audited)
(Expressed in U.S. Dollars)
10. Income taxes
The significant components of the Company’s temporary differences are as follows:
| Six months Ended June 30, 2015 |
Six months Ended June 30, 2014 |
Year Ended December 31, 2014 |
Year Ended December 31, 2013 |
|||||||||||||
| $ | $ | $ | $ | |||||||||||||
| (unaudited) | (unaudited) | |||||||||||||||
| Loss carryforwards |
26,442,591 | 19,876,248 | 23,513,177 | 15,076,632 | ||||||||||||
| Property and Equipment |
8,802 | 15,449 | 46,257 | 10,750 | ||||||||||||
| Financing fees |
111,158 | 160,937 | 90,170 | 126,552 | ||||||||||||
| SR&ED Expenditure Pool |
722,866 | 844,591 | 777,236 | 847,746 | ||||||||||||
|
|
|
|
|
|
|
|
|
|||||||||
| 27,285,417 | 20,897,225 | 24,426,840 | 16,061,680 | |||||||||||||
| Valuation Allowance |
(27,285,417 | ) | (20,897,225 | ) | (24,426,840 | ) | (16,061,680 | ) | ||||||||
|
|
|
|
|
|
|
|
|
|||||||||
| Net temporary differences |
— | — | — | |||||||||||||
|
|
|
|
|
|
|
|
|
|||||||||
As of December 31, 2014, the Company has income tax losses of approximately $21,874,000, which may be used to reduce future years’ Canadian taxable income until 2034. The benefits resulting from these tax losses have not been recognized in the financial statements and the amounts and dates of expiration are as follows:
Non-capital loss carryforwards
| Expiry |
Amount | |||
| $ | ||||
| 2026 |
88,000 | |||
| 2027 |
105,000 | |||
| 2028 |
387,000 | |||
| 2029 |
839,000 | |||
| 2030 |
1,017,000 | |||
| 2031 |
1,556,000 | |||
| 2032 |
3,707,000 | |||
| 2033 (April 25, 2033) |
1,346,000 | |||
| 2033 (December 31, 2033) |
3,811,000 | |||
| 2034 |
9,018,000 | |||
|
|
|
|||
| 21,874,000 | ||||
|
|
|
|||
F-96
Table of Contents
Perspecsys Inc.
Notes to the consolidated financial statements
For the six months ended as at June 30, 2015 and 2014 (unaudited)
For the years ended as at December 31, 2014 and 2013 (audited)
(Expressed in U.S. Dollars)
For financial reporting purposes, loss before income taxes for periods reported includes the following components:
| Six months Ended June 30, 2015 |
Six months Ended June 30, 2014 |
Year Ended December 31, 2014 |
Year Ended December 31, 2013 |
|||||||||||||
| $ | $ | $ | ||||||||||||||
| (unaudited | ) | (unaudited | ) | |||||||||||||
| Canada |
(4,781,128 | ) | (5,185,544 | ) | (10,640,586 | ) | (6,227,402 | ) | ||||||||
| United States |
(228,314 | ) | 100,495 | (87,299 | ) | 121,272 | ||||||||||
| UK |
45,073 | 20,062 | 54,669 | — | ||||||||||||
|
|
|
|
|
|
|
|
|
|||||||||
| Loss before income taxes |
(4,964,369 | ) | (5,064,987 | ) | (10,673,216 | ) | (6,106,130 | ) | ||||||||
|
|
|
|
|
|
|
|
|
|||||||||
| The reconciliation between the Company’s statutory and effective tax rates are as follows: |
| |||||||||||||||
|
|
||||||||||||||||
| Income tax expense at statutory rate |
(1,737,529 | ) | (1,772,745 | ) | (3,735,626 | ) | (2,137,146 | ) | ||||||||
|
|
|
|
|
|
|
|
|
|||||||||
| State taxes |
7,855 | 3,560 | 8,199 | 23,981 | ||||||||||||
| Valuation allowance |
862,048 | 1,283,947 | 2,230,853 | 1,397,893 | ||||||||||||
| Foreign tax rate differences |
260,609 | 418,028 | 715,855 | 441,452 | ||||||||||||
| Foreign exchange impact |
85,549 | 22,670 | 45,393 | — | ||||||||||||
| Permanent and other |
529,323 | 74,575 | 758,913 | 344,721 | ||||||||||||
|
|
|
|
|
|
|
|
|
|||||||||
| Income tax provision |
7,855 | 30,035 | 23,587 | 70,901 | ||||||||||||
|
|
|
|
|
|
|
|
|
|||||||||
Scientific research and experimental development expenditure carryforwards
During the period ending June 30, 2015, the Company has unused scientific research and experimental development expenditures in the amount of approximately $722,866 (unaudited) (December 31, 2014—$777,236; December 31, 2013—$847,746) which are subject to acceptance by Canada Revenue Agency. These amounts are available to reduce future years’ taxable income and have no expiry date.
As referenced in Note 2, in the year when Perspecsys Corp. makes a SR&ED claim, the Company accrues the benefit of research and development investment tax credits in the period that the related expenditures are incurred on a best estimate basis as there is a high likelihood of receiving approval from the income tax authorities subsequent to year-end. The last claim made by Perspecsys Corp. was on April 25, 2013 when Perspecsys Corp. lost its Canadian Controlled Private Corporation (“CCPC”) status.
The income tax provision at June 30, 2015 reflects a full accounting of tax filings under ASC Subtopic 740-10. The Company is not currently under federal, state, provincial, local or foreign jurisdiction tax examinations. The Company recognizes interest and penalties, as estimated or incurred, as general and income tax expense.
The Company files income tax returns in Canada, UK, and in the U.S. federal and various state and local jurisdictions. As of June 30, 2015, the Company’s tax years for 2011 through 2014 are subject to examination by tax authorities.
F-97
Table of Contents
Perspecsys Inc.
Notes to the consolidated financial statements
For the six months ended as at June 30, 2015 and 2014 (unaudited)
For the years ended as at December 31, 2014 and 2013 (audited)
(Expressed in U.S. Dollars)
11. Contingency
The company is faced with a patent infringement lawsuit. The outcome or settlement of this case is not determinable or reasonably estimated as of June 30, 2015. As a result, no amounts have been accrued.
12. Subsequent events
Acquisition by Blue Coat Systems Inc.
On July 30, 2015, the Company was acquired by Blue Coat, Inc. in an all stock purchase. The purchase price consists of a cash payment of $29.7 million, a guaranteed earn out of $15.0 million and an earn out of $10.0 million contingent upon achieving certain net revenue targets within the first year. In connection with the Blue Coat acquisition, the Company’s loss carryforwards were utilized, and the Convertible Debenture and Notes Payable were repaid and extinguished.
The Company has evaluated subsequent events for possible disclosure through March 10, 2016, noting no events that would require adjustments to, or disclosure in, the consolidated financial statements for the reporting periods.
F-98
Table of Contents
UNAUDITED PRO FORMA CONDENSED COMBINED FINANCIAL INFORMATION
On July 30, 2015 the Company completed the acquisition of Perspecsys, Inc., a leader in enterprise cloud data protection solutions. The Company believes the acquisition will enable it to expand in the Cloud Access Security Broker (“CASB”) segment.
The following unaudited pro forma condensed combined financial information is based on the historical financial statements of the Company and Perspecsys and the assumptions and adjustments described in the accompanying notes to the unaudited pro forma condensed combined financial information.
The allocations of the Perspecsys purchase price to the identifiable intangible assets used in the unaudited pro forma condensed combined financial information are based on third-party valuation reports, estimates and currently available information.
The unaudited pro forma condensed combined financial information is presented for illustration purposes only and is not intended to represent what the Company’s results of operations would actually have been if the acquisition had occurred on those dates or to project the Company’s results of operations for any future period.
The unaudited pro forma condensed combined financial information should be read in conjunction with the accompanying notes to the unaudited pro forma condensed combined information as well as the Company’s and Perspecsys’ historical consolidated financial statements and accompanying notes included in this prospectus.
The unaudited pro forma condensed combined financial information included herein does not give effect to any potential cost reductions or other operating efficiencies that could result from the acquisition, including but not limited to, those associated with potential (i) reductions of corporate overhead, (ii) eliminations of duplicate functions and (iii) increased operational efficiencies through the adoption of best practices and capabilities from each company.
The unaudited pro forma condensed combined statements of operations for the year ended April 30, 2016, has been prepared to reflect the acquisition of Perspecsys as if it had occurred on May 1, 2015, the first day of the Company’s 2016 fiscal year. The unaudited pro forma condensed combined statement of operations was derived from the Company’s audited historical consolidated statements of operations for the period from May 1, 2015 through May 22, 2015 and the period from May 23, 2015 through April 30, 2016. Although the period from May 1, 2015 to May 22, 2015 relates to the Predecessor and the period from May 23, 2015 to April 30, 2016 relates to the Successor, in order to assist in the period to period comparison we have combined these periods as a sum of the amounts without any other adjustments and refer to the combined period as the combined year ended April 30, 2016. In addition, the unaudited pro forma condensed combined statement of operations was derived from Perspecsys’ unaudited financial results for the period April 1, 2015 through June 30, 2015. The Company’s fiscal year end is April 30, while Perspecsys’ fiscal year end is December 31. Accordingly, the Company has aligned Perspecsys’ reporting period to the Company’s fiscal year.
F-99
Table of Contents
UNAUDITED PRO FORMA CONDENSED COMBINED STATEMENT OF OPERATIONS
(in thousands)
| Blue Coat, Inc. | Perspecsys, Inc. | |||||||||||||||||||
| Year Ended April 30, 2016 |
Period from April 1, 2015 to June 30, 2015 |
Pro Forma Adjustments |
Pro Forma Combined |
|||||||||||||||||
| Net revenue: |
||||||||||||||||||||
| Product |
$ | 313,819 | — | — | 313,819 | |||||||||||||||
| Service and subscription |
284,518 | 1,103 | (993 | ) | A | 284,628 | ||||||||||||||
|
|
|
|
|
|
|
|
|
|||||||||||||
| Total net revenue |
598,337 | 1,103 | (993 | ) | 598,447 | |||||||||||||||
|
|
|
|
|
|
|
|
|
|||||||||||||
| Cost of net revenue: |
||||||||||||||||||||
| Product |
135,806 | — | — | 135,806 | ||||||||||||||||
| Service and subscription |
69,711 | 248 | 390 | B | 70,349 | |||||||||||||||
|
|
|
|
|
|
|
|
|
|||||||||||||
| Total cost of net revenue |
205,517 | 248 | 390 | 206,155 | ||||||||||||||||
|
|
|
|
|
|
|
|
|
|||||||||||||
| Gross profit |
392,820 | 855 | (1,383 | ) | 392,292 | |||||||||||||||
|
|
|
|
|
|
|
|
|
|||||||||||||
| Operating expenses: |
||||||||||||||||||||
| Sales and marketing |
241,118 | 2,028 | — | 243,146 | ||||||||||||||||
| Research and development |
131,367 | 649 | — | 132,016 | ||||||||||||||||
| General and administrative |
148,169 | 548 | (1,235 | ) | C | 147,482 | ||||||||||||||
| Amortization of intangible assets |
122,757 | — | 90 | B | 122,847 | |||||||||||||||
| Change in fair value of acquisition-related earn-out liability |
(970 | ) | — | — | (970 | ) | ||||||||||||||
| Restructuring and other charges |
2,857 | — | — | 2,857 | ||||||||||||||||
|
|
|
|
|
|
|
|
|
|||||||||||||
| Total operating expenses |
645,298 | 3,225 | (1,145 | ) | 647,378 | |||||||||||||||
|
|
|
|
|
|
|
|
|
|||||||||||||
| Operating income (loss) |
(252,478 | ) | (2,370 | ) | (238 | ) | (255,086 | ) | ||||||||||||
| Interest income |
144 | — | — | 144 | ||||||||||||||||
| Interest expense |
(103,372 | ) | (187 | ) | 187 | D | (103,372 | ) | ||||||||||||
| Debt extinguishment and refinancing costs |
(3,406 | ) | — | — | (3,406 | ) | ||||||||||||||
| Other expense, net |
(1,108 | ) | 448 | — | (660 | ) | ||||||||||||||
|
|
|
|
|
|
|
|
|
|||||||||||||
| Income (loss) before income taxes |
(360,220 | ) | (2,109 | ) | (51 | ) | (362,380 | ) | ||||||||||||
| Income tax provision (benefit) |
(71,139 | ) | 3 | (19 | ) | E | (71,155 | ) | ||||||||||||
|
|
|
|
|
|
|
|
|
|||||||||||||
| Net income (loss) |
$ | (289,081 | ) | $ | (2,112 | ) | $ | (32 | ) | $ | (291,225 | ) | ||||||||
|
|
|
|
|
|
|
|
|
|||||||||||||
| * | Net loss per share information is not presented for the combined year ended April 30, 2016 due to changes in capital structure resulting from the Bain Acquisition on May 22, 2015. |
F-100
Table of Contents
NOTES TO UNAUDITED PRO FORMA CONDENSED COMBINED FINANCIAL INFORMATION
Note 1. Basis of Pro Forma Presentation
On July 30, 2015 the Company completed the acquisition of Perspecsys, Inc., a leader in enterprise cloud data protection solutions. The purchase price of $45.5 million consisted of a cash payment of $29.7 million, a guaranteed earn out of $15.0 million and an earn out of $10.0 million contingent upon achieving certain net revenue targets within the first year. The guaranteed earn out and contingent earn out had an acquisition date fair value of $14.8 million and $1.0 million, respectively.
The unaudited pro forma condensed combined statements of operations for the year ended April 30, 2016, has been prepared to reflect the acquisition of Perspecsys as if it had occurred on May 1, 2015, the first day of the Company’s 2016 fiscal year. The unaudited pro forma condensed combined statement of operations was derived from the Company’s audited historical consolidated statement of operations for the period from May 1, 2015 through May 22, 2015 and the period from May 23, 2015 through April 30, 2016. Although the period from May 1, 2015 to May 22, 2015 relates to the Predecessor and the period from May 23, 2015 to April 30, 2016 relates to the Successor, in order to assist in the period to period comparison we have combined these periods as a sum of the amounts without any other adjustments and refer to the combined period as the combined year ended April 30, 2016. In addition, the unaudited pro forma condensed combined statement of operations was derived from Perspecsys’ unaudited financial results for the period April 1, 2015 through June 30, 2015. The Company’s fiscal year end is April 30, while Perspecsys’ fiscal year end is December 31. Accordingly, the Company has aligned Perspecsys’ reporting period to the Company’s fiscal year.
The historical consolidated results of operations of Perspecsys have been prepared in accordance with U.S. GAAP.
Note 2. Unaudited Pro Forma Condensed Combined Statement of Operations Adjustments
The unaudited pro forma condensed combined statement of operations adjustments include:
| A. | Adjustments to service and subscription revenue to reflect (i) the impact of the write down of deferred revenue acquired, and (ii) the reversal of the impact of the write-down of deferred revenue over the periods presented. |
| B. | Adjustments to reflect the net impact of the amortization of intangible assets acquired. The estimated amortization for each period reflects the amounts and estimated useful lives as recorded in purchase accounting. Intangible assets acquired and their estimated useful lives are shown below: |
| Intangible Type |
Fair Value (in thousands) |
Useful Life | ||||
| Trade names |
$ | 20 | 2 years | |||
| Non-competition agreements |
360 | 2 years | ||||
| Customer relationships |
1,400 | 10 years | ||||
| Developed technology |
9,300 | 6 years | ||||
| C. | Adjustments to eliminate transaction costs incurred that are nonrecurring and directly attributable to the Perspecsys acquisition. |
| D. | Adjustments to reflect the elimination of Perspecsys’ convertible debentures, bearing non-cumulative interest at a rate of 5% per year. The elimination of the convertible debentures had the effect of eliminating the interest expense incurred during the periods presented. |
| E. | Adjustments to reflect the estimated impact to the income tax provision (benefit) for the adjustments identified. |
F-101
Table of Contents
SCHEDULE I—CONDENSED FINANCIAL INFORMATION OF REGISTRANT
BLUE COAT, INC.
(PARENT COMPANY ONLY)
CONDENSED BALANCE SHEET
(In thousands, except share and per share amounts)
| April 30, 2016 |
||||
| ASSETS |
||||
| Current Assets: |
||||
| Cash and cash equivalents |
$ | 1,236 | ||
| Other current assets |
15,926 | |||
| Investment in subsidiaries |
602,242 | |||
|
|
|
|||
| Total current assets |
619,404 | |||
|
|
|
|||
| Total assets |
$ | 619,404 | ||
|
|
|
|||
| LIABILITIES AND STOCKHOLDERS’ EQUITY |
||||
| Current Liabilities: |
||||
| Accrued liabilities |
$ | 1,056 | ||
|
|
|
|||
| Total current liabilities |
1,056 | |||
|
|
|
|||
| Commitments and Contingencies |
||||
| Stockholders’ Equity: |
||||
| Common stock: $0.001 par value; 150,000,000 shares authorized; 91,172,391 shares issued and outstanding at April 30, 2016 |
91 | |||
| Additional paid-in capital |
889,861 | |||
| Accumulated deficit |
(271,604 | ) | ||
|
|
|
|||
| Total stockholders’ equity |
618,348 | |||
|
|
|
|||
| Total liabilities and stockholders’ equity |
$ | 619,404 | ||
|
|
|
|||
The accompanying notes are an integral part of the condensed financial information of the registrant.
F-102
Table of Contents
BLUE COAT, INC.
(PARENT COMPANY ONLY)
CONDENSED STATEMENT OF OPERATIONS AND COMPREHENSIVE LOSS
(In thousands)
| Period from May 23, 2015 to April 30, 2016 |
||||
| General and administrative expenses |
$ | 4 | ||
|
|
|
|||
| Operating loss |
(4 | ) | ||
| Interest income |
1 | |||
|
|
|
|||
| Loss before equity in net loss of subsidiaries |
(3 | ) | ||
| Equity in net loss in subsidiaries, net of taxes |
(271,601 | ) | ||
|
|
|
|||
| Net loss |
(271,604 | ) | ||
| Other comprehensive loss attributable to subsidiaries |
(1,908 | ) | ||
|
|
|
|||
| Comprehensive loss |
$ | (273,512 | ) | |
|
|
|
|||
The accompanying notes are an integral part of the condensed financial information of the registrant.
F-103
Table of Contents
BLUE COAT, INC.
(PARENT COMPANY ONLY)
CONDENSED STATEMENT OF CASH FLOWS
(In thousands)
| Period from May 23, 2015 to April 30, 2016 |
||||
| Operating Activities: |
||||
| Net loss |
$ | (271,604 | ) | |
| Adjustments to reconcile net loss to net cash provided by operating activities: |
||||
| Equity in net loss in subsidiaries, net of taxes |
271,601 | |||
| Changes in operating assets and liabilities, net of acquisitions: |
||||
| Other current assets |
(15,926 | ) | ||
| Accrued liabilities |
1,056 | |||
|
|
|
|||
| Net cash used in operating activities |
(14,873 | ) | ||
|
|
|
|||
| Investing Activities: |
||||
| Investment in subsidiaries |
(873,843 | ) | ||
|
|
|
|||
| Net cash used in investing activities |
(873,843 | ) | ||
|
|
|
|||
| Financing Activities: |
||||
| Net proceeds from private equity investors |
840,750 | |||
| Net proceeds from employee investors |
52,482 | |||
| Repurchases of common stock, net |
(3,280 | ) | ||
|
|
|
|||
| Net cash provided by financing activities |
889,952 | |||
|
|
|
|||
| Net increase in cash and cash equivalents |
1,236 | |||
| Cash and cash equivalents, beginning of period |
— | |||
|
|
|
|||
| Cash and cash equivalents, end of period |
$ | 1,236 | ||
|
|
|
|||
The accompanying notes are an integral part of the condensed financial information of the registrant.
F-104
Table of Contents
SCHEDULE I—CONDENSED FINANCIAL INFORMATION OF REGISTRANT
BLUE COAT, INC.
(PARENT COMPANY ONLY)
NOTES TO CONDENSED FINANCIAL STATEMENTS
Note 1. Basis of Presentation
Blue Coat, Inc. (the “Parent Company”) is a holding company with no material operations of its own and conducts substantially all of its activities through its subsidiaries. The Parent Company was incorporated in March 2015 (originally named Batman Holdings, Inc.) and became the ultimate parent company of our business in May 2015, pursuant to the acquisition by Bain Capital Investors, LLC on May 22, 2015 (the “Bain Acquisition”).
The accompanying condensed financial statements are presented only for periods following the Bain Acquisition. We have not presented parent-only condensed financial statements for periods prior to the Bain Acquisition, as we believe the information will not be meaningful to investors due to differences in the legal entity structure and capitalization, and application of purchase accounting as of the closing date of the Bain acquisition.
The accompanying condensed Parent Company financial statements have been prepared in accordance with Rule 12-04, Schedule I or Regulation S-X, and using the same accounting principles and policies described in the notes to the consolidated financial statements. We have presented our Parent Company’s investments in subsidiaries under the equity method. Refer to the consolidated financial statements and notes of Blue Coat, Inc. presented above for additional information and disclosures with respect to these condensed financial statements.
Under the terms of agreements governing indebtedness of Blue Coat Holdings, Inc., a subsidiary of Blue Coat, Inc., such subsidiary is significantly restricted from making dividend payments, loans or advances and other upstream distributions to Blue Coat, Inc. and its subsidiaries. These restrictions have resulted in the restricted net assets (as defined in Rule 4-08(e)(3) of Regulation S-X) of Blue Coat, Inc. and its subsidiaries exceeding 25% of the consolidated net assets of Blue Coat, Inc. and its subsidiaries.
Note 2. Commitments and Contingencies
The Parent Company has no direct commitments and contingencies, but its subsidiaries do. See Note 13 to the consolidated financial statements of Blue Coat, Inc.
F-105
Table of Contents

BLUE COAT Network + Security + Cloud
Table of Contents

Blue Coat Inc. | 384 Santa Trinita Ave. Sunnyvale, CA 94085 | tel. +1.408.220.2200 | www.bluecoat.com
Table of Contents
PART II
INFORMATION NOT REQUIRED IN THE PROSPECTUS
Item 13. Other Expenses of Issuance and Distribution.
Estimated costs and expenses, other than underwriting discounts and commissions, payable by us in connection with the sale of the common stock being registered under this registration statement are as follows:
| Amount to be Paid |
||||
| SEC registration fee |
$ | 10,070 | ||
| FINRA filing fee |
* | |||
| NYSE listing fee |
* | |||
| Blue sky fees and expenses |
* | |||
| Printing and engraving |
* | |||
| Legal fees and expenses |
* | |||
| Accounting fees and expenses |
* | |||
| Transfer agent and registrar fees |
* | |||
| Miscellaneous fees and expenses |
* | |||
| Total |
$ | * | ||
|
|
|
|||
| * | To be completed by amendment. |
Item 14. Indemnification of Directors and Officers.
On completion of this offering, our restated certificate of incorporation will contain provisions that eliminate, to the maximum extent permitted by the General Corporation Law of the State of Delaware, the personal liability of our directors and officers for monetary damages for breach of their fiduciary duties as directors or officers. Our restated certificate of incorporation and amended and restated bylaws will provide that we must indemnify our directors and officers and may indemnify our employees and other agents to the fullest extent permitted by the General Corporation Law of the State of Delaware.
Section 145 of the General Corporation Law of the State of Delaware provides that a corporation may indemnify any person made a party to an action by reason of the fact that he or she was a director, officer, employee or agent of the corporation or is or was serving at the request of a corporation against expenses (including attorneys’ fees), judgments, fines and amounts paid in settlement actually and reasonably incurred by him or her in connection with such action if he or she acted in good faith and in a manner he or she reasonably believed to be in, or not opposed to, the best interests of the corporation and, with respect to any criminal action or proceeding, had no reasonable cause to believe his or her conduct was unlawful, except that, in the case of an action by or in right of the corporation, no indemnification may generally be made in respect of any claim as to which such person is adjudged to be liable to the corporation.
We have entered into indemnification agreements with our directors, in addition to the indemnification provided for in our restated certificate of incorporation and amended and restated bylaws, and intend to enter into indemnification agreements with any new directors in the future.
We have purchased and intend to maintain insurance on behalf of each and any person who is or was one of our directors or officers against any loss arising from any claim asserted against him or her and incurred by him or her in any such capacity, subject to certain exclusions.
The Underwriting Agreement (Exhibit 1.1 hereto) provides for indemnification by the underwriters of us and our executive officers and directors for certain liabilities, including liabilities arising under the Securities Act of 1933, as amended, or the Securities Act.
See also the undertakings set out in response to Item 17 herein.
II-1
Table of Contents
Item 15. Recent Sales of Unregistered Securities.
Equity Securities
In connection the Bain Acquisition, on May 22, 2015, we issued and sold 84,075,000 shares of common stock to the Sponsor and the other Acquiring Funds for aggregate consideration of $840.75 million without registration in reliance on the exemption afforded by Section 4(a)(2) of the Securities Act and Rule 506 promulgated thereunder. We also issued 2,686,320 shares of our common stock and options to purchase 158,800.74 shares of our common stock having an average weighted exercise price of with an exercise price of $2.26 per share, resulting from the rollover of certain stock and options to purchase common stock of the Predecessor. These shares of common stock and options to purchase common stock were issued without registration in reliance on the exemptions afforded by Section 4(a)(2) of the Securities Act and Rule 506 promulgated thereunder.
Since May 22, 2015, we have issued 4,649,603 shares of our common stock to our employees at an average purchase price of $5.25 and options to purchase 13,667,691 shares of our common stock at a weighted average exercise price of $11.04. These securities were issued without registration in reliance on the exemptions afforded by Section 4(a)(2) of the Securities Act and Rule 701 and Regulation D promulgated thereunder.
Debt Securities
In connections with the Bain Acquisition, on May 22, 2015, Blue Coat Holdings, Inc. issued an aggregate principal amount of $470.0 million of 8.375% Senior Notes. See “Description of Indebtedness” for a description of the terms of the Senior Notes. The Senior Notes were offered and sold to qualified institutional buyers pursuant to Rule 144A under the Securities Act or to non-U.S. investors outside the United States in compliance with Regulation S of the Securities Act.
ITEM 16. EXHIBITS AND FINANCIAL STATEMENT SCHEDULES.
(a) Exhibits.
See the Exhibit Index immediately following the signature page hereto for a list of exhibits filed as part of this registration statement on Form S-1, which Exhibit Index is incorporated herein by reference.
(b) Financial Statement Schedules.
All financial statement schedules not listed in the Index to Consolidated Financial Statements are omitted because the information called for is not required or is shown either in the consolidated financial statements or in the notes thereto.
ITEM 17. UNDERTAKINGS.
The undersigned registrant hereby undertakes to provide to the underwriters at the closing specified in the underwriting agreement, certificates in such denominations and registered in such names as required by the underwriters to permit prompt delivery to each purchaser.
Insofar as indemnification for liabilities arising under the Securities Act may be permitted to directors, officers and controlling persons of the registrant pursuant to the foregoing provisions, or otherwise, the registrant has been advised that in the opinion of the Securities and Exchange Commission such indemnification is against public policy as expressed in the Securities Act and is, therefore, unenforceable. In the event that a claim for indemnification against such liabilities (other than the payment by the registrant of expenses incurred or paid by a director, officer or controlling person of the registrant in the successful defense of any action, suit or proceeding) is asserted by such director, officer or controlling person in connection with the securities being
II-2
Table of Contents
registered, the registrant will, unless in the opinion of its counsel the matter has been settled by controlling precedent, submit to a court of appropriate jurisdiction the question whether such indemnification by it is against public policy as expressed in the Securities Act and will be governed by the final adjudication of such issue.
The undersigned registrant hereby undertakes that:
(1) For purposes of determining any liability under the Securities Act, the information omitted from the form of prospectus filed as part of this registration statement in reliance upon Rule 430A and contained in a form of prospectus filed by the registrant pursuant to Rule 424(b)(1) or (4) or 497(h) under the Securities Act shall be deemed to be part of this registration statement as of the time it was declared effective.
(2) For the purpose of determining any liability under the Securities Act, each post-effective amendment that contains a form of prospectus shall be deemed to be a new registration statement relating to the securities offered therein, and the offering of such securities at that time shall be deemed to be the initial bona fide offering thereof.
II-3
Table of Contents
SIGNATURES
Pursuant to the requirements of the Securities Act of 1933, the registrant has duly caused this registration statement to be signed on its behalf by the undersigned, thereunto duly authorized, in the City of Sunnyvale, State of California, on June 7, 2016.
| Blue Coat, Inc. | ||
| By: | /s/ Gregory Clark | |
| Name: Gregory Clark | ||
| Title: Chief Executive Officer | ||
Pursuant to the requirements of the Securities Act of 1933, this registration statement has been signed by the following persons in the capacities and on the dates indicated below:
| Signature |
Title |
Date | ||
| /s/ Gregory Clark Gregory Clark |
Chief Executive Officer & Director (Principal Executive Officer) |
June 7, 2016 | ||
| /s/ Nicholas Noviello Nicholas Noviello |
Chief Financial Officer (Principal Financial Officer and Principal Accounting Officer) |
June 7, 2016 | ||
| * Darren Abrahamson |
Director | June 7, 2016 | ||
| * David Humphrey |
Director | June 7, 2016 | ||
| * Ian Loring |
Director | June 7, 2016 | ||
| * Dwight Poler |
Director | June 7, 2016 | ||
| * Charles Robel |
Director | June 7, 2016 | ||
| *By: | /s/ Nicholas Noviello | |
| Attorney-in-Fact |
II-4
Table of Contents
EXHIBIT INDEX
| Exhibit |
Exhibit Title | |
| 1.1* | Form of Underwriting Agreement | |
| 3.1* | Form of Restated Certificate of Incorporation of the Registrant, to be effective upon closing of this offering | |
| 3.2* | Form of Amended and Restated Bylaws of the Registrant, to be effective upon closing of this offering | |
| 4.1* | Specimen Common Stock Certificate of the Registrant | |
| 4.2† | Indenture, dated as of May 22, 2015, among Batman Merger Sub, Inc., the Guarantors party thereto, and Wilmington Trust, National Association, as Trustee | |
| 4.3† | Supplemental Indenture, dated as of May 22, 2015, among Blue Coat Holdings, Inc., the Guarantors party thereto, and Wilmington Trust, National Association, as Trustee | |
| 4.4† | Second Supplemental Indenture, dated as of December 10, 2015, among Blue Coat Holdings, Inc., the Guarantors party thereto, and Wilmington Trust, National Association, as Trustee | |
| 4.5† | Registration Rights Agreement, dated as of May 22, 2015, by and among Batman Holdings, Inc. and the Stockholders set forth therein | |
| 4.6* | Amended and Restated Stockholders’ Agreement, dated September 9, 2015, by and among the Registrant and certain stockholders | |
| 5.1* | Opinion of Ropes & Gray LLP | |
| 10.1† | Management Agreement, dated as of May 22, 2015, between Batman Holdings Inc., Batman Intermediate Holdings A, Inc., Batman Intermediate Holdings B, Inc., Blue Coat Holdings, Inc., Blue Coat Systems, Inc., Bain Capital Private Equity, LP (formerly Bain Capital Partners, LLC), and Bain Capital Private Equity (Europe), LLP (formerly Bain Capital Europe, LLP) | |
| 10.1.1* | Management Agreement, to be effective upon closing of this offering, between Blue Coat, Inc., Batman Intermediate Holdings A, Inc., Batman Intermediate Holdings B, Inc., Blue Coat Holdings, Inc., Blue Coat Systems, Inc., Bain Capital Private Equity, LP, and Bain Capital Private Equity (Europe), LLP | |
| 10.2† | Credit Agreement, dated as of May 22, 2015, by and among Batman Intermediate Holdings B, Inc., Blue Coat Holdings, Inc. (as successor by merger to Batman Merger Sub, Inc.), the Lenders party thereto, Jefferies Finance LLC, as Administrative Agent, Collateral Agent, Letter of Credit Issuer, Swingline Lender and Lender, Lead Arranger and Bookrunner, and ING Capital LLC and Newstar Financial, LLC, as Co-Documentation Agents | |
| 10.3† | Amendment No. 1 to Credit Agreement and Joinder Agreement, dated as of November 16, 2015, by and among the Lenders party thereto, Blue Coat Holdings, Inc., as Borrower, and Jefferies Finance LLC, as Administrative Agent | |
| 10.4† | Pledge Agreement, dated as of May 22, 2015, among Batman Intermediate Holdings B, Inc., Blue Coat Holdings, Inc. (as successor by merger to Batman Merger Sub, Inc.), each of the Subsidiaries of the Borrower party thereto, and Jefferies Finance LLC, as Collateral Agent | |
| 10.5† | Supplement, dated as of November 16, 2015, to the Pledge Agreement, dated as of May 22, 2015 among Batman Intermediate Holdings B, Inc., Blue Coat Holdings, Inc. (as successor by merger to Batman Merger Sub, Inc.), each of the Subsidiaries of the Borrower party thereto, and Jefferies Finance LLC, as Collateral Agent | |
| 10.6† | Security Agreement, dated as of May 22, 2015, among Batman Intermediate Holdings B, Inc., Blue Coat Holdings, Inc. (as successor by merger to Batman Merger Sub, Inc.), each of the Subsidiaries of the Borrower party thereto, and Jefferies Finance LLC, as Collateral Agent | |
| 10.7† | Supplement, dated as of November 16, 2015, to the Security Agreement, dated as of May 22, 2015, among Batman Intermediate Holdings B, Inc., Blue Coat Holdings, Inc. (as successor by merger to Batman Merger Sub, Inc.), each of the Subsidiaries of the Borrower party thereto, and Jefferies Finance LLC, as Collateral Agent | |
| 10.8† | Guarantee, dated as of May 22, 2015, by and amount Batman Intermediate Holdings B, Inc., as Guarantor, Blue Coat Systems, Inc., as Guarantor, and Jefferies Finance, LLC, as the Collateral Agent | |
| 10.9† | Supplement, dated as of November 16, 2015, to the Guarantee, dated as of May 22, 2015, by and amount Batman Intermediate Holdings B, Inc., as Guarantor, Blue Coat Systems, Inc., as Guarantor, and Jefferies Finance, LLC, as the Collateral Agent | |
| 10.10* | 2015 Amended and Restated Equity Incentive Plan |
Table of Contents
| Exhibit |
Exhibit Title | |
| 10.11* | Form of Restricted Stock Agreement under the 2015 Amended and Restated Equity Incentive Plan | |
| 10.12* | Form of Non-Statutory Stock Option Agreement under the 2015 Amended and Restated Equity Incentive Plan | |
| 10.13* | Non-Statutory Rollover Option Agreement between Batman Holdings, Inc. and Michael Fey dated May 22, 2015 | |
| 10.14* | Employment Letter between Gregory S. Clark, Blue Coat Systems, Inc. and Batman Holdings, Inc. effective as of November 12, 2015 | |
| 10.15* | Employment Letter between Blue Coat Systems, Inc. and Michael Fey dated November 17, 2014, as amended and restated | |
| 10.16* | Employment Letter between Blue Coat Systems, Inc. and Nicholas Noviello dated December 28, 2015 | |
| 16.1† | Letter from RSM US LLP, dated January 29, 2016 | |
| 21.1† | List of subsidiaries of the Registrant | |
| 23.1 | Consent of PricewaterhouseCoopers LLP | |
| 23.2 | Consent of RSM US LLP | |
| 23.3 | Consent of PricewaterhouseCoopers LLP | |
| 23.4 | Consent of Deloitte LLP | |
| 23.5* | Consent of Ropes & Gray LLP (included in Exhibit 5.1) | |
| 24.1† | Powers of Attorney (included in the signature pages to this Registration Statement) |
| * | To be filed by amendment. |
| † | Previously filed. |