Attached files
| file | filename |
|---|---|
| 8-K - 8-K - Rimini Street, Inc. | a16-12920_18k.htm |
Exhibit 99.1
Strictly Private & Confidential World Kitchen Group, Inc. Analyst Presentation June 2016
Disclaimer Investor Presentation This communication is for informational purposes only and has been prepared to assist interested parties in making their own evaluation with respect to the proposed business combination between WKI Holding Company Inc. (“WKI”) and GP Investments Acquisition Corp. (“GPIAC”) and for no other purpose. The information contained herein does not purport to be all-inclusive. The data contained herein is derived from various internal and external sources. No representation is made as to the reasonableness of the assumptions made within or the accuracy or completeness of any projections, modelling or back-testing or any other information contained herein. All levels, prices and spreads are historical and do not represent current market levels, prices or spreads, some or all of which may have changed since the issuance of this communication. Any data on past performance, modeling or back-testing contained herein is no indication as to future performance. GPIAC assumes no obligation to update the information in this communication. Disclaimer: These materials have been prepared for informational purposes only and neither No OffeWr oroSorllicditaKtiointchen (“the Company”) nor Morgan Stanley make any implied representations as to the This communication is not intended to and does not constitute an offer to sell or the solicitation of an offer to buy or an i nvitation to purchase any securities or the solicitation of any vote or approavacl icn uanryajucriysdicotironcinocmonnpeclteiotnewnithetshesproopfotsehdebuisninefsos rcommbaintaiotionn bpetrwoeevnidWeKI dan,d oGPrIAaC corcoethpertwiasen, nyor lsihaalbl thileirteybewanhyiscalhe, imssuanyce boretrabnsafesr oef sdecurities in any juorisndictthioneinicnonfotrarvmentaiotniofnappcliocanbletalaiwn. ed herein or omitted herefrom. You agree to keep confidential the Importainnt IfnoforrmaatiotnioFonr Incvoesntotras AindeSdtochkheolrderisn, the fact that this document has been delivered to you, and the fact In connection with the transactions referred to in this communication, on May 13, 2016 GPIAC filed a registration statement on Form S-4 (File No.: 333-211355) with the Securities and ExchangtehCaomtmtihsseionC(“SoECm”) cpoantnainyingisa pcreolimninsairdy perorxiynsgtateamepnot otfeGnPIAtiCathl attraalsoncsonasctittuitoesna.preTlimhinearyepsrotsipmectausteofsG,PIpACr.oAfjter thteiorengistratinondstaftoemrwenat isrdeclared effectiveloGPoIAkCiwnigll msaitl a defimnitievenptrosxyssteattemfoenrtt/phrohspecrtues itno stwocekhroeldeprs roef GpPaIACreandd sbtoackshoelddersoofnWvKI.aTrhisocuomsmaunsicsatuionmispnottioa snusbstwituthe ifcorhthempraoxyy not statement/prospectus or registration statement or for any other document that GPIAC may file with the SEC and send to GPIAC’s stockholders and/or WKI’s stockholders in connection with thebperoproesead tlriaznesadctioins. fINaVcEStT,OaRSnAdNDsSEhCoURuITlYdHOnLoDEtRSbAeRErUeRGliEeDdTOuRpEAoD nTHEaPsROaXYnSTaATcEcMuENrTa/PtReOSrPeECpTUrSeAsNeDnOTtHaEtRioDOnCUoMfENfuTStuFILrEeD WreITHsTuHlEtsSE,C CAREFUwLLYhAiNcDhINmTHaEIRyENdTiIfRfEeTYrWmHEaNtTeHErYiaBEllCyOMfrEoAVmAILAthBLeE BiEnCAfoUSrEmTHaEYtiWoILnL CpONreTAsINeIMnPteORdTAhNTeINreFO.RMNATeIOiNth. IneversttohrseanCd soecmuritpy ahonldyersnwoill rbe able to obtain free copies of the proxy statement/prospectus (when available) and other documents filed with the SEC by GPIAC through the website maintained by the SEC at http://www.sec.gov. Copies of the docuMmeontrsgfialednwiSthttahenSlEeC yby aGPsIAsCuwmill be aavanilayblerferese pofochnarsgeibbyilciotnytatcotinguGpPIdACaatte150aEn. 5y2nod fStrtehete, Sueitse t5i0m03,aNteewsY,orkp, rNoewjeYocrkti1o00n2s2, Aottrn:fIonvrewstoar Rredlations. Participalontos ikn itnhegSoslictiatatieonments contained herein. The Company will make no representations regarding its GPIAC anbduWsKiInanedsthsei,r roesppeectrivaetdiiorenctosrsoanrd fcienrtainnocf tihaelir rrespseuctlivtesexeecxuctivee poftficienrs maayfubellcyonseidxereedcpuartteicidpandtseinfitnheitsiovliceitaatiogn roef peromxiees wnitth raesppepctrotovthee dproposed transactions under the rules of the SEC. Information about the directors and executive officers of GPIAC is set forth in its Annual Report on Form 10-K for the year ended December 31, 2015, wbhicyh witass fiBledowaithrdtheoSfECDonirMeacrctho28r,s2.01T6.hAidsditdioonacl iunfmormeatniotn:re(gi)ardiisngnthoe tpaartincipoanftfseinrthoe prroinxyvsoitliacittaitoions abnyd aMdesocrripgtiaonnof Sthetiar dnirleectyanod irndtihreect interests, by securCityohomldipngas onr yothteorwpiseu, wrcill halsaosbe inoclurdesdeinllthse eprcoxuy srtiattieemsento/prroaspsecstuestasnd, owthhereretlehveanrt minaterrieallsatotiboe nfiletdowitthhtehe SpECrowpheon sthey betcroamenasvailacbtleio. n ForwardoLroookinthg Setartwemiesnets nor any form of commitment or recommendation by Morgan Stanley or the Certain statements included in this communication are not historical facts but are forward-looking statements for purposes of the safe harbor provisions under The Private Securities LitigatioCn RoefmormpAactnoyf 1;99a5n. Fdorw(airid)-ldoookinegsstanteomtenftos gremneratlhly earebacacosmispanoiefd abynwyordcs osunchtrasa“cmtauy”a, “lshoourldo”, t“hwoeurld”a, “gplraen”e, “minteennd”t, “iannticriepaltae”t,i“obenlievteo”, t“hesitismate”, “predictt”r, “apnotsenatiacl”t,i“osenem. ”, “seek”, “continue”, “future”, “will”, “expect”, “outlook” or other similar words, phrases or expressions. These forward-looking statements include statements regarding our industry, future events, the proposed transaction between GPIAC and WKI, the estimated or anticipated future results and benefits of GPIAC and WKI following the transaction, including the likelihood and ability of the parties to successfully consummate the proposed transaction, fut ure opportunities for the combined company, and other statements that are not historical facts. These statements are based on the current expectations of GPIAC and WKI management and are not predictions of actual performance. These statements are subject to a number of risks and uncertainties regarding GPIAC’s and WKI’s respective businesses and the transaction, and actual results may differ materially. These risks and uncertainties include, but are not limited to, changes in the business environment in which GPIAC and WKI operate, includ ing inflation and interest rates, and general financial, economic, regulatory and political conditions affecting the industry in which WKI operates; changes in taxes, governmental laws, and regulations; competitive product and pricing 2
Disclaimer (Cont’d) activity; difficulties of managing growth profitably; the loss of one or more members of GPIAC’s or WKI’s management team; the inability of the parties to successfully or timely consummate the proposed transaction, including the risk that the required regulatory approvals are not obtained, are delayed or are subject to unanticipated conditions that could adversely affect the combined company or the expected benefits of the transaction or that the approval of the stockholders of GPIAC and/or the stockholders of WKI for the transaction is not obtained; failure to realize the anticipated benefits of the transaction, including as a result of a delay in consummating the transaction or a delay or difficulty in integrating the businesses of GPIAC and WKI; uncertainty as to the long-term value of GPIAC common stock; the inability to realize the expected amount and timing of cost savings and operating synergies; those discussed in GPIAC’s Annual Report on Form 10-K for the year ended December 31, 2015 under the heading “Risk Factors,” as updated from time to time by GPIAC’s QuarterlDy Risepcolrats iomn Feorm T10h-Qeasned omthear dteocruimaelnsts hofaGvPIeACbonefeilenwpithrethpe aSErCeodr infothre ipnrofxoy rstmateamteinot/npraoslppecuturs pthoatsweilsl beofnileldywaithntdhe nSEeCitbhy eGPrIAC. There may be additional risks that neither GPIAC nor WKI presently know or that GPIAC and WKI currently believe are immaterial that could also cause actual results to differ from those contained in the forwWardo-loroldkingKsittactehments. (In“tahddeitioCn,ofomrwaprda-lnooyki”n)g sntaotermeMntos prrgovaidne GSPIAtaC’snalnedyWmKI’saekxpeectaatnionys, ipmlanps loirefdorerceastps roef fsuteurne teavetniots nansd vaieswstaos otfhthee date of this communication. GPIAC and WKI anticipate that subsequent events and developments will cause GPIAC’s and WKI’s assessments to change. However, while GPIAC and WKI may elect to update tahecsecfuorrwaarcdy-loookirngcsotatmempenlets taet snomeespsoinot fin tthe futiunref,oGrPmIACaatnidoWnKIpspreocifviciadllyeddisc,laoimranaycocbleigaptiotnatondyo sloi.aTbheisleitfyorwwarhd-ilcoohkinmg staatyembenets bshaousldendot be relied upon asorenpretshenetinginGfPoIArCm’s aandtiWoKnI’s casosenssmtaenints easdof haney rdeateinsuboserquoemnt tiottteheddahteeofrtehifsrcommm.unicYaotioun. agree to keep confidential the Non-GAiAnPfFoinramncial tMioeansurcesontained herein, the fact that this document has been delivered to you, and the fact This comtmhuanticatthioneinCcluodems npona-GnAyAP ifsinacncoialnmseiadsuerers,inincgludaingpEoBITteDAn, AtidajulstterdaEBnITsDaA,cwthiiochna.re sTuphplementatlimeaasutreesso,f pperforjmeacncteiothnatsareanneidthefrorerqwuiraedrdby, nor presented in accordance with, U.S. generally accepted accounting principles ("GAAP"). EBITDA is calculated as earnings before interest and taxes plus depreciation and amortizalotioon.kAidnjugstesdtEaBItTeDAmisecanlctuslatesdeastEfBoITrDtAh, exhcleudrinegitnhewimeparcet ofpcerretapinaitermesdthabt aWsKIemdanaogenmevnat droieos unost caonssisdeur rmeppresteiontnatisve wof hitsiocnhgoimng aopyerantinogt performance. A reconciliation of such non-GAAP financial measures to GAAP financial measures is included as an appendix hereto. be realized in fact, and should not be relied upon as an accurate representation of future results, GPIAC bweliehveics thhatmsuachynodn-iGfAfeAPrfimnanaciatel mreiasullryes pfrovimde utshefeul siunppfloemrmental tiniofonrmaptiornetso eitsnbtoeard ofhdeirerceto.rs, Nmaenaigtehmeenrt tahndeinvCesotomrs rpegarndinyg cnerotarin financial and business trends relating to WKI's financial condition and results of operation. GPIAC believes such measures, when viewed in conjunction with its consolidated financial statements, consisteMncyoanrdgcaomnpaSratbailitny lweityh WaKsI’sspuasmt fineanacianl pyerrfoermsapncoe,nfasciilbitaitleitpyeritood-tuo-pedrioadtceomapanrisyonos off tohpeerateingspteimrforamtaencse,anpd rmoayjefaccitliitoatencsomoparrifsonrs wiathrodther companlieos.oUkndinuegrelsiatnacetsehomuldennot sbe cploacnedtoanitnhesedmheaesurresians .WKTI'shoenly Cmeoasmureps oaf nopyerawtinilglpmerfoarmkaencen, onorrsehopurldessuceh nmetasutiroesnbescornesigdearerddininisoglatiotsn from, or as a substitute for, financial information presented in compliance with GAAP. Non-GAAP financial measures as used in respect of WKI may not be comparable to similarly titled amounts used by otherbcoumspiannies. s, operations or financial results except in a fully executed definitive agreement approved by its Board of Directors. This document: (i) is not an offer or invitation by Morgan Stanley or the Company to purchase or sell securities or assets, whether in relation to the proposed transaction or otherwise nor any form of commitment or recommendation by Morgan Stanley or the Company; and (ii) does not form the basis of any contractual or other agreement in relation to this transaction. 3
Today’s Presenters Antonio Bonchristiano CEO at GPIAC and GP Investments Danilo Gamboa Incoming Chief Executive Officer at World Kitchen; Managing Director at GP Investments Stephen Earhart SVP and Chief Financial Officer at World Kitchen Kris Malkoski President, Global Business & Chief Commercial Officer 4
Agenda I. Introduction II. GP Investments Overview III. World Kitchen Overview IV. Investment Highlights V. Financial Summary Outlook VI. Wrap-up + Q&A VII. Appendix VIII. 5
I. Introduction
Transaction Overview On April 18, 2016, GP Investments Acquisition Corp. (NASDAQ: “GPIAU”; “GPIA”; GPIAW”) entered into a definitive agreement to acquire WKI Holding Company, Inc. (“WKI”) – World Kitchen manufactures and markets homeware products in the U.S. and internationally under well-recognized brands including Corelle, Pyrex, CorningWare and Snapware – Following consummation of the transaction, GPIAC will be renamed World Kitchen Group, Inc. and intends to trade on NASDAQ as “WDKN” Transaction highlights: – – – – – – Leading global housewares company with iconic brands and significant future opportunity for growth Enterprise Value of approximately US$566 million(1) Attractive purchase valuation at 7.2x 2016E adj. EBITDA of US$78 million (~20% discount to peers(2)) Modest net PF leverage of 3.3x at close(4) and 2.6x at YE 2016E GP Investments will be the largest single shareholder with 9.3 million shares of common stock, representing ~28%(3) PF ownership Pro forma cash balance of US$43 million(4) to fund future growth Confidence in growth potential and value creation opportunity of merged entity: – GP Investments will co-invest an additional US$50 million of capital alongside investors in the form of new common equity at US$10.00 per share – Current WKI shareholders will roll equity to participate in the upside of the merged entity, translating into ~20%(3) PF ownership The debt financing will consist of: – – $100 million 5-year Senior Secured Asset-Based Revolving Credit Facility (the “ABL Revolver”), undrawn at close $275 million 7-year Senior Secured Term Loan B (1) (2) (3) (4) Based on 33.0mm shares outstanding at US$10.00/share and net debt of US$236mm. The peers include Helen of Troy, Newell Rubbermaid, Spectrum Brands, Tupperware Brands, De’longhi, SEB, Nobia and Libbey. Based on US$10.00 per share. Assumes no redemptions of GPIA public shares. 7
II. GP Investments Overview
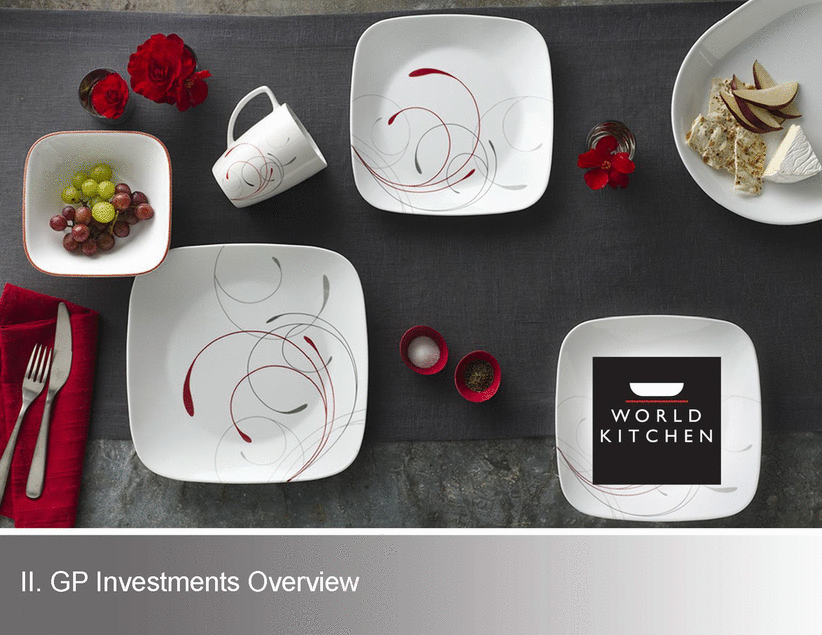
GP Investments History of Success Founded in 1993 with investments in over 50 companies, GP Investments is a leading alternative investments firm with over 20 equity capital market executions. Select Transaction Examples Initial Investment Date (Exit) Investment Overview Return Highlights Leading full-service Brazilian steakhouses in the US and Brazil; GP grew the restaurant base from three to seven in Brazil and from six to eighteen in the United States 2006 Overall investment generated a 24% IRR and 3.4x cash-on-cash (in US$ terms) in six years (2012) Overall investment generated a 56% IRR and 2.4x cash-on-cash (in US$ terms) just two years after the original investment 2007 Diversified consumer goods company with over 150 brands (2009) Brazil’s largest integrated shopping mall company; Led by a GP Partner, BR Malls grew its portfolio from six to forty malls Overall investment generated a 47% IRR and 3.2x cash-on-cash (in US$ terms) in four years 2006 (2010) Track Record of Success With US$5 Billion of Capital Raised Across 15 Sectors Source: Company information, Factset, Capital IQ and Mergermarket. 9
GP’s Investment Philosophy Value creation through active management and operationally-oriented approach Significant ownership structures that ensure influence and implementation of strategic change Accelerated growth through revenue and margin expansion and M&A Core Principles Management Tools 1 1 Attraction, retention and development of the best talents Robust approach for effective board monitoring 2 2 Focus on results and search for excellence Flat hierarchical structures and open communication 3 3 Transparency and ethics in the conduct of business Permanent focus on cost control 4 4 Alignment of interests and meritocracy Disciplined performance-based compensation 5 5 Management techniques: EVAtm, Six Sigma, Zero Based Budget, Goal-Based Management Management by measurement 10
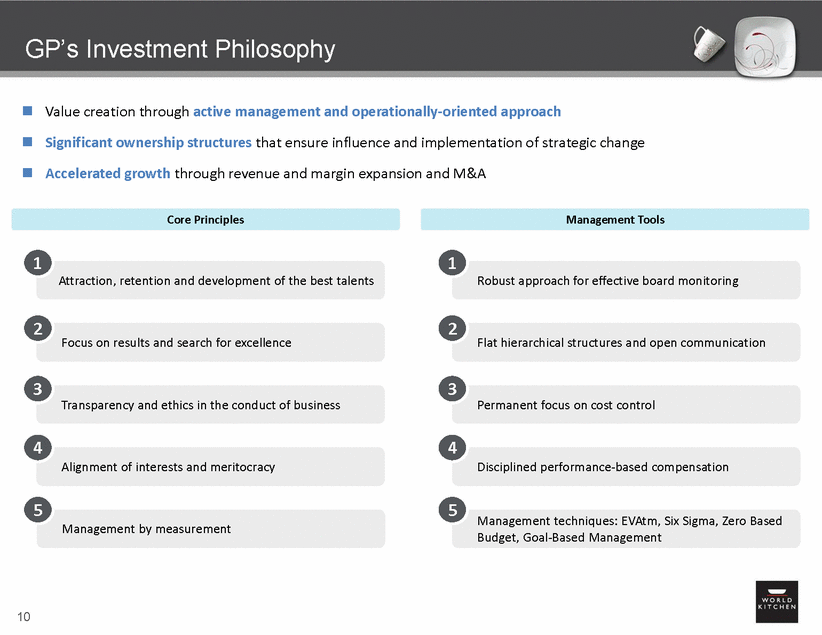
Thesis for Investment in World Kitchen Multiple Value Creation Levers to Drive Growth Branded Consumer Products Company Compelling Consolidation Opportunity Industry-Leading Innovation Stable Organic Growth Profile Global Footprint Iconic Brands with Leading Market Share in Key Categories High Growth Emerging Market Exposure Predictable and Attractive Cash Flow Generation Proprietary Technology Highly Fragmented Homeware Space Detailed due diligence process with numerous top-tier third party consultants engaged across functions including business, manufacturing, legal, financial, insurance and IT 11
III. World Kitchen Overview
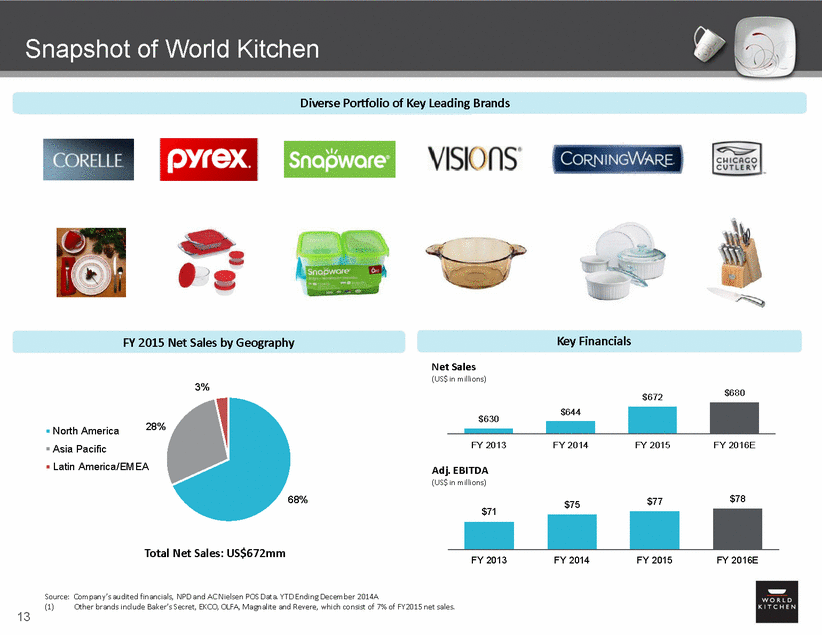
Snapshot of World Kitchen Diverse Portfolio of Key Leading Brands Key Financials FY 2015 Net Sales by Geography Net Sales (US$ in millions) 3% $680 $672 $630 28% North America Asia Pacific FY 2013 FY 2014 FY 2015 FY 2016E Latin America/EMEA Adj. EBITDA (US$ in millions) 68% $78 $77 $75 $71 Total Net Sales: US$672mm FY 2013 FY 2014 FY 2015 FY 2016E Source: Company’s audited financials, NPD and AC Nielsen POS Data. YTD Ending December 2014A (1) Other brands include Baker’s Secret, EKCO, OLFA, Magnalite and Revere, which consist of 7% of FY2015 net sales. 13 $644
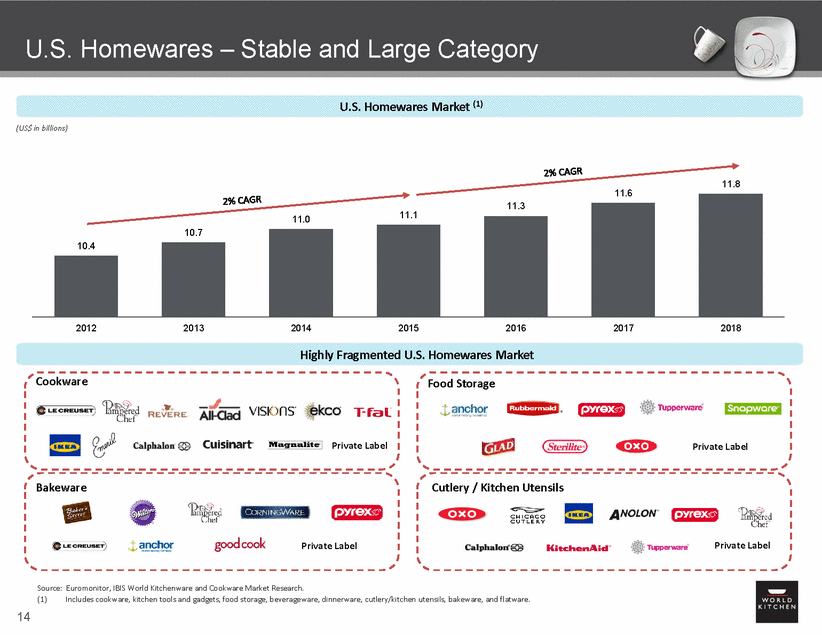
U.S. Homewares – Stable and Large Category U.S. Homewares Market (1) (US$ in billions) 11.8 11.6 11.1 11.0 2012 2013 2014 2015 2016 2017 2018 Highly Fragmented U.S. Homewares Market Cookware Food Storage Private Label Private Label Bakeware Cutlery / Kitchen Utensils Private Label Private Label Source: Euromonitor, IBIS World Kitchenware and Cookware Market Research. (1) Includes cookware, kitchen tools and gadgets, food storage, beverageware, dinnerware, cutlery/kitchen utensils, bakeware, and flatware. 14 11.3 10.7 10.4
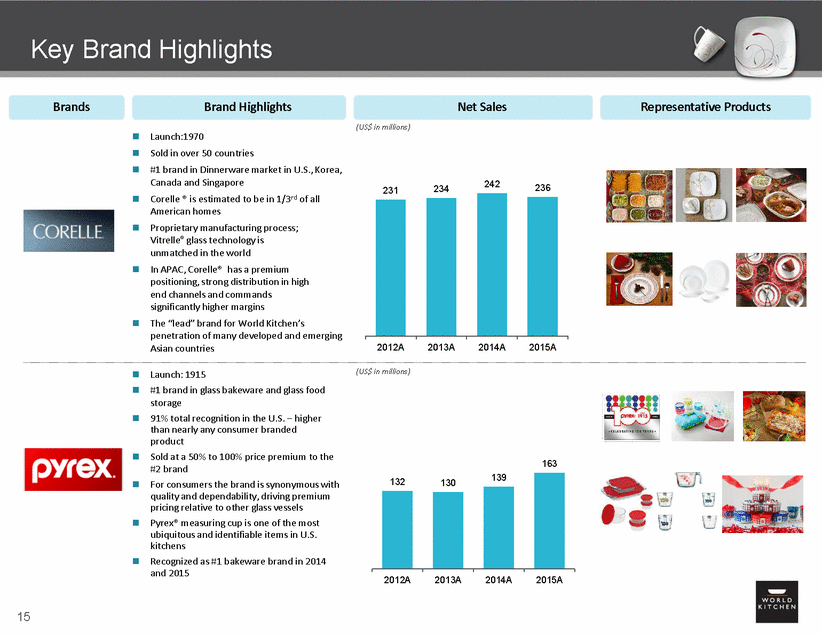
Key Brand Highlights Brands Brand Highlights Net Sales Representative Products (US$ in millions) Launch:1970 Sold in over 50 countries #1 brand in Dinnerware market in U.S., Korea, Canada and Singapore Corelle ® is estimated to be in 1/3rd of all American homes Proprietary manufacturing process; Vitrelle® glass technology is unmatched in the world In APAC, Corelle® has a premium positioning, strong distribution in high end channels and commands significantly higher margins The “lead” brand for World Kitchen’s penetration of many developed and emerging Asian countries 242 236 234 231 2012A 2013A 2014A 2015A (US$ in millions) Launch: 1915 #1 brand in glass bakeware and glass food storage 91% total recognition in the U.S. – higher than nearly any consumer branded product Sold at a 50% to 100% price premium to the #2 brand For consumers the brand is synonymous with quality and dependability, driving premium pricing relative to other glass vessels Pyrex® measuring cup is one of the most ubiquitous and identifiable items in U.S. kitchens Recognized as #1 bakeware brand in 2014 and 2015 163 2012A 2013A 2014A 2015A 15 132130139
Key Brand Highlights Brands Brand Highlights Launch: 1982 Pioneer in glass cookware with claim to launching the first see-through cooking vessel for stovetop use Maintains a loyal following and remains the leading see-through cookware product in APAC Commands a 30% price premium over its top competitor Highly desirable safety messaging with Chinese consumers Net Sales Representative Products (US$ in millions) 43 37 33 28 2012A 2013A 2014A 2015A (US$ in millions) Launch: 1999 Leading plastic and glass storage brand with innovative lid technology Dramatic increase in brand awareness, grown from 14% to 41% since acquisition in December 2010 Comprehensive product line consists of innovative and easy-to-use storage products offered at a competitive, mid-range price point in both plastic and glass 64 63 62 56 2012A 2013A 2014A 2015A (US$ in millions) Launch: 1958 #1 brand in ceramic bakeware 21% category share and 64% brand awareness Highly versatile product portfolio, suited for use in conventional, convection and microwave ovens, with the ability to store in the refrigerator or freezer and clean in the dishwasher 48 43 42 42 2012A 2013A 2014A 2015A 16
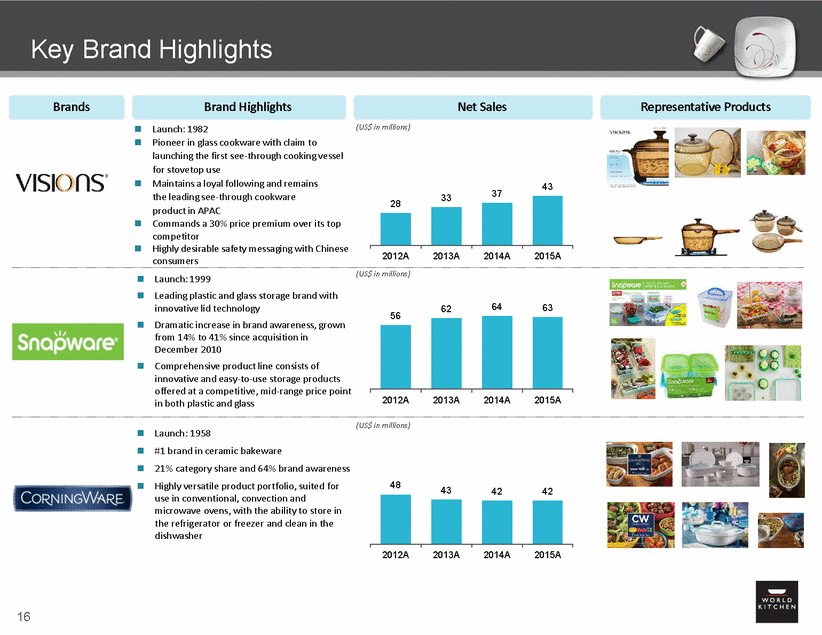
Diversified Distribution Strategy North America Sales by Channel Asia Pacific Sales by Channel (2015) Online(1) 5% Hardware 2% Mom & Pop 4% Specialty Channel 5% Online (1) 5% Premium 6% Other 8% Mass 31% TVHS 32% Grocery 8% Outlets/Stores 7% OLFA 9% Department 17% Department 10% Outlet/Stores 17% Mass 24% Club 10% Key Wins Top Asia Pacific Customers Distribution gains with Chicago Cutlery and Baker’s Secret worth ~$9 million in incremental sales Launch of Corelle Market Street on Macys.com in Q3; In-store test in January 2017 World Kitchen has #1 bridal brand in glass bakeware, ceramic bakeware, cutlery and casual dinnerware Korea Full store roll-out in Hardware department of 8 OLFA SKU’s in spring of 2016 worth incremental sales of $1.3 million Leading partner to drive online content / demos with 34% net sales CAGR from 2011 to 2014 in North America 17 (1) Includes worldkitchen.com and all online-only retailers; major brick and mortar retailers’ online channel is included within their respective segments.
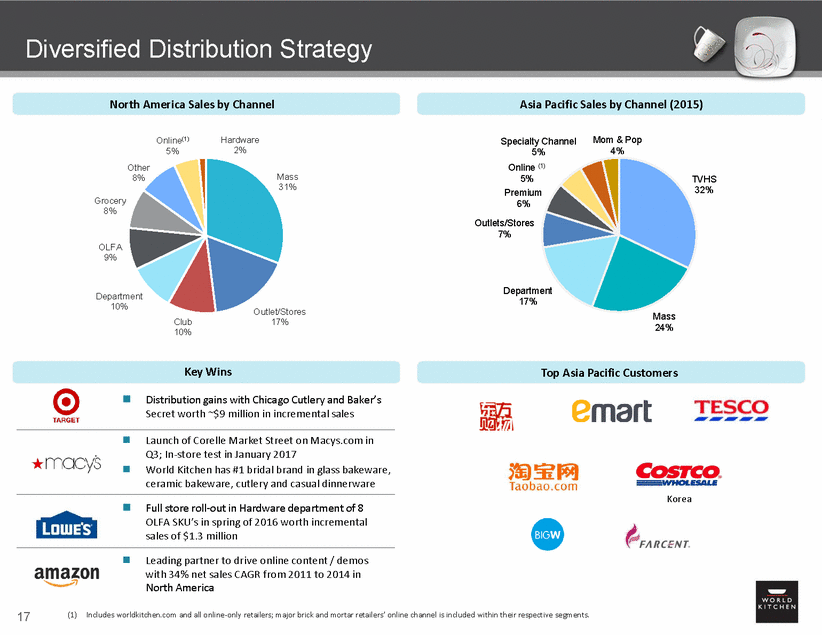
Leading Approach to Integrated Marketing Redefining how the consumer interacts with the World Kitchen Brand, with a shifting focus from “talking at” the consumer to establishing a more contemporary relationship–better understanding their interests. Branded Websites Change +8.2 million +36 million +28,782 +5.2 million +1,462,271 +9,100 +812 million Retailer Engagement Visitor Sessions 2.5 million 10.7 million Branded Content Page Views 10 million 46 million Digital Content Assets 1,867 30,649 Video Views 3,600 5.2 million Facebook Likes 33,000 1,495,271 Social Posts 79 9,179 Digital Impressions 36 million 848 million Content Sharing Social / Community Platforms 18 Metric2012A2015A
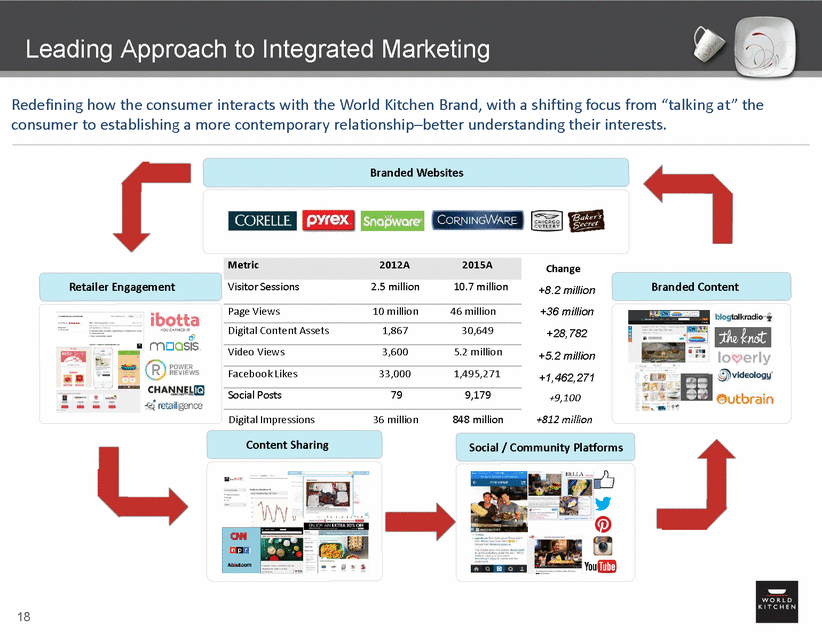
Track Record of Innovation Latam / EMEA North America Asia Corelle Tumblers Gen 1 +2 Corelle; Coordinates; Footed Rice Bowl Collection 11 New Pattern Designs Market Street Gadgets; 4-Lock Glass Storage; Sculptured Glass; Leak-proof 4-latch line; Soon to Launch Breakthrough Color Pyrex Measuring Cup Accessories; Sourced Glass Storage Japan NPD: Storage, Pyrex Fuego; 4 tab storage (Q1); Metal Bakeware Infusion Technology Drop-in Accessories for TS Glass ; Smart Store Dividers New 4-Latch Storage; Sourced Plastic Storage (Linuo) Eco Pure EMEA ; Drop in accessories for TS Glass Cast Aluminum Series ; CW by Corningware Line Extensions; Pyroceram Flair Essentials-Australia; Pyroceram Flair CW Color & Pattern Vivid Cutlery Blocks; Open Stock and Scissors Tablet Prep Set ; Dual Sharpener ; Insignia2 Tablet Prep Set; Sandwich Set ; Kinzie Shift Block 19
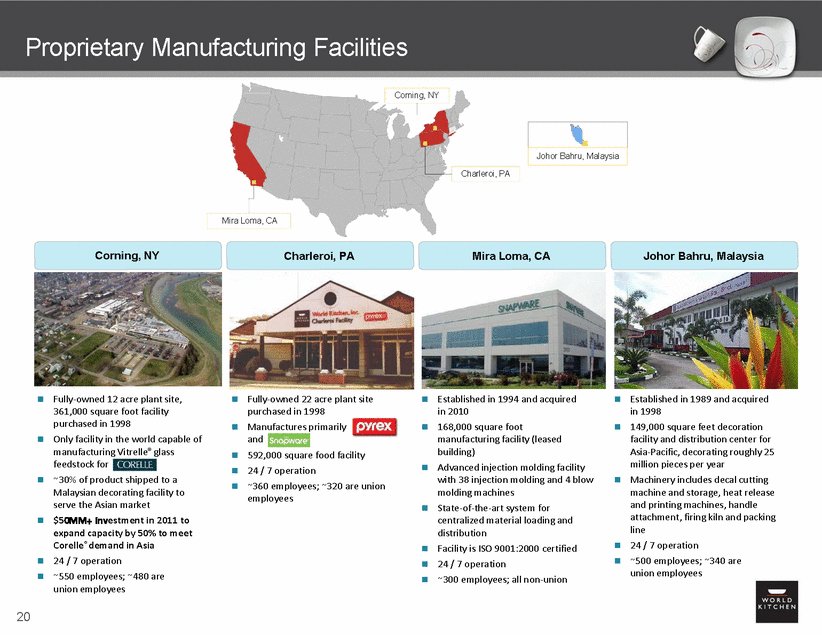
Proprietary Manufacturing Facilities Corning, NY Charleroi, PA Mira Loma, CA Corning, NY Charleroi, PA Mira Loma, CA Johor Bahru, Malaysia Fully-owned 12 acre plant site, 361,000 square foot facility purchased in 1998 Only facility in the world capable of manufacturing Vitrelle® glass feedstock for ~30% of product shipped to a Malaysian decorating facility to serve the Asian market $50MM+ investment in 2011 to expand capacity by 50% to meet Corelle® demand in Asia 24 / 7 operation ~550 employees; ~480 are union employees Fully-owned 22 acre plant site purchased in 1998 Manufactures primarily and 592,000 square food facility 24 / 7 operation ~360 employees; ~320 are union employees Established in 1994 and acquired in 2010 168,000 square foot manufacturing facility (leased building) Advanced injection molding facility with 38 injection molding and 4 blow molding machines State-of-the-art system for centralized material loading and distribution Facility is ISO 9001:2000 certified 24 / 7 operation ~300 employees; all non-union Established in 1989 and acquired in 1998 149,000 square feet decoration facility and distribution center for Asia-Pacific, decorating roughly 25 million pieces per year Machinery includes decal cutting machine and storage, heat release and printing machines, handle attachment, firing kiln and packing line 24 / 7 operation ~500 employees; ~340 are union employees 20 Johor Bahru, Malaysia
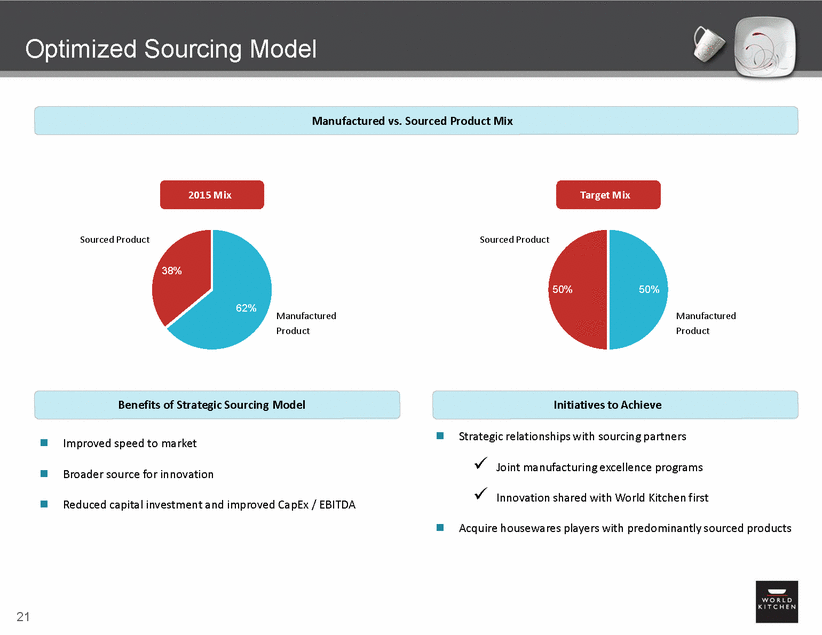
Optimized Sourcing Model Manufactured vs. Sourced Product Mix 2015 Mix Target Mix Sourced Product Sourced Product 38% 50% 50% 62% Manufactured Product Manufactured Product Benefits of Strategic Sourcing Model Initiatives to Achieve Strategic relationships with sourcing partners Joint manufacturing excellence programs Innovation shared with World Kitchen first Acquire housewares players with predominantly sourced products Improved speed to market Broader source for innovation Reduced capital investment and improved CapEx / EBITDA 21
IV. Investment Highlights
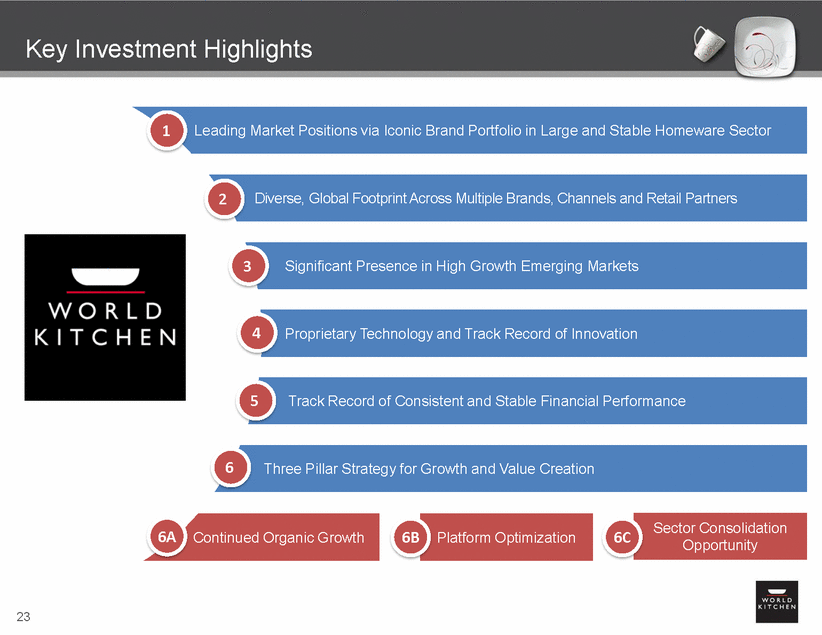
Key Investment Highlights 6B 6C 23 Sector Consolidation Opportunity Platform Optimization 6AContinued Organic Growth 6Three Pillar Strategy for Growth and Value Creation 5Track Record of Consistent and Stable Financial Performance 4Proprietary Technology and Track Record of Innovation 3Significant Presence in High Growth Emerging Markets 2Diverse, Global Footprint Across Multiple Brands, Channels and Retail Partners 1Leading Market Positions via Iconic Brand Portfolio in Large and Stable Homeware Sector
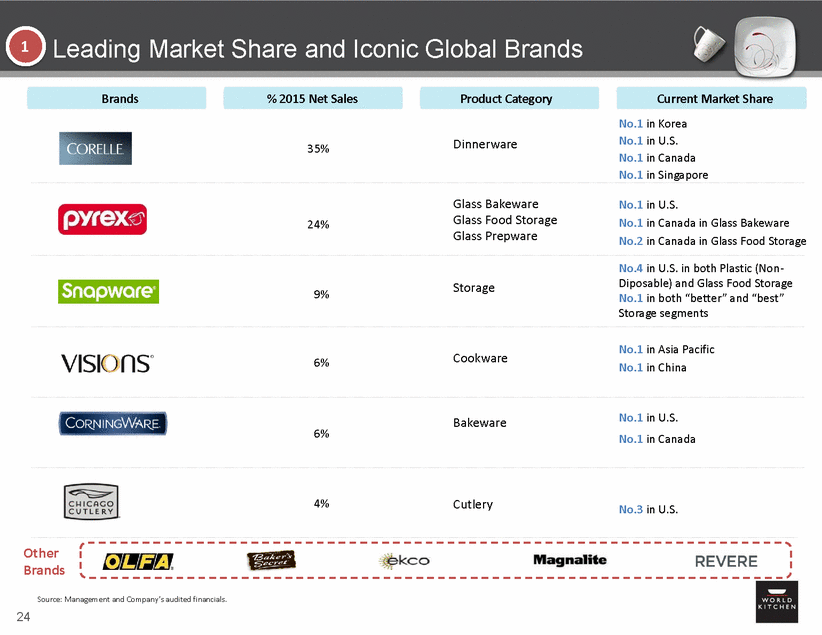
Leading Market Share and Iconic Global Brands 1 Brands % 2015 Net Sales Product Category Current Market Share No.1 in Korea No.1 in U.S. No.1 in Canada No.1 in Singapore Dinnerware 35% Glass Bakeware Glass Food Storage Glass Prepware No.1 in U.S. No.1 in Canada in Glass Bakeware No.2 in Canada in Glass Food Storage 24% No.4 in U.S. in both Plastic (Non-Diposable) and Glass Food Storage No.1 in both “better” and “best” Storage segments Storage 9% No.1 in Asia Pacific No.1 in China Cookware 6% No.1 in U.S. No.1 in Canada Bakeware 6% 4% Cutlery No.3 in U.S. Other Brands Source: Management and Company’s audited financials. 24
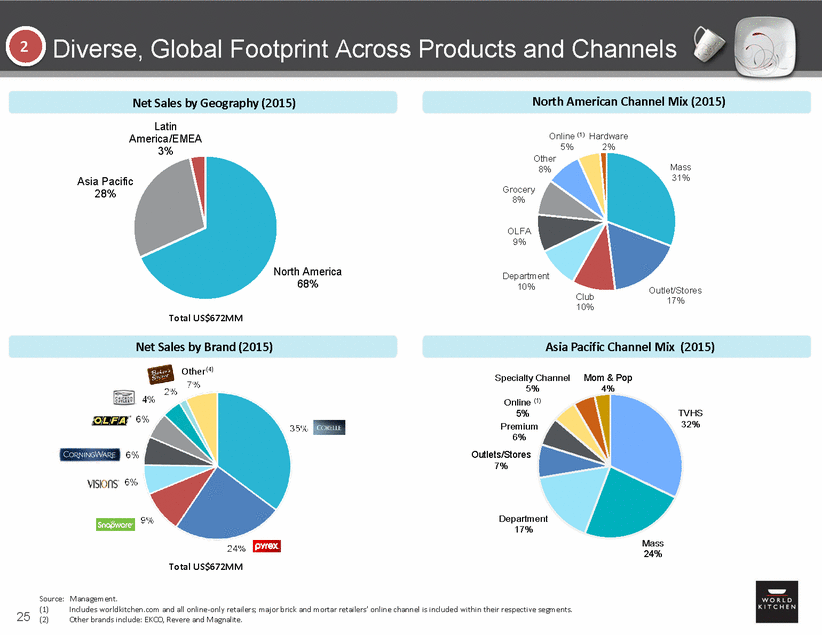
Diverse, Global Footprint Across Products and Channels 2 North American Channel Mix (2015) Net Sales by Geography (2015) Latin America/EMEA 3% Online (1) Hardware 5% 2% Other 8% Mass 31% Asia Pacific 28% Grocery 8% OLFA 9% North America 68% Department 10% Outlet/Stores 17% Club 10% Total US$672MM Net Sales by Brand (2015) Other(4) Asia Pacific Channel Mix (2015) Specialty Channel 5% Online (1) 5% Premium 6% Outlets/Stores 7% Mom & Pop 4% TVHS 32% Department 17% Mass 24% Total US$672MM Source: Management. (1) (2) Includes worldkitchen.com and all online-only retailers; major brick and mortar retailers’ online channel is included within their respective segments. Other brands include: EKCO, Revere and Magnalite. 25
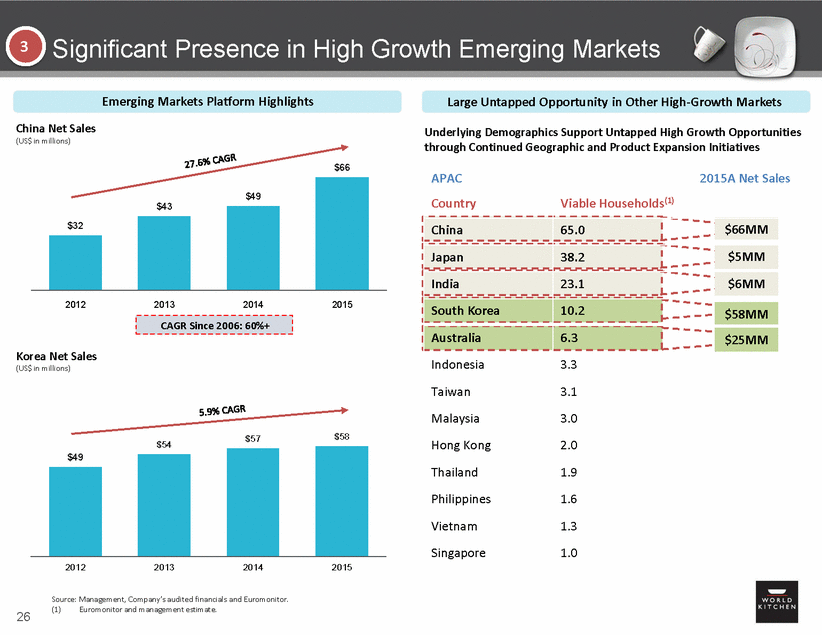
Significant Presence in High Growth Emerging Markets 3 Emerging Markets Platform Highlights Large Untapped Opportunity in Other High-Growth Markets China Net Sales (US$ in millions) Underlying Demographics Support Untapped High Growth Opportunities through Continued Geographic and Product Expansion Initiatives $66 $43 2012 2013 2014 2015 Korea Net Sales (US$ in millions) $58 $57 $54 2012 2013 2014 2015 Source: Management, Company’s audited financials and Euromonitor. (1) Euromonitor and management estimate. 26 $49 CAGR Since 2006: 60%+ $49 $32 APAC 2015A Net Sales Country Viable Households(1) China 65.0 $66MM Japan 38.2 $5MM India 23.1 $6MM South Korea 10.2 $58MM Australia 6.3 $25MM Indonesia 3.3 Taiwan 3.1 Malaysia 3.0 Hong Kong 2.0 Thailand 1.9 Philippines 1.6 Vietnam 1.3 Singapore 1.0
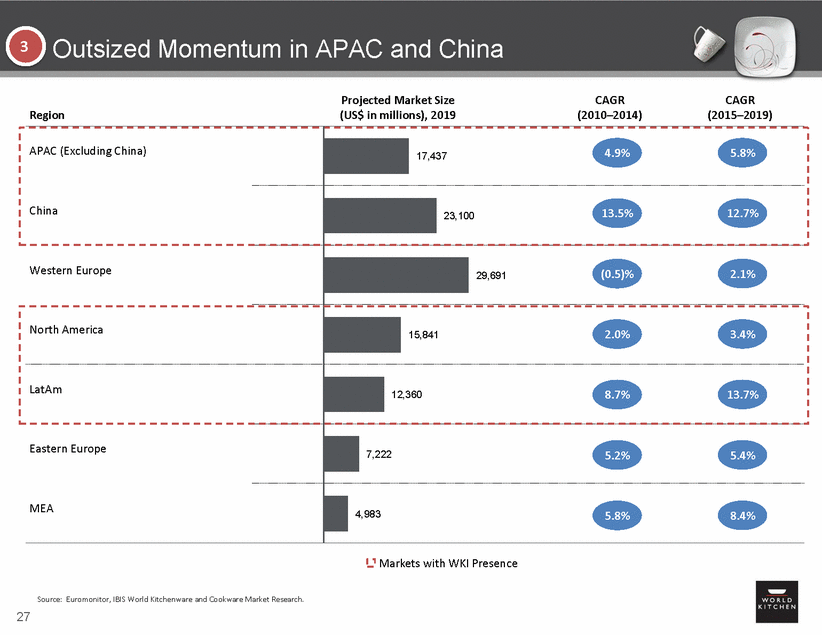
Outsized Momentum in APAC and China 3 Projected Market Size (US$ in millions), 2019 CAGR (2010–2014) CAGR (2015–2019) Region Markets with WKI Presence Source: Euromonitor, IBIS World Kitchenware and Cookware Market Research. 27 APAC (Excluding China) China 17,437 4.9%5.8% 23,100 13.5%12.7% Western Europe 29,691 (0.5)%2.1% North America 15,841 2.0%3.4% LatAm 12,360 8.7%13.7% Eastern Europe MEA 7,222 5.2%5.4% 4,983 5.8%8.4%
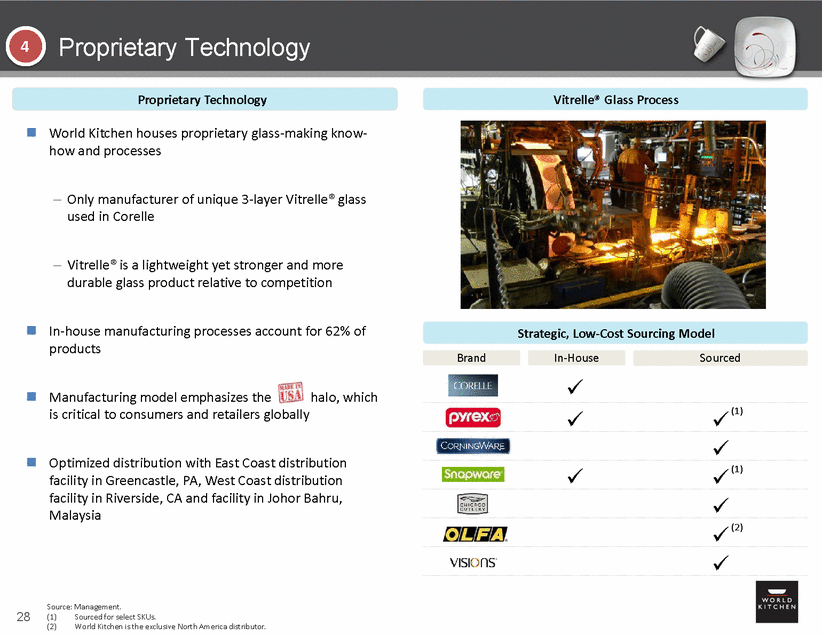
Proprietary Technology 4 Proprietary Technology Vitrelle® Glass Process World Kitchen houses proprietary glass-making know-how and processes – Only manufacturer of unique 3-layer Vitrelle® glass used in Corelle – Vitrelle® is a lightweight yet stronger and more durable glass product relative to competition In-house manufacturing processes account for 62% of products Strategic, Low-Cost Sourcing Model Brand In-House Sourced Manufacturing model emphasizes the is critical to consumers and retailers globally halo, which (1) Optimized distribution with East Coast distribution facility in Greencastle, PA, West Coast distribution facility in Riverside, CA and facility in Johor Bahru, Malaysia (1) (2) Source: Management. 28 (1) (2) Sourced for select SKUs. World Kitchen is the exclusive North America distributor.
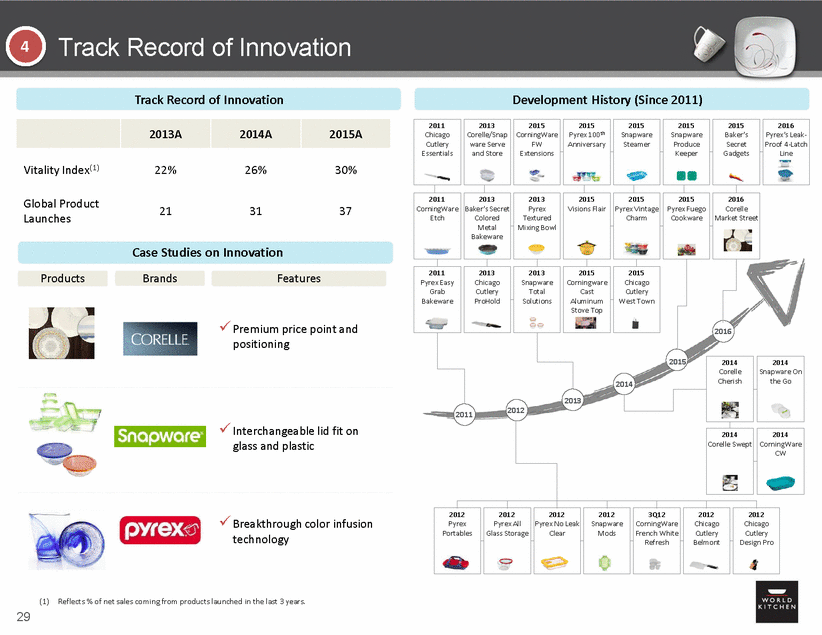
Track Record of Innovation 4 Track Record of Innovation Development History (Since 2011) Pyrex’s Leak-Corelle Case Studies on Innovation Products Brands Features Premium price point and positioning 2012 2011 Interchangeable lid fit on glass and plastic Breakthrough color infusion technology (1) Reflects % of net sales coming from products launched in the last 3 years. 29 2012 Pyrex Portables 2012 Pyrex All Glass Storage 2012 Pyrex No Leak Clear 2012 Snapware Mods 3Q12 CorningWare French White Refresh 2012 Chicago Cutlery Belmont 2012 Chicago Cutlery Design Pro 2015 2014 2014 2014 Corelle Swept 2014 CorningWare CW 2011 Chicago Cutlery Essentials 2013 Corelle/Snap ware Serve and Store 2015 CorningWare FW Extensions 2015 Pyrex 100th Anniversary 2015 Snapware Steamer 2015 Snapware Produce Keeper 2015 Baker’s Secret Gadgets 2016 Proof 4-Latch Line 2011 CorningWare Etch 2013 Baker’s Secret Colored Metal Bakeware 2013 Pyrex Textured Mixing Bowl 2015 Visions Flair 2015 Pyrex Vintage Charm 2015 Pyrex Fuego Cookware 2016 Market Street 2011 Pyrex Easy Grab Bakeware 2013 Chicago Cutlery ProHold 2013 Snapware Total Solutions 2015 Corningware Cast Aluminum Stove Top 2015 Chicago Cutlery West Town 2016 Corelle Snapware On 2014Cherishthe Go 2013 2013A 2014A 2015A Vitality Index(1) 22% 26% 30% Global Product Launches 21 31 37
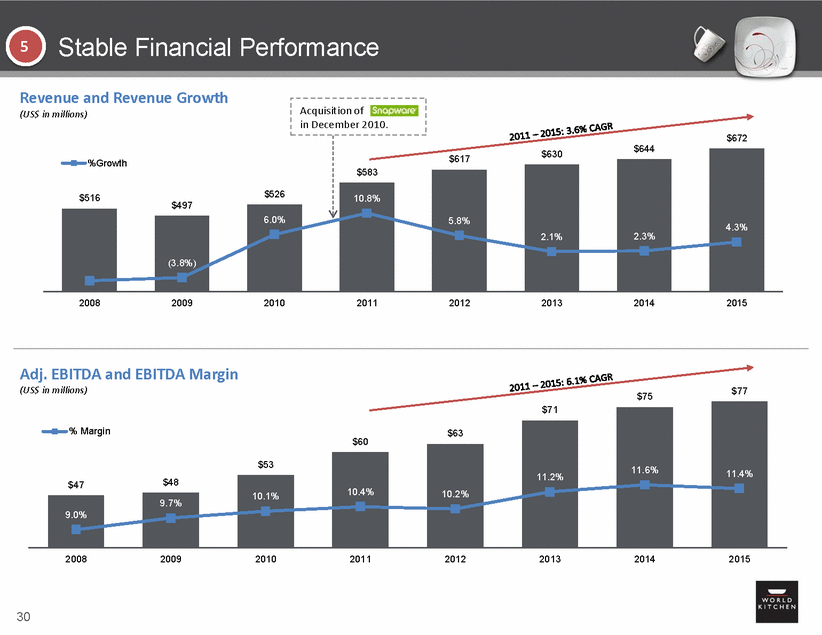
Stable Financial Performance 5 Revenue and Revenue Growth (US$ in millions) 28.0% $700 $650 $600 $550 $500 $450 $400 $350 $300 $672 $644 $630 $617 23.0% %Growth 18.0% 13.0% $497 8.0% 3.0% (2.0% (7.0% 2008 2009 2010 2011 2012 2013 2014 2015 Adj. EBITDA and EBITDA Margin 17 16 15 14 13 12 11 10 $80 (US$ in millions) $77 $75 $75 $70 $65 $60 $55 $50 $45 9.0% $40 9.0% $35 8.0% $30 2008 2009 2010 2011 2012 2013 2014 2015 30 11.4% $71 11.6% % Margin$63 $60 11.2% 10.2% $53 10.4% $47$48 10.1% 9.7% 4.3% 2.3% 2.1% $583 5.8% $516 $526 10.8% 6.0% (3.8%) Acquisition of in December 2010.
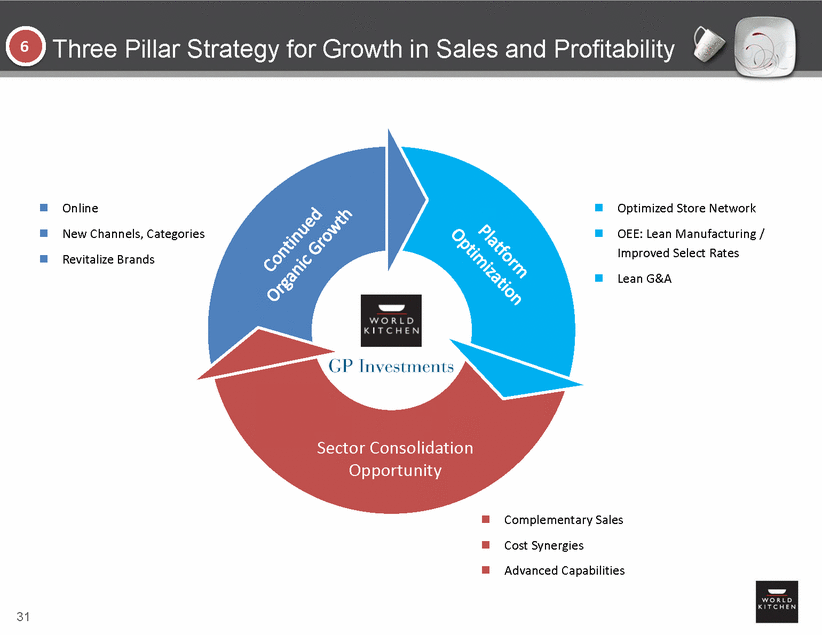
Three Pillar Strategy for Growth in Sales and Profitability 6 Online New Channels, Categories Revitalize Brands Optimized Store Network OEE: Lean Manufacturing / Improved Select Rates Lean G&A Sector Consolidation Opportunity Complementary Sales Cost Synergies Advanced Capabilities 31
Continued Organic Growth 6A 1 E-Commerce Net Sales (US$ in millions) 42 37 33 30 Online 2012A 2013A 2014A 2015A Pursue omni channel opportunities 2 New Product Development 3 Enhance presence in underrepresented channels such as foodservice and high-end specialty stores (> US$2 billion market) Expand Channels 4 Revitalize Brands 5 Enter new markets at premium price points Initially enter via distributors and shift to direct model (e.g. Korea) New Market Opportunities 32
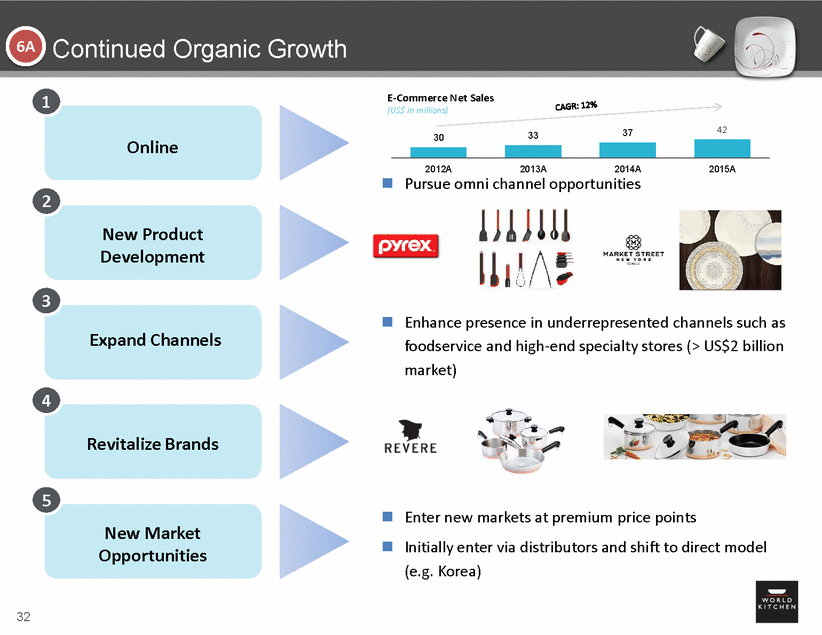
Platform Optimization 6B Identified specific areas of improvement and developed initiatives that will yield $10+ million in EBITDA improvement – majority of which will be achieved in the next 12 – 18 months with remainder achieved within 2 – 3 years. Implement OEE/Select Rate Improvement: From ~68% to 80% Flatten Organization/ Reduce Layers Improve Store Margin Optimized Store Network SG&A Leverage Improved Operations Performance improvement across network Improvement of production yields Margin expansion through efficient cost structure Integration with e-commerce Implementation of lean manufacturing initiatives Gains through scalable infrastructure 33
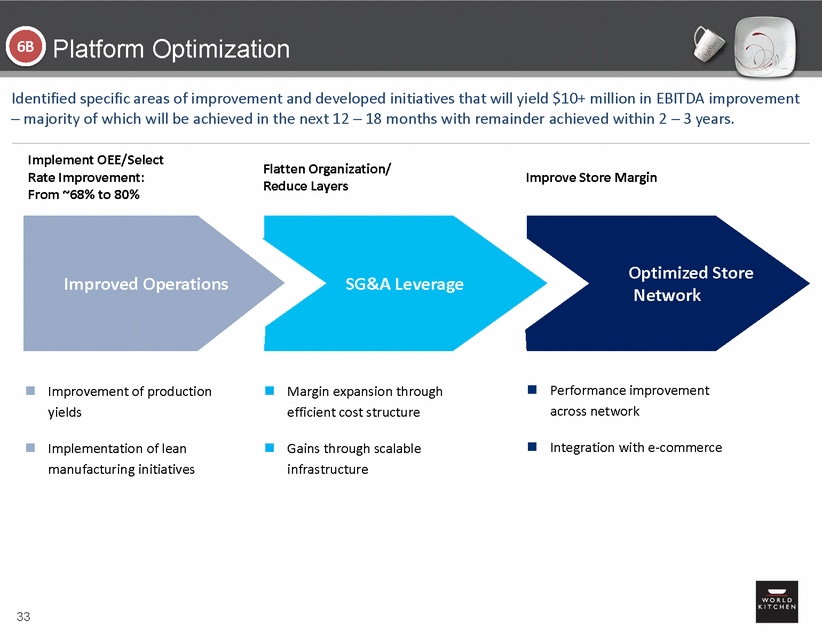
Disciplined Approach to Growth in a Fragmented Industry 6C WKI Has Category White Space in a Highly Fragmented Industry Housewares Market by Category Kitchen Utensils & Gadgets 14% Dinnerware 20% Underpenetrated categories for WKI; WKI is currently pursuing organic expansion to capitalize within these categories 53% of Total Housewares Market Categories in which WKI competes 47% of Total Housewares Market Stove Top Cookware 24% Food Storage 11% Cutlery 9% Ovenware 7% Beverageware 15% Market Expansion Opportunities Key Acquisition Criteria Category Geography Strong Brands Cost Synergies Beverageware Europe Commercial Synergies Advanced Capabilities Stove Top Cookware Latin America Low Capital Expenditures Valuation Discipline Kitchen Utensils & Gadgets Asia 34
V. Financial Summary
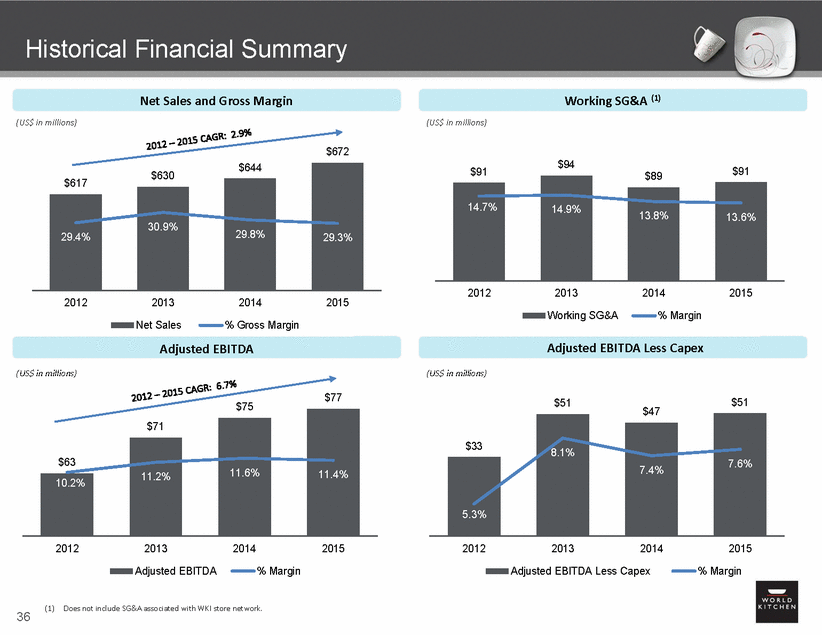
Historical Financial Summary Working SG&A (1) Net Sales and Gross Margin (US$ in millions) (US$ in millions) $110 $700 $100 $650 $90 $60$080 $55$070 25.0% .0% .0% .0% .0% .0% .0% .0% .0% .0% .0% .0% $672 $94 20.0% $91 $91 $89 15.0% 10.0% 5.0% $50$060 $50 $450 0.0% 2012 2013 2014 2015 2012 2013 2014 2015 Working SG&A % Margin Net Sales % Gross Margin Adjusted EBITDA Less Capex Adjusted EBITDA (US$ in millions) (US$ in millions) 0 18$.06%0 16$.05%0 10.0% $77 $51 $51 $75 $47 5 9.0% 14.0% 0 $40 12.0% $30 10.0% 8.0% 5 7.0% 0 $20 6.0% 8.0% 5 6.0$%10 4.0%$0 5.0% 0 4.0% 2012 2013 2014 2015 2012 2013 2014 2015 Adjusted EBITDA % Margin Adjusted EBITDA Less Capex % Margin (1) Does not include SG&A associated with WKI store network. 36 $33 8.1% 7.6% 7.4% 5.3% 11.4% $71 11.6% $63 11.2% 10.2% 14.9% 14.7% 13.6% 13.8% $644 $630 29.3% $617 29.8% 30.9% 29.4%
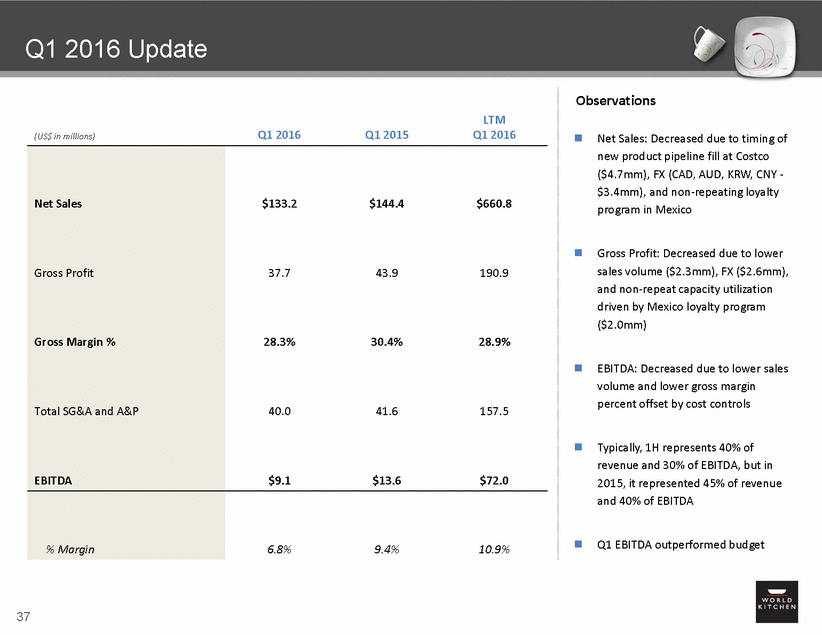
Q1 2016 Update Observations Net Sales: Decreased due to timing of new product pipeline fill at Costco ($4.7mm), FX (CAD, AUD, KRW, CNY - $3.4mm), and non-repeating loyalty program in Mexico Gross Profit: Decreased due to lower sales volume ($2.3mm), FX ($2.6mm), and non-repeat capacity utilization driven by Mexico loyalty program ($2.0mm) EBITDA: Decreased due to lower sales volume and lower gross margin percent offset by cost controls Typically, 1H represents 40% of revenue and 30% of EBITDA, but in 2015, it represented 45% of revenue and 40% of EBITDA Q1 EBITDA outperformed budget 37 (US$ in millions) LTM Q1 2016Q1 2015Q1 2016 Net Sales Gross Profit Gross Margin % Total SG&A and A&P EBITDA $133.2$144.4$660.8 37.743.9190.9 28.3%30.4%28.9% 40.041.6157.5 $9.1$13.6$72.0 % Margin 6.8%9.4%10.9%
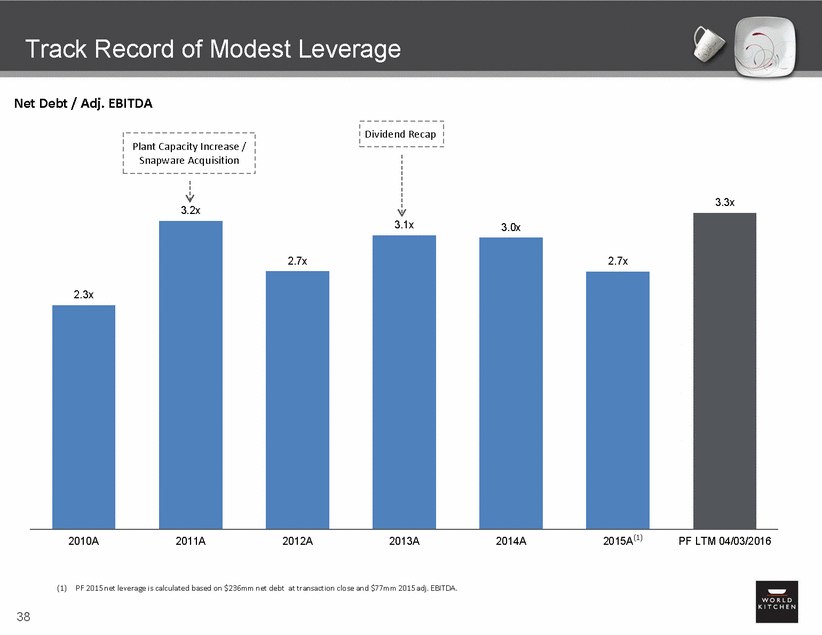
Track Record of Modest Leverage Net Debt / Adj. EBITDA 3.3x 3.2x 2015A(1) 2010A 2011A 2012A 2013A 2014A PF LTM 04/03/2016 (1) PF 2015 net leverage is calculated based on $236mm net debt at transaction close and $77mm 2015 adj. EBITDA. 38 2.3x 3.1x3.0x 2.7x 2.7x Plant Capacity Increase / Snapware Acquisition Dividend Recap
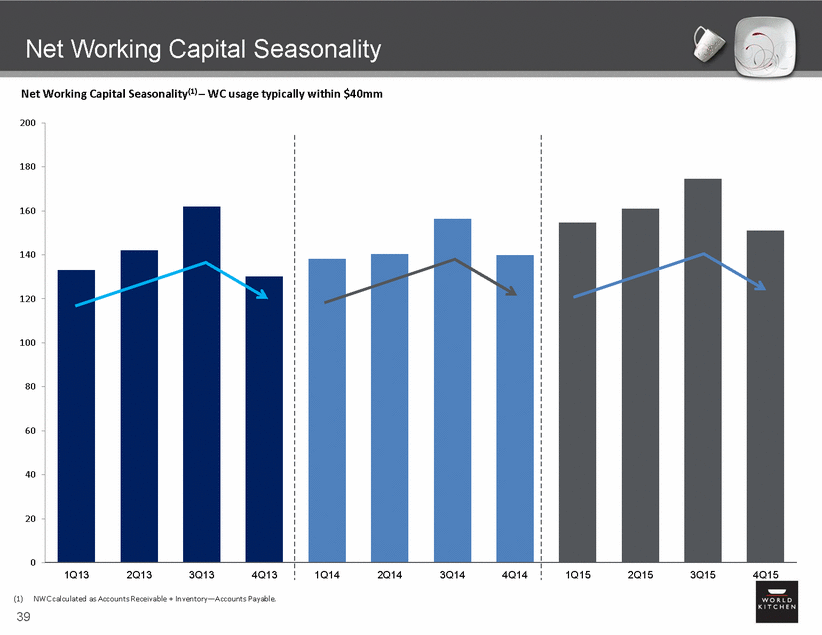
Net Working Capital Seasonality Net Working Capital Seasonality(1) – WC usage typically within $40mm 200 180 160 140 120 100 80 60 40 20 0 (1)NWC calculated as Accounts Receivable + Inventory—Accounts Payable. 39 1Q132Q133Q134Q13 1Q142Q143Q144Q14 1Q152Q153Q154Q15
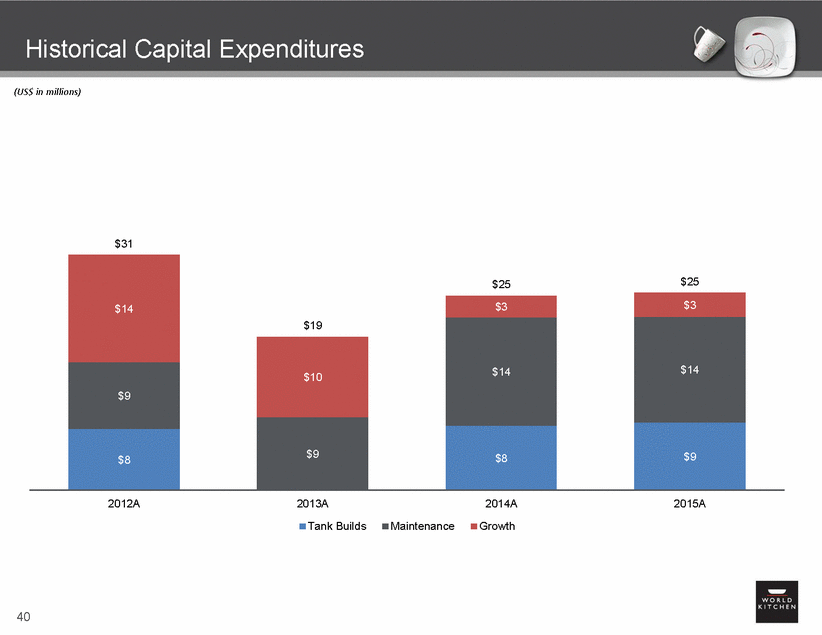
Historical Capital (US$ in millions) Expenditures $31 2012A 2013A 2014A Growth 2015A Tank Builds Maintenance 40 $14 $25 $25 $19 $3 $3 $14 $14 $10 $9 $9 $9 $8 $8
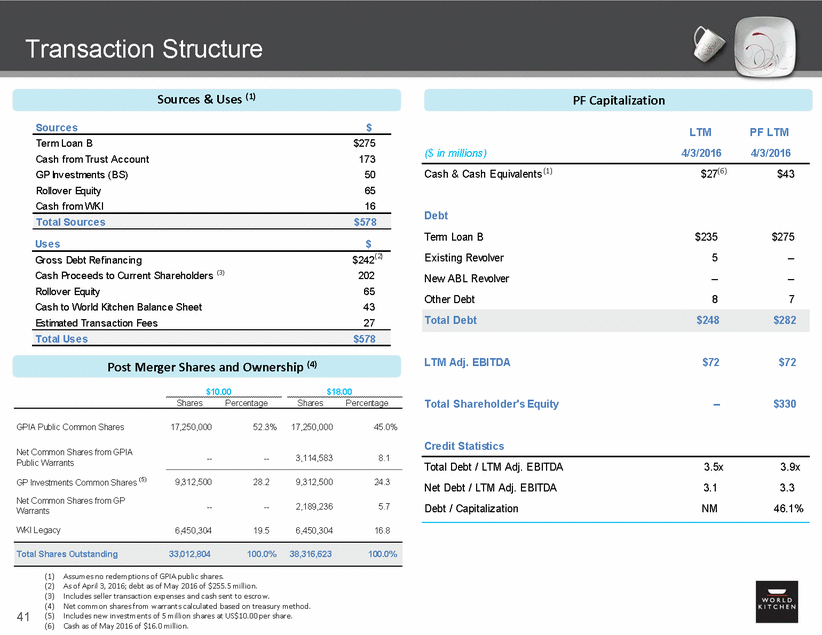
Transaction Structure Sources & Uses (1) PF Capitalization Source s $ LTM 4/3/2016 PF LTM 4/3/2016 Term Loan B Cash f rom Trust Account GP Investments (BS) Rollover Equity Cash f rom WKI $275 173 50 65 16 ($ in millions) Cash & Cash Equivalents (1) $27(6) $43 Debt Term Loan B Existing Revolver New ABL Revolver Other Debt $235 5 --8 $275 ---- 7 Us e s $ $242(2) 202 65 43 27 Gross Debt Ref inancing Cash Proceeds to Current Shareholders (3) Rollover Equity Cash to World Kitchen Balance Sheet Estimated Transaction Fees LTM Adj. EBITDA $72 $72 Post Merger Shares and Ownership (4) $10.00 $18.00 Shares Percentage Shares Percentage Total Shareholder's Equity --$330 GPIA Public Common Shares 17,250,000 52.3% 17,250,000 45.0% Credit Statistics Net Common Shares from GPIA Public Warrants ---- 3,114,583 8.1 Total Debt / LTM Adj. EBITDA Net Debt / LTM Adj. EBITDA Debt / Capitalization 3.5x 3.1 NM 3.9x 3.3 46.1% (5) 9,312,500 28.2 9,312,500 24.3 GP Investments Common Shares Net Common Shares from GP Warrants ---- 2,189,236 5.7 WKI Legacy 6,450,304 19.5 6,450,304 16.8 (1) (2) (3) (4) (5) (6) Assumes no redemptions of GPIA public shares. As of April 3, 2016; debt as of May 2016 of $255.5 million. Includes seller transaction expenses and cash sent to escrow. Net common shares from warrants calculated based on treasury method. Includes new investments of 5 million shares at US$10.00 per share. Cash as of May 2016 of $16.0 million. 41 Total Shares Outstanding 33,012,804 100.0% 38,316,623 100.0% Total Us e s $578 Total Debt $248 $282 Total Source s $578
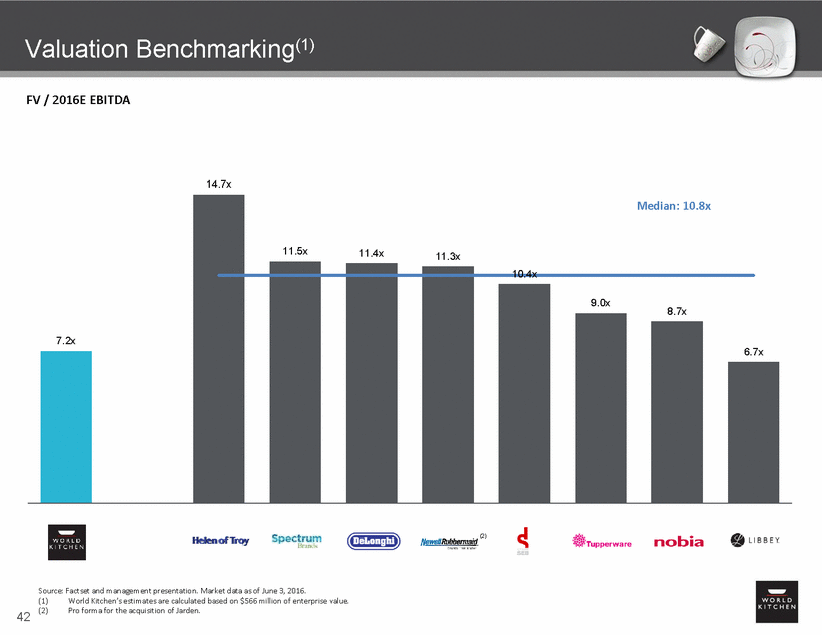
Benchmarking(1) Valuation FV / 2016E EBITDA 14.7x 10.4x 8.7x 6.7x WKI HELE-US SPB-US DLG-IT NWL SK-FR TUP-US NOBI-SE LBY (2) Source: Factset and management presentation. Market data as of June 3, 2016. (1) (2) World Kitchen’s estimates are calculated based on $566 million of enterprise value. Pro forma for the acquisition of Jarden. 42 7.2x Median: 10.8x 11.5x11.4x11.3x 9.0x
VI. Outlook
Looking Forward – The Global Housewares Market North America Category Outlook Category Growth Growth in housewares tracks GDP and the industry should benefit from positive tailwinds from trends such as urbanization, economic growth and increased disposable income Market CAGR ( ’ 15 -’ 18E ) 12.6 12.3 12.0 11.7 11.4 11.2 11.0 1.7% Online retailing is the fastest growing channel having increased at 29% from 2010 – 2014 and is projected to grow at 13-15% from 2015 - 2018 2.0% 2012 2013 2014 2015 2016 2017 2018 Kitchen Dining APAC Category Outlook China & Korea Housewares Market China Homewares Market Size (US$ in billions) South Korea Homewares Market Size (US$ in billions) The Chinese housewares market grew at a 10% CAGR between 2012 and 2015, reaching US$13.5 billion in 2015. The economic slowdown in China is expected to generate a deceleration of growth to 5-7% in the period between 2015 and 2018. 16.5 13.5 14.0 12.8 The Korea housewares market grew at a 3% CAGR between 2012 and 2015, reaching $2.3bn in 2015. It is expected to grow at the same 3% rate between 2015 and 2018, tracking GDP growth. 2.6 2.5 2.4 2.3 2.3 2.3 2.1 2012 2013 2014 2015 2016 2017 2018 2012 2013 2014 2015 2016 2017 2018 Y-O-Y Growth Y-O-Y Growth 2.3% 16.5% 14.1% 13.3% 5.5% 3.7% 8.6% 8.6% 7.3% 4.3% (4.2%) 0.0% 8.7% 4.0% Source: Euromonitor 44 15.2 11.3 9.9 4.24.24.34.44.54.6 6.87.07.17.37.57.7 4.7 7.9
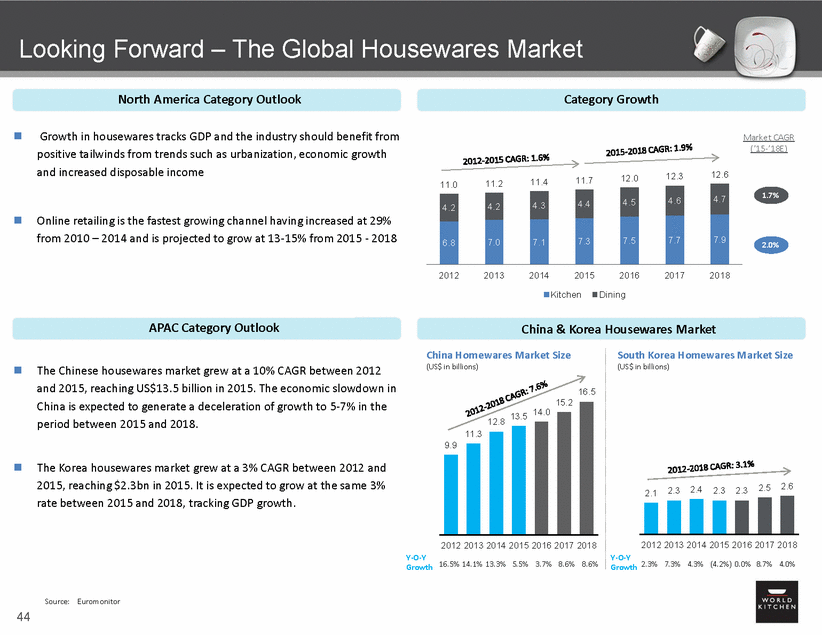
Summary of Key Drivers For WKI 1 Growth in e-commerce New product launches (e.g. Corelle Market Street line) Distribution gains Product, channel and geographic expansion in China Growing beyond Corelle in Korea Growth in emerging markets Revenue 2 Corning plant improvements Product assortment (NPD, gadgets) Geographic and channel mix Gross Margin 3 A&P growing with Net Sales A&P and SG&A Operating efficiencies offsetting inflation 4 $275m Term Loan B: 500 bps + 100 LIBOR floor Interest $100m ABL: 125-175 bps 5 Normalized cash tax rate of 20-25% Tax Minimal US cash taxes due to existing NOL 45
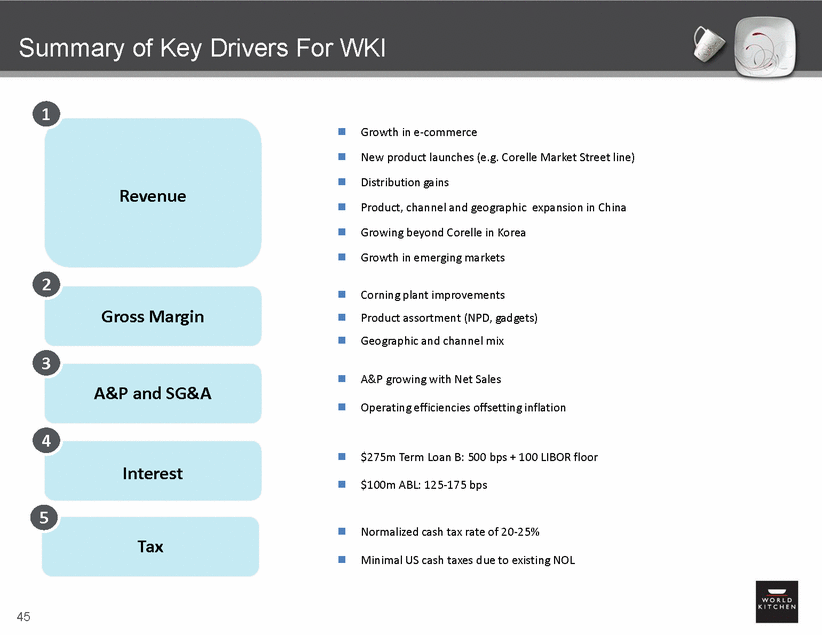
Seasonality 46 ( US$ in millions)F Y 2 0 15Q1Q2 N e t S a le s $ 6 7 2 21.5% 21.9% A dj. E B IT D A $ 7 7 17.8% 20.5% 1H 4 3 .4 % 3 8 .3 % Q3Q4 25.2% 31.3% 23.9% 37.8% 2H 5 6 .6 % 6 1.7 % ( US$ in millions)F Y 2 0 14Q1Q2 N e t S a le s $ 6 4 4 19.4% 21.5% A dj. E B IT D A $ 7 5 8.4% 14.3% 1H 4 0 .9 % 2 2 .7 % Q3Q4 25.1% 34.0% 32.4% 44.9% 2H 5 9 .1% 7 7 .3 % ( US$ in millions)F Y 2 0 13Q1Q2 N e t S a le s $ 6 3 0 19.9% 21.0% A dj. E B IT D A $ 7 1 14.3% 17.9% 1H 4 0 .9 % 3 2 .2 % Q3Q4 26.2% 32.9% 25.1% 42.7% 2H 5 9 .1% 6 7 .8 % ( US$ in millions)F Y 2 0 12Q1Q2 N e t S a le s $ 6 17 19.8% 21.1% A dj. E B IT D A $ 6 3 12.4% 17.0% 1H 4 0 .8 % 2 9 .4 % Q3Q4 26.7% 32.5% 24.2% 46.3% 2H 5 9 .2 % 7 0 .6 %
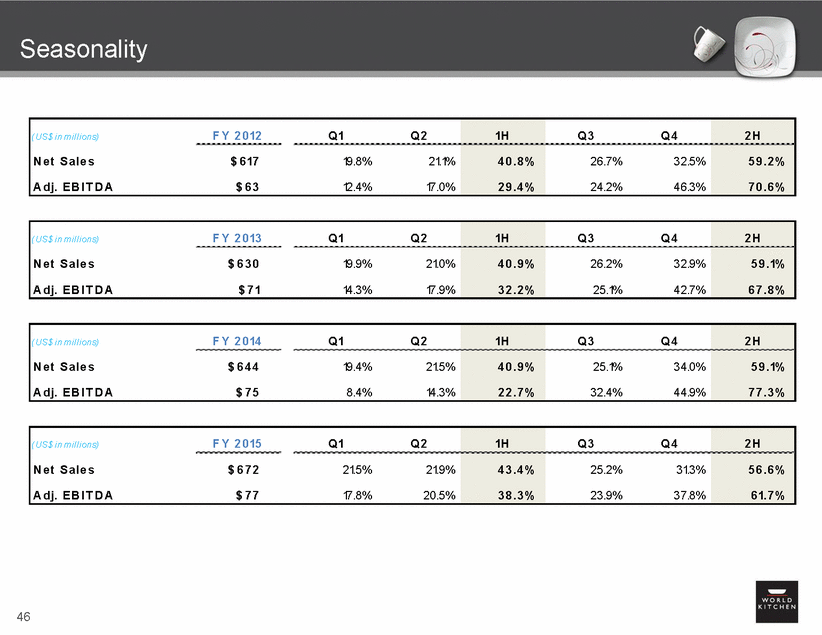
Top Line and Gross Margin Outlook Sales $460m 2-4% Growth 25-75bps improvement Gross Margin 29% Sales $198m 5-7% Growth 25-75bps improvement Gross Margin 36% Sales $22m 4-6% Growth 25-75bps improvement Gross Margin 29% Note: Regional gross margin excludes $10m of unallocated Global Product Supply overhead costs. 47 Latam / EMEA Asia Pacific North America 2016E 2017E
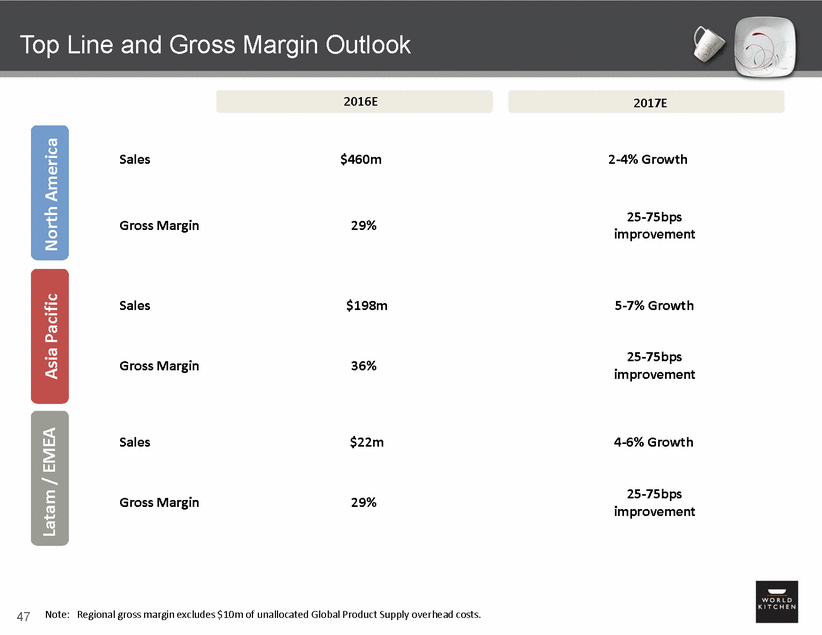
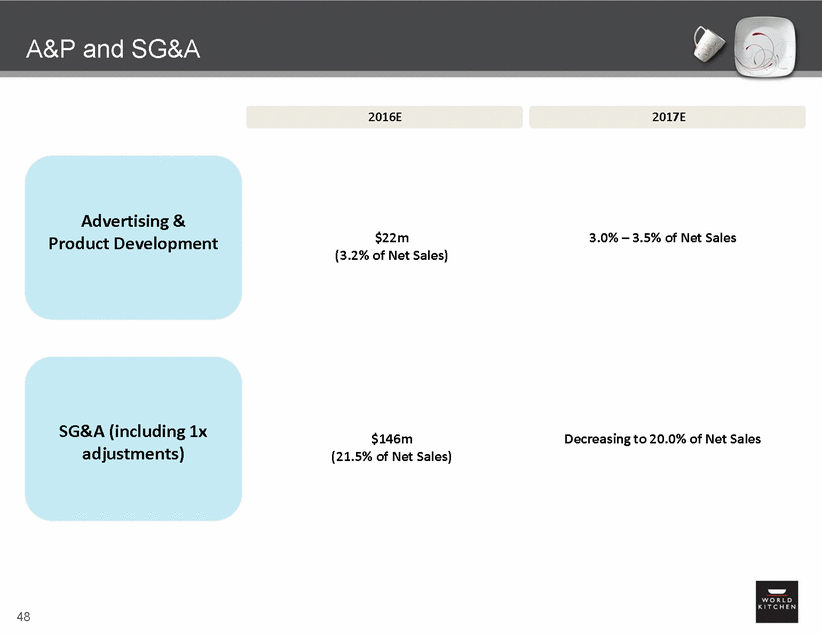
A&P and SG&A Advertising & Product Development $22m (3.2% of Net Sales) 3.0% – 3.5% of Net Sales SG&A (including 1x adjustments) $146m (21.5% of Net Sales) Decreasing to 20.0% of Net Sales 48 2016E 2017E
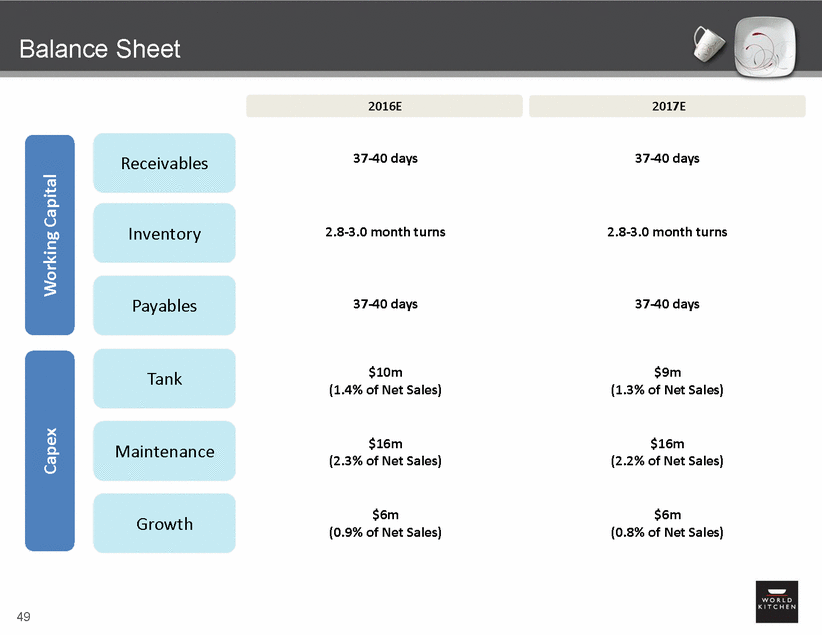
Balance Sheet 37-40 days 37-40 days Receivables Inventory 2.8-3.0 month turns 2.8-3.0 month turns Payables 37-40 days 37-40 days $10m (1.4% of Net Sales) $9m (1.3% of Net Sales) Tank $16m (2.3% of Net Sales) $16m (2.2% of Net Sales) Maintenance $6m (0.9% of Net Sales) $6m (0.8% of Net Sales) Growth 49 Capex Working Capital 2016E 2017E
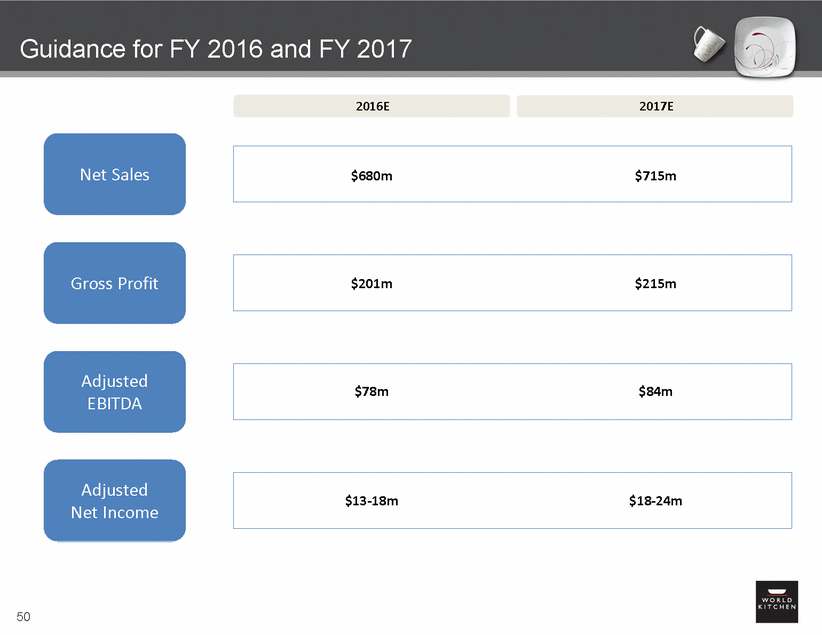
Guidance for FY 2016 and FY 2017 Net Sales Gross Profit Adjusted EBITDA Adjusted Net Income 50 $13-18m$18-24m $78m$84m $201m$215m $680m$715m 2016E 2017E
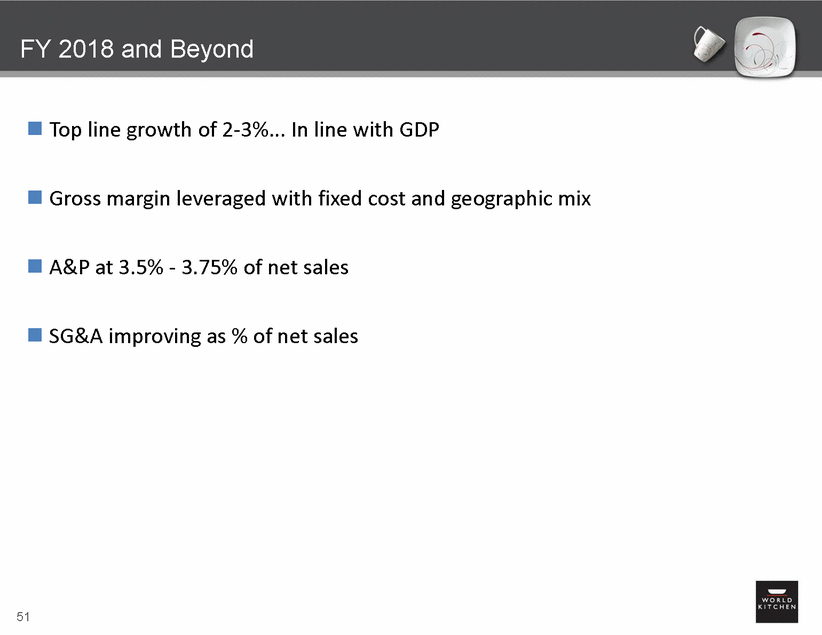
FY 2018 and Beyond Top line growth of 2-3%... In line with GDP Gross margin leveraged with fixed cost and geographic mix A&P at 3.5% - 3.75% of net sales SG&A improving as % of net sales 51
VII. Wrap-up + Q&A
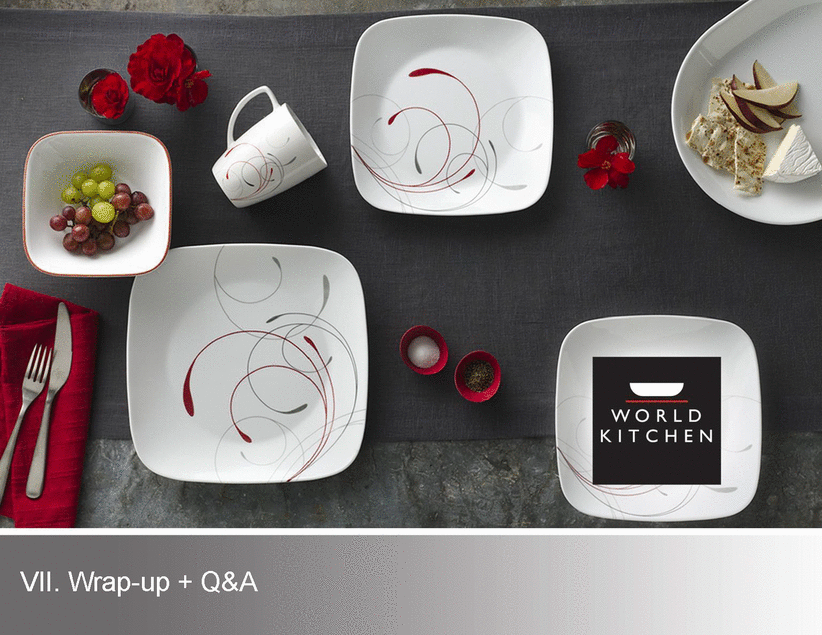
Key Investment Highlights 6B 6C 53 Sector Consolidation Opportunity Platform Optimization 6AContinued Organic Growth 6Three Pillar Strategy for Growth and Value Creation 5Track Record of Consistent and Stable Financial Performance 4Proprietary Technology and Track Record of Innovation 3Significant Presence in High Growth Emerging Markets 2Diverse, Global Footprint Across Multiple Brands, Channels and Retail Partners 1Leading Market Positions via Iconic Brand Portfolio in Large and Stable Homeware Sector
VIII. Appendix
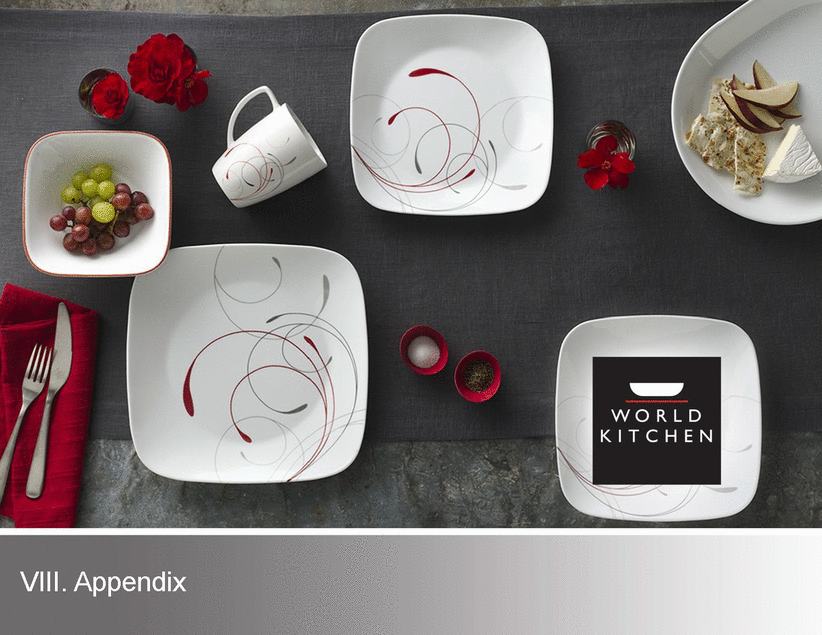
Financial Policy 1 Sustained leverage of 3 – 4x Preserve adequate liquidity with sufficiently sized ABL Target Leverage 2 Will make acquisitions selectively to add capabilities / products / categories Will finance acquisitions responsibly with cash flow and appropriate mix of debt and equity Acquisition Policy Access to follow-on equity proceeds as acquisition currency 3 No dividends anticipated in the near-term, as cash generated by the business will be used to delever and selectively pursue acquisitions Dividend Policy 55
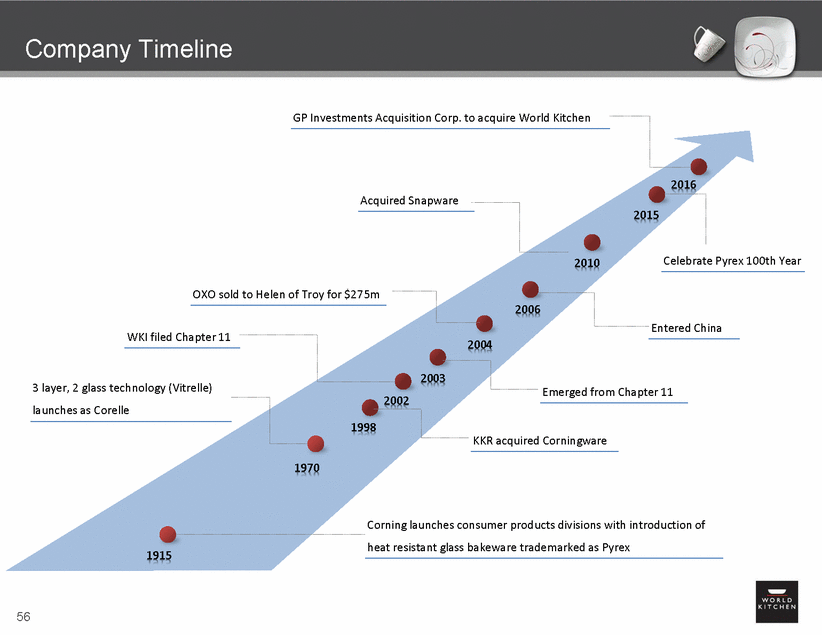
Company Timeline 2016 2015 Celebrate Pyrex 100th Year 2010 OXO sold to Helen of Troy for $275m 2006 WKI filed Chapter 11 2004 2003 3 layer, 2 glass technology (Vitrelle) launches as Corelle Emerged from Chapter 11 2002 1998 KKR acquired Corningware 1970 1915 56 Corning launches consumer products divisions with introduction of heat resistant glass bakeware trademarked as Pyrex Entered China Acquired Snapware GP Investments Acquisition Corp. to acquire World Kitchen
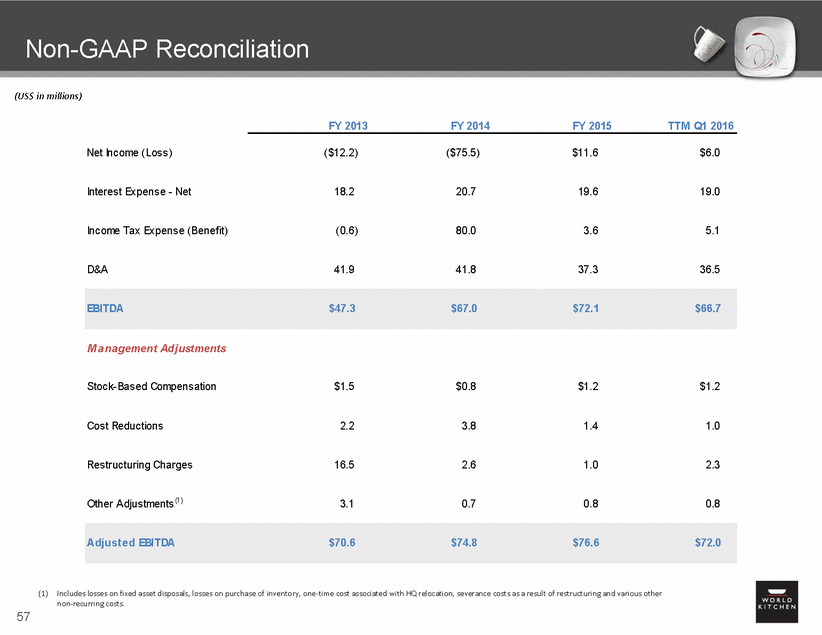
Non-GAAP Reconciliation (US$ in millions) FY 2013 FY 2014 FY 2015 TTM Q1 2016 Net Income (Loss) ($12.2) ($75.5) $11.6 $6.0 Interest Expense - Net 18.2 20.7 19.6 19.0 Income Tax Expense (Benef it) (0.6) 80.0 3.6 5.1 D&A 41.9 41.8 37.3 36.5 M a na gement Adj ustments Stock-Based Compensation $1.5 $0.8 $1.2 $1.2 Cost Reductions 2.2 3.8 1.4 1.0 Restructuring Charges 16.5 2.6 1.0 2.3 Other Adjustments(1) 3.1 0.7 0.8 0.8 (1) Includes losses on fixed asset disposals, losses on purchase of inventory, one-time cost associated with HQ relocation, severance costs as a result of restructuring and various other non-recurring costs. 57 Adjus te d EBITDA $70.6 $74.8 $76.6 $72.0 EBITDA $47.3 $67.0 $72.1 $66.7
