Attached files
| file | filename |
|---|---|
| 8-K - 8-K - FRANKLIN STREET PROPERTIES CORP /MA/ | fsp-20160606x8k.htm |
|
|
Two Ravinia Drive 1999 Broadway 1001 17th Street Addison Circle One Legacy Circle Eldridge Green Westchase I & II 801 Marquette Avenue South Investor Presentation June 2016 Franklin Street Properties Corp. 401 Edgewater Place ● Wakefield, MA 01880 ● (781) 557-1300 www.franklinstreetproperties.com 999 Peachtree Street Plaza Seven |

|
|
Forward-Looking Statements This presentation may contain forward-looking statements based on current judgments and current knowledge of management, which are subject to certain risks, trends and uncertainties that could cause actual results to differ materially from those indicated in such forward-looking statements. Accordingly, readers are cautioned not to place undue reliance on forward-looking statements. Investors are cautioned that our forward-looking statements involve risks and uncertainty, including without limitation, economic conditions in the United States, disruptions in the debt markets, economic conditions in the markets in which we own properties, risks of a lessening of demand for the types of real estate owned by us, changes in government regulations and regulatory uncertainty, uncertainty about governmental fiscal policy, geopolitical events, expenditures that cannot be anticipated such as utility rate and usage increases, unanticipated repairs, additional staffing, insurance increases, real estate tax valuation reassessments and our failure to maintain our status as a real estate investment trust ("REIT") under the Internal Revenue Code of 1986, as amended. Readers are advised to refer to the “Risk Factors” section of our quarterly reports on Form 10-Q and our Annual Report on Form 10-K for additional information concerning these risks and uncertainties. Although we believe the expectations reflected in the forward-looking statements are reasonable, we cannot guarantee future results, levels of activity, performance or achievements. We do not undertake a duty to update or revise any forward-looking statements contained in this presentation, whether as a result of new information, future events or otherwise. Unless otherwise indicated, all information contained in this presentation is as of March 31, 2016. This presentation contains references to Funds from Operations (“FFO”), Adjusted FFO (“AFFO”) and Adjusted EBITDA. Such measurements are non-GAAP (Generally Accepted Accounting Principles) financial measures. Please refer to pages 20 through 24 for definitions and reconciliations of GAAP net income to FFO and Adjusted EBITDA. Past financial performance is not a guarantee of future financial performance. Franklin Street Properties Corp. (“FSP”) assumes no obligation to update or revise the financial information contained in this presentation. |
|
|
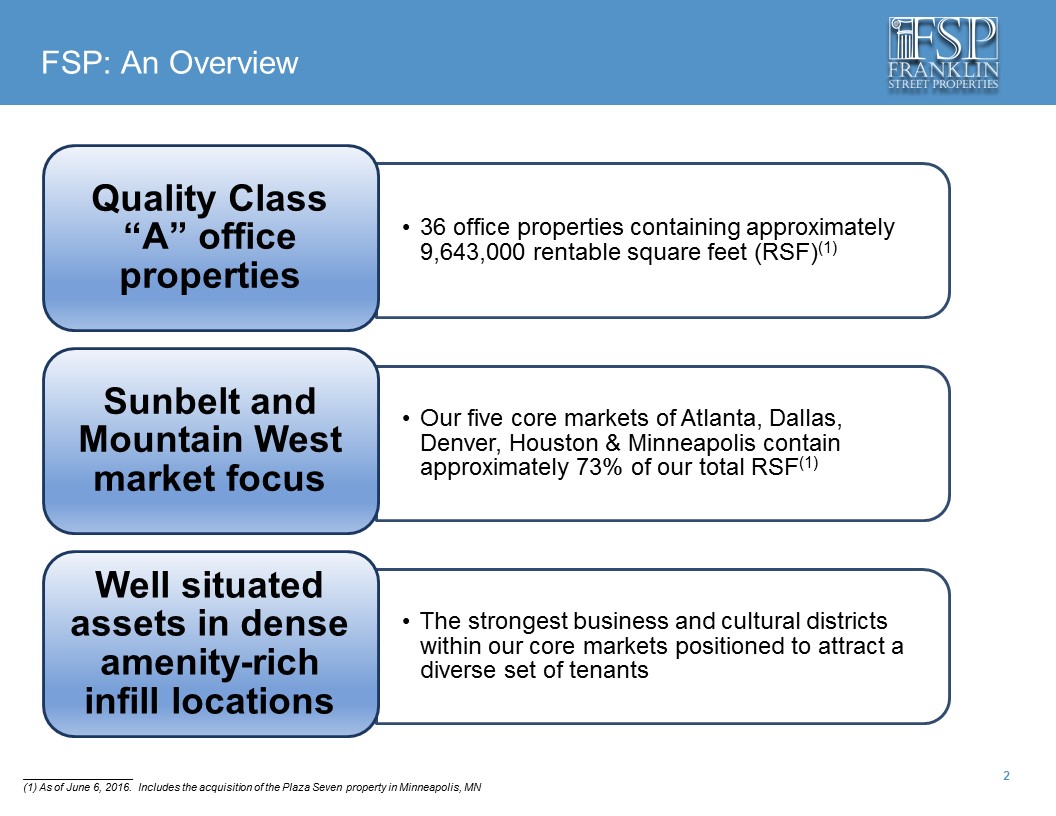
FSP: An Overview ____________________ (1) As of June 6, 2016. Includes the acquisition of the Plaza Seven property in Minneapolis, MN |
|
|
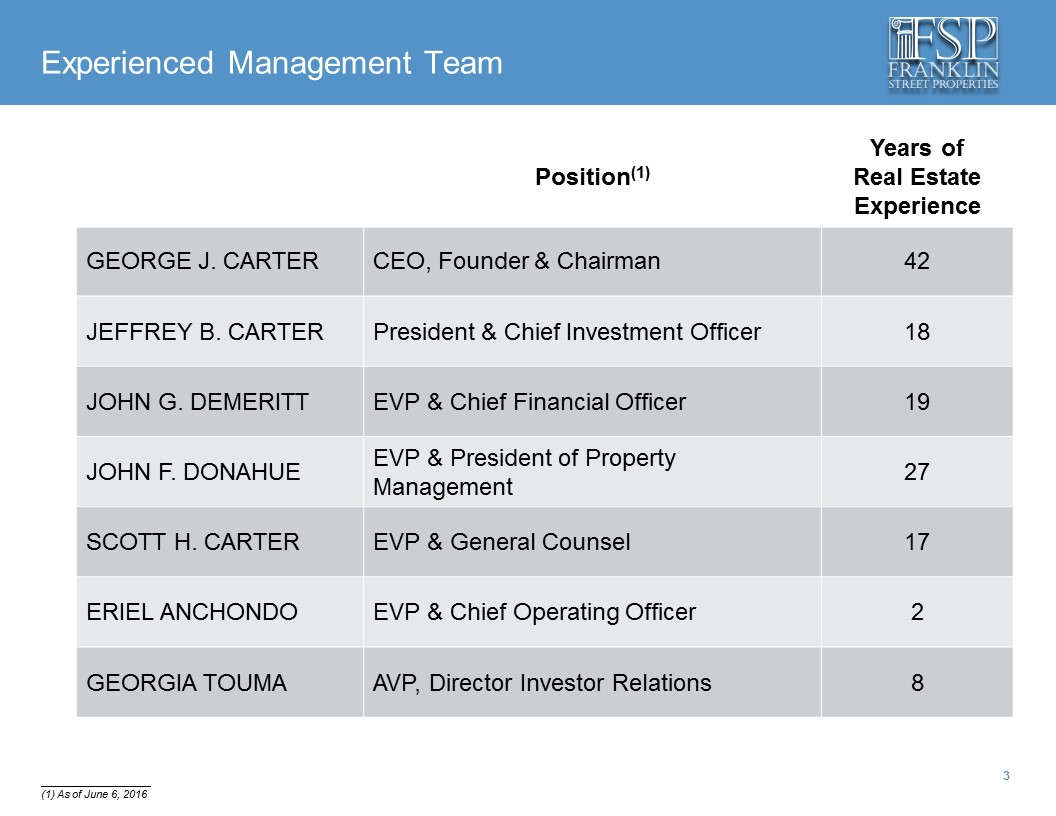
Experienced Management Team Position(1) Years of Real Estate Experience GEORGE J. CARTER CEO, Founder & Chairman 42 JEFFREY B. CARTER President & Chief Investment Officer 18 JOHN G. DEMERITT EVP & Chief Financial Officer 19 JOHN F. DONAHUE EVP & President of Property Management 27 SCOTT H. CARTER EVP & General Counsel 17 ERIEL ANCHONDO EVP & Chief Operating Officer 2 GEORGIA TOUMA AVP, Director Investor Relations 8 ____________________ (1) As of June 6, 2016 |
|
|
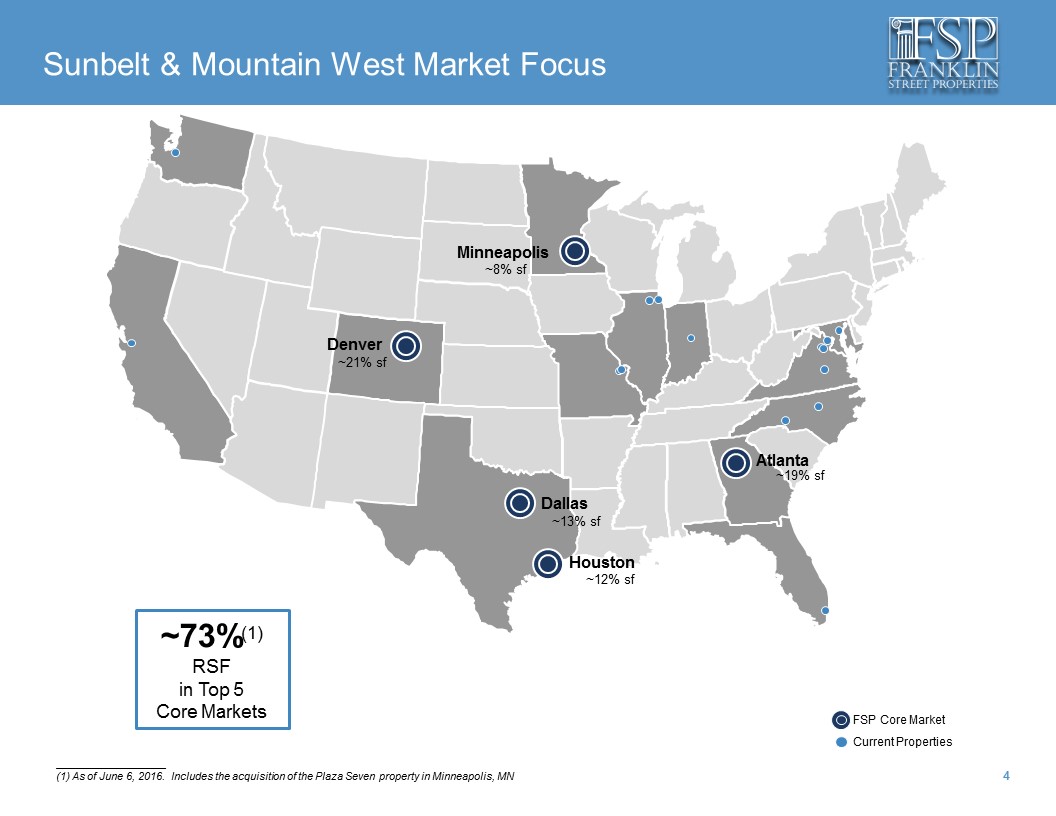
~73%(1) RSF in Top 5 Core Markets Sunbelt & Mountain West Market Focus FSP Core Market Current Properties Houston Dallas Minneapolis Denver Atlanta ~8% sf ~21% sf ~13% sf ~12% sf ~19% sf ____________________ (1) As of June 6, 2016. Includes the acquisition of the Plaza Seven property in Minneapolis, MN |
|
|
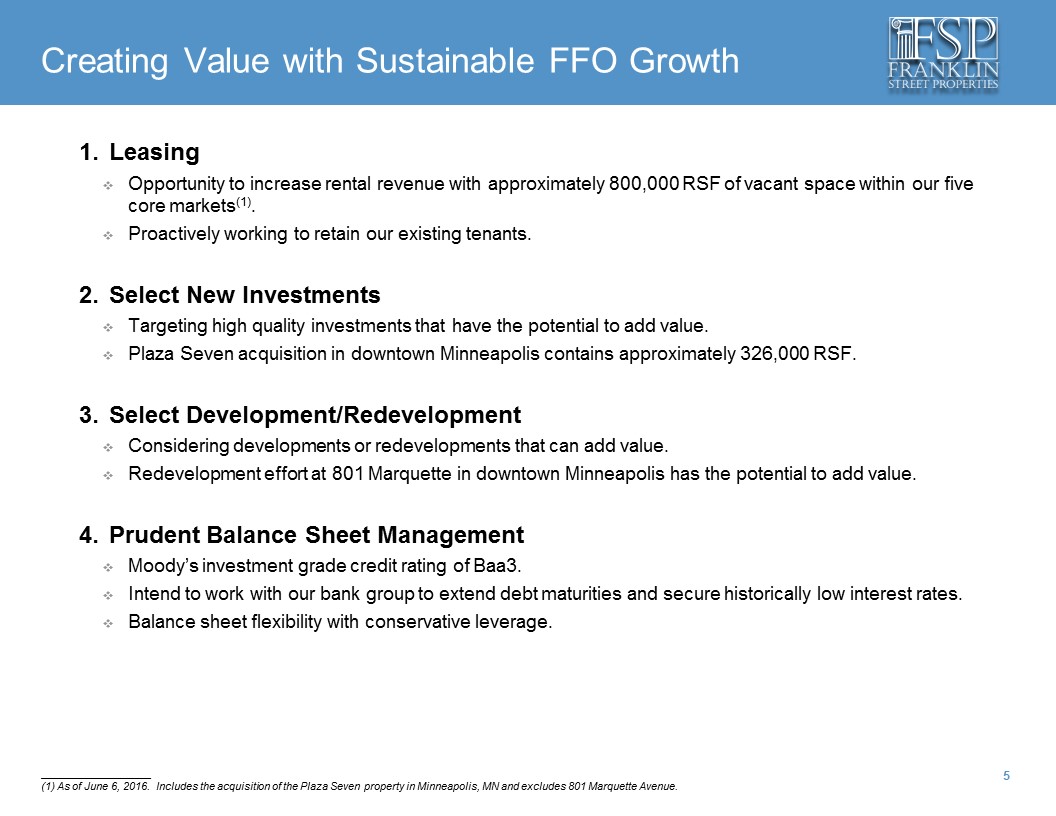
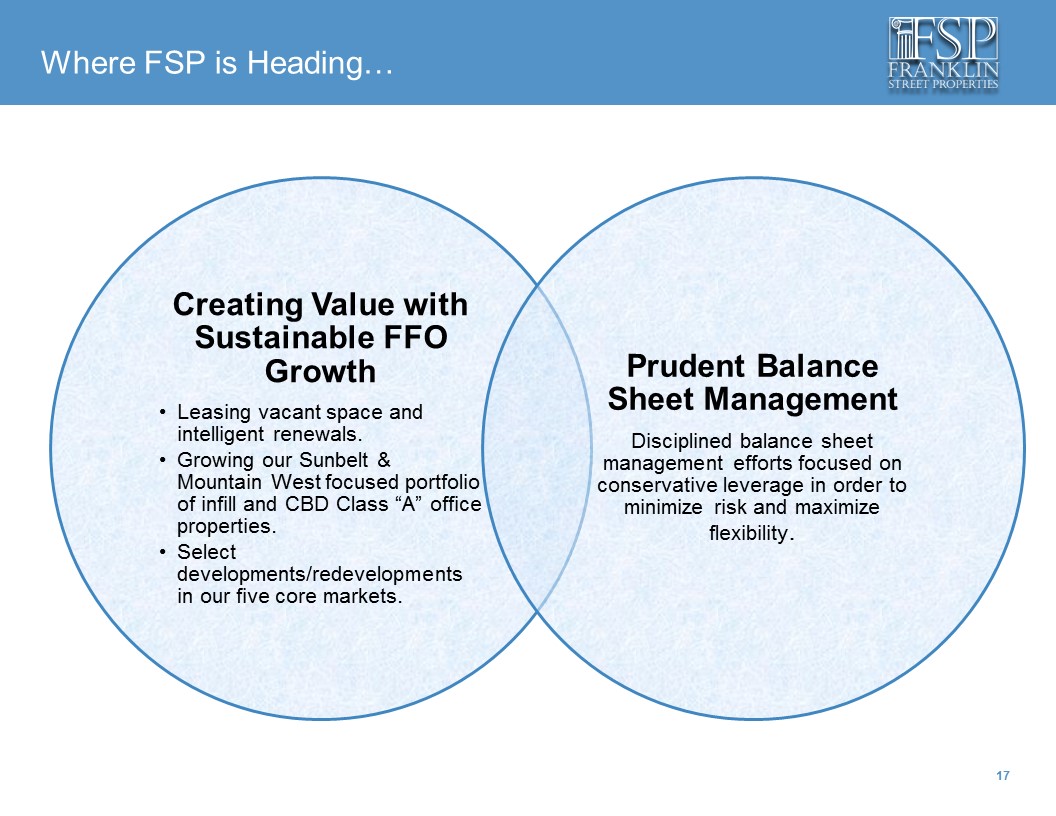
Creating Value with Sustainable FFO Growth Leasing Opportunity to increase rental revenue with approximately 800,000 RSF of vacant space within our five core markets(1). Proactively working to retain our existing tenants. Select New Investments Targeting high quality investments that have the potential to add value. Plaza Seven acquisition in downtown Minneapolis contains approximately 326,000 RSF. Select Development/Redevelopment Considering developments or redevelopments that can add value. Redevelopment effort at 801 Marquette in downtown Minneapolis has the potential to add value. Prudent Balance Sheet Management Moody’s investment grade credit rating of Baa3. Intend to work with our bank group to extend debt maturities and secure historically low interest rates. Balance sheet flexibility with conservative leverage. ____________________ (1) As of June 6, 2016. Includes the acquisition of the Plaza Seven property in Minneapolis, MN and excludes 801 Marquette Avenue. |
|
|
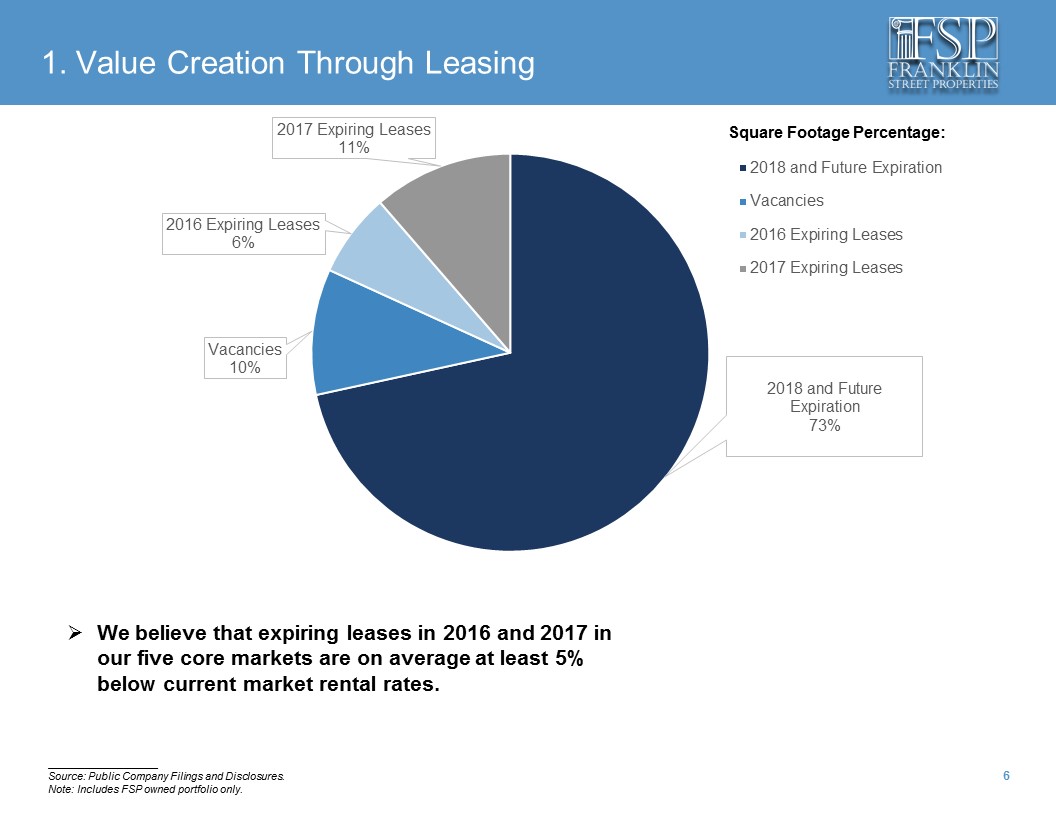
1. Value Creation Through Leasing We believe that expiring leases in 2016 and 2017 in our five core markets are on average at least 5% below current market rental rates. 2018 and Future Expiration 73% Vacancies 10% 2016 Expiring Leases 6% 2017 Expiring Leases 11% 2018 and Future Expiration Vacancies 2016 Expiring Leases 2017 Expiring Leases Square Footage Percentage: Source: Public Company Filings and Disclosures. Note: Includes FSP owned portfolio only. |
|
|
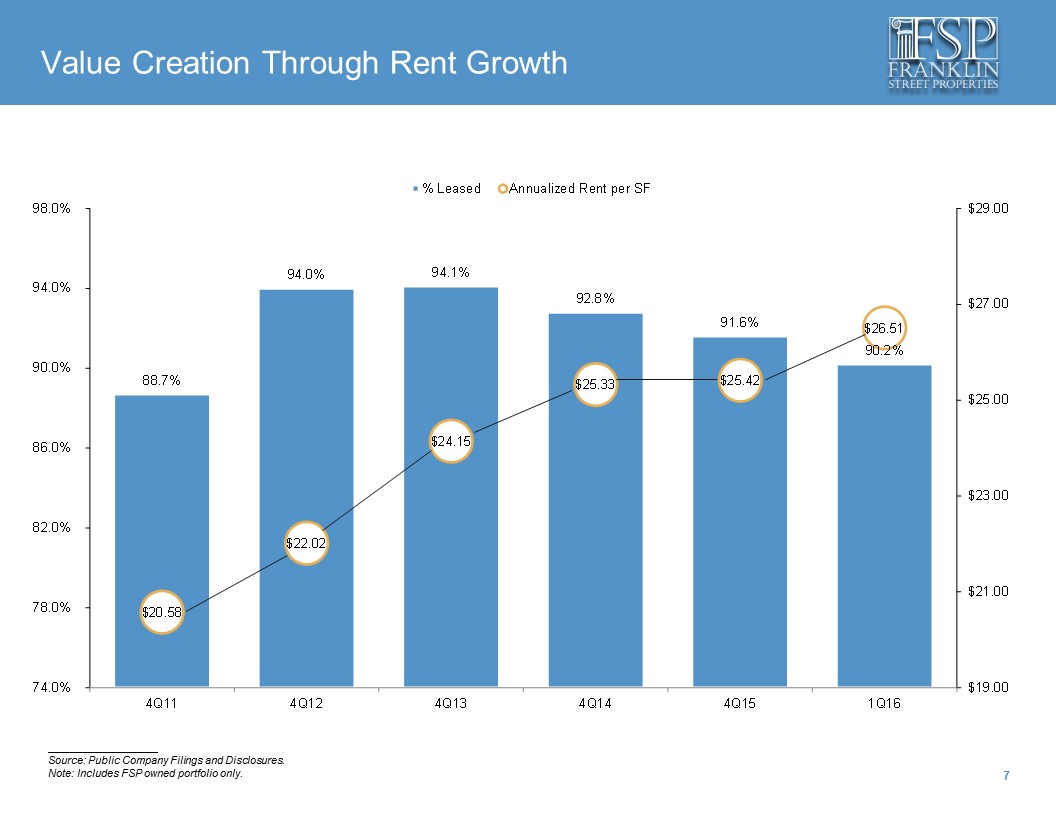
Value Creation Through Rent Growth ____________________ Source: Public Company Filings and Disclosures. Note: Includes FSP owned portfolio only. 88.7% 94.0% 94.1% 92.8% 91.6% 90.2% $20.58 $22.02 $24.15 $25.33 $25.42 $26.51 $19.00 $21.00 $23.00 $25.00 $27.00 $29.00 74.0% 78.0% 82.0% 86.0% 90.0% 94.0% 98.0% 4Q11 4Q12 4Q13 4Q14 4Q15 1Q16 % Leased Annualized Rent per SF |
|
|
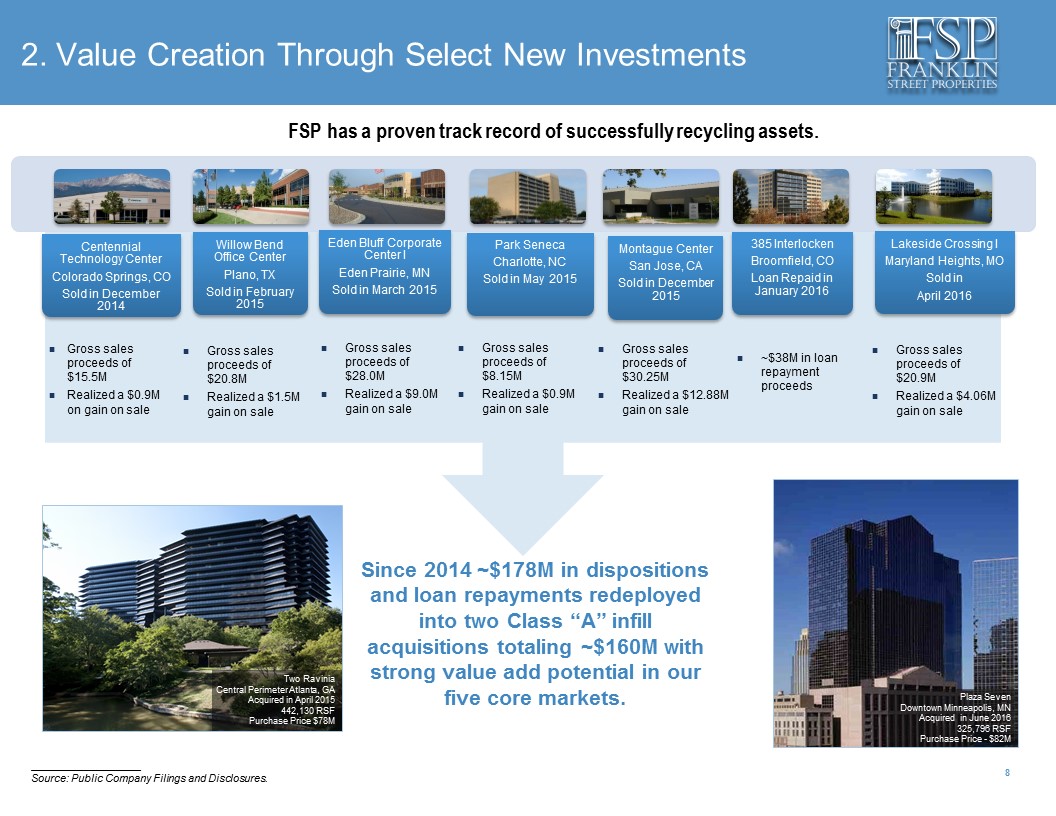
Gross sales proceeds of $20.8M Realized a $1.5M gain on sale 2. Value Creation Through Select New Investments Two Ravinia Central Perimeter Atlanta, GA Acquired in April 2015 442,130 RSF Purchase Price $78M Since 2014 ~$178M in dispositions and loan repayments redeployed into two Class “A” infill acquisitions totaling ~$160M with strong value add potential in our five core markets. Gross sales proceeds of $15.5M Realized a $0.9M on gain on sale Gross sales proceeds of $28.0M Realized a $9.0M gain on sale FSP has a proven track record of successfully recycling assets. Gross sales proceeds of $8.15M Realized a $0.9M gain on sale ____________________ Source: Public Company Filings and Disclosures. Gross sales proceeds of $30.25M Realized a $12.88M gain on sale Plaza Seven Downtown Minneapolis, MN Acquired in June 2016 325,796 RSF Purchase Price - $82M ~$38M in loan repayment proceeds Gross sales proceeds of $20.9M Realized a $4.06M gain on sale |
|
|
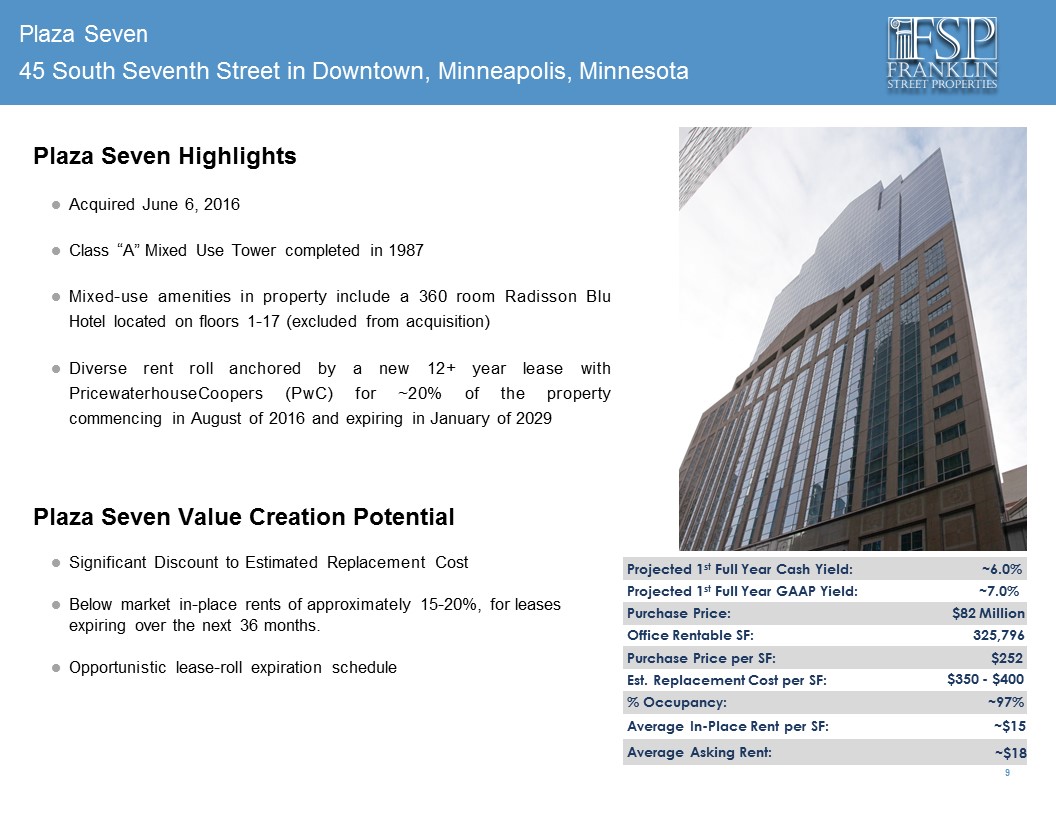
Plaza Seven Plaza Seven Highlights Acquired June 6, 2016 Class “A” Mixed Use Tower completed in 1987 Mixed-use amenities in property include a 360 room Radisson Blu Hotel located on floors 1-17 (excluded from acquisition) Diverse rent roll anchored by a new 12+ year lease with PricewaterhouseCoopers (PwC) for ~20% of the property commencing in August of 2016 and expiring in January of 2029 Plaza Seven Value Creation Potential Significant Discount to Estimated Replacement Cost Below market in-place rents of approximately 15-20%, for leases expiring over the next 36 months. Opportunistic lease-roll expiration schedule Projected 1st Full Year Cash Yield: ~6.0% Projected 1st Full Year GAAP Yield: ~7.0% Purchase Price: $82 Million Office Rentable SF: 325,796 Purchase Price per SF: $252 Est. Replacement Cost per SF: $350 - $400 % Occupancy: ~97% Average In-Place Rent per SF: ~$15 Average Asking Rent: ~$18 45 South Seventh Street in Downtown, Minneapolis, Minnesota |
|
|
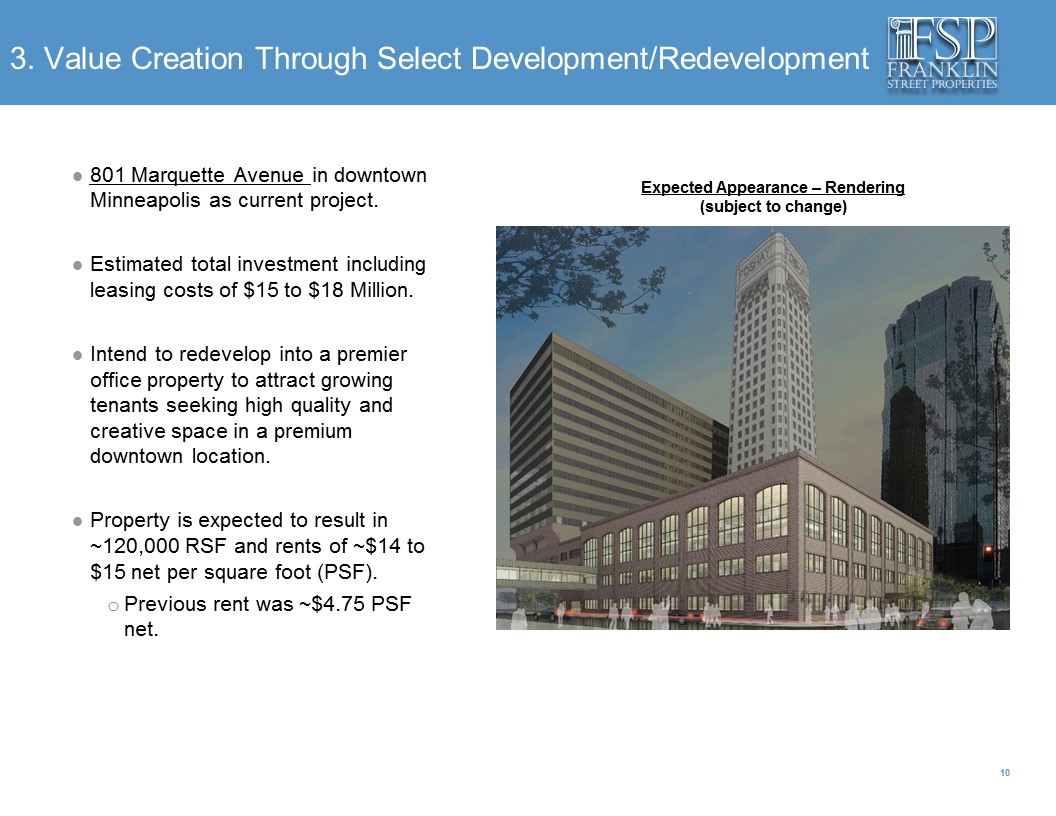
3. Value Creation Through Select Development/Redevelopment 801 Marquette Avenue in downtown Minneapolis as current project. Estimated total investment including leasing costs of $15 to $18 Million. Intend to redevelop into a premier office property to attract growing tenants seeking high quality and creative space in a premium downtown location. Property is expected to result in ~120,000 RSF and rents of ~$14 to $15 net per square foot (PSF). Previous rent was ~$4.75 PSF net. Expected Appearance – Rendering (subject to change) |
|
|
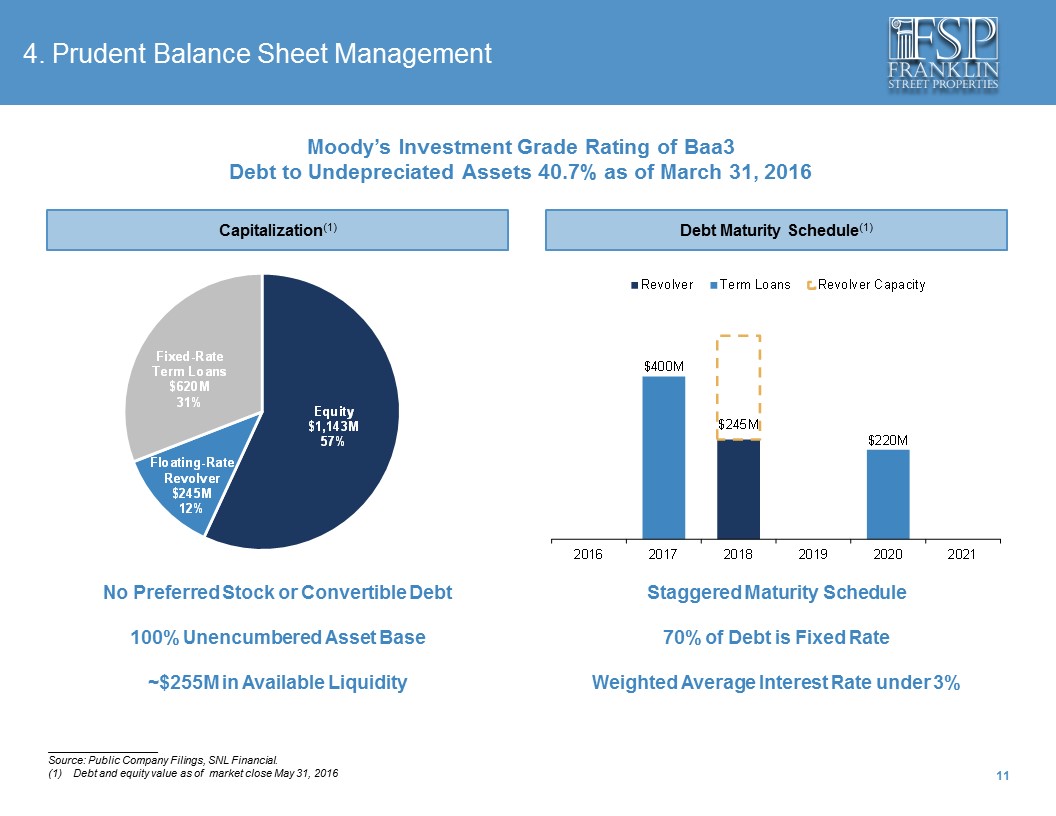
Staggered Maturity Schedule 70% of Debt is Fixed Rate Weighted Average Interest Rate under 3% No Preferred Stock or Convertible Debt 100% Unencumbered Asset Base ~$255M in Available Liquidity Capitalization(1) Debt Maturity Schedule(1) Moody’s Investment Grade Rating of Baa3 Debt to Undepreciated Assets 40.7% as of March 31, 2016 ____________________ Source: Public Company Filings, SNL Financial. (1) Debt and equity value as of market close May 31, 2016 4. Prudent Balance Sheet Management Equity $1,143M 57% Floating - Rate Revolver $245M 12% Fixed - Rate Term Loans $620M 31% $245M $400M $220M 2016 2017 2018 2019 2020 2021 Revolver Term Loans Revolver Capacity |
|
|
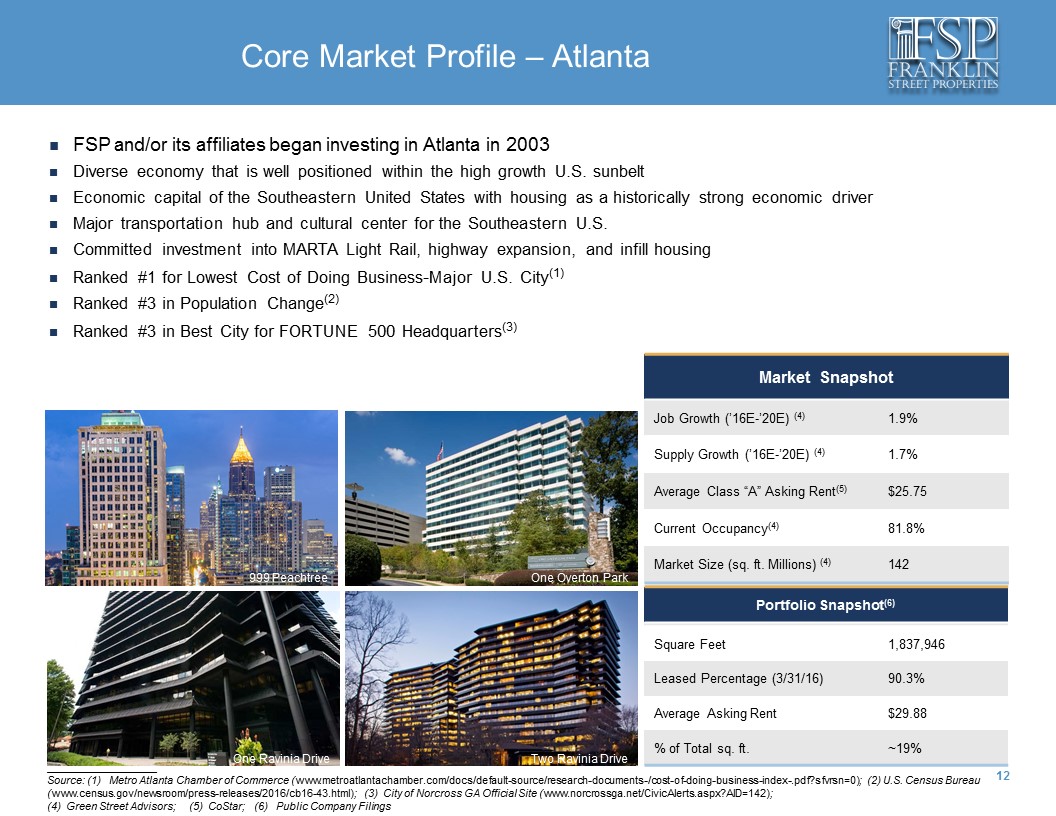
Core Market Profile – Atlanta Portfolio Snapshot(6) Square Feet 1,837,946 Leased Percentage (3/31/16) 90.3% Average Asking Rent $29.88 % of Total sq. ft. ~19% One Ravinia Drive Two Ravinia Drive ____________________ Source: (1) Metro Atlanta Chamber of Commerce (www.metroatlantachamber.com/docs/default-source/research-documents-/cost-of-doing-business-index-.pdf?sfvrsn=0); (2) U.S. Census Bureau (www.census.gov/newsroom/press-releases/2016/cb16-43.html); (3) City of Norcross GA Official Site (www.norcrossga.net/CivicAlerts.aspx?AID=142); (4) Green Street Advisors; (5) CoStar; (6) Public Company Filings FSP and/or its affiliates began investing in Atlanta in 2003 Diverse economy that is well positioned within the high growth U.S. sunbelt Economic capital of the Southeastern United States with housing as a historically strong economic driver Major transportation hub and cultural center for the Southeastern U.S. Committed investment into MARTA Light Rail, highway expansion, and infill housing Ranked #1 for Lowest Cost of Doing Business-Major U.S. City(1) Ranked #3 in Population Change(2) Ranked #3 in Best City for FORTUNE 500 Headquarters(3) Market Snapshot Job Growth (’16E-’20E) (4) 1.9% Supply Growth (’16E-’20E) (4) 1.7% Average Class “A” Asking Rent(5) $25.75 Current Occupancy(4) 81.8% Market Size (sq. ft. Millions) (4) 142 999 Peachtree One Overton Park |
|
|
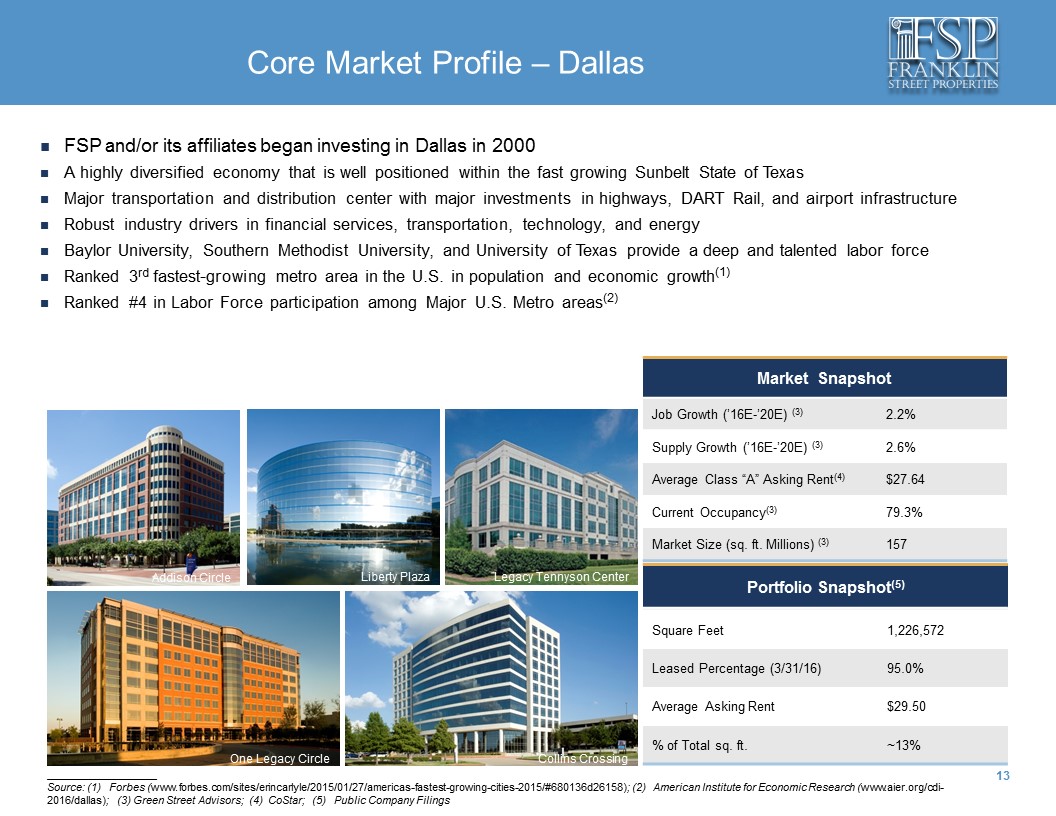
Portfolio Snapshot(5) Square Feet 1,226,572 Leased Percentage (3/31/16) 95.0% Average Asking Rent $29.50 % of Total sq. ft. ~13% Core Market Profile – Dallas One Legacy Circle Collins Crossing ____________________ Source: (1) Forbes (www.forbes.com/sites/erincarlyle/2015/01/27/americas-fastest-growing-cities-2015/#680136d26158); (2) American Institute for Economic Research (www.aier.org/cdi-2016/dallas); (3) Green Street Advisors; (4) CoStar; (5) Public Company Filings FSP and/or its affiliates began investing in Dallas in 2000 A highly diversified economy that is well positioned within the fast growing Sunbelt State of Texas Major transportation and distribution center with major investments in highways, DART Rail, and airport infrastructure Robust industry drivers in financial services, transportation, technology, and energy Baylor University, Southern Methodist University, and University of Texas provide a deep and talented labor force Ranked 3rd fastest-growing metro area in the U.S. in population and economic growth(1) Ranked #4 in Labor Force participation among Major U.S. Metro areas(2) Market Snapshot Job Growth (’16E-’20E) (3) 2.2% Supply Growth (’16E-’20E) (3) 2.6% Average Class “A” Asking Rent(4) $27.64 Current Occupancy(3) 79.3% Market Size (sq. ft. Millions) (3) 157 Addison Circle Liberty Plaza Legacy Tennyson Center |
|
|
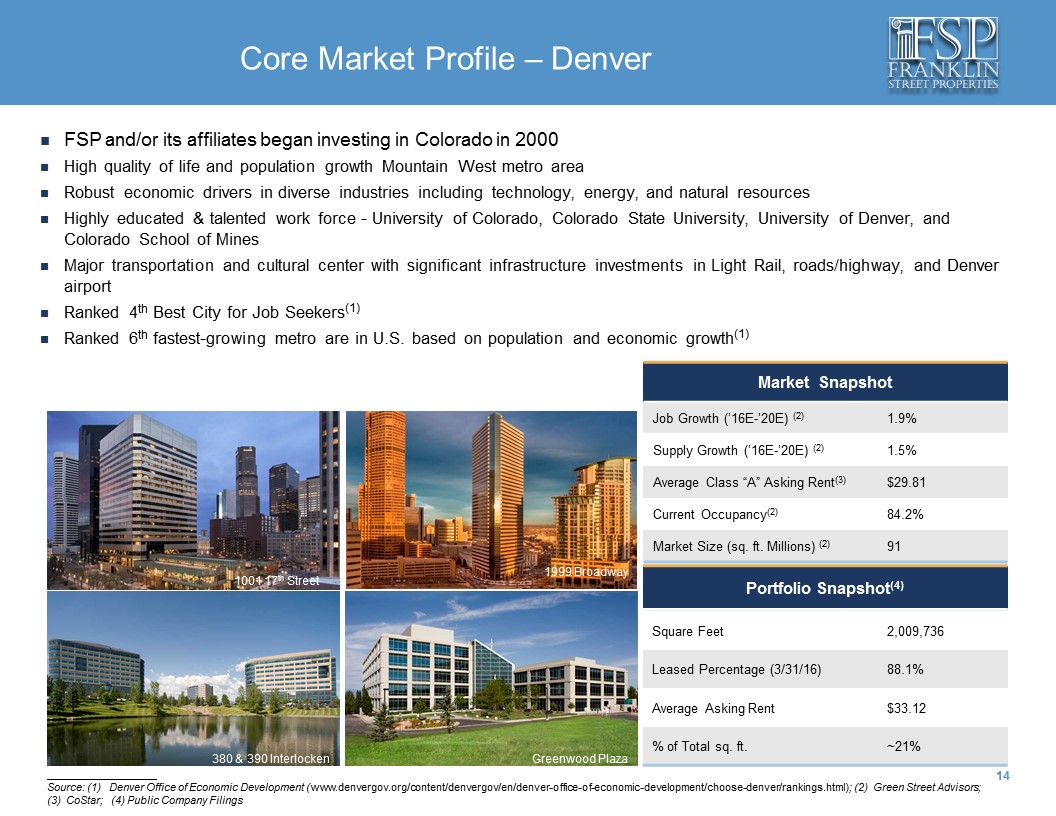
Core Market Profile – Denver Portfolio Snapshot(4) Square Feet 2,009,736 Leased Percentage (3/31/16) 88.1% Average Asking Rent $33.12 % of Total sq. ft. ~21% 380 & 390 Interlocken Greenwood Plaza ____________________ Source: (1) Denver Office of Economic Development (www.denvergov.org/content/denvergov/en/denver-office-of-economic-development/choose-denver/rankings.html); (2) Green Street Advisors; (3) CoStar; (4) Public Company Filings FSP and/or its affiliates began investing in Colorado in 2000 High quality of life and population growth Mountain West metro area Robust economic drivers in diverse industries including technology, energy, and natural resources Highly educated & talented work force - University of Colorado, Colorado State University, University of Denver, and Colorado School of Mines Major transportation and cultural center with significant infrastructure investments in Light Rail, roads/highway, and Denver airport Ranked 4th Best City for Job Seekers(1) Ranked 6th fastest-growing metro are in U.S. based on population and economic growth(1) Market Snapshot Job Growth (’16E-’20E) (2) 1.9% Supply Growth (’16E-’20E) (2) 1.5% Average Class “A” Asking Rent(3) $29.81 Current Occupancy(2) 84.2% Market Size (sq. ft. Millions) (2) 91 1001 17th Street 1999 Broadway |
|
|
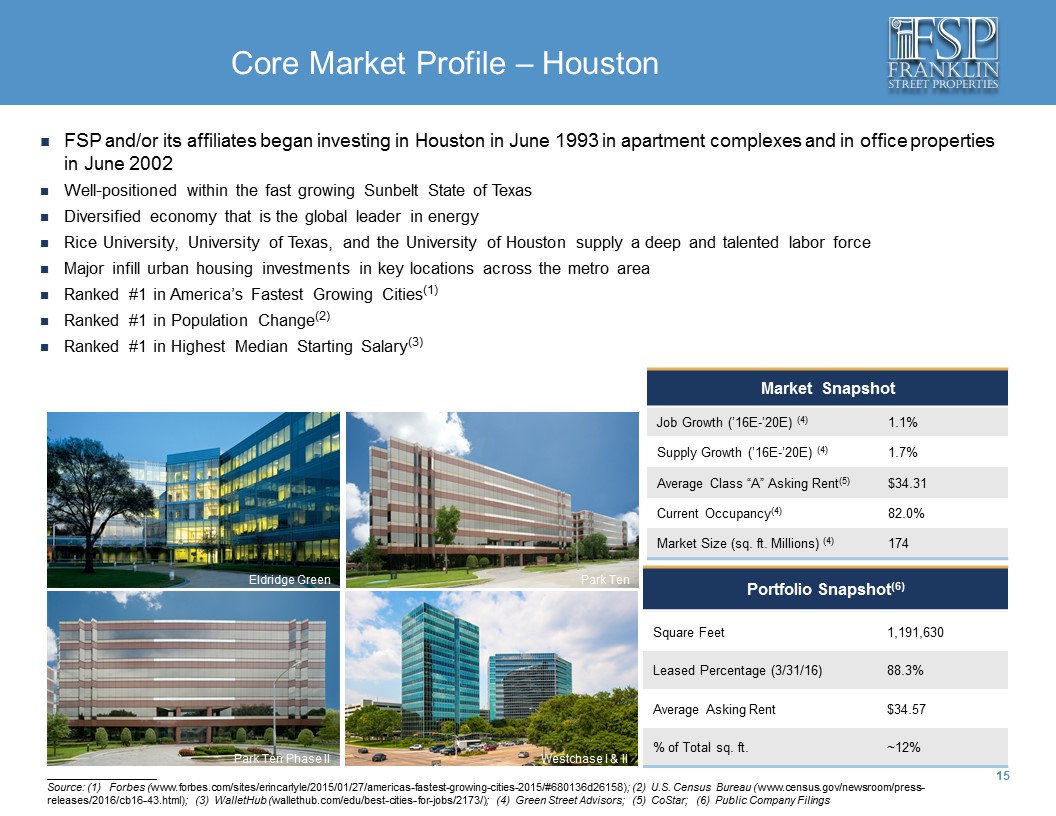
Core Market Profile – Houston Portfolio Snapshot(6) Square Feet 1,191,630 Leased Percentage (3/31/16) 88.3% Average Asking Rent $34.57 % of Total sq. ft. ~12% Park Ten Phase II Westchase I & II ____________________ Source: (1) Forbes (www.forbes.com/sites/erincarlyle/2015/01/27/americas-fastest-growing-cities-2015/#680136d26158); (2) U.S. Census Bureau (www.census.gov/newsroom/press-releases/2016/cb16-43.html); (3) WalletHub (wallethub.com/edu/best-cities-for-jobs/2173/); (4) Green Street Advisors; (5) CoStar; (6) Public Company Filings FSP and/or its affiliates began investing in Houston in June 1993 in apartment complexes and in office properties in June 2002 Well-positioned within the fast growing Sunbelt State of Texas Diversified economy that is the global leader in energy Rice University, University of Texas, and the University of Houston supply a deep and talented labor force Major infill urban housing investments in key locations across the metro area Ranked #1 in America’s Fastest Growing Cities(1) Ranked #1 in Population Change(2) Ranked #1 in Highest Median Starting Salary(3) Market Snapshot Job Growth (’16E-’20E) (4) 1.1% Supply Growth (’16E-’20E) (4) 1.7% Average Class “A” Asking Rent(5) $34.31 Current Occupancy(4) 82.0% Market Size (sq. ft. Millions) (4) 174 Park Ten Eldridge Green |
|
|
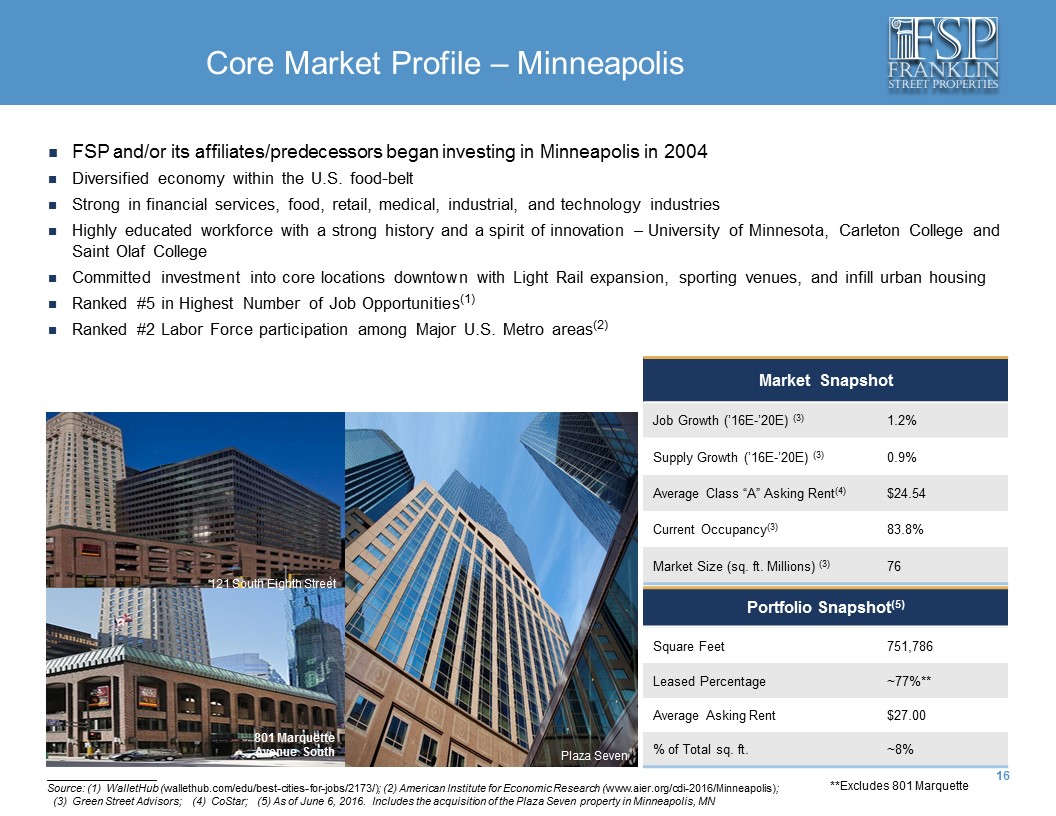
Core Market Profile – Minneapolis Portfolio Snapshot(5) Square Feet 751,786 Leased Percentage ~77%** Average Asking Rent $27.00 % of Total sq. ft. ~8% ____________________ Source: (1) WalletHub (wallethub.com/edu/best-cities-for-jobs/2173/); (2) American Institute for Economic Research (www.aier.org/cdi-2016/Minneapolis); (3) Green Street Advisors; (4) CoStar; (5) As of June 6, 2016. Includes the acquisition of the Plaza Seven property in Minneapolis, MN FSP and/or its affiliates/predecessors began investing in Minneapolis in 2004 Diversified economy within the U.S. food-belt Strong in financial services, food, retail, medical, industrial, and technology industries Highly educated workforce with a strong history and a spirit of innovation – University of Minnesota, Carleton College and Saint Olaf College Committed investment into core locations downtown with Light Rail expansion, sporting venues, and infill urban housing Ranked #5 in Highest Number of Job Opportunities(1) Ranked #2 Labor Force participation among Major U.S. Metro areas(2) Market Snapshot Job Growth (’16E-’20E) (3) 1.2% Supply Growth (’16E-’20E) (3) 0.9% Average Class “A” Asking Rent(4) $24.54 Current Occupancy(3) 83.8% Market Size (sq. ft. Millions) (3) 76 801 Marquette Avenue South 121 South Eighth Street Plaza Seven Plaza 7***Excludes 801 Marquette |
|
|
Where FSP is Heading |
|
|
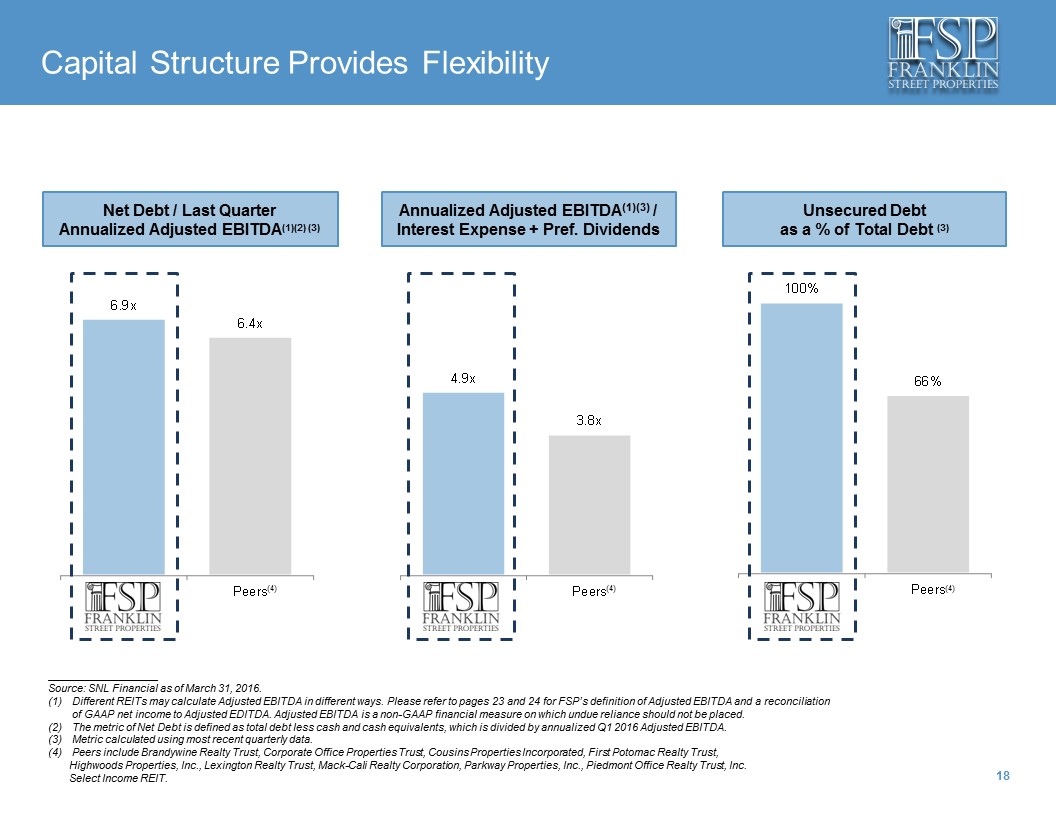
Capital Structure Provides Flexibility Annualized Adjusted EBITDA(1) (3) / Interest Expense + Pref. Dividends Net Debt / Last Quarter Annualized Adjusted EBITDA(1)(2) (3) Unsecured Debt as a % of Total Debt (3) (4) (4) (4) ____________________ Source: SNL Financial as of March 31, 2016. Different REITs may calculate Adjusted EBITDA in different ways. Please refer to pages 23 and 24 for FSP’s definition of Adjusted EBITDA and a reconciliation of GAAP net income to Adjusted EDITDA. Adjusted EBITDA is a non-GAAP financial measure on which undue reliance should not be placed. The metric of Net Debt is defined as total debt less cash and cash equivalents, which is divided by annualized Q1 2016 Adjusted EBITDA. Metric calculated using most recent quarterly data. Peers include Brandywine Realty Trust, Corporate Office Properties Trust, Cousins Properties Incorporated, First Potomac Realty Trust, Highwoods Properties, Inc., Lexington Realty Trust, Mack-Cali Realty Corporation, Parkway Properties, Inc., Piedmont Office Realty Trust, Inc. Select Income REIT. 100% 66% FSP Peers 4.9x 3.8x FSP Peers 6.9x 6.4x FSP Peers |
|
|
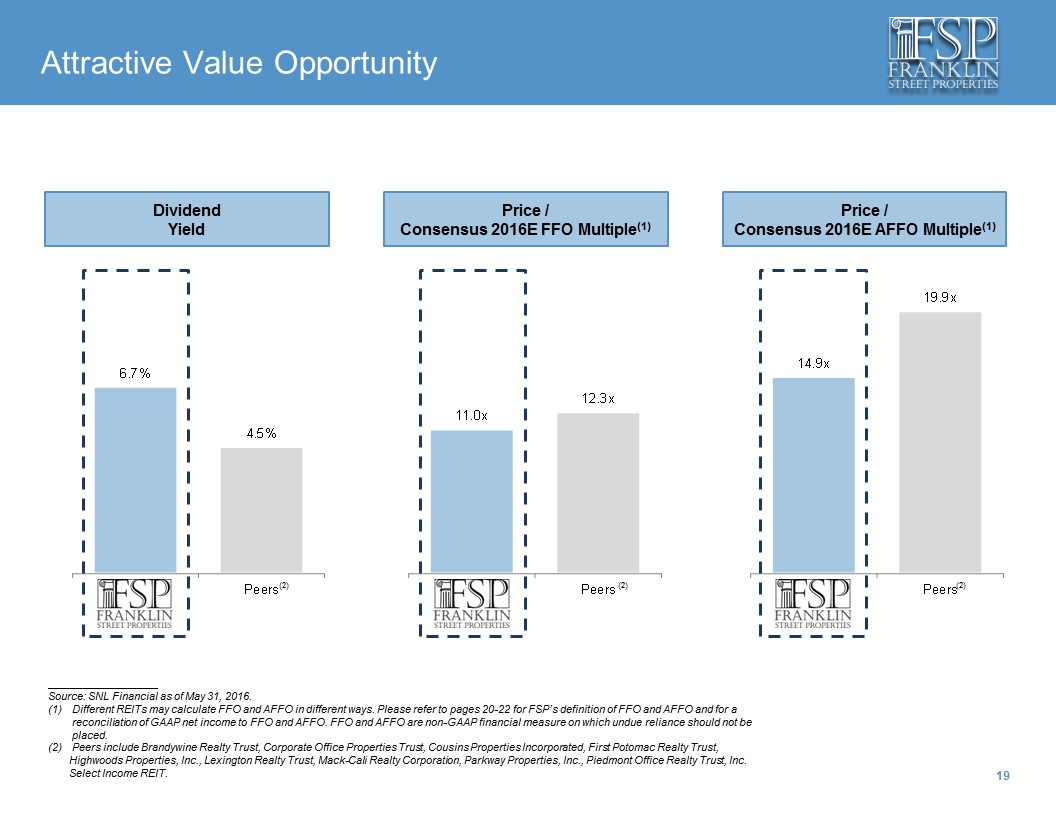
Attractive Value Opportunity Price / Consensus 2016E FFO Multiple(1) Dividend Yield Price / Consensus 2016E AFFO Multiple(1) ____________________ Source: SNL Financial as of May 31, 2016. Different REITs may calculate FFO and AFFO in different ways. Please refer to pages 20-22 for FSP’s definition of FFO and AFFO and for a reconciliation of GAAP net income to FFO and AFFO. FFO and AFFO are non-GAAP financial measure on which undue reliance should not be placed. Peers include Brandywine Realty Trust, Corporate Office Properties Trust, Cousins Properties Incorporated, First Potomac Realty Trust, Highwoods Properties, Inc., Lexington Realty Trust, Mack-Cali Realty Corporation, Parkway Properties, Inc., Piedmont Office Realty Trust, Inc. Select Income REIT. (2) (2) (2) 14.9x 19.9x FSP Peers 6.7% 4.5% FSP Peers 11.0x 12.3x FSP Peers |
|
|
Appendix: Non-GAAP Financial Measure Definitions Definition of Funds From Operations (FFO) The Company evaluates performance based on Funds From Operations, which we refer to as FFO, as management believes that FFO represents the most accurate measure of activity and is the basis for distributions paid to equity holders. The Company defines FFO as net income (computed in accordance with GAAP), excluding gains (or losses) from sales of property and acquisition costs of newly acquired properties that are not capitalized, plus depreciation and amortization, including amortization of acquired above and below market lease intangibles and impairment charges on properties or investments in non-consolidated REITs, and after adjustments to exclude equity in income or losses from, and, to include the proportionate share of FFO from, non-consolidated REITs. FFO should not be considered as an alternative to net income (determined in accordance with GAAP), nor as an indicator of the Company’s financial performance, nor as an alternative to cash flows from operating activities (determined in accordance with GAAP), nor as a measure of the Company’s liquidity, nor is it necessarily indicative of sufficient cash flow to fund all of the Company’s needs. Other real estate companies and the National Association of Real Estate Investment Trusts, or NAREIT, may define this term in a different manner. We have included the NAREIT FFO definition in our table and note that other REITs may not define FFO in accordance with the current NAREIT definition or may interpret the current NAREIT definition differently than we do. We believe that in order to facilitate a clear understanding of the results of the Company, FFO should be examined in connection with net income and cash flows from operating, investing and financing activities in the consolidated financial statements. Appendix: Non-GAAP Financial Measure Definitions and Reconciliations to GAAP Net Income |
|
|
Definition of Adjusted Funds From Operations (AFFO) The Company defines AFFO as the sum of (1) FFO; (2) excluding our proportionate share of FFO and including distributions received, from non-consolidated REITs; (3) excluding the effect of straight-line rent; (4) plus deferred financing costs, (5) less recurring capital expenditures that are generally for (a) maintenance of properties, which we call non-investment capex or are second generation capital expenditures. Second generation costs include re-tenanting space after a tenant vacates, which include tenant improvements and leasing commissions. We exclude development/redevelopment activities, capital expenditures planned at acquisition and costs to reposition a property. We also exclude first generation leasing costs, which are generally to fill vacant space in properties we acquire or were planned for at acquisition. AFFO should not be considered as an alternative to net income (determined in accordance with GAAP), as an indicator of the Company’s financial performance, nor as an alternative to cash flows from operating activities (determined in accordance with GAAP), nor as a measure of the Company’s liquidity, nor is it necessarily indicative of sufficient cash flow to fund all of the Company’s needs. Other real estate companies may define this term in a different manner. We believe that in order to facilitate a clear understanding of the results of the Company, AFFO should be examined in connection with net income and cash flows from operating, investing and financing activities in the consolidated financial statements. Appendix: Non-GAAP Financial Measure Definitions and Reconciliations to GAAP Net Income |
|
|
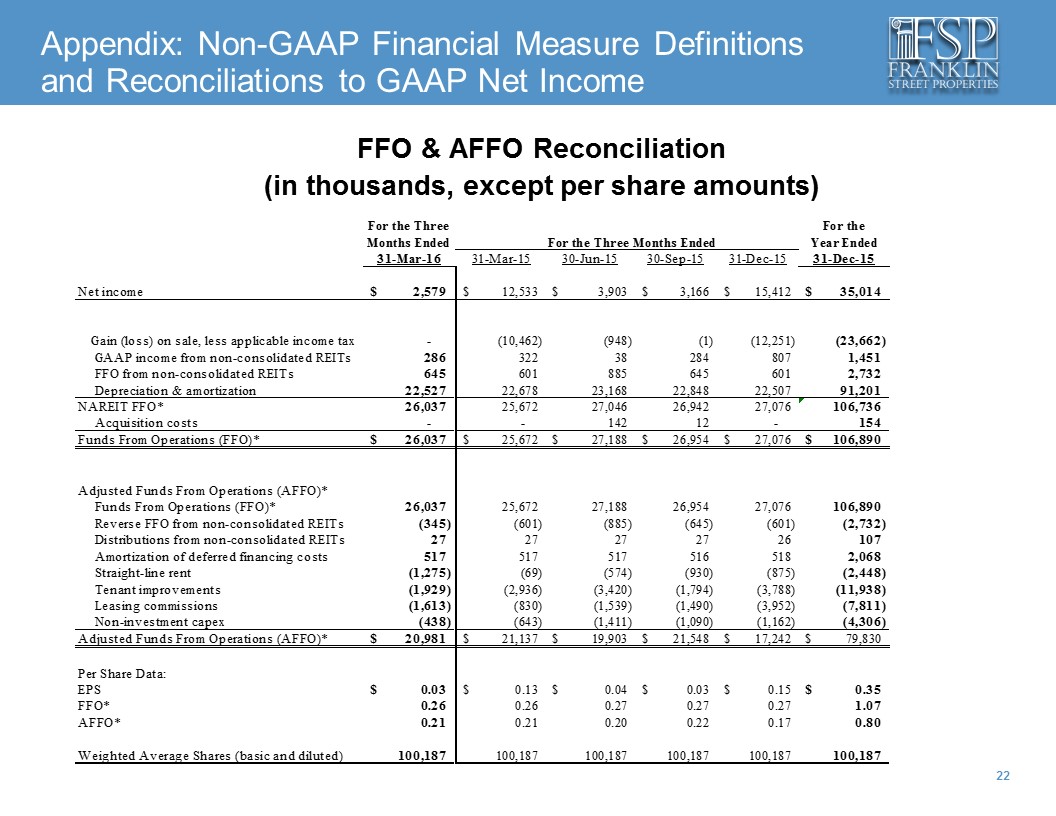
FFO & AFFO Reconciliation (in thousands, except per share amounts) Appendix: Non-GAAP Financial Measure Definitions and Reconciliations to GAAP Net Income For the Three For the Months Ended For the Three Months Ended Year Ended 31-Mar-16 31-Mar-15 30-Jun-15 30-Sep-15 31-Dec-15 31-Dec-15 Net income 2,579 $ 12,533 $ 3,903 $ 3,166 $ 15,412 $ 35,014 $ Gain (loss) on sale, less applicable income tax - (10,462) (948) (1) (12,251) (23,662) GAAP income from non-consolidated REITs 286 322 38 284 807 1,451 FFO from non-consolidated REITs 645 601 885 645 601 2,732 Depreciation & amortization 22,527 22,678 23,168 22,848 22,507 91,201 NAREIT FFO* 26,037 25,672 27,046 26,942 27,076 106,736 Acquisition costs - - 142 12 - 154 Funds From Operations (FFO)* 26,037 $ 25,672 $ 27,188 $ 26,954 $ 27,076 $ 106,890 $ Adjusted Funds From Operations (AFFO)* Funds From Operations (FFO)* 26,037 25,672 27,188 26,954 27,076 106,890 Reverse FFO from non-consolidated REITs (345) (601) (885) (645) (601) (2,732) Distributions from non-consolidated REITs 27 27 27 27 26 107 Amortization of deferred financing costs 517 517 517 516 518 2,068 Straight-line rent (1,275) (69) (574) (930) (875) (2,448) Tenant improvements (1,929) (2,936) (3,420) (1,794) (3,788) (11,938) Leasing commissions (1,613) (830) (1,539) (1,490) (3,952) (7,811) Non-investment capex (438) (643) (1,411) (1,090) (1,162) (4,306) Adjusted Funds From Operations (AFFO)* 20,981 $ 21,137 $ 19,903 $ 21,548 $ 17,242 $ 79,830 $ Per Share Data: EPS 0.03 $ 0.13 $ 0.04 $ 0.03 $ 0.15 $ 0.35 $ FFO* 0.26 0.26 0.27 0.27 0.27 1.07 AFFO* 0.21 0.21 0.20 0.22 0.17 0.80 Weighted Average Shares (basic and diluted) 100,187 100,187 100,187 100,187 100,187 100,187 |
|
|
Definition of Earnings before Interest, Taxes, Depreciation and Amortization (EBITDA) and Adjusted EBITDA EBITDA is defined as net income plus interest expense, income tax expense and depreciation and amortization expense. Adjusted EBITDA is defined as EBITDA excluding gains and losses on sales of properties or shares of equity investments or provisions for losses on assets held for sale. EBITDA and Adjusted EBITDA are not intended to represent cash flow for the period, are not presented as an alternative to operating income as an indicator of operating performance, should not be considered in isolation or as a substitute for measures of performance prepared in accordance with GAAP and are not indicative of operating income or cash provided by operating activities as determined under GAAP. EBITDA and Adjusted EBITDA are presented solely as a supplemental disclosure with respect to liquidity because the Company believes it provides useful information regarding the Company's ability to service or incur debt. Because all companies do not calculate EBITDA or Adjusted EBITDA the same way, this presentation may not be comparable to similarly titled measures of other companies. The Company believes that net income is the financial measure calculated and presented in accordance with GAAP that is most directly comparable to EBITDA and Adjusted EBITDA. Appendix: Non-GAAP Financial Measure Definitions and Reconciliations to GAAP Net Income |
|
|
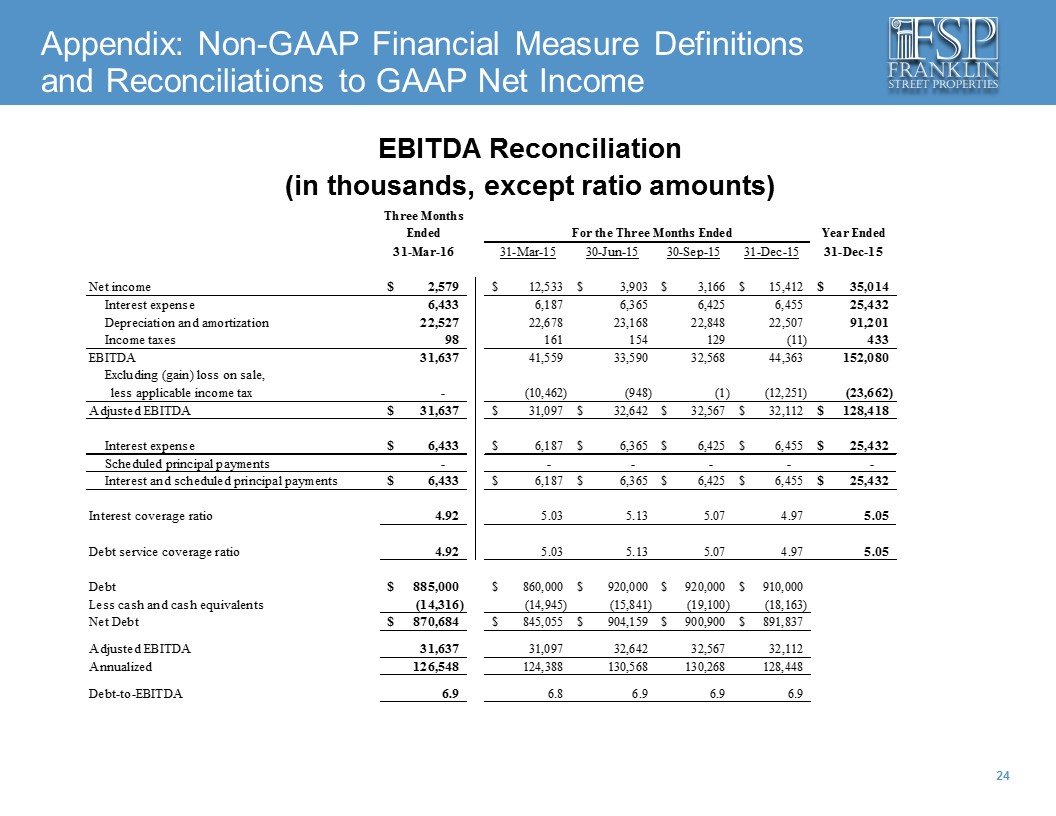
EBITDA Reconciliation (in thousands, except ratio amounts) Appendix: Non-GAAP Financial Measure Definitions and Reconciliations to GAAP Net Income Three Months Ended For the Three Months Ended Year Ended 31-Mar-16 31-Mar-15 30-Jun-15 30-Sep-15 31-Dec-15 31-Dec-15 Net income 2,579 $ 12,533 $ 3,903 $ 3,166 $ 15,412 $ 35,014 $ Interest expense 6,433 6,187 6,365 6,425 6,455 25,432 Depreciation and amortization 22,527 22,678 23,168 22,848 22,507 91,201 Income taxes 98 161 154 129 (11) 433 EBITDA 31,637 41,559 33,590 32,568 44,363 152,080 Excluding (gain) loss on sale, less applicable income tax - (10,462) (948) (1) (12,251) (23,662) Adjusted EBITDA 31,637 $ 31,097 $ 32,642 $ 32,567 $ 32,112 $ 128,418 $ Interest expense 6,433 $ 6,187 $ 6,365 $ 6,425 $ 6,455 $ 25,432 $ Scheduled principal payments - - - - - - Interest and scheduled principal payments 6,433 $ 6,187 $ 6,365 $ 6,425 $ 6,455 $ 25,432 $ Interest coverage ratio 4.92 5.03 5.13 5.07 4.97 5.05 Debt service coverage ratio 4.92 5.03 5.13 5.07 4.97 5.05 Debt 885,000 $ 860,000 $ 920,000 $ 920,000 $ 910,000 $ Less cash and cash equivalents (14,316) (14,945) (15,841) (19,100) (18,163) Net Debt 870,684 $ 845,055 $ 904,159 $ 900,900 $ 891,837 $ Adjusted EBITDA 31,637 31,097 32,642 32,567 32,112 Annualized 126,548 124,388 130,568 130,268 128,448 Debt-to-EBITDA 6.9 6.8 6.9 6.9 6.9 |
|
|
Two Ravinia Drive 1999 Broadway 1001 17th Street Addison Circle One Legacy Circle Eldridge Green Westchase I & II 801 Marquette Avenue South Franklin Street Properties Corp. 401 Edgewater Place ● Wakefield, MA 01880 ● (781) 557-1300 www.franklinstreetproperties.com 999 Peachtree Street Investor Relations Contact: (877) 686-9496 InvestorRelations@franklinstreetproperties.com Plaza Seven |