Attached files
| file | filename |
|---|---|
| 8-K - 8-K - Sprague Resources LP | f8-k2016mlpaconf.htm |
1 Sprague Resources LP MLPA Conference June 3, 2016
2 Safe Harbor Forward-Looking Statements /Non-GAAP Measures Some of the statements in this presentation may contain forward-looking statements within the meaning of the safe harbor provisions of the U.S. Private Securities Litigation Reform Act of 1995. Forward-looking statements can be identified by words such as “may,” “assume,” “forecast,” “position,” “predict,” “strategy,” “expect,” “intend,” “plan,” “estimate,” “anticipate,” “believe,” “will,” “project,” “budget,” “potential,” or “continue,” and similar references to future periods. However, the absence of these words does not mean that a statement is not forward looking. Descriptions of our objectives, goals, plans, projections, estimates, anticipated capital expenditures, cost savings, strategy for customer retention and strategy for risk management and other statements of future events or conditions are also forward looking statements. Forward-looking statements are neither historical facts nor assurances of future performance. Instead, they are based only on our current beliefs, expectations and assumptions regarding the future of our business, future plans and strategies, projections, anticipated events and trends, the economy and other future conditions. Our actual future results and financial condition may differ materially from those indicated in the forward-looking statements. Therefore, you should not rely on any of these forward-looking statements. Important factors that could cause our actual results and financial condition to differ materially from those indicated in the forward-looking statements include, but are not limited to a significant decrease in in a demand for refined products, natural gas or our materials handling services in the areas we serve; derivatives legislation could impact our ability to use derivatives to reduce the effect of commodity price risk, interest rate risk, and adversely affect our hedging activities; and, warmer weather during winter months and non-performance by our customers, suppliers and counterparties. Any forward-looking statement made by us in this presentation is based only on information currently available to us and speaks only as of the date on which it is made. We undertake no obligation to publicly update any forward-looking statement, whether written or oral, that may be made from time to time, whether as a result of new information, future developments or otherwise. For additional information about risks and uncertainties that could cause actual results to differ materially from the expectations, please refer to Sprague’s current Quarterly Report on Form 10-Q and our most recent 10-K available in the “Investor Relations” section of our website www.spragueenergy.com. In this presentation we refer to certain financial measures not prepared in accordance with generally accepted accounting principles, or GAAP, including adjusted gross margin and adjusted EBITDA. For a description of how we define these non-GAAP financial measures and reconciliations to comparable GAAP financial measures, please see the Appendix included at the end of this presentation or “Management’s Discussion and Analysis of Financial Condition and Results of Operations – How Management Evaluates Our Results of Operations” located in Part 1, Item 2 of Sprague’s current Quarterly Report on Form 10-Q and in Part 2, Item 6 and Item 7 of our most recent 10-K available in the “Investor Relations” section of our website www.spragueenergy.com.
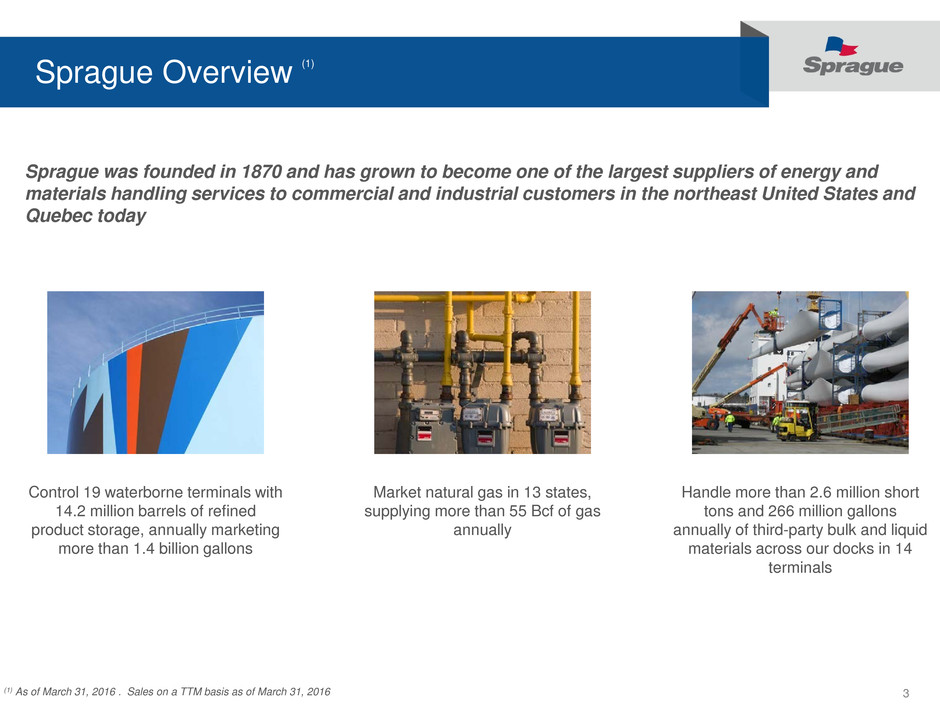
3 Sprague Overview (1) Sprague was founded in 1870 and has grown to become one of the largest suppliers of energy and materials handling services to commercial and industrial customers in the northeast United States and Quebec today Control 19 waterborne terminals with 14.2 million barrels of refined product storage, annually marketing more than 1.4 billion gallons (1) As of March 31, 2016 . Sales on a TTM basis as of March 31, 2016 Market natural gas in 13 states, supplying more than 55 Bcf of gas annually Handle more than 2.6 million short tons and 266 million gallons annually of third-party bulk and liquid materials across our docks in 14 terminals
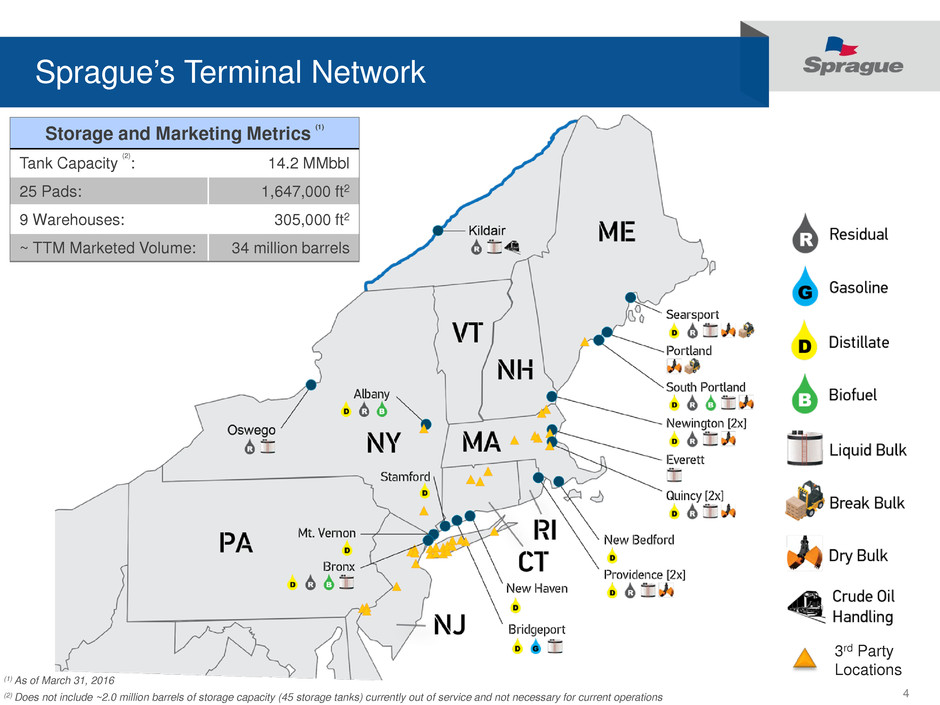
4 Sprague’s Terminal Network 3rd Party Locations Storage and Marketing Metrics (1) Tank Capacity (2) : 14.2 MMbbl 25 Pads: 1,647,000 ft2 9 Warehouses: 305,000 ft2 ~ TTM Marketed Volume: 34 million barrels (2) Does not include ~2.0 million barrels of storage capacity (45 storage tanks) currently out of service and not necessary for current operations (1) As of March 31, 2016
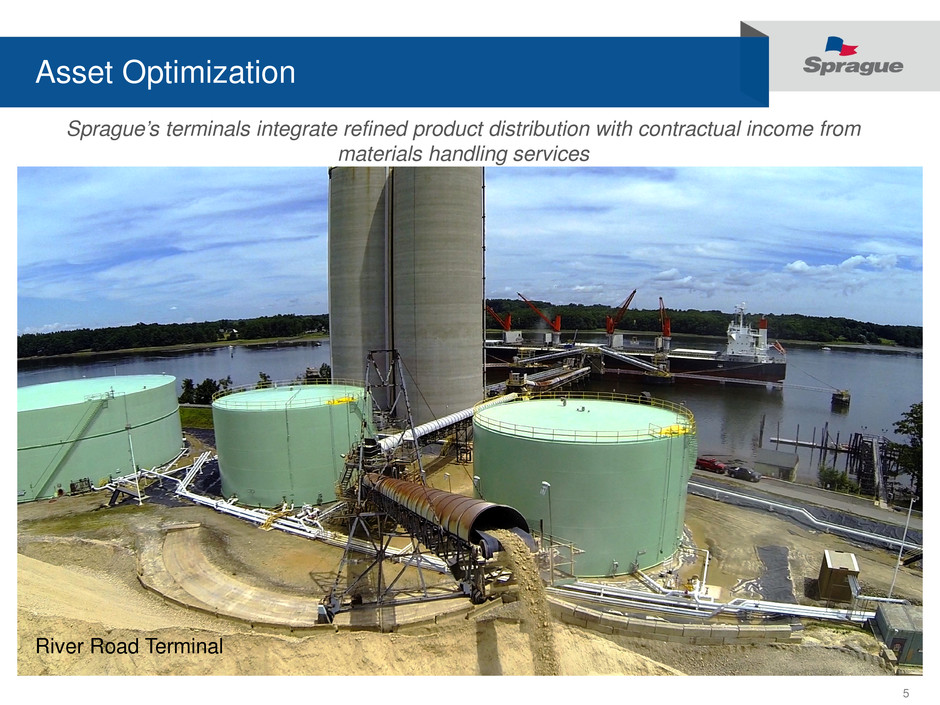
5 Asset Optimization River Road Terminal Sprague’s terminals integrate refined product distribution with contractual income from materials handling services
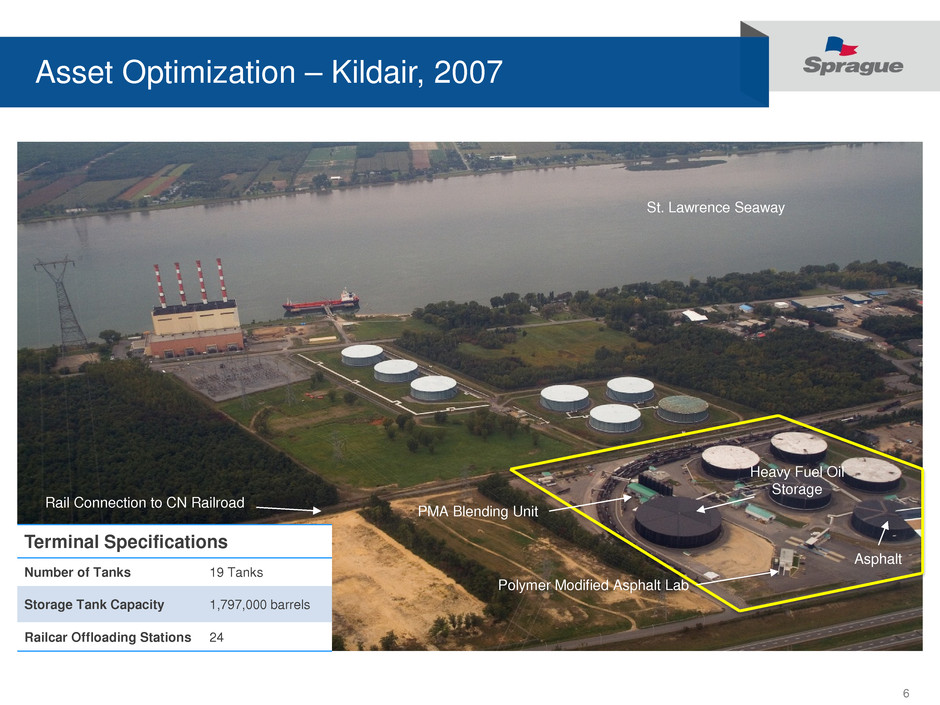
6 Asset Optimization – Kildair, 2007 Polymer Modified Asphalt Lab PMA Blending Unit Heavy Fuel Oil Storage Asphalt St. Lawrence Seaway Rail Connection to CN Railroad Terminal Specifications Number of Tanks 19 Tanks Storage Tank Capacity 1,797,000 barrels Railcar Offloading Stations 24

7 Asset Optimization – Kildair Today Distillate Tank Upgrade (2016) Vapor Incineration (2014) Expanded Railcar Offloading Station (2014) Crude Storage (2014) Polymer Modified Asphalt Lab PMA Blending Unit Heavy Fuel Oil Storage Asphalt St. Lawrence Seaway Rail Connection to CN Railroad Dual-use Asphalt/HFO Storage (2010) Terminal Specifications Number of Tanks 27 Tanks Storage Tank Capacity 3,282,600 barrels Railcar Offloading Stations 84
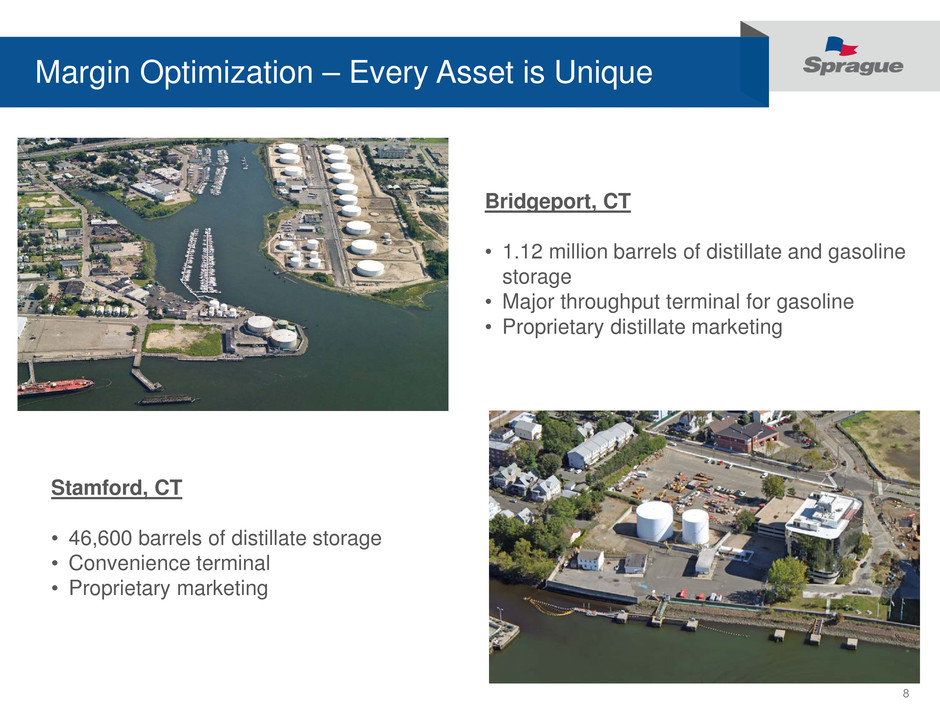
8 Margin Optimization – Every Asset is Unique Stamford, CT • 46,600 barrels of distillate storage • Convenience terminal • Proprietary marketing Bridgeport, CT • 1.12 million barrels of distillate and gasoline storage • Major throughput terminal for gasoline • Proprietary distillate marketing

9 Natural Gas System • Standard pathway to meter assumed • Contract offer reflects market cost to supply • Customer signs contract – sale is locked in • Supply costs are hedged Base contract margin established Traditional Supply Routes
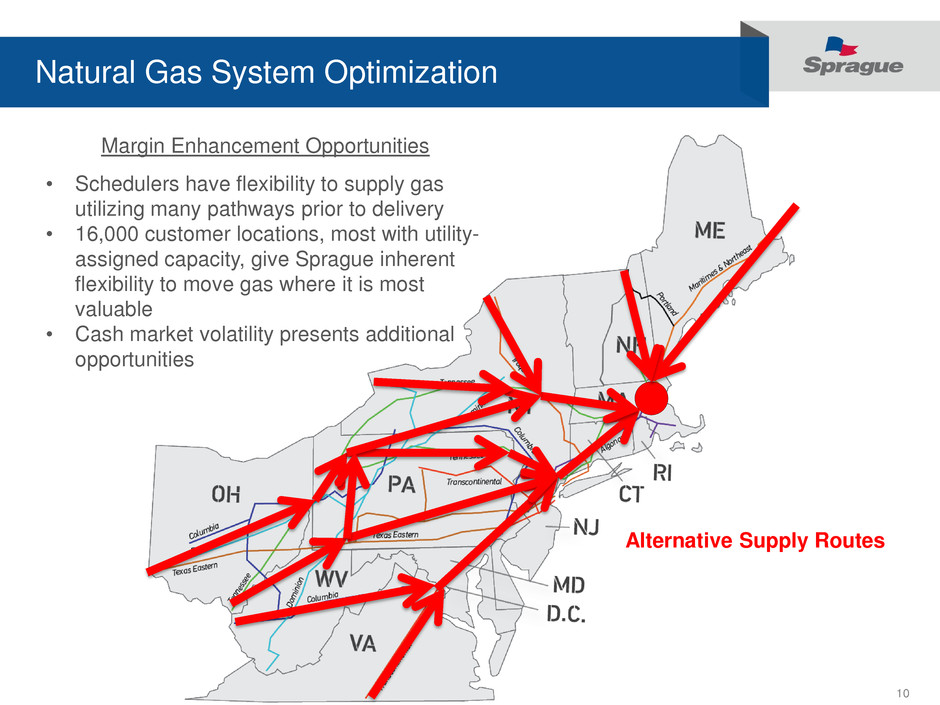
10 Natural Gas System Optimization • Schedulers have flexibility to supply gas utilizing many pathways prior to delivery • 16,000 customer locations, most with utility- assigned capacity, give Sprague inherent flexibility to move gas where it is most valuable • Cash market volatility presents additional opportunities Margin Enhancement Opportunities Alternative Supply Routes

11 Marketing is Core to our Business Model $0.12 $0.45 $0.54 $0.78 $1.02 $0.90 $0.00 $0.20 $0.40 $0.60 $0.80 $1.00 $1.20 2010 2011 2012 2013 2014 2015 $0.08 $0.08 $0.06 $0.08 $0.09 $0.10 $0.00 $0.02 $0.04 $0.06 $0.08 $0.10 $0.12 2010 2011 2012 2013 2014 2015 Refined Products Adjusted Unit Margin ($/gallon) Natural Gas Adjusted Unit Margin ($/MMBtu) Representative Throughput Model Margin (1) Representative Wholesale Supply Services Margin (1) (1) Source: Sprague Sprague thinks past “commodity” when it comes to commodity marketing

12

13
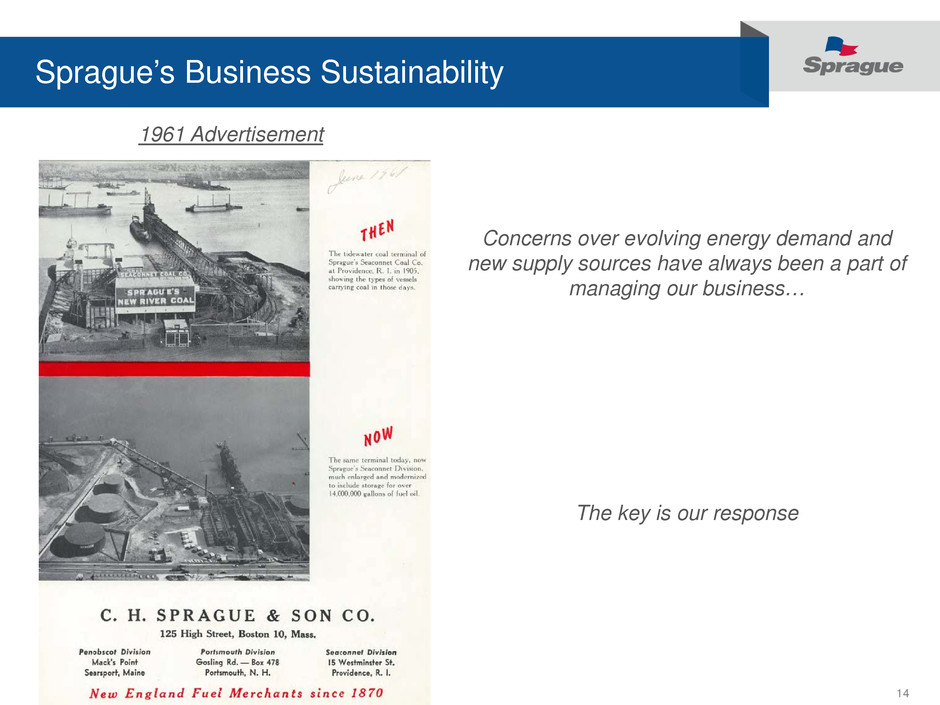
14 Sprague’s Business Sustainability Concerns over evolving energy demand and new supply sources have always been a part of managing our business… The key is our response 1961 Advertisement
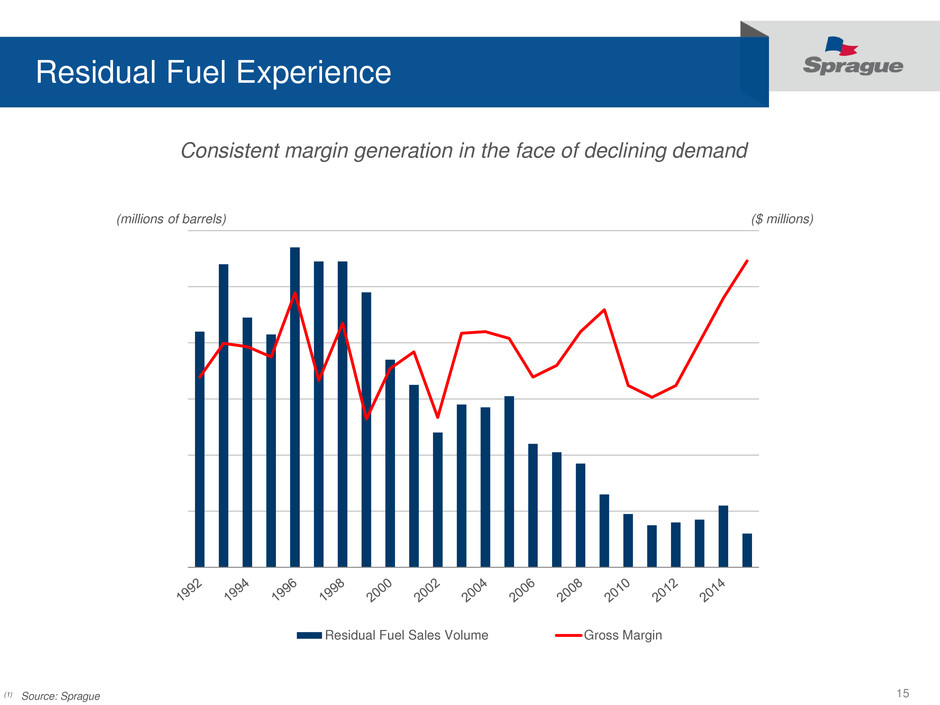
15 Residual Fuel Experience Residual Fuel Sales Volume Gross Margin ($ millions) (millions of barrels) Consistent margin generation in the face of declining demand (1) Source: Sprague
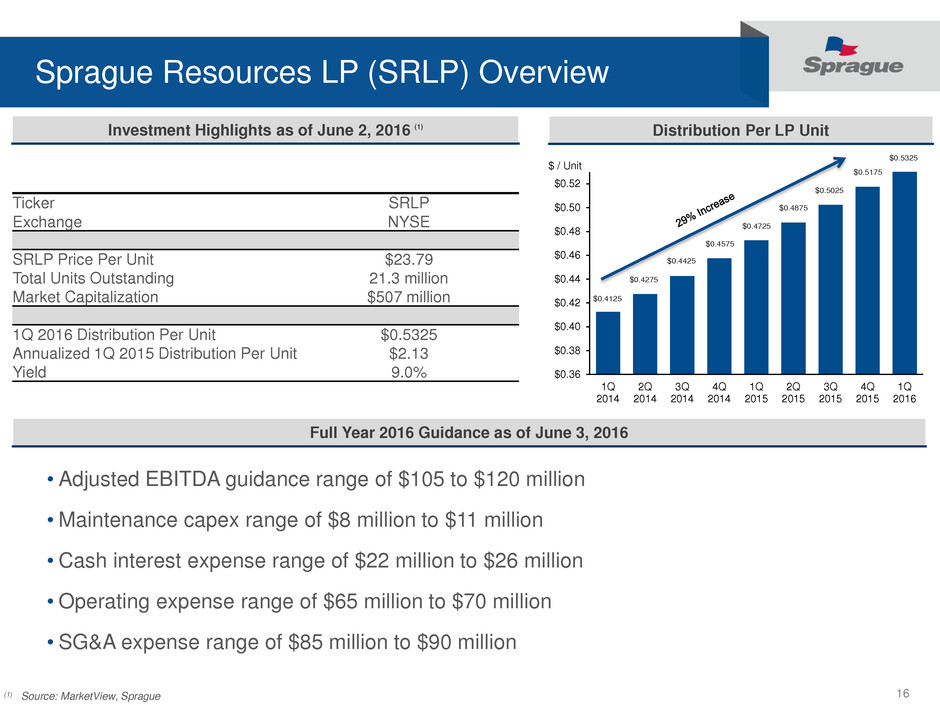
16 Sprague Resources LP (SRLP) Overview Distribution Per LP Unit Investment Highlights as of June 2, 2016 (1) Ticker SRLP Exchange NYSE SRLP Price Per Unit $23.79 Total Units Outstanding 21.3 million Market Capitalization $507 million 1Q 2016 Distribution Per Unit $0.5325 Annualized 1Q 2015 Distribution Per Unit $2.13 Yield 9.0% • Adjusted EBITDA guidance range of $105 to $120 million • Maintenance capex range of $8 million to $11 million • Cash interest expense range of $22 million to $26 million • Operating expense range of $65 million to $70 million • SG&A expense range of $85 million to $90 million Full Year 2016 Guidance as of June 3, 2016 $0.36 $0.38 $0.40 $0.42 $0.44 $0.46 $0.48 $0.50 $0.52 1Q 2014 2Q 2014 3Q 2014 4Q 2014 1Q 2015 2Q 2015 3Q 2015 4Q 2015 1Q 2016 $ / Unit $0.4275 $0.4425 $0.4575 $0.4725 $0.4875 $0.5025 $0.4125 $0.5175 (1) Source: MarketView, Sprague $0.5325
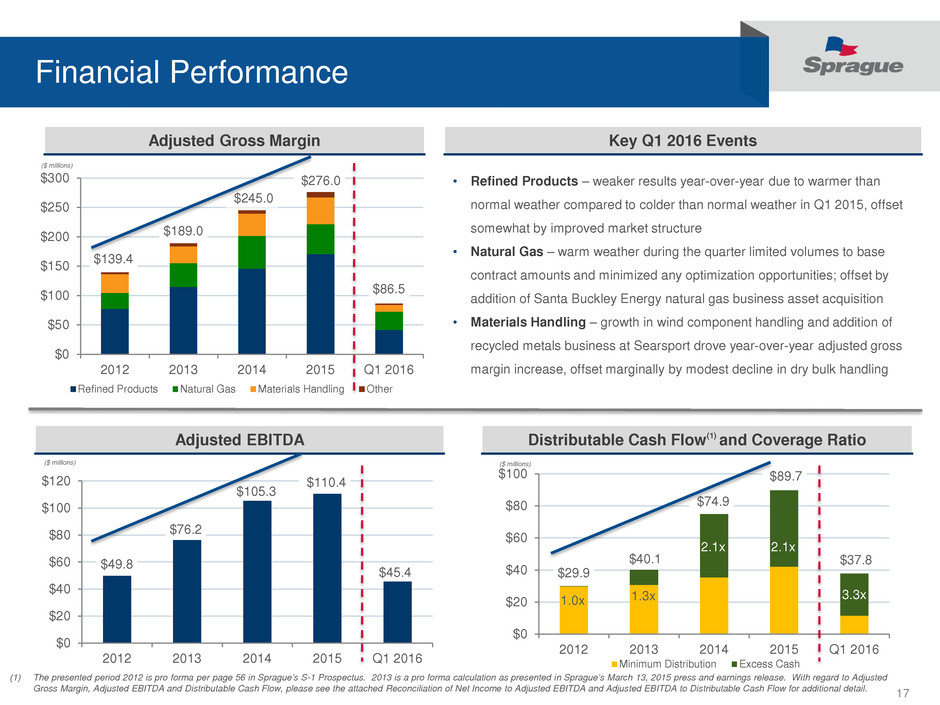
17 $29.9 $40.1 $74.9 $89.7 $37.8 $0 $20 $40 $60 $80 $100 2012 2013 2014 2015 Q1 2016 Minimum Distribution Excess Cash Financial Performance Adjusted EBITDA • Refined Products – weaker results year-over-year due to warmer than normal weather compared to colder than normal weather in Q1 2015, offset somewhat by improved market structure • Natural Gas – warm weather during the quarter limited volumes to base contract amounts and minimized any optimization opportunities; offset by addition of Santa Buckley Energy natural gas business asset acquisition • Materials Handling – growth in wind component handling and addition of recycled metals business at Searsport drove year-over-year adjusted gross margin increase, offset marginally by modest decline in dry bulk handling Adjusted Gross Margin Key Q1 2016 Events Distributable Cash Flow(1) and Coverage Ratio (1) The presented period 2012 is pro forma per page 56 in Sprague’s S-1 Prospectus. 2013 is a pro forma calculation as presented in Sprague’s March 13, 2015 press and earnings release. With regard to Adjusted Gross Margin, Adjusted EBITDA and Distributable Cash Flow, please see the attached Reconciliation of Net Income to Adjusted EBITDA and Adjusted EBITDA to Distributable Cash Flow for additional detail. $139.4 $189.0 $245.0 $276.0 $86.5 $0 $50 $100 $150 $200 $250 $300 2012 2013 2014 2015 Q1 2016 Refined Products Natural Gas Materials Handling Other ($ millions) $49.8 $76.2 $105.3 $110.4 $45.4 $0 $20 $40 $60 $80 $100 $120 2012 2013 2014 2015 Q1 2016 ($ millions) ($ millions) 1.0x 1.3x 2.1x 2.1x 3.3x
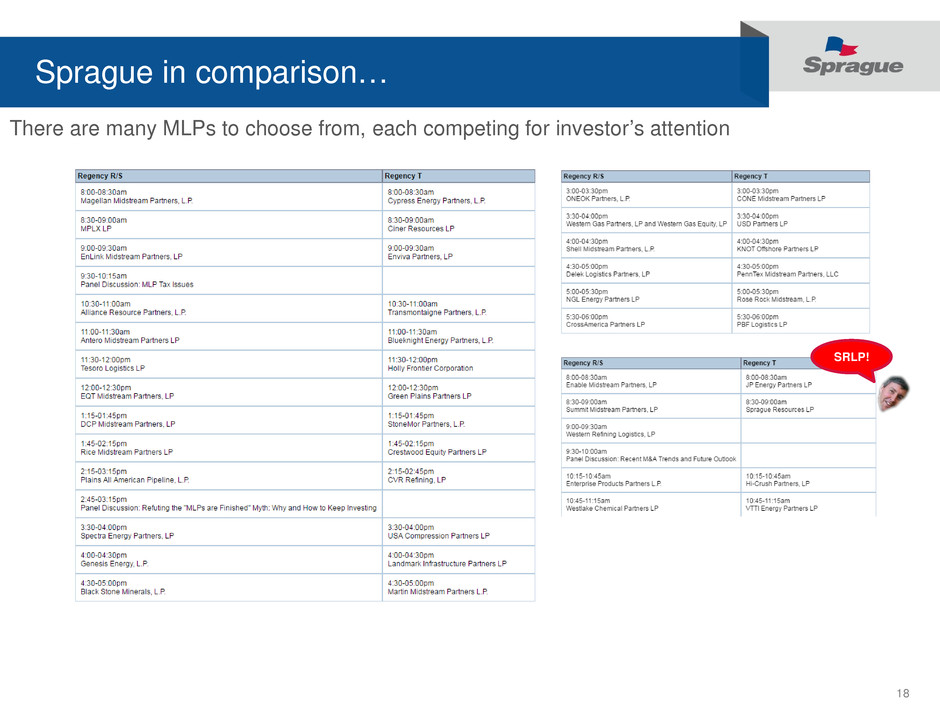
18 There are many MLPs to choose from, each competing for investor’s attention Sprague in comparison… SRLP!
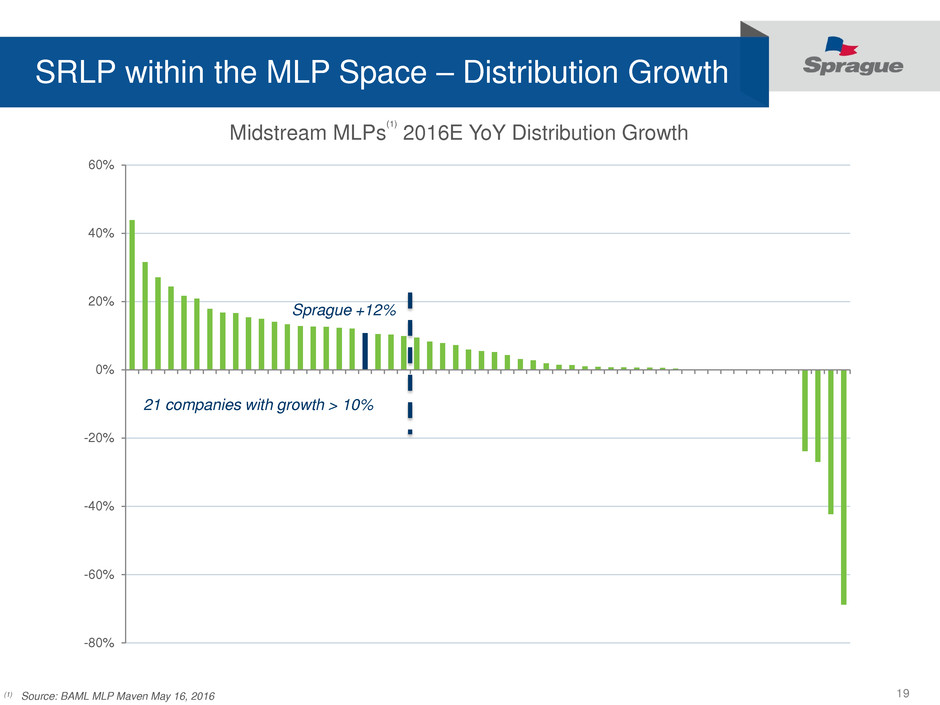
19 SRLP within the MLP Space – Distribution Growth -80% -60% -40% -20% 0% 20% 40% 60% (1) Source: BAML MLP Maven May 16, 2016 Sprague +12% 21 companies with growth > 10% Midstream MLPs (1) 2016E YoY Distribution Growth
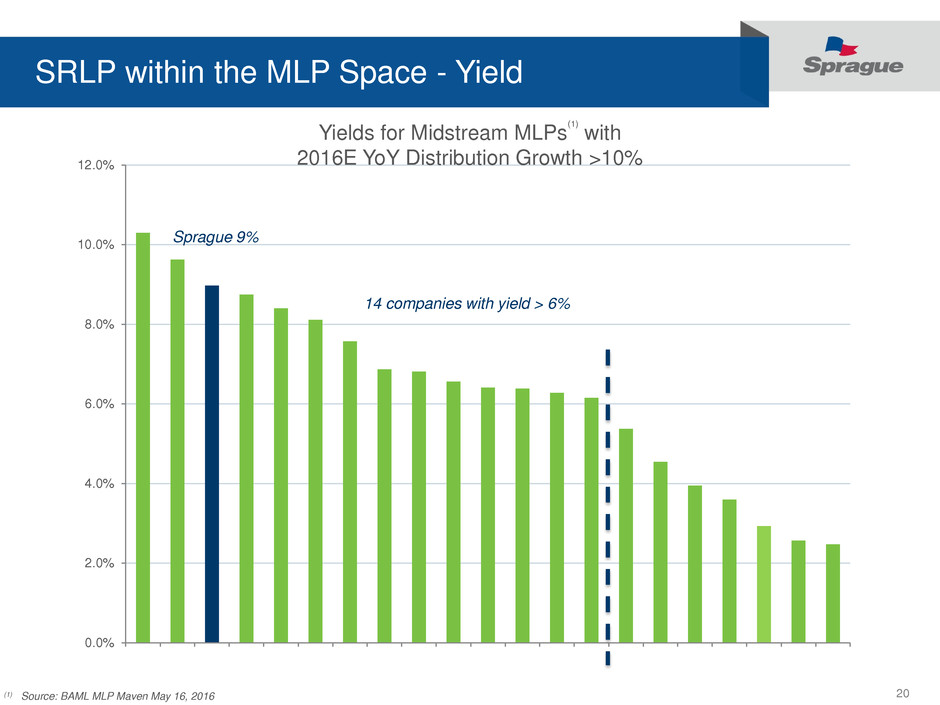
20 SRLP within the MLP Space - Yield 0.0% 2.0% 4.0% 6.0% 8.0% 10.0% 12.0% (1) Source: BAML MLP Maven May 16, 2016 Sprague 9% Yields for Midstream MLPs (1) with 2016E YoY Distribution Growth >10% 14 companies with yield > 6%
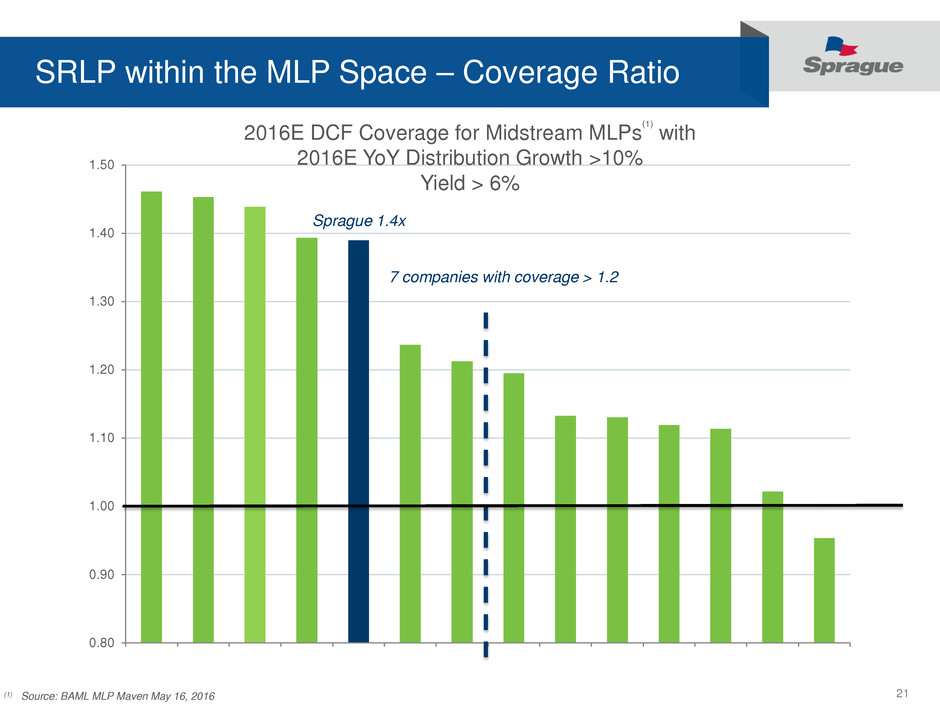
21 SRLP within the MLP Space – Coverage Ratio 0.80 0.90 1.00 1.10 1.20 1.30 1.40 1.50 (1) Source: BAML MLP Maven May 16, 2016 Sprague 1.4x 2016E DCF Coverage for Midstream MLPs (1) with 2016E YoY Distribution Growth >10% Yield > 6% 7 companies with coverage > 1.2

22 SRLP within the MLP Space - Leverage -1.0x 0.0x 1.0x 2.0x 3.0x 4.0x 5.0x 6.0x (1) Source: BAML MLP Maven May 16, 2016 Sprague 4.9x Net Debt / 2017E EBITDA for Midstream MLPs (1) with 2016E YoY Distribution Growth >10% Yield > 6% 2016E DCF Coverage > 1.2x
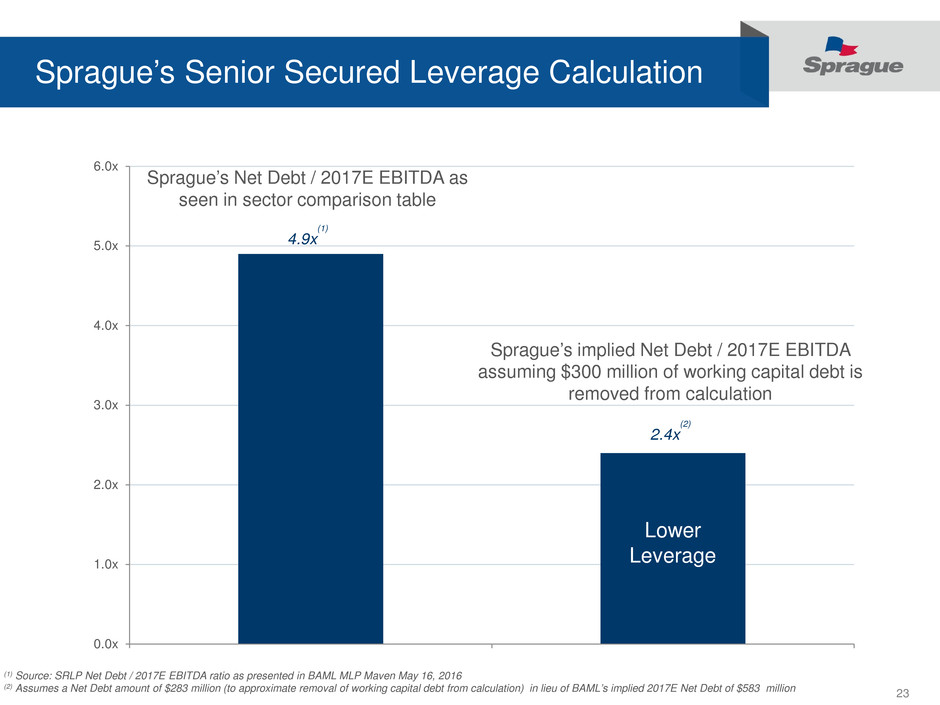
23 Sprague’s Senior Secured Leverage Calculation 0.0x 1.0x 2.0x 3.0x 4.0x 5.0x 6.0x (1) Source: SRLP Net Debt / 2017E EBITDA ratio as presented in BAML MLP Maven May 16, 2016 (2) Assumes a Net Debt amount of $283 million (to approximate removal of working capital debt from calculation) in lieu of BAML’s implied 2017E Net Debt of $583 million 2.4x (2) Sprague’s implied Net Debt / 2017E EBITDA assuming $300 million of working capital debt is removed from calculation 4.9x (1) Sprague’s Net Debt / 2017E EBITDA as seen in sector comparison table Lower Leverage
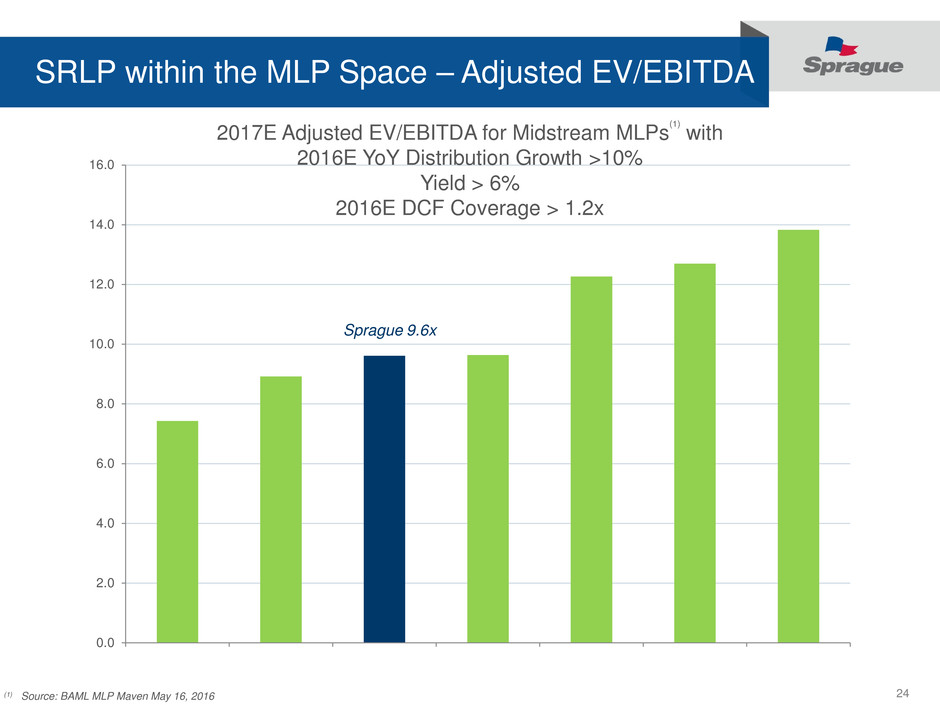
24 SRLP within the MLP Space – Adjusted EV/EBITDA 0.0 2.0 4.0 6.0 8.0 10.0 12.0 14.0 16.0 (1) Source: BAML MLP Maven May 16, 2016 Sprague 9.6x 2017E Adjusted EV/EBITDA for Midstream MLPs (1) with 2016E YoY Distribution Growth >10% Yield > 6% 2016E DCF Coverage > 1.2x
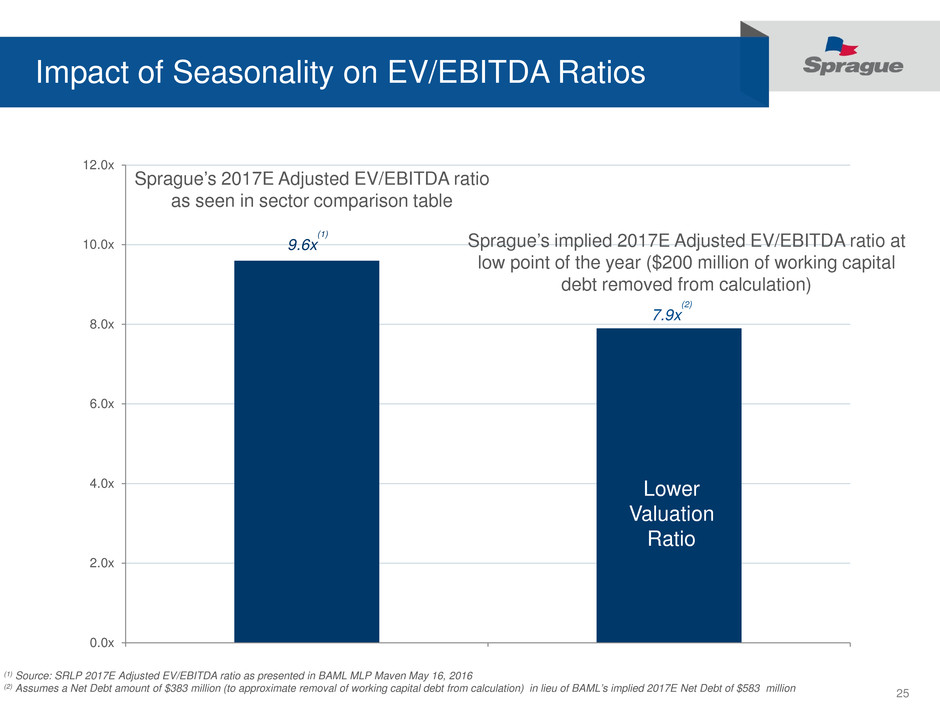
25 Impact of Seasonality on EV/EBITDA Ratios 0.0x 2.0x 4.0x 6.0x 8.0x 10.0x 12.0x (1) Source: SRLP 2017E Adjusted EV/EBITDA ratio as presented in BAML MLP Maven May 16, 2016 (2) Assumes a Net Debt amount of $383 million (to approximate removal of working capital debt from calculation) in lieu of BAML’s implied 2017E Net Debt of $583 million 7.9x (2) Sprague’s implied 2017E Adjusted EV/EBITDA ratio at low point of the year ($200 million of working capital debt removed from calculation) 9.6x (1) Sprague’s 2017E Adjusted EV/EBITDA ratio as seen in sector comparison table Lower Valuation Ratio
26 Appendix • Consolidated and Condensed Balance Sheet • Credit Facility, Liquidity and Leverage • Q1 Selected Metrics • Q1 2016 Adjusted EBITDA Reconciliation • Q1 2016 Distributable Cash Flow Reconciliation
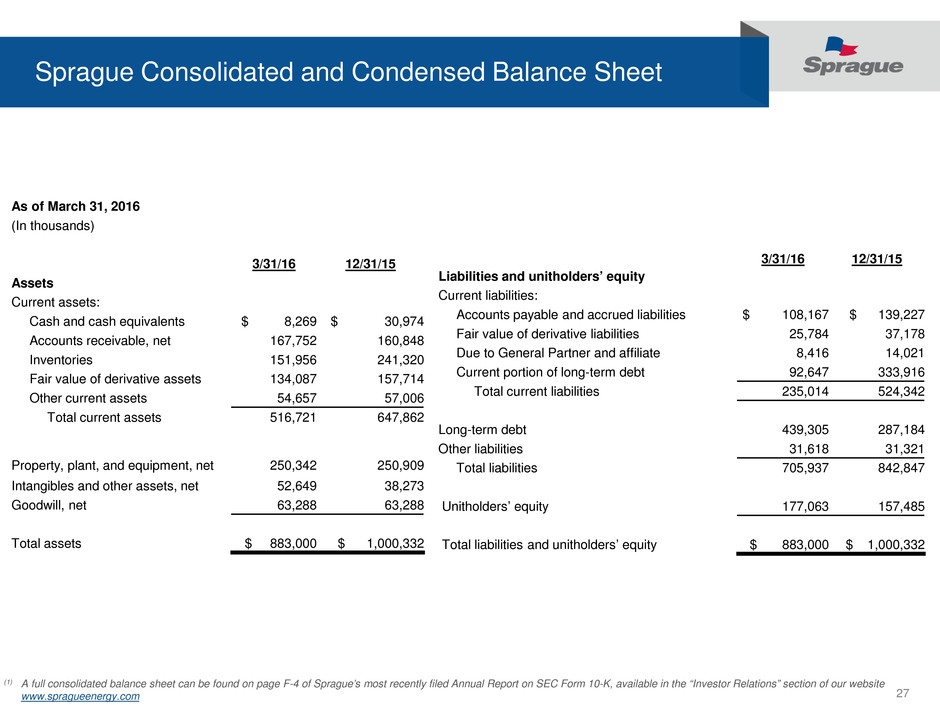
27 Sprague Consolidated and Condensed Balance Sheet As of March 31, 2016 (In thousands) 3/31/16 12/31/15 Assets Current assets: Cash and cash equivalents $ 8,269 $ 30,974 Accounts receivable, net 167,752 160,848 Inventories 151,956 241,320 Fair value of derivative assets 134,087 157,714 Other current assets 54,657 57,006 Total current assets 516,721 647,862 Property, plant, and equipment, net 250,342 250,909 Intangibles and other assets, net 52,649 38,273 Goodwill, net 63,288 63,288 Total assets $ 883,000 $ 1,000,332 3/31/16 12/31/15 Liabilities and unitholders’ equity Current liabilities: Accounts payable and accrued liabilities $ 108,167 $ 139,227 Fair value of derivative liabilities 25,784 37,178 Due to General Partner and affiliate 8,416 14,021 Current portion of long-term debt 92,647 333,916 Total current liabilities 235,014 524,342 Long-term debt 439,305 287,184 Other liabilities 31,618 31,321 Total liabilities 705,937 842,847 Unitholders’ equity 177,063 157,485 Total liabilities and unitholders’ equity $ 883,000 $ 1,000,332 (1) A full consolidated balance sheet can be found on page F-4 of Sprague’s most recently filed Annual Report on SEC Form 10-K, available in the “Investor Relations” section of our website www.spragueenergy.com
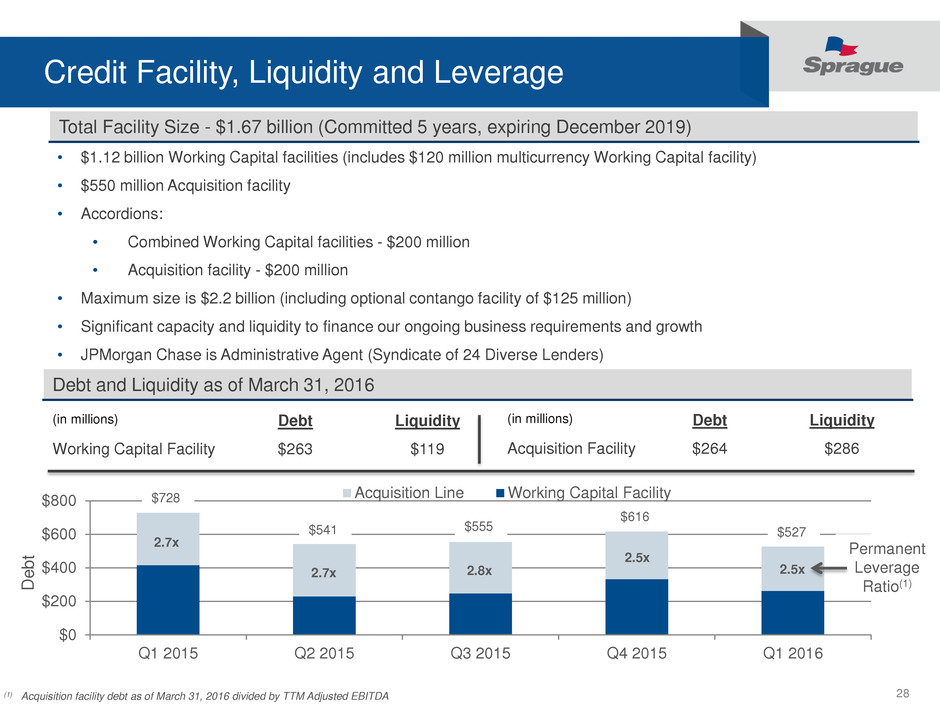
28 $0 $200 $400 $600 $800 Q1 2015 Q2 2015 Q3 2015 Q4 2015 Q1 2016 Acquisition Line Working Capital Facility (in millions) Debt Liquidity Acquisition Facility $264 $286 Credit Facility, Liquidity and Leverage • $1.12 billion Working Capital facilities (includes $120 million multicurrency Working Capital facility) • $550 million Acquisition facility • Accordions: • Combined Working Capital facilities - $200 million • Acquisition facility - $200 million • Maximum size is $2.2 billion (including optional contango facility of $125 million) • Significant capacity and liquidity to finance our ongoing business requirements and growth • JPMorgan Chase is Administrative Agent (Syndicate of 24 Diverse Lenders) (in millions) Debt Liquidity Working Capital Facility $263 $119 Total Facility Size - $1.67 billion (Committed 5 years, expiring December 2019) Debt and Liquidity as of March 31, 2016 D eb t 2.7x 2.7x 2.8x Permanent Leverage Ratio(1) 2.5x $728 $541 $555 $616 (1) Acquisition facility debt as of March 31, 2016 divided by TTM Adjusted EBITDA $527 2.5x
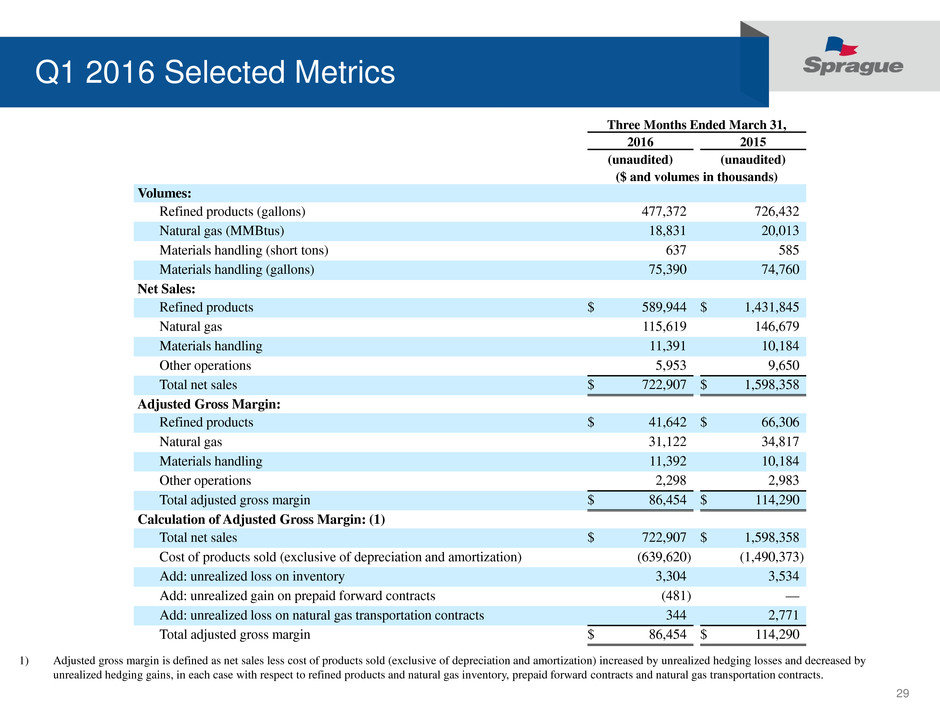
29 Q1 2016 Selected Metrics Three Months Ended March 31, 2016 2015 (unaudited) (unaudited) ($ and volumes in thousands) Volumes: Refined products (gallons) 477,372 726,432 Natural gas (MMBtus) 18,831 20,013 Materials handling (short tons) 637 585 Materials handling (gallons) 75,390 74,760 Net Sales: Refined products $ 589,944 $ 1,431,845 Natural gas 115,619 146,679 Materials handling 11,391 10,184 Other operations 5,953 9,650 Total net sales $ 722,907 $ 1,598,358 Adjusted Gross Margin: Refined products $ 41,642 $ 66,306 Natural gas 31,122 34,817 Materials handling 11,392 10,184 Other operations 2,298 2,983 Total adjusted gross margin $ 86,454 $ 114,290 Calculation of Adjusted Gross Margin: (1) Total net sales $ 722,907 $ 1,598,358 Cost of products sold (exclusive of depreciation and amortization) (639,620 ) (1,490,373 ) Add: unrealized loss on inventory 3,304 3,534 Add: unrealized gain on prepaid forward contracts (481 ) — Add: unrealized loss on natural gas transportation contracts 344 2,771 Total adjusted gross margin $ 86,454 $ 114,290 1) Adjusted gross margin is defined as net sales less cost of products sold (exclusive of depreciation and amortization) increased by unrealized hedging losses and decreased by unrealized hedging gains, in each case with respect to refined products and natural gas inventory, prepaid forward contracts and natural gas transportation contracts.
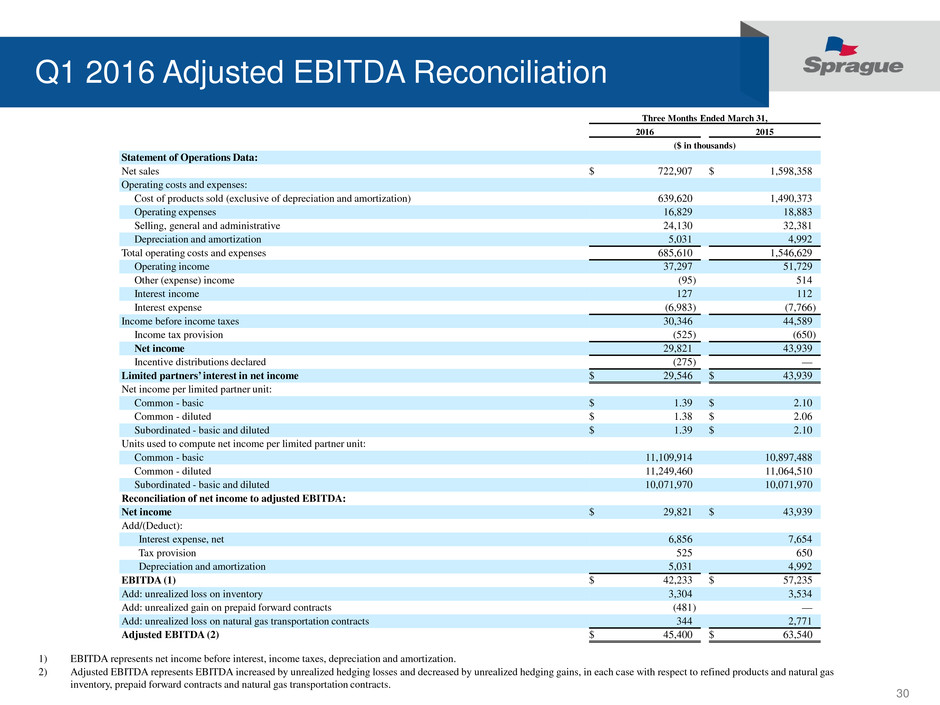
30 Q1 2016 Adjusted EBITDA Reconciliation Three Months Ended March 31, 2016 2015 ($ in thousands) Statement of Operations Data: Net sales $ 722,907 $ 1,598,358 Operating costs and expenses: Cost of products sold (exclusive of depreciation and amortization) 639,620 1,490,373 Operating expenses 16,829 18,883 Selling, general and administrative 24,130 32,381 Depreciation and amortization 5,031 4,992 Total operating costs and expenses 685,610 1,546,629 Operating income 37,297 51,729 Other (expense) income (95 ) 514 Interest income 127 112 Interest expense (6,983 ) (7,766 ) Income before income taxes 30,346 44,589 Income tax provision (525 ) (650 ) Net income 29,821 43,939 Incentive distributions declared (275 ) — Limited partners’ interest in net income $ 29,546 $ 43,939 Net income per limited partner unit: Common - basic $ 1.39 $ 2.10 Common - diluted $ 1.38 $ 2.06 Subordinated - basic and diluted $ 1.39 $ 2.10 Units used to compute net income per limited partner unit: Common - basic 11,109,914 10,897,488 Common - diluted 11,249,460 11,064,510 Subordinated - basic and diluted 10,071,970 10,071,970 Reconciliation of net income to adjusted EBITDA: Net income $ 29,821 $ 43,939 Add/(Deduct): Interest expense, net 6,856 7,654 Tax provision 525 650 Depreciation and amortization 5,031 4,992 EBITDA (1) $ 42,233 $ 57,235 Add: unrealized loss on inventory 3,304 3,534 Add: unrealized gain on prepaid forward contracts (481 ) — Add: unrealized loss on natural gas transportation contracts 344 2,771 Adjusted EBITDA (2) $ 45,400 $ 63,540 1) EBITDA represents net income before interest, income taxes, depreciation and amortization. 2) Adjusted EBITDA represents EBITDA increased by unrealized hedging losses and decreased by unrealized hedging gains, in each case with respect to refined products and natural gas inventory, prepaid forward contracts and natural gas transportation contracts.
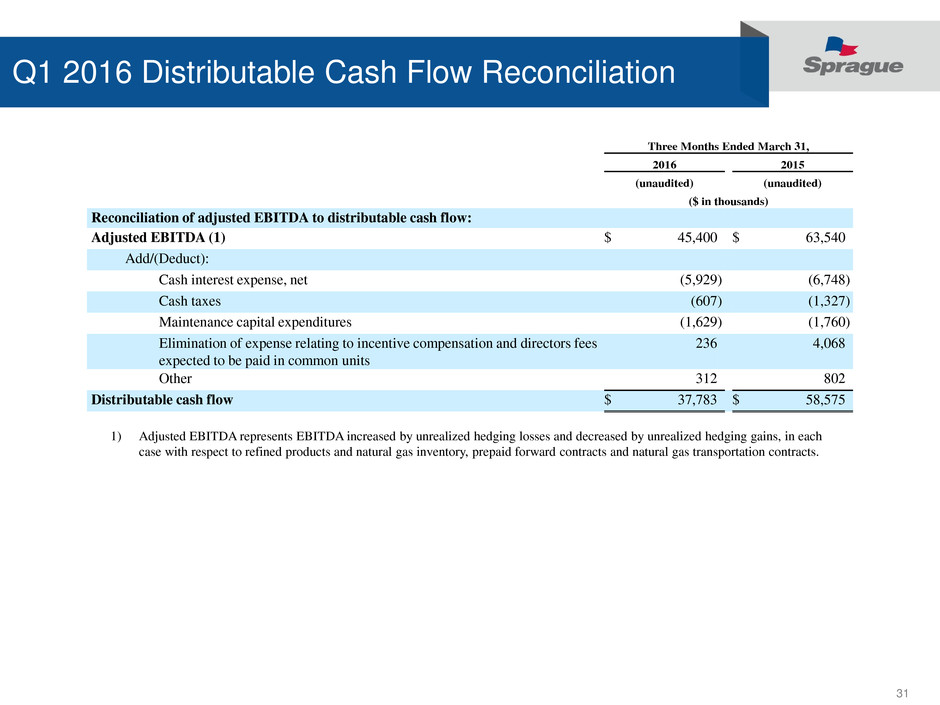
31 Q1 2016 Distributable Cash Flow Reconciliation Three Months Ended March 31, 2016 2015 (unaudited) (unaudited) ($ in thousands) Reconciliation of adjusted EBITDA to distributable cash flow: Adjusted EBITDA (1) $ 45,400 $ 63,540 Add/(Deduct): Cash interest expense, net (5,929 ) (6,748 ) Cash taxes (607 ) (1,327 ) Maintenance capital expenditures (1,629 ) (1,760 ) Elimination of expense relating to incentive compensation and directors fees expected to be paid in common units 236 4,068 Other 312 802 Distributable cash flow $ 37,783 $ 58,575 1) Adjusted EBITDA represents EBITDA increased by unrealized hedging losses and decreased by unrealized hedging gains, in each case with respect to refined products and natural gas inventory, prepaid forward contracts and natural gas transportation contracts.
