Attached files
| file | filename |
|---|---|
| EX-23.1 - EX-23.1 - Elevate Credit, Inc. | d83122dex231.htm |
| EX-10.52 - EX-10.52 - Elevate Credit, Inc. | d83122dex1052.htm |
Table of Contents
As filed with the Securities and Exchange Commission on June 3, 2016
Registration No. 333-207888
UNITED STATES
SECURITIES AND EXCHANGE COMMISSION
Washington, D.C. 20549
AMENDMENT NO. 3 TO
FORM S-1
REGISTRATION STATEMENT
Under
The Securities Act of 1933
ELEVATE CREDIT, INC.
(Exact name of registrant as specified in its charter)
| Delaware | 6199 | 46-4714474 | ||
| (State or other jurisdiction of incorporation or organization) |
(Primary Standard Industrial Classification Code Number) |
(I.R.S. Employer Identification Number) |
4150 International Plaza, Suite 300
Fort Worth, Texas 76109
(817) 928-1500
(Address, including zip code, and telephone number, including area code, of registrant’s principal executive offices)
Kenneth E. Rees
Chief Executive Officer
Elevate Credit, Inc.
4150 International Plaza, Suite 300
Fort Worth, Texas 76109
(817) 928-1500
(Name, address, including zip code, and telephone number, including area code, of agent for service)
Copies to:
| Brandon C. Parris, Esq. Andrew W. Winden, Esq. Morrison & Foerster LLP 425 Market Street San Francisco, California 94105 (415) 268-7000 |
Sarah Fagin Cutrona, Esq. Chief Counsel Elevate Credit, Inc. 4150 International Plaza, Suite 300 Fort Worth, Texas 76109 (817) 928-1500 |
Andrew D. Thorpe, Esq. Peter M. Lamb, Esq. Orrick, Herrington & Sutcliffe LLP The Orrick Building 405 Howard Street San Francisco, CA 94105 (415) 773-5700 |
Approximate date of commencement of proposed sale to the public: As soon as practicable after this registration statement becomes effective.
If any of the securities being registered on this Form are to be offered on a delayed or continuous basis pursuant to Rule 415 under the Securities Act of 1933 check the following box: ¨
If this Form is filed to register additional securities for an offering pursuant to Rule 462(b) under the Securities Act, please check the following box and list the Securities Act registration statement number of the earlier effective registration statement for the same offering. ¨
If this Form is a post effective amendment filed pursuant to Rule 462(c) under the Securities Act, check the following box and list the Securities Act registration statement number of the earlier effective registration statement for the same offering. ¨
If this Form is a post effective amendment filed pursuant to Rule 462(d) under the Securities Act, check the following box and list the Securities Act registration statement number of the earlier effective registration statement for the same offering. ¨
Indicate by check mark whether the registrant is a large accelerated filer, an accelerated filer, a non-accelerated filer, or a smaller reporting company. See the definitions of “large accelerated filer,” “accelerated filer” and “smaller reporting company” in Rule 12b-2 of the Exchange Act. (Check one):
| Large accelerated filer | ¨ | Accelerated filer | ¨ | |||
| Non-accelerated filer | x (do not check if a smaller reporting company) | Smaller reporting company | ¨ |
The registrant hereby amends this registration statement on such date or dates as may be necessary to delay its effective date until the registrant shall file a further amendment which specifically states that this registration statement shall thereafter become effective in accordance with Section 8(a) of the Securities Act of 1933 or until the registration statement shall become effective on such date as the Securities and Exchange Commission, acting pursuant to said Section 8(a), may determine.
Table of Contents
|
|
The information in this preliminary prospectus is not complete and may be changed. We may not sell these securities until the registration statement filed with the Securities and Exchange Commission is effective. This preliminary prospectus is not an offer to sell these securities and we are not soliciting offers to buy these securities in any jurisdiction where the offer or sale is not permitted. PRELIMINARY PROSPECTUS Subject to Completion , 2016 3,600,000 Shares Common Stock Elevate Credit, Inc. is offering 3,600,000 shares of its common stock. This is our initial public offering and no public market currently exists for our shares. We anticipate that the initial public offering price of our common stock will be between $20 and $22 per share. / Our common stock has been approved for listing on the New York Stock Exchange under the symbol “ELVT.” / We are an “emerging growth company” under the federal securities laws and are therefore subject to reduced public company reporting requirements. Investing in our common stock involves risks. See “Risk factors” beginning on page 17. Neither the Securities and Exchange Commission nor any state securities commission has approved or disapproved of these securities or determined if the prospectus is truthful or complete. Any representation to the contrary is a criminal offense. Per Share Total Public offering price $$ Underwriting discounts and commissions(1) $ $ Proceeds, before expenses, to us $ $ (1) See “Underwriting” beginning on page 195 for additional information regarding underwriting compensation. We have granted the underwriters the right to purchase up to an additional 540,000 shares of common stock. The underwriters expect to deliver the shares of common stock to purchasers on , 2016. UBS Investment Bank Jefferies Stifel William Blair BB&T Capital Markets
Table of Contents

Table of Contents

The next generation of re
Approval in seconds Rates that go do Credit building features
Table of Contents

responsible online credit o down over time Financial wellness features Flexible payment terms Good Today, Better Tomorrow
Table of Contents
You should rely only on the information contained in this prospectus or contained in any free writing prospectus prepared by or on behalf of us. Neither we nor the underwriters have authorized anyone to provide you with information different from, or in addition to, that contained in this prospectus or any related free writing prospectus. This prospectus is an offer to sell only the shares offered hereby and only under circumstances and in jurisdictions where it is lawful to do so. The information contained in this prospectus is current only as of its date, regardless of its delivery. Our business, financial condition, results of operations and prospects may have changed since that date.
Through and including , 2016 (25 days after the date of this prospectus), all dealers that effect transactions in these securities, whether or not participating in this offering, may be required to deliver a prospectus. This delivery requirement is in addition to a dealer’s obligation to deliver a prospectus when acting as an underwriter and with respect to their unsold allotments or subscriptions.
CERTAIN CONVENTIONS GOVERNING INFORMATION IN THIS PROSPECTUS
Presentation of information related to periods before the Spin-Off
We were incorporated in Delaware in January 2014. Prior to May 1, 2014, we operated as a separately identifiable line of business of Think Finance, Inc., or “TFI,” our predecessor company. On May 1, 2014, TFI contributed the assets and liabilities associated with its direct lending and branded products business to us, and distributed its interest in our company to its stockholders. We refer to this as the “Spin-Off.” Unless expressly indicated or the context requires otherwise, the terms “Elevate,” “company,” “we,” “us” and “our” in this prospectus refer to Elevate Credit, Inc. and, where appropriate, our wholly owned subsidiaries, as well as the direct lending and branded product business of TFI for periods prior to the Spin-Off. Financial and operational information for periods before the Spin-Off refer solely to the direct lending and branded product business of TFI. For further information regarding the Spin-Off, see “Business—Our History.”
Presentation of information related to our products
Our products are Rise and Elastic in the US and Sunny in the UK. Rise is an installment loan product that operates under individual state laws and may have significantly different rates, terms and conditions in each of the states in which Rise is offered. In Texas and Ohio, we do not make Rise loans directly, but rather act as a Credit Services Organization (which is also known as a Credit Access Business in Texas), or, collectively, “CSO,” and the loans are originated by an unaffiliated third party. Texas and Ohio are currently the only states in which Rise is offered pursuant to a CSO program. Our other US product, Elastic, is an open-end line of credit that is originated by a third-party lender under a contractual relationship whereby we provide marketing and technology services to support the lender’s origination of Elastic lines of credit. Unless expressly indicated or the context requires otherwise, and to simplify the disclosures contained herein, “Elevate’s products,” “our products,” “Elevate’s customers,” and “our customers,” as well as these products being “offered” by us and similar or related phrases, refer to these three products and their customers irrespective of whether Elevate directly originates the credit to the customer or whether such credit is originated by a third party.
i
Table of Contents
| 1 | ||||
| 9 | ||||
| 11 | ||||
| 15 | ||||
| 17 | ||||
| 59 | ||||
| 61 | ||||
| 62 | ||||
| 62 | ||||
| 63 | ||||
| 65 | ||||
| 68 | ||||
| Management’s discussion and analysis of financial condition and results of operations |
75 | |||
| 116 | ||||
| 145 | ||||
| 157 | ||||
| 170 | ||||
| 179 | ||||
| 182 | ||||
| 188 | ||||
| Material US federal income tax consequences to non-US holders of our common stock |
191 | |||
| 195 | ||||
| 205 | ||||
| 205 | ||||
| 205 | ||||
| Index to combined and consolidated financial statements contents |
F-1 |
ii
Table of Contents
This summary overview of the key aspects of the offering identifies those aspects of the offering that are the most significant. This summary is qualified in its entirety by the more detailed information and financial statements included elsewhere in this prospectus. This summary may not contain all the information you should consider before investing in our common stock. You should carefully read this prospectus in its entirety before investing in our common stock, including the sections titled “Risk factors” and “Management’s discussion and analysis of financial condition and results of operations” and our combined and consolidated financial statements and related notes included elsewhere in this prospectus. See “Certain conventions governing information in this prospectus” for detailed information on how we discuss our business.
OUR COMPANY
We provide technology-driven, progressive online credit solutions to non-prime consumers, typically defined as those with credit scores of less than 700. We use advanced technology and proprietary risk analytics to provide more convenient and more responsible financial options to our customers, who are not well-served by either banks or legacy non-prime lenders. We currently offer online installment loans and lines of credit in the United States, or the “US,” and the United Kingdom, or the “UK.” Our products, Rise, Elastic and Sunny, reflect our mission of “Good Today, Better Tomorrow” and provide customers with access to competitively priced credit and services while helping them build a brighter financial future with credit building and financial wellness features.
We have experienced rapid growth since launching our current generation of product offerings in 2013. Since their introduction, Rise, Elastic and Sunny, together, have provided approximately $1.6 billion in credit to approximately 550,000 customers and generated strong revenue growth. Our revenues for the year ended December 31, 2015 grew 59% to $434 million from $274 million for the year ended December 31, 2014 and revenues for the three months ended March 31, 2016 grew 46% compared to the three months ended March 31, 2015. Our operating income (loss) for the years ended December 31, 2015 and 2014 were $9 million and $(61) million, respectively, and were $26.5 million and $11.6 million for the three months ended March 31, 2016 and 2015, respectively.
Along with increased revenue growth and improving margins, we have also reduced the average APR to our customers. For the three months ended March 31, 2016 our average portfolio effective APR was 153%, a reduction of nearly 40% from 2013 when the average effective APR was 250%. We believe that this rate reduction helps to differentiate our products in the market and reflects improvements in our underwriting and the maturing of our loan portfolios.
Our products in the US and the UK are:
|
|

|
| ||||
| Product type |
Installment | Installment | Line of credit | |||
| Geographies served(1) |
15 states | UK | 40 states | |||
| Loan size |
$500 to $5,000 | £100 to £2,500 | $500 to $3,500 | |||
| Loan term(2) |
4-26 months | 6-14 months | Up to 10 months | |||
| Pricing(3) |
36% to 365% annualized |
10.5% to 24% monthly | Initially $5 per $100 borrowed plus up to 5.0% of outstanding principal per billing period | |||
| Other fees |
None | None | None | |||
| Weighted average effective APR(1)(4) |
160% | 239% | 85% |


1
Table of Contents
| (1) | As of or for the three months ended March 31, 2016. Includes loans originated through Credit Services Organization, or “CSO,” programs. |
| (2) | Elastic term is based on minimum principal payments of 10% of last draw amount per month. |
| (3) | In Texas and Ohio, Rise charges a CSO fee instead of interest. See “Management’s discussion and analysis of financial condition and results of operations—Key Financial and Operating Metrics—Revenue growth—Revenues.” Rise interest rates may differ significantly by state. See “Regulatory Environment—APR by geography” for a breakdown of the APR for each of our products. Rise interest rates of 36% are available to qualified customers based on on-time repayment history. |
| (4) | Elastic is a fee-based product. The number shown is based on a calculation of an effective APR. |
We differentiate ourselves in the following ways:
| Ø | Online products that are “Good Today, Better Tomorrow.” We provide customers access to competitively priced credit when they need it and reward successful payment history with rates on subsequent loans (installment loan products) that can decrease over time. In addition, our products offer responsible lending features including credit bureau reporting, free credit monitoring (for US customers), online financial literacy videos and tools, amortizing loan balances, flexible repayment schedules, and no prepayment penalties or punitive fees. |
| Ø | Industry-leading advanced technology and proprietary risk analytics. We have developed proprietary automated underwriting capabilities that allow us to make data-driven decisions on loan applications in seconds. To best serve a broad set of non-prime consumers, we have developed a unique approach that we call “segment-optimized analytics.” This approach utilizes proprietary credit scoring models for each of the customer segments and channels we serve to underwrite and assess risk and uses targeted fraud models to identify potential fraud. We apply both cutting-edge and traditional analytical techniques and a vast array of data sources, while complying with applicable lending laws. As a result of our proprietary technology and risk analytics, over 90% of loan applications are fully automated with no manual review required. |
| Ø | Integrated multi-channel marketing strategy. We use an integrated multi-channel marketing strategy to directly reach potential customers. Our marketing strategy includes coordinated direct mail programs, TV campaigns, search engine marketing and digital campaigns, as well as strategic partnerships. We believe our direct-to-consumer approach allows us to focus on higher quality, lower cost customer acquisitions while maximizing reach and brand awareness. Approximately 85% of our customers are sourced from direct marketing channels. We continue to invest in new marketing channels, including social media, which we believe will provide us with further competitive advantages and support our ongoing growth. We expect to continue to expand growth in our channels based on improved customer targeting analytics and increasingly sophisticated response models that allow us to expand our marketing reach while maintaining target customer acquisition costs. |
Our seasoned management team has, on average, over 15 years of technology and financial services experience and has worked together for an average of over six years in the non-prime consumer credit industry. Our management team has overseen the origination of more than $3.0 billion in credit to 1.4 million consumers for the combined current and predecessor direct and branded products that were contributed to Elevate in the Spin-Off. In addition, our management team achieved stable credit performance through the recent financial crisis, maintaining total principal losses as a percentage of loan originations of between 17% and 20% each year from 2006 through 2011. See “Business—Advanced Analytics and Risk Management—History of stable credit quality through the economic downturn.”
INDUSTRY OVERVIEW
Non-prime consumers represent the largest segment of the credit market. We provide credit to non-prime consumers, many of whom face reduced credit options and increased financial pressure due to macro-economic changes over the past few decades. We believe that this segment of the population represents a massive and underserved market of approximately 170 million consumers in the US and
2
Table of Contents
UK—a larger population than the market for prime credit. The profile of our typical customer for our US and UK products indicates that our customer base, which we refer to as the “New Middle Class,” is middle-income and has a mainstream demographic profile, in line with the average of the populations of the US and UK, respectively, in terms of income, educational background and homeownership.
The New Middle Class has an unmet need for credit. Due to wage stagnation over the past several decades and the further impact of the recent financial crisis, the New Middle Class is characterized by a lack of savings and significant income volatility. As a result, our customer base often must rely on short-term credit to fund unexpected expenses, like car and home repairs or medical emergencies.
Non-prime credit can be less vulnerable to recessionary factors. We believe that patterns of credit charge-offs for non-prime consumers typically are counter-cyclical when compared to prime consumers in credit downturns. In a recession, banks and traditional prime credit providers often experience increases in credit charge-off rates and tighten access to credit, which pushes certain consumers out of the credit market. Conversely, with advanced underwriting, lenders serving non-prime consumers are able to maintain comparatively flat charge off rates in part because these consumers are unable to avail themselves of the traditional credit market. See “Business—Advanced Analytics and Risk Management—History of stable credit quality through the economic downturn.”
Non-prime consumers have different needs for credit. Non-prime consumers generally have unique and immediate credit needs, which differ greatly from the typical prime consumer. Where prime consumers consider price most in selecting their credit products, we believe that non-prime consumers will often consider a variety of features, including the simplicity of the application process, speed of decisioning and funding, how they will be treated if they cannot pay their loan back on time, and flexible repayment terms.
Banks do not adequately serve the New Middle Class. Following the recent financial crisis, most banks tightened their underwriting standards and increased their minimum FICO score requirements for borrowers, leaving non-prime borrowers with severely reduced access to traditional credit. Despite the improving economy, banks continue to underserve the New Middle Class. We estimate that revolving credit available to non-prime US borrowers has been reduced by approximately $143 billion since 2008. This has had a profound impact on non-prime consumers in the US and UK who typically have little to no savings. Often, the only credit-like product offered by banks that is available to non-prime borrowers is overdraft protection, which provides credit at extremely high rates.
Legacy non-prime lenders are not innovative. As a result of limited access to credit products from banks, the New Middle Class has historically had to rely on a variety of legacy non-prime lenders, such as storefront installment lenders, payday lenders, title lenders, pawn and rent-to-own providers that typically do not offer consumers the convenience of online and mobile access. While legacy non-prime credit products may fulfill a borrower’s immediate funding needs, many of these products have significant drawbacks for consumers, including a potential “cycle of debt,” higher interest rates, punitive fees and aggressive collection tactics. Additionally, legacy non-prime lenders do not typically report to major credit bureaus, so non-prime consumers often remain in a “cycle of non-prime” and rarely improve their financial options.
New innovation is slow to market. Despite the growing and unmet need for non-prime credit, few innovative solutions tailored for non-prime consumers have come to market. Where new online marketplace lenders and small business lenders have emerged to serve prime consumers, we believe that non-prime consumers still have relatively few responsible online credit options. We believe this is because underwriting non-prime consumers presents significantly greater analytical challenges than underwriting prime consumers. Unlike prime consumers, the credit profiles of non-prime consumers vary greatly and
3
Table of Contents
their needs are extremely diverse. While new data and techniques can assist in improving underwriting capabilities, we believe lenders still require deep insight and extensive experience to successfully serve non-prime consumers while maintaining target loss rates. Additionally, we believe the compliance and other systems necessary to serve non-prime consumers in a manner consistent with regulatory requirements can be a barrier to entry for less sophisticated and newer entrants.
Consumers are embracing the internet for their personal finances. Consumers are increasingly turning to online solutions to fulfill their personal finance needs. We believe this growth is an indication of borrower preferences for online financial products that are more convenient and easier to use than products provided by legacy brick-and-mortar lenders.
OUR SOLUTIONS
Our innovative online credit solutions provide immediate relief to customers today and can help them build a brighter financial future. Our mission of “Good Today, Better Tomorrow” is central to our innovative product design. We offer a number of financial wellness and consumer-friendly features that we believe are unmatched in the non-prime lending market.
We use advanced technology and proprietary risk analytics to provide more convenient, competitively priced financial solutions to our customers, who are not well-served by either banks or legacy non-prime lenders. We believe we are one of the first to develop a risk-based pricing model utilizing technology and risk analytics focused on the non-prime credit industry. As a result, we believe we are leading the next generation of more responsible online credit providers for the New Middle Class.
Our products provide the following key benefits:
| Ø | Competitive pricing and no hidden or punitive fees. Our US products offer rates that we believe are typically more than 50% lower than many generally available alternatives from legacy non-prime lenders, such as payday lenders, which have an average APR of almost 400%. Our products offer rates on subsequent loans (installment loan products) that can decrease over time based on successful loan payment history. For instance, as of March 31, 2016, over two-thirds of Rise customers in good standing had received a rate reduction, either after a refinance or on a subsequent loan. In addition, in order to help our customers facing financial hardships, we have eliminated “punitive” fees, including returned payment fees and late charges, among others. |
| Ø | Access and convenience. We provide convenient, easy-to-use products via online and mobile platforms. Consumers are able to apply using an online application, which takes only minutes to complete. Credit determinations are made in seconds and over 90% of loan applications are fully automated with no manual review required. Funds are typically available next-day in the US and same-day in the UK. |
| Ø | Flexible payment terms and responsible lending features. Customers can select a repayment schedule that fits their needs with no prepayment penalties. In addition, our products feature amortizing principal balances over the term of the loan, in contrast to balloon payments required by many legacy non-prime lenders, which often result in repeated refinancings and can lead to a cycle of debt. To ensure that consumers fully understand the product and their alternatives, we provide extensive “Know Before You Borrow” disclosures as well as an industry-leading five-day period for customers to rescind their loan at no cost. Consistent with our goal of being sensitive to the unique needs of non-prime consumers, we also offer flexible solutions to help customers facing issues impacting their ability to make scheduled payments. Our solutions include notifications before payment processing, extended due dates, grace periods, payment plans and settlement offers. |
4
Table of Contents
| Ø | Financial wellness features. Our products include credit building and financial wellness programs, such as credit reporting, free credit monitoring (in the US) and online financial literacy videos and tools. Our goal is to help our customers improve their financial options and behaviors at no additional charge. |
OUR COMPETITIVE ADVANTAGES
Using our technology platform and proprietary risk analytics, we are able to offer our customers innovative credit solutions that place us as a leader among a new generation of more responsible, online non-prime lenders. We believe the following are our key competitive advantages:
| Ø | Differentiated online products for non-prime consumers. We are committed to our mission of “Good Today, Better Tomorrow.” Our products are “good today” due to their convenience, cost and flexibility. However, we go even further in creating credit products that can help enable customers to have a “better tomorrow.” Based on successful payment history, rates on subsequent loans (installment loan products) can decrease over time, and we provide a path to prime credit for struggling consumers by reporting to credit bureaus, providing free credit monitoring (for US products), and offering online financial literacy videos and tools to help build better financial management skills. |
| Ø | Leading risk analytics. As a result of our extensive experience and track record in the industry, we have developed a unique approach to underwriting non-prime credit using segment-optimized analytics. Unlike simplistic scoring approaches that may be adequate for prime and near-prime consumers, our approach allows us to serve a broad set of customer segments within the non-prime market and across the numerous channels we use to reach them. Our team of over 35 data scientists utilizes thousands of data inputs to continually optimize our proprietary credit scoring model, which is currently in its 12th generation. See “Business—Advanced Analytics and Risk Management—Segment-optimized analytics—Segment specific credit scores.” Across the portfolio of products we currently offer, we have maintained stable credit quality as evidenced by credit loss rates of under 20% on the original principal loan balances. See “Management’s discussion and analysis of financial condition and results of operations—Key Financial and Operating Metrics—Credit quality.” Furthermore, our proprietary credit and fraud scoring models allow not only for the scoring of a broad range of non-prime consumers, but also across a variety of products, channels, geographies and regulatory requirements. |
| Ø | Innovative and flexible technology platform. Investment in our flexible and scalable technology platform has enabled us to rapidly grow and innovate new products—notably supporting the launch of our current generation of product offerings in 2013. Our proven technology platform provides for highly automated loan originations and cost-effective servicing. In addition, our platform is adaptable to allow us to deliver customizable online loan products to meet changing consumer preferences and respond to a dynamic regulatory environment. Further, our open architecture allows us to easily integrate best-in-class third party providers, including strategic partners, data sources and outsourced vendors, into our platform. |
| Ø | Integrated multi-channel marketing approach. We use an integrated multi-channel marketing strategy to market directly to potential customers, which includes coordinated direct mail programs, TV campaigns, search engine marketing and digital campaigns, and strategic partnerships with affiliates. We have created unique capabilities to effectively identify and attract qualified customers, which supports our long-term growth objectives at target customer acquisition costs. We believe this approach allows us to focus on higher quality, lower cost customer acquisition while maximizing reach and enhancing brand awareness. |
5
Table of Contents
| Ø | Seasoned management team with strong industry track record. We have a seasoned team of senior executives with an average of over 15 years of experience in technology and financial services, led by Ken Rees, a financial services industry veteran with over 20 years of experience, who is regarded as one of the leading advocates of responsible credit in the non-prime lending space. The team oversaw the origination of more than $3.0 billion in credit to 1.4 million consumers for the combined current and predecessor products that were contributed to Elevate in the Spin-Off. Additionally, the team has a proven track record of managing defaults through the most recent financial crisis. From 2006 to 2011, the principal charge-offs of Elevate’s legacy and predecessor credit products remained comparatively flat compared to credit card charge-offs, which experienced volatility, with charge-off rates increasing by close to 300% during the same period. |
OUR GROWTH STRATEGY
To achieve our goal of being the preeminent online lender to the New Middle Class, we intend to execute the following strategies:
| Ø | Continue to grow our current products into dominant brands. The current generation of Rise, Elastic and Sunny were launched in 2013. Given strong consumer demand and organic growth potential, we believe that significant opportunities exist to expand these three products within their current markets via existing marketing channels. As non-prime consumers become increasingly familiar and comfortable with online financial services, we also plan to capture the new business generated as they migrate away from less convenient legacy brick-and-mortar lenders. |
| Ø | Widen the spectrum of borrowers served. We continue to evaluate new product and market opportunities that fit into our overall strategic objective of delivering next-generation online credit products that span the non-prime credit spectrum. For example, we are evaluating products with lower rates that would be more focused on the needs of near-prime consumers. In addition, we are continually focused on improving our analytics to effectively underwrite and serve consumers within those segments of the non-prime credit spectrum that we do not currently reach. |
| Ø | Increase operating leverage by expanding our relationship with existing customers. Customer acquisition cost is one of the most significant expenses for online lenders. We will seek to expand our strong relationships with existing customers by providing qualified customers with new loans on improved terms or offering other products and services without incurring significant additional costs. We believe we can, as a result, provide improved products and services to our customers while, at the same time, achieving better operating leverage. |
| Ø | Expand strategic partnerships. Our progressive non-prime credit solutions have attracted top-tier affiliate partners. We intend to continue growing our existing affiliate partnerships and will evaluate opportunities to enter into new partnerships with affiliates and retailers and potentially enable non-prime customers to purchase their goods and services on credit. We expect these partnerships to provide us with access to a broad range of potential new customers, with low customer acquisition costs. |
| Ø | Expansion in select markets. We will explore pursuing strategic opportunities to expand into additional international and domestic markets. However, we plan to take a disciplined approach to international expansion, utilizing customized products and in-market expertise. As reflected in our approach to entering the UK market, we believe that local teams with products developed for each unique local market will ultimately be the most successful. We currently do not expect to undertake any international expansion in the near term. |
6
Table of Contents
RISKS AFFECTING US
Our business is subject to numerous risks and uncertainties, including those highlighted in “Risk factors.” These risks include, but are not limited to, the following:
| Ø | We have a limited operating history in an evolving industry, which makes it difficult to accurately assess our future growth prospects. |
| Ø | Our historical information does not necessarily represent the results we would have achieved as a stand-alone company and may not be a reliable indicator of our future results. |
| Ø | Our recent growth rate may not be indicative of our ability to continue to grow, if at all, in the future. |
| Ø | We have a history of losses and may not achieve consistent profitability in the future. |
| Ø | The consumer lending industry continues to be subjected to new laws and regulations in many jurisdictions that could restrict the consumer lending products and services we offer, impose additional compliance costs on us, render our current operations unprofitable or even prohibit our current operations. |
| Ø | Regulators and payment processors are scrutinizing certain online lenders’ access to the Automated Clearing House system to disburse and collect loan proceeds and repayments, and any interruption or limitation on our ability to access this critical system would materially adversely affect our business. |
| Ø | If the information provided by customers to us is incorrect or fraudulent, we may misjudge a customer’s qualification to receive a loan, and any inability to effectively identify, manage, monitor and mitigate fraud risk on a large scale could cause us to incur substantial losses, and our operating results, brand and reputation could be harmed. |
| Ø | Because of the non-prime nature of our customers, we have historically experienced a high rate of net charge-offs as a percentage of revenues, and our ability to price appropriately in response to this and other factors is essential. We rely on our proprietary credit and fraud scoring models in the forecasting of loss rates. If we are unable to effectively forecast loss rates, it may negatively impact our operating results. |
| Ø | We currently depend on debt financing to finance most of the loans we originate. Our business could be adversely affected by a lack of sufficient debt financing at acceptable prices or disruptions in the credit markets, which could reduce our access to credit. |
| Ø | Risks related to our association with Think Finance, Inc., or “TFI.” |
| Ø | Other risks related to litigation, compliance, regulation and this offering. |
CORPORATE INFORMATION
We were incorporated in Delaware in January 2014. Prior to May 1, 2014, we operated as a separate identifiable line of business of TFI. On May 1, 2014 were spun off from TFI.
Our principal executive offices are located at 4150 International Plaza, Suite 300, Fort Worth, Texas 76109, and our telephone number is (817) 928-1500. Our website is www.elevate.com. Information contained on, or that can be accessed through, our website is not incorporated by reference into this prospectus, and you should not consider information on our website to be part of this prospectus.
Elevate, Elastic, Rise, Sunny and other trademarks or service marks of Elevate appearing in this prospectus are the property of Elevate. Trade names, trademarks and service marks of other companies appearing in this prospectus are the property of their respective holders. We have omitted the ® and ™ designations, as applicable, for the trademarks and service marks used in this prospectus.
7
Table of Contents
We are an emerging growth company as defined in the Jumpstart Our Business Startups Act of 2012 and are therefore subject to reduced public company reporting requirements. We will remain an emerging growth company until the earliest to occur of: the last day of the fiscal year in which we have more than $1.0 billion in annual revenues; the date we qualify as a “large accelerated filer” with at least $700 million of equity securities held by non-affiliates; the issuance, in any three-year period, by us of more than $1.0 billion in non-convertible debt securities; and the last day of the fiscal year ending after the fifth anniversary of our initial public offering.
8
Table of Contents
| Common stock offered by us |
3,600,000 shares |
| Common stock to be outstanding after this offering |
30,497,985 shares |
| Option to purchase additional shares to be offered by us |
540,000 shares |
| Use of proceeds |
We expect to use approximately $56.3 million of the net proceeds to repay a portion of the outstanding amount under our financing agreement and the remainder for general corporate purposes, including to fund a portion of the loans made to our customers. See “Use of proceeds.” |
| Directed share program |
At our request, the underwriters have reserved up to 5% of the common stock being offered by this prospectus for sale at the initial public offering price to our directors, director nominees, officers, employees and other individuals associated with us and members of their families. Any reserved shares not so purchased will be offered by the underwriters to the general public on the same terms as the other shares of common stock. Participants in the directed share program who purchase more than $1 million of shares shall be subject to a 25-day lock-up with respect to any shares sold to them pursuant to that program. Any shares sold in the directed share program to our directors, director nominees or executive officers shall be subject to 180-day lock-ups. Any of these lock-up agreements will have similar restrictions to the lock-up agreements described herein. See “Underwriting—Directed Share Program.” |
| Exchange listing |
Our common stock has been approved for listing on the New York Stock Exchange, or “NYSE,” under the symbol “ELVT”. |
The number of shares of our common stock to be outstanding after this offering is based on 26,897,985 shares of our common and convertible preferred stock outstanding as of March 31, 2016, as adjusted for the 2.5-for-1 forward stock split, which will occur in connection with the completion of this offering, and excludes 4,264,223 shares of common stock reserved and common stock available for issuance under our 2014 Equity Incentive Plan, or “2014 Plan,” which comprises:
| Ø | 3,997,278 shares of common stock issuable upon the exercise of options outstanding as of March 31, 2016, with a weighted average exercise price of $3.90 per share and per share exercise prices ranging from $2.12 to $8.32; |
9
Table of Contents
| Ø | 266,945 shares of common stock issuable upon the exercise of options available for grant. |
Unless otherwise noted, the information in this prospectus reflects and assumes the following:
| Ø | the conversion of all outstanding shares of our convertible preferred stock on a one-to-one basis without additional consideration into an aggregate of 5,639,410 shares of common stock immediately prior to the 2.5-for-1 forward stock split of our common stock and immediately prior to the completion of this offering; |
| Ø | a 2.5-for-1 forward stock split of our common stock to be effected immediately prior to the completion of this offering; |
| Ø | the filing of our amended and restated certificate of incorporation in connection with the completion of this offering; |
| Ø | no exercise of outstanding options; and |
| Ø | no exercise of the underwriters’ option to purchase additional shares. |
10
Table of Contents
Summary historical and pro forma financial data
The following tables summarize our combined and consolidated financial data. You should read the summary combined and consolidated financial data set forth below in conjunction with our combined and consolidated financial statements, the notes to our combined and consolidated financial statements and “Management’s discussion and analysis of financial condition and results of operations” contained elsewhere in this prospectus.
The combined and consolidated statements of operations data for the years ended December 31, 2015 and 2014 are derived from our audited combined and consolidated financial statements included elsewhere in this prospectus. The consolidated statements of operations data for the three months ended March 31, 2016 and 2015 and consolidated balance sheet data as of March 31, 2016 are derived from our unaudited condensed consolidated interim financial statements included elsewhere in this prospectus. The unaudited consolidated financial data for the three months ended March 31, 2016 and 2015 and as of March 31, 2016 include all adjustments, consisting only of normal recurring accruals that are necessary in the opinion of our management for a fair presentation of our financial position and results of operations for these periods. Our historical results are not necessarily indicative of the results that may be expected in any future period.
Prior to May 1, 2014, we operated as a separately identifiable line of business of Think Finance, Inc., or “TFI,” our predecessor company. On May 1, 2014, TFI contributed the assets and liabilities associated with its direct lending and branded products business to us and distributed its interest in our company to its stockholders, which we refer to as the “Spin-Off.” Our combined financial statements for periods prior to the Spin-Off reflect the historical results of operations and historical basis of assets and liabilities of the direct lending business that was contributed to us. The combined statements of operations for periods prior to the Spin-Off include expense allocations for general overhead and corporate functions historically provided to the direct lending business. These allocations were made based on a specifically identifiable basis or using allocations methods such as revenues, headcount or other reasonable methods and have been included in our combined financial statements for periods prior to May 1, 2014. Prior to May 1, 2014, all intercompany transactions between us and TFI have been included within the combined and consolidated financial statements and are considered to be effectively settled through contributions or distributions within TFI’s net investment at the time the transactions were recorded. Beginning May 1, 2014, all material intercompany transactions have been eliminated.
11
Table of Contents
| For the years ended December 31, |
For the three months ended March 31, |
|||||||||||||||
| Combined and consolidated statements of operations data (dollars in thousands, except per share amounts) |
2015 | 2014 | 2016 | 2015 | ||||||||||||
| (unaudited) | ||||||||||||||||
| Revenues |
$ | 434,006 | $ | 273,718 | $ | 130,722 | $ | 89,506 | ||||||||
| Cost of sales: |
||||||||||||||||
| Provision for loan losses |
232,650 | 170,908 | 59,089 | 39,284 | ||||||||||||
| Direct marketing costs |
61,032 | 60,166 | 9,606 | 9,866 | ||||||||||||
| Other cost of sales |
15,197 | 10,603 | 3,583 | 2,606 | ||||||||||||
|
|
|
|
|
|
|
|
|
|||||||||
| Total cost of sales |
308,879 | 241,677 | 72,278 | 51,756 | ||||||||||||
|
|
|
|
|
|
|
|
|
|||||||||
| Gross profit |
125,127 | 32,041 | 58,444 | 37,750 | ||||||||||||
|
|
|
|
|
|
|
|
|
|||||||||
| Operating expenses: |
||||||||||||||||
| Compensation and benefits |
60,568 | 48,010 | 16,100 | 13,921 | ||||||||||||
| Professional services |
25,134 | 18,662 | 7,249 | 4,748 | ||||||||||||
| Selling and marketing |
7,567 | 7,366 | 2,505 | 2,490 | ||||||||||||
| Occupancy and equipment |
9,690 | 8,043 | 2,735 | 2,333 | ||||||||||||
| Depreciation and amortization |
8,898 | 8,317 | 2,633 | 2,068 | ||||||||||||
| Other |
4,303 | 2,766 | 706 | 569 | ||||||||||||
|
|
|
|
|
|
|
|
|
|||||||||
| Total operating expenses |
116,160 | 93,164 | 31,928 | 26,129 | ||||||||||||
|
|
|
|
|
|
|
|
|
|||||||||
| Operating income (loss) |
8,967 | (61,123 | ) | 26,516 | 11,621 | |||||||||||
|
|
|
|
|
|
|
|
|
|||||||||
| Other income (expense): |
||||||||||||||||
| Net interest expense |
(36,674 | ) | (12,939 | ) | (13,500 | ) | (6,755 | ) | ||||||||
| Foreign currency transaction loss |
(2,385 | ) | (1,408 | ) | (1,358 | ) | (1,459 | ) | ||||||||
| Non-operating income |
5,523 | — | — | — | ||||||||||||
|
|
|
|
|
|
|
|
|
|||||||||
| Total other expense |
(33,536 | ) | (14,347 | ) | (14,858 | ) | (8,214 | ) | ||||||||
|
|
|
|
|
|
|
|
|
|||||||||
| Income (loss) before taxes |
(24,569 | ) | (75,470 | ) | 11,658 | 3,407 | ||||||||||
| Income tax provision (benefit) |
(4,658 | ) | (20,710 | ) | 5,866 | 2,509 | ||||||||||
|
|
|
|
|
|
|
|
|
|||||||||
| Income (loss) from continuing operations |
(19,911 | ) | (54,760 | ) | 5,792 | 898 | ||||||||||
|
|
|
|
|
|
|
|
|
|||||||||
| Income from discontinued operations, net of tax |
— | 135 | — | — | ||||||||||||
|
|
|
|
|
|
|
|
|
|||||||||
| Net income (loss) |
$ | (19,911 | ) | $ | (54,625 | ) | $ | 5,792 | $ | 898 | ||||||
|
|
|
|
|
|
|
|
|
|||||||||
| Basic earnings (loss) per share |
$ | (3.97 | ) | $ | (11.59 | ) | $ | 1.13 | $ | 0.18 | ||||||
| Diluted earnings (loss) per share |
$ | (3.97 | ) | $ | (11.59 | ) | $ | 0.51 | $ | 0.08 | ||||||
| Pro forma earnings (loss) per share: |
||||||||||||||||
| Basic(1) |
$ | (0.75 | ) | $ | (2.11 | ) | $ | 0.22 | $ | 0.03 | ||||||
| Diluted(1) |
$ | (0.75 | ) | $ | (2.11 | ) | $ | 0.20 | $ | 0.03 | ||||||
| Basic, as adjusted(2) |
$ | (0.66 | ) | $ | (1.85 | ) | $ | 0.19 | $ | 0.03 | ||||||
| Diluted, as adjusted(2) |
$ | (0.66 | ) | $ | (1.85 | ) | $ | 0.18 | $ | 0.03 | ||||||
| Basic weighted average shares outstanding |
5,010,339 | 4,711,794 | 5,118,983 | 4,892,431 | ||||||||||||
| Diluted weighted average shares outstanding |
5,010,339 | 4,711,794 | 11,359,870 | 10,986,502 | ||||||||||||
| Weighted average shares used in computing pro forma net income (loss) per share |
||||||||||||||||
| Basic(1) |
26,624,373 | 25,878,010 | 26,895,983 | 26,329,603 | ||||||||||||
| Diluted(1) |
26,624,373 | 25,878,010 | 28,399,675 | 27,466,255 | ||||||||||||
| Basic, as adjusted(2) |
30,224,373 | 29,478,010 | 30,495,983 | 29,929,603 | ||||||||||||
| Diluted, as adjusted(2) |
30,224,373 | 29,478,010 | 31,999,675 | 31,066,255 | ||||||||||||
| (1) | Pro forma basic and diluted net income (loss) per share of common stock have been calculated assuming (i) the conversion of all outstanding shares of convertible preferred stock at March 31, 2016 and 2015 and at December 31, 2015 and 2014 into an aggregate of 5,639,410 shares (prior to the 2.5-for-1 forward stock split) of common stock as of the beginning of the applicable period or at the time of issuance, if later and (ii) the application of the 2.5-for-1 forward stock split to all common stock after such conversion. |
| (2) | Pro forma net income (loss) per share of common stock, as adjusted, gives effect to (i) the sale by us of 3,600,000 shares of our common stock in this offering; (ii) the automatic conversion of all outstanding shares of convertible preferred stock into an aggregate of 5,639,410 shares (prior to the 2.5-for-1 forward stock split) of our common stock; (iii) the application of the 2.5-for-1 forward stock split to all common stock after such conversion and (iv) the use of proceeds from this offering to repay a portion of the amounts outstanding under the Victory Park Capital credit facility, or the “VPC Facility,” as described in “Use of proceeds,” as if the offering and those transactions had occurred on March 31, 2016. The number of shares is computed based on an assumed initial public offering price of $21.00 per share, the midpoint of the price range set forth on the cover page of this prospectus. |
12
Table of Contents
| As of and for the years ended December 31, |
As of and for the three months ended March 31, |
|||||||||||||||
| Other financial and operational data (dollars in thousands, except as noted) |
2015 | 2014 | 2016 | 2015 | ||||||||||||
| (unaudited) | ||||||||||||||||
| Adjusted EBITDA(1) |
$ | 17,865 | $ | (52,806 | ) | $ | 29,149 | $ | 13,689 | |||||||
| Free cash flow(2) |
$ | (30,931 | ) | $ | (47,358 | ) | $ | 6,188 | $ | (11,694 | ) | |||||
| Number of new customer loans |
238,238 | 202,656 | 40,717 | 29,944 | ||||||||||||
| Number of loans outstanding |
222,723 | 146,046 | 201,076 | 131,577 | ||||||||||||
| Customer acquisition cost per new loan (in dollars) |
$ | 256 | $ | 297 | $ | 236 | $ | 329 | ||||||||
| Net charge-offs(3) |
$ | 214,795 | $ | 138,559 | $ | 69,010 | $ | 45,694 | ||||||||
| Additional provision for loan losses(3) |
17,855 | 32,349 | (9,921 | ) | (6,410 | ) | ||||||||||
|
|
|
|
|
|
|
|
|
|||||||||
| Provision for loan losses |
$ | 232,650 | $ | 170,908 | $ | 59,089 | $ | 39,284 | ||||||||
|
|
|
|
|
|
|
|
|
|||||||||
| Past due combined loans receivable – principal as a percentage of combined loans receivable – principal(4) |
12 | % | 15 | % | 12 | % | 14 | % | ||||||||
| Net charge-offs as a percentage of revenues |
49 | % | 51 | % | 53 | % | 51 | % | ||||||||
| Total provision for loan losses as a percentage of revenues |
54 | % | 62 | % | 45 | % | 44 | % | ||||||||
| Combined loan loss reserve(5) |
$ | 65,784 | $ | 48,491 | $ | 55,592 | $ | 41,718 | ||||||||
| Combined loan loss reserve as a percentage of combined loans receivable(5) |
17 | % | 22 | % | 16 | % | 22 | % | ||||||||
| Effective APR of combined loan portfolio |
173 | % | 202 | % | 153 | % | 189 | % | ||||||||
| Ending combined loans receivable – principal(4) |
$ | 356,069 | $ | 201,660 | $ | 320,682 | $ | 176,658 | ||||||||
| (1) | Adjusted EBITDA is not a financial measure prepared in accordance with generally accepted accounting principles in the United States, or “GAAP.” Adjusted EBITDA represents our net income (loss), adjusted to exclude: net interest expense primarily associated with notes payable under the VPC Facility and ESPV Facility used to fund or purchase loans; foreign currency gains and losses associated with our UK operations; depreciation and amortization expense on fixed assets and intangible assets; adjustments to contingent consideration payable related to companies previously acquired prior to the Spin-Off; miscellaneous gains and losses associated with the sale of assets related to discontinued operations; and income taxes. See “Management’s discussion and analysis of financial condition and results of operations—Non-GAAP Financial Measures” for more information and for a reconciliation of Adjusted EBITDA to net income (loss), the most directly comparable financial measure calculated in accordance with GAAP. |
| (2) | Free cash flow is not a financial measure prepared in accordance with GAAP. Free cash flow represents our net cash from operating activities adjusted for the principal loan net charge-offs and capital expenditures incurred during the period. See “Management’s discussion and analysis of financial condition and results of operations—Non-GAAP Financial Measures” for more information and a reconciliation of free cash flow to net cash provided by operating activities. |
| (3) | Net charge-offs and additional provision for loan losses are not a financial measure prepared in accordance with GAAP. Net charge-offs include the amount of principal and accrued interest on loans that are more than 60 days past due, or sooner if we receive notice that the loan will not be collected, such as a bankruptcy notice or identified fraud, offset by any recoveries. Additional provision for loan losses is the amount of provision for loan losses needed for a particular period to adjust the combined loan loss reserve to the appropriate level in accordance with our underlying loan loss reserve methodology. See “Management’s discussion and analysis of financial condition and results of operations—Non-GAAP Financial Measures” for more information and for a reconciliation to provision for loan losses, the most directly comparable financial measure calculated in accordance with GAAP. |
| (4) | Combined loans receivable is defined as loans owned by the company plus loans originated and owned by third-party lenders pursuant to our CSO programs. See “Management’s discussion and analysis of financial condition and results of operations—Non-GAAP Financial Measures” for more information and for a reconciliation of Combined loans receivable to loans receivable, net, the most directly comparable financial measure calculated in accordance with GAAP. |
(footnotes continued on following page)
13
Table of Contents
| (5) | Combined loan loss reserve is defined as the loan loss reserve for loans owned by the company plus the loan loss reserve for loans originated and owned by third-party lenders and guaranteed by the company. See “Management’s discussion and analysis of financial condition and results of operations—Non-GAAP Financial Measures” for more information and for a reconciliation of Combined loan loss reserve to loan loss reserve, the most directly comparable financial measure calculated in accordance with GAAP. |
| As of March 31, 2016 | ||||||||||||
| Selected consolidated balance sheet data (dollars in thousands) | Actual | Pro forma(1) | Pro forma as adjusted(2) |
|||||||||
| (unaudited) | ||||||||||||
| Cash and cash equivalents |
$ | 72,871 | $ | 72,871 | $ | 82,871 | ||||||
| Loans receivable, net of allowance for loan losses of $59,771 |
257,763 | 257,763 | 257,763 | |||||||||
| Total assets |
429,547 | 429,547 | 439,547 | |||||||||
| Total liabilities |
390,076 | 390,076 | 333,776 | |||||||||
| Total convertible preferred stock |
6 | — | — | |||||||||
| Total stockholders’ equity |
$ | 39,471 | $ | 39,471 | $ | 105,771 | ||||||
| (1) | The pro forma column reflects (i) the conversion of all outstanding shares of convertible preferred stock at March 31, 2016 into 5,639,410 shares (prior to the 2.5-for-1 forward stock split) of common stock immediately prior to the closing of this offering and (ii) the application of the 2.5-for-1 forward stock split to all common stock after such conversion. The outstanding shares of our preferred stock were originally distributed to stockholders of TFI in connection with the Spin-Off. Each share of preferred stock will convert into one share of common stock without the payment of additional consideration. The conversion of the convertible preferred stock reduces total convertible preferred stock par value by $6,000 while increasing common stock by the same amount. |
| (2) | The pro forma as adjusted column reflects (i) the pro forma adjustments described in footnote (1) above, (ii) the sale by us of 3,600,000 shares of common stock in this offering at an assumed initial public offering price of $21.00 per share, the midpoint of the price range set forth on the cover page of this prospectus, after deducting the underwriting discount and commissions and estimated offering expenses payable by us and (iii) the use of proceeds from this offering to repay a portion of the amounts outstanding under our VPC Facility as described in “Use of proceeds.” A $1.00 increase (decrease) in the assumed initial public offering price of $21.00 per share would increase (decrease) each of pro forma as adjusted cash and cash equivalents and total assets by $3.3 million and decrease (increase) pro forma as adjusted total stockholders’ (deficit) equity by approximately $3.3 million, assuming the number of shares we are offering, as set forth on the cover page of this prospectus, remains the same, after deducting the underwriting discount and commissions and estimated offering expenses payable by us. Similarly, an increase (decrease) of one million shares in the number of shares offered by us in this offering would increase (decrease) each of pro forma as adjusted cash and cash equivalents and total assets by $19.7 million and decrease (increase) pro forma as adjusted total stockholders’ equity by approximately $19.7 million, assuming an initial public offering price of $21.00 per share, the midpoint of the price range set forth on the cover page of this prospectus, remains the same, after deducting the underwriting discount and commissions and estimated offering expenses payable by us. The pro forma as adjusted information is illustrative only, and we will adjust this information based on the actual initial public offering price, number of shares offered and other terms of this offering determined at pricing. |
14
Table of Contents
Letter from Ken Rees, CEO of Elevate
At Elevate, we know that now more than ever there is a need to rethink traditional approaches to consumer credit. Decades-long macroeconomic trends and the recent financial crisis have resulted in a growing “New Middle Class” with little to no savings, urgent credit needs and limited options. Banks haven’t stepped up to serve this market and legacy non-prime lenders haven’t innovated. We believe that Elevate provides the answer.
We use technology and advanced analytics to provide consumers the relief they need today and the tools and resources to help them build a brighter financial future. We call this “Good Today, Better Tomorrow.”
The rapid growth we’ve achieved stems from our unique perspective on the New Middle Class. We understand they are more than a single-dimensional credit score. They deserve access to credit, fair pricing, a path to lower rates and better credit, and to achieve their long-term financial goals—all through convenient online and mobile channels. With our innovative products, technology and analytics, we’re leading the path to progress.
Serving non-prime consumers represents a vast and untapped market opportunity. Banks have pulled away from non-prime consumers since the recession while more recent innovations in non-bank financial services have primarily focused on the needs of prime consumers. To make matters worse, “dead-end” products offered by legacy non-prime lenders can trap consumers in a “cycle of debt” and never solve for an even more pervasive problem we call the “cycle of non-prime.” We believe the New Middle Class deserves better. Where marketplace lenders are providing better options for prime consumers, online small business lenders are streamlining and enhancing access to credit for small businesses, and other technology-enabled lenders are rethinking the student loan market, Elevate is leading the transformation of the underserved non-prime credit market.
We believe we offer investors a tremendous opportunity to invest in a platform with a proven ability to grow, scale and innovate. We also think it’s important that before you invest you understand the core beliefs that drive our business:
We believe the highest cost credit is no credit at all. Eliminating access to credit by forcing non-prime consumers to borrow from family and friends is irresponsible and ignores the real-world challenges and needs facing the New Middle Class. Our goal is to responsibly serve as many non-prime consumers as possible while maintaining sustainable margins and without compromising our commitment to lowering rates for our customers.
We believe non-prime credit needs to be priced to risk. Serving non-prime customers means accepting a higher likelihood of default. However, instituting overly restrictive credit criteria or adding punitive fees and aggressive collections practices that create even more hardships for consumers is not the answer. At Elevate, we utilize risk-based pricing to achieve target margins with simple and transparent pricing. This means that our customers will pay the rate appropriate for their risk but won’t face hidden or punitive fees, and as a result, most of the credit we offer will be priced above rates generally available to prime consumers. Our goal is to balance the need to provide access to responsible credit with the need for sustainable profits.
We believe that further improvements in technology, analytics and scale should benefit our customers. We are continually investing in advanced analytics that allow us to improve our underwriting capabilities. In addition, because we are a 100% online and mobile business, as we
15
Table of Contents
Letter from Ken Rees, CEO of Elevate
continue to grow we expect to generate economies of scale. We are committed to using these improvements to benefit our borrowers in the form of lower rates. As a result, we do not expect operating margins to grow above 20% over the long term. This is part of our commitment as a responsible lender, but also an important discipline that supports long-term growth and competitive differentiation.
We believe in “Good Today, Better Tomorrow.” The New Middle Class deserves responsible online and mobile credit products that meet their needs today and also provide them with a path to improve their financial future. Our products are competitively priced and convenient, have flexible payment options, and don’t have hidden or punitive fees. In addition, they have rates that can go down over time, are reported to credit bureaus, offer free credit score monitoring and provide financial wellness tools—all to help our customers build their brighter tomorrow. We believe this approach is the right thing to do and will result in a more successful long-term relationship with our customers.
We believe the need for non-prime credit is here to stay. Ongoing changes in the regulatory environment will not eliminate the need for non-prime credit, but rather will evolve the way it is provided. Moreover, consumers continue to demand more convenience and speed of delivery for credit. Innovation is in our DNA, and we believe that nimble, technology-enabled lenders like Elevate will be able to adapt, thrive and continue to grow in a dynamic regulatory environment and serve expanding consumers expectations for credit.
Delivering on these core beliefs is powered by our people and a corporate culture driven by Elevate’s four company values: Think Big, Do the Right Thing, Win Together, and Raise the Bar. These are not just words on paper, they inspire us to innovate, adapt and always focus on improving the financial options available to the New Middle Class.

Thank you for reading this letter. We are proud to serve the New Middle Class, and I hope you share our excitement about the incredible opportunity we have to provide the next generation of responsible, technology-driven credit solutions for non-prime consumers and build a successful, lasting company.

|
| Ken Rees Chief Executive Officer |
16
Table of Contents
Investing in our common stock involves a high degree of risk. You should carefully consider the following risks and all other information contained in this prospectus, including our combined and consolidated financial statements and the related notes, before investing in our common stock. The risks and uncertainties described below are not the only ones we face, but include the most significant factors currently known by us that make the offering speculative or risky. Additional risks and uncertainties that we are unaware of, or that we currently believe are not material, also may become important factors that affect us. If any of the following risks materialize, our business, financial condition and results of operations could be materially harmed. In that case, the trading price of our common stock could decline, and you may lose some or all of your investment.
RISKS RELATED TO OUR BUSINESS AND INDUSTRY
We have a limited operating history in an evolving industry, which makes it difficult to accurately assess our future growth prospects.
We were incorporated as a wholly owned subsidiary of Think Finance, Inc., or “TFI,” our predecessor company, in January 2014 and became a stand-alone company in May 2014 following the Spin-Off and, as such, have a very limited operating history as a stand-alone company. Although our management team has many years of experience in the non-prime lending industry, we also operate in an evolving industry that may not develop as expected. Assessing the future prospects of our business is challenging in light of both known and unknown risks and difficulties we may encounter. Growth prospects in non-prime lending can be affected by a wide variety of factors including:
| Ø | Competition from other online and traditional lenders; |
| Ø | Regulatory limitations on the products we can offer and markets we can serve; |
| Ø | Other changes in the regulation of non-prime lending; |
| Ø | Access to important marketing channels such as: |
| ¡ | Direct mail; |
| ¡ | TV and mass media; |
| ¡ | Search engine marketing; and |
| ¡ | Strategic partnerships with affiliates; |
| Ø | Changes in consumer behavior; |
| Ø | Access to adequate financing; |
| Ø | Increasingly sophisticated fraudulent borrowing and online theft; |
| Ø | Challenges with new products and new markets; and |
| Ø | Fluctuations in the credit markets and demand for credit. |
We may not be able to successfully address these factors, which could negatively impact our growth, harm our business and cause our operating results to be worse than expected.
17
Table of Contents
Risk factors
Our historical information does not necessarily represent the results we would have achieved as a stand-alone company and may not be a reliable indicator of our future results.
We have a very limited operating history as a stand-alone company. See “—We have a limited operating history in an evolving industry, which makes it difficult to accurately assess our future growth prospects” above. As a result of the Spin-Off, TFI contributed the assets and liabilities associated with its direct lending and branded products business to us. The historical financial information we have included in this prospectus may not reflect what our results of operations, financial position and cash flows would have been had we been a stand-alone company during the periods presented. This is primarily because:
| Ø | our historical financial information reflects allocations for services historically provided to us by TFI, which allocations may not reflect the costs we will incur for similar services in the future as a stand-alone company; and |
| Ø | our historical financial information does not reflect changes that we expect to incur in the future as a result of our separation from TFI and from reduced economies of scale, including changes in the cost structure, personnel needs, financing and operations of our business. |
Following this offering, we also will be responsible for the additional costs associated with being a public company, including costs related to corporate governance and having listed and registered securities. Therefore, our financial statements may not be indicative of our future performance as a stand-alone public company. For additional information about our past financial performance and the basis of presentation of our financial statements, please see “Summary historical and pro forma financial data,” “Selected historical consolidated financial data,” “Management’s discussion and analysis of financial condition and results of operations” and our financial statements and the notes thereto included elsewhere in this prospectus.
Our recent growth rate may not be indicative of our ability to continue to grow, if at all, in the future.
Our revenues grew to $434 million in the year ended December 31, 2015 from $274 million in the year ended December 31, 2014 and to $131 million for the three months ended March 31, 2016 from $90 million for the three months ended March 31, 2015. It is possible that, in the future, even if our revenues continue to increase, our rate of revenue growth could decline, either because of external factors affecting the growth of our business or because we are not able to scale effectively as we grow. If we cannot manage our growth effectively, it could have a material adverse effect on our business, prospects, results of operations, financial condition or cash flows.
We have a history of losses and may not achieve consistent profitability in the future.
We generated net losses of $20 million and $55 million in the years ended December 31, 2015 and 2014, respectively, and we generated net income of $6 million and $1 million for the three months ended March 31, 2016 and 2015, respectively. As of March 31, 2016, we had an accumulated deficit of $48 million. We will need to generate and sustain increased revenues in future periods in order to remain profitable, and, even if we do, we may not be able to maintain or increase our level of profitability.
As we grow, we expect to continue to expend substantial financial and other resources on:
| Ø | personnel, including significant increases to the total compensation we pay our employees as we grow our employee headcount; |
| Ø | marketing, including expenses relating to increased direct marketing efforts; |
18
Table of Contents
Risk factors
| Ø | product development, including the continued development of our proprietary scoring methodology; |
| Ø | diversification of our funding sources; |
| Ø | office space, as we increase the space we need for our growing employee base; and |
| Ø | general administration, including legal, accounting and other compliance expenses related to being a public company. |
These expenditures are expected to increase and may adversely affect our ability to achieve and sustain profitability as we grow. In addition, we record our provision for loan losses as an expense to account for the possibility that some loans may not be repaid in full. We expect the aggregate amount of loan loss provision to grow as we increase the number and total amount of loans we make to new customers.
Our efforts to grow our business may be more costly than we expect, and we may not be able to increase our revenues enough to offset our higher operating expenses. We may incur losses in the future for a number of reasons, including the other risks described in this prospectus, unforeseen expenses, difficulties, complications and delays and other unknown events. If we are unable to achieve and sustain profitability, the market price of our common stock may significantly decrease.
The consumer lending industry continues to be subjected to new laws and regulations in many jurisdictions that could restrict the consumer lending products and services we offer, impose additional compliance costs on us, render our current operations unprofitable or even prohibit our current operations.
Both state and federal governments in the US and regulatory bodies in the UK may seek to impose new laws, regulatory restrictions or licensing requirements that affect the products or services we offer, the terms on which we may offer them, and the disclosure, compliance and reporting obligations we must fulfill in connection with our lending business. They may also interpret or enforce existing requirements in new ways that could restrict our ability to continue our current methods of operation or to expand operations, impose significant additional compliance costs and may have a negative effect on our business, prospects, results of operations, financial condition or cash flows. In some cases these measures could even directly prohibit some or all of our current business activities in certain jurisdictions, or render them unprofitable or impractical to continue.
In recent years, consumer loans, and in particular the category commonly referred to as “payday loans,” have come under increased regulatory scrutiny that has resulted in increasingly restrictive regulations and legislation that makes offering consumer loans in certain states in the US or the UK less profitable or unattractive. Laws or regulations in some states in the US require that all borrowers of certain short-term loan products be reported to a centralized database and limit the number of loans a borrower may receive or have outstanding. See “—The CFPB has proposed new rules affecting the consumer lending industry, and these or subsequent new rules and regulations may significantly impact our US consumer lending business.”
Certain consumer advocacy groups and federal and state legislators and regulators have advocated that laws and regulations should be tightened so as to severely limit, if not eliminate, some kinds of non-prime loan products and services, and this has resulted in both the executive and legislative branches of the US federal government and state governmental bodies pursuing legislation that could further regulate consumer loan products and services such as those that we offer. The US Congress, as well as state legislatures and other state and federal governmental authorities have debated, and may in the future adopt, legislation or regulations that could, among other things, place a cap (or decrease a current cap) on the interest or fees that we can charge or a cap on the effective annual percentage rate that limits the
19
Table of Contents
Risk factors
amount of interest or fees that may be charged, limit origination fees for loans, require changes to underwriting or collections practices, require short-term lenders to be bonded or require lenders to report consumer loan activity to databases designed to monitor or restrict consumer borrowing activity, impose “cooling off” periods between the time a loan is paid off and another loan is obtained, require an ability to repay analysis before loans can be originated or prohibit us from providing any of our consumer loan products in the US to active duty military personnel, active members of the National Guard or members on active reserve duty and their immediate dependents. For instance, the rules under the Military Lending Act, or “MLA,” were recently amended to restrict the interest rate and other terms that can be offered to certain active duty military personnel and their spouses and dependents. The amended MLA rules became effective on October 1, 2015 and will apply to transactions consummated or established after October 3, 2016 for all credit products subject to the rules except credit cards, which have a later operative date. The MLA, as amended, covers the Elastic and Rise products and will restrict our ability to offer our products to military personnel and their dependents when the amendments become operative in October 2016. Failure to comply with the MLA may limit our ability to collect principal, interest, and fees from borrowers and may result in civil and criminal liability that could harm our business.
Significant new laws and regulations have also been adopted in the UK, and additional new laws and regulations will continue to be imposed. See “—The UK has imposed, and continues to impose, increased regulation of the short-term high-cost credit industry with the stated expectation that some firms will exit the market” below for additional information.
We cannot currently assess the likelihood of any future unfavorable federal, state, local or foreign legislation or regulations being proposed or enacted that could affect the products and services we offer. We closely monitor proposed legislation in jurisdictions where we offer loan products. Additional legislative or regulatory provisions could be enacted that could severely restrict, prohibit or eliminate our ability to offer a consumer loan product. In addition, under statutory authority, US state regulators have broad discretionary power and may impose new licensing requirements, interpret or enforce existing regulatory requirements in different ways or issue new administrative rules, even if not contained in state statutes, that could adversely affect the way we do business and may force us to terminate or modify our operations in particular states or affect our ability to obtain new licenses or renew the licenses we hold.
In order to serve our non-prime customers profitably we need to sufficiently price the risk of the transaction into the annual percentage rate, or “APR,” of our loans. If individual states or the US federal government or regulators in the UK impose rate caps lower than those at which we can operate our current business profitably or otherwise impose stricter limits on non-prime lending, we would need to exit such states or dramatically reduce our rate of growth by limiting our products to customers with higher creditworthiness.
Legislation that would create low rate caps or that would otherwise adversely impact Rise, our installment loan product, is occasionally introduced in the legislatures of some of the states where we have a license to originate loans. If one of the states where we are currently offering or hope in the future to offer Rise loans changes its legislation in a way that would make it difficult or impossible to offer this product at acceptable margins, we may choose to exit the state or alter our expansion plans, which would reduce our revenues and operating margins. A regulatory change that reduces the rate that can be charged in a state or across the US or UK would cause us to reduce the number of customers we serve and/or lead to higher losses as a percentage of revenues and/or higher customer acquisition costs.
Similarly, if Elevate products were required to receive and review additional documentation from consumers such as bank statements, photo identification or pay stubs, this added inconvenience may result in lower consumer applications and loans, which would adversely affect our growth.
20
Table of Contents
Risk factors
Furthermore, legislative or regulatory actions may be influenced by negative perceptions of us and our industry, even if such negative perceptions are inaccurate, attributable to conduct by third parties not affiliated with us (such as other industry members) or attributable to matters not specific to our industry.
Any of these or other legislative or regulatory actions that affect our consumer loan business at the national, state, international and local level could, if enacted or interpreted differently, have a material adverse effect on our business, prospects, results of operations, financial condition or cash flows and prohibit or directly or indirectly impair our ability to continue current operations.
Regulators and payment processors are scrutinizing certain online lenders’ access to the Automated Clearing House system to disburse and collect loan proceeds and repayments, and any interruption or limitation on our ability to access this critical system would materially adversely affect our business.
When making loans in the US, we use the Automated Clearing House, or “ACH,” system to deposit loan proceeds into our customers’ bank accounts. This includes loans that we originate as well as Elastic loans (originated by Republic Bank & Trust Company, or “Republic Bank”) and Rise loans made through the credit services organization, or “CSO,” programs. These products also depend on the ACH system to collect amounts due by withdrawing funds from customers’ bank accounts when the customer has provided authorization to do so. ACH transactions are processed by banks, and if these banks cease to provide ACH processing services or are not allowed to do so, we would have to materially alter, or possibly discontinue, some or all of our business if alternative ACH processors are not available.
It has been reported that actions by the US Department of Justice, or the “Justice Department,” the Federal Deposit Insurance Corporation, or the “FDIC,” and certain state regulators, referred to as Operation Choke Point, appear to be intended to discourage banks and ACH payment processors from providing access to the ACH system for certain short-term consumer loan providers that they believe are operating illegally, cutting off their access to the ACH system to either debit or credit customer accounts (or both). According to published reports, the Justice Department issued subpoenas to banks and payment processors and the FDIC and other regulators were reported to have used bank oversight examinations to discourage banks from providing access to the ACH system to certain online lenders. In August 2013, the Department of Financial Services of the State of New York, or the “NYDFS,” sent letters to approximately 35 online short-term consumer loan companies (which did not include us as we do not offer consumer loans in New York) demanding that they cease and desist offering illegal payday loans to New York consumers and also sent letters to over 100 banks, as well as the National Automated Clearing House Association, or “NACHA,” which oversees the ACH network, requesting that they work with the NYDFS to cut off ACH system access to New York customer accounts for illegal payday lenders. NACHA, in turn, requested that its participants review origination activity for these 35 online short-term consumer loan companies and advise NACHA whether it had terminated these lenders’ access to the ACH system or, if not, the basis for not doing so. NACHA also requested that participants review ACH origination activities related to other online loan companies and that participants terminate any ACH system access that would violate NACHA rules, which would include, according to NACHA, any authorizations to use the ACH system to pay illegal short-term consumer loans that are unenforceable under state law. Maryland’s Division of Financial Regulation has also been reported to have taken steps to stop banks in Maryland from processing illegal payday loans in its state, and the California Department of Business Oversight is reported to have similarly directed state-licensed banks and credit unions to monitor transactions with any unlicensed lenders.
This heightened regulatory scrutiny by the Justice Department, the FDIC and other regulators has caused some banks and ACH payment processors to cease doing business with consumer lenders who are
21
Table of Contents
Risk factors
operating legally, without regard to whether those lenders are complying with applicable laws, simply to avoid the risk of heightened scrutiny or even litigation. These actions have reduced the number of banks and payment processors who provide ACH payment processing services and could conceivably make it increasingly difficult to find banking partners and payment processors in the future and/or lead to significantly increased costs for these services. If we are unable to maintain access to needed services on favorable terms, we would have to materially alter, or possibly discontinue, some or all of our business if alternative processors are not available.
Furthermore, NACHA announced certain rule amendments effective September 18, 2015, which reduced the return rate threshold for unauthorized debit entries and established an inquiry process for administrative and over all debit return rates. Return rates in excess of the guidelines prescribed by the rule may trigger an inquiry and review process by NACHA.
If we lost access to the ACH system because our payment processor was unable or unwilling to access the ACH system on our behalf we would experience a significant reduction in customer loan payments. Although we would notify consumers that they would need to make their loan payments via physical check, debit card, or other method of payment a large number of customers would likely go into default because they are expecting automated payment processing. Similarly, if regulatory changes limited our access to the ACH system or reduced the number of times ACH transactions could be re-presented, we would experience higher losses.
If the information provided by customers to us is incorrect or fraudulent, we may misjudge a customer’s qualification to receive a loan, and any inability to effectively identify, manage, monitor and mitigate fraud risk on a large scale could cause us to incur substantial losses, and our operating results, brand and reputation could be harmed.
For the loans we originate through Rise and Sunny, our growth is largely predicated on effective loan underwriting resulting in acceptable customer profitability. This is equally important for the Rise loans in Texas and Ohio and the Elastic lines of credit originated by unaffiliated third parties. See “Management’s discussion and analysis of financial condition and results of operations—Components of Our Results of Operations—Revenues.” Lending decisions by such originating lenders are made using our proprietary credit and fraud scoring models, which we license to them. Lending decisions are based partly on information provided by loan applicants. To the extent that these applicants provide information in a manner that is unverifiable, the credit score delivered by our proprietary scoring methodology may not accurately reflect the associated risk. In addition, data provided by third party sources is a significant component of the decision methodology and this data may contain inaccuracies. Our resources, technologies and fraud prevention tools, which are used to originate loans or lines of credit, as applicable, under Rise, Sunny and Elastic, may be insufficient to accurately detect and prevent fraud. Inaccurate analysis of credit data that could result from false loan application information could harm our reputation, business and operating results.
In addition, our proprietary credit and fraud scoring models use identity and fraud checks analyzing data provided by external databases to authenticate each customer’s identity. The level of our fraud charge-offs and results of operations could be materially adversely affected if fraudulent activity were to significantly increase. Online lenders are particularly subject to fraud because of the lack of face-to-face interactions and document review. If applicants assume false identities to defraud the company or consumers simply have no intent to repay the money they have borrowed the related portfolio of loans will exhibit higher loan losses. We have in the past and may in the future incur substantial losses and our business operations could be disrupted if we or the originating lenders are unable to effectively identify,
22
Table of Contents
Risk factors
manage, monitor and mitigate fraud risk using our proprietary credit and fraud scoring models. In the three months ended June 30, 2015, we made changes to our fraud control environment in connection with a new marketing strategy that we were testing, which, when combined with certain factors, including certain staffing constraints, had unintended consequences resulting in certain fraudulent loans being originated. We increased our reserve for loan losses by $6 million in the six months ended June 30, 2015 as a result of these loans. We believe we have identified and, by improving our control environment and hiring additional staff, remediated the root causes of the vulnerability that principally contributed to this instance of fraud.
Since fraud is perpetrated by increasingly sophisticated individuals and “rings” of criminals, it is important for us to continue to update and improve the fraud detection and prevention capabilities of our proprietary credit and fraud scoring models. If these efforts are unsuccessful then credit quality and customer profitability will erode. If credit and/or fraud losses increased significantly due to inadequacies in underwriting or new fraud trends, new customer originations may need to be reduced until credit and fraud losses returned to target levels, and business could contract.
It may be difficult or impossible to recoup funds underlying loans made in connection with inaccurate statements, omissions of fact or fraud. Loan losses are currently the largest cost as a percentage of revenues across each of Rise, Sunny and Elastic. If credit or fraud losses were to rise, this would significantly reduce our profitability. High profile fraudulent activity could also lead to regulatory intervention, negatively impact our operating results, brand and reputation and require us, and the originating lenders, to take steps to reduce fraud risk, which could increase our costs.
Any of the above risks could have a material adverse effect on our business, prospects, results of operations, financial condition or cash flows.
Because of the non-prime nature of our customers, we have historically experienced a high rate of net charge-offs as a percentage of revenues, and our ability to price appropriately in response to this and other factors is essential. We rely on our proprietary credit and fraud scoring models in the forecasting of loss rates. If we are unable to effectively forecast loss rates, it may negatively impact our operating results.
Our net charge-offs as a percentage of revenues for the years ended December 31, 2015 and 2014 and for the three months ended March 31, 2016 were 49%, 51% and 53%, respectively. Because of the non-prime nature of our customers, it is essential that our products are appropriately priced, taking this and all other relevant factors into account. In making a decision whether to extend credit to prospective customers, and the terms on which we or the originating lenders are willing to provide credit, including the price, we and the originating lenders rely heavily on our proprietary credit and fraud scoring models, which comprise an empirically derived suite of statistical models built using third party data, data from customers and our credit experience gained through monitoring the performance of customers over time. Our proprietary credit and fraud scoring models are based on previous historical experience. Typically, however, our models will become less effective over time and need to be rebuilt regularly to perform optimally. This is particularly true in the context of our preapproved direct mail campaigns. If we are unable to rebuild our proprietary credit and fraud scoring models, or if they do not perform up to target standards the products will experience increasing defaults or higher customer acquisition costs.
Our proprietary credit and fraud scoring models are also highly reliant on access to third party data sources. If these data sources are not available at the time of credit decisions or if the companies that have aggregated this data are no longer able or willing to provide this data to us, our products will experience higher defaults or higher customer acquisition costs. Similarly, if the data becomes corrupted
23
Table of Contents
Risk factors
in some fashion or is improperly processed by our underwriting systems we, and the originating lenders, will experience reduced underwriting accuracy and consequently higher defaults or customer acquisition costs.
If our proprietary credit and fraud scoring models fail to adequately predict the creditworthiness of customers, or if they fail to assess prospective customers’ financial ability to repay their loans, or if any portion of the information pertaining to the prospective customer is false, inaccurate or incomplete, and our systems do not detect such falsities, inaccuracies or incompleteness, or any or all of the other components of the credit decision process described herein fails, higher than forecasted losses may result. Furthermore, if we are unable to access the third party data used in our proprietary credit and fraud scoring models, or access to such data is limited, the ability to accurately evaluate potential customers using our proprietary credit and fraud scoring models will be compromised, and we may be unable to effectively predict probable credit losses inherent in the resulting loan portfolio, which could have a material adverse effect on our business, prospects, results of operations, financial condition or cash flows.
Additionally, if we make errors in the development and validation of any of the models or tools used to underwrite loans, such loans may result in higher delinquencies and losses. Moreover, if future performance of customer loans differs from past experience, which experience has informed the development of our proprietary credit and fraud scoring models, delinquency rates and losses could increase.
If our proprietary credit and fraud scoring models were unable to effectively price credit to the risk of the customer, lower margins would result. Either our losses would be higher than anticipated due to “underpricing” products or customers may refuse to accept the loan if products are perceived as “overpriced.” Additionally, an inability to effectively forecast loss rates could also inhibit our ability to borrow from our debt facilities, which could further hinder our growth and have a material adverse effect on our business, prospects, results of operations, financial condition or cash flows.
We currently depend on debt financing to finance most of the loans we originate. Our business could be adversely affected by a lack of sufficient debt financing at acceptable prices or disruptions in the credit markets, which could reduce our access to credit.
We primarily rely on debt financing to support the growth of our originated portfolios, Rise and Sunny. However, we cannot guarantee that financing will continue to be available beyond the current maturity date of our debt facilities, on reasonable terms or at all. Presently our debt financing for Rise and Sunny comes from a single source, Victory Park Management, LLC, or “VPC,” an affiliate of Victory Park Capital. If VPC became unwilling or unable to provide debt financing to us at prices acceptable to us we would need to secure additional debt financing or reduce loan originations significantly. As the volume of loans that we make to customers increases, we may require the expansion of our borrowing capacity on our existing debt facilities or the addition of new sources of capital. For example, on December 16, 2015, we and VPC entered into an amendment to our debt facility to increase the maximum loan to value ratio for purposes of certain covenants and calculating the borrowing base for the December 31, 2015 testing date due to an increased volume of loans. The availability of these financing sources depends on many factors, some of which are outside of our control.
We may also experience the occurrence of events of default or breaches of financial or performance covenants under our debt agreements, which are currently secured by all our assets. Any such occurrence or breach could result in the reduction or termination of our access to institutional funding or increase our cost of funding. Certain of these covenants are tied to our customer default rates, which may be
24
Table of Contents
Risk factors
significantly affected by factors, such as economic downturns or general economic conditions beyond our control and beyond the control of individual customers. In particular, loss rates on customer loans may increase due to factors such as prevailing interest rates, the rate of unemployment, the level of consumer and business confidence, commercial real estate values, the value of the US dollar, energy prices, changes in consumer and business spending, the number of personal bankruptcies, disruptions in the credit markets and other factors. Increases in the cost of capital would reduce our net profit margins.
Similarly, the loan portfolio for Elastic, which is originated by a third-party lender, gets funding as a result of the purchase of a participation interest in the loans it originates from Elastic SPV, Ltd., or “Elastic SPV,” a Cayman Islands entity that purchases such participations. Elastic SPV has a loan facility with VPC for its funding, for which we provide credit support, and we have entered into a credit default swap facility with Elastic SPV that provides protection for loan losses. A voluntary or involuntary halt to this program would result in the originating lender halting further loan originations until a new financing partner could be identified.
In the event of a sudden or unexpected shortage of funds in the banking system, we cannot be sure that we will be able to maintain necessary levels of funding without incurring high funding costs, a reduction in the term of funding instruments or the liquidation of certain assets. If we were to be unable to arrange new or alternative methods of financing on favorable terms, we may have to curtail our origination of loans or recommend that the originating lenders curtail their origination of credit, which could have a material adverse effect on our business, prospects, results of operations, financial condition or cash flows.
In the future, we may seek to access the debt capital markets to obtain capital to finance growth. However, our future access to the debt capital markets could be restricted due to a variety of factors, including a deterioration of our earnings, cash flows, balance sheet quality, or overall business or industry prospects, adverse regulatory changes, a disruption to or deterioration in the state of the capital markets or a negative bias toward our industry by market participants. Disruptions and volatility in the capital markets could also cause banks and other credit providers to restrict availability of new credit. Due to the negative bias toward our industry, commercial banks and other lenders have restricted access to available credit to participants in our industry, and we may have more limited access to commercial bank lending than other businesses. Our ability to obtain additional financing in the future will depend in part upon prevailing capital market conditions, and a potential disruption in the capital markets may adversely affect our efforts to arrange additional financing on terms that are satisfactory to us, if at all. If adequate funds are not available, or are not available on acceptable terms, we may not have sufficient liquidity to fund our operations, make future investments, take advantage of acquisitions or other opportunities, or respond to competitive challenges and this, in turn, could adversely affect our ability to advance our strategic plans. Additionally, if the capital and credit markets experience volatility, and the availability of funds is limited, third parties with whom we do business may incur increased costs or business disruption and this could adversely affect our business relationships with such third parties, which could have a material adverse effect on our business, prospects, results of operations, financial condition or cash flows.
Any decrease in our access to preapproved marketing lists from credit bureaus or other developments impacting our use of direct mail marketing could adversely affect our ability to grow our business.
We market Rise and Sunny and provide marketing services to the originating lender in connection with Elastic. Direct mailings of preapproved loan offers to potential loan customers comprise one of the most important marketing channels for both the loans we originate, as well as those originated by third-party
25
Table of Contents
Risk factors
lenders. We estimate that approximately 52% and 100% of new Rise and Elastic loan customers, respectively, in the year ended December 31, 2015 obtained loans as a result of receiving such preapproved loan offers. Our marketing techniques identify candidates for preapproved loan mailings in part through the use of preapproved marketing lists purchased from credit bureaus. If access to such preapproved marketing lists were lost or limited due to regulatory changes prohibiting credit bureaus from sharing such information or for other reasons, our growth could be significantly adversely affected. If the cost of obtaining such lists increases significantly, it could substantially increase customer acquisition costs and decrease profitability.
Similarly, federal or state regulators or legislators could limit access to these preapproved marketing lists with the same effect.
In addition, preapproved direct mailings may become a less effective marketing tool due to over-penetration of direct mailing lists. Any of these developments could have a material adverse effect on our business, prospects, results of operations, financial condition or cash flows.
We rely in part on relationships with marketing affiliates to originate our loans. These relationships are generally non-exclusive and subject to termination, and the growth of our customer base could be adversely affected if any of our marketing affiliate relationships are terminated or the number of referrals we receive from marketing affiliates is reduced.
We rely on strategic marketing affiliate relationships with certain companies for referrals of some of the customers to whom we issue loans, and our growth depends in part on the growth of these referrals. In 2015, loans issued to Rise customers referred to us by our strategic partners constituted 13% of total Rise loan originations. Additionally, in 2015, loans issued to Sunny customers through strategic partners constituted 26% of total Sunny loan originations. Many of our marketing affiliate relationships do not contain exclusivity provisions that would prevent such marketing affiliates from providing customer referrals to competing companies. In addition, the agreements governing these partnerships, generally, contain termination provisions, including provisions that in certain circumstances would allow our partners to terminate if convenient, that, if exercised, would terminate our relationship with these partners. These agreements also contain no requirement that a marketing affiliate refer us any minimum number of customers. There can be no assurance that these marketing affiliates will not terminate our relationship with them or continue referring business to us in the future, and a termination of any of these relationships or reduction in customer referrals to us could have a material adverse effect on our business, prospects, results of operations, financial condition or cash flows.
Our success and future growth depend significantly on our successful marketing efforts, and if such efforts are not successful, our business and financial results may be harmed.
We intend to continue to dedicate significant resources to marketing efforts, including for the Elastic product, particularly as we continue to grow, introduce new loan products and expand into new states. Our ability to attract qualified borrowers depends in large part on the success of these marketing efforts and the success of the marketing channels we use to promote our products. Our marketing channels include social media and the press, online affiliations, search engine optimization, search engine marketing, offline partnerships, preapproved direct mailings and television advertising. If any of our current marketing channels become less effective, if we are unable to continue to use any of these channels, if the cost of using these channels were to significantly increase or if we are not successful in generating new channels, we may not be able to attract new borrowers in a cost-effective manner or
26
Table of Contents
Risk factors
convert potential borrowers into active borrowers. If we are unable to recover our marketing costs through increases in website traffic and in the number of loans made by visitors to product websites, or if we discontinue our broad marketing campaigns, it could have a material adverse effect on our business, prospects, results of operations, financial condition or cash flows.
We are dependent on third parties to support several key aspects of our business, and the failure of such parties to continue to provide services to us in the current manner and at the current rates would adversely affect our revenues and results of operations.
The Elastic line of credit product, which is originated by a third-party lender and contributed approximately 5.6% of our revenues for the year ended December 31, 2015, and the portions of the Rise installment loan product that we offer through CSO programs, which contributed approximately 14.1% of our revenues for the year ended December 31, 2015, depend in part on the willingness and ability of unaffiliated third party lenders to make loans to customers. Additionally, as described above, our business, including our Elastic loans and Rise loans made through the CSO programs, depends on the ACH system, and ACH transactions are processed by third-party banks. See “—Regulators and payment processors are scrutinizing certain online lenders’ access to the Automated Clearing House system to disburse and collect loan proceeds and repayments, and any interruption or limitation on our ability to access this critical system would materially adversely affect our business.” We also utilize many other third parties to provide services to facilitate lending, loan underwriting, payment processing, customer service, collections and recoveries, as well as to support and maintain certain of our communication systems and information systems.
The loss of the relationship with any of these third party lenders and service providers, and an inability to replace them or the failure of any of these third parties to provide its products or services, to maintain its quality and consistency or to have the ability to provide its products and services, could disrupt our operations, cause us to terminate product offerings, result in lost customers and substantially decrease the revenues and earnings of our business. Our revenues and earnings could also be adversely affected if any of those third party providers make material changes to the products or services that we rely on or increase the price of their products or services.
Elevate uses third parties for the majority of its collections and recovery activities. If those parties were unable or unwilling to provide those services for Elevate products we would experience higher defaults until those functions could be outsourced to an alternative service provider or until we could bring those functions in-house and adequately staff and train internally.
Any of these events could result in a loss of revenues and could have a material adverse effect on our business, prospects, results of operations, financial condition or cash flows.
The profitability of the line of credit product we offer, Elastic, could be adversely affected by policy or pricing decisions made by the originating lender.
We do not originate and do not ultimately control the pricing or functionality of Elastic, the line of credit product we offer. Instead, Republic Bank, which originates the loans, has licensed our technology and underwriting services and makes all key decisions regarding Elastic marketing, underwriting, product features and pricing. We generate revenues from the Elastic product through marketing and technology licensing fees paid by Republic Bank, and through a credit default swap agreement we entered into with Elastic SPV, which purchases participations in Elastic loans from Republic Bank. If Republic Bank changes its pricing, underwriting or marketing of Elastic in a way that decreases revenues or increases losses, then the profitability of each loan could be reduced. Although this would not reduce the revenues that we receive for marketing and technology licensing services, it would reduce the revenues that we receive from our credit default swap agreement with Elastic SPV.
27
Table of Contents
Risk factors
Any of the above changes could have a material adverse effect on our business, prospects, results of operations, financial condition or cash flows.
Our ability to continue to offer Elastic would be adversely affected by a degradation in our relationship with Republic Bank.
The structure of the Elastic product exposes us to risks associated with being reliant on Republic Bank as the originating lender. If our relationship with Republic Bank were to degrade, or if Republic Bank were to terminate the various agreements associated with the Elastic product, we may not be able to find another suitable originating lender and new arrangements, if any, may result in significantly increased costs to us. Because line of credit products are relatively more difficult to establish under state law, any inability to find another originating lender would adversely affect our ability to continue to offer Elastic, which in turn could have a material adverse effect on our business, prospects, results of operations, financial condition or cash flows.
Decreased demand for non-prime loans as a result of increased savings or income could result in a loss of revenues or decline in profitability if we are unable to successfully adapt to such changes.
The demand for non-prime loan products in the markets we serve could decline due to a variety of factors, such as regulatory restrictions that reduce customer access to particular products, the availability of competing or alternative products or changes in customers’ financial conditions, particularly increases in income or savings. For instance, an increase in state or federal minimum wage requirements could decrease demand for non-prime loans. Additionally, a change in focus from borrowing to saving (such as has happened in some countries) would reduce demand. Should we fail to adapt to a significant change in our customers’ demand for, or access to, our products, our revenues could decrease significantly. Even if we make adaptations or introduce new products to fulfill customer demand, customers may resist or may reject products whose adaptations make them less attractive or less available. Such decreased demand could have a material adverse effect on our business, prospects, results of operations, financial condition or cash flows.
A decline in economic conditions could result in decreased demand for our loans or cause our customers’ default rates to increase, harming our operating results.
Uncertainty and negative trends in general economic conditions in the US and abroad, including significant tightening of credit markets and a general decline in the value of real property, historically have created a difficult environment for companies in the lending industry. Many factors, including factors that are beyond our control, may impact our consolidated results of operations or financial condition or affect our borrowers’ willingness or capacity to make payments on their loans. These factors include: unemployment levels, housing markets, rising living expenses, energy costs and interest rates, as well as major medical expenses, divorce or death that affect our borrowers. If we experience an economic downturn or if the US economy is unable to sustain its recovery from the most recent financial crisis, or if we become affected by other events beyond our control, we may experience a significant reduction in revenues, earnings and cash flows, difficulties accessing capital and a deterioration in the value of our investments. We may also become exposed to increased credit risk from customers and third parties who have obligations to us or to the originating lenders with respect to Elastic, or Rise, as it relates to the loans in Texas and Ohio. Moreover, non-prime borrowers have historically been and will likely continue to be more severely affected by adverse macroeconomic conditions.
Credit quality is driven by the ability and willingness of customers to make their loan payments. If customers face rising unemployment or reduced wages, defaults may increase. Similarly, if customers
28
Table of Contents
Risk factors
experience rising living expenses (for instance due to rising gas, energy, or food costs) they may be unable to make loan payments. An economic slowdown could also result in a decreased number of loans being made to customers due to higher unemployment or an increase in loan defaults in our loan products. The underwriting standards used for our products may need to be tightened in response to such conditions, which would likely reduce loan balances, and collecting defaulted loans could become more difficult, which could lead to an increase in loan losses. If a customer defaults on a loan, the loan enters a collections process where, including as a result of contractual agreements with the originating lenders, our systems and collections teams initiate contact with the customer for payments owed. If a loan is subsequently charged off, the loan is generally sold to a third party collection agency and the resulting proceeds from such sales comprise only a small fraction of the remaining amount payable on the loan.
There can be no assurance that economic conditions will remain favorable for our business or that demand for loans or default rates by customers will remain at current levels. Reduced demand for loans would negatively impact our growth and revenues, while increased default rates by customers may inhibit our access to capital, hinder the growth of the loan portfolio attributable to our products and negatively impact our profitability. Either such result could have a material adverse effect on our business, prospects, results of operations, financial condition or cash flows.
We are operating in a highly competitive environment and face increasing competition from a variety of traditional and new lending institutions, including other online lending companies. This competition could adversely affect our business, prospects, results of operations, financial condition or cash flows.
We have many competitors. Our principal competitors are consumer loan companies, CSOs, online lenders, credit card companies, consumer finance companies, pawnshops and other financial institutions that offer similar financial services. Many other financial institutions or other businesses that do not now offer products or services directed toward our traditional customer base could begin doing so. Significant increases in the number and size of competitors for our business could result in a decrease in the number of loans that we fund, resulting in lower levels of revenues and earnings in these categories. Many of these competitors are larger than us, have significantly more resources and greater brand recognition than we do, and may be able to attract customers more effectively than we do.
Competitors of our business may operate, or begin to operate, under business models less focused on legal and regulatory compliance, which could put us at a competitive disadvantage. Additionally, negative perceptions about these models could cause legislators or regulators to pursue additional industry restrictions that could affect the business model under which we operate. To the extent that these models gain acceptance among consumers, small businesses and investors or face less onerous regulatory restrictions than we do, we may be unable to replicate their business practices or otherwise compete with them effectively, which could cause demand for the products we currently offer to decline substantially.
When new competitors seek to enter one of our markets, or when existing market participants seek to increase their market share, they sometimes undercut the pricing and/or credit terms prevalent in that market, which could adversely affect our market share or ability to exploit new market opportunities. Elevate products compete at least partly based on rate comparison with other credit products used by non-prime consumers. However, non-prime consumers by definition have a higher propensity for default and as a result need to be charged higher rates of interest to generate adequate profit margins. If existing competitors significantly reduced their rates or lower priced competitors enter the market and offer credit to customers at a lower rates, the pricing and credit terms we or the originating lenders offer could deteriorate if we or the originating lenders act to meet these competitive challenges. Any such action may result in lower customer acquisition volumes and higher costs per new customer.
29
Table of Contents
Risk factors
“Near-prime” competitors may aggressively target customers with lower rate offers. The number of “prime” oriented technology-enabled lenders has grown dramatically following the success of providers such as Lending Club and Prosper. Although these new entrants have largely focused on higher FICO score customers, if a well-funded new entrant targeted “near-prime” consumers with lower rate loans, the overall credit quality of the portfolio of loans attributable to our products could erode, with the better quality consumers migrating to new products.
We may be unable to compete successfully against any or all of our current or future competitors. As a result, our products could lose market share and our revenues could decline, thereby affecting our ability to generate sufficient cash flow to service our indebtedness and fund our operations. Any such changes in our competition could have a material adverse effect on our business, prospects, results of operations, financial condition or cash flows.
Customer complaints or negative public perception of our business could result in a decline in our customer growth and our business could suffer.
Our reputation is very important to attracting new customers to our platform as well as securing repeat lending to existing customers. While we believe that we have a good reputation and that we provide customers with a superior experience, there can be no assurance that we will continue to maintain a good relationship with customers or avoid negative publicity.
In recent years, consumer advocacy groups and some media reports have advocated governmental action to prohibit or place severe restrictions on short-term and high-cost consumer loans. Such consumer advocacy groups and media reports generally focus on the annual percentage rate for this type of consumer loan, which is compared unfavorably to the interest typically charged by banks to consumers with top-tier credit histories. The finance charges assessed by us, the originating lenders and others in the industry can attract media publicity about the industry and be perceived as controversial. If the negative characterization of the types of loans we offer, including those originated through third-party lenders, becomes increasingly accepted by consumers, demand for any or all of our consumer loan products could significantly decrease, which could materially affect our business, prospects, results of operations, financial condition or cash flows. Additionally, if the negative characterization of these types of loans is accepted by legislators and regulators, we could become subject to more restrictive laws and regulations applicable to consumer loan products that could have a material adverse effect on our business, prospects, results of operations, financial condition or cash flows.
In addition, our ability to attract and retain customers is highly dependent upon the external perceptions of our level of service, trustworthiness, business practices, financial condition and other subjective qualities. Negative perceptions or publicity regarding these matters—even if related to seemingly isolated incidents, or even if related to practices not specific to short-term loans, such as debt collection—could erode trust and confidence and damage our reputation among existing and potential customers, which would make it difficult to attract new customers and retain existing customers, significantly decrease the demand for our products, result in increased regulatory scrutiny, and have a material adverse effect on our business, prospects, results of operations, financial condition or cash flows.
30
Table of Contents
Risk factors
Our business depends on the uninterrupted operation of our systems and business functions, including our information technology and other business systems, as well as the ability of such systems to support compliance with applicable legal and regulatory requirements.
Our business is highly dependent upon customers’ ability to access our website and the ability of our employees and those of the originating lenders, as well as third party service providers, to perform, in an efficient and uninterrupted fashion, necessary business functions, such as internet support, call center activities and processing and servicing of loans. Problems with the IQ Technology Platform running our systems, or a shut-down of or inability to access the facilities in which our internet operations and other technology infrastructure are based, such as a power outage, a failure of one or more of our information technology, telecommunications or other systems, cyber-attacks on, or sustained or repeated disruptions of, such systems could significantly impair our ability to perform such functions on a timely basis and could result in a deterioration of our ability to underwrite, approve and process loans (or support such functions with regard to Elastic lines of credit), provide customer service, perform collections activities, or perform other necessary business functions. Any such interruption could reduce new customer acquisition and negatively impact growth, which would have a material adverse effect on our business, prospects, results of operations, financial condition or cash flows.
In addition, our systems and those of third parties on whom we rely must consistently be capable of compliance with applicable legal and regulatory requirements and timely modification to comply with new or amended requirements. Any systems problems going forward could have a material adverse effect on our business, prospects, results of operations, financial condition or cash flows.
We are subject to cybersecurity risks and security breaches and may incur increasing costs in an effort to minimize those risks and to respond to cyber incidents.
Our business involves the storage and transmission of consumers’ proprietary information, and security breaches could expose us to a risk of loss or misuse of this information, litigation and potential liability. We are entirely dependent on the secure operation of our websites and systems as well as the operation of the internet generally. While we have incurred no material cyber-attacks or security breaches to date, a number of other companies have disclosed cyber-attacks and security breaches, some of which have involved intentional attacks. Attacks may be targeted at us, our customers, or both. Although we devote significant resources to maintain and regularly upgrade our systems and processes that are designed to protect the security of our computer systems, software, networks and other technology assets and the confidentiality, integrity and availability of information belonging to us and our customers, our security measures may not provide absolute security. Despite our efforts to ensure the integrity of our systems, it is possible that we may not be able to anticipate or to implement effective preventive measures against all security breaches of these types, especially because the techniques used change frequently or are not recognized until launched, and because cyber-attacks can originate from a wide variety of sources, including third parties outside the company such as persons who are involved with organized crime or associated with external service providers or who may be linked to terrorist organizations or hostile foreign governments. These risks may increase in the future as we continue to increase our mobile and other internet-based product offerings and expand our internal usage of web-based products and applications or expand into new countries. If an actual or perceived breach of security occurs, customer and/or supplier perception of the effectiveness of our security measures could be harmed and could result in the loss of customers, suppliers or both. Actual or anticipated attacks and risks may cause us to incur increasing costs, including costs to deploy additional personnel and protection technologies, train employees, and engage third party experts and consultants.
31
Table of Contents
Risk factors
A successful penetration or circumvention of the security of our systems could cause serious negative consequences, including significant disruption of our operations, misappropriation of our confidential information or that of our customers, or damage to our computers or systems or those of our customers and counterparties, and could result in violations of applicable privacy and other laws, financial loss to us or to our customers, loss of confidence in our security measures, customer dissatisfaction, significant litigation exposure, and harm to our reputation, all of which could have a material adverse effect on us. In addition, our applicants provide personal information, including bank account information when applying for loans. We rely on encryption and authentication technology licensed from third parties to provide the security and authentication to effectively secure transmission of confidential information, including customer bank account and other personal information. Advances in computer capabilities, new discoveries in the field of cryptography or other developments may result in the technology used by us to protect transaction data being breached or compromised. Data breaches can also occur as a result of non-technical issues.
Our servers are also vulnerable to computer viruses, physical or electronic break-ins, and similar disruptions, including “denial-of-service” type attacks. We may need to expend significant resources to protect against security breaches or to address problems caused by breaches. Security breaches, including any breach of our systems or by persons with whom we have commercial relationships that result in the unauthorized release of consumers’ personal information, could damage our reputation and expose us to a risk of loss or litigation and possible liability. In addition, many of the third parties who provide products, services or support to us could also experience any of the above cyber risks or security breaches, which could impact our customers and our business and could result in a loss of customers, suppliers or revenues.
Any of these events could have a material adverse effect on our business, prospects, results of operations, financial condition or cash flows.
Our ability to collect payment on loans and maintain accurate accounts may be adversely affected by computer viruses, physical or electronic break-ins, technical errors and similar disruptions.
The automated nature of our platform may make it an attractive target for hacking and potentially vulnerable to computer viruses, physical or electronic break-ins and similar disruptions. Despite efforts to ensure the integrity of our platform, it is possible that we may not be able to anticipate or to implement effective preventive measures against all security breaches of these types, in which case there would be an increased risk of fraud or identity theft, and we may experience losses on, or delays in the collection of amounts owed on, a fraudulently induced loan. In addition, the software that we have developed to use in our daily operations is highly complex and may contain undetected technical errors that could cause our computer systems to fail. Because each loan made involves our proprietary credit and fraud scoring models, and over 90% of loan applications are fully automated with no manual review required, any failure of our computer systems involving our proprietary credit and fraud scoring models and any technical or other errors contained in the software pertaining to our proprietary credit and fraud scoring models could compromise the ability to accurately evaluate potential customers, which would negatively impact our results of operations. Furthermore, any failure of our computer systems could cause an interruption in operations and result in disruptions in, or reductions in the amount of, collections from the loans we made to customers. If any of these risks were to materialize, it could have a material adverse effect on our business, prospects, results of operations, financial condition or cash flows.
32
Table of Contents
Risk factors
Our platform and internal systems rely on software that is highly technical, and if it contains undetected errors, our business could be adversely affected.
Our platform and internal systems rely on software that is highly technical and complex. In addition, our platform and internal systems depend on the ability of such software to store, retrieve, process and manage immense amounts of data. The software on which we rely has contained, and may now or in the future contain, undetected errors or bugs. Some errors may only be discovered after the code has been released for external or internal use. Errors or other design defects within the software on which we rely may result in a negative experience for borrowers, delay introductions of new features or enhancements, result in errors or compromise our ability to protect borrower data or our intellectual property. Any errors, bugs or defects discovered in the software on which we rely could result in harm to our reputation, loss of borrowers, loss of revenues or liability for damages, any of which could have a material adverse effect on our business, prospects, results of operations, financial condition or cash flows.
Security breaches of customers’ confidential information that we store may harm our reputation and expose us to liability.
We store customers’ bank information, credit information and other sensitive data. Any accidental or willful security breaches or other unauthorized access could cause the theft and criminal use of this data. Security breaches or unauthorized access to confidential information could also expose us to liability related to the loss of the information, time-consuming and expensive litigation and negative publicity. If security measures are breached because of third party action, employee error, malfeasance or otherwise, or if design flaws in our software are exposed and exploited, and, as a result, a third party obtains unauthorized access to customer data, our relationships with customers will be severely damaged, and we could incur significant liability.
Because techniques used to obtain unauthorized access or to sabotage systems change frequently and generally are not recognized until they are launched against a target, we and our third party hosting facilities may be unable to anticipate these techniques or to implement adequate preventative measures. In addition, many states have enacted laws requiring companies to notify individuals of data security breaches involving their personal data. These mandatory disclosures regarding a security breach are costly to implement and often lead to widespread negative publicity, which may cause customers to lose confidence in the effectiveness of our data security measures. Any security breach, whether actual or perceived, would harm our reputation, and result in lost customers, which could in turn have a material adverse effect on our business, prospects, results of operations, financial condition or cash flows.
Credit and other information that we receive from third parties about a borrower may be inaccurate or may not accurately reflect the borrower’s creditworthiness, which may cause us to inaccurately underwrite loans.
We obtain credit information from consumer reporting agencies, such as TransUnion, Experian or Equifax, and underwrite Rise and Sunny loans based on our proprietary credit and fraud scoring models. Originating lenders use our proprietary credit and fraud scoring models in underwriting Elastic lines of credit and Rise loans in Texas and Ohio. Our proprietary credit and fraud scoring models take into account reported credit score, other information reported by consumer reporting agencies and the requested loan amount, in addition to a variety of other factors.
33
Table of Contents
Risk factors
A credit score assigned to a borrower may not reflect that borrower’s actual creditworthiness because the credit score may be based on outdated, incomplete or inaccurate consumer reporting data, and we do not verify the information obtained from the borrower’s credit report. Additionally, there is a risk that, following the date of the credit report that we obtain and review, a borrower may have:
| Ø | become past due in the payment of an outstanding obligation; |
| Ø | defaulted on a pre-existing debt obligation; |
| Ø | taken on additional debt; or |
| Ø | sustained other adverse financial events. |
If large numbers of borrowers default on loans that are not decisioned correctly, this could have a material adverse effect on our business, prospects, results of operations, financial condition or cash flows.
To date, we have derived our revenues from a limited number of products and markets. Our efforts to expand our market reach and product portfolio may not succeed, may put pressure on our margins and may reduce our revenue growth.
We originate Rise installment loans in the US, other than in Texas and Ohio, and Sunny installment loans in the UK. We earn revenues associated with the Rise loans originated by third-party lenders in Texas and Ohio, which we guarantee, and consolidate revenues attributable to purchased participations in Elastic lines of credit, which are also originated by a third-party lender, through a credit default swap agreement. Many of our competitors offer a more diverse set of products to small businesses and in additional international markets. While we intend to eventually broaden the scope of the products from which we derive revenues, there can be no assurance that we will be successful in such efforts.
When new customers are acquired, from an accounting point of view, we must recognize marketing costs and loan origination and data costs, and we incur a provision for loan losses, including with regard to Elastic loan participations that are purchased from the originating lender by a third party, which we protect from loan losses pursuant to a credit default swap arrangement. Hence, new customer acquisition does not typically yield positive margins for at least six months. As a result, rapid growth tends to compress margins in the near-term until growth rates slow down.
Rise, a state-licensed product, offers different rates and terms based on state law. In states with lower maximum rates we have more stringent credit criteria and generally lower initial customer profitability due to higher customer acquisition costs and higher losses as a percentage of revenues. While these states can have significant growth potential they typically deliver lower profit margins.
In order to support the rapid growth of the company we may need to hire more staff which would increase operating expenses. In particular, growth may require additional technology staff, analysts in risk management, compliance personnel and customer support and collections staff. Although the company outsources most of its customer support and collections staff, additional volumes would lead to increased costs in these areas.
We may elect to pursue aggressive growth over margin expansion in order to increase market share and long-term revenue opportunities.
Failure to broaden the scope of the products we offer to potential customers may inhibit the growth of repeat business from our customers and harm our operating results. There also can be no guarantee that
34
Table of Contents
Risk factors
we will be successful with respect to our current efforts in the UK, as well as any further expansion beyond the US and the UK, if we decide to attempt such expansion, which may inhibit the growth of our business and have a material adverse effect on our business, prospects, results of operations, financial condition or cash flows.
If the cost of borrowing goes up, our net interest expense could increase.
We earn a substantial majority of our revenues from interest payments on the loans we make to our customers. Financial institutions and other funding sources provide us with the capital to fund these installment loans and lines of credit and charge us interest on funds that we draw down. In the event that the spread between the rate at which we lend to our customers and the rate at which we borrow from our lenders decreases, our financial results and operating performance will be harmed. The interest rates we charge to our customers and pay to our lenders could each be affected by a variety of factors, including access to capital based on our business performance, the volume of loans we make to our customers, competition and regulatory requirements. These interest rates may also be affected by a change over time in the mix of the types of products we sell to our customers and a shift among our channels of customer acquisition. Our VPC funding facilities are variable rate in nature and tied to the 3-month LIBOR rate. Thus any increase in the 3-month LIBOR rate will result in an increase in our net interest expense. Interest rate changes may also adversely affect our business forecasts and expectations and are highly sensitive to many macroeconomic factors beyond our control, such as inflation, recession, the state of the credit markets, changes in market interest rates, global economic disruptions, unemployment and the fiscal and monetary policies of the federal government and its agencies. Regulatory or legislative changes may reduce our ability to charge our current rates in all states and products. Also, competitive threats may cause us to reduce our rates. This would reduce profit margins unless there was a commensurate reduction in losses. Any material reduction in our interest rate spread could have a material adverse effect on our business, prospects, results of operations, financial condition or cash flows.
Our allowance for loan losses is determined based upon both objective and subjective factors and may not be adequate to absorb loan losses. If we experience rising credit or fraud losses, our results of operations would be adversely affected.
We face the risk that customers will fail to repay their loans in full. We reserve for such losses by establishing an allowance for loan losses, the increase of which results in a charge to our earnings as a provision for loan losses. We have established a methodology designed to determine the adequacy of our allowance for loan losses. While this evaluation process uses historical and other objective information, the classification of loans and the forecasts and establishment of loan losses are also dependent on our subjective assessment based upon our experience and judgment. Actual losses are difficult to forecast, especially if such losses stem from factors beyond our historical experience. As a result, there can be no assurance that our allowance for loan losses will be sufficient to absorb losses or prevent a material adverse effect on our business, financial condition and results of operations. Losses are the largest cost as a percentage of revenues across all of our products. Fraud and customers not being able to repay their loans are both significant drivers of loss rates. If we experienced rising credit or fraud losses this would significantly reduce our earnings and profit margins and could have a material adverse effect on our business, prospects, results of operations, financial condition or cash flows.
Increased customer acquisition costs and/or data costs would reduce our margins.
Although losses are our largest cost, if customer acquisition costs or other servicing costs increased this would reduce our profit margins. Marketing costs would be negatively affected by increased competition or stricter credit standards that would reduce customer fund rates. We could also experience increased
35
Table of Contents
Risk factors
marketing costs due to higher fees from credit bureaus for preapproved direct mail lists, search engines for search engine marketing, or fees for affiliates, and these increased costs would reduce our profit margins.
We purchase significant amounts of data to facilitate our proprietary credit and fraud scoring models. If there was an increase in the cost of data or if the company elected to purchase from new data providers there would be a reduction in our profit margins.
Any such reduction in our profit margins could result in a material adverse effect on our business, prospects, results of operations, financial condition or cash flows.
Our success is dependent, in part, upon our officers and key employees, and if we are not able to attract and retain qualified officers and key employees, or if one of our officers or key employees is temporarily unable to fully contribute to our operations, our business could be materially adversely affected.
Our success depends, in part, on our officers, which comprise relatively small group of individuals. Many members of the senior management team have significant industry experience, and we believe that our senior management would be difficult to replace, if necessary. Because the market for qualified individuals is highly competitive, we may not be able to attract and retain qualified officers or candidates. In addition, increasing regulations on, and negative publicity about, the consumer financial services industry could affect our ability to attract and retain qualified officers. Kenneth E. Rees, our Chief Executive Officer, is a competitive cyclist. Although we maintain key-man life insurance, such insurance may not be sufficient to compensate us for losses if Mr. Rees were injured in a cycling accident, or otherwise, and unable to be fully active in the business while recuperating, and that could have a material adverse effect on our business, prospects, results of operations, financial condition or cash flows.
Our future success also depends on our continuing ability to attract, develop, motivate and retain highly qualified and skilled employees. Qualified individuals are in high demand, and we may incur significant costs to attract and retain them. The loss of any of our senior management or key employees could materially adversely affect our ability to execute our business plan and strategy, and we may not be able to find adequate replacements on a timely basis, or at all. We cannot ensure that we will be able retain the services of any members of our senior management or other key employees. Our officers and key employees may terminate their employment relationship with us at any time, and their knowledge of our business and industry would be extremely difficult to replace. While all key employees have signed non-disclosure, non-solicitation and non-compete agreements, they may still elect to leave the company or even retire any time. Loss of key employees could result in delays to critical initiatives and the loss of certain capabilities and poorly documented intellectual property.
If we do not succeed in attracting and retaining our officers and key employees, our business could be materially and adversely affected.
Our US loan business is seasonal in nature, which causes our revenues and earnings to fluctuate.
Our US loan business is affected by fluctuating demand for the products and services we offer and fluctuating collection rates throughout the year. Demand for our consumer loan products in the US has historically been highest in the third and fourth quarters of each year, corresponding to the holiday season, and lowest in the first quarter of each year, corresponding to our customers’ receipt of income tax refunds. This results in significant increases and decreases in portfolio sizes and profit margins from
36
Table of Contents
Risk factors
quarter to quarter. In particular, we typically experience a reduction in our credit portfolios and an increase in profit margins in the first quarter of the year. When we experience higher growth in the second quarter through fourth quarters, portfolio balances tend to grow and profit margins are compressed. Our cost of sales for the non-prime loan products we offer in the US, which represents our provision for loan losses, is lowest as a percentage of revenues in the first quarter of each year, corresponding to our customers’ receipt of income tax refunds, and increases as a percentage of revenues for the remainder of each year. This seasonality requires us to manage our cash flows over the course of the year. If our revenues or collections were to fall substantially below what we would normally expect during certain periods, our ability to service debt and meet our other liquidity requirements may be adversely affected, which could have a material adverse effect on our business, prospects, results of operations, financial condition or cash flows.
If internet search engine providers change their methodologies for organic rankings or paid search results, or our organic rankings or paid search results decline for other reasons, our new customer growth or volume from returning customers could decline.
Our new customer acquisition marketing and our returning customer relationship management is partly dependent on search engines such as Google, Bing and Yahoo! to direct a significant amount of traffic to our desktop and mobile websites via organic ranking and paid search advertising. We bid on certain keywords from search engines as well as use their algorithms to place our listings ahead of other lenders.
Our paid search activities may not produce (and in the past have not always produced) the desired results. Internet search engines often revise their methodologies. The volume of customers we receive through organic ranking and paid search could be adversely affected by any such changes in methodologies or policies by search engine providers, by:
| Ø | decreasing our organic rankings or paid search results; |
| Ø | creating difficulty for our customers in using our web and mobile sites; |
| Ø | producing more successful organic rankings, paid search results or tactical execution efforts for our competitors than for us; and |
| Ø | resulting in higher costs for acquiring new or returning customers. |
In addition, search engines could implement policies that restrict the ability of companies such as us to advertise their services and products, which could prevent us from appearing in a favorable location or any location in the organic rankings or paid search results when certain search terms are used by the consumer. For example, Google recently announced a policy, effective July 13, 2016, that is expected to impact paid search results for certain personal loans, including Rise, although we do not believe that this change will have a material impact on Rise and our current business practices. Our online marketing efforts are also susceptible to actions by third parties that negatively impact our search results such as spam link attacks, which are often referred to as “black hat” tactics. Our sites have experienced meaningful fluctuations in organic rankings and paid search results in the past, and we anticipate similar fluctuations in the future. Any reduction in the number of consumers directed to our web and mobile sites could harm our business and operating results.
Finally, our competitors’ paid search, pay per click or search engine marketing activities may result in their sites receiving higher paid search results than ours and significantly increasing the cost of such advertising for us. We have little to no control over these potential changes in policy and methodologies relating to search engine results, and any of the changes described above could have a material adverse effect on our business, prospects, results of operations, financial condition or cash flows.
37
Table of Contents
Risk factors
Failure to keep up with the rapid technological changes in financial services and e-commerce, or changes in the uses and regulation of the internet could harm our business.
The financial services industry is undergoing rapid technological changes, with frequent introductions of new technology-driven products and services. The effective use of technology increases efficiency and enables financial and lending institutions to better serve customers and reduce costs. Our future success will depend, in part, upon our ability to address the needs of our customers by using technology to provide products and services that will satisfy customer demands for convenience, as well as to create additional efficiencies in our operations. We may not be able to effectively implement new technology-driven products and services as quickly as some of our competitors or be successful in marketing these products and services to our customers. Failure to successfully keep pace with technological change affecting the financial services industry could harm our ability to compete with our competitors.
Additionally, the business of providing products and services such as ours over the internet is dynamic and relatively new. We must keep pace with rapid technological change, consumer use habits, internet security risks, risks of system failure or inadequacy, and governmental regulation and taxation, and each of these factors could adversely impact our business. In addition, concerns about fraud, computer security and privacy and/or other problems may discourage additional consumers from adopting or continuing to use the internet as a medium of commerce. Also, to expand our customer base, we must appeal to and acquire consumers who historically have used traditional means of commerce to conduct their financial services transactions. If these consumers prove to be less profitable than our previous customers, and we are unable to gain efficiencies in our operating costs, including our cost of acquiring new customers, our business could be adversely impacted.
Any such failure to adapt to changes could have a material adverse effect on our business, prospects, results of operations, financial condition or cash flows.
Our ability to conduct our business and demand for our loans could be disrupted by natural or man-made catastrophes.
Catastrophes, such as fires, hurricanes and tornadoes, floods, earthquakes, or other natural disasters, terrorist attacks, computer viruses and telecommunications failures, could adversely affect our ability to market or service loans. Natural disasters and acts of terrorism, war, civil unrest, violence or human error could also cause disruptions to our business or the economy as a whole, which could negatively affect customers’ demand for our loans. Despite any precautions we may take, system interruptions and delays could occur if there is a natural disaster that affects our offices or one of the data center facilities we lease. As we rely heavily on our servers, computer and communications systems and the internet to conduct our business and provide high-quality customer service, such disruptions could harm our ability to market our products, accept and underwrite applications, provide customer service and undertake collections activities and cause lengthy delays which could harm our business, results of operations and financial condition. We have implemented a disaster recovery program that allows us to move production to a back-up data center in the event of a catastrophe. Although this program is functional, we do not currently serve network traffic equally from each data center, and are not able to switch instantly to our backup center in the event of failure of the main server site. If our primary data center shuts down, there will be a period of time that our loan products or services, or certain of such loan products or services, will remain inaccessible to our users or our users may experience severe issues accessing such loan products and services. Our business interruption insurance may not be sufficient to compensate us for losses that may result from interruptions in our service as a result of system failures.
38
Table of Contents
Risk factors
Any of these events could also cause consumer confidence to decrease in one or more of the markets we serve, which could result in a decreased number of loans being made to customers. As a result of these issues, any of these occurrences could have a material adverse effect on our business, prospects, results of operations, financial condition or cash flows.
We may be unable to protect our proprietary technology and analytics or keep up with that of our competitors.
The success of our business depends to a significant degree upon the protection of our proprietary technology, including our proprietary credit and fraud scoring models, which we use for pricing loans. We seek to protect our intellectual property with non-disclosure agreements and through standard measures to protect trade secrets. However, we may be unable to deter misappropriation of our proprietary information, detect unauthorized use or take appropriate steps to enforce our intellectual property rights. If competitors learn our trade secrets (especially with regard to marketing and risk management capabilities) it could be difficult to successfully prosecute to recover damages. A third party may attempt to reverse engineer or otherwise obtain and use our proprietary technology without our consent. The pursuit of a claim against a third party for infringement of our intellectual property could be costly, and there can be no guarantee that any such efforts would be successful. Our failure to protect our software and other proprietary intellectual property rights or to develop technologies that are as good as our competitors’ could put us at a disadvantage relative to our competitors. Any such failures could have a material adverse effect on our business, prospects, results of operations, financial condition or cash flows.
We are subject to intellectual property disputes from time to time, and such disputes may be costly to defend and could harm our business and operating results.
We have faced and may continue to face allegations that we have infringed the trademarks, copyrights, patents or other intellectual property rights of third parties, including from our competitors or non-practicing entities. Patent and other intellectual property litigation may be protracted and expensive, and the results are difficult to predict and may require us to stop offering certain products or product features, acquire licenses, which may not be available at a commercially reasonable price or at all, or modify such products, product features, processes or websites while we develop non-infringing substitutes.
In addition, we use open source software in our technology platform and plan to use open source software in the future. From time to time, we may face claims from parties claiming ownership of, or demanding release of, the source code, potentially including our valuable proprietary code, or derivative works that were developed using such software, or otherwise seeking to enforce the terms of the applicable open source license. These claims could also result in litigation, require us to purchase a costly license or require us to devote additional research and development resources to change our platform, any of which could have a material adverse effect on our business, prospects, results of operations, financial condition or cash flows.
Current and future litigation or regulatory proceedings could cause management distraction, harm our reputation and have a material adverse effect on our business, prospects, results of operations, financial condition or cash flows.
We, our officers and certain of our subsidiaries have been and may become subject to lawsuits that could cause us to incur substantial expenditures, generate adverse publicity and could significantly impair our business, force us to cease doing business in one or more jurisdictions or cause us to cease offering or alter one or more products. Additionally, our Chief Executive Officer is party to civil suits in Pennsylvania and Vermont. In August 2015, a Vermont class action civil lawsuit initiated by two citizens of Vermont was amended to add defendants Kenneth E. Rees, TFI, TC Loan Service, LLC, TC Decision Sciences, LLC, Tailwind Marketing, LLC, Sequoia Capital Operations, LLC, and Technology Crossover
39
Table of Contents
Risk factors
Ventures related to TFI’s role in providing services to third party tribal lenders. Plaintiffs assert violations of several statutes, including the Consumer Financial Protection Act of 2010, Federal Trade Commission Act, Electronic Funds Transfer Act, Vermont Consumer Fraud Act, Racketeer Influenced and Corrupt Organizations Act and violations of the common law theory of unjust enrichment. The allegations in the Pennsylvania civil suit are similar to those in the Vermont civil suit.
We may also be subject to litigation in the future and an adverse ruling in or a settlement of any such future litigation against us, our executive officers or another lender, or against our Chief Executive Officer in connection with either current litigation, could harm our reputation, cause us to have to refund fees and/or interest collected, forego collection of the principal amount of loans, pay treble or other multiple damages, pay monetary penalties and/or modify or terminate our operations in particular jurisdictions.
Defense of any lawsuit, even if successful, could require substantial time and attention of our management and could require the expenditure of significant amounts for legal fees and other related costs. We and others are also subject to regulatory proceedings, and we could suffer losses as a result of interpretations of applicable laws, rules and regulations in those regulatory proceedings, even if we are not a party to those proceedings. Any of these events could have a material adverse effect on our business, prospects, results of operations, financial condition or cash flows.
We may be unable to use some or all of our net operating loss carryforwards, which could materially and adversely affect our reported financial condition and results of operations.
At December 31, 2015, we had US and UK net operating loss carryforwards, or “NOLs,” of $22.7 million and $39.4 million, respectively, available to offset future taxable income, due to prior period losses. If not utilized, the US NOL will begin to expire in 2034. The UK NOL can be carried forward indefinitely. Realization of these NOLs depends on future income, and there is a risk that our existing US NOLs could expire unused and be unavailable to offset future income tax liabilities, which could materially and adversely affect our results of operations.
Under Section 382 of the Internal Revenue Code of 1986, as amended, or the “Code,” our ability to utilize NOLs or other tax attributes, such as research tax credits, in any taxable year may be limited if we experience an “ownership change.” A Section 382 “ownership change” generally occurs if one or more stockholders or groups of stockholders, who own at least 5% of our stock, increase their ownership by more than 50 percentage points over their lowest ownership percentage within a rolling three-year period. Similar rules may apply under state tax laws. We have not completed a Section 382 analysis through September 30, 2015. If we have previously had, or have in the future, one or more Section 382 “ownership changes,” including in connection with this offering, or if we do not generate sufficient taxable income, we may not be able to utilize a material portion of our NOLs, even if we achieve profitability. If we are limited in our ability to use our NOLs in future years in which we have taxable income, we will pay more taxes than if we were able to fully utilize our NOLs. This could materially and adversely affect our results of operations.
RISKS RELATED TO OUR ASSOCIATION WITH TFI
Third parties may seek to hold us responsible for liabilities of TFI that we did not assume in our agreements.
In connection with our separation from TFI, TFI has generally agreed to retain all liabilities that did not historically arise from our business. Third parties may seek to hold us responsible for TFI’s retained
40
Table of Contents
Risk factors
liabilities, including third party claims arising from TFI’s business and retained assets. For instance, the Pennsylvania civil suit described in “Business—Legal Proceedings” originally included Elevate as a named party, even though the purported claim is based on TFI’s retained business. Under the separation and distribution agreement, we are responsible for the debts, liabilities and other obligations related to the business or businesses that we own and operate. See “Certain relationships and related party transactions—Spin-Off Agreements with TFI—Separation and distribution agreement.” Under our agreements with TFI, TFI has agreed to indemnify us for claims and losses relating to its retained liabilities. However, if any of those liabilities are significant and we are ultimately held liable for such liabilities, we cannot assure you that we will be able to recover the full amount of our losses from TFI.
Although we do not anticipate liability for any obligations not expressly assumed by us pursuant to the separation and distribution agreement, it is possible that we could be required to assume responsibility for certain obligations retained by TFI should TFI fail to pay or perform its retained obligations. For instance, the Spin-Off could be challenged under various state and federal fraudulent conveyance laws. An unpaid creditor or an entity vested with the power of such creditor (such as a trustee or debtor-in-possession in a bankruptcy) could claim that the distribution left TFI insolvent or with unreasonably small capital or that TFI intended or believed it would incur debts beyond its ability to pay such debts as they mature and that TFI did not receive fair consideration or reasonably equivalent value in the Spin-Off. The measure of insolvency for purposes of such fraudulent conveyance laws will vary depending on which jurisdiction’s law is applied. Generally, however, an entity would be considered insolvent if either the fair saleable value of its assets is less than the amount of its liabilities (including the probable amount of contingent liabilities), or it is unlikely to be able to pay its liabilities as they become due. We do not know what standard a court would apply to determine insolvency; however, if a court were to conclude that the Spin-Off constituted a fraudulent conveyance, then such court could void the distribution as a fraudulent transfer and could impose a number of different remedies, including without limitation, returning our assets or your shares in our company to TFI, voiding our liens and claims (if any) against TFI, or providing TFI with a claim for money damages against us in an amount equal to the difference between the consideration received by TFI and the fair market value of our company at the time of the distribution.
Certain members of management, directors and stockholders may face actual or potential conflicts of interest as a result of owning shares of, or having positions as directors of TFI.
Some of our officers and directors own both TFI common stock and our common stock. This ownership overlap could create, or appear to create, potential conflicts of interest when our officers and directors face decisions that could have different implications for us and TFI. For example, potential conflicts of interest could arise in connection with the resolution of any dispute between us and TFI regarding the terms of the agreements governing the distribution and our relationship with TFI thereafter or in the strategy for defending or resolving any litigation in which both TFI and Elevate are involved. Existing and past agreements between TFI and Elevate include, but are not limited to, the separation and distribution agreement, intellectual property assignment agreement, data sharing and support agreement, tax sharing agreement and sublease agreements. Potential conflicts of interest may also arise because one of our directors, Stephen J. Shaper, is currently a member of the board of directors of TFI. See “Certain relationships and related party transactions.”
We do not have a non-competition agreement with TFI to restrict TFI from competing with us, and TFI is not required to offer corporate opportunities to us.
We do not have any noncompetition agreement or arrangement with TFI. TFI is free to compete with us in any activity or line of business. Additionally, TFI continues to offer its licensed technology platform,
41
Table of Contents
Risk factors
which includes the proprietary intellectual property included in our IQ Technology Platform as it existed as of January 1, 2015, to customers offering financial services and is not restricted from competing in the online financial services business. We will not have any interest or expectancy in any business activity, opportunity, transaction or other matter in which TFI engages or seeks to engage merely because we engage in the same or similar lines of business. In addition, TFI will have no duty to communicate its knowledge of, or offer, any potential business opportunity, transaction or other matter to us, and TFI is free to pursue or acquire such business opportunity, including opportunities that would be in direct competition with us.
We could be subject to fines or corrective orders based on a Civil Investigative Demand issued by the CFPB to TFI.
In June 2012, prior to the Spin-Off, TFI received a Civil Investigative Demand from the Consumer Finance Protection Bureau, or “CFPB.” The purpose of the Civil Investigative Demand was to determine whether small-dollar online lenders or other unnamed persons engaged in unlawful acts or practices relating to the advertising, marketing, provision, or collection of small-dollar loan products, in violation of parts of the Dodd-Frank Wall Street Reform and Consumer Protection Act, or the “Dodd-Frank Act,” the Truth in Lending Act, the Electronic Funds Transfer Act, the Gramm-Leach-Bliley Act, or any other federal consumer financial law and to determine whether CFPB action to obtain legal or equitable relief would be in the public interest. While TFI’s business is distinct from our business, we cannot predict the final outcome of this Civil Investigative Demand or to what extent any obligations arising out of such final outcome will be applicable to our company or business, if at all. It is possible that if the CFPB determines any violations occurred we could receive fines or orders for corrective action as a successor to some of TFI’s businesses.
OTHER RISKS RELATED TO COMPLIANCE AND REGULATION
We, our marketing affiliates, our third-party service providers and Republic Bank, which originates Elastic, the line of credit product we offer, are subject to complex federal, state and local lending and consumer protection laws, and if we fail to comply with applicable laws, regulations, rules and guidance, our business could be adversely affected.
We, our marketing affiliates, our third-party service providers and Republic Bank, which originates Elastic, the line of credit product we offer, must comply with US federal, state and local regulatory regimes, including those applicable to consumer credit transactions. Certain US federal and state laws generally regulate interest rates and other charges and require certain disclosures. In particular, we may be subject to laws such as:
| Ø | local regulations and ordinances that impose requirements or restrictions related to certain loan product offerings and collection practices; |
| Ø | state laws and regulations that impose requirements related to loan or credit service disclosures and terms, credit discrimination, credit reporting, debt servicing and collection; |
| Ø | the Truth in Lending Act and Regulation Z promulgated thereunder, and similar state laws, which require certain disclosures to borrowers regarding the terms and conditions of their loans and credit transactions; |
| Ø | Section 5 of the Federal Trade Commission Act, which prohibits unfair and deceptive acts or practices in or affecting commerce, Section 1031 of the Dodd-Frank Act, which prohibits unfair, deceptive or abusive acts or practices in connection with any consumer financial product or service, and similar state laws that prohibit unfair and deceptive acts or practices; |
42
Table of Contents
Risk factors
| Ø | the Equal Credit Opportunity Act and Regulation B promulgated thereunder and state non-discrimination laws, which generally prohibit creditors from discriminating against credit applicants on the basis of race, color, sex, age, religion, national origin, marital status, the fact that all or part of the applicant’s income derives from any public assistance program or the fact that the applicant has in good faith exercised any right under the federal Consumer Credit Protection Act; |
| Ø | the Fair Credit Reporting Act, or the “FCRA,” as amended by the Fair and Accurate Credit Transactions Act, and similar state laws, which promote the accuracy, fairness and privacy of information in the files of consumer reporting agencies; |
| Ø | the Fair Debt Collection Practices Act, or the “FDCPA,” and similar state and local debt collection laws, which provide guidelines and limitations on the conduct of third party debt collectors and creditors in connection with the collection of consumer debts; |
| Ø | the Gramm-Leach-Bliley Act and Regulation P promulgated thereunder and similar state privacy laws, which include limitations on financial institutions’ disclosure of nonpublic personal information about a consumer to nonaffiliated third parties, in certain circumstances require financial institutions to limit the use and further disclosure of nonpublic personal information by nonaffiliated third parties to whom they disclose such information and require financial institutions to disclose certain privacy policies and practices with respect to information sharing with affiliated and nonaffiliated entities as well as to safeguard personal customer information, and other privacy laws and regulations; |
| Ø | the Bankruptcy Code and similar state insolvency laws, which limit the extent to which creditors may seek to enforce debts against parties who have filed for bankruptcy protection; |
| Ø | the Servicemembers Civil Relief Act and similar state laws, which allow military members and certain dependents to suspend or postpone certain civil obligations, as well as limit applicable rates, so that the military member can devote his or her full attention to military duties; |
| Ø | the Military Lending Act, which limits the interest rate and fees that may be charged to military members and their dependents, requires certain disclosures and prohibits certain mandatory clauses among other restrictions; |
| Ø | the Electronic Fund Transfer Act and Regulation E promulgated thereunder, which provide disclosure requirements, guidelines and restrictions on the electronic transfer of funds from consumers’ asset accounts; |
| Ø | the Electronic Signatures in Global and National Commerce Act and similar state laws, particularly the Uniform Electronic Transactions Act, which authorize the creation of legally binding and enforceable agreements utilizing electronic records and signatures and, with consumer consent, permits required disclosures to be provided electronically; |
| Ø | the Bank Secrecy Act, which relates to compliance with anti-money laundering, customer due diligence and record-keeping policies and procedures; and |
| Ø | the Telephone Consumer Protection Act, or the “TCPA,” and the regulations of the Federal Communications Commission, or the “FCC,” which regulations include limitations on telemarketing calls, auto-dialed calls, prerecorded calls, text messages and unsolicited faxes. |
While it is our intention to always be in compliance with these laws, it is possible that we may currently be, or at some time have been, inadvertently out of compliance with some or any such laws. Further, all applicable laws are subject to evolving regulatory and judicial interpretations, which further complicate real-time compliance. Lastly, compliance with these laws is costly, time-consuming and limits our operational flexibility.
43
Table of Contents
Risk factors
Failure to comply with these laws and regulatory requirements applicable to our business may, among other things, limit our or a collection agency’s ability to collect all or part of the principal of or interest on loans. As a result, we may not be able to collect on unpaid principal or interest. In addition, non-compliance could subject us to damages, revocation of required licenses, class action lawsuits, administrative enforcement actions, rescission rights held by investors in securities offerings and civil and criminal liability, which may harm our business and may result in borrowers rescinding their loans.
Where applicable, we seek to comply with state small loan, loan broker, CSO, servicing and similar statutes. In all US jurisdictions with licensing or other requirements that we believe may be applicable to us, we comply with the relevant requirements by acquiring the necessary licenses or authorization and submitting appropriate registrations in connection therewith. Nevertheless, if we are found to not have complied with applicable laws, we could lose one or more of our licenses or authorizations or face other sanctions or penalties or be required to obtain a other licenses or authorizations in such jurisdiction, which may have an adverse effect on our ability to perform our servicing obligations or make products or services available to borrowers in particular states, which may harm our business.
Our products currently have usage caps and limitations on lending based on internally developed “responsible lending guidelines.” If those policies become more restrictive due to legislative or regulatory changes at either the local, state, US federal, or UK regulatory level these products would experience declining revenues per customer.
The CFPB may have examination authority over our US consumer lending business that could have a significant impact on our US business.
In July 2010, the US Congress passed the Dodd-Frank Act. Title X of the Dodd-Frank Act created the CFPB, which regulates US consumer financial products and services, and gave it regulatory, supervisory and enforcement powers over certain providers of consumer financial products and services, including authority to examine such providers.
The CFPB has begun exercising supervisory review over and examining certain non-bank providers of consumer financial products and services, including providers of consumer loans similar to us. The CFPB has not examined our lending products, or our services and practices. The CFPB’s examination authority permits CFPB examiners to inspect the books and records of providers, and ask questions about their business practices. The examination procedures include specific modules for examining marketing activities, loan application and origination activities, payment processing activities and sustained use by consumers, collections, accounts in default, consumer reporting activities and third party relationships. As a result of these examinations, we could be required to change our products, our services or our practices, whether as a result of another party being examined or as a result of an examination of us, or we could be subject to monetary penalties, which could materially adversely affect us.
Furthermore, because the CFPB is a relatively new entity, its practices and procedures regarding civil investigations, examination, enforcement and other matters relevant to us and other CFPB-regulated entities are subject to further development and change. Where the CFPB holds powers previously assigned to other regulators or may interpret laws previously interpreted by other regulators, the CFPB may not continue to apply such powers or interpret relevant concepts consistent with previous regulators’ practice. This may adversely affect our ability to anticipate the CFPB’s expectations or interpretations in our interaction with the CFPB.
The CFPB also has broad authority to prohibit unfair, deceptive and abusive acts and practices and to investigate and penalize financial institutions that violate this prohibition. In addition to having the
44
Table of Contents
Risk factors
authority to obtain monetary penalties for violations of applicable federal consumer financial laws (including the CFPB’s own rules), the CFPB can require remediation of practices, pursue administrative proceedings or litigation and obtain cease and desist orders (which can include orders for restitution or rescission of contracts, as well as other kinds of affirmative relief). Also, where a company is believed to have violated Title X of the Dodd-Frank Act or CFPB regulations implemented thereunder, the Dodd-Frank Act empowers state attorneys general and state regulators to bring civil actions to remedy such violations after consulting with the CFPB. If the CFPB or one or more state attorneys general or state regulators believe that we have violated any of the applicable laws or regulations, they could exercise their enforcement powers in ways that could have a material adverse effect on our business, prospects, results of operations, financial condition or cash flows.
Regulators in both the US and the UK have imposed very large fines on both large and small financial services companies including well-established global financial institutions. Although we have had numerous state examinations, we have not been examined by the CFPB or the Financial Conduct Authority, or the “FCA,” the company’s regulator in the UK. A UK examination is expected sometime during 2016, and a US examination is expected in 2017 or 2018. Either examination could result in fines or changes to business practices that would reduce profit margins for the company.
The CFPB has proposed new rules affecting the consumer lending industry, and these or subsequent new rules and regulations may significantly impact our US consumer lending business.
On May 5, 2016, the CFPB released a proposed rule to prohibit certain providers of consumer financial products and services from including pre-dispute arbitration clauses in new contracts that bar a consumer from filing or participating in a class action with respect to the covered consumer financial product or service, and that would require any covered pre-dispute arbitration agreement to include specific disclosure to that effect. The proposal also requires a covered provider that uses pre-dispute arbitration agreements to submit certain arbitral records to the CFPB. Unless significant changes are made to the proposal, the CFPB’s final rule is likely to increase class action exposure and litigation expense. Comments on the proposed rule are due August 22, 2016, and the CFPB has proposed that a final rule would become effective 180 days after publication in the Federal Register. The CFPB is also expected to initiate its rulemaking process pertaining to debt collections in 2016, which could impact collection practices of both lenders and those that purchase charged-off debt from lenders. Lastly, the CFPB has indicated it is continuing with its rulemaking to define larger participants in the installment lending markets. This will enable the CFPB to examine and supervise that market.
On June 2, 2016, the CFPB also released proposed rules addressing practices of certain providers of payday, vehicle title and certain high-cost installment loans. If the rules were adopted as proposed, we could be required to modify the manner in which we make a reasonable determination of a customer’s ability to repay and provide customers notice at least three days before a payment withdrawal attempt, as well as obtain a new ACH authorization from a customer following two failed ACH attempts, among other requirements. Comments on the proposed rules are due September 14, 2016, and the CFPB has proposed that final rules would become effective 15 months after publication in the Federal Register. We do not currently know the full extent of the final rules that the CFPB will ultimately adopt, and thus, the impact on our business practices will remain uncertain until the final rules are adopted.
If the CFPB adopts rules or regulations that significantly restrict the conduct of our business, any such rules or regulations could have a material adverse effect on our business, prospects, results of operations, financial condition or cash flows or could make the continuance of all or part of our US business impractical or unprofitable. Any new rules or regulations adopted by the CFPB could also result in significant compliance costs.
45
Table of Contents
Risk factors
Republic Bank, the originator of loans for the Elastic product, is regulated by the FDIC, which could require Republic Bank to make changes to or terminate the product.
The Elastic line of credit product is offered by Republic Bank using technology, underwriting and marketing services provided by Elevate. Republic Bank is supervised and examined by the FDIC. If the FDIC considers some aspects of the Elastic product inappropriate, it could require the lender to change the way the product is offered or require the lender to terminate the program entirely.
The UK has imposed, and continues to impose, increased regulation of the short-term high-cost credit industry with the stated expectation that some firms will exit the market.
In the UK, we are subject to regulation by the FCA, pursuant to the Financial Services and Markets Act 2000, or the “FSMA,” the Consumer Credit Act 1974, as amended, or the “CCA,” and secondary legislation passed under such statutes, among other rules and regulations including the FCA Handbook, which collectively serve to transpose the obligations under the European Consumer Credit Directive into UK law. In December 2012, the UK Parliament passed the Financial Services Act 2012, or the “FSA Act 2012,” which created a new regulatory framework for the supervision and regulation of the consumer credit industry in the UK, including the consumer lending industry in which we operate. The FSA Act 2012 mandated that in April 2014, the FCA take over responsibility for regulating consumer credit from the Office of Fair Trading, or the “OFT,” and it also made changes to the relevant legislation including the CCA and the FSMA.
The FCA regulates consumer credit and related activities pursuant to the FSMA and the FCA Handbook, which includes prescriptive rules and regulations and carries across many of the laws set out in the CCA and its secondary legislation, as well as guidance in a number of key areas, including Irresponsible Lending and Debt Collection, issued by the OFT, or the “Guidance.” The regulations under the FCA consumer credit regime are more prescriptive than under the former UK consumer credit regime and in many instances the Guidance has been transposed into rules. The FSMA gives the FCA the power to authorize, supervise, examine, bring enforcement actions and impose fines and disciplinary sanctions against providers of consumer credit, as well as to make rules for the regulation of consumer credit. On February 28, 2014, the FCA issued the Consumer Credit Sourcebook, or the “CONC,” contained in the FCA Handbook. The CONC incorporates prescriptive regulations for consumer loans such as those that we offer, including mandatory affordability checks on borrowers, limiting the number of refinances, or “rollovers,” to two, restricting how lenders can advertise, banning advertisements that the FCA deems misleading, and introducing a limit of two unsuccessful attempts on the use of continuous payment authority, or “CPA,” (which provides a creditor the ability to directly debit a customer’s account for payment using their bank card details when authorized by the customer to do so) to pay off a loan. Certain provisions of the CONC took effect on April 1, 2014, and other provisions for high-cost short-term credit providers, such as the limits on rollovers, CPA and advertising, took effect on July 1, 2014.
In addition, on December 18, 2013, the UK passed the Financial Services (Banking Reform) Act, which included an amendment to the FSMA that required the FCA to introduce rules “with a view to securing an appropriate degree of protection for borrowers against excessive charges” on “high-cost short-term” consumer loans. On July 15, 2014, the FCA issued a consultation paper that proposed a cap on the total cost of high-cost short-term credit and requested comments on the proposal. The consultation paper proposed a maximum interest rate of 0.8% of principal per day, and a limit on the total fees, including interest (including post-default interest) and all other charges (including late repayment fees which are capped at £15) to an aggregate amount not to exceed 100% of the principal amount loaned. The FCA requested comments on the proposal and issued its final rules (which can be found at CONC section 5A)
46
Table of Contents
Risk factors
on November 11, 2014. The final rule was largely the same as the proposed rule and required us to make changes to our loan products in the UK. As a result of the final rule, we discontinued offering line of credit accounts to new customers in the UK and effective January 1, 2015, we discontinued draws on existing accounts in the UK. Once UK customers have paid off their outstanding line of credit balance, they may apply for an installment loan. We also made the Sunny product an installment loan product. The final rule became effective on January 2, 2015, as required by the 2013 amendment to the FSMA. In addition, on February 24, 2015, the FCA issued a consultation paper (CP15/6) that, among other things, proposed to remove the exemption from the requirement that providers of high-cost short-term credit include a risk warning in financial promotions communicated electronically where limited space on the medium did not permit such inclusion and to amend its rules to allow firms to use CPA to collect repayments where a customer is in arrears or default and the lender is exercising forbearance, without having to enter into a formal modifying agreement. The FCA requested comments on the proposals by May 6, 2015 and published its response in PS15/23 in September 2015. The proposed changes were implemented without amendment on September 28, 2015 (with regard to the changes to CPA under CONC 7.6.28) and on November 2, 2015 (with regard to the removal of the financial promotion exemption).
During the years ended December 31, 2015 and 2014, our UK operations represented 19% and 25%, respectively, of our consolidated total revenues. The results for the year ended December 31, 2015 and 2014 do not include the full impact of the changes described above. The results for each of these periods are not indicative of our future results of operations and cash flows from our operations in the UK.
These changes that we have implemented or any changes we may be required to implement in the future as a result of such legislative and regulatory activities could have a material adverse effect on our UK business.
Additionally, in June 2013, the OFT referred the payday lending industry in the UK to the Competition Commission, which is now the Competition & Markets Authority, or the “CMA,” for a market investigation. The CMA gathered data from industry participants, including us, in connection with its review of the UK payday lending industry to determine whether certain features of the payday lending industry prevent, restrict or distort competition (which is also referred to as having an adverse effect on competition) and, if so, what remedial action should be taken.
On June 11, 2014, the CMA released a provisional findings report in which it indicated that it believes that many payday lenders fail to compete on price and indicated that it will look at potential ways to increase price competition. The CMA also announced the expansion of its review of the payday lending industry to include lead generators. The CMA announced its provisional decision on remedies on October 9, 2014, and published its final report on February 24, 2015, supplemented by its final order, to implement the changes, on August 13, 2015. The CMA ordered online lenders to provide details of their products on at least one price comparison website, or “PCW,” which is authorized by the FCA and include a hyperlink from their website to at least one such PCW on which its loans are featured. The CMA also ordered online and storefront lenders to provide existing customers with a summary of their cost of borrowing and to make quarterly compliance reports to the CMA. In addition, the CMA recommended that the FCA take steps to improve the disclosure of late fees and other additional charges, help customers compare competing loan products without unduly affecting their ability to access credit, improve real-time data sharing between lenders and credit reference agencies and ensure that lead generators explain how they operate much more clearly to customers. The FCA issued a consultation paper (CP15/33) on October 28, 2015, which proposed that PCWs must rank high cost short term credit products in ascending order of price according to the total amount payable, ensure rankings are neutral, do not include advertisements, do not give products greater prominence based on commercial
47
Table of Contents
Risk factors
relationships and allow customers to search for loans according to the amount and duration of the loan they require. The FCA decided not to enforce real time data sharing between lenders at this stage. The consultation period closed on January 28, 2016 and it is expected that the final rules will be published later in 2016, with the changes becoming effective by the end of 2016. The CMA will work closely with the FCA to implement the recommendations.
If the FCA adopts rules that significantly restrict the conduct of our business, any such rules could have a material adverse effect on our business, prospects, results of operations, financial condition or cash flows or could make the continuance of all or part of our UK business impractical or unprofitable. Any new rules adopted by the FCA could also result in significant compliance costs.
Our advertising and marketing materials and disclosures have been and continue to be subject to regulatory scrutiny, particularly in the UK.
In the jurisdictions where we operate, our advertising and marketing activities and disclosures are subject to regulation under various industry standards, consumer protection laws, and other applicable laws and regulations. Consistent with the consumer lending industry as a whole (see “—The consumer lending industry continues to be subjected to new laws and regulations in many jurisdictions that could restrict the consumer lending products and services we offer, impose additional compliance costs on us, render our current operations unprofitable or even prohibit our current operations” above), our advertising and marketing materials have come under increased scrutiny. In the UK, for example, consumer credit firms are subject to the financial promotions regime set out in the FSMA (Financial Promotions) Order 2005 and specific rules in the CONC, part 3, such as the inclusion of a risk warning on certain advertising materials. The FCA has also decided to adopt certain elements of industry codes as FCA rules on a case by case basis. Our advertising and marketing materials in the UK are subject to review and regulation both by the FCA and the Advertising Standards Authority. We have in some cases been required to withdraw, amend or add disclosures to such materials, or have done so voluntarily in response to inquiries or complaints. In addition, on February 24, 2015, the FCA issued a consultation paper that, among other things, proposed a requirement that providers of high-cost short-term credit include a risk warning in all financial promotions (i.e., removing the exemption which provided that such warnings could be omitted where, owing to space constraints, it was not reasonably practicable to include them). This change was implemented on September 28, 2015. Going forward, there can be no guarantee that we will be able to advertise and market our business in the UK or elsewhere in a manner we consider effective. Any inability to do so could have a material adverse effect on our business, prospects, results of operations, financial condition or cash flows.
Our FCA-authorized UK business is subject to the consumer credit regulatory framework regulated by the FCA and must comply with applicable UK laws.
In April 2014, the FCA began regulating UK consumer credit. At that time, all companies were required to apply for FCA authorization to continue to operate a consumer credit-related business in the UK. In addition, the FCA implemented new high-cost short-term credit, or “HCSTC,” rules, including a cap on the total cost of borrowing, as well as the rules to ensure that the systems and controls, and operations and culture, of lenders were aligned with the requirements of the FCA’s handbook, and that management decisions were based in fair treatment. In February 2016, the FCA issued full authorization to Elevate for our UK business. Similar to US and state regulatory regimes, the FCA has the power to revoke, suspend or impose conditions upon our authorization to conduct a consumer credit business if it determines we are out of compliance with applicable UK laws, HCSTC rules or other legal requirements ensuring fair treatment of consumers. Furthermore, the FCA could elect to amend its rules and impose additional conditions that could further increase compliance costs or require changes to the conduct of our UK business that could have a material adverse effect on our UK operations.
48
Table of Contents
Risk factors
Several lawsuits have sought to re-characterize certain loan marketers and service providers as lenders. If litigation on similar theories were successful against us, we could be subject to state usury and consumer protection laws in a greater number of states, loans in such states could be deemed void and unenforceable, and we could be subject to substantial penalties in connection with such loans.
Several lawsuits in the US, including some filed by state attorneys general, have challenged relationships between federally chartered banks or state chartered banks supervised and insured by the Federal Deposit Insurance Corporation and non-bank lenders and service providers like Elevate, claiming that the originating lender is not the “true lender” and that the loans offered pursuant to such relationships are not covered by the protections of the National Bank Act, Section 27 of the Federal Deposit Insurance Act or otherwise, but are instead subject to state usury and consumer protection laws.
While the case law involving whether an originating lender or a third party servicer is the “true lender” is not well developed and courts have come to different conclusions and applied different analyses, a determination of which party is the “true lender” is significant because if an originating lender is deemed not to be the “true lender,” the non-bank lenders and third party service providers risk having the loans be subjected to a consumer’s state usury and consumer protection laws. The federal courts that have opined on the “true lender” issue have looked primarily to who is the lender indicated on the borrower’s loan documents. Most state courts consider a number of other factors when analyzing whether the originating lender or a third party is the “true lender,” including looking at the economics of the transaction to determine, among other things, who has the predominate economic interest in the loan being made. Additional state consumer protection laws would be applicable to us if we were re-characterized as a lender with respect to Elastic, or Rise in Ohio or Texas. The loans could be deemed to be void and unenforceable in some states, the right to collect finance charges could be affected, and we could be subject to fines and penalties from state and federal regulatory agencies as well as claims by borrowers, including class actions by private plaintiffs. Even if we were not required to change our business practices to comply with applicable state laws and regulations or cease doing business in some states, we could be required to register or obtain licenses or other regulatory approvals that could impose a substantial cost on us. If Republic Bank or the CSO lenders in Ohio or Texas were subject to such a lawsuit, they may elect to terminate their relationship voluntarily, and if they lost the lawsuit, they could be forced to modify or terminate the program.
The Second Circuit held in Madden v. Midland Funding, LLC that a third party purchaser of a loan from a national bank does not enjoy the ability to “export” the interest rate of the originating bank, but rather is restricted to the usury rate of the state where the borrower resides. The court overturned the long standing “valid at inception” doctrine, which provides that a loan that is assigned to a non-bank party retains the legality it had when it was originated by a national or state-chartered bank. The Second Circuit declined a rehearing en banc of the decision. In November 2015, a petition for a writ of certiorari was filed urging the US Supreme Court to address “[w]hether the National Bank Act, which preempts state usury laws regulating the interest a national bank may charge on a loan, continues to have preemptive effect after the national bank has sold or otherwise assigned the loan to another entity.” On March 21, 2016, the US Supreme Court invited the Solicitor General’s Office to file a brief expressing the United States’ views on Madden; however, the US Supreme Court has not yet decided whether or not it will hear the case.
Neither Elevate nor any of its affiliates purchase loans in connection with our business. Rather, we either make the loans directly or, in the case of Elastic, the originating lender makes the loans and sells a participation to Elastic SPV, and therefore different facts exist with respect to our business than those at issue in the Madden case.
49
Table of Contents
Risk factors
We use third party collection agencies to assist us with debt collection. The failure to comply with debt collection regulations could subject us to fines and other liabilities, which could harm our reputation and business.
The FDCPA regulates persons who regularly collect or attempt to collect, directly or indirectly, consumer debts owed or asserted to be owed to another person. Many states impose additional requirements on debt collection communications, and some of those requirements may be more stringent than the federal requirements. Moreover, regulations governing debt collection are subject to changing interpretations that differ from jurisdiction to jurisdiction. We use third party collections agencies to collect on debts incurred by consumers of our credit products. Regulatory changes could make it more difficult for collections agencies to effectively collect on the loans we originate.
Non-US jurisdictions also regulate debt collection. For example, in the UK, due to new rules under the CONC we have made adjustments to some of our business practices, including our collections processes, which could possibly result in lower collections on loans made by us and has resulted in a decrease in the number of new customers that we are able to approve. In addition, the concerns expressed to us by the OFT and the FCA relate in part to debt collection. We could be subject to fines, written orders or other penalties if we, or parties working on our behalf, are determined to have violated the FDCPA, the CONC or analogous state or international laws, which could have a material adverse effect on our reputation, business, prospects, results of operations, financial condition or cash flows.
Our business is subject to complex and evolving US and international laws and regulations regarding privacy, data protection, and other matters. Many of these laws and regulations are subject to change and uncertain interpretation, and could result in claims, changes to our business practices, monetary penalties, increased cost of operations, or declines in user growth or engagement, or otherwise harm our business.
We receive, transmit and store a large volume of personally identifiable information and other sensitive data from customers and potential customers. Our business is subject to a variety of laws and regulations in the US and the UK that involve user privacy issues, data protection, advertising, marketing, disclosures, distribution, electronic contracts and other communications, consumer protection and online payment services. The introduction of new products or expansion of our activities in certain jurisdictions may subject us to additional laws and regulations. In addition, international data protection, privacy, and other laws and regulations can be more restrictive than those in the US. US federal and state and international laws and regulations, which can be enforced by private parties or government entities, are constantly evolving and can be subject to significant change, and the US government, including the Federal Trade Commission, or the “FTC,” and the Department of Commerce, has announced that it is reviewing the need for greater regulation of the collection of information concerning consumer behavior on the internet, including regulation aimed at restricting certain targeted advertising practices. In addition, the application and interpretation of these laws and regulations are often uncertain, particularly in the new and rapidly evolving e-commerce industry in which we operate, and may be interpreted and applied inconsistently from country to country and inconsistently with our current or past policies and practices.
A number of proposals are pending before federal, state, and international legislative and regulatory bodies that could significantly affect our business. For example, on December 15, 2015, the European Commission finalized the new General Data Protection Regulation, or “GDPR,” which will replace the existing Data Protection Directive (95/46/EC) and is expected to be implemented in the UK in the first quarter of 2018. The GDPR is more prescriptive than the existing regime and includes new obligations on businesses, for example, to appoint a data protection officer, self-report breaches, obtain express consent for data processing and provide more rights to individuals whose data is processed, including the
50
Table of Contents
Risk factors
“right to be forgotten,” by having such individuals’ records erased. Penalties for non-compliance are also significantly higher under the GDPR—up to 4% of global turnover for the preceding year. Similarly, there have been a number of recent legislative proposals in the US, at both the federal and state level, that could impose new obligations in areas such as privacy. In addition, some countries are considering legislation requiring local storage and processing of data that, if enacted, would increase the cost and complexity of delivering our services. These existing and proposed laws and regulations can be costly to comply with and can delay or impede the development of new products, the expansion into new markets, result in negative publicity, increase our operating costs, require significant management time and attention, and subject us to inquiries or investigations, claims or other liabilities, including demands that we modify or cease existing business practices or pay fines, penalties or other damages.
The use of personal data in credit underwriting is highly regulated.
In the US the FCRA regulates the collection, dissemination and use of consumer information, including consumer credit information. Compliance with the FCRA and related laws and regulations concerning consumer reports has recently been under regulatory scrutiny. The FCRA requires us to provide a Notice of Adverse Action to a loan applicant when we deny an application for credit, which, among other things, informs the applicant of the action taken regarding the credit application and the specific reasons for the denial of credit. The FCRA also requires us to promptly update any credit information reported to a consumer reporting agency about a consumer and to allow a process by which consumers may inquire about credit information furnished by us to a consumer reporting agency. Historically, the FTC has played a key role in the implementation, oversight, enforcement and interpretation of the FCRA. Pursuant to the Dodd-Frank Act, the CFPB has primary supervisory, regulatory and enforcement authority of FCRA issues. Although the FTC also retains its enforcement role regarding the FCRA, it shares that role in many respects with the CFPB. The CFPB has taken a more active approach than the FTC, including with respect to regulation, enforcement and supervision of the FCRA. Changes in the regulation, enforcement or supervision of the FCRA may materially affect our business if new regulations or interpretations by the CFPB or the FTC require us to materially alter the manner in which we use personal data in our credit underwriting.
In the UK, we are subject to the requirements of the Data Protection Act 1998, or the “DPA,” and are required to be fully registered as a data-controller under the DPA and comply with industry guidance published by the regulator, the Information Commissioner. There are also strict rules on the use of credit reference data under the CCA regulations and the CONC. We are also subject to laws limiting the transfer of personal data from the European Economic Area to non-European Economic Area countries or territories. There are also strict rules on the instigation of electronic communications such as email, text message and telephone calls under the Privacy and Electronic Communications (EC Directive) Regulations 2003, which prohibit unsolicited direct marketing by electronic means without express consent, as well as the monitoring of devices.
The oversight of the FCRA by both the CFPB and the FTC and any related investigation or enforcement activities or our failure to comply with the DPA may have a material adverse impact on our business, including our operations, our mode and manner of conducting business and our financial results.
Judicial decisions, CFPB rule-making or amendments to the Federal Arbitration Act could render the arbitration agreements we use illegal or unenforceable.
We include arbitration provisions in our consumer loan agreements. These provisions are designed to allow us to resolve any customer disputes through individual arbitration rather than in court and explicitly provide that all arbitrations will be conducted on an individual and not on a class basis. Thus, our arbitration agreements, if enforced, have the effect of shielding us from class action liability. Our
51
Table of Contents
Risk factors
arbitration agreements do not generally have any impact on regulatory enforcement proceedings. We take the position that the arbitration provisions in our consumer loan agreements, including class action waivers, are valid and enforceable; however, the enforceability of arbitration provisions is often challenged in court. If those challenges are successful, our arbitration and class action waiver provisions could be unenforceable, which could subject us to additional litigation, including additional class action litigation.
In addition, the US Congress has considered legislation that would generally limit or prohibit mandatory arbitration agreements in consumer contracts and has enacted legislation with such a prohibition with respect to certain mortgage loan agreements and also certain consumer loan agreements to members of the military on active duty and their dependents. Further, the CFPB’s proposed rule to prohibit pre-dispute arbitration clauses is likely to increase class action exposure and litigation expense. See “—The CFPB has proposed new rules affecting the consumer lending industry, and these or subsequent new rules and regulations may significantly impact our US consumer lending business.”
Any judicial decisions, legislation or other rules or regulations that impair our ability to enter into and enforce consumer arbitration agreements and class action waivers could significantly increase our exposure to class action litigation as well as litigation in plaintiff-friendly jurisdictions, which would be costly and could have a material adverse effect on our business, prospects, results of operations, financial condition or cash flows.
We use marketing affiliates to assist us and the originating lender in obtaining new customers, and if such marketing affiliates do not comply with an increasing number of applicable laws and regulations, or if our ability to use such marketing affiliates is otherwise impaired, it could adversely affect our business.
We depend in part on marketing affiliates as a source of new customers for us and, with respect to the Elastic product, for the originating lender. Our marketing affiliates place our advertisements on their websites that direct potential customers to our websites. As a result, the success of our business depends in part on the willingness and ability of marketing affiliates to provide us customer referrals at acceptable prices.
If regulatory oversight of marketing affiliates relationships is increased, through the implementation of new laws or regulations or the interpretation of existing laws or regulations, our ability to use marketing affiliates could be restricted or eliminated.
Marketing affiliates’ failure to comply with applicable laws or regulations, or any changes in laws or regulations applicable to marketing affiliates relationships or changes in the interpretation or implementation of such laws or regulations, could have an adverse effect on our business and could increase negative perceptions of our business and industry. Additionally, the use of marketing affiliates could subject us to additional regulatory cost and expense. If our ability to use marketing affiliates were to be impaired, our business, prospects, results of operations, financial condition or cash flows could be materially adversely affected.
52
Table of Contents
Risk factors
RISKS RELATED TO THIS OFFERING, THE SECURITIES MARKETS AND OWNERSHIP OF OUR COMMON STOCK
The price of our common stock may be volatile and the value of your investment could decline.
Technology stocks have historically experienced high levels of volatility. The trading price of our common stock following this offering may fluctuate substantially. Following the completion of this offering, the market price of our common stock may be higher or lower than the price you pay, depending on many factors, some of which are beyond our control and may not be related to our operating performance. These fluctuations could cause you to lose all or part of your investment in our common stock. Factors that could cause fluctuations in the trading price of our common stock include the following:
| Ø | announcements of new products, services or technologies, relationships with strategic partners, acquisitions or of the termination of, or material changes to, material agreements or of other events by us or our competitors; |
| Ø | changes in economic conditions; |
| Ø | changes in prevailing interest rates; |
| Ø | price and volume fluctuations in the overall stock market from time to time; |
| Ø | significant volatility in the market price and trading volume of technology companies in general and of companies in the financial services industry; |
| Ø | fluctuations in the trading volume of our shares or the size of our public float; |
| Ø | actual or anticipated changes in our operating results or fluctuations in our operating results; |
| Ø | quarterly fluctuations in demand for our loans; |
| Ø | whether our operating results meet the expectations of securities analysts or investors; |
| Ø | actual or anticipated changes in the expectations of investors or securities analysts; |
| Ø | regulatory developments in the US, foreign countries or both and our ability to comply with applicable regulations; |
| Ø | material litigation, including class action law suits; |
| Ø | major catastrophic events; |
| Ø | sales of large blocks of our stock; or |
| Ø | departures of key personnel or directors. |
In addition, if the market for technology and financial services stocks or the stock market in general experiences loss of investor confidence, the trading price of our common stock could decline for reasons unrelated to our business, operating results or financial condition. The trading price of our common stock might also decline in reaction to events that affect other companies in our industry even if these events do not directly affect us. In the past, following periods of volatility in the market price of a company’s securities, securities class action litigation has often been brought against that company. If our stock price is volatile, we may become the target of securities litigation. Securities litigation could result in substantial costs and divert our management’s attention and resources from our business. This could have a material adverse effect on our business, operating results and financial condition.
53
Table of Contents
Risk factors
Sales of substantial amounts of our common stock in the public markets, or the perception that they might occur, could reduce the price that our common stock might otherwise attain and may dilute your voting power and your ownership interest in us.
Sales of a substantial number of shares of our common stock in the public market after this offering, or the perception that these sales could occur, could adversely affect the market price of our common stock and may make it more difficult for you to sell your common stock at a time and price that you deem appropriate. Based on the total number of outstanding shares of our common stock as of March 31, 2016, upon completion of this offering, we will have 30,497,985 shares of common stock outstanding, assuming no exercise of our outstanding options. All of the shares of common stock sold in this offering will be freely tradable without restrictions or further registration under the Securities Act of 1933, or the “Securities Act,” except for any shares held by our affiliates as defined in Rule 144 under the Securities Act.
Subject to certain exceptions described under “Underwriting,” we and all of our directors and officers and substantially all of our equity holders have agreed not to offer, sell or agree to sell, directly or indirectly, any shares of common stock without the permission of UBS Securities LLC, Jefferies LLC and Stifel, Nicolaus & Company, Incorporated for a period of 180 days from the date of this prospectus. When the lock-up period expires, we and our locked-up security holders will be able to sell our shares in the public market. In addition, the underwriters may, in their sole discretion, release all or some portion of the shares subject to lock-up agreements prior to the expiration of the lock-up period. See “Shares eligible for future sale” for more information. Sales of a substantial number of such shares upon expiration, or the perception that such sales may occur, or early release of the lock-up, could cause our share price to fall or make it more difficult for you to sell your common stock at a time and price that you deem appropriate.
Upon completion of this offering, the holders of an aggregate of 14,098,525 shares of our common stock (including shares issuable pursuant to the exercise of options to purchase common stock), or their permitted transferees, will have rights, subject to some conditions, to require us to file registration statements covering the sale of their shares or to include their shares in registration statements that we may file for ourselves or other stockholders. We also intend to register the offer and sale of all shares of common stock that we may issue under our equity compensation plans.
We may issue our shares of common stock or securities convertible into our common stock from time to time in connection with a financing, acquisition, investments or otherwise. Any such issuance could result in substantial dilution to our existing stockholders and cause the trading price of our common stock to decline.
We cannot assure you that a market will develop for our common stock or what the market price of our common stock will be.
Although our common stock has been approved for listing on the New York Stock Exchange, we cannot assure you that an active trading market for our common stock will develop on that exchange or elsewhere or, if developed, that any market will be sustained. We cannot predict the prices at which our common stock will trade. The initial public offering price of our common stock was determined by negotiations with the underwriters and may not bear any relationship to the market price at which our common stock will trade after this offering or to any other established criteria of the value of our business.
54
Table of Contents
Risk factors
We have broad discretion in the use of the net proceeds that we receive in this offering.
The principal purposes of this offering are to increase our capitalization and financial flexibility, create a public market for our stock and thereby enable access to the public equity markets by our employees and stockholders, obtain additional capital and increase our visibility in the marketplace. We expect to use approximately $56.3 million of the net proceeds to repay a portion of the outstanding amount under our financing agreement and the remainder for general corporate purposes, including to fund a portion of the loans made to our customers. Accordingly, our management will have broad discretion over the specific use of the net proceeds that we receive in this offering that we do not use to repay indebtedness and might not be able to obtain a significant return, if any, on investment of such net proceeds. Investors in this offering will need to rely upon the judgment of our management with respect to the use of proceeds. If we do not use the net proceeds that we receive in this offering effectively, then our business, operating results and financial condition could be harmed.
The requirements of being a public company may strain our resources, divert management’s attention and affect our ability to attract and retain qualified board members.
As a public company, we will be subject to the reporting requirements of the Securities Exchange Act of 1934, or the “Exchange Act,” the listing standards of the New York Stock Exchange and other applicable securities rules and regulations. Compliance with these rules and regulations will increase our legal and financial compliance costs, make some activities more difficult, time-consuming or costly, and increase demand on our systems and resources, particularly after we are no longer an “emerging growth company” as defined in the Jumpstart Our Business Startups Act, or the “JOBS Act.” Among other things, the Exchange Act requires that we file annual, quarterly and current reports with respect to our business and operating results and maintain effective disclosure controls and procedures and internal control over financial reporting. In order to maintain and, if required, improve our disclosure controls and procedures and internal control over financial reporting to meet this standard, significant resources and management oversight may be required. As a result, management’s attention may be diverted from other business concerns, which could harm our business and operating results.
In addition, changing laws, regulations and standards relating to corporate governance and public disclosure are creating uncertainty for public companies, increasing legal and financial compliance costs and making some activities more time consuming. These laws, regulations and standards are subject to varying interpretations, in many cases due to their lack of specificity, and, as a result, their application in practice may evolve over time as new guidance is provided by regulatory and governing bodies. This could result in continuing uncertainty regarding compliance matters and higher costs necessitated by ongoing revisions to disclosure and governance practices. We intend to invest resources to comply with evolving laws, regulations and standards, and this investment may result in increased general and administrative expense and a diversion of management’s time and attention from revenues-generating activities to compliance activities. If our efforts to comply with new laws, regulations and standards differ from the activities intended by regulatory or governing bodies, regulatory authorities may initiate legal proceedings against us and our business may be harmed.
However, for so long as we remain an “emerging growth company” as defined in the JOBS Act, we may take advantage of certain exemptions from various requirements that are applicable to public companies that are not “emerging growth companies,” including not being required to comply with the independent auditor attestation requirements of Section 404 of the Sarbanes-Oxley Act, reduced disclosure obligations regarding executive compensation in our periodic reports and proxy statements, and
55
Table of Contents
Risk factors
exemptions from the requirements of holding a nonbinding advisory vote on executive compensation and stockholder approval of any golden parachute payments not previously approved. We may take advantage of these exemptions until we are no longer an “emerging growth company.”
We would cease to be an “emerging growth company” upon the earliest of: (i) the first fiscal year following the fifth anniversary of this offering, (ii) the first fiscal year after our annual gross revenues are $1 billion or more, (iii) the date on which we have, during the previous three-year period, issued more than $1 billion in non-convertible debt securities, or (iv) as of the end of any fiscal year in which the market value of our common stock held by non-affiliates exceeded $700 million as of the end of the second quarter of that fiscal year.
We also expect that being a public company and these new rules and regulations will make it more expensive for us to obtain director and officer liability insurance, and we may be required to accept reduced coverage or incur substantially higher costs to obtain coverage. These factors could also make it more difficult for us to attract and retain qualified members of our Board of Directors and board committees and qualified executive officers.
If securities or industry analysts do not publish research or reports about our business, or publish inaccurate or unfavorable research reports about our business, our share price and trading volume could decline.
The trading market for our common stock will, to some extent, depend on the research and reports that securities or industry analysts publish about us or our business. We do not have any control over these analysts. If one or more of the analysts who cover us should downgrade our shares or change their opinion of our shares, our share price would likely decline. If one or more of these analysts should cease coverage of our company or fail to regularly publish reports on us, we could lose visibility in the financial markets, which could cause our share price or trading volume to decline.
We do not intend to pay dividends for the foreseeable future.
We have never declared or paid any dividends on our common stock. We intend to retain any earnings to finance the operation and expansion of our business, and we do not anticipate paying any cash dividends in the future. In addition, pursuant to our financing agreement, we are prohibited from paying cash dividends without the prior consent of VPC. As a result, you may only receive a return on your investment in our common stock if the market price of our common stock increases.
If you purchase shares of our common stock in this offering, you will experience substantial and immediate dilution.
If you purchase shares of our common stock in this offering, you will experience substantial and immediate dilution of $18.14 per share, based on the initial public offering price of $21.00 per share, and after deducting underwriting discounts and commissions and estimated offering expenses payable by us, because the price that you pay will be substantially greater than the pro forma net tangible book value per share of the common stock that you acquire. This dilution is due in large part to the fact that our earlier investors paid substantially less than the initial public offering price when they purchased their shares of capital stock. You will experience additional dilution upon exercise of options to purchase common stock under our equity incentive plans or if we otherwise issue additional shares of our common stock. See “Dilution.”
56
Table of Contents
Risk factors
Anti-takeover provisions in our charter documents and Delaware law may delay or prevent an acquisition of our company.
Our restated certificate of incorporation and restated bylaws, as we expect they will be in effect upon the completion of this offering, contain provisions that may have the effect of delaying or preventing a change in control of us or changes in our management. The provisions, among other things:
| Ø | establish a classified Board of Directors so that not all members of our Board of Directors are elected at one time; |
| Ø | permit only our Board of Directors to establish the number of directors and fill vacancies on the Board; |
| Ø | provide that directors may only be removed “for cause” and only with the approval of two-thirds of our stockholders; |
| Ø | require two-thirds approval to amend some provisions in our restated certificate of incorporation and restated bylaws; |
| Ø | authorize the issuance of “blank check” preferred stock that our Board of Directors could use to implement a stockholder rights plan, or a “poison pill;” |
| Ø | eliminate the ability of our stockholders to call special meetings of stockholders; |
| Ø | prohibit stockholder action by written consent, which will require that all stockholder actions must be taken at a stockholder meeting; |
| Ø | do not provide for cumulative voting; and |
| Ø | establish advance notice requirements for nominations for election to our Board of Directors or for proposing matters that can be acted upon by stockholders at annual stockholder meetings. |
These provisions, alone or together, could delay or prevent hostile takeovers and changes in control or changes in our management.
In addition, because we are incorporated in Delaware, we are governed by the provisions of Section 203 of the Delaware General Corporation Law, or the “DGCL,” which limits the ability of stockholders owning in excess of 15% of our outstanding voting stock to merge or combine with us in certain circumstances.
Any provision of our restated certificate of incorporation or restated bylaws, as we expect they will be in effect upon the completion of this offering, or Delaware law that has the effect of delaying or deterring a change in control could limit the opportunity for our stockholders to receive a premium for their shares of our common stock, and could also affect the price that some investors are willing to pay for our common stock.
Our Amended and Restated Certificate of Incorporation that will be in effect upon the completion of the IPO designates the Court of Chancery of the State of Delaware as the exclusive forum for certain litigation that may be initiated by our stockholders, which could limit our stockholders’ ability to obtain a favorable judicial forum for disputes with us.
Our Amended and Restated Certificate of Incorporation, as we expect it will be in effect upon the completion of this offering provides that the Court of Chancery of the State of Delaware will be the sole and exclusive forum for (i) any derivative action or proceeding brought on our behalf, (ii) any action
57
Table of Contents
Risk factors
asserting a claim of breach of a fiduciary duty owed to us or our stockholders by any of our directors, officers, employees or agents, (iii) any action asserting a claim against us arising under the DGCL or (iv) any action asserting a claim against us that is governed by the internal affairs doctrine. By becoming a stockholder in our company, you will be deemed to have notice of and have consented to the provisions of our amended and restated certificate of incorporation related to choice of forum. The choice of forum provision in our amended and restated certificate of incorporation may limit our stockholders’ ability to obtain a favorable judicial forum for disputes with us.
If we fail to maintain an effective system of disclosure controls and procedures and internal control over financial reporting, we may not be able to accurately report our financial results or prevent fraud.
Ensuring that we have adequate disclosure controls and procedures, including internal controls over financial reporting, in place so that we can produce accurate financial statements on a timely basis is costly and time-consuming and needs to be reevaluated frequently. We are in the process of documenting, reviewing and, if appropriate, improving our internal controls and procedures in anticipation of becoming a public company and being subject to the requirements of Section 404 of the Sarbanes-Oxley Act of 2002, or the “Sarbanes-Oxley Act,” which will require annual management assessments of the effectiveness of our internal controls over financial reporting and, when we cease to be an emerging growth company under the JOBS Act, a report by our independent auditors addressing these assessments. Our management may conclude that our internal controls over financial reporting are not effective if we fail to cure any identified material weakness or otherwise. Moreover, even if our management concludes that our internal controls over financial reporting are effective, our independent registered public accounting firm may conclude that our internal controls over financial reporting are not effective. In the future, our independent registered public accounting firm may not be satisfied with our internal controls over financial reporting or the level at which our controls are documented, designed, operated or reviewed, or it may interpret the relevant requirements differently from us. In addition, during the course of the evaluation, documentation and testing of our internal controls over financial reporting, we may identify deficiencies that we may not be able to remediate in time to meet the deadline imposed by the Securities and Exchange Commission, or the “SEC,” for compliance with the requirements of Section 404 of the Sarbanes-Oxley Act. Any such deficiencies may also subject us to adverse regulatory consequences. If we fail to achieve and maintain the adequacy of our internal controls over financial reporting, as these standards may be modified, supplemented or amended from time to time, we may be unable to report our financial information on a timely basis, may not be able to conclude on an ongoing basis that we have effective internal control over financial reporting in accordance with the Sarbanes-Oxley Act, and may suffer adverse regulatory consequences or violations of listing standards. Any of the above could also result in a negative reaction in the financial markets due to a loss of investor confidence in the reliability of our financial statements.
58
Table of Contents
This prospectus contains forward-looking statements that are based on our management’s beliefs and assumptions and on information currently available to our management. The forward-looking statements are contained principally in “Prospectus summary,” “Risk factors,” “Management’s discussion and analysis of financial condition and results of operations” and “Business.” Forward-looking statements include information concerning our strategy, future operations, future financial position, future revenues, projected expenses, margins, prospects and plans and objectives of management. Forward-looking statements include all statements that are not historical facts and can be identified by terms such as “anticipate,” “believe,” “could,” “seek,” “estimate,” “expect,” “intend,” “may,” “plan,” “potential,” “predict,” “project,” “should,” “will,” “would” or similar expressions and the negatives of those terms. Forward-looking statements contained in this prospectus include, but are not limited to, statements about:
| Ø | our future financial performance, including our expectations regarding our revenue, cost of revenue, growth rate of revenue, cost of borrowing, credit losses, marketing costs, net charge-offs, gross profit or gross margin, operating expenses, operating margins, ability to generate cash flow and ability to achieve and maintain future profitability; |
| Ø | our use of the proceeds of this offering; |
| Ø | the availability of debt financing, funding sources and disruptions in credit markets; |
| Ø | our ability to meet anticipated cash operating expenses and capital expenditure requirements; |
| Ø | anticipated trends, growth rates, seasonal fluctuations and challenges in our business and in the markets in which we operate; |
| Ø | our ability to anticipate market needs and develop new and enhanced or differentiated products, services and mobile apps to meet those needs, and our ability to successfully monetize them; |
| Ø | our expectations with respect to trends in our average portfolio effective APR; |
| Ø | our anticipated growth and growth strategies and our ability to effectively manage that growth; |
| Ø | our anticipated expansion of relationships with strategic partners; customer demand for our product and our ability to rapidly scale our business in response to fluctuations in demand; |
| Ø | our ability to attract potential customers and retain existing customers and our cost of customer acquisition; |
| Ø | the ability of customers to repay loans; |
| Ø | interest rates and origination fees on loans; |
| Ø | the impact of competition in our industry and innovation by our competitors; |
| Ø | our ability to attract and retain necessary qualified directors, officers and employees to expand our operations; |
| Ø | our reliance on third-party service providers; |
| Ø | our access to the automated clearinghouse system; |
| Ø | the efficacy of our marketing efforts and relationships with marketing affiliates; |
| Ø | our anticipated direct marketing costs and spending; |
| Ø | the evolution of technology affecting our products, services and markets; |
| Ø | continued innovation of our analytics platform; |
| Ø | our ability to prevent security breaches, disruption in service and comparable events that could compromise the personal and confidential information held in our data systems, reduce the attractiveness of the platform or adversely impact our ability to service loans; |
59
Table of Contents
Forward-looking statements
| Ø | our ability to detect and filter fraudulent or incorrect information provided to us by our customers or by third parties; |
| Ø | our ability to adequately protect our intellectual property; |
| Ø | our compliance with applicable local, state, federal and foreign laws; |
| Ø | our compliance with current or future applicable regulatory developments and regulations, including developments or changes from the CFPB; |
| Ø | regulatory developments or scrutiny by agencies regulating our business or the businesses of our third-party partners; |
| Ø | public perception of our business and industry; |
| Ø | the anticipated effect on our business of litigation or regulatory proceedings to which we or our officers are a party; |
| Ø | the anticipated effect on our business of natural or man-made catastrophes; |
| Ø | the increased expenses and administrative workload associated with being a public company; |
| Ø | failure to maintain an effective system of internal controls necessary to accurately report our financial results and prevent fraud; |
| Ø | our liquidity and working capital requirements; |
| Ø | the estimates and estimate methodologies used in preparing our consolidated financial statements; |
| Ø | the utility of non-GAAP financial measures; |
| Ø | the future trading prices of our common stock and the impact of securities analysts’ reports on these prices; |
| Ø | our anticipated development and release of certain products and applications and changes to certain products; |
| Ø | our anticipated investing activity; and |
| Ø | trends anticipated to continue as our portfolio of loans matures. |
We caution you that the foregoing list may not contain all of the forward-looking statements made in this prospectus.
We believe that these statements constitute “forward-looking statements” within the meaning of Rule 175 under the Securities Act of 1933, as amended, and Rule 3b-6 under the Securities Exchange Act of 1934, as amended. Forward-looking statements involve known and unknown risks, uncertainties and other factors that may cause our actual results, performance or achievements to be materially different from any future results, performance or achievements expressed or implied by the forward-looking statements. We discuss these risks in greater detail in “Risk factors” and elsewhere in this prospectus. Given these uncertainties, you should not place undue reliance on these forward-looking statements. Also, forward-looking statements represent our management’s beliefs and assumptions only as of the date of this prospectus. You should read this prospectus and the documents that we have filed as exhibits to the registration statement, of which this prospectus is a part, completely and with the understanding that our actual future results may be materially different from what we expect.
Except as required by law, we assume no obligation to update these forward-looking statements publicly, or to update the reasons actual results could differ materially from those anticipated in these forward-looking statements, even if new information becomes available in the future.
60
Table of Contents
This prospectus contains estimates, statistical data, and other information concerning our industry, including market size and growth rates, that are based on industry publications, surveys and forecasts, including those by the CFPB, Friends Provident Foundation, CFI Group and other publicly available sources. The industry and market information included in this prospectus involves a number of assumptions and limitations.
The sources of industry and market data contained in this prospectus are listed below:
| Ø | Board of Governors of the Federal Reserve System, Report on the Economic Well-Being of U.S. Households, 2014, 2015. |
| Ø | CFPB, Payday Loans and Deposit Advance Products: A White Paper of Initial Findings, April 2013. |
| Ø | CFPB, Data Point: Payday Lending, March 2014. |
| Ø | CFPB, Arbitration Study, Report to Congress, Pursuant to Dodd-Frank Wall Street Reform and Consumer Protection Act §1028(a), March 2015. |
| Ø | Centre for Economics and Business Research, Future Trends in UK Banking, February 2015. |
| Ø | CFI Group, Bank Satisfaction Barometer 2013, October 2013. |
| Ø | Competition & Markets Authority, Market Investigation into Payday Lending, Notice of Possible Remedies Under Rule 11 of the CMA Rules of Procedure, June 11, 2014. |
| Ø | Competition & Markets Authority, Payday Lending Investigation, Summary of Provisional Findings Report, June 11, 2014. |
| Ø | Competition & Markets Authority, Payday Lending Market Investigation Final Report, February 24, 2015. |
| Ø | Corporation for Enterprise Development, Treading Water in the Deep End: Findings from the 2014 Assets and Opportunity Scorecard, January 2014. |
| Ø | FICO, Expanding Credit Opportunities, July 2015. |
| Ø | Financial Inclusion Commission, Improving the Financial Health of the Nation, March 2015. |
| Ø | Friends Provident Foundation, Credit and Low-Income Consumers, November 2011. |
| Ø | House of Commons Welsh Affairs Committee, The Impact of Changes Benefit in Wales, October 2013. |
| Ø | The Information, Online Lenders Facing Marketing War, August 2015. |
| Ø | J.P. Morgan Chase & Co., Weathering Volatility: Big Data on the Financial Ups and Downs of U.S. Individuals, May 2015. |
The industry in which we operate is subject to a high degree of uncertainty and risk due to a variety of factors, including those described in “Risk factors” and elsewhere in this prospectus. These and other factors could cause our actual results to differ materially from those expressed in the estimates made by the independent parties and by us.
61
Table of Contents
We estimate that the net proceeds from our sale of 3,600,000 shares of common stock in this offering at an assumed initial public offering price of $21.00 per share, the midpoint of the price range set forth on the front cover of this prospectus, after deducting estimated underwriting discounts and commissions and estimated offering expenses, will be approximately $66.3 million, or $76.9 million if the underwriters’ option to purchase additional shares is exercised in full. A $1.00 increase (decrease) in the assumed initial public offering price would increase (decrease) the net proceeds to us from this offering by $3.3 million, assuming the number of shares offered by us, as set forth on the front cover of this prospectus, remains the same and after deducting the estimated underwriting discounts and commissions. Similarly, an increase (decrease) of one million shares in the number of shares offered by us in this offering would increase (decrease) the net proceeds to us from this offering by $19.7 million, assuming an initial public offering price of $21.00 per share, the midpoint of the price range set forth on the cover page of this prospectus, remains the same, after deducting the underwriting discount and commissions and estimated offering expenses payable by us.
We expect to use approximately $56.3 million of the net proceeds to repay a portion of the outstanding amount under the VPC Facility and the remainder for general corporate purposes, including to fund a portion of the loans made to our customers.
Pursuant to our financing agreement, the outstanding borrowings under the VPC Facility were used to finance customer loan growth for our Rise and Sunny products. Our financing agreement will mature on January 30, 2018 and, as of March 31, 2016, the $284.3 million outstanding under our financing agreement bears interest at the 3-month LIBOR rate plus 13-18%. See “Management’s discussion and analysis of financial condition and results of operations—Liquidity and Capital Resources—Debt facilities—VPC Facility.”
We will have broad discretion over the uses of the net proceeds in this offering. Pending these uses, we intend to invest the net proceeds from this offering in short-term, investment-grade interest-bearing securities such as money market accounts, certificates of deposit, commercial paper and guaranteed obligations of the US government.
We have never declared or paid cash dividends on our common stock. We currently intend to retain all available funds and any future earnings for use in the operation of our business and do not anticipate paying any dividends on our common stock in the foreseeable future. In addition, pursuant to our financing agreement, we are prohibited from paying cash dividends without the prior consent of VPC. Any future determination to declare dividends will be made at the discretion of our Board of Directors and will depend on our financial condition, operating results, capital requirements, general business conditions and other factors that our Board of Directors may deem relevant.
62
Table of Contents
The following table sets forth our consolidated cash and cash equivalents and capitalization as of March 31, 2016 on:
| Ø | an actual basis; |
| Ø | a pro forma basis to give effect to: (i) the automatic conversion of all outstanding shares of our convertible preferred stock into 5,639,410 shares of our common stock immediately prior to the 2.5-for-1 forward stock split of our common stock and immediately prior to the completion of this offering, (ii) the application of the 2.5-for-1 forward stock split to all common stock after such conversion and (iii) the filing of our amended and restated certificate of incorporation; and |
| Ø | a pro forma as adjusted basis to reflect: (i) the pro forma adjustments set forth above, (ii) our receipt of the net proceeds from our sale of 3,600,000 shares of common stock in this offering at an assumed initial public offering price of $21.00 per share, the midpoint of the price range set forth on the front cover of this prospectus, after deducting estimated underwriting discounts and commissions and estimated offering expenses, and (iii) the use of proceeds from this offering to repay a portion of the amounts outstanding under our VPC Facility as described in “Use of proceeds.” |
| As of March 31, 2016 | ||||||||||||
| (dollars in thousands) | Actual | Pro forma |
Pro forma as adjusted(1)(2) |
|||||||||
| Cash and cash equivalents |
$ | 72,871 | $ | 72,871 | $ | 82,871 | ||||||
|
|
|
|
|
|
|
|||||||
| Financing agreement |
357,800 | 357,800 | 301,500 | |||||||||
|
|
|
|
|
|
|
|||||||
| Convertible preferred stock: |
||||||||||||
| Series A preferred stock, par value $0.0001, 2,957,059 shares authorized, issued and outstanding at March 31, 2016, no shares issued and outstanding pro forma and pro forma as adjusted |
3 | — | — | |||||||||
| Series B preferred stock, par value $0.0001, 2,682,351 shares authorized, issued and outstanding at March 31, 2016, no shares issued and outstanding pro forma and pro forma as adjusted |
3 | — | — | |||||||||
|
|
|
|
|
|
|
|||||||
| Total convertible preferred stock |
6 | — | — | |||||||||
| Stockholders’ equity: |
||||||||||||
| Common stock, par value $0.0004, 41,676,750 shares authorized and 12,799,460 shares issued and outstanding, actual; 41,676,750 shares authorized and 26,897,985 shares issued and outstanding, pro forma; and 41,676,750 shares authorized and 30,497,985 shares issued and outstanding, pro forma as adjusted |
5 | 11 | 15 | |||||||||
| Additional paid-in capital |
87,269 | 87,269 | 153,565 | |||||||||
| Accumulated other comprehensive loss, net of taxes |
411 | 411 | 411 | |||||||||
| Accumulated deficit |
(48,220 | ) | (48,220 | ) | (48,220 | ) | ||||||
|
|
|
|
|
|
|
|||||||
| Total stockholders’ equity |
39,471 | 39,471 | 105,771 | |||||||||
|
|
|
|
|
|
|
|||||||
| Total capitalization |
$ | 397,271 | $ | 397,271 | $ | 407,271 | ||||||
|
|
|
|
|
|
|
|||||||
| (1) | Each $1.00 increase (decrease) in the assumed initial public offering price of $21.00 per share, which is the midpoint of the estimated offering price range set forth on the cover page of this prospectus, would increase (decrease) each of cash and cash equivalents, additional paid-in-capital, total stockholders’ equity and total capitalization by approximately $3.3 million, assuming all other adjustments detailed above remain the same. Similarly, an increase (decrease) of one million shares in the number of shares offered by us in this offering would increase (decrease) each of cash and cash equivalents, additional paid-in capital, total stockholders’ equity and total capitalization by approximately $19.7 million, assuming all other adjustments detailed above remain the same. |
| (2) | The pro forma as adjusted information discussed above is illustrative only and will be adjusted based on the actual initial public offering price and other terms of this offering determined at pricing. |
63
Table of Contents
Capitalization
The number of shares of our common stock set forth in the table above excludes 4,264,223 shares of common stock reserved and common stock available for issuance under our 2014 Equity Incentive Plan, or “2014 Plan,” which comprises:
| Ø | 3,997,278 shares of common stock issuable upon the exercise of options outstanding as of March 31, 2016, with a weighted average exercise price of $3.90 per share and per share exercise prices ranging from $2.12 to $8.32; |
| Ø | 266,945 shares of common stock issuable upon the exercise of options available for grant. |
The information above is illustrative only and our capitalization following the completion of this offering will be adjusted based on the actual initial public offering price and other terms of this offering determined at pricing. You should read this table together with “Management’s discussion and analysis of financial condition and results of operations” and our financial statements and the related notes appearing elsewhere in this prospectus.
64
Table of Contents
If you invest in our common stock, your interest will be diluted to the extent of the difference between the amount per share paid by purchasers of shares of common stock in this initial public offering and the pro forma as adjusted net tangible book value per share of common stock immediately after this offering.
As of March 31, 2016, our pro forma net tangible book value was approximately $21.0 million, or $0.78 per share of common stock. Pro forma net tangible book value per share represents the amount of our total tangible assets less our total liabilities, divided by the shares of common stock outstanding at March 31, 2016 assuming the conversion of all outstanding shares of our convertible preferred stock into common stock and the application of the 2.5-for-1 forward stock split to all common stock after such conversion.
After giving effect to (i) our sale of 3,600,000 shares of common stock in this offering at an assumed initial public offering price of $21.00 per share, the midpoint of the price range set forth on the front cover of this prospectus, and after deducting estimated underwriting discounts and commissions and estimated offering expenses, and (ii) the use of proceeds from this offering to repay a portion of the amounts outstanding under our VPC Facility as described in “Use of proceeds,” our pro forma as adjusted net tangible book value at March 31, 2016 would have been approximately $87.3 million, or $2.86 per share of common stock. This represents an immediate increase in pro forma as adjusted net tangible book value of $2.08 per share to existing stockholders and an immediate dilution of $18.14 per share to new investors purchasing shares in this offering.
The following table illustrates this dilution at March 31, 2016:
| Assumed initial public offering price per share |
$ | 21.00 | ||||||
| Pro forma net tangible book value per share |
$ | 0.78 | ||||||
| Increase per share attributable to this offering |
2.08 | |||||||
|
|
|
|||||||
| Pro forma as adjusted net tangible book value per share after this offering |
2.86 | |||||||
|
|
|
|||||||
| Net tangible book value dilution per share to new investors in this offering |
$ | 18.14 | ||||||
|
|
|
A $1.00 increase (decrease) in the assumed initial public offering price of $21.00 per share, the midpoint of the price range set forth on the front cover of this prospectus, would increase (decrease) our pro forma net tangible book value, as adjusted to give effect to this offering, by $0.11 per share and the dilution in pro forma as adjusted net tangible book value per share to new investors in this offering by $0.89 per share, assuming the number of shares offered by us, as set forth on the front cover of this prospectus, remains the same and after deducting estimated underwriting discounts and commissions and estimated offering expenses. Similarly, an increase (decrease) of one million shares in the number of shares offered by us in this offering would increase (decrease) our pro forma net tangible book value, as adjusted to give effect to this offering by $0.54 per share and the dilution in pro forma as adjusted net tangible book value per share to new investors in this offering by $0.54 per share, assuming an initial public offering price of $21.00 per share, the midpoint of the price range set forth on the cover page of this prospectus, remains the same, after deducting the underwriting discount and commissions and estimated offering expenses payable by us.
If the underwriters exercise their option to purchase additional shares in full, the following will occur:
| Ø | the pro forma as adjusted net tangible book value per share of our common stock after giving effect to this offering would be $3.16 per share; |
65
Table of Contents
Dilution
| Ø | the pro forma as adjusted percentage of shares of our common stock held by existing stockholders will decrease to approximately 86.7% of the total number of pro forma as adjusted shares of our common stock outstanding after this offering; |
| Ø | the pro forma as adjusted number of shares of our common stock held by investors participating in this offering will increase to 4,140,000, or approximately 13.3% of the total pro forma as adjusted number of shares of our common stock outstanding after this offering; and |
| Ø | the dilution in net tangible book value per share to new investors in this offering would be $17.84 per share. |
The following table summarizes, on a pro forma as adjusted basis as of March 31, 2016, assuming the conversion of all outstanding shares of our convertible preferred stock into common stock, the total number of shares of common stock purchased from us, the total consideration paid to us, and the weighted average price per share paid to us by existing stockholders and by new investors purchasing shares in this offering at the initial public offering price of $21.00 per share, the midpoint of the price range set forth on the front cover of this prospectus, before deducting estimated underwriting discounts and commissions and estimated offering expenses:
| Shares purchased | Total consideration | Weighted average price per share |
||||||||||||||||||
| Number | Percent | Amount | Percent | |||||||||||||||||
| Existing stockholders(1) |
26,897,985 | 78.0 | % | $ | 86,124,185 | 48.6 | % | $ | 3.20 | |||||||||||
| Exercised options |
3,997,278 | 11.6 | 15,589,382 | 8.8 | 3.90 | |||||||||||||||
| New investors(2) |
3,600,000 | 10.4 | 75,600,000 | 42.6 | 21.00 | |||||||||||||||
|
|
|
|
|
|
|
|
|
|||||||||||||
| Total |
34,495,263 | 100.0 | % | $ | 177,313,569 | 100.0 | % | |||||||||||||
|
|
|
|
|
|
|
|
|
|||||||||||||
| (1) | Number includes (i) 25,706,357 shares contributed by TFI in connection with the Spin-Off pursuant to the separation and distribution agreement and (ii) 1,191,628 shares issued upon the exercise of stock options. |
| (2) | May include purchases, if any, of the shares in this offering by the existing stockholders through a directed share program, as described in this prospectus, or otherwise, at the initial public offering price. |
Each $1.00 increase (decrease) in the assumed public offering price of $21.00 per share, the midpoint of the price range set forth on the front cover of this prospectus, would increase (decrease) total consideration paid by new investors, total consideration paid by all stockholders and the average price per share paid by all stockholders by $3.6 million, $3.6 million and $0.10, respectively, assuming the number of shares offered by us, as set forth on the front cover of this prospectus, remains the same and after deducting estimated underwriting discounts and commissions and estimated offering expenses. Similarly, an increase (decrease) of one million shares in the number of shares offered by us in this offering would increase (decrease) total consideration paid by new investors, total consideration paid by all stockholders and the average price per share paid by all stockholders by $21 million, $21 million and $0.45, respectively, assuming an initial public offering price of $21.00 per share, the midpoint of the price range set forth on the cover page of this prospectus, remains the same, after deducting the underwriting discount and commissions and estimated offering expenses payable by us.
The foregoing discussion and tables exclude:
| Ø | 266,945 shares of common stock reserved for issuance pursuant to the exercise of options available for grant under our 2014 Equity Incentive Plan, or “2014 Plan,” as of March 31, 2016. |
66
Table of Contents
Dilution
The foregoing discussion and tables assume the following:
| Ø | the conversion of all outstanding shares of our convertible preferred stock into an aggregate of 5,639,410 shares of common stock immediately prior to the 2.5-for-1 forward stock split of our common stock and immediately prior to the completion of this offering; |
| Ø | a 2.5-for-1 forward stock split of our common stock to be effected immediately prior to the completion of this offering; |
| Ø | the filing of our amended and restated certificate of incorporation in connection with the completion of this offering; |
| Ø | an IPO price per share in excess of our highest option exercise prices; |
| Ø | the exercise of options to purchase 3,997,278 shares of common stock, issuable upon the exercise of options outstanding as of March 31, 2016, with a weighted average exercise price of $3.90 per share and per share exercise prices ranging from $2.12 to $8.32; and |
| Ø | no exercise of the underwriters’ option to purchase additional shares. |
To the extent that any options become exercisable, new investors will experience further dilution. In addition, we may grant more options in the future.
67
Table of Contents
Selected historical consolidated financial data
You should read the following selected combined and consolidated financial data below in conjunction with “Management’s discussion and analysis of financial condition and results of operations” and the combined and consolidated financial statements, related notes and other financial information included elsewhere in this prospectus.
The combined and consolidated statements of operations data for the years ended December 31, 2015 and 2014 are derived from our audited combined and consolidated financial statements included elsewhere in this prospectus. The consolidated statements of operations data for the three months ended March 31, 2016 and 2015 and consolidated balance sheet data as of March 31, 2016 are derived from our unaudited condensed consolidated interim financial statements included elsewhere in this prospectus. The unaudited consolidated financial data for the three months ended March 31, 2016 and 2015 and as of March 31, 2016 include all adjustments, consisting only of normal recurring accruals that are necessary in the opinion of our management for a fair presentation of our financial position and results of operations for these periods. Our historical results are not necessarily indicative of the results that may be expected in any future period.
Prior to May 1, 2014, we operated as a separately identifiable line of business of TFI. On May 1, 2014, TFI contributed the assets and liabilities associated with its direct lending and branded products business to us and distributed its interest in our company to its stockholders. Our combined financial statements for periods prior to the Spin-Off reflect the historical results of operations and historical basis of assets and liabilities of the direct lending business that was contributed to us. The combined statements of operations for periods prior to the Spin-Off include expense allocations for general overhead and corporate functions historically provided to the direct lending business. These allocations were made based on a specifically identifiable basis or using allocation methods such as revenues, headcount or other reasonable methods and have been included in our combined financial statements for periods prior to May 1, 2014. Prior to May 1, 2014, all intercompany transactions between us and TFI have been included within the combined and consolidated financial statements and are considered to be effectively settled through contributions or distributions within TFI’s net investment at the time the transactions were recorded. Beginning May 1, 2014, all material intercompany transactions have been eliminated.
68
Table of Contents
Selected historical consolidated financial data
| For the years ended December 31, |
For the three months ended March 31, |
|||||||||||||||
| Combined and consolidated statements of operations data (dollars in thousands, except per share amounts) |
2015 | 2014 | 2016 | 2015 | ||||||||||||
| (unaudited) | ||||||||||||||||
| Revenues |
$ | 434,006 | $ | 273,718 | $ | 130,722 | $ | 89,506 | ||||||||
| Cost of sales: |
||||||||||||||||
| Provision for loan losses |
232,650 | 170,908 | 59,089 | 39,284 | ||||||||||||
| Direct marketing costs |
61,032 | 60,166 | 9,606 | 9,866 | ||||||||||||
| Other cost of sales |
15,197 | 10,603 | 3,583 | 2,606 | ||||||||||||
|
|
|
|
|
|
|
|
|
|||||||||
| Total cost of sales |
308,879 | 241,677 | 72,278 | 51,756 | ||||||||||||
|
|
|
|
|
|
|
|
|
|||||||||
| Gross profit |
125,127 | 32,041 | 58,444 | 37,750 | ||||||||||||
|
|
|
|
|
|
|
|
|
|||||||||
| Operating expenses: |
||||||||||||||||
| Compensation and benefits |
60,568 | 48,010 | 16,100 | 13,921 | ||||||||||||
| Professional services |
25,134 | 18,662 | 7,249 | 4,748 | ||||||||||||
| Selling and marketing |
7,567 | 7,366 | 2,505 | 2,490 | ||||||||||||
| Occupancy and equipment |
9,690 | 8,043 | 2,735 | 2,333 | ||||||||||||
| Depreciation and amortization |
8,898 | 8,317 | 2,633 | 2,068 | ||||||||||||
| Other |
4,303 | 2,766 | 706 | 569 | ||||||||||||
|
|
|
|
|
|
|
|
|
|||||||||
| Total operating expenses |
116,160 | 93,164 | 31,928 | 26,129 | ||||||||||||
|
|
|
|
|
|
|
|
|
|||||||||
| Operating income (loss) |
8,967 | (61,123 | ) | 26,516 | 11,621 | |||||||||||
|
|
|
|
|
|
|
|
|
|||||||||
| Other income (expense): |
||||||||||||||||
| Net interest expense |
(36,674 | ) | (12,939 | ) | (13,500 | ) | (6,755 | ) | ||||||||
| Foreign currency transaction loss |
(2,385 | ) | (1,408 | ) | (1,358 | ) | (1,459 | ) | ||||||||
| Non-operating income |
5,523 | — | — | — | ||||||||||||
|
|
|
|
|
|
|
|
|
|||||||||
| Total other expense |
(33,536 | ) | (14,347 | ) | (14,858 | ) | (8,214 | ) | ||||||||
|
|
|
|
|
|
|
|
|
|||||||||
| Income (loss) before taxes |
(24,569 | ) | (75,470 | ) | 11,658 | 3,407 | ||||||||||
| Income tax provision (benefit) |
(4,658 | ) | (20,710 | ) | 5,866 | 2,509 | ||||||||||
|
|
|
|
|
|
|
|
|
|||||||||
| Income (loss) from continuing operations |
(19,911 | ) | (54,760 | ) | 5,792 | 898 | ||||||||||
|
|
|
|
|
|
|
|
|
|||||||||
| Income from discontinued operations, net of tax |
— | 135 | — | — | ||||||||||||
|
|
|
|
|
|
|
|
|
|||||||||
| Net income (loss) |
$ | (19,911 | ) | $ | (54,625 | ) | $ | 5,792 | $ | 898 | ||||||
|
|
|
|
|
|
|
|
|
|||||||||
| Basic earnings (loss) per share |
$ | (3.97 | ) | $ | (11.59 | ) | $ | 1.13 | $ | 0.18 | ||||||
| Diluted earnings (loss) per share |
$ | (3.97 | ) | $ | (11.59 | ) | $ | 0.51 | $ | 0.08 | ||||||
| Pro forma earnings (loss) per share: |
||||||||||||||||
| Basic(1) |
$ | (0.75 | ) | $ | (2.11 | ) | $ | 0.22 | $ | 0.03 | ||||||
| Diluted(1) |
$ | (0.75 | ) | $ | (2.11 | ) | $ | 0.20 | $ | 0.03 | ||||||
| Basic, as adjusted(2) |
$ | (0.66 | ) | $ | (1.85 | ) | $ | 0.19 | $ | 0.03 | ||||||
| Diluted, as adjusted(2) |
$ | (0.66 | ) | $ | (1.85 | ) | $ | 0.18 | $ | 0.03 | ||||||
| Basic weighted average shares outstanding |
5,010,339 | 4,711,794 | 5,118,983 | 4,892,431 | ||||||||||||
| Diluted weighted average shares outstanding |
5,010,339 | 4,711,794 | 11,359,870 | 10,986,502 | ||||||||||||
| Weighted average shares used in computing pro forma net income (loss) per share |
||||||||||||||||
| Basic(1) |
26,624,373 | 25,878,010 | 26,895,983 | 26,329,603 | ||||||||||||
| Diluted(1) |
26,624,373 | 25,878,010 | 28,399,675 | 27,466,255 | ||||||||||||
| Basic, as adjusted(2) |
30,224,373 | 29,478,010 | 30,495,983 | 29,929,603 | ||||||||||||
| Diluted, as adjusted(2) |
30,224,373 | 29,478,010 | 31,999,675 | 31,066,255 | ||||||||||||
| (1) | Pro forma basic and diluted net income (loss) per share of common stock have been calculated assuming (i) the conversion of all outstanding shares of convertible preferred stock at March 31, 2016 and 2015 and at December 31, 2015 and 2014 into an aggregate of 5,639,410 shares (prior to the 2.5-for-1 forward stock split) of common stock as of the beginning of the applicable period or at the time of issuance, if later and (ii) the application of the 2.5-for-1 forward stock split to all common stock after such conversion. |
| (2) | Pro forma net income (loss) per share of common stock, as adjusted, gives effect to (i) the sale by us of 3,600,000 shares of our common stock in this offering; (ii) the automatic conversion of all outstanding shares of convertible preferred stock into an aggregate of 5,639,410 shares (prior to the 2.5-for-1 forward stock split) of our common stock; (iii) the application of the 2.5-for-1 forward stock split to all common stock after such conversion and (iv) the use of proceeds from this offering to repay a portion of the amounts outstanding under the Victory Park Capital credit facility, or the “VPC Facility,” as described in “Use of proceeds,” as if the offering and those transactions had occurred on March 31, 2016. The number of shares is computed based on an assumed initial public offering price of $21.00 per share, the midpoint of the price range set forth on the cover page of this prospectus. |
69
Table of Contents
Selected historical consolidated financial data
| As of and for the years ended December 31, |
As of and for the three months ended March 31, |
|||||||||||||||
| Other financial and operational data (dollars in thousands, except as noted) |
2015 | 2014 | 2016 | 2015 | ||||||||||||
| (unaudited) | ||||||||||||||||
| Adjusted EBITDA(1) |
$ | 17,865 | $ | (52,806 | ) | $ | 29,149 | $ | 13,689 | |||||||
| Free cash flow(2) |
$ | (30,931 | ) | $ | (47,358 | ) | $ | 6,188 | $ | (11,694 | ) | |||||
| Number of new customer loans |
238,238 | 202,656 | 40,717 | 29,944 | ||||||||||||
| Number of loans outstanding |
222,723 | 146,046 | 201,076 | 131,577 | ||||||||||||
| Customer acquisition cost per new loan (in dollars) |
$ | 256 | $ | 297 | $ | 236 | $ | 329 | ||||||||
| Net charge-offs(3) |
$ | 214,795 | $ | 138,559 | $ | 69,010 | $ | 45,694 | ||||||||
| Additional provision for loan losses(3) |
17,855 | 32,349 | (9,921 | ) | (6,410 | ) | ||||||||||
|
|
|
|
|
|
|
|
|
|||||||||
| Provision for loan losses |
$ | 232,650 | $ | 170,908 | $ | 59,089 | $ | 39,284 | ||||||||
|
|
|
|
|
|
|
|
|
|||||||||
| Past due combined loans receivable – principal as a percentage of combined loans receivable – principal(4) |
12 | % | 15 | % | 12 | % | 14 | % | ||||||||
| Net charge-offs as a percentage of revenues |
49 | % | 51 | % | 53 | % | 51 | % | ||||||||
| Total provision for loan losses a percentage of revenues |
54 | % | 62 | % | 45 | % | 44 | % | ||||||||
| Combined loan loss reserve(5) |
$ | 65,784 | $ | 48,491 | $ | 55,592 | $ | 41,718 | ||||||||
| Combined loan loss reserve as a percentage of combined loans receivable(5) |
17 | % | 22 | % | 16 | % | 22 | % | ||||||||
| Effective APR of combined loan portfolio |
173 | % | 202 | % | 153 | % | 189 | % | ||||||||
| Ending combined loans receivable – principal(4) |
$ | 356,069 | $ | 201,660 | $ | 320,682 | $ | 176,658 | ||||||||
| (1) | Adjusted EBITDA is not a financial measure prepared in accordance with GAAP. Adjusted EBITDA represents our net income (loss), adjusted to exclude: net interest expense primarily associated with notes payable under the VPC Facility and ESPV Facility used to fund or purchase loans; foreign currency gains and losses associated with our UK operations; depreciation and amortization expense on fixed assets and intangible assets; adjustments to contingent consideration payable related to companies previously acquired prior to the Spin-Off; miscellaneous gains and losses associated with the sale of assets related to discontinued operations; and income taxes. See “Management’s discussion and analysis of financial condition and results of operations—Non-GAAP Financial Measures” for more information and for a reconciliation of Adjusted EBITDA to net income (loss), the most directly comparable financial measure calculated in accordance with GAAP. |
| (2) | Free cash flow is not a financial measure prepared in accordance with GAAP. Free cash flow represents our net cash from operating activities adjusted for the principal loan net charge-offs and capital expenditures incurred during the period. See “Management’s discussion and analysis of financial condition and results of operations—Non-GAAP Financial Measures” for more information and a reconciliation of free cash flow to net cash provided by operating activities. |
| (3) | Net charge-offs and additional provision for loan losses are not a financial measure prepared in accordance with GAAP. Net charge-offs include the amount of principal and accrued interest on loans that are more than 60 days past due, or sooner if we receive notice that the loan will not be collected, such as a bankruptcy notice or identified fraud, offset by any recoveries. Additional provision for loan losses is the amount of provision for loan losses needed for a particular period to adjust the combined loan loss reserve to the appropriate level in accordance with our underlying loan loss reserve methodology. See “Management’s discussion and analysis of financial condition and results of operations—Non-GAAP Financial Measures” for more information and for a reconciliation to provision for loan losses, the most directly comparable financial measure calculated in accordance with GAAP. |
| (4) | Combined loans receivable is defined as loans owned by the company plus loans originated and owned by third-party lenders pursuant to our CSO programs. See “Management’s discussion and analysis of financial condition and results of operations—Non-GAAP Financial Measures” for more information and for a reconciliation of Combined loans receivable to loans receivable, net, the most directly comparable financial measure calculated in accordance with GAAP. |
| (5) | Combined loan loss reserve is defined as the loan loss reserve for loans owned by the company plus the loan loss reserve for loans originated and owned by third-party lenders and guaranteed by the company. See “Management’s discussion and analysis of financial condition and results of operations—Non-GAAP Financial Measures” for more information and for a reconciliation of Combined loan loss reserve to loan loss reserve, the most directly comparable financial measure calculated in accordance with GAAP. |
70
Table of Contents
Selected historical consolidated financial data
| As of March 31, 2016 | ||||||||||||
| Selected consolidated balance sheet data (dollars in thousands) | Actual | Pro forma(1) | Pro forma as adjusted(2) |
|||||||||
| (unaudited) | ||||||||||||
| Cash and cash equivalents |
$ | 72,871 | $ | 72,871 | $ | 82,871 | ||||||
| Loans receivable, net of allowance for loan losses of $59,771 |
257,763 | 257,763 | 257,763 | |||||||||
| Total assets |
429,547 | 429,547 | 439,547 | |||||||||
| Total liabilities |
390,076 | 390,076 | 333,776 | |||||||||
| Total convertible preferred stock |
6 | — | — | |||||||||
| Total stockholders’ equity |
$ | 39,471 | $ | 39,471 | $ | 105,771 | ||||||
| (1) | The pro forma column reflects (i) the conversion of all outstanding shares of convertible preferred stock at March 31, 2016 into 5,639,410 shares (prior to the 2.5-for-1 forward stock split) of common stock immediately prior to the closing of this offering and (ii) the application of the 2.5-for-1 forward stock split to all common stock after such conversion. The outstanding shares of our preferred stock were originally distributed to stockholders of TFI in connection with the Spin-Off. Each share of preferred stock will convert into one share of common stock without the payment of additional consideration. The conversion of the convertible preferred stock reduces total convertible preferred stock par value by $6,000 while increasing common stock by the same amount. |
| (2) | The pro forma as adjusted column reflects (i) the pro forma adjustments described in footnote (1) above, (ii) the sale by us of 3,600,000 shares of common stock in this offering at an assumed initial public offering price of $21.00 per share, the midpoint of the price range set forth on the cover page of this prospectus, after deducting the underwriting discount and commissions and estimated offering expenses payable by us and (iii) the use of proceeds from this offering to repay a portion of the amounts outstanding under our VPC Facility as described in “Use of proceeds.” A $1.00 increase (decrease) in the assumed initial public offering price of $21.00 per share would increase (decrease) each of pro forma as adjusted cash and cash equivalents and total assets by $3.3 million and decrease (increase) pro forma as adjusted total stockholders’ (deficit) equity by approximately $3.3 million, assuming the number of shares we are offering, as set forth on the cover page of this prospectus, remains the same, after deducting the underwriting discount and commissions and estimated offering expenses payable by us. Similarly, an increase (decrease) of one million shares in the number of shares offered by us in this offering would increase (decrease) each of pro forma as adjusted cash and cash equivalents and total assets by $19.7 million and decrease (increase) pro forma as adjusted total stockholders’ equity by approximately $19.7 million, assuming an initial public offering price of $21.00 per share, the midpoint of the price range set forth on the cover page of this prospectus, remains the same, after deducting the underwriting discount and commissions and estimated offering expenses payable by us. The pro forma as adjusted information is illustrative only, and we will adjust this information based on the actual initial public offering price, number of shares offered and other terms of this offering determined at pricing. |
71
Table of Contents
Selected historical consolidated financial data
Quarterly Results of Operations
The following tables show our unaudited consolidated quarterly statement of operations data, as well as the percentage of revenue for each line item shown, for each of the quarters making up our two most recent fiscal years and any completed quarter of subsequent interim periods. This information has been derived from our unaudited combined and consolidated financial statements, which, in the opinion of management have been prepared on the same basis as our audited combined and consolidated financial statements and include all adjustments necessary for the fair presentation of the financial information for the quarters presented. Historical results are not necessarily indicative of the results to be expected in future periods, and operating results for a quarterly period are not necessarily indicative of the operating results for a full year. The information should be read in conjunction with the combined and consolidated financial statements and related notes included elsewhere in this prospectus.
| Three months ended | ||||||||||||||||||||||||||||||||||||
| (dollars in thousands, except as noted) | March 31, 2014 |
June 30, 2014 |
September 30, 2014 |
December 31, 2014 |
March 31, 2015 |
June 30, 2015 |
September 30, 2015 |
December 31, 2015 |
March 31, 2016 |
|||||||||||||||||||||||||||
| Revenues |
$ | 43,877 | $ | 58,685 | $ | 77,132 | $ | 94,024 | $ | 89,506 | $ | 91,368 | $ | 119,432 | $ | 133,700 | $ | 130,722 | ||||||||||||||||||
| Cost of sales: |
||||||||||||||||||||||||||||||||||||
| Provision for loan losses |
24,867 | 39,917 | 49,728 | 56,396 | 39,284 | 50,210 | 71,519 | 71,637 | 59,089 | |||||||||||||||||||||||||||
| Direct marketing costs |
12,133 | 13,907 | 16,033 | 18,094 | 9,866 | 17,151 | 20,790 | 13,225 | 9,606 | |||||||||||||||||||||||||||
| Other cost of sales |
2,460 | 2,020 | 3,274 | 2,849 | 2,606 | 3,791 | 4,297 | 4,503 | 3,583 | |||||||||||||||||||||||||||
|
|
|
|
|
|
|
|
|
|
|
|
|
|
|
|
|
|
|
|||||||||||||||||||
| Total cost of sales |
39,460 | 55,844 | 69,035 | 77,339 | 51,756 | 71,152 | 96,606 | 89,365 | 72,278 | |||||||||||||||||||||||||||
|
|
|
|
|
|
|
|
|
|
|
|
|
|
|
|
|
|
|
|||||||||||||||||||
| Gross profit |
4,417 | 2,841 | 8,097 | 16,685 | 37,750 | 20,216 | 22,826 | 44,335 | 58,444 | |||||||||||||||||||||||||||
|
|
|
|
|
|
|
|
|
|
|
|
|
|
|
|
|
|
|
|||||||||||||||||||
| Operating expenses |
||||||||||||||||||||||||||||||||||||
| Compensation and benefits |
11,133 | 11,162 | 11,978 | 13,737 | 13,921 | 15,013 | 15,595 | 16,039 | 16,100 | |||||||||||||||||||||||||||
| Professional services |
3,623 | 4,233 | 5,705 | 5,100 | 4,747 | 6,107 | 7,145 | 7,135 | 7,249 | |||||||||||||||||||||||||||
| Selling and marketing |
952 | 1,453 | 1,900 | 3,061 | 2,490 | 1,890 | 1,498 | 1,689 | 2,505 | |||||||||||||||||||||||||||
| Occupancy and equipment |
1,499 | 2,707 | 1,803 | 2,034 | 2,333 | 2,265 | 2,490 | 2,602 | 2,735 | |||||||||||||||||||||||||||
| Depreciation and amortization |
1,942 | 2,247 | 2,212 | 1,916 | 2,068 | 2,142 | 2,266 | 2,422 | 2,633 | |||||||||||||||||||||||||||
| Other |
477 | 1,198 | 545 | 546 | 569 | 1,030 | 1,043 | 1,661 | 706 | |||||||||||||||||||||||||||
|
|
|
|
|
|
|
|
|
|
|
|
|
|
|
|
|
|
|
|||||||||||||||||||
| Total operating expenses |
19,626 | 23,000 | 24,143 | 26,394 | 26,128 | 28,447 | 30,037 | 31,548 | 31,928 | |||||||||||||||||||||||||||
|
|
|
|
|
|
|
|
|
|
|
|
|
|
|
|
|
|
|
|||||||||||||||||||
| Operating (loss) income |
(15,209 | ) | (20,159 | ) | (16,046 | ) | (9,709 | ) | 11,622 | (8,231 | ) | (7,211 | ) | 12,787 | 26,516 | |||||||||||||||||||||
|
|
|
|
|
|
|
|
|
|
|
|
|
|
|
|
|
|
|
|||||||||||||||||||
| Net interest expense |
(874 | ) | (2,033 | ) | (3,920 | ) | (6,112 | ) | (6,755 | ) | (7,172 | ) | (10,278 | ) | (12,469 | ) | (13,500 | ) | ||||||||||||||||||
| Foreign currency transaction (loss) gain |
— | — | — | (1,408 | ) | (1,459 | ) | 1,950 | (1,731 | ) | (1,145 | ) | (1,358 | ) | ||||||||||||||||||||||
| Non-operating income |
— | — | — | — | — | 5,528 | 3 | (8 | ) | — | ||||||||||||||||||||||||||
|
|
|
|
|
|
|
|
|
|
|
|
|
|
|
|
|
|
|
|||||||||||||||||||
| Total other (expense) income |
(874 | ) | (2,033 | ) | (3,920 | ) | (7,520 | ) | (8,214 | ) | 306 | (12,006 | ) | (13,622 | ) | (14,858 | ) | |||||||||||||||||||
|
|
|
|
|
|
|
|
|
|
|
|
|
|
|
|
|
|
|
|||||||||||||||||||
| (Loss) income before taxes |
(16,083 | ) | (22,192 | ) | (19,966 | ) | (17,229 | ) | 3,408 | (7,925 | ) | (19,217 | ) | (835 | ) | 11,658 | ||||||||||||||||||||
| Income tax (benefit) expense |
(3,498 | ) | (5,049 | ) | (5,676 | ) | (6,486 | ) | 2,509 | (1,932 | ) | (4,156 | ) | (1,079 | ) | 5,866 | ||||||||||||||||||||
|
|
|
|
|
|
|
|
|
|
|
|
|
|
|
|
|
|
|
|||||||||||||||||||
| (Loss) income from continuing operations |
(12,585 | ) | (17,143 | ) | (14,290 | ) | (10,743 | ) | 899 | (5,993 | ) | (15,061 | ) | 244 | 5,792 | |||||||||||||||||||||
|
|
|
|
|
|
|
|
|
|
|
|
|
|
|
|
|
|
|
|||||||||||||||||||
| Income (loss) from discontinued operations, net of tax |
11 | 138 | 20 | (34 | ) | — | — | — | — | — | ||||||||||||||||||||||||||
|
|
|
|
|
|
|
|
|
|
|
|
|
|
|
|
|
|
|
|||||||||||||||||||
| Net (loss) income |
$ | (12,574 | ) | $ | (17,005 | ) | $ | (14,270 | ) | $ | (10,777 | ) | $ | 899 | $ | (5,993 | ) | $ | (15,061 | ) | $ | 244 | $ | 5,792 | ||||||||||||
|
|
|
|
|
|
|
|
|
|
|
|
|
|
|
|
|
|
|
|||||||||||||||||||
| Adjustments to arrive at Adjusted EBITDA: |
||||||||||||||||||||||||||||||||||||
| Net (loss) income |
$ | (12,574 | ) | $ | (17,005 | ) | $ | (14,270 | ) | $ | (10,777 | ) | $ | 899 | $ | (5,993 | ) | $ | (15,061 | ) | $ | 244 | $ | 5,792 | ||||||||||||
| Net interest expense |
874 | 2,033 | 3,920 | 6,112 | 6,755 | 7,172 | 10,278 | 12,469 | 13,500 | |||||||||||||||||||||||||||
| Foreign currency (gains) losses |
— | — | — | 1,408 | 1,459 | (1,950 | ) | 1,731 | 1,145 | 1,358 | ||||||||||||||||||||||||||
| Depreciation and amortization expense |
1,942 | 2,247 | 2,212 | 1,916 | 2,068 | 2,142 | 2,266 | 2,422 | 2,633 | |||||||||||||||||||||||||||
| Adjustment to contingent consideration |
— | — | — | — | — | (5,528 | ) | (3 | ) | 8 | — | |||||||||||||||||||||||||
| (Gain) loss on discontinued operations |
(11 | ) | (138 | ) | (20 | ) | 34 | — | — | — | — | — | ||||||||||||||||||||||||
| Income tax (benefit) expense |
(3,498 | ) | (5,049 | ) | (5,676 | ) | (6,486 | ) | 2,509 | (1,932 | ) | (4,156 | ) | (1,079 | ) | 5,866 | ||||||||||||||||||||
|
|
|
|
|
|
|
|
|
|
|
|
|
|
|
|
|
|
|
|||||||||||||||||||
| Adjusted EBITDA |
$ | (13,267 | ) | $ | (17,912 | ) | $ | (13,834 | ) | $ | (7,793 | ) | $ | 13,690 | $ | (6,089 | ) | $ | (4,945 | ) | $ | 15,209 | $ | 29,149 | ||||||||||||
|
|
|
|
|
|
|
|
|
|
|
|
|
|
|
|
|
|
|
|||||||||||||||||||
| Number of new customer loans |
39,602 | 54,922 | 54,675 | 53,457 | 29,944 | 62,548 | 84,333 | 61,413 | 40,717 | |||||||||||||||||||||||||||
| Number of loans outstanding |
94,539 | 114,813 | 131,339 | 146,046 | 131,577 | 163,736 | 206,934 | 222,723 | 201,076 | |||||||||||||||||||||||||||
| Customer acquisition costs per new loan (in dollars) |
$ | 306 | $ | 253 | $ | 293 | $ | 338 | $ | 329 | $ | 274 | $ | 247 | $ | 215 | $ | 236 | ||||||||||||||||||
| Net charge-offs |
$ | 13,330 | $ | 31,799 | $ | 45,452 | $ | 47,978 | $ | 45,694 | $ | 38,180 | $ | 59,287 | $ | 71,634 | $ | 69,010 | ||||||||||||||||||
| Additional provision for loan losses |
11,537 | 8,118 | 4,276 | 8,418 | (6,410 | ) | 12,030 | 12,232 | 3 | (9,921 | ) | |||||||||||||||||||||||||
|
|
|
|
|
|
|
|
|
|
|
|
|
|
|
|
|
|
|
|||||||||||||||||||
| Provision for loan losses |
$ | 24,867 | $ | 39,917 | $ | 49,728 | $ | 56,396 | $ | 39,284 | $ | 50,210 | $ | 71,519 | $ | 71,637 | $ | 59,089 | ||||||||||||||||||
|
|
|
|
|
|
|
|
|
|
|
|
|
|
|
|
|
|
|
|||||||||||||||||||
| Past due combined loans receivable – principal as a percentage of combined loans receivable – principal |
20 | % | 16 | % | 15 | % | 15 | % | 14 | % | 12 | % | 14 | % | 12 | % | 12 | % | ||||||||||||||||||
| Net charge-offs as a percentage of revenue |
30 | % | 54 | % | 59 | % | 51 | % | 51 | % | 42 | % | 50 | % | 54 | % | 53 | % | ||||||||||||||||||
| Effective APR of combined loan portfolio |
212 | % | 203 | % | 200 | % | 199 | % | 189 | % | 189 | % | 169 | % | 158 | % | 153 | % | ||||||||||||||||||
72
Table of Contents
Selected historical consolidated financial data
| 3 Months Ended | ||||||||||||||||||||||||||||||||||||
| (as a percentage of revenues) |
March 31, 2014 |
June 30, 2014 |
September 30, 2014 |
December 31, 2014 |
March 31, 2015 |
June 30, 2015 |
September 30, 2015 |
December 31, 2015 |
March 31, 2016 |
|||||||||||||||||||||||||||
| Revenues |
100.0 | % | 100.0 | % | 100.0 | % | 100.0 | % | 100.0 | % | 100.0 | % | 100.0 | % | 100.0 | % | 100.0 | % | ||||||||||||||||||
| Cost of sales: |
||||||||||||||||||||||||||||||||||||
| Provision for loan losses |
56.7 | 68.0 | 64.5 | 60.0 | 43.9 | 55.0 | 59.9 | 53.6 | 45.2 | |||||||||||||||||||||||||||
| Direct marketing costs |
27.7 | 23.7 | 20.8 | 19.2 | 11.0 | 18.8 | 17.4 | 9.9 | 7.3 | |||||||||||||||||||||||||||
| Other cost of sales |
5.6 | 3.4 | 4.2 | 3.0 | 2.9 | 4.1 | 3.6 | 3.4 | 2.7 | |||||||||||||||||||||||||||
|
|
|
|
|
|
|
|
|
|
|
|
|
|
|
|
|
|
|
|||||||||||||||||||
| Total cost of sales |
89.9 | 95.2 | 89.5 | 82.3 | 57.8 | 77.9 | 80.9 | 66.8 | 55.3 | |||||||||||||||||||||||||||
|
|
|
|
|
|
|
|
|
|
|
|
|
|
|
|
|
|
|
|||||||||||||||||||
| Gross profit |
10.1 | 4.8 | 10.5 | 17.7 | 42.2 | 22.1 | 19.1 | 33.2 | 44.7 | |||||||||||||||||||||||||||
|
|
|
|
|
|
|
|
|
|
|
|
|
|
|
|
|
|
|
|||||||||||||||||||
| Operating expenses |
||||||||||||||||||||||||||||||||||||
| Compensation and benefits |
25.4 | 19.0 | 15.5 | 14.6 | 15.6 | 16.4 | 13.1 | 12.0 | 12.3 | |||||||||||||||||||||||||||
| Professional services |
8.3 | 7.2 | 7.4 | 5.4 | 5.3 | 6.7 | 6.0 | 5.3 | 5.5 | |||||||||||||||||||||||||||
| Selling and marketing |
2.2 | 2.5 | 2.5 | 3.3 | 2.8 | 2.1 | 1.3 | 1.3 | 1.9 | |||||||||||||||||||||||||||
| Occupancy and equipment |
3.4 | 4.6 | 2.3 | 2.2 | 2.6 | 2.5 | 2.1 | 1.9 | 2.1 | |||||||||||||||||||||||||||
| Depreciation and amortization |
4.4 | 3.8 | 2.9 | 2.0 | 2.3 | 2.3 | 1.9 | 1.8 | 2.0 | |||||||||||||||||||||||||||
| Other |
1.1 | 2.0 | 0.7 | 0.6 | 0.6 | 1.1 | 0.9 | 1.2 | 0.5 | |||||||||||||||||||||||||||
|
|
|
|
|
|
|
|
|
|
|
|
|
|
|
|
|
|
|
|||||||||||||||||||
| Total operating expenses |
44.7 | 39.2 | 31.3 | 28.1 | 29.2 | 31.1 | 25.1 | 23.6 | 24.4 | |||||||||||||||||||||||||||
|
|
|
|
|
|
|
|
|
|
|
|
|
|
|
|
|
|
|
|||||||||||||||||||
| Operating (loss) income |
(34.7 | ) | (34.4 | ) | (20.8 | ) | (10.3 | ) | 13.0 | (9.0 | ) | (6.0 | ) | 9.6 | 20.3 | |||||||||||||||||||||
|
|
|
|
|
|
|
|
|
|
|
|
|
|
|
|
|
|
|
|||||||||||||||||||
| Net interest expense |
(2.0 | ) | (3.5 | ) | (5.1 | ) | (6.5 | ) | (7.5 | ) | (7.8 | ) | (8.6 | ) | (9.3 | ) | (10.3 | ) | ||||||||||||||||||
| Foreign currency transaction (loss) gain |
0.0 | 0.0 | 0.0 | (1.5 | ) | (1.6 | ) | 2.1 | (1.4 | ) | (0.9 | ) | (1.0 | ) | ||||||||||||||||||||||
| Non-operating income |
0.0 | 0.0 | 0.0 | 0.0 | 0.0 | 6.1 | 0.0 | 0.0 | 0.0 | |||||||||||||||||||||||||||
|
|
|
|
|
|
|
|
|
|
|
|
|
|
|
|
|
|
|
|||||||||||||||||||
| Total other (expense) income |
(2.0 | ) | (3.5 | ) | (5.1 | ) | (8.0 | ) | (9.2 | ) | 0.3 | (10.1 | ) | (10.2 | ) | (11.4 | ) | |||||||||||||||||||
|
|
|
|
|
|
|
|
|
|
|
|
|
|
|
|
|
|
|
|||||||||||||||||||
| (Loss) income before taxes |
(36.7 | ) | (37.8 | ) | (25.9 | ) | (18.3 | ) | 3.8 | (8.7 | ) | (16.1 | ) | (0.6 | ) | 8.9 | ||||||||||||||||||||
| Income tax (benefit) expense |
(8.0 | ) | (8.6 | ) | (7.4 | ) | (6.9 | ) | 2.8 | (2.1 | ) | (3.5 | ) | (0.8 | ) | 4.5 | ||||||||||||||||||||
|
|
|
|
|
|
|
|
|
|
|
|
|
|
|
|
|
|
|
|||||||||||||||||||
| (Loss) income from continuing operations |
(28.7 | ) | (29.2 | ) | (18.5 | ) | (11.4 | ) | 1.0 | (6.6 | ) | (12.6 | ) | 0.2 | 4.4 | |||||||||||||||||||||
|
|
|
|
|
|
|
|
|
|
|
|
|
|
|
|
|
|
|
|||||||||||||||||||
| Income (loss) from discontinued operations, net of tax |
0.0 | 0.2 | 0.0 | 0.0 | 0.0 | 0.0 | 0.0 | 0.0 | 0.0 | |||||||||||||||||||||||||||
|
|
|
|
|
|
|
|
|
|
|
|
|
|
|
|
|
|
|
|||||||||||||||||||
| Net (loss) income |
(28.7 | )% | (29.0 | )% | (18.5 | )% | (11.5 | )% | 1.0 | % | (6.6 | )% | (12.6 | )% | 0.2 | % | 4.4 | % | ||||||||||||||||||
|
|
|
|
|
|
|
|
|
|
|
|
|
|
|
|
|
|
|
|||||||||||||||||||
Quarterly Trends
Our gross revenue has generally increased over the nine quarters ended March 31, 2016. This growth has been primarily attributable to an increase in the finance charges, driven by increases in combined loans receivable – principal balances during the respective quarters. As expected, total cost of sales has generally increased quarter-to-quarter in absolute dollars as our loan originations and combined loans receivable – principal balances have increased. The decrease in revenue and total cost of sales from December 31, 2015 to March 31, 2016 and from December 31, 2014 to March 31, 2015 was due to the seasonality of our business as both originations and combined loans receivable – principal balances typically decrease during first quarter of the next year.
Generally, our total operating expenses have increased quarter-to-quarter over the nine quarters ended March 31, 2016, primarily due to increased personnel-related costs reflecting the increase in our headcount to support our growth. Despite the increases in absolute dollar amounts, total operating expenses as a percentage of revenue has generally decreased for each quarter as we have achieved greater economies of scale.
73
Table of Contents
Selected historical consolidated financial data
Lastly, we believe it is important to note that the average effective APR of our combined loan portfolio has decreased from 212% for the three months ended March 31, 2014 to 153% for the three months ended March 31, 2016. This reflects the improvements made in underwriting, the impact of the lower priced Elastic product as well as the maturing of the combined loan portfolio.
74
Table of Contents
Management’s discussion and analysis of financial condition and results of operations
You should read the following discussion and analysis of our financial condition and results of operations together with our combined and consolidated financial statements and the related notes and other financial information included elsewhere in this prospectus. Some of the information contained in this discussion and analysis, including information with respect to our plans and strategy for our business, includes forward-looking statements that involve risks and uncertainties. You should review the “Risk factors” section of this prospectus for a discussion of important factors that could cause actual results to differ materially from the results described in or implied by the forward-looking statements contained in the following discussion and analysis. We generally refer to loans, customers and other information and data associated with each of Rise, Elastic and Sunny as Elevate’s loans, customers, information and data, irrespective of whether Elevate directly originates the credit to the customer or whether such credit is originated by a third party. See “Certain Conventions Governing Information in this Prospectus—Presentation of information related to our products” for detailed information.
OVERVIEW
We provide technology-driven, progressive online credit solutions to non-prime consumers. We use advanced technology and proprietary risk analytics to provide more convenient and more responsible financial options to our customers, who are not well-served by either banks or legacy non-prime lenders. We currently offer online installment loans and lines of credit in the US and the UK. Our products, Rise, Elastic and Sunny, reflect our mission of “Good Today, Better Tomorrow” and provide consumers with access to competitively priced credit and services while helping them build a brighter financial future with credit building and financial wellness features.
On May 1, 2014, Think Finance, Inc., or “TFI,” completed a tax-free spin-off, or the “Spin-Off,” of our company by contributing the assets and liabilities associated with its direct lending and branded products business to us. TFI retained the assets and liabilities associated with its licensed technology platform line of business. The direct lending and branded products business contributed to us included Rise installment loans in the US, Sunny installment loans in the UK, Elastic lines of credit originated by a third party lender in the US, and our US and UK legacy short-term consumer loan products (loans which were migrated to our Rise and Sunny products, respectively) and a rent-to-own product (which we ceased offering in 2014).
The financial results included in this Management’s discussion and analysis of financial condition and results of operations, or “MD&A,” include amounts prior to the Spin-Off that have been derived from the consolidated financial statements and accounting records of TFI, using the historical results of operations and historical basis of assets and liabilities of the direct lending and branded products business. In preparing these financial results, we have made certain assumptions or used methodologies to allocate various expenses from TFI to us. These allocations were made on a specifically identifiable basis where expenses could be tied directly to Elevate products or using allocation methods such as revenues, headcount or other reasonable methods. We believe the assumptions and methodologies used in these allocations are reasonable. However, these financial results may not necessarily reflect our financial results had we been a stand-alone company during all of the periods presented.
We earn revenues on the Rise and Sunny installment loans and on the Elastic lines of credit offered to customers. For all three products, our revenues, which primarily consist of finance charges, are driven by
75
Table of Contents
Management’s discussion and analysis of financial condition and results of operations
our average loan balances outstanding and by the average annual percentage rate, or “APR,” associated with those outstanding loan balances. We calculate our average loan balances by taking a simple daily average of the ending loan balances outstanding for each period. We present certain key metrics and other information on a “combined” basis to reflect information related to loans originated by us and loans originated by Republic Bank, as well as loans originated by third-party lenders pursuant to CSO programs, which loans originated through CSO programs are not recorded on our balance sheet in accordance with GAAP. See “—Key Financial and Operating Metrics” and “—Non-GAAP Financial Measures.”
We have experienced rapid growth since launching our current generation of product offerings in 2013. Since their introduction, Rise, Elastic and Sunny, together, have provided approximately $1.6 billion in credit to approximately 550,000 customers and generated strong growth in revenues and loans outstanding. Our revenues for the year ended December 31, 2015 grew 59% compared to revenues for 2014, and revenues for the three months ended March 31, 2016 grew 46% compared to the three months ended March 31, 2015. Our combined loan principal balances grew 77% in 2015, from $201.7 million as of December 31, 2014 to $356.1 million as of December 31, 2015 and grew 82% from $176.7 million as of March 31, 2015 to $320.7 million as of March 31, 2016. For additional information about our combined loan balances please see “—Non-GAAP Financial Measures—Combined loan information.”
We use our working capital and our credit facility with Victory Park Management, LLC, or “VPC,” to fund the loans we make to our customers. Prior to January 2014, we funded all of our loans to customers out of our existing cash flows. On January 30, 2014, we entered into an agreement with VPC to provide a credit facility, or the “VPC Facility,” with a maximum borrowing amount of $250 million to fund our Rise installment loans. On August 15, 2014, the VPC Facility was amended to provide a credit facility with a maximum total borrowing amount of $315 million in order to add funds for our UK Sunny product and for working capital. On May 20, 2015, the VPC Facility was further amended to increase the maximum total borrowing amount to $335 million, and, on February 11, 2016, the VPC Facility was further amended to increase the maximum total borrowing amount to $345 million. See “—Liquidity and Capital Resources—Debt facilities.”
The Elastic line of credit product is originated by a third-party lender, Republic Bank, which initially provides all of the funding for that product. Republic Bank retains 10% of the balances of all loans originated and sells a 90% loan participation in the Elastic lines of credit. We purchased these loan participations ourselves through June 30, 2015 and thus earned 90% of the revenues and incurred 90% of the losses associated with the Elastic product through that date. Due to the significant growth in Elastic, commencing July 1, 2015, a new structure was implemented such that the loan participations are sold by Republic Bank to Elastic SPV, Ltd., or “Elastic SPV.” Elastic SPV receives its funding from VPC in a separate $50 million financing facility, the “ESPV Facility,” which was finalized on July 13, 2015. This facility was further increased to $100 million effective October 21, 2015. We do not own Elastic SPV but, effective July 1, 2015, we entered into a credit default protection agreement with Elastic SPV whereby we agreed to provide credit protection to the investors in Elastic SPV against Elastic loan losses in return for a credit premium. Per the terms of this agreement, under GAAP, the Company is the primary beneficiary of Elastic SPV and we are required to consolidate the financial results of Elastic SPV as a variable interest entity in our consolidated financial results beginning July 1, 2015. The presentation of this new Elastic SPV structure does not differ from the presentation of the previous structure reflected in our financial statements, as we continue to present revenue and losses on 90% of the Elastic lines of credit originated by Republic Bank that are sold to Elastic SPV within our consolidated financial statements.
76
Table of Contents
Management’s discussion and analysis of financial condition and results of operations
Our management assesses our financial performance and future strategic goals through key metrics based primarily on the following three themes:
| Ø | Revenue growth. In 2015, our total revenues were $434.0 million, which represented a 59% increase over 2014 total revenues of $273.7 million. For the three months ended March 31, 2016, our total revenues increased 46% as compared to the same prior year period, increasing from $89.5 million to $130.7 million. Key metrics related to revenue growth that we monitor by product include the ending and average combined loan balances outstanding, the effective APR of our product loan portfolios, the total dollar value of loans originated, the number of new customer loans made, the ending number of customer loans outstanding and the related customer acquisition cost, or “CAC,” associated with each new customer loan made. We include CAC as a key metric when analyzing revenue growth (rather than as a key metric within margin expansion) as we do not intend to lower our CAC over future periods. Instead, as we improve customer acquisition efficiency, we intend to increase spending on direct marketing to acquire a broader customer base to drive further revenue growth. |
| Ø | Stable credit quality. Since the time they were managing our legacy US products, our management team has maintained stable credit quality across the loan portfolio they were managing, including during the recent financial crisis. See “Business—Advanced Analytics and Risk Management—History of stable credit quality through the economic downturn.” Additionally, in the periods covered in this MD&A, we have continued to maintain stable credit quality. The credit quality metrics we monitor include net charge-offs as a percentage of revenues, the combined loan loss reserve as a percentage of outstanding combined loans, total provision for loan losses as a percentage of revenues and the percentage of past due combined loans receivable – principal. |
| Ø | Margin expansion. We expect that our operating margins will continue to expand over the near term as we lower our direct marketing costs and operating expense as a percentage of revenues while continuing to maintain our stable credit quality levels. Over the next several years, as we continue to scale our loan portfolio, we anticipate that our direct marketing costs primarily associated with new customer acquisitions will decline to approximately 10% of revenues and our operating expenses will decline to approximately 20% of revenues. We aim to manage our business to achieve a long-term operating margin of 20%, and do not expect our operating margin to increase beyond that level, as we intend to pass on any improvements over our targeted margins to our customers in the form of lower APRs. We believe this is a critical component of our responsible lending platform and over time will also help us continue to attract new customers and retain existing customers. |
KEY FINANCIAL AND OPERATING METRICS
As discussed above, we regularly monitor a number of metrics in order to measure our current performance and project our future performance. These metrics aid us in developing and refining our growth strategies and in making strategic decisions.
Certain of our metrics are non-GAAP financial measures. We believe that such metrics are useful in period-to-period comparisons of our core business. However, non-GAAP financial measures are not an alternative to any measure of financial performance calculated and presented in accordance with GAAP. See “—Non-GAAP Financial Measures” for a reconciliation of our non-GAAP metrics to GAAP.
77
Table of Contents
Management’s discussion and analysis of financial condition and results of operations
Revenue growth
| As of and for the years ended December 31, |
As of and for the three months ended March 31, |
|||||||||||||||
| Revenue growth metrics (dollars in thousands, except as noted) | 2015 | 2014 | 2016 | 2015 | ||||||||||||
| (unaudited) | ||||||||||||||||
| Revenues |
$ | 434,006 | $ | 273,718 | $ | 130,722 | $ | 89,506 | ||||||||
| Period-over-period revenue growth |
59 | % | 280 | % | 46 | % | 104 | % | ||||||||
| Ending combined loans receivable – principal(1) |
356,069 | 201,660 | 320,682 | 176,658 | ||||||||||||
| Average combined loans receivable – principal(1)(2) |
250,058 | 134,491 | 343,532 | 191,743 | ||||||||||||
| Total combined loans originated – principal |
783,627 | 508,692 | 188,989 | 105,091 | ||||||||||||
| Average customer loan balance (in dollars)(3) |
1,598 | 1,367 | 1,595 | 1,343 | ||||||||||||
| Number of new customer loans |
238,238 | 202,656 | 40,717 | 29,944 | ||||||||||||
| Number of loans outstanding |
222,723 | 146,046 | 201,076 | 131,577 | ||||||||||||
| Customer acquisition cost per new loan (in dollars) |
256 | 297 | 236 | 329 | ||||||||||||
| Effective APR of combined loan portfolio |
173 | % | 202 | % | 153 | % | 189 | % | ||||||||
| (1) | Combined loans receivable is defined as loans owned by the company plus loans originated and owned by third-party lenders pursuant to our CSO programs. See “—Non-GAAP financial measures” for more information and for a reconciliation of Combined loans receivable to loans receivable, net, the most directly comparable financial measure calculated in accordance with GAAP. |
| (2) | Average combined loans receivable – principal is calculated using an average of daily principal balances. |
| (3) | Average customer loan balance is a weighted average of all three products and is calculated for each product by dividing the ending combined loans receivable – principal by the number of loans outstanding at period end. |
Revenues. Our revenues are composed of finance charges, CSO acquisition fees (which are fees we receive from customers who obtain a loan through the CSO program for the credit services, including the loan guaranty, we provide) and non-sufficient funds fees (which were discontinued at the beginning of the fourth quarter of 2015) on Rise installment loans, finance charges on Sunny installment loans and revenues earned on the Elastic lines of credit. See “—Components of our Results of Operations—Revenues.”
Ending and average combined loans receivable – principal. We calculate the average combined loans receivable – principal by taking a simple daily average of the ending combined loans receivable – principal for each period. Key metrics that drive the ending and average combined loans receivable – principal include the amount of loans originated in a period and the average customer loan balance. All loan balance metrics include only the 90% participation in the related Elastic line of credit advances (we exclude the 10% held by Republic Bank), but include the full loan balances on CSO loans, which are not presented on our balance sheet.
Total combined loans originated – principal. The amount of loans originated in a period is driven primarily by loans to new customers as well as new loans to prior customers, including refinancings of existing loans to customers in good standing.
Average customer loan balance and effective APR of combined loan portfolio. The average loan amount and its related APR are based on the product and the underlying credit quality of the customer. Generally, better credit quality customers are offered higher loan amounts at lower APRs. Additionally, new customers have more potential risk of loss than prior or existing customers due to lack of payment history and the potential for fraud. As a result, newer customers typically will have lower loan amounts and higher APRs to compensate for that additional risk of loss. The effective APR is calculated based on the actual amount of finance charges generated from a customer loan divided by the average outstanding balance for the loan, and can be lower than the stated APR on the loan due to waived finance charges
78
Table of Contents
Management’s discussion and analysis of financial condition and results of operations
and other reasons. For example, a Rise customer may receive a $2,000 installment loan with a term of 24 months and a stated rate of 180%. In this example, the customer’s monthly installment loan payment would be $310.86. As the customer can prepay the loan balance at any time with no additional fees or early payment penalty, the customer pays the loan in full in month eight. The customer’s loan earns interest of $2,337.81 over the eight month period and has an average outstanding balance of $1,948.17. The effective APR for this loan is 180% over the eight month period calculated as follows:
| ($2,337.81 interest earned / $1,948.17 average balance outstanding) x 12 months per year = 180% | ||
| 8 months | ||
In addition, as an example for Elastic, if a customer makes a $2,500 draw on the customer’s line of credit and this draw required bi-weekly minimum payments of 5% (equivalent to 20 bi-weekly payments), and if all minimum payments are made, the draw would earn finance charges of $1,148. The effective APR for the line of credit in this example is 109% over the payment period and is calculated as follows:
| ($1,148.00 fees earned / $1,369.05 average balance outstanding) x 26 bi-weekly periods per year = 109% | ||
| 20 payments | ||
The actual amount of revenue we realize on a loan portfolio is also impacted by the amount of prepayments and charged-off customer loans in the portfolio. For a single loan, on average, we typically expect to realize approximately 60% of the revenues that we would otherwise realize if the loan were to fully amortize at the stated APR. From the Rise example above, if we waived $400 of interest for this customer, the effective APR for this loan would decrease to 149%.
Number of new customer loans. We define a new customer loan as the first loan made to a customer for each of our products (so a customer receiving a Rise installment loan and then at a later date taking their first cash advance on an Elastic line of credit would be counted twice). The number of new customer loans is subject to seasonal fluctuations. New customer acquisition is typically slowest during the first six months of each calendar year, primarily in the first quarter, compared to the latter half of the year, as our existing and prospective US customers usually receive tax refunds during this period and, thus, have less of a need for loans from us. Further, many US customers will use their tax refunds to prepay all or a portion of their loan balance during this period, so our overall loan portfolio typically decreases during the first quarter of the calendar year. Overall loan portfolio growth and the number of new customer loans tends to accelerate during the summer months (typically June and July), at the beginning of the school year (typically late August to early September) and during the winter holidays (typically late November to early December).
Customer acquisition cost per new loan. A key expense metric we monitor related to loan growth is our CAC. This metric is the amount of direct marketing costs incurred during a period divided by the number of new customer loans originated during that same period. New loans to former customers are not included in our calculation of CAC (except to the extent they receive a loan through a different product) as we believe we incur no material direct marketing costs to make additional loans to a prior customer through the same product.
Recent trends. Our revenues for the three months ended March 31, 2016 totaled $130.7 million, up 46% from the three months ended March 31, 2015. The growth in revenues during the first quarter of 2016 as compared with the growth experienced in the same period of 2015 was driven by a 79% increase in our average combined loan balance as we continued to expand our customer base. The number of customer loans outstanding at March 31, 2016 increased 53% over the prior year amount. We were able to continue to grow our customer base while maintaining a CAC that remained slightly below our historical levels of $250 to $300. Additionally, the average customer loan balance increased
79
Table of Contents
Management’s discussion and analysis of financial condition and results of operations
19% from the prior period, totaling approximately $1,595. We expect this trend in average customer loan balance to continue as our loan portfolio continues to grow and mature with more existing and repeat customers. The growth in loan balances drove the increase in revenues for the three months ended March 31, 2016, offset in part by a decrease in the average APR on the loan portfolio, which declined to 153% during the three months ended March 31, 2016 from 189% during the three months ended March 31, 2015. This decrease in the average APR resulted primarily from an overall maturation of the loan portfolio, which we expect to continue over time. Additionally, Elastic, which has grown significantly in volume and as a proportion of our portfolio since 2015, has an average effective APR of approximately 85% compared to Rise, which has an average APR of approximately 160%, further contributing to the overall reduction in the consolidated APR. See “Risk factors—Risks Related to Our Business and Industry—Our recent growth rate may not be indicative of our ability to continue to grow, if at all, in the future.”
Credit quality
| As of and for the years ended December 31, |
As of and for the three months ended March 31, |
|||||||||||||||
| Credit quality metrics (dollars in thousands) | 2015 | 2014 | 2016 | 2015 | ||||||||||||
| (unaudited) | ||||||||||||||||
| Net charge-offs(1) |
$ | 214,795 | $ | 138,559 | $ | 69,010 | $ | 45,694 | ||||||||
| Additional provision for loan losses(1) |
17,855 | 32,349 | (9,921 | ) | (6,410 | ) | ||||||||||
|
|
|
|
|
|
|
|
|
|||||||||
| Provision for loan losses |
$ | 232,650 | $ | 170,908 | $ | 59,089 | $ | 39,284 | ||||||||
|
|
|
|
|
|
|
|
|
|||||||||
| Past due combined loans receivable – principal as a percentage of combined loans receivable – principal(2) |
12 | % | 15 | % | 12 | % | 14 | % | ||||||||
| Net charge-offs as a percentage of revenues(1) |
49 | % | 51 | % | 53 | % | 51 | % | ||||||||
| Total provision for loan losses as a percentage of revenues |
54 | % | 62 | % | 45 | % | 44 | % | ||||||||
| Combined loan loss reserve(3) |
$ | 65,784 | $ | 48,491 | $ | 55,592 | $ | 41,718 | ||||||||
| Combined loan loss reserve as a percentage of combined loans receivable(3) |
17 | % | 22 | % | 16 | % | 22 | % | ||||||||
| (1) | Net charge-offs and additional provision for loan losses are not financial measures prepared in accordance with GAAP. Net charge-offs include the amount of principal and accrued interest on loans that are more than 60 days past due, or sooner if we receive notice that the loan will not be collected, such as a bankruptcy notice or identified fraud, offset by any recoveries. Additional provision for loan losses is the amount of provision for loan losses needed for a particular period to adjust the combined loan loss reserve to the appropriate level in accordance with our underlying loan loss reserve methodology. See “—Non-GAAP Financial Measures” for more information and for a reconciliation to provision for loan losses, the most directly comparable financial measure calculated in accordance with GAAP. |
| (2) | Combined loans receivable is defined as loans owned by the company plus loans originated and owned by third-party lenders. See “—Non-GAAP Financial Measures” for more information and for a reconciliation of Combined loans receivable to loans receivable, net, the most directly comparable financial measure calculated in accordance with GAAP. |
| (3) | Combined loan loss reserve is defined as the loan loss reserve for loans originated and owned by the company plus the loan loss reserve for loans owned by third-party lenders and guaranteed by the company. See “—Non-GAAP Financial Measures” for more information and for a reconciliation of Combined loan loss reserve to allowance for loan losses, the most directly comparable financial measure calculated in accordance with GAAP. |
In reviewing the credit quality of our loan portfolio, we break out our total provision for loan losses that is presented on our income statement under GAAP into two separate items—net charge-offs and additional provision for loan losses. Net charge-offs are indicative of the credit quality of our underlying portfolio, while additional provision for loan losses is subject to more fluctuation based on loan portfolio growth and the effect of normal seasonality on our business. The additional provision for loan losses is the amount needed to adjust the combined loan loss reserve to the appropriate amount at the end of each month based on our loan loss reserve methodology.
80
Table of Contents
Management’s discussion and analysis of financial condition and results of operations
Net charge-offs. Net charge-offs comprise gross charge-offs offset by recoveries on prior charge-offs. Gross charge-offs include the amount of principal and accrued interest on loans that are more than 60 days past due, or sooner if we receive notice that the loan will not be collected, such as bankruptcy notice or identified fraud. Any payments received on loans that have been charged off are recorded as recoveries and reduce the amount of gross charge-offs. Recoveries are typically less than 10% of the amount charged off, and thus, we do not view recoveries as a key credit quality metric. Historically, we have generally incurred net charge-offs as a percentage of revenues of between 43% and 53%.
Net charge-offs as a percentage of revenues can vary based on several factors, such as whether or not we experience significant growth or lower the APR of our products. Additionally, although a more seasoned portfolio will typically result in lower net charge-offs as a percentage of revenues, we do not intend to drive down this ratio significantly below our historical ratios and would instead seek to offer our existing products to a broader new customer base to drive additional revenues.
Additional provision for loan losses. Additional provision for loan losses is the amount of provision for loan losses needed for a particular period to adjust the combined loan loss reserve to the appropriate level in accordance with our underlying loan loss reserve methodology.
Additional provision relates to an increase in future inherent losses in the loan portfolio as determined by our loan loss reserve methodology. This increase could be due to a combination of factors such as an increase in the size of the loan portfolio or a worsening of credit quality or increase in past due loans. It is also possible for the additional provision for loan losses for a period to be a negative amount, which would reduce the amount of the combined loan loss reserve needed (due to a decrease in the loan portfolio or improvement in credit quality). The amount of additional provision for loan losses is seasonal in nature, mirroring the seasonality of our new customer acquisition and overall loan portfolio growth, as discussed above. The combined loan loss reserve typically decreases during the first quarter or first half of the calendar year due to a decrease in the loan portfolio from year end. Then, as the rate of growth for the loan portfolio starts to increase during the second half of the year, additional provision for loan losses is typically needed to increase the reserve for future losses associated with the loan growth. Because of this, our provision for loan losses can vary significantly throughout the year without a significant change in the credit quality of our portfolio.
The following provides an example of the application of our loan loss reserve methodology and the break out of the provision for loan losses between the portion associated with replenishing the reserve due to net charge-offs and the amount related to the additional loan loss provision. If the beginning combined loan loss reserve were $25 million, and we incurred $10 million of net charge-offs during the period and the ending combined loan loss reserve needed to be $30 million according to our loan loss reserve methodology, our total provision for loan losses would be $15 million, comprising $10 million in net charge-offs (provision needed to replenish the combined loan loss reserve) plus $5 million of additional provision related to an increase in future inherent losses in the loan portfolio identified by our loan loss reserve methodology.
| Example (dollars in thousands) | ||||||||
| Beginning combined loan loss reserve |
$ | 25,000 | ||||||
| Less: Net charge-offs |
(10,000 | ) | ||||||
| Provision for loan losses: |
||||||||
| Provision for net charge-offs |
$ | 10,000 | ||||||
| Additional provision for loan losses |
5,000 | |||||||
|
|
|
|||||||
| Total provision for loan losses |
15,000 | |||||||
|
|
|
|||||||
| Ending combined loan loss reserve balance |
$ | 30,000 | ||||||
|
|
|
|||||||
81
Table of Contents
Management’s discussion and analysis of financial condition and results of operations
Loan loss reserve methodology. Our loan loss reserve methodology is calculated separately for each product and, in the case of Rise (for non-CSO and CSO program loans), is calculated separately based on the state in which each customer resides to account for varying state license requirements that affect the amount of the loan offered, repayment terms and other factors. For each product, loss factors are calculated based on the delinquency status of customer loan balances: current, 1 to 30 days past due or 31 to 60 days past due. These loss factors for loans in each delinquency status are based on average historical loss rates by product (or state) associated with each of these three delinquency categories. Hence, another key credit quality metric we monitor is the percentage of past due combined loans receivable – principal, as an increase in past due loans will cause an increase in our combined loan loss reserve and related additional provision for loan losses to increase the reserve. For customers that are not past due, we further stratify these loans into loss rates by payment number, as a new customer that is about to make a first loan payment has a significantly higher risk of loss than a customer who has successfully made ten payments on an existing loan with us. Based on this methodology, we have historically seen our combined loan loss reserve as a percentage of combined loans receivable fluctuate between approximately 16% and 24% depending on the overall mix of new, former and past due customer loans.
Recent trends. For the three months ended March 31, 2016, net charge-offs as a percentage of revenues was 53%. Our historical range of net charge-offs as a percentage of revenues on an annual basis generally ranges from 43% to 53%. The net charge-offs as a percentage of revenues for the three months ended March 31, 2016 was at the high end of our historical range, due primarily to seasonal fluctuations in revenue (associated with loan balance attrition due to tax refunds). Additional provision for loan losses for the three months ended March 31, 2016 declined by $9.9 million due to an overall seasonal decrease of $35.4 million in ending combined loans receivable – principal compared to that at December 31, 2015. This resulted in our overall loan loss reserve as a percentage of combined loans receivable decreasing slightly to 16% as of March 31, 2016, from 17% as of December 31, 2015. The $19.8 million increase in the total loan loss provision during the three months ended March 31, 2016 as compared to the three months ended March 31, 2015 primarily resulted from the strong growth in loans we experienced during 2015 and the resulting increase in net charge-offs associated with this growth in new customers.
82
Table of Contents
Management’s discussion and analysis of financial condition and results of operations
Additionally, we also look at cumulative credit losses by vintage as a percentage of combined principal-originated. As the below table shows, our cumulative credit losses for each quarterly vintage since the third quarter of 2013 (with the launch of Rise and Sunny) have trended under 20%.
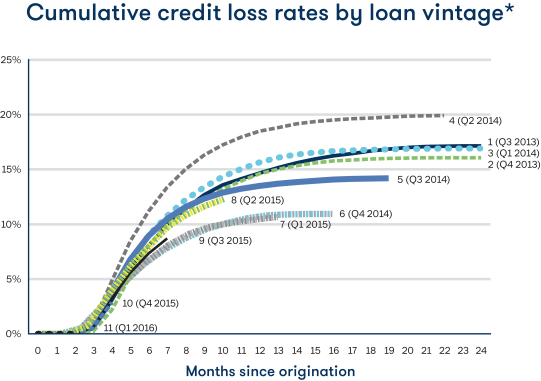
| * | Excludes losses related to fraud. |
83
Table of Contents
Management’s discussion and analysis of financial condition and results of operations
Margins
| For the years ended December 31, |
For the three months ended March 31, |
|||||||||||||||
| Margin metrics (dollars in thousands) | 2015 | 2014 | 2016 | 2015 | ||||||||||||
| (unaudited) | ||||||||||||||||
| Revenues |
$ | 434,006 | $ | 273,718 | $ | 130,722 | $ | 89,506 | ||||||||
| Net charge-offs(1) |
(214,795 | ) | (138,559 | ) | (69,010 | ) | (45,694 | ) | ||||||||
| Additional provision for loan losses(1) |
(17,855 | ) | (32,349 | ) | 9,921 | 6,410 | ||||||||||
| Direct marketing costs |
(61,032 | ) | (60,166 | ) | (9,606 | ) | (9,866 | ) | ||||||||
| Other cost of sales |
(15,197 | ) | (10,603 | ) | (3,583 | ) | (2,606 | ) | ||||||||
|
|
|
|
|
|
|
|
|
|||||||||
| Gross profit |
125,127 | 32,041 | 58,444 | 37,750 | ||||||||||||
| Operating expenses |
(116,160 | ) | (93,164 | ) | (31,928 | ) | (26,129 | ) | ||||||||
|
|
|
|
|
|
|
|
|
|||||||||
| Operating income (loss) |
$ | 8,967 | $ | (61,123 | ) | $ | 26,516 | $ | 11,621 | |||||||
|
|
|
|
|
|
|
|
|
|||||||||
| As a percentage of revenues: |
||||||||||||||||
| Net charge-offs |
49 | % | 51 | % | 53 | % | 51 | % | ||||||||
| Additional provision for loan losses |
4 | 11 | (8 | )% | (7 | )% | ||||||||||
| Direct marketing costs |
14 | 22 | 7 | % | 11 | % | ||||||||||
| Other cost of sales |
4 | 4 | 3 | % | 3 | % | ||||||||||
|
|
|
|
|
|
|
|
|
|||||||||
| Gross margin |
29 | 12 | 45 | % | 42 | % | ||||||||||
| Operating expenses |
27 | 34 | 24 | % | 29 | % | ||||||||||
|
|
|
|
|
|
|
|
|
|||||||||
| Operating margin |
2 | % | (22 | )% | 20 | % | 13 | % | ||||||||
|
|
|
|
|
|
|
|
|
|||||||||
| (1) | Non-GAAP measure. See “—Non-GAAP Financial Measures—Net charge-offs and additional provision for loan losses.” |
Gross margin is calculated as revenues minus cost of sales, or gross profit, expressed as a percentage of revenues, and operating margin is calculated as operating income (loss) expressed as a percentage of revenues. We expect our margins to increase as we continue to scale our business. Over the long term, we also expect direct marketing costs and operating expenses to decrease to approximately 10% and 20% of revenues, respectively, as revenues continue to increase as our loan portfolio grows.
Recent operating margin trends. For the three months ended March 31, 2016 our operating margin was 20%, a significant improvement from 2% for the full year 2015 and better than 13% for the first three months of 2015. This improvement was due to a decline in both direct marketing costs and operating expenses as a percentage of revenues. Direct marketing costs declined to 7% of revenues for the three months ended March 31, 2016 compared to 11% of revenues for the three months ended March 31, 2015 due to continued scaling of the business. Though direct marketing expense was essentially flat year-over-year, the number of new customer loans was up 36% in the first quarter of 2016 compared to the first quarter of 2015 and resulted in our CAC decreasing to $236 from $329 a year ago. Additionally, although operating expenses were up $5.8 million for the first quarter of 2016 as compared to a year ago, operating expenses as a percentage of revenue declined to 24%, down from 29% in the first quarter of 2015. As we continue to further scale our business, we believe our direct marketing costs as a percentage of revenues will continue to be approximately 10% of revenues and operating expenses as a percentage of revenues should continue to decline to approximately 20% of revenues.
84
Table of Contents
Management’s discussion and analysis of financial condition and results of operations
NON-GAAP FINANCIAL MEASURES
We believe that the inclusion of the following non-GAAP financial measures in this prospectus can provide a useful measure for period-to-period comparisons of our core business and useful information to investors and others in understanding and evaluating our operating results. However, non-GAAP financial measures are not a measure calculated in accordance with United States generally accepted accounting principles, or GAAP, and should not be considered an alternative to any measures of financial performance calculated and presented in accordance with GAAP. Other companies may calculate these non-GAAP financial measures differently than we do.
Adjusted EBITDA
Adjusted EBITDA represents our net income (loss), adjusted to exclude:
| Ø | Net interest expense, primarily associated with notes payable under the VPC Facility used to fund our loans; |
| Ø | Foreign currency gains and losses associated with our UK operations; |
| Ø | Depreciation and amortization expense on fixed assets and intangible assets; |
| Ø | Adjustments to contingent considerations payable related to companies previously acquired prior to the Spin-Off; |
| Ø | Miscellaneous gains and losses associated with the sale of assets on discontinued operations; and |
| Ø | Income taxes. |
Management believes that Adjusted EBITDA is a useful supplemental measure in analyzing the operating performance of the business and provides greater transparency into the results of operations of our core business.
Our use of Adjusted EBITDA has limitations as an analytical tool, and you should not consider it in isolation or as a substitute for analysis of our results as reported under GAAP. Some of these limitations are:
| Ø | Although depreciation and amortization are non-cash charges, the assets being depreciated and amortized may have to be replaced in the future, and Adjusted EBITDA does not reflect expected cash capital expenditure requirements for such replacements or for new capital expenditure requirements; |
| Ø | Adjusted EBITDA does not reflect changes in, or cash requirements for, our working capital needs; and |
| Ø | Adjusted EBITDA does not reflect interest associated with notes payable used for funding our customer loans, for other corporate purposes or tax payments that may represent a reduction in cash available to us. |
85
Table of Contents
Management’s discussion and analysis of financial condition and results of operations
The following table presents a reconciliation of net income (loss) to Adjusted EBITDA for each of the periods indicated:
| For the years ended December 31, |
For the three months ended March 31, |
|||||||||||||||
| (dollars in thousands) | 2015 | 2014 | 2016 | 2015 | ||||||||||||
| (unaudited) | ||||||||||||||||
| Net loss |
$ | (19,911 | ) | $ | (54,625 | ) | $ | 5,792 | $ | 898 | ||||||
| Adjustments: |
||||||||||||||||
| Net interest expense |
36,674 | 12,939 | 13,500 | 6,755 | ||||||||||||
| Foreign currency losses |
2,385 | 1,408 | 1,358 | 1,459 | ||||||||||||
| Depreciation and amortization expense |
8,898 | 8,317 | 2,633 | 2,068 | ||||||||||||
| Non-operating income |
(5,523 | ) | — | — | — | |||||||||||
| (Gain) loss on discontinued operations |
— | (135 | ) | — | — | |||||||||||
| Income tax benefit |
(4,658 | ) | (20,710 | ) | 5,866 | 2,509 | ||||||||||
|
|
|
|
|
|
|
|
|
|||||||||
| Adjusted EBITDA |
$ | 17,865 | $ | (52,806 | ) | $ | 29,149 | $ | 13,689 | |||||||
|
|
|
|
|
|
|
|
|
|||||||||
Free cash flow
Free cash flow, or “FCF,” represents our net cash provided by operating activities, adjusted to include:
| Ø | Principal net charge-offs – combined principal loans; and |
| Ø | Capital expenditures. |
The following table presents a reconciliation of net cash provided by (used in) operating activities to FCF for each of the periods indicated:
| For the years ended December 31, |
For the three months ended March 31, |
|||||||||||||||
| (dollars in thousands) | 2015 | 2014 | 2016 | 2015 | ||||||||||||
| (unaudited) | ||||||||||||||||
| Net cash provided by operating activities(1) |
$ | 128,432 | $ | 55,648 | $ | 57,285 | $ | 20,962 | ||||||||
| Adjustments: |
||||||||||||||||
| Net charge-offs – combined principal loans |
(150,091 | ) | (93,732 | ) | (49,370 | ) | (31,279 | ) | ||||||||
| Capital expenditures |
(9,272 | ) | (9,274 | ) | (1,727 | ) | (1,377 | ) | ||||||||
|
|
|
|
|
|
|
|
|
|||||||||
| FCF |
$ | (30,931 | ) | $ | (47,358 | ) | $ | 6,188 | $ | (11,694 | ) | |||||
|
|
|
|
|
|
|
|
|
|||||||||
| (1) | Net cash provided by (used in) operating activities includes net charge-offs – combined finance charges. |
Net charge-offs and additional provision for loan losses
We break out our total provision for loan losses into two separate items—first, the amount related to net charge-offs, and second, the additional provision for loan losses needed to adjust the combined loan loss reserve to the appropriate amount at the end of each month based on our loan loss provision methodology. We believe this presentation provides more detail related to the components of our total provision for loan losses when analyzing the gross margin of our business.
86
Table of Contents
Management’s discussion and analysis of financial condition and results of operations
Net charge-offs. Net charge-offs comprise gross charge-offs offset by recoveries on prior charge-offs. Gross charge-offs include the amount of principal and accrued interest on loans that are more than 60 days past due, or sooner if we receive notice that the loan will not be collected, such as a bankruptcy notice or identified fraud. Any payments received on loans that have been charged off are recorded as recoveries and reduce the amount of gross charge-offs.
Additional provision for loan losses. Additional provision for loan losses is the amount of provision for loan losses needed for a particular period to adjust the combined loan loss reserve to the appropriate level in accordance with our underlying loan loss reserve methodology.
| For the years ended December 31, |
For the three months ended March 31, |
|||||||||||||||
| (dollars in thousands) | 2015 | 2014 | 2016 | 2015 | ||||||||||||
| (unaudited) |
||||||||||||||||
| Net charge-offs |
$ | 214,795 | $ | 138,559 | $ | 69,010 | $ | 45,694 | ||||||||
| Additional provision for loan losses |
17,855 | 32,349 | (9,921) | (6,410 | ) | |||||||||||
|
|
|
|
|
|
|
|
|
|||||||||
| Provision for loan losses |
232,650 | $ | 170,908 | $59,089 | $ | 39,284 | ||||||||||
|
|
|
|
|
|
|
|
|
|||||||||
Combined loan information
The information presented in the tables below on a combined basis are non-GAAP measures based on a combined portfolio of loans, which includes the total amount of outstanding loans receivable that we own and that are on our balance sheet plus outstanding loans receivable originated and owned by third parties that we guarantee pursuant to CSO programs in which we participate. See “—Basis of Presentation and Critical Accounting Policies—Allowance and liability for estimated losses on consumer loans” and “—Basis of Presentation and Critical Accounting Policies—Liability for estimated losses on credit service organization loans.”
We believe these non-GAAP measures provide investors with important information needed to evaluate the magnitude of potential loan losses and the opportunity for revenue performance of the combined loan portfolio on an aggregate basis. We also believe that the comparison of the combined amounts from period to period is more meaningful than comparing only the amounts reflected on our balance sheet since both revenues and cost of sales as reflected in our financial statements are impacted by the aggregate amount of loans we own and those CSO loans we guarantee.
Our use of total combined loans and fees receivable has limitations as an analytical tool, and you should not consider it in isolation or as a substitute for analysis of our results as reported under GAAP. Some of these limitations are:
| Ø | Rise CSO loans are originated and owned by a third party lender; and |
| Ø | Rise CSO loans are funded by a third party lender and are not part of the VPC Facility. |
As of each of the period ends indicated, the following table presents a reconciliation of:
| Ø | Loans receivable, net, company owned (which reconciles to our combined and consolidated balance sheets included elsewhere in this prospectus); |
| Ø | Loans receivable, net, guaranteed by the company (as disclosed in Note 1 of our combined and consolidated financial statements included elsewhere in this prospectus); |
| Ø | Combined loans receivable (which we use as a non-GAAP measure); and |
| Ø | Combined loan loss reserve (which we use as a non-GAAP measure). |
87
Table of Contents
Management’s discussion and analysis of financial condition and results of operations
| 2014 | 2015 | 2016 | ||||||||||||||||||||||
| (dollars in thousands) | December 31 | March 31 | June 30 | September 30 | December 31 | March 31 | ||||||||||||||||||
| (unaudited) | (unaudited) | (unaudited) | (unaudited) | |||||||||||||||||||||
| Company Owned Loans: |
||||||||||||||||||||||||
| Loans receivable – principal, current, company owned |
$ | 148,210 | $ | 131,238 | $ | 182,007 | $ | 232,445 | $ | 271,415 | $ | 254,607 | ||||||||||||
| Loans receivable – principal, past due, company owned |
28,564 | 23,285 | 26,250 | 39,317 | 40,695 | 35,407 | ||||||||||||||||||
|
|
|
|
|
|
|
|
|
|
|
|
|
|||||||||||||
| Loans receivable – principal, total, company owned |
176,774 | 154,523 | 208,257 | 271,762 | 312,110 | 290,014 | ||||||||||||||||||
| Loans receivable – finance charges, company owned |
15,963 | 11,925 | 13,830 | 18,932 | 21,869 | 19,045 | ||||||||||||||||||
|
|
|
|
|
|
|
|
|
|
|
|
|
|||||||||||||
| Loans receivable – company owned |
192,737 | 166,448 | 222,087 | 290,694 | 333,979 | 309,059 | ||||||||||||||||||
| Allowance for loan losses on loans receivable, company owned |
(44,914 | ) | (38,747 | ) | (49,307 | ) | (60,409 | ) | (59,771 | ) | (51,296 | ) | ||||||||||||
|
|
|
|
|
|
|
|
|
|
|
|
|
|||||||||||||
| Loans receivable, net, company owned |
$ | 147,823 | $ | 127,701 | $ | 172,780 | $ | 230,285 | $ | 274,208 | $ | 257,763 | ||||||||||||
|
|
|
|
|
|
|
|
|
|
|
|
|
|||||||||||||
| Third Party Loans Guaranteed by the Company: |
||||||||||||||||||||||||
| Loans receivable – principal, current, guaranteed by company |
$ | 23,145 | $ | 20,555 | $ | 23,769 | $ | 29,193 | $ | 40,696 | $ | 28,556 | ||||||||||||
| Loans receivable – principal, past due, guaranteed by company |
1,741 | 1,580 | 2,230 | 3,131 | 3,263 | 2,112 | ||||||||||||||||||
|
|
|
|
|
|
|
|
|
|
|
|
|
|||||||||||||
| Loans receivable – principal, total, guaranteed by company(1) |
24,886 | 22,135 | 25,999 | 32,324 | 43,959 | 30,668 | ||||||||||||||||||
| Loans receivable – finance charges, guaranteed by company(2) |
75 | 30 | 110 | 147 | 128 | 1,541 | ||||||||||||||||||
|
|
|
|
|
|
|
|
|
|
|
|
|
|||||||||||||
| Loans receivable – guaranteed by company |
24,961 | 22,165 | 26,109 | 32,471 | 44,087 | 32,209 | ||||||||||||||||||
| Liability for losses on loans receivable, guaranteed by company |
(3,577 | ) | (2,971 | ) | (4,783 | ) | (5,602 | ) | (6,013 | ) | (4,296 | ) | ||||||||||||
|
|
|
|
|
|
|
|
|
|
|
|
|
|||||||||||||
| Loans receivable, net, guaranteed by company(3) |
$ | 21,384 | $ | 19,194 | $ | 21,326 | $ | 26,869 | $ | 38,074 | $ | 27,913 | ||||||||||||
|
|
|
|
|
|
|
|
|
|
|
|
|
|||||||||||||
| Combined Loans Receivable(3): |
||||||||||||||||||||||||
| Combined loans receivable – principal, current |
$ | 171,355 | $ | 151,793 | $ | 205,776 | $ | 261,638 | $ | 312,111 | $ | 283,163 | ||||||||||||
| Combined loans receivable – principal, past due |
30,305 | 24,865 | 28,480 | 42,448 | 43,958 | 37,519 | ||||||||||||||||||
|
|
|
|
|
|
|
|
|
|
|
|
|
|||||||||||||
| Combined loans receivable – principal |
201,660 | 176,658 | 234,256 | 304,086 | 356,069 | 320,682 | ||||||||||||||||||
| Combined loans receivable – finance charges |
16,038 | 11,955 | 13,940 | 19,079 | 21,997 | 20,586 | ||||||||||||||||||
|
|
|
|
|
|
|
|
|
|
|
|
|
|||||||||||||
| Combined loans receivable |
$ | 217,698 | $ | 188,613 | $ | 248,196 | $ | 323,165 | $ | 378,066 | $ | 341,268 | ||||||||||||
|
|
|
|
|
|
|
|
|
|
|
|
|
|||||||||||||
| Combined Loan Loss Reserve(3): |
||||||||||||||||||||||||
| Allowance for loan losses on loans receivable, company owned |
$ | (44,914 | ) | $ | (38,747 | ) | $ | (49,307 | ) | $ | (60,409 | ) | $ | (59,771 | ) | $ | (51,296 | ) | ||||||
| Liability for losses on loans receivable, guaranteed by company |
(3,577 | ) | (2,971 | ) | (4,783 | ) | (5,602 | ) | (6,013 | ) | (4,296 | ) | ||||||||||||
|
|
|
|
|
|
|
|
|
|
|
|
|
|||||||||||||
| Combined loan loss reserve |
$ | (48,491 | ) | $ | (41,718 | ) | $ | (54,090 | ) | $ | (66,011 | ) | $ | (65,784 | ) | $ | (55,592 | ) | ||||||
|
|
|
|
|
|
|
|
|
|
|
|
|
|||||||||||||
| Combined loans receivable – principal, past due(3) |
$ | 30,305 | $ | 24,865 | $ | 28,480 | $ | 42,448 | $ | 43,958 | $ | 37,519 | ||||||||||||
| Combined loans receivable – principal(3) |
201,660 | 176,658 | 234,256 | 304,086 | 356,069 | 320,682 | ||||||||||||||||||
| Percentage past due |
15 | % | 14 | % | 12 | % | 14 | % | 12 | % | 12 | % | ||||||||||||
| Combined loan loss reserve(3) |
$ | (48,491 | ) | $ | (41,718 | ) | $ | (54,090 | ) | $ | (66,011 | ) | $ | (65,784 | ) | $ | (55,592 | ) | ||||||
| Combined loans receivable(3) |
217,698 | 188,613 | 248,196 | 323,165 | 378,066 | 341,268 | ||||||||||||||||||
| Combined loan loss reserve as a percentage of combined loans receivable(3)(4) |
22 | % | 22 | % | 22 | % | 20 | % | 17 | % | 16 | % | ||||||||||||
| Allowance for loan losses as a percentage of loans receivable – company owned |
23 | % | 23 | % | 22 | % | 21 | % | 18 | % | 17 | % | ||||||||||||
| (1) | Represents loans originated by third-party lenders through the CSO programs, which are not included in our financial statements. |
| (2) | Represents finance charges earned by third-party lenders through the CSO programs, which are not included in our financial statements. |
| (3) | Non-GAAP measure. |
| (4) | Combined loan loss reserve as a percentage of combined loans receivable is determined using period-end balances. |
88
Table of Contents
Management’s discussion and analysis of financial condition and results of operations
COMPONENTS OF OUR RESULTS OF OPERATIONS
Revenues
Our revenues are composed of finance charges, CSO acquisition fees and non-sufficient funds fees on Rise installment loans, finance charges on Sunny installment loans, cash advance fees attributable to the participation in Elastic lines of credit that we consolidate and marketing and licensing fees received from the third-party lender related to the Elastic product. See “—Overview” above for further information on the structure of Elastic.
Cost of sales
Provision for loan losses. Provision for loan losses consists of amounts charged against income during the period related to net charge-offs and the additional provision for loan losses needed to adjust the loan loss reserve to the appropriate amount at the end of each month based on our loan loss methodology.
Direct marketing costs. Direct marketing costs consist of online marketing costs such as sponsored search and advertising on social networking sites, and other marketing costs such as purchased television and radio air time and direct mail print advertising. In addition, direct marketing cost includes affiliate costs paid to marketers in exchange for referrals of potential customers. All direct marketing costs are expensed as incurred.
Other cost of sales. Other cost of sales includes data verification costs associated with the underwriting of potential customers and automated clearinghouse, or “ACH,” transaction costs associated with customer loan funding and payments.
Operating expenses
Operating expenses consist of compensation and benefits, professional services, selling and marketing, occupancy and equipment, depreciation and amortization as well as other miscellaneous expenses. For 2015 and 2016, all operating expenses are based on actual operating expenses incurred by us. From the Spin-Off date (May 1, 2014) through the end of 2014, all operating expenses are based on actual operating expenses incurred by us, as well as on the allocation of expenses pursuant to the shared services agreement with TFI for functional areas such as finance, human resources and information technology. Prior to the Spin-Off, our operating expenses were calculated using assumptions or methodologies where operating expenses could not be directly attributable to either us or TFI. Examples would include allocating compensation and benefits for overhead personnel based on our product’s percentage of revenues to overall consolidated TFI revenues, or allocating rent expense based on a similar methodology. See “—Basis of Presentation and Critical Accounting Policies—Assumptions and significant judgments regarding treatment of amounts affected by the Spin-Off.”
Compensation and benefits. Salaries and personnel-related costs, including benefits, bonuses and stock-based compensation expense, comprise a majority of our operating expenses and these costs are driven by our number of employees.
Professional services. These operating expenses include costs associated with legal, accounting and auditing, recruiting and outsourced customer support and collections.
Selling and marketing. Selling and marketing costs include costs associated with the use of agencies that perform creative services and monitor and measure the performance of the various marketing channels.
89
Table of Contents
Management’s discussion and analysis of financial condition and results of operations
Selling and marketing costs also include the production costs associated with media advertisements that are expensed as incurred over the licensing or production period. These expenses do not include direct marketing costs incurred to acquire customers, which comprises CAC.
Occupancy and equipment. Occupancy and equipment includes rent expense on our leased facilities, as well as telephony and web hosting expenses.
Depreciation and amortization. We capitalize all acquisitions of property and equipment of $500 or greater as well as certain software development costs. Costs incurred in the preliminary stages of software development are expensed. Costs incurred thereafter, including external direct costs of materials and services as well as payroll and payroll-related costs, are capitalized. Post-development costs are expensed. Depreciation is computed using the straight-line method over the estimated useful lives of the depreciable assets.
Other (expense) income
Net interest expense. Net interest expense primarily includes the interest expense associated with the VPC Facility that funds the Rise and Sunny installment loans, and after July 1, 2015, the Elastic lines of credit and related Elastic SPV entity. Net interest expense for 2014 also includes interest expense paid to TFI related to the debt facility with TFI that was completely paid off on December 31, 2014 and terminated on January 1, 2015.
Foreign currency transaction gain (loss). We incur foreign currency transaction gains and losses related to activities associated with our UK entity, Elevate Credit International, Ltd., primarily with regard to the VPC Facility used to fund Sunny installment loans.
Non-operating income. Non-operating income primarily includes gains and losses on adjustments to contingent consideration liabilities related to acquisitions associated with the Elastic product.
Provision (benefit) for income taxes
Our provision for income taxes prior to, and after, the Spin-Off was determined on a separate return basis as if we were a separate filer (and not part of the TFI consolidated tax return).
90
Table of Contents
Management’s discussion and analysis of financial condition and results of operations
RESULTS OF OPERATIONS
The following table sets forth our combined and consolidated statements of operations data for each of the periods indicated.
| For the years ended December 31, |
For the three months ended March 31, |
|||||||||||||||
| Combined and consolidated statements of operations data (dollars in thousands) |
2015 | 2014 | 2016 | 2015 | ||||||||||||
| (unaudited) | ||||||||||||||||
| Revenues |
$ | 434,006 | $ | 273,718 | $ | 130,722 | $ | 89,506 | ||||||||
| Cost of sales: |
||||||||||||||||
| Provision for loan losses |
232,650 | 170,908 | 59,089 | 39,284 | ||||||||||||
| Direct marketing costs |
61,032 | 60,166 | 9,606 | 9,866 | ||||||||||||
| Other cost of sales |
15,197 | 10,603 | 3,583 | 2,606 | ||||||||||||
|
|
|
|
|
|
|
|
|
|||||||||
| Total cost of sales |
308,879 | 241,677 | 72,278 | 51,756 | ||||||||||||
|
|
|
|
|
|
|
|
|
|||||||||
| Gross profit |
125,127 | 32,041 | 58,444 | 37,750 | ||||||||||||
|
|
|
|
|
|
|
|
|
|||||||||
| Operating expenses: |
||||||||||||||||
| Compensation and benefits |
60,568 | 48,010 | 16,100 | 13,921 | ||||||||||||
| Professional services |
25,134 | 18,662 | 7,249 | 4,748 | ||||||||||||
| Selling and marketing |
7,567 | 7,366 | 2,505 | 2,490 | ||||||||||||
| Occupancy and equipment |
9,690 | 8,043 | 2,735 | 2,333 | ||||||||||||
| Depreciation and amortization |
8,898 | 8,317 | 2,633 | 2,068 | ||||||||||||
| Other |
4,303 | 2,766 | 706 | 569 | ||||||||||||
|
|
|
|
|
|
|
|
|
|||||||||
| Total operating expenses |
116,160 | 93,164 | 31,928 | 26,129 | ||||||||||||
|
|
|
|
|
|
|
|
|
|||||||||
| Operating income (loss) |
8,967 | (61,123 | ) | 26,516 | 11,621 | |||||||||||
|
|
|
|
|
|
|
|
|
|||||||||
| Other income (expense): |
||||||||||||||||
| Net interest expense |
(36,674 | ) | (12,939 | ) | (13,500 | ) | (6,755 | ) | ||||||||
| Foreign currency transaction loss |
(2,385 | ) | (1,408 | ) | (1,358 | ) | (1,459 | ) | ||||||||
| Non-operating income |
5,523 | — | — | — | ||||||||||||
|
|
|
|
|
|
|
|
|
|||||||||
| Total other expense |
(33,536 | ) | (14,347 | ) | (14,858 | ) | (8,214 | ) | ||||||||
|
|
|
|
|
|
|
|
|
|||||||||
| Income (loss) before taxes |
(24,569 | ) | (75,470 | ) | 11,658 | 3,407 | ||||||||||
| Income tax provision (benefit) |
(4,658 | ) | (20,710 | ) | 5,866 | 2,509 | ||||||||||
|
|
|
|
|
|
|
|
|
|||||||||
| Income (loss) from continuing operations |
(19,911 | ) | (54,760 | ) | 5,792 | 898 | ||||||||||
|
|
|
|
|
|
|
|
|
|||||||||
| Income from discontinued operations, net of tax |
— | 135 | — | — | ||||||||||||
|
|
|
|
|
|
|
|
|
|||||||||
| Net income (loss) |
$ | (19,911 | ) | $ | (54,625 | ) | $ | 5,792 | $ | 898 | ||||||
|
|
|
|
|
|
|
|
|
|||||||||
91
Table of Contents
Management’s discussion and analysis of financial condition and results of operations
| For the years ended December 31, |
For the three months ended March 31, |
|||||||||||||||
| As a percentage of revenues | 2015 | 2014 | 2016 | 2015 | ||||||||||||
| (unaudited) | ||||||||||||||||
| Cost of sales: |
||||||||||||||||
| Provision for loan losses |
54 | % | 62 | % | 45 | % | 44 | % | ||||||||
| Direct marketing costs |
14 | 22 | 7 | 11 | ||||||||||||
| Other cost of sales |
3 | 4 | 2 | 3 | ||||||||||||
|
|
|
|
|
|
|
|
|
|||||||||
| Total cost of sales |
71 | 88 | 55 | 58 | ||||||||||||
|
|
|
|
|
|
|
|
|
|||||||||
| Gross profit |
29 | 12 | 45 | 42 | ||||||||||||
|
|
|
|
|
|
|
|
|
|||||||||
| Operating expenses: |
||||||||||||||||
| Compensation and benefits |
14 | 18 | 12 | 16 | ||||||||||||
| Professional services |
6 | 7 | 6 | 5 | ||||||||||||
| Selling and marketing |
2 | 3 | 2 | 3 | ||||||||||||
| Occupancy and equipment |
2 | 3 | 2 | 3 | ||||||||||||
| Depreciation and amortization |
2 | 3 | 2 | 2 | ||||||||||||
| Other |
1 | — | 1 | 1 | ||||||||||||
|
|
|
|
|
|
|
|
|
|||||||||
| Total operating expenses |
27 | 34 | 24 | 29 | ||||||||||||
|
|
|
|
|
|
|
|
|
|||||||||
| Operating income (loss) |
2 | (22 | ) | 20 | 13 | |||||||||||
|
|
|
|
|
|
|
|
|
|||||||||
| Other income (expense): |
||||||||||||||||
| Net interest expense |
(8 | ) | (5 | ) | (10 | ) | (8 | ) | ||||||||
| Foreign currency transaction loss |
(1 | ) | (1 | ) | (1 | ) | (2 | ) | ||||||||
| Non-operating income |
1 | — | — | — | ||||||||||||
|
|
|
|
|
|
|
|
|
|||||||||
| Total other expense |
(8 | ) | (6 | ) | (11 | ) | (9 | ) | ||||||||
|
|
|
|
|
|
|
|
|
|||||||||
| Income (loss) before taxes |
(6 | ) | (28 | ) | 9 | 4 | ||||||||||
| Income tax expense (benefit) |
(1 | ) | 8 | 5 | 3 | |||||||||||
|
|
|
|
|
|
|
|
|
|||||||||
| Income (loss) from continuing operations |
(5 | ) | (20 | ) | 4 | 1 | ||||||||||
| Income from discontinued operations, net of tax |
— | — | — | — | ||||||||||||
|
|
|
|
|
|
|
|
|
|||||||||
| Net income (loss) |
(5 | )% | (20 | )% | 4 | % | 1 | % | ||||||||
|
|
|
|
|
|
|
|
|
|||||||||
Comparison of the three ended March 31, 2016 and 2015
Revenues
| Three months ended March 31, | Period-to-period change | |||||||||||||||||||||||
| 2016 | 2015 | |||||||||||||||||||||||
| (dollars in thousands) | Amount | Percentage of revenues |
Amount | Percentage of revenues |
Amount | Percentage | ||||||||||||||||||
| (unaudited) | ||||||||||||||||||||||||
| Finance charges |
$ | 130,552 | 100 | % | $ | 89,254 | 100 | % | $ | 41,298 | 46 | % | ||||||||||||
| Other |
170 | — | % | 253 | — | % | (83 | ) | (33 | )% | ||||||||||||||
|
|
|
|
|
|
|
|
|
|
|
|
|
|||||||||||||
| Revenues |
$ | 130,722 | 100 | % | $ | 89,507 | 100 | % | $ | 41,215 | 46 | % | ||||||||||||
|
|
|
|
|
|
|
|
|
|
|
|
|
|||||||||||||
92
Table of Contents
Management’s discussion and analysis of financial condition and results of operations
Revenues increased by $41.2 million, or 46%, from $89.5 million for the three months ended March 31, 2015 to $130.7 million for the three months ended March 31, 2016. This growth in revenues was primarily attributable to increased finance charges driven by growth in our average loan balances, partially offset by a decrease in our overall APR, as illustrated in the tables below. Over time, we expect our average customer loan balance to continue to increase and the related overall effective APR of our loan portfolio to decrease as our loan portfolio continues to grow and mature with more existing and repeat customers who pay lower interest rates over time.
The below tables break out this change in finance charges (including CSO acquisition fees and cash advance fees) by product:
| Three months ended March 31, 2016 | ||||||||||||||||||||
| (dollars in thousands) | US Installment(1) |
US Line of Credit |
Total Domestic |
UK | Total | |||||||||||||||
| (unaudited) | ||||||||||||||||||||
| Average combined loans receivable – principal(2) |
$ | 229,133 | $ | 74,991 | $ | 304,124 | $ | 39,408 | $ | 343,532 | ||||||||||
| Weighted average effective APR |
160 | % | 85 | % | 142 | % | 239 | % | 153 | % | ||||||||||
| Finance charges |
$ | 91,265 | $ | 15,838 | $ | 107,103 | $ | 23,449 | $ | 130,552 | ||||||||||
| Other |
33 | 137 | 170 | — | 170 | |||||||||||||||
|
|
|
|
|
|
|
|
|
|
|
|||||||||||
| Total revenue |
$ | 91,298 | $ | 15,975 | $ | 107,273 | $ | 23,449 | $ | 130,722 | ||||||||||
|
|
|
|
|
|
|
|
|
|
|
|||||||||||
| Three months ended March 31, 2015 | ||||||||||||||||||||
| (dollars in thousands) | US Installment(1) |
US Line of Credit |
Total Domestic |
UK | Total | |||||||||||||||
| (unaudited) | ||||||||||||||||||||
| Average combined loans receivable – principal(2) |
$ | 164,797 | $ | 1,256 | $ | 166,053 | $ | 25,690 | $ | 191,743 | ||||||||||
| Weighted average effective APR |
180 | % | 100 | % | 179 | % | 250 | % | 189 | % | ||||||||||
| Finance charges |
$ | 73,105 | $ | 308 | $ | 73,413 | $ | 15,840 | $ | 89,253 | ||||||||||
| Other |
253 | — | 253 | — | 253 | |||||||||||||||
|
|
|
|
|
|
|
|
|
|
|
|||||||||||
| Total revenue |
$ | 73,358 | $ | 308 | $ | 73,666 | $ | 15,840 | $ | 89,506 | ||||||||||
|
|
|
|
|
|
|
|
|
|
|
|||||||||||
| (1) | Includes loans originated by third-party lenders through the CSO programs, which are not included in our financial statements. |
| (2) | Average combined loans receivable – principal is calculated using daily principal balances. |
During the three months ended March 31, 2016, our average combined loans receivable – principal increased $151.8 million compared to the prior year period as we continued to market our Rise, Sunny and Elastic products in the US and UK. As a result of the increased average combined loans receivable – principal, finance charges increased $41.3 million during the three months ended March 31, 2016 compared to a year earlier. This increase was partially offset by a decrease in our average APR, as the installment loan portfolios continue to mature and existing customer continue to receive lower rates. Rise’s APR dropped to 160% from 180%, while Sunny’s APR dropped to 239% from 250% for the periods ended March 31, 2016 and 2015, respectively.
93
Table of Contents
Management’s discussion and analysis of financial condition and results of operations
Cost of sales
| Three months ended 31, | Period-to-period change |
|||||||||||||||||||||||
| 2016 | 2015 | |||||||||||||||||||||||
| (dollars in thousands) | Amount | Percentage of revenues |
Amount | Percentage of revenues |
Amount | Percentage | ||||||||||||||||||
| (unaudited) | ||||||||||||||||||||||||
| Cost of sales: |
||||||||||||||||||||||||
| Provision for loan losses |
$ | 59,089 | 45 | % | $ | 39,284 | 44 | % | $ | 19,805 | 50 | % | ||||||||||||
| Direct marketing costs |
9,606 | 7 | 9,866 | 11 | % | (260 | ) | (3 | ) | |||||||||||||||
| Other cost of sales |
3,583 | 3 | 2,606 | 3 | % | 977 | 37 | |||||||||||||||||
|
|
|
|
|
|
|
|
|
|
|
|
|
|||||||||||||
| Total cost of sales |
$ | 72,278 | 55 | % | $ | 51,756 | 58 | % | $ | 20,522 | 40 | % | ||||||||||||
|
|
|
|
|
|
|
|
|
|
|
|
|
|||||||||||||
Provision for loan losses. Provision for loan losses increased by $19.8 million, or 50%, from $39.3 million for the three months ended March 31, 2015 to $59.1 million for the three months ended March 31, 2016 primarily due to a $23.3 million increase in net charge-offs resulting from an increase in the overall loan portfolio.
The tables below break out these changes by loan product:
| Three months ended March 31, 2016 | ||||||||||||||||||||
| (dollars in thousands) | US Installment(1) |
US Line of credit(2) |
Total Domestic |
UK(3) | Total | |||||||||||||||
| (unaudited) | ||||||||||||||||||||
| Combined loan loss reserve(4): |
||||||||||||||||||||
| Beginning balance |
$ | 46,635 | $ | 10,016 | $ | 56,651 | $ | 9,133 | $ | 65,784 | ||||||||||
| Net charge-offs |
(50,218 | ) | (8,100 | ) | (58,318 | ) | (10,692 | ) | (69,010 | ) | ||||||||||
| Provision for loan losses |
42,504 | 7,145 | 49,649 | 9,440 | 59,089 | |||||||||||||||
| Effect of foreign currency |
— | — | — | (271 | ) | (271 | ) | |||||||||||||
|
|
|
|
|
|
|
|
|
|
|
|||||||||||
| Ending balance |
$ | 38,921 | $ | 9,061 | $ | 47,982 | $ | 7,610 | $ | 55,592 | ||||||||||
|
|
|
|
|
|
|
|
|
|
|
|||||||||||
| Total combined loans receivable(4)(5) |
$ | 224,785 | $ | 77,224 | $ | 302,009 | $ | 39,259 | $ | 341,268 | ||||||||||
|
|
|
|
|
|
|
|
|
|
|
|||||||||||
| Combined loan loss reserve as a percentage of ending combined loans receivable |
17 | % | 12 | % | 16 | % | 19 | % | 16 | % | ||||||||||
| Net charge-offs as a percentage of revenues |
55 | % | 51 | % | 54 | % | 46 | % | 53 | % | ||||||||||
| Provision for loan losses as a percentage of revenues |
47 | % | 45 | % | 46 | % | 40 | % | 45 | % | ||||||||||
94
Table of Contents
Management’s discussion and analysis of financial condition and results of operations
| Three months ended March 31, 2015 | ||||||||||||||||||||
| (dollars in thousands) | US Installment(1) |
US Line of credit(2) |
Total Domestic |
UK(3) | Total | |||||||||||||||
| (unaudited) | ||||||||||||||||||||
| Combined loan loss reserve(4): |
||||||||||||||||||||
| Beginning balance |
$ | 39,311 | $ | 38 | $ | 39,349 | $ | 9,142 | $ | 48,491 | ||||||||||
| Net charge-offs |
(40,131 | ) | (50 | ) | (40,181 | ) | (5,513 | ) | (45,694 | ) | ||||||||||
| Provision for loan losses |
36,048 | 269 | 36,317 | 2,967 | 39,284 | |||||||||||||||
| Effect of foreign currency |
— | — | — | (363 | ) | (363 | ) | |||||||||||||
|
|
|
|
|
|
|
|
|
|
|
|||||||||||
| Ending balance |
$ | 35,228 | $ | 257 | $ | 35,485 | $ | 6,233 | $ | 41,718 | ||||||||||
|
|
|
|
|
|
|
|
|
|
|
|||||||||||
| Total combined loans receivable(4)(5) |
$ | 164,133 | $ | 1,605 | $ | 165,738 | $ | 22,876 | $ | 188,614 | ||||||||||
|
|
|
|
|
|
|
|
|
|
|
|||||||||||
| Combined loan loss reserve as a percentage of ending combined loans receivable |
21 | % | 16 | % | 21 | % | 27 | % | 22 | % | ||||||||||
| Net charge-offs as a percentage of revenues |
55 | % | 17 | % | 55 | % | 35 | % | 51 | % | ||||||||||
| Provision for loan losses as a percentage of revenues |
49 | % | 89 | % | 49 | % | 19 | % | 44 | % | ||||||||||
| (1) | Represents loan loss reserve attributable to Rise for the three months ended March 31, 2016 and 2015. |
| (2) | Represents loan loss reserve attributable to Elastic for the three months ended March 31, 2016 and 2015. |
| (3) | Represents loan loss reserve attributable to Sunny for the three months ended March 31, 2016 and 2015. |
| (4) | Not a financial measure prepared in accordance with GAAP. See “—Non-GAAP Financial Measures” for more information and for a reconciliation to the most directly comparable financial measure calculated in accordance with GAAP. |
| (5) | Includes loans originated by third-party lenders through the CSO programs, which are not included in our financial statements. |
Net charge-offs increased $23.3 million for the three months ended March 31, 2016 compared to a year ago, primarily due to loan growth in all three products during 2015. Despite the large increase in absolute dollar amounts, overall net charge-offs as a percentage of revenues for the three months ended March 31, 2016 was 53%, an increase from 51% for the comparable period in 2015 and approximates our 50% expectation as discussed in “—Key Financial and Operating Metrics—Credit quality” above.
Direct marketing costs. Direct marketing costs decreased by $0.3 million, or 3%, from $9.9 million for the three months ended March 31, 2015 to $9.6 million for the three months ended March 31, 2016 driven by improved marketing efficiency. For the three months ended March 31, 2016, the number of new customers acquired increased to 40,717 compared to 29,944 during the three months ended March 31, 2015. The resulting CAC decreased $93, or 28%, dropping to $236, from $329 in the prior year period. Our targeted CAC is between $250 and $300 per customer on a consolidated basis.
Other cost of sales. Other cost of sales increased by $1.0 million, or 37%, from $2.6 million for the three months ended March 31, 2015 to $3.6 million for the three months ended March 31, 2016 due to increased data verification, ACH transactions and other costs associated with growth in our loan portfolio.
95
Table of Contents
Management’s discussion and analysis of financial condition and results of operations
Operating expenses
| Three months ended March 31, | Period-to-period change |
|||||||||||||||||||||||
| 2016 | 2015 | |||||||||||||||||||||||
| (dollars in thousands) | Amount | Percentage of revenues |
Amount | Percentage of revenues |
Amount | Percentage | ||||||||||||||||||
| (unaudited) | ||||||||||||||||||||||||
| Operating expenses: |
||||||||||||||||||||||||
| Compensation and benefits |
$ | 16,100 | 12 | % | $ | 13,921 | 16 | % | $ | 2,179 | 16 | % | ||||||||||||
| Professional services |
7,249 | 6 | % | 4,748 | 5 | % | 2,501 | 53 | % | |||||||||||||||
| Selling and marketing |
2,505 | 2 | % | 2,490 | 3 | % | 15 | 1 | % | |||||||||||||||
| Occupancy and equipment |
2,735 | 2 | % | 2,333 | 3 | % | 402 | 17 | % | |||||||||||||||
| Depreciation and amortization |
2,633 | 2 | % | 2,068 | 2 | % | 565 | 27 | % | |||||||||||||||
| Other |
706 | 1 | % | 569 | 1 | % | 137 | 24 | % | |||||||||||||||
|
|
|
|
|
|
|
|
|
|
|
|
|
|||||||||||||
| Total operating expenses |
$ | 31,928 | 24 | % | $ | 26,129 | 29 | % | $ | 5,799 | 22 | % | ||||||||||||
|
|
|
|
|
|
|
|
|
|
|
|
|
|||||||||||||
Compensation and benefits. Compensation and benefits increased by $2.2 million, or 16%, from $13.9 million for the three months ended March 31, 2015 to $16.1 million for the three months ended March 31, 2016 primarily due to an increase in the number of employees as we continue to scale our business.
Professional services. Professional services increased by $2.5 million, or 53%, from $4.7 million for the three months ended March 31, 2015 to $7.2 million for the three months ended March 31, 2016 due to increased audit and tax services associated with the carve-out audits, increased costs from customer service support costs due to the growth in the overall loan portfolio and an increase in contractor expense to accelerate key development projects.
Selling and marketing. Changes in selling and marketing were not significant.
Occupancy and equipment. Occupancy and equipment increased by $0.4 million, or 17%, from $2.3 million for the three months ended March 31, 2015 to $2.7 million for the three months ended March 31, 2016 primarily due to increased licenses and rent expense needed to support an increased number of employees as we continue to scale our business.
Depreciation and amortization. Depreciation and amortization increased by $0.6 million, or 27%, from $2.1 million for the three months ended March 31, 2015 to $2.6 million for the three months ended March 31, 2016 due primarily to increases in equipment and internally-developed software projects placed into service during 2015.
Other expenses. Other expenses increased by $0.1 million, or 24%, from $0.6 million for the three months ended March 31, 2015 to $0.7 million for the three months ended March 31, 2016 due to higher headcount resulting in increased travel related expenses and other taxes.
Net interest expense
| Three months ended March 31, | Period-to-period change |
|||||||||||||||||||||||
| 2016 | 2015 | |||||||||||||||||||||||
| (dollars in thousands) | Amount | Percentage of revenues |
Amount | Percentage of revenues |
Amount | Percentage | ||||||||||||||||||
| (unaudited) | ||||||||||||||||||||||||
| Net interest expense |
$ | 13,500 | 10 | % | $ | 6,755 | 8 | % | $ | 6,745 | 100 | % | ||||||||||||
96
Table of Contents
Management’s discussion and analysis of financial condition and results of operations
Net interest expense increased $6.7 million, or 100%, during the three months ended March 31, 2016 versus the three months ended March 31, 2015 as we expanded the debt facility with our third party lender, VPC, to continue to fund Rise and Sunny loan growth, as well as working capital for general corporate purposes. In addition, in July 2015 Elastic SPV entered into an agreement with VPC to obtain financing in order to purchase loan participations from the bank partner for Elastic line of credit loans. At March 31, 2015, we had $174.8 million in notes payable outstanding under these debt facilities, which increased to $357.8 million at March 31, 2016. The interest rates on these notes vary from 13% to 18%.
Foreign currency transaction loss
During the three months ended March 31, 2016, we realized $1.4 million in foreign currency remeasurement losses primarily related to the debt facility that our UK entity, Elevate Credit International, Ltd., has with a third party lender, VPC, which is denominated in US dollars. The remeasurement loss for the three months ended March 31, 2015 was $1.5 million. Additionally, we expect that upon completion of our initial public offering as contemplated by this prospectus, we will use a portion of the proceeds to pay down the $42.3 million outstanding under the UK entity’s VPC debt facility.
Income tax expense
| Three months ended March 31, | Period-to-period change |
|||||||||||||||||||||||
| 2016 | 2015 | |||||||||||||||||||||||
| (dollars in thousands) | Amount | Percentage of revenues |
Amount | Percentage of revenues |
Amount | Percentage | ||||||||||||||||||
| (unaudited) | ||||||||||||||||||||||||
| Income tax expense |
$ | 5,866 | 5 | % | $ | 2,509 | 3 | % | $ | 3,357 | 134 | % | ||||||||||||
Our income tax expense increased $3.4 million, or 134%, from $2.5 million for the three months ended March 31, 2015 to $5.9 million for the three months ended March 31, 2016. Our US effective tax rates for the three months ended March 31, 2016 and 2015 were 45% and 37%, respectively. Our US effective tax rates are different from the standard corporate federal income tax rate of 35% primarily due to our corporate state tax obligations in the states where we have lending activities and our permanent non-deductible items. Our UK operations have generated net operating losses which have a full valuation allowance provided due to the lack of sufficient objective evidence regarding the realizability of this asset. Therefore, no UK tax benefit has been recognized in the financial statements for the three months ended March 31, 2016 and 2015.
Net income
| Three months ended March 31, | Period-to-period change |
|||||||||||||||||||||||
| 2016 | 2015 | |||||||||||||||||||||||
| (dollars in thousands) | Amount | Percentage of revenues |
Amount | Percentage of revenues |
Amount | Percentage | ||||||||||||||||||
| (unaudited) | ||||||||||||||||||||||||
| Net income |
$ | 5,792 | 4 | % | $ | 898 | 1 | % | $ | 4,894 | 545 | % | ||||||||||||
Our net income increased $4.9 million, or 545%, from $0.9 million for the three months ended March 31, 2015 to $5.8 million for the three months ended March 31, 2016. This increase was due to an increase in gross profit that resulted from an increase in our loan portfolio, partially offset by increases in operating expenses and net interest expense as discussed above.
97
Table of Contents
Management’s discussion and analysis of financial condition and results of operations
Comparison of years ended December 31, 2015 and 2014
Revenues
| Years ended December 31, | Period-to-period change |
|||||||||||||||||||||||
| 2015 | 2014 | |||||||||||||||||||||||
| (dollars in thousands) | Amount | Percentage of revenues |
Amount | Percentage of revenues |
Amount | Percentage | ||||||||||||||||||
| Finance charges |
$ | 432,385 | 100 | % | $ | 272,275 | 99 | % | $ | 160,172 | 59 | % | ||||||||||||
| Other |
1,621 | — | 1,443 | 1 | 116 | 8 | ||||||||||||||||||
|
|
|
|
|
|
|
|
|
|
|
|
|
|||||||||||||
| Revenues |
$ | 434,006 | 100 | % | $ | 273,718 | 100 | % | $ | 160,288 | 59 | % | ||||||||||||
|
|
|
|
|
|
|
|
|
|
|
|
|
|||||||||||||
Revenues increased by $160.3 million, or 59%, from $273.7 million for the year ended December 31, 2014 to $434.0 million for the year ended December 31, 2015. This growth in revenues was primarily attributable to increased finance charges driven by growth in our average loan balances, partially offset by a decrease in our overall APR, as illustrated in the tables below. Over time, we expect our average customer loan balance to continue to increase and the related overall effective APR of our loan portfolio to decrease as our loan portfolio continues to grow and mature with more existing and repeat customers who pay lower interest rates over time.
The below tables break out this change in finance charges (including CSO acquisition fees and cash advance fees) by product:
| Year ended December 31, 2015 | ||||||||||||||||||||
| (dollars in thousands) | US Installment (1) |
US Line of Credit |
Total Domestic |
UK | Total | |||||||||||||||
| Average combined loans receivable – principal(2) |
$ | 190,950 | $ | 27,158 | $ | 218,108 | $ | 31,950 | $ | 250,058 | ||||||||||
| Effective APR |
172 | % | 87 | % | 161 | % | 252 | % | 173 | % | ||||||||||
| Finance charges |
$ | 328,213 | $ | 23,681 | $ | 351,894 | $ | 80,491 | $ | 432,385 | ||||||||||
| Other |
929 | 688 | 1,617 | 4 | 1,621 | |||||||||||||||
|
|
|
|
|
|
|
|
|
|
|
|||||||||||
| Total revenue |
$ | 329,142 | $ | 24,369 | $ | 353,511 | $ | 80,495 | $ | 434,006 | ||||||||||
|
|
|
|
|
|
|
|
|
|
|
|||||||||||
| Year ended December 31, 2014 | ||||||||||||||||||||
| (dollars in thousands) | US Installment (1) |
US Line of Credit |
Total Domestic |
UK | Total | |||||||||||||||
| Average combined loans receivable – principal(2) |
$ | 112,976 | $ | 70 | $ | 113,046 | $ | 21,445 | $ | 134,491 | ||||||||||
| Effective APR |
182 | % | 106 | % | 182 | % | 312 | % | 202 | % | ||||||||||
| Finance charges |
$ | 205,205 | $ | 74 | $ | 205,279 | $ | 66,996 | $ | 272,275 | ||||||||||
| Other |
1,348 | 26 | 1,374 | 69 | 1,443 | |||||||||||||||
|
|
|
|
|
|
|
|
|
|
|
|||||||||||
| Total revenue |
$ | 206,553 | $ | 100 | $ | 206,653 | $ | 67,065 | $ | 273,718 | ||||||||||
|
|
|
|
|
|
|
|
|
|
|
|||||||||||
| (1) | Includes loans originated by third-party lenders through the CSO programs, which are not included in our financial statements. |
| (2) | Average combined loans receivable – principal is calculated using daily principal balances. |
98
Table of Contents
Management’s discussion and analysis of financial condition and results of operations
During the year ended December 31, 2015, our average combined loans receivable – principal increased $115.6 million as we continued to market our Rise, Sunny and Elastic products in the US and UK. As a result of the increased average combined loans receivable – principal, finance charges increased $160.2 million during the year ended December 31, 2015 compared to a year earlier. This increase was partially offset by a decrease in our average APR, in particular for Sunny. Effective January 1, 2015, Sunny was required under the new UK regulations to have a lower APR in order to comply with a 24% monthly rate cap. Our prior monthly APR for Sunny had a maximum monthly rate of 29%. This new rate cap, combined with our existing Sunny UK customers continuing to receive lower rates, resulted in the overall annual APR of that product dropping to 252% for the year ended December 31, 2015 compared to 312% for the year ended December 31, 2014. Along with the new rate cap, the APR of Sunny may further decrease over time as the portfolio matures and more existing customers receive lower rates on their loans, including the new Sunny Plus, one of our Sunny sub-brands, that has a monthly rate of only 10.5%.
Cost of sales
| Years ended December 31, | Period-to-period change |
|||||||||||||||||||||||
| 2015 | 2014 | |||||||||||||||||||||||
| (dollars in thousands) | Amount | Percentage of revenues |
Amount | Percentage of revenues |
Amount | Percentage | ||||||||||||||||||
| (unaudited) | ||||||||||||||||||||||||
| Cost of sales: |
||||||||||||||||||||||||
| Provision for loan losses |
$ | 232,650 | 54 | % | $ | 170,908 | 62 | % | $ | 61,742 | 36 | % | ||||||||||||
| Direct marketing costs |
61,032 | 14 | 60,166 | 22 | 866 | 1 | ||||||||||||||||||
| Other cost of sales |
15,197 | 4 | 10,603 | 4 | 4,594 | 43 | ||||||||||||||||||
|
|
|
|
|
|
|
|
|
|
|
|
|
|||||||||||||
| Total cost of sales |
$ | 308,879 | 71 | % | $ | 241,677 | 88 | % | $ | 67,202 | 28 | % | ||||||||||||
|
|
|
|
|
|
|
|
|
|
|
|
|
|||||||||||||
Provision for loan losses. Provision for loan losses increased by $61.7 million, or 36%, from $170.9 million for the year ended December 31, 2014 to $232.7 million for the year ended December 31, 2015 due to an increase in the overall loan portfolio. The provision for loan losses increase reflected a $76.2 million increase in net charge-offs partially offset by a $14.5 million decrease in additional loss provisions.
The tables below break out these changes by loan product:
| (dollars in thousands) |
Year ended December 31, 2015 |
|||||||||||||||||||
| US Installment(1) |
US Line of credit(2) |
Total domestic |
UK(3) | Total | ||||||||||||||||
| Combined loan loss reserve(4): |
||||||||||||||||||||
| Beginning balance |
$ | 39,311 | $ | 38 | $ | 39,349 | $ | 9,142 | $ | 48,491 | ||||||||||
| Net charge-offs |
(179,527 | ) | (9,844 | ) | (189,371 | ) | (25,424 | ) | (214,795 | ) | ||||||||||
| Provision for loan losses |
186,851 | 19,822 | 206,673 | 25,977 | 232,650 | |||||||||||||||
| Effect of foreign currency |
— | — | — | (562 | ) | (562 | ) | |||||||||||||
|
|
|
|
|
|
|
|
|
|
|
|||||||||||
| Ending balance |
$ | 46,635 | $ | 10,016 | $ | 56,651 | $ | 9,133 | $ | 65,784 | ||||||||||
|
|
|
|
|
|
|
|
|
|
|
|||||||||||
| Total combined loans receivable(4)(5) |
$ | 259,825 | $ | 76,031 | $ | 335,856 | $ | 42,210 | $ | 378,066 | ||||||||||
|
|
|
|
|
|
|
|
|
|
|
|||||||||||
| Combined loan loss reserve as a percentage of ending combined loans receivable |
18 | % | 13 | % | 17 | % | 22 | % | 17 | % | ||||||||||
| Net charge-offs as a percentage of revenues |
55 | % | 40 | % | 54 | % | 32 | % | 49 | % | ||||||||||
| Provision for loan losses as a percentage of revenues |
57 | % | 81 | % | 58 | % | 32 | % | 54 | % | ||||||||||
99
Table of Contents
Management’s discussion and analysis of financial condition and results of operations
| (dollars in thousands) | Year ended December 31, 2014 |
|||||||||||||||||||
| US Installment(1) |
US Line of credit(2) |
Total domestic |
UK(3) | Total | ||||||||||||||||
| Combined loan loss reserve(4): |
||||||||||||||||||||
| Beginning balance |
$ | 12,657 | $ | — | $ | 12,657 | $ | 4,169 | $ | 16,826 | ||||||||||
| Net charge-offs |
(112,085 | ) | (44 | ) | (112,129 | ) | (26,430 | ) | (138,559 | ) | ||||||||||
| Provision for loan losses |
138,739 | 82 | 138,821 | 32,087 | 170,908 | |||||||||||||||
| Effect of foreign currency |
— | — | — | (684 | ) | (684 | ) | |||||||||||||
|
|
|
|
|
|
|
|
|
|
|
|||||||||||
| Ending balance |
$ | 39,311 | $ | 38 | $ | 39,349 | $ | 9,142 | $ | 48,491 | ||||||||||
|
|
|
|
|
|
|
|
|
|
|
|||||||||||
| Total combined loans receivable(4)(5) |
$ | 186,280 | $ | 184 | $ | 186,464 | $ | 31,234 | $ | 217,698 | ||||||||||
|
|
|
|
|
|
|
|
|
|
|
|||||||||||
| Combined loan loss reserve as a percentage of ending combined loans receivable |
21 | % | 21 | % | 21 | % | 29 | % | 22 | % | ||||||||||
| Net charge-offs as a percentage of revenues |
54 | % | 44 | % | 54 | % | 39 | % | 51 | % | ||||||||||
| Provision for loan losses as a percentage of revenues |
67 | % | 82 | % | 67 | % | 48 | % | 62 | % | ||||||||||
| (1) | Represents loan loss reserve attributable to Rise for the year ended December 31, 2015 and December 31, 2014. |
| (2) | Represents loan loss reserve attributable to Elastic for the year ended December 31, 2015 and December 31, 2014. |
| (3) | Represents loan loss reserve attributable to Sunny for the year ended December 31, 2015 and December 31, 2014. |
| (4) | Not a financial measure prepared in accordance with GAAP. See “—Non-GAAP Financial Measures” for more information and for a reconciliation to the most directly comparable financial measure calculated in accordance with GAAP. |
| (5) | Includes loans originated by third-party lenders through the CSO programs, which are not included in our financial statements. |
Net charge-offs increased $76.2 million for the year ended December 31, 2015 versus the year ended December 31, 2014, primarily due to an increase in Rise net charge-offs associated with growth in the Rise loan portfolio during the year. Despite the large increase in absolute dollar amounts, overall net charge-offs as a percentage of revenues for the year ended December 31, 2015 was 49%, a decrease from 51% for the comparable period in 2014 and slightly lower than our 50% expectation as discussed in “—Key Financial and Operating Metrics—Credit quality” above.
Additional provision for loan losses decreased $14.5 million as the combined loan loss reserve increased $17.3 million in the year ended December 31, 2015, as compared to a $31.7 million increase in the year ended December 31, 2014. This relatively smaller increase in the loan loss reserve was due to both an improvement in credit quality and the Rise portfolio growing slower during the year ended December 31, 2015 compared to the year ended December 31, 2014. The combined loan loss reserve as a percentage of total combined loans receivable was 17% as of December 31, 2015, a decrease compared to 22% as of December 31, 2014.
Direct marketing costs. Direct marketing costs increased by $0.9 million, or 1%, from $60.2 million for the year ended December 31, 2014 to $61.0 million for the year ended December 31, 2015 driven by an increase in the number of new customers acquired. For the year ended December 31, 2015, the number of new customers acquired increased to 238,238 compared to 202,656 during the year ended December 31, 2014. Despite the increase in direct marketing costs, CAC decreased $41, dropping to $256, from $297 a year earlier. Our targeted CAC is between $250 and $300 per customer on a consolidated basis.
Other cost of sales. Other cost of sales increased by $4.6 million, or 43%, from $10.6 million for the year ended December 31, 2014 to $15.2 million for the year ended December 31, 2015 due to increased data verification, ACH transactions and other costs associated with growth in our loan portfolio.
100
Table of Contents
Management’s discussion and analysis of financial condition and results of operations
Operating expenses
| Years ended December 31, | Period-to-period change |
|||||||||||||||||||||||
| 2015 | 2014 | |||||||||||||||||||||||
| (dollars in thousands) | Amount | Percentage of revenues |
Amount | Percentage of revenues |
Amount | Percentage | ||||||||||||||||||
| Operating expenses: |
||||||||||||||||||||||||
| Compensation and benefits |
$ | 60,568 | 14 | % | $ | 48,010 | 18 | % | $ | 12,558 | 26 | % | ||||||||||||
| Professional services |
25,134 | 6 | 18,662 | 7 | 6,472 | 35 | ||||||||||||||||||
| Selling and marketing |
7,567 | 2 | 7,366 | 3 | 201 | 3 | ||||||||||||||||||
| Occupancy and equipment |
9,690 | 2 | 8,043 | 3 | 1,647 | 20 | ||||||||||||||||||
| Depreciation and amortization |
8,898 | 2 | 8,317 | 3 | 581 | 7 | ||||||||||||||||||
| Other |
4,303 | 1 | 2,766 | — | 1,537 | 56 | ||||||||||||||||||
|
|
|
|
|
|
|
|
|
|
|
|
|
|||||||||||||
| Total operating expenses |
$ | 116,160 | 27 | % | $ | 93,164 | 34 | % | $ | 22,996 | 25 | % | ||||||||||||
|
|
|
|
|
|
|
|
|
|
|
|
|
|||||||||||||
Compensation and benefits. Compensation and benefits increased by $12.6 million, or 26%, from $48.0 million for the year ended December 31, 2014 to $60.6 million for the year ended December 31, 2015 primarily due to an increase in the number of employees as we continue to scale our business.
Professional services. Professional services increased by $6.5 million, or 35%, from $18.7 million for the year ended December 31, 2014 to $25.1 million for the year ended December 31, 2015 due to increased audit and tax services associated with the carve-out audits, increased costs from customer service support costs due to the growth in the overall loan portfolio and an increase in contractor expense to accelerate key development projects.
Selling and marketing. Changes in selling and marketing were not significant.
Occupancy and equipment. Occupancy and equipment increased by $1.6 million, or 20%, from $8.0 million for the year ended December 31, 2014 to $9.7 million for the year ended December 31, 2015 primarily due to increased licenses and rent expense needed to support an increased number of employees as we continue to scale our business.
Depreciation and amortization. Depreciation and amortization increased by $0.6 million, or 7%, from $8.3 million for the year ended December 31, 2014 to $8.9 million for the year ended December 31, 2015 due primarily to increases in equipment and internally-developed software projects placed into service during 2015.
Other expenses. Other expenses increased by $1.5 million, or 56%, from $2.8 million for the year ended December 31, 2014 to $4.3 million for the year ended December 31, 2015 due to higher headcount resulting in increased travel related expenses and other taxes.
Net interest expense
| Years ended December 31, | Period-to-period change |
|||||||||||||||||||||||
| 2015 | 2014 | |||||||||||||||||||||||
| (dollars in thousands) | Amount | Percentage of revenues |
Amount | Percentage of revenues |
Amount | Percentage | ||||||||||||||||||
| Net interest expense |
$ | 36,674 | 8 | % | $ | 12,939 | 5 | % | $ | 23,735 | 183 | % | ||||||||||||
101
Table of Contents
Management’s discussion and analysis of financial condition and results of operations
Net interest expense increased $23.7 million, or 183%, during the year ended December 31, 2015 versus the year ended December 31, 2014 as we expanded the debt facility with our third party lender, VPC, in August 2014 to fund Rise and Sunny, as well as working capital for general corporate purposes. In addition, in July 2015 Elastic SPV entered into an agreement with VPC to obtain financing in order to purchase loan participations from the bank partner for Elastic line of credit loans. At December 31, 2014, we had $174.8 million in notes payable outstanding under these debt facilities, which increased to $339.8 million at December 31, 2015. The interest rates on these notes vary from 13% to 18%. Prior to establishing these debt facilities we funded all of our loans to customers out of our existing cash flows. During 2014, after the Spin-Off, we also borrowed funds from TFI for general corporate purposes under the credit facility provided as part of the Spin-Off. The maximum amount we borrowed under the debt facility was $24.8 million and we repaid the outstanding balance on the facility in full as of December 31, 2014 and terminated the debt facility on January 1, 2015. The interest rate on that debt facility was 8%.
Foreign currency transaction gain (loss)
During the year ended December 31, 2015, we realized $2.4 million in foreign currency remeasurement losses, primarily related to the debt facility our UK entity, Elevate Credit International, Ltd., has with a third party lender, VPC, which is denominated in US dollars. This debt facility for our UK entity was not put in place until August 15, 2014, and was not drawn down until October 2014. The remeasurement loss for the year ended December 31, 2014 was $1.4 million. Additionally, we expect that upon completion of our initial public offering as contemplated by this prospectus, we will use a portion of the proceeds to pay down the $42.3 million outstanding under the UK entity’s VPC debt facility.
Non-operating Income
For the year ended December 31, 2015, we realized non-operating income of $5.5 million. We had no non-operating income during the year ended December 31, 2014. In June 2015, we entered into a consulting agreement with a related party whereby the related party agreed to release our $5.5 million contingent consideration payable to them, and, in exchange, we agreed to pay the related party a $300 thousand annual fee for the next five years for consulting services. See “Certain relationships and related party transactions—Transactions with RLJ Financial LLC.”
Income tax benefit
| Years ended December 31, | Period-to-period change |
|||||||||||||||||||||||
| 2015 | 2014 | |||||||||||||||||||||||
| (dollars in thousands) | Amount | Percentage of revenues |
Amount | Percentage of revenues |
Amount | Percentage | ||||||||||||||||||
| Income tax benefit |
$ | (4,658 | ) | (1 | )% | $ | (20,710 | ) | (8 | )% | $ | 16,052 | 78 | % | ||||||||||
Our income tax benefit decreased $16.1 million, or 78%, from $20.7 million for the year ended December 31, 2014 to $4.7 million for the year ended December 31, 2015. Our US effective tax rates for the years ended December 31, 2015 and 2014 were 32% and 38%, respectively. Our US effective tax rates are different from the standard corporate federal income tax rate of 35% primarily due to our corporate state tax obligations in the states where we have lending activities and our permanent non-deductible items. Our UK operations have generated net operating losses which have a full valuation allowance provided due to the lack of sufficient objective evidence regarding the realizability of this asset. Therefore, no UK tax benefit has been recognized in the financial statements for the years ended December 31, 2015 and 2014.
102
Table of Contents
Management’s discussion and analysis of financial condition and results of operations
Discontinued operations
We realized a small gain of $0.1 million in the year ended December 31, 2014 on our discontinued operations (i.e., our prior rent-to-own product) that we ceased offering in 2014.
Net loss
| Years ended December 31, | Period-to-period change |
|||||||||||||||||||||||
| 2015 | 2014 | |||||||||||||||||||||||
| (dollars in thousands) | Amount | Percentage of revenues |
Amount | Percentage of revenues |
Amount | Percentage | ||||||||||||||||||
| Net loss |
$ | 19,911 | 5 | % | $ | 54,625 | 20 | % | $ | (34,714 | ) | (64 | )% | |||||||||||
Our net loss decreased $34.7 million, or 64%, from $54.6 million for the year ended December 31, 2014 to $19.9 million for the year ended December 31, 2015. This decrease was due to an increase in gross profit that resulted from an increase in our loan portfolio, partially offset by increases in operating expenses and net interest expense as discussed above.
LIQUIDITY AND CAPITAL RESOURCES
We principally rely on our working capital and our credit facility with VPC to fund the loans we make to our customers.
Debt facilities
VPC Facility
In 2014, we entered into an agreement with VPC providing a credit facility with a maximum total borrowing amount of $315 million in order to fund our Rise and UK Sunny products and provide working capital. On May 20, 2015, the VPC Facility was amended to increase the maximum total borrowing amount to $335 million. On February 11, 2016, the VPC Facility was further amended to include an additional $10 million to provide working capital bringing the total borrowing amount to $345 million.
The VPC Facility provided the following term notes as of March 31, 2016:
| Ø | A US Term Note with a maximum borrowing amount of $250 million at a base rate (defined as the 3-month LIBOR rate) plus 15% for the outstanding balance up to $75 million, 14% for the outstanding balance greater than $75 million and up to $150 million, and 13% for the outstanding balance greater than $150 million used to fund the Rise loan portfolio. |
| Ø | A UK Term Note with a maximum borrowing amount of $50 million at a base rate (defined as the 3-month LIBOR rate) plus 16% used to fund the Sunny loan portfolio. |
| Ø | A Sub-debt Term Note with a maximum borrowing amount of $45 million at a base rate (defined as the 3-month LIBOR rate) plus 18% used to fund working capital. |
There are no principal payments due or scheduled until the VPC Facility maturity date of January 30, 2018. All of our assets are pledged as collateral to secure the VPC Facility. The agreement contains
103
Table of Contents
Management’s discussion and analysis of financial condition and results of operations
customary financial covenants, including a maximum loan to value ratio of between 0.75 and 0.85 (which was temporarily amended to 0.90 for the December 31, 2015 testing date only), depending on the actual charge-off rate as of the relevant measurement date, a maximum principal charge-off rate of not greater than 20%, determined by the product of the ratio of principal balances charged-off or past due to principal balances due for the current, 1-30 and 31-60 delinquency status periods determined as of the month of charge-off and the preceding two month period, and a maximum first payment default rate of not greater than 20% for any month and not greater than 17.5% for any two months during any three month period. We were in compliance with all covenants as of March 31, 2016 and December 31, 2015.
ESPV Facility
Elastic funding
The Elastic line of credit product is originated by a third-party lender, Republic Bank, which initially provides all of the funding for that product. Republic Bank retains 10% of the balances of all loans originated and sells a 90% loan participation in the Elastic lines of credit. We purchased such loan participations ourselves through June 30, 2015. As detailed below, beginning July 1, 2015, such participations are being sold to Elastic SPV.
Elastic SPV structure
As of July 1, 2015, loan participations are sold by Republic Bank to Elastic SPV. We do not own Elastic SPV, but effective July 1, 2015 we entered into a credit default protection agreement with Elastic SPV whereby we agreed to provide credit protection to the investors in Elastic SPV against Elastic loan losses in return for a credit premium. Per the terms of the agreement, under GAAP, the Company qualifies as the primary beneficiary of Elastic SPV, and we are required to consolidate the financial results of Elastic SPV as a variable interest entity in our combined financial results. Accordingly, the presentation of this structure will not differ from the presentation of the previous structure reflected in our financial statements, as we continue to earn revenues and incur losses on 90% of the Elastic lines of credit originated by Republic Bank that are sold to Elastic SPV.
Elastic SPV receives its funding from VPC in a separate financing facility, the “ESPV Facility,” which was finalized on July 13, 2015. The ESPV Facility provides for a maximum borrowing amount of $50 million at a base rate (defined as the greater of the 3-month LIBOR rate or 1% per annum) plus 13% for the outstanding balance up to $50 million. To continue to fund Elastic growth, as of October 21, 2015, the maximum borrowing amount was expanded to $100 million at a base rate plus 12% for any outstanding balance greater than $50 million. There are no principal payments due or scheduled until the credit facility maturity date of July 1, 2019. All of our assets are pledged as collateral to secure the ESPV Facility. The agreement contains customary financial covenants, including a maximum loan to value ratio of between 0.75 and 0.85, depending on the actual charge off rate as of the relevant measurement date, a maximum principal charge-off rate of not greater than 20%, determined by the product of the ratio of principal balances charged-off or past due to principal balances due for the current, 1-30 and 31-60 delinquency status periods determined as of the month of charge-off and the preceding two month period, and a maximum first payment default rate of not greater than 15%. We were in compliance with all covenants as of March 31, 2016 and December 31, 2015.
104
Table of Contents
Management’s discussion and analysis of financial condition and results of operations
Outstanding Notes Payable
The outstanding balance of notes payable as of March 31, 2016 is as follows:
| (dollars in thousands) | ||||
| US Term Note bearing interest at 3-month LIBOR + 13-15% |
$ | 197,000 | ||
| UK Term Note bearing interest at 3-month LIBOR + 16% |
42,300 | |||
| Sub-debt Term Note bearing interest at 3-month LIBOR + 18% |
45,000 | |||
| ESPV Term Note bearing interest at (maximum of 3-month LIBOR or 1%)+12-13% |
73,500 | |||
|
|
|
|||
| Total |
$ | 357,800 | ||
|
|
|
|||
Cash and cash equivalents, loans (net of allowance for loan losses), and cash flows
The following table summarizes our cash and cash equivalents, loans receivable, net, and cash flows for the periods indicated:
| As of and for the years ended December 31, |
As of and for the three months ended March 31, |
|||||||||||||||
| (dollars in thousands) | 2015 | 2014 | 2016 | 2015 | ||||||||||||
| (unaudited) | ||||||||||||||||
| Cash and cash equivalents |
$ | 29,050 | $ | 29,519 | $ | 72,871 | $ | 39,379 | ||||||||
| Loans receivable, net |
274,208 | 147,823 | 257,763 | 127,702 | ||||||||||||
| Cash provided by (used in): |
||||||||||||||||
| Operating activities |
128,432 | 55,648 | 57,285 | 20,962 | ||||||||||||
| Investing activities |
(290,323 | ) | (226,982 | ) | (30,618 | ) | (11,069 | ) | ||||||||
| Financing activities |
161,856 | 197,732 | 17,195 | 45 | ||||||||||||
Our cash and cash equivalents at March 31, 2016 were held primarily for working capital purposes. We may, from time to time, use excess cash and cash equivalents to fund our lending activities. We do not enter into investments for trading or speculative purposes. Our policy is to invest any cash in excess of our immediate working capital requirements in investments designed to preserve the principal balance and provide liquidity. Accordingly, our excess cash is invested primarily in demand deposit accounts that are currently providing only a minimal return.
Net cash provided by operating activities
We generated $57.3 million in cash from our operating activities for the three months ended March 31, 2016, primarily from revenues derived from our loan portfolio. This was up $36.3 million from the $21.0 million of cash provided by operating activities during the three months ended March 31, 2015. This increase was the result of the growth in our loan portfolio in 2015 which drove a $41.2 million increase in our revenues for the three months ended March 31, 2016 compared to the comparable prior year period.
105
Table of Contents
Management’s discussion and analysis of financial condition and results of operations
Net cash used in investing activities
During the years ended December 31, 2015 and 2014, cash used in investing activities was $290.3 million and $227.0 million, respectively. For the three months ended March 31, 2016 and 2015, cash used in investing activities totaled $30.6 million and $11.1 million respectively. The following table summarizes cash provided by (used in) investing activities for the periods indicated:
| Years ended December 31, | Three months ended March 31, |
|||||||||||||||
| (dollars in thousands) | 2015 | 2014 | 2016 | 2015 | ||||||||||||
| (unaudited) | ||||||||||||||||
| Cash used in investing activities |
||||||||||||||||
| Net loans issued to consumers, less repayments |
$ | (286,389 | ) | $ | (213,720 | ) | $ | (28,452 | ) | $ | (10,165 | ) | ||||
| Participation premium paid |
(1,019 | ) | — | (439 | ) | — | ||||||||||
| Purchases of fixed assets |
(9,272 | ) | (9,274 | ) | (1,727 | ) | (1,377 | ) | ||||||||
| Change in restricted cash |
6,357 | (3,882 | ) | — | 473 | |||||||||||
| Other activities |
— | (106 | ) | — | — | |||||||||||
|
|
|
|
|
|
|
|
|
|||||||||
| $ | (290,323 | ) | $ | (226,982 | ) | $ | (30,618 | ) | $ | (11,069 | ) | |||||
|
|
|
|
|
|
|
|
|
|||||||||
For the three months ended March 31, 2016, cash used in investing activities was $19.5 million higher than for the comparable 2015 period, primarily due to an increase in net loans issued to consumers.
Net cash provided by financing activities
Cash flows from financing activities primarily include cash received from issuing notes payable and related repayments of those notes payable, and contributions from TFI prior to the Spin-Off. During the years ended December 31, 2015 and 2014, cash provided by financing activities was $161.9 million and $197.7 million, respectively. For the three months ended March 31, 2016 and 2015, cash provided by financing activities was $17.2 million and $45 thousand, respectively. The following table summarizes cash provided by (used in) financing activities for the periods indicated:
| Years ended December 31, |
Three months ended March 31, |
|||||||||||||||
| (dollars in thousands) | 2015 | 2014 | 2016 | 2015 | ||||||||||||
| (unaudited) | ||||||||||||||||
| Cash provided by financing activities |
||||||||||||||||
| Proceeds less repayment of notes payable |
$ | 165,000 | $ | 174,800 | $ | 18,000 | $ | — | ||||||||
| Contribution from TFI |
— | 24,032 | — | — | ||||||||||||
| Other activities |
(3,144 | ) | (1,100 | ) | (805 | ) | 45 | |||||||||
|
|
|
|
|
|
|
|
|
|||||||||
| $ | 161,856 | $ | 197,732 | $ | 17,195 | $ | 45 | |||||||||
|
|
|
|
|
|
|
|
|
|||||||||
The increase in cash provided by financing activities for the three months ended March 31, 2016 as compared to the three months ended March 31, 2015 was due to increased borrowings in 2016 under the VPC Facility and the ESPV Facility.
106
Table of Contents
Management’s discussion and analysis of financial condition and results of operations
Free Cash Flow
In addition to the above, we also review FCF when analyzing our cash flows from operations. We calculate free cash flow as cash flows from operating activities, adjusted for the principal loan net charge-offs and capital expenditures incurred during the period. While this is a non-GAAP measure, we believe it provides a useful presentation of cash flows derived from our core operating activities.
| Year ended December 31, | Three months ended March 31, | |||||||||||||||
| (dollars in thousands) | 2015 | 2014 | 2016 | 2015 | ||||||||||||
| (unaudited) | ||||||||||||||||
| Net cash provided by operating activities |
$ | 128,432 | $ | 55,648 | $ | 57,285 | $ | 20,962 | ||||||||
| Adjustments: |
||||||||||||||||
| Net charge-offs – combined principal loans |
(150,091 | ) | (93,732 | ) | (49,370 | ) | (31,279 | ) | ||||||||
| Capital expenditures |
(9,272 | ) | (9,274 | ) | (1,727 | ) | (1,377 | ) | ||||||||
|
|
|
|
|
|
|
|
|
|||||||||
| FCF |
$ | (30,931 | ) | $ | (47,358 | ) | $ | 6,188 | $ | (11,694 | ) | |||||
|
|
|
|
|
|
|
|
|
|||||||||
Our FCF was a positive $6.2 million for the first three months of 2016 compared to a negative $11.7 million for the comparable prior year period. The increase in our FCF was the result of the continued scaling of our business. However, our loan portfolio declined during both the first quarter of both 2016 and 2015 due to seasonality associated with customers paying down their loan balances from tax refunds. As we grow our loan portfolio and customer base throughout the rest of 2016 our FCF will be impacted by the resulting upfront costs incurred, such as CAC.
Operating and capital expenditure requirements
We believe that our existing cash balances, together with the available borrowing capacity under our VPC Facility and ESPV Facility, will be sufficient to meet our anticipated cash operating expense and capital expenditure requirements through at least the next 12 months. Following our initial public offering, we intend to further diversify our funding sources. If our loan growth exceeds our expectations, our available cash balances and net proceeds from this offering may be insufficient to satisfy our liquidity requirements, and we may seek additional equity or debt financing. This additional capital may not be available on reasonable terms, or at all.
CONTRACTUAL OBLIGATIONS
Our principal commitments consist of obligations under our debt facilities and operating lease obligations. The following table summarizes these contractual obligations as of December 31, 2015. Future events could cause actual payments to differ from these estimates.
| Payment due by period | ||||||||||||||||||||
| (dollars in thousands) | Total | Less than 1 year |
1-3 years | 3-5 years | More than 5 years |
|||||||||||||||
| Contractual obligations: |
||||||||||||||||||||
| Long-term debt obligations |
$ | 339,800 | $ | — | $ | 274,300 | $ | 65,500 | $ | — | ||||||||||
| Capital lease obligations |
271 | 250 | 21 | — | — | |||||||||||||||
| Operating lease obligations |
4,192 | 2,661 | 1,457 | 74 | — | |||||||||||||||
|
|
|
|
|
|
|
|
|
|
|
|||||||||||
| Total contractual obligations |
$ | 344,263 | $ | 2,911 | $ | 275,778 | $ | 65,574 | $ | — | ||||||||||
|
|
|
|
|
|
|
|
|
|
|
|||||||||||
107
Table of Contents
Management’s discussion and analysis of financial condition and results of operations
OFF-BALANCE SHEET ARRANGEMENTS
We provide services in connection with installment loans originated by independent third-party lenders, or “CSO Lenders,” whereby we act as a credit service organization/credit access business on behalf of consumers in accordance with applicable state laws through our “CSO program.” The CSO program includes arranging loans with CSO lenders, assisting in the loan application, documentation and servicing processes. Under the CSO program, we guarantee the repayment of a customer’s loan to the CSO lenders as part of the credit services we provide to the customer. A customer who obtains a loan through the CSO program pays us a fee for the credit services, including the guaranty, and enters into a contract with the CSO lenders governing the credit services arrangement. We estimate a liability for losses associated with the guaranty provided to the CSO lenders using assumptions and methodologies similar to the allowance for loan losses, which we recognize for our consumer loans. See Note 1 to our audited combined and consolidated financial statements included elsewhere in this prospectus for more information.
QUANTITATIVE AND QUALITATIVE DISCLOSURES ABOUT MARKET RISK
Market risk is the risk of loss to future earnings, values or future cash flows that may result from changes in the price of a financial instrument. The value of a financial instrument may change as a result of changes in interest rates, exchange rates, commodity prices, equity prices and other market changes. We are exposed to market risk related to changes in interest rates and foreign currency exchange rates. We do not use derivative financial instruments for speculative, hedging or trading purposes, although in the future we may enter into interest rate or exchange rate hedging arrangements to manage the risks described below.
Interest rate sensitivity
Our cash and cash equivalents as of March 31, 2016 consisted of demand deposit accounts. Our primary exposure to market risk for our cash and cash equivalents is interest income sensitivity, which is affected by changes in the general level of US interest rates. Given the currently low US interest rates, we generate only a de minimis amount of interest income from these deposits.
All of our customer loan portfolios are fixed APR loans and not variable in nature. Additionally given the high APR’s associated with these loans, we do not believe there is any interest rate sensitivity associated with our customer loan portfolio.
Our VPC and ESPV funding facilities are variable rate in nature and tied to the 3-month LIBOR rate. Thus, any increase in the 3-month LIBOR rate will result in an increase in our net interest expense. We intend to mitigate this risk by using all or a portion of the proceeds raised in this offering to pay down our VPC debt. The outstanding balance of our VPC debt at March 31, 2016 was $284.3 million and the balance at December 31, 2015 was $274.3 million. The outstanding balance of our ESPV debt was $73.5 million and $65.5 million at March 31, 2016 and December 31, 2015, respectively. Based on the average outstanding indebtedness through the three months ended March 31, 2016, a 1% (100 basis points) increase in interest rates would have increased our interest expense by approximately $0.7 million for the period.
Foreign currency exchange risk
We provide installment loans to customers in the UK. Interest income from our Sunny UK installment loans is earned in British pounds, or “GBP.” Fluctuations in exchange rate of the US dollar, or “USD,” against the GBP and cash held in such foreign currency can result, and have resulted, in fluctuations in our operating income and foreign currency transaction gains and losses. As the USD has strengthened compared to most
108
Table of Contents
Management’s discussion and analysis of financial condition and results of operations
foreign currencies, including the GBP, during 2015 and the first quarter of 2016, our financial position and results of operations have been adversely affected. We had foreign currency transaction losses of approximately $1.4 million and $1.5 million during the three months ended March 31, 2016 and 2015, respectively. We currently do not engage in any foreign exchange hedging activity but may do so in the future.
At December 31, 2015, our net GBP-denominated assets were approximately $38.2 million (which excludes the $42.3 million USD-denominated VPC credit facility). A hypothetical 10% strengthening or weakening in the value of the USD compared to the GBP at this date would have resulted in a decrease/increase in net assets of approximately $3.8 million. During the three months ended March 31, 2016, the GBP-denominated pre-tax loss was approximately $9.5 million. A hypothetical 10% strengthening or weakening in the value of the USD compared to the GBP during this period would have resulted in a decrease/increase in the pre-tax loss of approximately $1.0 million.
At March 31, 2016, our net GBP-denominated assets were approximately $41.7 million (which excludes the $42.3 million USD-denominated VPC credit facility). A hypothetical 10% strengthening or weakening in the value of the USD compared to the GBP at this date would have resulted in a decrease/increase in net assets of approximately $4.2 million. During the three months ended March 31, 2016, the GBP-denominated pre-tax loss was approximately $1.5 million. A hypothetical 10% strengthening or weakening in the value of the USD compared to the GBP during this period would have resulted in a decrease/increase in the pre-tax loss of approximately $0.1 million.
BASIS OF PRESENTATION AND CRITICAL ACCOUNTING POLICIES
On January 31, 2014, we were incorporated as a wholly owned subsidiary of TFI. On May 1, 2014, we were spun off from TFI and we entered into several agreements with TFI that governed shared services, tax sharing, data sharing, employee matters and a credit facility. We accounted for this transaction in accordance with relevant accounting guidance governing spinoffs. See “Certain relationships and related party transactions—Spin-Off Agreements with TFI” contained elsewhere in this prospectus for additional information regarding the agreements entered into between us and TFI in connection with the Spin-Off.
Our combined financial statements include amounts prior to the Spin-Off that have been derived from the consolidated financial statements and accounting records of TFI, using the historical results of operations and historical basis of assets and liabilities of the direct lending and branded products business, which was spun off to form our business. Beginning May 1, 2014, our consolidated financial statements include Elevate Credit, Inc. and our majority-owned subsidiaries. Prior to May 1, 2014, all intercompany transactions between us and TFI have been included within the combined financial statements and are also considered to be effectively settled through contributions or distributions within TFI’s net investment at the time the transactions were recorded. The total net effect of these intercompany transactions is reflected in the Combined and Consolidated Statements of Cash Flows as financing activities. Beginning May 1, 2014, all material intercompany transactions have been eliminated.
We made certain assumptions and significant judgments regarding the treatment of amounts affected by the Spin-Off, which we believe are critical to understanding and evaluating our reported financial results. Additionally, while our significant accounting policies are more fully described in Note 1 to our combined and consolidated financial statements appearing elsewhere in this prospectus, we believe the accounting policies detailed below reflect our most significant judgments, estimates and assumptions, which we believe are also critical to understanding and evaluating our reported financial results.
109
Table of Contents
Management’s discussion and analysis of financial condition and results of operations
Assumptions and significant judgments regarding treatment of amounts affected by the Spin-Off
In preparing our combined and consolidated financial statements for the period before May 1, 2014, we made certain assumptions and used certain methodologies to allocate various expenses from TFI to us. For instance, we assigned certain expenses on a specifically identifiable basis, meaning that where we were able to tie expenses, such as direct mail marketing expenses for any of the products we currently offer, back to our business, we allocated such expenses to us. In other instances, such as with regard to certain corporate functions historically performed by TFI, including finance, human resources and information technology support services, we also used allocation methods such as those based on a percentage of revenues, headcount or other reasonable methods to assign expenses to us. All such costs and expenses were assumed to be settled with TFI through TFI’s net investment equity account in the period in which the costs were incurred.
For services shared between TFI and us pursuant to our shared services agreement with TFI, which was effective from the date of the Spin-Off through October 2014 and covered services such as human resources, finance, facilities management and information technology, to the extent that a shared-services cost was not demonstrably attributable to either party, the cost was allocated ratably based on each party’s proportion of revenues.
We believe the assumptions and methodologies used in these allocations are reasonable. However, the combined financial statements included herein may not necessarily reflect our results of operations, financial position and cash flows in the future or what our results of operations, financial position and cash flows would have been had we been a separate stand-alone public company during the periods presented.
Revenue recognition
We realize revenues in connection with the consumer loans we offer for each of our products, including finance charges, line of credit fees and fees for services provided through CSO programs. We have also historically realized a small amount of NSF fees on Rise installment loans and may recognize other fees or charges as permitted by applicable laws and pursuant to the agreement with the borrower. We discontinued Rise NSF fees in the fourth quarter of 2015 and now generally all of our revenues will consist of finance charges on our Rise and Sunny installment loans, cash advance fees associated with our Elastic line of credit product, and fees for services provided through CSO programs associated with our Rise installment loans in Texas and Ohio. The Company also recorded revenues related to the sale of customer applications to unrelated third parties. These applications are sold with the customer’s consent in the event that the Company or its CSO lenders are unable to offer the customer a loan. Revenue is recognized at the time of the sale. Other revenues also include marketing and licensing fees received from the third-party lender related to the Elastic product. Revenue related to these fees is recognized when service is performed.
We recognize finance charges on installment loans on a constant yield basis over their terms. We realize fees such as CSO acquisition fees and cash advance fees as they are earned over the term of the loan. We do not recognize finance charges or other fees on installment loans or lines of credit more than 60 days past due based on management’s historical experience that such past due loans and lines of credit are unlikely to be repaid and thus the loans are charged off. Installment loans and lines of credit are considered past due for accounting purposes if a scheduled payment is not paid on its due date. Payments received on past due loans are applied against the loan and accrued interest balance to bring the loan current. When payments are received, they are first applied to accrued charges and fees, then interest, and then to the loan balance.
110
Table of Contents
Management’s discussion and analysis of financial condition and results of operations
Allowance and liability for estimated losses on consumer loans
Credit losses are an inherent part of outstanding loans receivable. We maintain an allowance for loan losses for loans and interest receivable at a level estimated to be adequate to absorb such losses based primarily on our analysis of historical loss rates by product, stratified by delinquency ranges. We also consider recent collection and delinquency trends, as well as macro-economic conditions that we believe may affect portfolio losses. Additionally, due to the uncertainty of economic conditions and cash flow resources of our customers, we adjust our estimates as needed, with the result that the allowance for loan losses is subject to change in the near-term, which could significantly impact our combined and consolidated financial statements. If a loan is deemed to be uncollectible before it is fully reserved based on information we become aware of (e.g., receipt of customer bankruptcy notice), we charge off such loan at that time. As noted above, we believe that loans and lines of credit more than 60 days past due have a low probability of being repaid. We charge off such overdue loans and reduce the allowance accordingly. Any recoveries on loans previously charged to the allowance are credited to the allowance when collected.
Liability for estimated losses on credit service organization loans
Under the CSO program, we guarantee the repayment of a customer’s loan to the CSO lenders as part of the credit services we provide to the customer. A customer who obtains a loan through the CSO program pays us a fee for the credit services, including the guaranty, and enters into a contract with the CSO lenders governing the credit services arrangement. We estimate a liability for losses associated with the guaranty provided to the CSO lenders using assumptions and methodologies similar to the allowance for loan losses, which we recognize for our consumer loans.
Goodwill
Goodwill represents the excess of the purchase price over the fair value of the net tangible and identifiable intangible assets acquired in each business combination. We perform an impairment review of goodwill and intangible assets with an indefinite life annually at October 31 and between annual tests if we determine that an event has occurred or circumstances changed in a way that would more likely than not reduce the fair value of a reporting unit below its carrying amount. Such a determination may be based on our consideration of macro-economic and other factors and trends, such as current and projected financial performance, interest rates and access to capital.
Our impairment evaluation of goodwill is based on comparing the fair value of the respective reporting unit to its carrying value. The fair value of the reporting unit is determined based on a weighted average of the income and market approaches. The income approach establishes fair value based on estimated future cash flows of the reporting unit, discounted by an estimated weighted-average cost of capital developed using the capital asset pricing model, which reflects the overall level of inherent risk of the reporting unit. The income approach uses our projections of financial performance for a six- to nine-year period and includes assumptions about future revenue growth rates, operating margins and terminal values. The market approach establishes fair value by applying cash flow multiples to the respective reporting unit’s operating performance. The multiples are derived from other publicly traded companies that are similar but not identical from an operational and economic standpoint.
We completed our annual test and determined that there was no evidence of impairment of goodwill for the two reporting units that have goodwill. Although no goodwill impairment was noted, there can be no assurances that future goodwill impairments will not occur.
111
Table of Contents
Management’s discussion and analysis of financial condition and results of operations
Internal-use software development costs
We capitalize certain costs related to software developed for internal-use, primarily associated with the ongoing development and enhancement of our technology platform. Costs incurred in the preliminary development and post-development stages are expensed. These costs are amortized on a straight-line basis over the estimated useful life of the related asset, generally three years.
Income taxes
Our income tax expense and deferred income tax balances in the combined and consolidated financial statements have been calculated on a separate tax return basis, although prior to the Spin-Off, our operations had been included as part of the consolidated US federal and state tax returns of TFI. Prior to May 1, 2014, current income taxes are assumed to be settled with TFI through TFI’s net investment and settlement is deemed to occur in the year of recognition in the current income tax provision. As part of the process of preparing our combined and consolidated financial statements, we are required to estimate income taxes in each of the jurisdictions in which we operate. This process involves estimating the actual current tax expense based on various factors and assumptions, together with assessing temporary differences in recognition of income for tax and accounting purposes. These differences result in net deferred tax assets and are included within the Combined and Consolidated Balance Sheets. We then must assess the likelihood that the deferred tax assets will be recovered from future taxable income and, to the extent we believe that recovery is not likely, we must establish a valuation allowance. An expense or benefit is included within the tax provision in the Combined and Consolidated Statement of Operations for any increase or decrease in the valuation allowance for a given period.
We perform an evaluation of the recoverability of our deferred tax assets on a quarterly basis. We establish a valuation allowance if it is more likely than not (greater than 50 percent) that all or some portion of the deferred tax asset will not be realized. We analyze several factors, including the nature and frequency of operating losses, our carryforward period for any losses, the reversal of future taxable temporary differences, the expected occurrence of future income or loss and the feasibility of available tax planning strategies to protect against the loss of deferred tax assets. We have established a full valuation allowance for our UK deferred tax assets due to the lack of sufficient objective evidence supporting the realization of these assets in the foreseeable future.
We account for uncertainty in income taxes in accordance with applicable guidance, which requires that a more-likely-than-not threshold be met before the benefit of a tax position may be recognized in the combined and consolidated financial statements and prescribes how such benefit should be measured. We must evaluate tax positions taken on our tax returns for all periods that are open to examination by taxing authorities and make a judgment as to whether and to what extent such positions are more likely than not to be sustained based on merit.
Our judgment is required in determining the provision for income taxes, the deferred tax assets and liabilities and any valuation allowance recorded against deferred tax assets. Our judgment is also required in evaluating whether tax benefits meet the more-likely-than-not threshold for recognition.
Stock-Based Compensation
In accordance with applicable accounting standards, all stock-based compensation made to employees is measured based on the grant-date fair value of the awards and recognized as compensation expense on a straight-line basis over the period during which the option holder is required to perform services in exchange for the award (the vesting period). The Company uses the Black-Scholes-Merton Option
112
Table of Contents
Management’s discussion and analysis of financial condition and results of operations
Pricing Model to estimate the fair value of stock options. The use of the option valuation model requires subjective assumptions, including the fair value of the Company’s common stock, the expected term of the option and the expected stock price volatility based on peer companies. Additionally, the recognition of stock-based compensation expense requires an estimation of the number of options that will ultimately vest and the number of options that will ultimately be forfeited.
RECENTLY ISSUED ACCOUNTING PRONOUNCEMENTS AND JOBS ACT ELECTION
Under the Jumpstart Our Business Startups Act, or “JOBS Act,” we meet the definition of an emerging growth company. We have irrevocably elected to opt out of the extended transition period for complying with new or revised accounting standards pursuant to Section 107(b) of the JOBS Act.
Recently Adopted Accounting Standards
In June 2015, the FASB issued ASU No. 2015-10, Technical Corrections and Improvements (“ASU 2015-10”). The amendments in ASU 2015-10 represent changes to clarify the Codification, correct unintended application of guidance, or make minor improvements to the Codification that are not expected to have a significant effect on current accounting practice or create a significant administrative cost to most entities. In addition, some of the amendments are intended to make the Codification easier to understand and easier to apply by eliminating inconsistencies, providing needed clarifications, and improving the presentation of guidance in the Codification. ASU 2015-10 is effective for fiscal years (and interim reporting periods within those years) beginning after December 15, 2015. The Company has adopted this standard, and it did not have a material impact on the Company’s consolidated financial statements.
In April 2015, the FASB issued ASU No 2015-03, Interest—Imputation of Interest (Subtopic 835-30): Simplifying the Presentation of Debt Issuance Costs (“ASU 2015-03”). The amendments in ASU 2015-03 are intended to simplify the presentation of debt issuance costs. These amendments require that debt issuance costs related to a recognized debt liability be presented in the balance sheet as a direct deduction from the carrying amount of that debt liability, consistent with debt discounts. The recognition and measurement guidance for debt issuance costs are not affected by the amendments in this ASU. In August 2015, the FASB issued ASU No. 2015-15, Interest—Imputation of Interest (Subtopic 835-30): Presentation and Subsequent Measurement of Debt Issuance Costs Associated with Line-of-Credit Arrangements (“ASU 2015-15”). ASU 2015-15 amends Subtopic 835-30 to include that the Securities and Exchange Commission would not object to the deferral and presentation of debt issuance costs as an asset and subsequent amortization of debt issuance costs over the term of the line-of-credit arrangement, whether or not there are any outstanding borrowings on the line-of-credit arrangement. ASU 2015-03 is effective for fiscal years (and interim reporting periods within those years) beginning after December 15, 2015. Early adoption is permitted. The Company has adopted this guidance for the period ended March 31, 2016, and all prior period financial information presented has been adjusted to reflect the retrospective application of this guidance resulting in a reduction to other assets and to notes payable of $0.7 million as of March 31, 2016 and December 31, 2015.
In February 2015, the FASB issued ASU 2015-02, Consolidation (Topic 810): Amendments to the Consolidation Analysis (“ASU 2015-02”). The amendments in ASU 2015-02 provide guidance for reporting entities that are required to evaluate whether they should consolidate certain legal entities. In accordance with ASU 2015-02, all legal entities are subject to reevaluation under the revised consolidation model. ASU 2015-02 is effective for public business entities for annual periods, and interim periods within those annual periods, beginning after December 15, 2015. Early adoption is permitted. The Company has adopted this standard, and it did not have a material impact on the Company’s consolidated financial statements.
113
Table of Contents
Management’s discussion and analysis of financial condition and results of operations
In January 2015, the FASB issued ASU 2015-01, Income Statement—Extraordinary and Unusual Items (Subtopic 225-20): Simplifying Income Statement Presentation by Eliminating the Concept of Extraordinary Items (“ASU 2015-01”). The amendments in ASU 2015-01 eliminate from GAAP the concept of extraordinary items. If an event or transaction meets the criteria for extraordinary classification, it is segregated from the results of ordinary operations and is shown as a separate item in the income statement, net of tax. ASU 2015-01 is effective for annual periods, and interim periods within those annual periods, beginning after December 15, 2015. Early adoption is permitted. The Company has adopted this standard, and it did not have a material impact on the Company’s consolidated financial statements.
Accounting Standards to be Adopted in Future Periods
In March 2016, the FASB issued ASU No. 2016-09, Compensation—Stock Compensation (Topic 718): Improvements to Employee Share-Based Payment Accounting (“ASU 2016-09”). ASU 2016-09 is intended to simplify the accounting for share-based payment transactions, including the income tax consequences, classification of awards as either equity or liabilities and classification on the statement of cash flows. ASU 2016-09 is effective for fiscal years beginning after December 15, 2016, including interim periods within those fiscal years. Early adoption is permitted. The Company is still assessing the potential impact of ASU 2016-09 on its consolidated financial statements.
In February 2016, the FASB issued ASU No. 2016-02, Leases (Topic 842) (“ASU 2016-02”). ASU 2016-02 is intended to improve the reporting of leasing transactions to provide users of financial statements with more decision-useful information. ASU 2016-02 will require organizations that lease assets to recognize on the balance sheet the assets and liabilities for the rights and obligations created by those leases. ASU 2016-02 is effective for fiscal years beginning after December 15, 2018, including interim periods within those fiscal years. Early adoption is permitted. The Company is still assessing the potential impact of ASU 2016-02 on its consolidated financial statements.
In January 2016, the FASB issued ASU No. 2016-01, Financial Instruments—Overall (Subtopic 825-10): Recognition and Measurement of Financial Assets and Financial Liabilities (“ASU 2016-01”). ASU 2016-01 is intended to enhance the reporting model for financial instruments to provide users of financial statements with more decision-useful information. ASU 2016-01 is effective for fiscal years beginning after December 15, 2017, including interim periods within those fiscal years. The Company is still assessing the potential impact of ASU 2016-01 on its consolidated financial statements.
In August 2014, the FASB issued ASU 2014-15, Presentation of Financial Statements—Going Concern (Subtopic 205-40): Disclosure of Uncertainties about an Entity’s Ability to Continue as a Going Concern (“ASU 2014-15”). The amendments in ASU 2014-15 require management to evaluate, in connection with financial statement preparation for each annual and interim reporting period, whether there are conditions or events that raise substantial doubt about the entity’s ability to continue as a going concern within one year after the date the financial statements are issued, and to provide related disclosures. ASU 2014-15 applies to all entities and is effective for annual periods ending after December 15, 2016 and interim periods thereafter. Early adoption is permitted. The Company is still assessing the potential impact of ASU 2014-15 on its consolidated financial statements.
In May 2014, the FASB issued ASU 2014-09, Revenue from Contracts with Customers (Topic 606) (“ASU 2014-09”). ASU 2014-09 is a comprehensive new revenue recognition model that requires a company to recognize revenue to depict the transfer of goods or services to a customer at an amount that reflects the consideration it expects to receive in exchange for those goods or services. ASU 2014-09 also
114
Table of Contents
Management’s discussion and analysis of financial condition and results of operations
requires additional disclosure about the nature, amount, timing and uncertainty of revenue and cash flows arising from customer contracts, including significant judgments and changes in judgments and assets recognized from costs incurred to obtain or fulfill a contract. In August 2015, the FASB issued ASU No. 2015-14, Revenue from Contracts with Customers (Topic 606): Deferral of Effective Date (“ASU 2015-14”), which defers the effective date of this guidance by one year, to the annual reporting periods beginning after December 15, 2017, including interim periods within that reporting period. A reporting entity may choose to early adopt the guidance as of the original effective date. In April 2016, the FASB issued ASU 2016-09, Revenues from Contracts with Customers (Topic 606): Identifying Performance Obligations and Licensing (“ASU 2016-10”), which clarifies the guidance related to identifying performance obligations and licensing implementation. The Company is still assessing the potential impact of ASU 2014-09 on its consolidated financial statements.
115
Table of Contents
Unless expressly indicated or the context requires otherwise, the terms “Elevate,” “company,” “we,” “us” and “our” used below refer to Elevate Credit, Inc. and, where appropriate, our wholly owned subsidiaries, as well as the direct lending and branded product business of our predecessor, TFI, for periods prior to the Spin-Off. We generally refer to loans, customers and other information and data associated with each of Rise, Elastic and Sunny as Elevate’s loans, customers, information and data, irrespective of whether Elevate originates the credit to the customer or whether such credit is originated by a third party. See “Certain Conventions Governing Information in this Prospectus” for detailed information.
OUR COMPANY
We provide technology-driven, progressive online credit solutions to non-prime consumers, typically defined as those with credit scores of less than 700. We use advanced technology and proprietary risk analytics to provide more convenient and more responsible financial options to our customers, who are not well-served by either banks or legacy non-prime lenders. We currently offer online installment loans and lines of credit in the US and the UK. Our products, Rise, Elastic and Sunny, reflect our mission of “Good Today, Better Tomorrow” and provide customers with access to competitively priced credit and services while helping them build a brighter financial future with credit building and financial wellness features.
We have experienced rapid growth since launching our current generation of product offerings in 2013. Since their introduction, Rise, Elastic and Sunny, together, have provided approximately $1.6 billion in credit to approximately 550,000 customers and generated strong revenue growth. Our revenues for the year ended December 31, 2015 grew 59% to $434 million from $274 million for the year ended December 31, 2014 and revenues for the three months ended March 31, 2016 grew 46% compared to the three months ended March 31, 2015. Our operating income (loss) for the years ended December 31, 2015 and 2014 were $9 million and $(61) million, respectively, and were $26.5 million and $11.6 million for the three months ended March 31, 2016 and 2015, respectively.
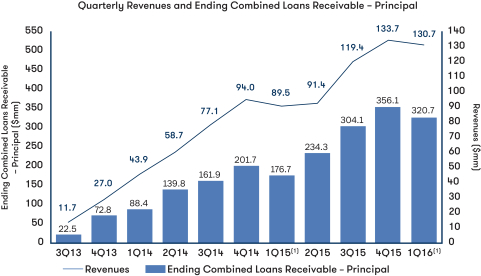
| (1) | Our business is subject to seasonality, which is particularly evident in the first quarter of every year. See “Management’s discussion and analysis of financial condition and results of operations—Key Financial and Operating Metrics—Revenue growth.” |
116
Table of Contents
Business
We believe our growth demonstrates our ability to rapidly scale our business by utilizing advanced technology, proprietary risk analytics and sophisticated multi-channel marketing capabilities. The chart above details our total combined loans receivable and revenues by quarter since the fourth quarter of 2013.
We believe the market for non-prime credit in the US and UK consists of approximately 170 million consumers. See “—Industry Overview—Non-prime consumers represent the largest segment of the credit market.” Despite the large size of the non-prime credit market, banks continue to neglect it. According to our analysis of master pool trust data of securitizations for the five major credit card issuers, we estimate that from 2008 to 2015 revolving credit to US borrowers with FICO scores less than 660 was reduced by approximately $143 billion. Elevate is leading a new generation of technology-enabled lenders with a focus on bringing better options to this underserved market.
Our products in the US and the UK are:
| Ø | Rise. An installment loan product available in 15 states in the US; |
| Ø | Sunny. An installment loan product available in the UK; and |
| Ø | Elastic. A line of credit product originated by a third-party bank and offered in 40 states in the US. |
We differentiate ourselves in the following ways:
| Ø | Online products that are “Good Today, Better Tomorrow.” We provide customers access to competitively priced credit when they need it and reward successful payment history with rates on subsequent loans (installment loan products) that can decrease over time. In addition, our products offer responsible lending features including credit bureau reporting, free credit monitoring (for US customers), online financial literacy videos and tools, amortizing loan balances, flexible repayment schedules, and no prepayment penalties or punitive fees. |
| Ø | Industry-leading advanced technology and proprietary risk analytics. We have developed proprietary automated underwriting capabilities that allow us to make data-driven decisions on loan applications in seconds. To best serve a broad set of non-prime consumers, we have developed a unique approach that we call “segment-optimized analytics.” This approach utilizes proprietary credit scoring models for each of the customer segments and channels we serve to underwrite and assess risk and uses targeted fraud models to identify potential fraud. We apply both cutting-edge and traditional analytical techniques and use a vast array of data sources, while complying with applicable lending laws. As a result of our proprietary technology and risk analytics, over 90% of loan applications are fully automated with no manual review required. |
| Ø | Integrated multi-channel marketing strategy. We use an integrated multi-channel marketing strategy to directly reach potential customers. Our marketing strategy includes coordinated direct mail programs, TV campaigns, search engine marketing and digital campaigns as well as strategic partnerships. We believe our direct-to-consumer approach allows us to focus on higher quality, lower cost customer acquisitions while maximizing reach and brand awareness. Approximately 85% of our customers are sourced from direct marketing channels. We continue to invest in new marketing channels, including social media, which we believe will provide us with further competitive advantages and support our ongoing growth. We expect to continue to expand growth in each of our channels based on improved customer targeting analytics and increasingly sophisticated response models that allow us to expand our marketing reach while maintaining target customer acquisition costs, or “CAC.” |
117
Table of Contents
Business
Our seasoned management team has, on average, over 15 years of technology and financial services experience and has worked together for an average of over six years in the non-prime consumer credit industry. Our management team has overseen the origination of $3.0 billion in credit to 1.4 million consumers for the combined current and predecessor direct and branded products that were contributed to Elevate in the Spin-Off. In addition, our management team achieved stable credit performance through the recent financial crisis, maintaining total principal losses as a percentage of loan originations of between 17% and 20% each year from 2006 through 2011. See “—Advanced Analytics and Risk Management—History of stable credit quality through the economic downturn.”
Our business has grown rapidly under our management team. For the years ended December 31, 2015 and 2014 our revenues were $434.0 million and $273.7 million, respectively. For the years ended December 31, 2015 and 2014 our Adjusted EBITDA was $17.9 million and $(52.8) million, respectively, and our net loss from continuing operations was $19.9 million and $54.8 million, respectively. For the three months ended March 31, 2016 and 2015, our revenues were $130.7 million and $89.5 million, while our Adjusted EBITDA totaled $29.1 million and $13.7 million, and our net income was $5.8 million and $0.9 million, respectively. See “Management’s discussion and analysis of financial condition and results of operations—Non-GAAP Financial Measures” for a discussion and reconciliation of Adjusted EBITDA to net loss.
Along with increased revenue growth and improving margins, we have also reduced the average APR to our customers. For the three months ended March 31, 2016 our average portfolio effective APR was 153%, a reduction of approximately 40% from 2013 when the average effective APR was 250%. We believe that this rate reduction helps to differentiate our products in the market and reflects improvements in our underwriting and the maturing of our loan portfolios.
INDUSTRY OVERVIEW
Non-prime consumers represent the largest segment of the credit market
We provide credit to non-prime consumers, many of whom face reduced credit options and increased financial pressure due to macro-economic changes over the past few decades. We believe that this segment of the population represents a massive and underserved market of approximately 170 million consumers in the US and UK—a larger population than the market for prime credit:
| Ø | According to an analysis of TransUnion data through the third quarter of 2014 by the Corporation for Enterprise Development, approximately 56% of the US population with a TransRisk Score (TransUnion’s credit score) had a non-prime credit score of less than 700, representing approximately 109 million Americans adults. |
| Ø | Approximately 22% of Americans over the age of 18, or approximately 53 million Americans, do not have a credit score at all or had credit records that were treated as “unscorable” by traditional credit scoring models used by nationwide credit reporting agencies, according to a 2015 report by Fair Isaac Corporation. |
| Ø | According to a House of Commons report covering the years 2013 and 2014, it is estimated that the UK “non-standard” credit market consisted of approximately ten million people. |
118
Table of Contents
Business
Our typical customers in both the US and UK are middle-income and have a mainstream demographic profile as illustrated below which is in line with the average of the populations of the US and UK, respectively, in terms of income, educational background and homeownership. We refer to them as the “New Middle Class:”
| Rise and Elastic Customer Profile |
Sunny Customer Profile | |||
| Average income |
$48,300 for Rise $60,000 for Elastic |
£23,400 | ||
| % Attended college |
79% | 58% | ||
| % Own their homes |
44% | 22% | ||
| Typical range of FICO scores |
575 to 600 | N/A |
Our customers have varying credit profiles, which we currently generally categorize into the following groups in order to provide insight into the different types of credit histories and financial needs facing our non-prime customers.
| Ø | “Prime-ish.” Consumers with access to traditional credit sources who have exhausted all available lines of credit and now need new sources of credit. |
| Ø | “Challenged.” Consumers who have had traditional credit in the past but experienced defaults and as a result now use alternative non-prime products such as payday, pawn and title loans. |
| Ø | “Invisibles.” Consumers with no credit history or such limited credit experience that they cannot be sufficiently scored by traditional means and as a result are kept outside the traditional credit markets. |
These categories do not correspond to specific credit score bands or precise scores or definitions for the customers included in such categories. We continue to identify additional customer segments and evolve our customer segment definitions over time.
The New Middle Class has an unmet need for credit
Due to wage stagnation over the past several decades and the further impact of the recent financial crisis, the New Middle Class is characterized by a lack of savings and significant income volatility. According to a Federal Reserve survey in 2015, 47% of American adults said they could not cover an emergency expense of $400, or would cover it by selling an asset or borrowing money. In the UK, according to a report by Friends Provident Foundation surveying over 1,500 adult consumers in the lowest 50% of household incomes in the UK in 2010, 68% of low-income households had no savings and seven in ten low-income households would find it difficult or impossible to raise from £200 to £300 in an emergency. Further, the JPMorgan Chase Institute reported in a 2015 study of 100,000 US customers that 41% saw their incomes vary by more than 30% from month-to-month, and noted that the bottom 80% of households by income lacked sufficient savings to cover the volatility observed in income and spending. As a result, our customer base often must rely on short-term credit to fund unexpected expenses, like car and home repairs or medical emergencies.
Non-prime credit can be less vulnerable to recessionary factors
We believe that patterns of credit charge-offs for non-prime consumers typically are counter-cyclical when compared to prime consumers in credit downturns. In a recession, banks and traditional prime credit providers often experience increases in credit charge-off rates and tighten access to credit, which pushes certain consumers out of the credit market. Conversely, with advanced underwriting, lenders serving non-prime consumers are able to maintain comparatively flat charge off rates in part because these consumers are unable to avail themselves of the traditional credit market. See “Business—Advanced Analytics and Risk Management—History of stable credit quality through the economic downturn.”
119
Table of Contents
Business
Non-prime consumers have different needs for credit.
Non-prime consumers generally have unique and immediate credit needs, which differ greatly from the typical prime consumer. Where prime consumers consider price most in selecting their credit products, we believe that non-prime consumers will often consider a variety of features, including the simplicity of the application process, speed of decisioning and funding, how they will be treated if they cannot pay their loan back on time, and flexible repayment terms.
Banks do not adequately serve the New Middle Class
Following the recent financial crisis, most banks tightened their underwriting standards and increased their minimum FICO score requirements for borrowers, leaving non-prime borrowers with severely reduced access to traditional credit. Despite the improving economy, banks continue to underserve the New Middle Class. According to our analysis of master pool trust data of securitizations for the five major credit card issuers, we estimate that from 2008 to 2015 revolving credit to US borrowers with a FICO score of less than a 660 was reduced by approximately $143 billion. This reduction has had a profound impact on non-prime consumers in the US and UK who typically have little to no savings. Often, the only credit-like product offered by banks that is available to non-prime borrowers is overdraft protection, which in essence provides credit at extremely high rates. According to a 2013 study by the CFPB, Americans pay approximately $34 billion in bank overdraft and similar fees annually. Additionally, according to a 2014 study by the CFPB, bank overdraft fees can carry an effective APR of 17,000%.
Legacy non-prime lenders are not innovative
As a result of limited access to credit products offered by banks, the New Middle Class has historically had to rely on a variety of legacy non-prime lenders, such as storefront installment lenders, payday lenders, title lenders, pawn and rent-to-own providers that typically do not offer the customer the convenience of online and mobile access. While legacy non-prime credit products may fulfill a borrower’s immediate funding needs, many of these products have significant drawbacks for consumers, including a potential cycle of debt, higher interest rates, punitive fees and aggressive collection tactics. Additionally, legacy non-prime lenders do not typically report to major credit bureaus, so non-prime consumers often remain in a cycle of non-prime and rarely improve their financial options.
New innovation is slow to market
Despite the growing and unmet need for non-prime credit, few innovative solutions tailored for non-prime consumers have come to market. Where new online marketplace lenders and small business lenders have emerged to serve prime consumers, we believe that non-prime consumers still have relatively few responsible online credit options. We believe this is because underwriting non-prime consumers presents significantly greater analytical challenges than underwriting prime consumers. Unlike prime consumers, the credit profiles of non-prime consumers vary greatly and their needs are extremely diverse. While new data and techniques can assist in improving underwriting capabilities, we believe lenders still require deep insight and extensive experience to successfully serve non-prime consumers while maintaining target loss rates. Additionally, we believe the regulatory requirements necessary to serve non-prime consumers compliantly can be a barrier to entry for less sophisticated and newer entrants.
Consumers are embracing the internet for their personal finances
Consumers are increasingly turning to online solutions to fulfill their personal finance needs. A 2013 study by the CFI Group found that 82% of bank customers surveyed in the US had interacted with their bank’s website at least once in the last 30 days. In the UK, 61% of people choose to do their banking or
120
Table of Contents
Business
pay their bills online, according to a 2015 report by the Financial Inclusion Commission. Additionally, according to a 2015 report by the Center for Economics and Business Research, 53% of UK adults used the internet for their banking needs and this proportion is projected to grow to 66% of UK adults by 2020. We believe this growth is an indication of borrower preferences for online financial products that are more convenient and easier to use than products provided by legacy brick-and-mortar lenders.
OUR SOLUTIONS
Our innovative online credit solutions provide immediate relief to customers today and can help them build a brighter financial future. Our mission of “Good Today, Better Tomorrow” is central to our innovative product design. We are committed to responsible products with competitive pricing that help customers improve their financial options with features like lower interest rates, free online financial literacy videos and tools, and free credit monitoring. Elevate’s current suite of credit products includes Rise, Sunny and Elastic. See “—Our Products.”
We use advanced technology and proprietary risk analytics to provide more convenient, competitively priced financial solutions to our customers, who are not well-served by either banks or legacy non-prime lenders. We believe we are one of the first to develop a risk-based pricing model utilizing technology and risk analytics focused on the non-prime credit industry. We offer a number of financial wellness and consumer-friendly features that we believe are unmatched in the non-prime lending market. As a result, we believe we are leading the next generation of more responsible online credit providers for the New Middle Class.
Our products provide the following key benefits:
| Ø | Competitive pricing and no hidden or punitive fees. Our US products offer rates that we believe are typically more than 50% lower than many generally available alternatives from legacy non-prime lenders, such as payday lenders, which have an average APR of almost 400%, according to findings by the CFPB. Our products offer rates on subsequent loans (installment loan products) that can decrease over time based on successful loan payment history. For instance, as of March 31, 2016, almost two-thirds of Rise customers in good standing had received a rate reduction. In addition, in order to help our customers facing financial hardships, we have eliminated punitive fees, including returned payment fees and late charges, among others. |
| Ø | Access and convenience. We provide convenient, easy-to-use products via online and mobile platforms. Consumers are able to apply using an online application, which takes only minutes to complete. Credit determinations are made in seconds and over 90% of loan applications are fully automated with no manual review required. Funds are typically available next-day in the US and same-day in the UK. Consumers can elect to make payments via preapproved automated clearinghouse, or “ACH,” authorization or other methods such as check or debit card transfer. |
| Ø | Flexible payment terms and responsible lending features. Customers can select a repayment schedule that fits their needs with no prepayment penalties. In addition, our products feature amortizing principal balances over the term of the loan, in contrast to balloon payments required by many legacy non-prime lenders which often result in repeated refinancings and can lead to a cycle of debt. To ensure that consumers fully understand the product and their alternatives, we provide extensive “Know Before You Borrow” disclosures as well as an industry-leading five-day period for customers to rescind their loan at no cost. Consistent with our goal of being sensitive to the unique needs of non-prime consumers, we also offer flexible solutions to help customers facing issues impacting their ability to make scheduled payments. Our solutions include notifications before payment processing, extended due dates, grace periods, payment plans and settlement offers. |
121
Table of Contents
Business
| Ø | Financial wellness features. Our products include credit building and financial wellness programs, such as credit reporting, free credit monitoring (in the US) and online financial literacy videos and tools. Our goal is to help our customers improve their financial options and behaviors at no additional charge. |
This combination of features has resulted in extremely high customer satisfaction for our products. Internal customer satisfaction ratings are consistently over 90% for all of our products. Additionally, our products’ Net Promoter Scores, or “NPS,” are consistently significantly higher than the average NPS for banks (approximately 15%) and credit cards (approximately 18%) as measured by Temkin Group. For example, in March 2016, the NPS was 36%, 58% and 55% for each of Rise, Elastic and Sunny, respectively.
OUR COMPETITIVE ADVANTAGES
Using our technology platform and proprietary risk analytics, we are able to offer our customers innovative credit solutions that place us as a leader among a new generation of more responsible, online non-prime lenders. We believe the following are our key competitive advantages:
| Ø | Differentiated online products for non-prime consumers. We are committed to our mission of “Good Today, Better Tomorrow.” Our products are “good today” due to their convenience, cost and flexibility. Our average customer receives an interest rate that we believe is more than 50% less than that offered by many legacy non-prime lenders, such as payday lenders. Furthermore, the convenience of online and mobile access and flexible repayment options distinguish our products from many legacy non-prime credit options. However, we go even further in creating credit products that can help enable customers to have a “better tomorrow.” Based on successful payment history, rates on subsequent loans (installment loan products) can decrease over time, and we provide a path to prime credit for struggling consumers by reporting to credit bureaus, providing free credit monitoring (for US products), and offering online financial literacy videos and tools to help build better financial management skills. |
| Ø | Leading risk analytics. As a result of our extensive experience and track record in the industry, we have developed a unique approach to underwriting non-prime credit using our segment-optimized analytics. Unlike simplistic scoring approaches that may be adequate for prime and near-prime consumers, our approach allows us to serve a broad set of customer segments within the non-prime market and across the numerous channels we use to reach them. Our team of over 35 data scientists utilizes thousands of data inputs to continually optimize our proprietary credit scoring model which is currently in its 12th generation. See “—Advanced Analytics and Risk Management—Segment-optimized analytics—Segment specific credit scores.” Across the portfolio of products we currently offer, we have maintained stable credit quality as evidenced by credit loss rates of under 20% on the original principal loan balances. See “Management’s discussion and analysis of financial condition and results of operations—Key Financial and Operating Metrics—Credit quality.” Furthermore, our proprietary credit and fraud scoring models allow not only for the scoring of a broad range of non-prime consumers, but also across a variety of products, channels, geographies and regulatory requirements. |
| Ø | Innovative and flexible technology platform. Investment in our flexible and scalable technology platform has enabled us to rapidly grow and innovate new products—notably supporting the launch of our current generation of product offerings in 2013. Our proven technology platform provides for highly automated loan originations and cost-effective servicing. In addition, our platform is adaptable to allow us to deliver customizable online loan products to meet changing consumer preferences and respond to a dynamic regulatory environment. Further, our open architecture allows us to easily integrate best-in-class third party providers, including strategic partners, data sources and outsourced vendors into our platform. |
122
Table of Contents
Business
| Ø | Integrated multi-channel marketing approach. Unlike other online non-prime lenders, which typically rely on lead generators to identify potential customers, we use an integrated multi-channel marketing strategy to market directly to potential customers. Our marketing strategy includes coordinated direct mail programs, TV campaigns, search engine marketing and digital campaigns and strategic partnerships with affiliates and has been key to our growth. We believe this approach allows us to focus on higher quality, lower cost customer acquisition while maximizing reach and enhancing brand awareness. By investing in new channels such as direct mail and TV, we have created unique capabilities to effectively identify and attract qualified customers, which support our long-term growth objectives at target CAC. |
| Ø | Seasoned management team with strong industry track record. We have a seasoned team of senior executives with an average of over 15 years of experience in technology and financial services at companies such as PayPal, Experian, Silicon Valley Bank, JPMorgan Chase and GE Capital, led by Ken Rees, a financial services industry veteran with over 20 years of experience, who is regarded as one of the leading advocates of responsible credit in the non-prime lending space. Mr. Rees was named Regional Entrepreneur of the Year by Ernst & Young in 2012 in recognition of his achievements in the online lending sector. The team oversaw the origination of $3.0 billion in credit to 1.4 million consumers for the combined current and predecessor products that were contributed to Elevate in the Spin-Off. Additionally, the team has a proven track record of managing defaults through the most recent financial crisis. From 2006 to 2011, Elevate’s principal charge-offs remained relatively flat compared to credit card charge-offs, which experienced volatility, with charge-off rates increasing by close to 300% during the same period. |
OUR GROWTH STRATEGY
To achieve our goal of being the preeminent online lender to the New Middle Class, we intend to execute the following strategies:
| Ø | Continue to grow our current products into dominant brands. The current generation of Rise, Elastic and Sunny were launched in 2013. Given strong consumer demand and organic growth potential, we believe that significant opportunities exist to expand these three products within their current markets via existing marketing channels. As non-prime consumers become increasingly familiar and comfortable with online financial services, we also plan to capture the new business generated as they migrate away from less convenient legacy brick-and-mortar lenders. |
| Ø | Widen the spectrum of borrowers served. We continue to evaluate new product and market opportunities that fit into our overall strategic objective of delivering next-generation online credit products that span the non-prime credit spectrum. For example, we are evaluating products with lower rates that would be more focused on the needs of near-prime consumers. In addition, we are continually focused on improving our analytics to effectively underwrite and serve consumers within those segments of the non-prime credit spectrum that we do not currently reach. |
| Ø | Increase operating leverage by expanding our relationship with existing customers. Customer acquisition cost is one of the most significant expenses for online lenders. We will seek to expand our strong relationships with existing customers by providing qualified customers with new loans on improved terms or offering other products and services without incurring significant additional costs. We believe we can, as a result, provide improved products and services to our customers while, at the same time, achieving better operating leverage. |
| Ø | Expand strategic partnerships. Our progressive non-prime credit solutions have attracted top-tier affiliate partners. We intend to continue growing our existing affiliate partnerships and will evaluate opportunities to enter into new partnerships with affiliates and retailers and potentially enable non-prime customers to purchase their goods and services on credit. We expect these partnerships to provide us with access to a broad range of potential new customers, with low customer acquisition costs. |
123
Table of Contents
Business
| Ø | Expansion in select markets. We will explore pursuing strategic opportunities to expand into additional international and domestic markets. However, we plan to take a disciplined approach to international expansion, utilizing customized products and in-market expertise. As reflected in our approach to entering the UK market, we believe that local teams with products developed for each unique local market will ultimately be the most successful. We currently do not expect to undertake any international expansion in the near term. |
OUR PRODUCTS
Rise, Elastic and Sunny are exclusively available through online and mobile platforms. We offer these products by leveraging the deep experience of our management team in the non-prime lending industry as well as by utilizing leading technology and proprietary risk analytics to effectively manage profitability and optimize customer convenience.
Each of these products reflects our “Good Today, Better Tomorrow” mission and offers competitive rates along with credit building and financial wellness features. These responsible lending features include rates on subsequent loans that can decrease over time, credit bureau reporting, free credit monitoring (in the US), and online financial literacy videos and tools.
Rise, Elastic and Sunny each follow distinct regulatory models, providing diversification across different regulatory frameworks. Rise operates under licenses from each state it serves and is additionally regulated by the CFPB, Elastic is a bank-originated credit product that is offered in 40 states across the US and is regulated by the FDIC, and Sunny is a UK credit product regulated by the Financial Conduct Authority, or the “FCA.”
|
|
|
| ||||
| Year launched |
2013 | 2013 | 2013 | |||
| Product type |
Installment | Installment | Line of credit | |||
| Geographies served(1) |
15 states | UK | 40 states | |||
| Loan size |
$500 to $5,000 | £100 to £2,500 | $500 to $3,500 | |||
| Loan term(2) |
4-26 months | 6-14 months | Up to 10 months | |||
| Repayment schedule |
Bi-weekly, semi-monthly, or monthly |
Bi-weekly, semi-monthly, or monthly |
Bi-weekly or semi-monthly | |||
| Prepayment penalties |
None | None | None | |||
| Pricing(3) |
36% to 365% annualized |
10.5% to 24% monthly | Initially $5 per $100 borrowed plus up to 5.0% of outstanding principal per billing period | |||
| Other fees |
None | None | None | |||
| Combined loans receivable principal(1) |
$209.5 million | $36.1 million | $75.1 million | |||
| % of Combined loans receivable principal(1) |
65.3% | 11.3% | 23.4% | |||
| Top three states as a percentage of combined loans receivable – principal(1) |
CA (36%), GA (16%), | N/A | FL (14%), CA (9%), | |||
| OH (9%) | TX (7%) | |||||
| Weighted average effective APR(1)(4) |
160% | 239% | 85% |
| (1) | As of or for the three months ended March 31, 2016. Includes loans originated through Credit Services Organization, or “CSO,” programs. |
| (2) | Elastic term is based on minimum principal payments of 10% of last draw amount per month. |
| (3) | In Texas and Ohio, Rise charges a CSO fee instead of interest. See “Management’s discussion and analysis of financial condition and results of operations—Key Financial and Operating Metrics—Revenue growth—Revenues.” Rise interest rates may differ significantly by state. See “—Regulatory Environment—APR by geography” for a breakdown of the APR for each of our products. Rise interest rates of 36% are available to qualified customers based on on-time repayment history. |
| (4) | Elastic is a fee-based product. The number shown is based on a calculation of an effective APR. |
124
Table of Contents
Business
Rise—US installment loans
Rise is an installment loan product currently available in 15 states in the US. After 24 months of on-time payments, eligible customers can receive a 50% rate reduction on their next loan, limited to a resulting rate of 36%. After an additional 12 months of on-time payments on a subsequent loan, rates on new loans drop to 36% for qualifying customers. As of March 31, 2016, over two-thirds of Rise customers in good standing had received a rate reduction mid-loan or after a refinance or on a subsequent loan. We no longer provide rate reductions mid-loan as our current policy is to award customers with rate reductions once they refinance or take out a new loan. As of March 31, 2016 more than 60% of Rise customers in good standing had refinanced or taken out a subsequent loan. As of March 31, 2016, of the outstanding loans for Rise, 39% were new customer loans and 61% were returning customer loans. The average effective APR across the Rise portfolio is approximately 160%, which we believe is more than 50% lower than the average effective rate of a typical payday loan, based on the CFPB’s findings that the average APR for a payday loan is almost 400%.
As a result of differing state laws, the structure of Rise varies. Rise is currently offered as an installment loan product. However, in Texas and Ohio, Rise is available through a CSO program that provides consumers access to installment loans offered by a third-party lender. See “Certain Conventions Governing Information in this Prospectus—Presentation of information related to our products.”
Sunny—UK installment loans
Sunny is our UK installment loan product, currently offering loans of up to £2,500 under two sub-brands, Sunny Now for loans up to £1,000 and Sunny Plus for loans between £1,000 and £2,500. Rates range from 10.5% per month for Sunny Plus to 24% per month for Sunny Now. Like Rise, Sunny customers may receive higher credit lines and interest rate reductions over time. In addition, Sunny offers a “no-fee guarantee.”
Although it is a relatively new entrant to the market, Sunny has already become the third most recognized brand among non-prime lenders, according to our recent survey of over 4,000 people in the UK. Sunny is a differentiated offering based on a wider range of loan amounts, lower rates, price promotions and more flexible repayment options than most other providers in the UK short-term lending market.
Elastic—US bank-originated lines of credit
Elastic, currently available in 40 US states, is a line of credit designed to be a financial safety net for non-prime consumers. It is originated by a third-party lender, Republic Bank. See “Management’s discussion and analysis of financial condition and results of operations—Components of our Results of Operations—Revenues.” Elastic offers a maximum credit limit of $3,500 and charges an initial advance fee of $5 for each $100 advanced against the credit line, as well as a fixed charge of approximately 5% of open balances each payment period. Elastic’s effective APR based on this is approximately 85%, more than 75% lower than the average effective rate of a typical payday loan, based on the above-mentioned findings by the CFPB. There are no origination fees, monthly fees, late fees, over-limit fees or fees for returned payments on the product. Additionally, consumers must make a 10% mandatory principal reduction each month designed to encourage the full repayment of the original loan amount in approximately ten months.
Under the terms of our agreement with Republic Bank, we provide them with marketing services related to the Elastic program and license them our website, technology platform and proprietary credit and
125
Table of Contents
Business
fraud scoring models to originate and service Elastic customers. However, as the originator of the Elastic lines of credit, Republic Bank reviews and approves all marketing materials and campaigns and determines the underwriting strategies and score cutoffs used in processing applications. In addition, Republic Bank defines all program parameters and provides full compliance oversight over all aspects of the program. Our platform supports Republic Bank’s operational and compliance activities related to the Elastic program. See “Management’s discussion and analysis of financial condition and results of operations—Overview” regarding the structure of Elastic and how we recognize revenue associated with Elastic loans.
ADVANCED ANALYTICS AND RISK MANAGEMENT
The non-prime lending challenge
Traditional underwriting requires manual review of physical documents and human credit decisions. This is inconvenient for customers and for lenders it is resource-intensive, time-consuming and can lead to inconsistent results. Technology-enabled lenders have recently used Big Data techniques to revolutionize the offering of credit. Instant credit decisions and automated processes are increasingly the norm for innovative online lenders such as Lending Club, SoFi and Prosper (for prime consumer credit), Avant (for near-prime consumer credit) and OnDeck (for small business loans).
In non-prime consumer lending, however, the analytical challenges are significantly greater. Traditional credit scores like FICO are poorly correlated with risk for non-prime consumers. Whereas prime consumers have established positive credit histories with traditional credit products and very little derogatory information, non-prime consumers are more varied and difficult to underwrite. Because of the wider variety of credit backgrounds and higher credit risk, automated analytical techniques for underwriting non-prime consumers must be much more sophisticated.
We use our deep insights into non-prime consumers and extensive experience serving them to develop differentiated analytical techniques and scores to better underwrite and price credit for the New Middle Class, as further described below under “—Segment-optimized analytics.” This approach provides for extremely high levels of automation in the underwriting process and has been proven to be effective, resulting in stable credit performance through the recent financial crisis. See “Business—Advanced Analytics and Risk Management—History of stable credit quality through the economic downturn.” Furthermore, we invest significant resources into the research and development of new data sources and new analytical techniques to continue to improve our capabilities.
Segment-optimized analytics
Based on our extensive experience and track record in the industry, we have found that FICO and other monolithic credit scores are inadequate for the non-prime market. Instead, we have developed an array of proprietary scores targeting unique customer segments and marketing channels as well as different fraud types. This segment-optimized analytical approach allows us to serve an expanding set of non-prime consumer segments and marketing channels while maintaining stable credit quality and acceptable customer acquisition costs.
We have used our extensive historical database of non-prime consumer information across multiple channels and products to identify unique segments for analysis and score development. We utilize highly predictive data sources and advanced analytical techniques to continually optimize our proprietary
126
Table of Contents
Business
targeted scores and underwriting strategies for each customer segment and marketing channel. This segment-optimized approach impacts all aspects of our underwriting process:
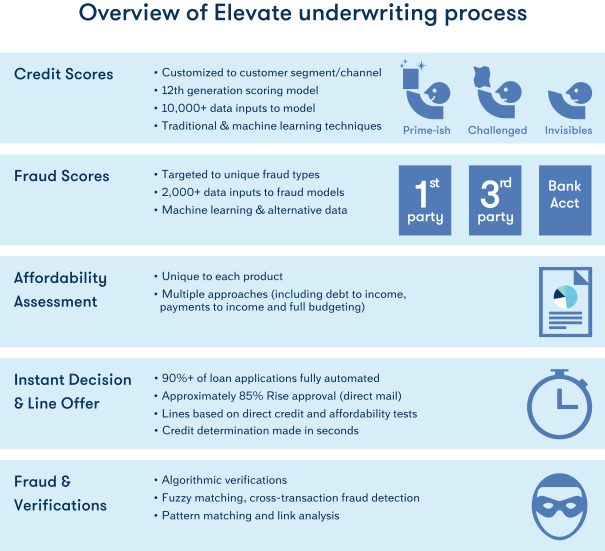
Segment specific credit scores
We use our proprietary risk analytics to build targeted credit scores for key customer segments. Based on our segmentation model, we utilize highly predictive data (including nationwide credit reporting agencies or “NCRA,” non-prime bureau data, and wide-ranging alternative data sources, as well as internally collected proprietary customer credit performance history) and analytical techniques (including regression and machine learning techniques) to achieve a high level of accuracy for our scores. For instance, for “prime-ish” consumers who have access to traditional credit sources but supplement them with non-prime credit, we use NCRA data extensively in our proprietary credit and fraud scoring models. For “challenged” consumers who have derogatory NCRA credit information and, as a result,
127
Table of Contents
Business
rely primarily on non-prime credit providers, our proprietary credit and fraud scoring models leverage data provided by non-prime credit bureau sources like Clarity and Teletrack. For “credit invisibles” with limited or no credit history, we utilize a host of alternative data sources, such as the duration for which an applicant has used the same mobile phone number or used an email address. Our definitions of our customer segments and the ways they affect our credit scoring models evolve over time and we do not track individual customers through the different segments.
We assess over 10,000 data inputs while developing our segmented credit models and are currently using the 12th generation of our proprietary credit scoring model.
Targeted fraud scores
In addition to our segment-specific credit scores, we have developed targeted fraud scores for different types of fraud. For instance, we have found that first party fraud (when the loan applicant provides correct identity information but has no intent of repaying the loan), third party fraud (when the applicant has stolen someone else’s identity information) and bank account fraud (when the borrower intends to shut down his or her account shortly after receiving the proceeds from the loan) are fundamentally different and require unique analysis and risk management tools.
Our proprietary fraud scores are built from over 2,000 available data inputs and models with extensive use of non-linear analytical tools and techniques. Examples of data sources that we have found to be predictive in our fraud scores include IP address information, how applicants use our website (including pages viewed), and email and bank account information as well as identity fraud information provided by third parties.
Affordability analysis
Although not currently required by US federal law, we proactively assess the affordability of our products for our customers. We use multiple approaches including debt to income, payment to income and full budgeting (required by UK regulations), based on third-party and self-reported information, and continue to evaluate the effectiveness of each approach. Our affordability assessment impacts both the decision of whether to provide the loan, as well as the maximum amount to offer.
Fully automated, near-instant credit decisions
Credit and fraud determinations are made in seconds and more than 90% of loan applications for all products are fully automated with no manual review required, based on our proprietary credit and fraud scoring models, and affordability assessments. Once approved, the customer is provided the loan amount and relevant terms of the credit being offered. Of the less than 10% of loan applications requiring manual review, in the US, the majority require further documentation, which can be provided via fax, email or mail, others may have failed a fraud rule in the applicable underwriting methodology, and are managed based on the rule failed, and others are reviewed to address “know your customer” requirements. In the UK, of the loan applications requiring manual review, the vast majority require further verifications or other forms of identification, while the remaining portion requires further review based on fraud alerts by an industry database of fraudulent consumer activity, known as CIFAS. We provide declined customers with the reasons for the decision.
Elevate fraud detection agents manually review a limited number of applicants based on the results of the fraud scores and any discrepancies in the application data they provide (such as identity information).
128
Table of Contents
Business
Fraud detection specialists generate and review intraday reports to identify cross-application fraud risk and use such reports to flag additional loan applications requiring review. Elevate fraud detection agents use sophisticated “fuzzy matching” link analysis of application information to identify potentially fraudulent activity and pursue additional investigation if they suspect fraud.
History of stable credit quality through the economic downturn
We bring extensive experience in managing defaults through the most recent financial crisis. Including products that preceded our current generation of credit products, we have provided $3.0 billion in credit to 1.4 million non-prime consumers since 2002. As the following chart indicates, our management team delivered stable credit quality through the recent financial crisis. The chart below also presents the levels of volatility experienced by the credit card industry over the same period.
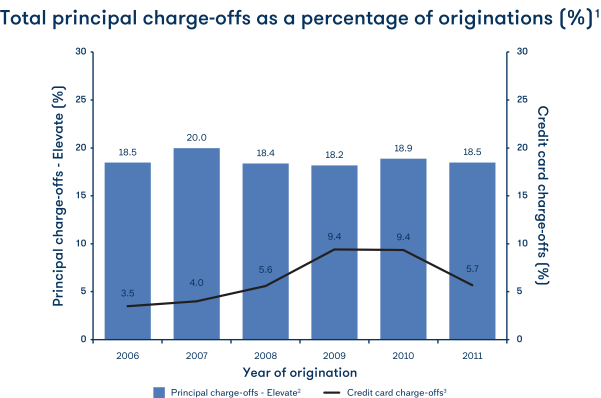
| (1) | Elevate legacy predecessor credit product from 2006-2011. Includes losses related to credit and fraud. |
| (2) | Years presented pre-date the Spin-Off. For recent cumulative credit loss rates by vintage, see “Management’s discussion and analysis of financial condition and results of operations—Key Financial and Operating Metrics—Credit quality.” |
| (3) | Credit card information based on Federal Reserve data. |
Commitment to research and development
We have built a team of over 35 data analysts in our Risk Management department including 25 staff members with advanced degrees and ten with PhDs. Our Advanced Analytics team is primarily focused on analysis of new (typically non-traditional) data sources and analytical techniques. We believe our commitment to research and development in risk analytics results in consistently improving capabilities, which give us an on-going competitive advantage in the market by allowing us to scale our business while providing savings back to our customers in the form of lower rates.
129
Table of Contents
Business
SALES AND MARKETING
Multi-channel approach to customer acquisition
Online providers of non-prime credit generally rely on third-party lead generators for customer acquisition, which limits growth and provides challenges to achieving cost and quality targets. In contrast, we rely primarily on direct marketing channels, which support improved CAC, faster growth and heightened brand awareness. The following chart shows the percentage of total customers attributable to each marketing channel for the year ended December 31, 2015, as well as the portions attributable to direct marketing channels and indirect marketing channels.
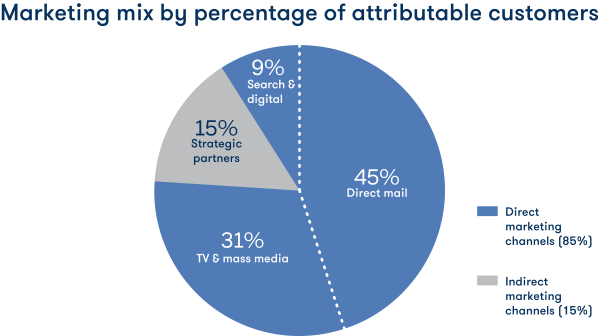
Our multi-channel approach is demonstrated by the following:
| Ø | Direct mail: Over 50 million pre-approved credit offers mailed during the year ended December 31, 2015; |
| Ø | TV and mass media: Both brand and direct response-oriented campaigns launched for Rise and Sunny; |
| Ø | Strategic partnerships: Multiple partnerships with large customer aggregators to drive traffic; |
| Ø | Paid search: Approximately 600,000 keywords actively managed; and |
| Ø | Other digital campaigns: Social media platforms and banner ads, among others. |
Analytically-driven channel optimization
Each new marketing channel we introduce requires extensive testing and optimization before it can be scaled cost-effectively and requires significant on-going analytical support. For instance, we spent three years developing, testing, and optimizing our response and credit models for pre-approved direct mail campaigns to achieve an acceptable CAC for this channel. As a result, direct mail is now our largest and most profitable marketing capability, and we continue to identify new analytical approaches that help expand the addressable market through the direct mail channel.
130
Table of Contents
Business
Similarly, we have been piloting and refining TV campaigns for the past two years in order to achieve target CAC levels. Rigorous testing of different creative messages, spot durations, “day-parting” and “pulsing” marketing strategies, and network targeting strategies have achieved significant improvements in performance. Based on these improvements, we are now aggressively expanding TV advertising. We believe TV and other mass media channels are essential to achieve market leadership for our products.
We are currently conducting large-scale tests of new digital and social channels that are showing strong initial results. Pilots with Facebook and other social media providers, including campaigns focusing on re-targeting strategies, have proven to generate meaningful lift in customer conversions and are expected to be integrated and scaled following the initial tests and refinements.
We expect to continue to expand growth in all of the above channels based on improved customer targeting analytics and increasingly sophisticated response models that allow us to enhance our marketing reach while maintaining our target CAC. Our dedicated channel management teams continually monitor and manage campaign effectiveness. We believe our investment in developing multiple customer acquisition channels provides a significant competitive advantage over other online non-prime lenders who rely primarily on lead generators.
Integrated channel management
In addition to optimizing the performance of each channel, we are increasingly using integrated channel management strategies to improve marketing impact and enhance brand-building. We have found that coordinating the timing of individual channel campaigns and leveraging creative across channels can accelerate growth at lower costs.
TV has become a key accelerator for integrated channel management. Because of the ability of TV advertising to help build trusted brands and expand customer awareness, we have invested extensively in TV campaigns in both the US (for Rise) and the UK (for Sunny). For the Rise campaign, we licensed the song Eye of the Tiger from Survivor (commonly recognized as the soundtrack for Rocky III). In the UK, we licensed the 1960’s song Sunny by Bobby Hebb. By using elements from the TV creative across other channels, we have increased the response from these other channels. In addition, we have learned to “pulse” our TV placements to coincide with large direct mail campaigns, which significantly improves customer acquisition results across both channels.
Strategic partner development
Rather than utilizing lead generators who are often accused of deceptive practices, we have focused on developing relationships through large strategic partnerships. A customer is referred to us through a strategic partner by clicking on a banner ad that takes them to the advertised product’s website. Large strategic partnerships with companies allow us to better control customer application quality and CAC. We have contractual relationships with such partners whereby we pay a fee per loan funded per application approved or per banner clicked through. Because the customer completes the loan application on our website, rather than on a lead generator’s site, we control the messaging received by the customer about our products. Credit Karma and money.co.uk are our two largest strategic partners in terms of fees paid. Fees paid to strategic partners do not comprise a material portion of our total expenses.
We expect our relationships with strategic partners to expand over time, and we will evaluate opportunities to enter into new partnerships with affiliates and retailers to potentially enable non-prime customers to purchase goods and services on credit. We also have the ability to make targeted offers with discounted rates to strategic partners who we believe have higher quality applicants.
131
Table of Contents
Business
Customer relationship optimization
Our sales and marketing efforts are not only focused on acquiring new customers. We also market to current and former customers for additional or improved offers of credit.
Based on rigorous creditworthiness and affordability analysis, we typically offer increased credit lines to former customers—often at lower rates. Also, subject to our usage caps, we may offer current customers the ability to refinance loans to receive additional funds (in the US). We use both email and text messaging campaigns to reach customers with additional credit offers.
We have witnessed strong repeat customer use of our products. Historically, more than 60% of customers who repay their loan have taken out an additional loan, typically at a lower rate. Because there is no additional CAC for originating those additional loans, these transactions are highly profitable and can support offering a lower APR for consumers. Similarly, over 50% of eligible US customers in good standing have historically refinanced their loan or made an additional draw on their credit line at some time.
TECHNOLOGY PLATFORM AND INFORMATION SECURITY
Underlying our innovative product features and advanced analytics is a flexible technology platform that has enabled rapid innovation and growth. In addition to a proven ability to scale, our technology platform supports compliant processing and business controls. We have optimized the platform for mobile device access and have created an industry-leading decision engine that enables our sophisticated segment-optimized analytics approach to underwriting. Also, because we collect and store extensive amounts of consumer information, we have invested in best practice levels of information security.
Flexible and scalable IQ Technology Platform
We call our end-to-end loan origination, decisioning, loan management and servicing system the IQ Technology Platform. We believe it integrates the best available third party loan modules under our proprietary architecture. This has allowed us to rapidly launch new products, modify product functionality and ensure regulatory compliance. In fact, all three of our current generation of credit products were released in 2013, highlighting the flexibility and scalability of our technology.
Our IQ Technology Platform includes proprietary architecture and messaging that facilitates high-availability, scalability and flexibility for changing product features. It supports both open-end (lines of credit) products as well as closed-end (installment loans) and is easily configurable for new pricing and term structures, whether in response to regulatory changes or competitive opportunities. Currently, the IQ Technology Platform supports our US products, Rise and Elastic. We plan to migrate Sunny from its
132
Table of Contents
Business
legacy technology platform to the IQ Technology Platform over the next two years. The core functionality of the IQ Technology Platform is illustrated below.
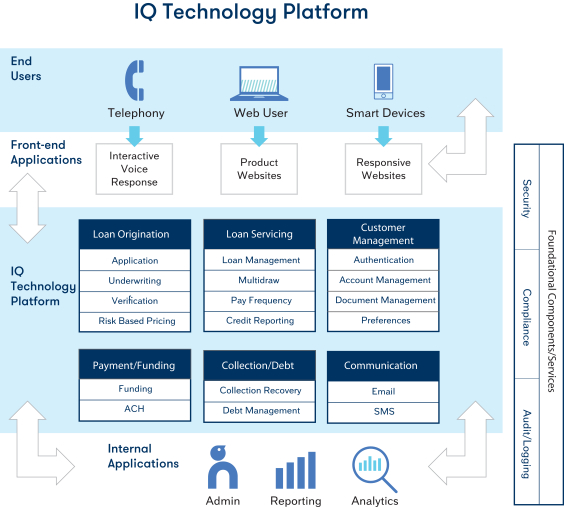
Mobile-first approach to user interface development
Currently, over half of our loan applications come from mobile rather than desktop devices. Our product front-ends (both web and mobile interfaces) are designed with a focus on user-friendly design and cross-platform mobility. While the web-based platform for our products is mobile-optimized, we do not currently have any mobile applications. We expect to release our first mobile app in 2016 to increase access for existing customers.
Sophisticated decision engine
Our segment-optimized analytics approach requires us to manage numerous credit and fraud scores and strategies for each of our products, customer segments and marketing channels. In addition, because of our commitment to innovation and research and development, we are regularly conducting “champion-challenger” testing of new scores, data providers and analytical techniques. This requires an extremely
133
Table of Contents
Business
flexible yet compliant decision engine. Our decision engine is a key component of the IQ Technology Platform and allows our Risk Management team to rapidly implement tests that control and measure new “challenger” performance against existing “champions.” In particular, the decision engine can rapidly integrate with new data providers and test a randomly selected percentage of application traffic with new scores and track their performance against existing scores.
All aspects of our underwriting process are controlled through components of the IQ Technology Platform, from the credit and fraud scores to the various product affordability assessments, to the instant decisioning and credit assignment process and even including the fraud and verifications activities performed by fraud agents. In this manner we have enhanced automation and have instituted tight controls over the entire decisioning process.
Best practice approach to information security and system reliability
Because we store extensive amounts of customer personally identifiable information, or “PII,” we take our obligations to protect that information and avoid data breaches very seriously. PII in the IQ Technology Platform is encrypted and we conduct regular audits of our security protocols via third party intrusion detection and vulnerability scans and penetration testing. These activities are supplemented with real-time monitoring and alerting for potential intrusions.
We have fully redundant data centers in place. Full disaster recovery and business continuity plans and tests have been completed, which help to ensure high levels of system availability.
COMPETITIVE OVERVIEW
The competition in our market is composed of both legacy brick-and-mortar and online credit providers. We compete with providers that offer products in the following categories:
| Ø | Non-prime installment loans |
| Ø | Non-prime credit cards |
| Ø | Pawn loans |
| Ø | Payday loans |
| Ø | Title loans |
| Ø | Rent to own |
In addition, bank overdrafts often function as an expensive form of emergency credit. According to a 2013 study by the CFPB, Americans pay approximately $34 billion in bank overdraft and similar fees annually. Additionally, according to a 2014 study by the CFPB, bank overdraft fees can carry an effective APR of 17,000%.
Most legacy non-prime lenders still operate primarily out of legacy brick-and-mortar locations and require extensive documentation and face-to-face interactions. With online and mobile-only products, Elevate eliminates the potential need for our customers to drive across town and stand in line to apply for credit. In fact, with our products, the credit determination is made in seconds and over 90% of loan applications are fully automated with no manual review required.
There are few providers attempting to deliver lower-cost, online non-prime credit products similar to ours. Although there have been a number of technology-enabled financial services companies that target
134
Table of Contents
Business
prime and near-prime customers, including LendingClub, Prosper and Avant, there are only a limited number of comparable online competitors in the non-prime lending space, such as LendUp and NetCredit in the US and Pounds-to-Pocket in the UK. We expect more entrants in this space as this market continues to develop. We also believe that it would require significant time and expense for other companies to build a technological platform similar to ours, which is geared towards serving non-prime consumers. While other lenders may use proprietary or off-the-shelf lending platforms to support their online lending operations, these typically are focused on specific product types, and this makes such platforms inflexible for the kind of product innovation that we have pursued. We are not aware of any off-the-shelf products that support the variety of non-prime products such as those supported by our IQ Technology Platform. Although technology generally can be reverse-engineered over time, we believe our IQ Technology Platform provides a competitive advantage due to our lead time based on our long history of serving non-prime consumers with multiple credit products. Although TFI holds an undivided co-ownership interest in the IQ Technology Platform as it existed as of January 1, 2015, without use restrictions on competition or otherwise, we are constantly looking for ways to improve our IQ Technology Platform. See “Certain relationships and related party transactions—Spin-Off Agreement with TFI—Separation and distribution agreement—Treatment of assets and liabilities” for more information.
The online non-prime credit market in the US is extremely fragmented and most lenders source customers from lead generation companies, resulting in low brand recognition. Unlike these competitors, we have made a significant investment in establishing a direct-to-consumer, integrated multi-channel marketing capability, which we believe creates a unique opportunity for Rise and Elastic to become dominant brands in this space.
In the UK, online non-prime credit products are established, but have faced increased regulatory scrutiny. An industry-wide re-licensing process with the FCA is being undertaken in the UK, which is expected to reduce the number of credit providers in the market. The two largest lenders in the market, Wonga and QuickQuid, are reported to have experienced significant reductions in originations and loans outstanding due to the regulatory changes. We believe that Sunny has an opportunity to take significant market share over time based on our improved customer value proposition and analytics.
REGULATORY ENVIRONMENT
The online consumer loan products we currently offer are subject to a range of laws, regulations and standards that address consumer lending, credit services, consumer protections and reporting, information sharing, marketing, debt collection, data protection, state licensing and interest rate and term limitations, among other things.
All products are subject to supervision, regulation and enforcement by numerous regulatory bodies—from state regulators and attorneys general, federal regulators, like the CFPB, the FTC and in some cases the FDIC, and the FCA in the UK. Consistent with regulatory expectations, we have an extensive compliance program and internal controls. As of the date of this prospectus, we have not been examined by the CFPB or the FCA, but we have had numerous state examinations.
For a discussion of the risks related to our regulatory environment, see “Risk factors—Other Risks Related to Compliance and Regulation.”
135
Table of Contents
Business
US regulation
State and local regulation and licensing
Rise is regulated under a variety of enabling state statutes. The scope of state regulation, including permissible interest rates, fees and terms, varies from state to state. Some states require specific disclosures, mandate or prohibit certain terms and limit the maximum interest rate and fees that may be charged. Where licensing or registration is required, we and our lending partners are subject to extensive state rules, licensing and examination. Failure to comply with these requirements may result in, among other things, refunds of excess charges, monetary penalties, revocation of required licenses, voiding of loans and other administrative enforcement actions. Rise is available in the following 15 states: Alabama, California, Delaware, Georgia, Idaho, Illinois, Missouri, New Mexico, North Dakota, Ohio, South Carolina, South Dakota, Texas, Utah and Wisconsin. Rise may also be subject to additional municipal regulations and ordinances related to, for example, certain short-term loan products and debt collection. The scope of municipal regulations and ordinances vary.
US federal regulation
Truth in Lending Act. Both Rise, an installment loan product, and Elastic, a bank-originated line of credit product, are subject to the federal Truth in Lending Act, or “TILA,” and its underlying regulations known as Regulation Z. TILA and Regulation Z require creditors to deliver disclosures to borrowers during the life cycle of a loan—at application, at account opening or at consummation and for open-end credit products, such as Elastic, periodically.
The disclosure rules differ depending upon whether the product is an open-end credit, such as Elastic, or closed-end credit, such as Rise. Under the appropriate disclosure scheme, the originating creditor is required to provide borrowers with key information about the loan, including, for open-end credit, the annual percentage rate, applicable finance charges, transaction and penalty fees, and, for closed-end loans, the annual percentage rate, the finance charge, the amount financed, the total of payments, the number and amount of payments and payment due dates.
Regulation Z and TILA also provide consumers with substantive consumer protections. Specifically, pursuant to Regulation Z and TILA, loan products are subject to special rules for calculating annual percentage rates, advertising, and for open-end credit, rules for resolving billing errors.
Fair Credit Reporting Act. We are also subject to the Fair Credit Reporting Act, or the “FCRA,” and similar state laws, as both a user of consumer reports and a furnisher of consumer credit information to credit reporting agencies. The FCRA and similar state laws regulate the use of consumer reports and reporting of information to credit reporting agencies. Specifically, the FCRA establishes requirements that apply to the use of “consumer reports” and similar data, including certain notifications to consumers, including when an adverse action, such as a loan declination, is based on information contained in a consumer report.
We only obtain and use consumer reports subject to the permissible purpose requirements under the FCRA. The FCRA permits us to share our experience information, information obtained from credit reporting agencies, and other customer information with affiliates. We comply with notice and opt out requirements for prescreen solicitations and for certain information sharing under the FCRA. We also have implemented an identity theft prevention program to fulfill the requirements of the Red Flags Regulations and Guidelines issued under the Fair and Accurate Credit Transactions Act, or the “FACT Act.”
136
Table of Contents
Business
In meeting our duties to furnish consumer credit information to consumer reporting agencies, we:
| Ø | furnish consumer credit information pursuant to the METRO 2 guidelines; |
| Ø | establish and maintain procedures regarding the accuracy and integrity of the consumer credit information we report; and |
| Ø | establish and maintain procedures to conduct timely investigations of customer disputes (received directly from customers or through credit reporting agencies) regarding the consumer credit information we report to the consumer reporting agencies. |
Equal Credit Opportunity Act. The federal Equal Credit Opportunity Act, or the “ECOA,” generally prohibit creditors from discriminating against applicants on the basis of race, color, sex, age, religion, national origin, marital status, the fact that all or part of the applicant’s income derives from any public assistance program or the fact that the applicant has in good faith exercised any right under the federal Consumer Credit Protection Act. Regulation B, which implements ECOA, restricts creditors from requesting certain types of information from loan applicants and from using advertising or making statements that would discourage on a prohibited basis a reasonable person from making or pursuing an application.
In the underwriting of loans offered through our online platform, and with respect to all aspects of the credit transaction, we, our lending partners and marketing affiliates must comply with applicable provisions prohibiting discouragement and discrimination.
ECOA also requires creditors to provide consumers with timely notices of adverse action taken on credit applications. A prospective borrower applying for a loan but denied credit is provided with an adverse action notice.
FTC Act and Dodd-Frank Wall Street Reform and Consumer Protection Act of 2010. Both the FTC and CFPB regulate the advertising and marketing of financial products and services. The FTC is charged with preventing unfair or deceptive acts or practices and false or misleading advertisements, and the CFPB is charged with preventing unfair, deceptive, or abusive acts and practices, all of which can erode consumer confidence. All marketing materials related to our products must also comply with the advertising requirements set forth in TILA.
Military Lending Act. The Military Lending Act, or “MLA,” restricts, among other things, the interest rate and other terms that can be offered to active military personnel and their dependents. The MLA caps the interest rate that may be offered to a covered borrower to a 36% military annual percentage rate, or “MAPR,” which includes certain fees such as application fees, participation fees and fees for add-on products. Prior to a recent amendment of the rules under the MLA, the MLA applied only to certain short term loans. The rules amendment extends the 36% rate cap to most types of consumer credit. The MLA also requires certain disclosures and prohibits certain terms, such as mandatory arbitration if a dispute arises concerning the consumer credit product. The amended MLA rules became effective on October 1, 2015 and will apply to transactions consummated or established after October 3, 2016 for all credit products subject to the rules except credit cards, which have a later operative date.
The MLA, as amended, will cover the Elastic and Rise products and will restrict our ability to offer our products to military personnel and their dependents when the amendments become operative in October 2016. Failure to comply with the MLA may limit our ability to collect principal, interest, and fees from borrowers and may result in civil and criminal liability that could harm our business.
137
Table of Contents
Business
The Servicemembers Civil Relief Act. The federal Servicemembers Civil Relief Act, or “SCRA,” and similar state laws apply to certain loans made to certain active duty members of the US military, reservists and members of the National Guard and certain dependents. The SCRA limits the interest rate a creditor may charge or certain collection actions a creditor may take on certain loans while a servicemember is on military duty.
The Electronic Signatures in Global and National Commerce Act. The federal Electronic Signatures in Global and National Commerce Act, or “E-SIGN,” and similar state laws, particularly the Uniform Electronic Transactions Act “UETA,” authorize the creation of legally binding and enforceable agreements utilizing electronic records and signatures. E-SIGN and UETA require businesses that use electronic records or signatures in consumer transactions and provide required disclosures to consumers electronically, to obtain the consumer’s consent to receive information electronically. When a borrower is provided electronic disclosures, we obtain his or her consent to transact business electronically, to receive electronic disclosures and maintain electronic records in compliance with E-SIGN and UETA requirements. We also follow similar state e-signature rules mandating that certain disclosures be made and certain steps be followed in order to obtain and authenticate e-signatures.
Electronic Fund Transfer Act. The Electronic Fund Transfer Act of 1978, or “EFTA,” protects consumers engaging in electronic fund transfers. The EFTA is implemented through Regulation E, which includes an official staff commentary. The Dodd-Frank Act transferred rule-making authority under the EFTA from the Federal Reserve Board to the CFPB and, with respect to entities under its jurisdiction, granted authority to the CFPB to supervise and enforce compliance with EFTA and its implementing regulations. Borrowers of our products often choose to repay by electronic fund transfers. Restrictions on how consumers choose to pay or how lenders comply with electronic fund transfers could impact our current business processes.
To the extent a borrower repays his or her payment obligation through electronic fund transfers, the federal Electronic Fund Transfer Act or “EFTA” and its implementing regulations apply. EFTA contains restrictions, requires disclosures and provides consumers certain rights relating to electronic fund transfers.
Fair Debt Collection Practices Act. The federal Fair Debt Collection Practices Act, or the “FDCPA,” provides guidelines and limitations on the conduct of third-party debt collectors and debt buyers when collecting consumer debt. While the FDCPA generally does not apply to first-party creditors collecting their own debts or to servicers when collecting debts that were current when servicing began, we use the FDCPA as a guideline for all collections. We require all vendors and third parties that provide collection services on our behalf to comply with the FDCPA to the extent applicable. We also comply with state and local laws that apply to creditors and provide guidance and limitations similar to the FDCPA.
Unfair, Deceptive, Abusive Acts and Practices. The Dodd-Frank Act prohibits “unfair, deceptive or abusive” acts or practices, or “UDAAPs.” The CFPB has found UDAAPs in most phases in the life cycle of a loan, including the marketing, collecting and reporting of loans. UDAAPs could involve omissions or misrepresentations of important information to consumers or practices that take advantages of vulnerable consumers, such as elderly or low-income consumers. All products and services provided by Elevate and its vendors are subject to the prohibition on UDAAPs.
Gramm-Leach-Bliley Act. We are also subject to various federal and state laws and regulations relating to privacy and security of consumers’ nonpublic personal information. Under these laws, including the federal Gramm-Leach-Bliley Act, or “GLBA,” and Regulation P promulgated thereunder, we must disclose our privacy policy and practices, including those policies relating to the sharing of nonpublic
138
Table of Contents
Business
personal information with third parties. We may also be required to provide an opt-out to certain sharing. The GLBA and other laws also require us to safeguard personal information.
Anti-money laundering and economic sanctions. We and the originating lenders that we work with are also subject to certain provisions of the USA PATRIOT Act and the Bank Secrecy Act under which we must maintain an anti-money laundering compliance program covering certain of our business activities. In addition, the Office of Foreign Assets Control prohibits us from engaging in financial transactions with specially designated nationals.
Anticorruption. We are also subject to the US Foreign Corrupt Practices Act, or the “FCPA,” which generally prohibits companies and their agents or intermediaries from making improper payments to foreign officials for the purpose of obtaining or keeping business and/or other benefits.
Telephone Consumer Protection Act. We are also subject to the TCPA and the regulations of the FCC, which regulations include limitations on telemarketing calls, auto-dialed calls, prerecorded calls, text messages and unsolicited faxes.
Consumer Financial Protection Bureau
The CFPB, which regulates consumer financial products and services, including consumer loans that we offer, was created in July 2010 with the passage of Title X of the Dodd-Frank Act. The CFPB has regulatory, supervisory and enforcement powers over certain providers of consumer financial products and services.
On May 5, 2016, the CFPB released a proposed rule to prohibit certain providers of consumer financial products and services from including pre-dispute arbitration clauses in new contracts that bar a consumer from filing or participating in a class action with respect to the covered consumer financial product or service, and that would require any covered pre-dispute arbitration agreement to include specific disclosure to that effect. The proposal also requires a covered provider that uses pre-dispute arbitration agreements to submit certain arbitral records to the CFPB. Unless significant changes are made to the proposal, we believe that the CFPB’s final rule is likely to increase class action exposure and litigation expense. Comments on the proposed rule are due August 22, 2016, and the CFPB has proposed that a final rule would become effective 180 days after publication in the Federal Register.
On June 2, 2016, the CFPB also released proposed rules addressing practices of certain providers of payday, vehicle title and certain high-cost installment loans. Under the proposed rules, we could be required to modify the manner in which we make a reasonable determination of a customer’s ability to repay and provide customers notice at least three days before a payment withdrawal attempt, as well as obtain new ACH authorization from a customer following two failed ACH attempts, among other requirements. Comments on the proposed rules are due September 14, 2016, and the CFPB has proposed that final rules would become effective 15 months after publication in the Federal Register.
The CFPB is also expected to initiate its rulemaking process pertaining to debt collections in 2016, which could impact collection practices of both lenders and those that purchase charged-off debt from lenders. Lastly, the CFPB has indicated it is continuing with its rulemaking to define larger participants in the installment lending markets. This will enable the CFPB to examine and supervise that market.
We do not currently know the full extent of the final rules the CFPB will ultimately adopt, and thus, their impact on our activities is uncertain, however the final rules will likely impose limitations on certain
139
Table of Contents
Business
loans and services we offer. As noted above, Republic Bank is supervised and examined by the FDIC. Furthermore, it is not clear whether or not the FDIC, the CFPB, or both will have supervisory authority over Elevate, as a service provider to Republic Bank.
Foreign regulation
United Kingdom
In the UK, we are subject to regulation by the FCA and must comply with the FCA’s rules and guidance set forth in the FCA Handbook, the Financial Services and Markets Act 2000, or the “FSMA,” the Consumer Credit Act 1974, as amended, or the “CCA,” and Secondary legislation passed under the FSMA and the CCA, among other rules and regulations. We must also follow the responsible lending and arrears, default and recovery rules, which provide greater clarity for lenders as to business practices that the FCA believes constitute inappropriate lending.
UK regulation and authorization. Our Sunny product is covered by the extensive regulatory regime promulgated under the FSMA and CCA. The regulatory regime requires firms undertaking consumer credit regulatory activities to be authorized or exempt. Regulated businesses must hold FCA authorizations, pay annual fees, follow prescriptive rules on advertising, include minimum and prescribed disclosures within pre-contract, loan and post-contract arrears documentation, regularly report customer complaints information, and maintain robust systems and controls in relation to the conduct of regulated business, including when engaging third-party suppliers.
The UK regime includes an obligation to self-report breaches of the applicable laws and regulations, and the FCA has the power to order regulated firms to pay fines, undertake changes to business models, implement customer remediation programs compensating customers for historic breaches and, among various other enforcement powers, limit or revoke regulatory authorizations. Failure to comply with the technical requirements of CCA and underlying regulations can, among other penalties, render loan agreements unenforceable without a court order. The courts also have wide powers to determine that a relationship between a lender and customers is unfair and impose equitable remedies in such circumstances.
Equality Act. The Equality Act 2010 prohibits unlawful direct and indirect discrimination and harassment of applicants and customers when conducting lending services on the basis of nine protected characteristics: age; disability; gender reassignment; marriage and civil partnership; pregnancy and maternity; race; religion or belief; sex; and sexual orientation. These requirements apply to the advertising, underwriting and enforcing of Sunny loans and the handling of complaints regarding Sunny loans.
Marketing laws. Marketing in all mediums, including television, radio and online, is subject to the detailed advertising rules for the consumer credit industry contained in part 3 of the FCA’s CONC rulebook as well as the Financial Services and Markets Act 2000 (Financial Promotion) Order 2005. In particular, all advertisements must be clear, fair and not misleading and include representative cost information and illustrations where particular advertising jargon is included in the material. Certain marketing expressions are also prohibited.
The Advertising Standards Authority, or the “ASA,” has also published specific codes for broadcast and non-broadcast advertising to which we must also adhere. Both the FCA and the ASA tightly monitor
140
Table of Contents
Business
consumer credit advertising and regularly conduct industry audits of compliance standards. The ASA maintains a complaints framework and investigates legal, regulatory and code breaches raised by both consumers and competitors and publishes public adjudications, which can require firms to amend or completely remove advertisements. Misleading marketing can also constitute a criminal offense under the Consumer Protection from Unfair Trading Regulations 2008 and result in fines from the FCA.
Debt collection practices. The CCA sets out a formulaic procedure for customers in arrears, applicable when levying default fees and when taking any other steps in relation to default. Firms are required to issue statutory notices in a prescribed format within specific timeframes and include self-help information sheets. Failure to comply has severe consequences, including restricting lender rights to enforce relevant loan agreements, charge interest or any levy applicable default fees. The FCA also expects firms that have failed to comply with these requirements to proactively undertake extensive remediation activities, issuing refunds to customers where appropriate, including in cases where customers have not raised a complaint directly. A number of leading banking groups in the UK are currently in the process of conducting such remediation activities.
Part 7 of the FCA’s CONC rulebook also sets out detailed rules and guidance for dealing with customers in arrears or default when pursuing recovery. The rules prohibit threatening, aggressive and harassing debt collection communications and practices, impose obligations to treat customers in arrears with forbearance and govern conduct when interacting with debt management firms engaged to resolve over-indebtedness. There are also specific rules on the use of continuous payment authorities as a repayment method that limit the number of repayment attempts that can be initiated by lenders.
Privacy laws. In the UK, we are subject to the requirements of the DPA and are required to be fully registered as a data-controller under the DPA and comply with industry guidance published by the regulator, the Information Commissioner. The DPA includes data protection principles regarding use, security and notification of the purposes of processing and sharing, which must be followed, as well as rights to access and correct information.
There are also strict rules on the instigation of electronic communications such as email, text message and telephone calls under the Privacy and Electronic Communications (EC Directive) Regulations 2003, which impose consent rules regarding unsolicited direct marketing, as well as the monitoring of devices.
We are subject to laws limiting the transfer of personal data from the European Economic Area to non-European Economic Area countries or territories.
On December 15, 2015, European Commission finalized the new GDPR, which will replace the existing Data Protection Directive (95/46/EC) and is expected to be implemented in the UK in the first quarter of 2018. The GDPR is more prescriptive than the existing regime and includes new obligations on businesses, for example, to appoint a data protection officer, self-report breaches, obtain express consent for data processing and provide more rights to individuals whose data is processed, including the “right to be forgotten,” by having such individuals’ records erased. Penalties for non-compliance under the GDPR are up to 4% of global turnover for the preceding year.
Anti-money laundering. We are subject to the Proceeds of Crime Act 2002 and the Money Laundering Regulations 2007, which require the implementation of strict procedures for our business activities. The UK regime includes self-reporting suspicious activities, the appointment of a designated anti-money laundering officer with overall responsibility for the compliance of the business and employees. The legislation also includes several criminal offenses and can result in personal criminal liability.
141
Table of Contents
Business
Anti-bribery and corruption. UK firms are subject to the Bribery Act 2010, which introduces a number of individual offenses relating to giving and receiving bribes and dealings with foreign public officials. Commercial organizations can be prosecuted for failure to implement adequate procedures to record, report and prevent bribery.
APR by geography
The table below presents the maximum APR allowed by state for states in which Rise is offered. Sunny is subject to a 24% monthly APR limit, which is nationwide in the UK. Elastic is a fee-based product to which such APR limits are not applicable.
| State | Maximum APR allowed by state |
Maximum APR Rise charges |
||||||
| Alabama |
* | 295 | % | |||||
| California(1) |
* | 225 | % | |||||
| Delaware |
* | 365 | % | |||||
| Georgia(2) |
60 | % | 59.8 | % | ||||
| Idaho |
* | 365 | % | |||||
| Illinois |
99 | % | 98.7 | % | ||||
| Missouri |
* | 365 | % | |||||
| North Dakota |
* | 325 | % | |||||
| New Mexico |
* | 365 | % | |||||
| Ohio |
* | 365 | % | |||||
| South Carolina |
* | 350 | % | |||||
| South Dakota |
* | 365 | % | |||||
| Texas |
* | 365 | % | |||||
| Utah |
* | 365 | % | |||||
| Wisconsin |
* | 365 | % | |||||
| * | As agreed upon between the parties. In California, as agreed upon between the parties for loans over $2,500. |
| (1) | Minimum loan amount offered in California is $2,600. |
| (2) | APR must be less than 60% under applicable state law. |
EMPLOYEES
As an innovator seeking to respond quickly to new market opportunities and challenges, we have built a corporate culture that rewards ambition, responsible lending practices, execution and intense cross-company collaboration and communication. Our key company values are:
| Ø | Think Big. We have always been an innovator in our industry. Ideas, both big and small, are our competitive advantage. We share a responsibility to think out of the box, challenge the status quo and embrace change. |
| Ø | Do the Right Thing. Doing the right thing is not optional. We hold each other to the highest standards and earn our reputation every day. |
| Ø | Raise the Bar. Excellence is not a skill. It is a habit—the gradual result of always striving to do better. As a company and as individuals we push ourselves to build on success, learn from failure and get better every day. |
| Ø | Win Together. Our goals are too big to achieve as individuals. Collaboration is not a by-product of our work, it is the primary focus. It is also more fun. |
142
Table of Contents
Business
Our values are reinforced in all aspects of our employees’ relationship with our company, including during the recruiting process and the bi-annual reviews, and play a large role in the promotion process. In addition, each quarter employees who best exemplify these values are nominated for “Smart Awards” and are selected and recognized at all-company Town Hall meetings.
As of March 31, 2016, we had 490 full-time employees, including 127 in technology, 73 in risk management, 57 in loan operations and customer support, 21 in marketing and business development, 126 related to our UK operations and 86 in general and administrative functions. We also outsource certain functions, such as collections and customer service to increase efficiencies and scalability. We use an internal quality team to review and improve third-party performance.
OUR HISTORY
We were created through the Spin-Off of the direct lending and branded product businesses of TFI. TFI was founded in 2001. Prior to the Spin-Off transaction, TFI had two discrete lines of business; a) a direct lender and branded product provider to non-prime consumers; and b) a licensor of its technology platform to third-party lenders. In order to allow each of these separate lines of business to focus on its relative strategic and operational strengths and future business plans, the board of directors of TFI decided to spin off its direct lending and branded products business into a separate company.
We were incorporated in Delaware on January 31, 2014 as a subsidiary of TFI, and we had no material assets or activities as a separate corporate entity until the Spin-Off occurred. On May 1, 2014, TFI contributed the assets and liabilities associated with its direct lending and branded products business to us, and distributed its interest in our company to its stockholders, but retained the assets and liabilities associated with its licensed technology platform line of business. TFI’s retained business line entails providing marketing services to third-party lenders and licensing TFI’s technology platform to these lenders for marketing and licensing fees. TFI previously conducted its direct lending business through various legal entity subsidiaries, which were contributed to us in the Spin-Off transaction.
There are no ongoing interactions or contractual relationships between us and TFI other than a tax sharing agreement and sublease agreements from TFI to us. See “Certain relationships and related party transactions” for additional information regarding these agreements.
FACILITIES
Our corporate headquarters are located in Fort Worth, Texas, where we lease approximately 51,029 square feet of office space pursuant to a lease that expires August 31, 2016. We also lease approximately 25,348 square feet of office space in Addison, Texas pursuant to a lease that expires September 30, 2018; approximately 3,300 square feet of office space in San Diego, California pursuant to a lease that expires April 30, 2019; approximately 3,525 square feet of office space in London, UK pursuant to a lease that expires November 30, 2016; and approximately 6,447 square feet of office space in Bury St. Edmunds, UK pursuant to a lease that expires March 24, 2019.
OUR INTELLECTUAL PROPERTY
Protecting our rights to our intellectual property is critical, as it enhances our ability to offer distinctive services and products to our customers, which differentiates us from our competitors. We rely on a combination of trademark laws and trade secret protections in the US and other jurisdictions, as well as confidentiality procedures and contractual provisions, to protect the intellectual property rights related to
143
Table of Contents
Business
our proprietary analytics, predictive underwriting models and software systems. We have either registered trademarks and/or pending applications in the US for the marks Elevate, Rise, Sunny and Elastic. We also own European Community trademark registrations for the Sunny and Elastic marks. Our trademarks are materially important to us and we anticipate maintaining them and renewing them.
LEGAL PROCEEDINGS
In addition to the matters discussed below, in the normal course of business, from time to time, we have been and may be named as a defendant in various legal proceedings arising in connection with our business activities. We may also be involved, from time to time, in reviews, investigations and proceedings (both formal and informal) by governmental agencies regarding our business (collectively, “regulatory matters”). We contest liability and/or the amount of damages as appropriate in each such pending matter. We do not anticipate that the ultimate liability, if any, arising out of any such pending matter will have a material effect on our financial condition, results of operations or cash flows.
Civil Investigative Demand
In June 2012, prior to the Spin-Off, TFI received a Civil Investigative Demand from the CFPB. The purpose of the Civil Investigative Demand was to determine whether small-dollar online lenders or other unnamed persons engaged in unlawful acts or practices relating to the advertising, marketing, provision, or collection of small-dollar loan products, in violation of Section 1036 of the Dodd-Frank Wall Street Reform and Consumer Protection Act, 12 USC. § 5536, the TILA, 15 USC. § 1601, the Electronic Funds Transfer Act, 15 USC. § 1693, the Gramm-Leach-Bliley Act, 15 USC. §§ 6802-6809, or any other federal consumer financial law and to determine whether CFPB action to obtain legal or equitable relief would be in the public interest. While TFI’s business is distinct from our business, we cannot predict the final outcome of this Civil Investigative Demand or to what extent any obligations arising out of such final outcome will be applicable to our company or business, if at all. We understand that TFI is cooperating with the CFPB and is in the process of providing all documents requested by the CFPB. As of March 31, 2016, there are no probable or estimable losses related to this matter.
144
Table of Contents
EXECUTIVE OFFICERS, KEY EMPLOYEES AND DIRECTORS
The following table sets forth the names, ages and positions of our executive officers, key employees and directors as of May 31, 2016.
| Name | Age | Position(s) | ||||
| Executive officers |
||||||
| Kenneth E. Rees |
53 | Chief Executive Officer and Chairman | ||||
| Jason Harvison |
40 | Chief Operating Officer and Director | ||||
| Christopher Lutes |
48 | Chief Financial Officer | ||||
| Walt Ramsey |
51 | Chief Credit Officer | ||||
| Key employees |
||||||
| Kathy Boden Holland |
49 | Chief Risk Officer, Chief Compliance Officer and EVP Corporate Development | ||||
| Nelda Bruce |
41 | Chief Accounting Officer | ||||
| Sharon Clarey |
55 | SVP Human Resources | ||||
| Sarah Fagin Cutrona |
55 | Chief Counsel | ||||
| Scott Greever |
47 | Managing Director, UK | ||||
| Greg Hall |
46 | Chief Marketing Officer | ||||
| Joan Kuehl |
59 | Chief Information Officer | ||||
| Non-employee directors |
||||||
| John C. Dean(1)(2) |
68 | Director | ||||
| Stephen B. Galasso(1) |
67 | Director | ||||
| Tyler Head(3) |
40 | Director | ||||
| Robert L. Johnson(3) |
69 | Director | ||||
| John C. Rosenberg(2)(3) |
39 | Director | ||||
| Saundra D. Schrock |
63 | Director | ||||
| Stephen J. Shaper(1) |
79 | Director | ||||
| (1) | Member of the Audit Committee |
| (2) | Member of the Compensation Committee |
| (3) | Member of the Nominating and Corporate Governance Committee |
Executive officers
Kenneth E. Rees has served as our Chief Executive Officer and Chairman of our Board of Directors since 2014. He joined Think Finance, Inc., or “TFI,” our predecessor company, as President in 2004, and held the position of Chief Executive Officer from his appointment in November 2004 until April 30, 2014, the day before the Spin-Off. Mr. Rees served on TFI’s board of directors as its Chairman from 2014 through May 15, 2015. Prior to joining us, from 2001 to 2004, Mr. Rees was the founder, Chief Executive Officer and Chairman of CashWorks, Inc., a provider of non-bank financial services that was purchased by GE Money Services in 2004. He has a BA in Mathematics from Reed College and an MBA in Finance and Statistics from the University of Chicago. Mr. Rees was named the E&Y Entrepreneur of the Year for the Southwest Area North region in 2012. We believe Mr. Rees is qualified to serve as the Chairman of the Board of Directors because of his over 20 years of experience, including over 14 years leading technology-enabled financial services companies such as TFI, Elevate and CashWorks.
145
Table of Contents
Management
Jason Harvison has served as our Chief Operating Officer and a member of the Board of Directors since 2014 and is a member of our Risk Management Committee. Mr. Harvison served as our Chief Financial Officer from May 2014 to December 2014, as well as Chief Product Officer from May 2014 to October 2014. He served on the board of directors of TFI from 2005, and stepped down from the board as of August 21, 2015. Mr. Harvison joined TFI as Senior Vice President in 2005, and in 2011, he was promoted to Executive Vice President. In 2013, he was further promoted to Chief Product Officer of TFI, which position he held until 2014. Prior to joining TFI, Mr. Harvison served as Assistant Vice President at Guaranty Bank. He has a BBA in Finance from Texas A&M University. We believe Mr. Harvison is qualified to serve as a member of our Board of Directors because of his substantial operational and business strategy expertise gained over ten years from numerous roles at TFI and Elevate.
Christopher Lutes has served as our Chief Financial Officer since January 1, 2015, and served as the Chief Financial Officer of TFI from 2007 to 2014. Prior to joining TFI, Mr. Lutes was the Chief Financial Officer for Silicon Valley Bank from 1998 to 2001, as well as several other companies. Mr. Lutes began his career in public accounting with Coopers & Lybrand. He has a BS in Accounting from Arizona State University and is a Certified Public Accountant in the State of Arizona.
Walt Ramsey has served as our Chief Credit Officer since 2014, having previously served as Chief Risk Officer at TFI from 2011 to 2014. Before joining TFI in 2011, he was the Senior Vice President of Consumer Banking Risk at JP Morgan Chase from 2008 to 2011 and the Chief Risk Officer and Managing Director of Personal Loans at Lloyds TSB from 2005 to 2007. He has also held senior management positions at Experian, GE Consumer Finance and Citigroup. He has a BS in Mathematics from the College of Charleston, as well as graduate degrees in Economics and Statistics from North Carolina State University.
Key employees
Kathy Boden Holland has served as an Executive Vice President of Corporate Development since 2014, having previously served in that role at TFI from 2012 to 2014, and is currently our Chief Risk Officer and Chief Compliance Officer. Ms. Boden Holland served as President of RLJ Financial LLC from 2010 to 2012, before it was purchased by TFI. Prior to that, she was EVP of Urban Trust Holdings, a bank holding company, from 2007 to 2010 and was the founder and General Partner at Bluehouse Capital, a consulting and investment firm, from 2003 to 2006. Ms. Boden Holland has a BS in Economics from the Wharton School at the University of Pennsylvania and an MBA from the University of North Carolina.
Nelda Bruce has served as our Chief Accounting Officer since joining Elevate in 2015. Prior to joining Elevate, Ms. Bruce was the Chief Financial Officer of BWI, Inc. from 2013 to 2015 and also served as the VP of Finance and Accounting and the Chief Accounting Officer at HKN, Inc. from 2008 to 2013. Prior to that, Ms. Bruce held various accounting and management roles at Sabre, Inc. Ms. Bruce is a Certified Public Accountant and has a BBA and MSA in Accounting from Texas Tech University.
Sharon Clarey has served as our Senior Vice President of Human Resources since 2014. She served as the Vice President of Human Resources at TFI from 2011 to 2014 and served as Director of Human Resources at TFI from 2009 to 2011. Prior to joining TFI, Ms. Clarey was the Director of Human Resources at Mannatech, Incorporated from 2004 to 2009 and held various leadership roles at American Airlines and American Trans Air. She has a BA in Advertising from Drake University.
146
Table of Contents
Management
Sarah Fagin Cutrona has served as our Chief Counsel since 2014. She was General Counsel at TFI from 2006 to 2014. Prior to that, she was Associate Counsel at AmeriCredit Corp. from 2001 to 2006 and served as Vice President of Government Affairs at NationsCredit Financial Services Corp. from 1997 to 1998. She is a member of the State Regulatory Registry (SRR) Industry Advisory Council, a subsidiary of the Conference of State Bank Supervisors. Ms. Cutrona graduated from Texas Tech University with degrees in Finance and Petroleum Land Management and received her JD from Southern Methodist University.
Scott Greever has served as Managing Director of our UK business unit since February 15, 2016, and served as the Chief Information Officer of the UK business since 2015. Mr. Greever held multiple roles with TFI from 2009 to 2014 including Chief Information Officer—UK, interim Chief Information Officer and Vice President of Application Development in the United States. Prior to joining TFI, Mr. Greever was the Vice President of North America IT for Brink’s Inc. from 2003 to 2009. Mr. Greever began his career as an internal consultant with NCNB (a predecessor of Bank of America). He has a BS in Marketing from Texas Tech University.
Greg Hall has served as our Chief Marketing Officer since 2015. Mr. Hall joined TFI in 2011 as Vice President of Marketing and was promoted to Executive Vice President of Marketing in 2014. Prior to joining TFI, Mr. Hall was the founder and Chief Executive Officer of Slix, an apparel company, from 2009 to 2011, and Vice President of Marketing and Operational Strategy at Capital One Financial Corp. from 2007 to 2008. He has a BS in Aeronautical & Astronautical Engineering from Purdue University and an MBA in Finance and Management & Strategy from Northwestern University’s Kellogg Graduate School of Management.
Joan Kuehl has served as Chief Information Officer since she joined Elevate in 2016. Prior to joining Elevate, Ms. Kuehl was Senior Vice President and eBusiness CIO at The Travelers Companies since 2012. Previously, she was Senior Vice President of Technology at Bank of America from 2006 to 2012, responsible for running Online Banking and Mobile Banking for the consumer bank. Additionally, from 1984 to 2006, Ms. Kuehl also held various technology leadership positions at Sabre, Inc., including Senior Vice President of Application Development. Ms. Kuehl holds a BS in Computer Science from West Virginia University.
Non-employee directors
John C. Dean has been a member of our Board of Directors since May 2014 and is a member of the Compensation and Audit Committees. Mr. Dean previously served as a member of the board of directors of TFI from 2005 to 2014. Mr. Dean has spent more than 35 years as an executive in the financial services industry, serving as Chief Executive Officer of five financial institutions throughout the country including Silicon Valley Bank. He has been with Central Pacific Bank since 2010, serving as Chairman of the Board of Central Pacific Bank from March 2010 until April 2011, when he became Chief Executive Officer, which position he held until July 2015, when he became Executive Chairman of the Board. In 2001, Mr. Dean was recognized by Forbes as one of the “50 most powerful dealmakers.” More recently, he was recognized as Hawaii Business Magazine’s 2012 CEO of the Year; Sales and Marketing Executives International Honolulu’s 2012 Salesperson of the Year; 2012 Pacific Business News’ Business Leader of the Year; and 2012 Pacific Buddhist Academy Inspirational Leader. He is a graduate of Holy Cross College, a former Peace Corps Volunteer in Western Samoa and a graduate of the Wharton School at the University of Pennsylvania with an MBA in Finance. We believe Mr. Dean is uniquely qualified to serve on our Board of Directors due to his 35 year history as a respected financial services executive.
147
Table of Contents
Management
Stephen B. Galasso has been a member of our Board of Directors since May 2014 and is a member of the Audit Committee and the Chairperson of the Risk Management Committee. Mr. Galasso previously served on the board of directors of TFI from 2012 to 2014. He was Chairman and Chief Executive Officer of NetSpend from 2001 to 2004, President and Chief Executive Officer of Universal Value Network from 1998 to 2000 and President and Chief Executive Officer of Bank of America Credit Cards from 1995 to 1998. He has been an independent director and strategic advisor to several companies including TFI since 2012 (where he ceased serving as a director in May 2014), Axeso Payment Solutions in Brazil from 2011 to 2012, AccountNow, Inc. from 2007 to 2011, and Advanced Payment Solutions in the UK from 2005 to 2011. Mr. Galasso was also an Entrepreneur in Residence for Payments and Financial Technology at Trident Capital from 2005 to 2011. He has a BS and MBA from Fordham University. We believe Mr. Galasso is qualified to serve on our Board of Directors because of his experience with multiple payment and credit financial products, for both large and small institutions in the US as well as abroad.
Tyler Head has been a member of the Board of Directors since July 2014 and is the Chairperson of the Nominating and Corporate Governance Committee. He is the President and founder of Corbett Capital, LLC, a closely held investment company focusing on growth capital investments in early-stage and lower middle market companies. Prior to founding Corbett Capital, LLC, in 2011, Mr. Head served as an officer and F/A-18 pilot in the US Marine Corps from 1998 through 2009, attaining the rank of Major prior to transitioning to the private sector. He is a founding member of Cowtown Angels, an Angel Investor group in Fort Worth, Texas and serves on the group’s steering council, investment screening committee, and membership committee. Mr. Head serves on the boards of directors of Wisegate, Inc. and Little Passports, Inc., and served on the board of directors of TFI until August 21, 2015. He serves on the Board of Managers of Eidolon Brands, LLC, the parent company of the Ben Hogan Golf Equipment Company. Mr. Head also serves on the board of directors of TECH Fort Worth, a business incubator and accelerator, and is the Chairman of its Outreach and Programs Committee. He has a BS in Political Science with a minor in Spanish from the US Naval Academy and an MBA from the Tuck School of Business at Dartmouth College. We believe Mr. Head is qualified to serve on our Board of Directors because of his experience funding and advising early stage growth companies, his experience in corporate governance, and his extensive organizational and leadership experience in the Marine Corps.
Robert L. Johnson has served on the Board of Directors since May 2014, and previously served on the board of directors of TFI from August 2012 to 2014. He is a member of the Nominating and Corporate Governance Committee. Mr. Johnson is the founder and Chairman of The RLJ Companies, an innovative business network that owns or holds interests in a diverse portfolio of companies in the consumer financial services, private equity, real estate, hospitality, professional sports, film production, gaming and automobile dealership industries. Prior to forming The RLJ Companies, in 1980 Mr. Johnson founded Black Entertainment Television (BET) where he served as chief executive officer. In 2001, BET was acquired by Viacom Inc. and Mr. Johnson continued to serve as chief executive officer until 2006. In July 2007, Mr. Johnson was named by USA Today as one of the “25 most influential business leaders of the past 25 years.” Mr. Johnson currently serves on the compensation committee and the governance committee of the board of directors of the Lowe’s Companies, Inc. (NYSE: LOW), the compensation committee and the nomination and governance committee of KB Home (NYSE: KBH), as well as on the board of directors or trustees of RLJ Entertainment, Inc., RLJ Lodging Trust (NYSE: RLJ) and Strayer Education, Inc. (NASDAQ: STRA). Mr. Johnson is a graduate of the University of Illinois and holds a master’s degree in public affairs from the Woodrow Wilson School of Public and International Affairs at Princeton University. We believe Mr. Johnson is qualified to serve on our Board of Directors due to his experience as a successful chief executive officer of BET and The RLJ Companies as well as his experience in finance, banking and brand-building enterprises. In addition, he brings
148
Table of Contents
Management
experience from serving on more than seven publicly-traded companies and participating in board committees including audit, governance and compensation and has a proven commitment to serving minority and underserved consumers.
John C. Rosenberg has served on the Board of Directors since May 2014 and is a member of the Compensation and Nominating and Corporate Governance Committees. Mr. Rosenberg previously served on the board of directors of TFI from 2009 to 2014. He is a General Partner at Technology Crossover Ventures, or “TCV,” a provider of growth capital to technology companies, which he joined in 2000. Mr. Rosenberg also serves as a director of several private companies. He received a BA in Economics from Princeton University. We believe Mr. Rosenberg is qualified to serve on our Board of Directors because, as a venture capital investor, he brings strategic insights and financial experience to the board. He has evaluated, invested in and served as a board member of numerous companies and is familiar with a full range of corporate and board functions.
Saundra D. Schrock has been a member of the Board of Directors since May 2016. Currently a Managing Partner at Equanimity Leadership Solutions, LLC, a consulting firm that trains leaders on effective management communications strategies, Ms. Schrock brings to Elevate more than 35 years of experience in consumer financial services. Prior to her current position, which she has held since 2015, she was a Partner at her current firm, and from 2011 to 2014, she worked as an executive coaching consultant. Before that, she spent over twenty years at JPMorgan Chase where she successfully managed over 3,000 bank branches and 30,000 employees, as well as their Consumer Lending Division. Ms. Schrock is also the Treasurer of St. Joseph’s Hospital Foundation Board. She earned a BA in Psychology from Memphis State University (now the University of Memphis) and an MBA from Arizona State University where she is currently serving as an Executive in Residence. We believe that she is qualified to serve on our Board of Directors because she brings a wealth of expertise in banking and consumer lending.
Stephen J. Shaper has been a member of the Board of Directors since May 2014 and is the Chairperson of the Audit Committee and a member of the Risk Management Committee. Mr. Shaper has been the Chief Executive Officer of Middlemarch Capital Corporation, a consulting organization for the payments industry encompassing credit and debit transactions, internet payments, checks and loans, since 2010. Mr. Shaper previously served as Executive Vice President, Sales for PreCash Corporation from 2007 to 2010 and before that was the Chairman of Optimal Payments PLC (London: OPAY). He also served as President of Sales and Marketing for First Data Corporation and as Chief Executive Officer of TeleCheck Services, Inc., or “TeleCheck.” Prior to TeleCheck, Mr. Shaper owned or was a partner in more than thirty manufacturing, importing and distribution companies. He is currently a board member of Direct Connect and Mickie Services Company and a member of the board and the audit committees of Optimal Payments and TFI. Mr. Shaper received a BA degree in Mechanical Engineering from Rice University and an MBA from Harvard Business School and served in the US Army Corps of Engineers. He was a member of Young Presidents’ Organization and is currently an active member of World Presidents’ Organization. We believe Mr. Shaper is uniquely qualified to serve on our Board of Directors from having been involved in the payments industry continuously since 1977 as an investor, board member and executive.
149
Table of Contents
Management
BOARD COMPOSITION
Our business and affairs are managed under the direction of our Board of Directors. Pursuant to our current certificate of incorporation and voting agreement, our current directors were elected as follows:
| Ø | John C. Dean was nominated by the Board and elected by the majority vote of holders of our preferred stock and certain holders of our common stock, voting together as a single class; |
| Ø | Stephen B. Galasso was nominated by the Board and elected by the majority vote of holders of our preferred stock and certain holders of our common stock, voting together as a single class; |
| Ø | Saundra D. Schrock was elected as the designee of certain holders of our Series A preferred stock; |
| Ø | Jason Harvison was elected as the designee of certain holders of shares of our common stock; |
| Ø | Tyler Head was elected as the designee of certain holders of shares of our common stock; |
| Ø | Robert L. Johnson was nominated by the Board and elected by the majority vote of holders of our preferred stock and certain holders of our common stock, voting together as a single class; |
| Ø | Kenneth E. Rees was elected as the designee reserved for the person serving as our Chief Executive Officer; |
| Ø | John C. Rosenberg was elected as the designee of certain holders of our Series B preferred stock; and |
| Ø | Stephen J. Shaper was nominated by the Board and elected by the majority vote of holders of our preferred stock and certain holders of our common stock, voting together as a single class. |
Our voting agreement will terminate and the provisions of our current certificate of incorporation by which our directors were elected will be amended and restated in connection with this offering. The number of directors will be fixed by our Board of Directors, subject to the terms of our amended and restated certificate of incorporation and amended and restated bylaws that will become effective immediately prior to the completion of this offering. Upon the completion of this offering, our Board of Directors will consist of nine directors, seven of whom will qualify as “independent” under the New York Stock Exchange listing standards.
In accordance with our amended and restated certificate of incorporation and our amended and restated bylaws that will be in effect upon completion of this offering, immediately after the completion of this offering our Board of Directors will be divided into three classes with staggered three-year terms. Only one class of directors will be elected at each annual meeting of our stockholders, with the other classes continuing for the remainder of their respective three-year terms. Our directors will be divided among the three classes as follows:
| Ø | the Class I directors will be Kenneth E. Rees, Stephen B. Galasso and Robert L. Johnson, and their terms will expire at the annual meeting of stockholders to be held in 2016; |
| Ø | the Class II directors will be John C. Rosenberg, John C. Dean and Jason Harvison, and their terms will expire at the annual meeting of stockholders to be held in 2017; and |
| Ø | the Class III directors will be Stephen J. Shaper, Saundra D. Schrock and Tyler Head, and their terms will expire at the annual meeting of stockholders to be held in 2018. |
The division of our Board of Directors into three classes with staggered three-year terms may delay or prevent a change of our management or a change of control. Under Delaware law, our directors may be removed for cause by the affirmative vote of the holders of a majority of our voting stock.
150
Table of Contents
Management
Any increase or decrease in the number of directors will be distributed among the three classes so that, as nearly as possible, each class will consist of one-third of the directors.
This classification of our Board of Directors may have the effect of delaying or preventing changes in control of our company.
DIRECTOR INDEPENDENCE
Our Board of Directors has undertaken a review of the independence of each director. Based on information provided by each director concerning his or her background, employment and affiliates, our Board of Directors determined that John C. Dean, Stephen B. Galasso, Saundra D. Schrock, Tyler Head, Robert L. Johnson, John C. Rosenberg and Stephen J. Shaper do not have a relationship that would interfere with the exercise of independent judgment in carrying out the responsibilities of a director and that each of these directors is “independent” as that term is defined under the applicable rules and regulations of the SEC and the listing requirements and rules of the New York Stock Exchange. In making these determinations, our Board of Directors considered the current and prior relationships that each non-employee director has with our company and TFI and all other facts and circumstances our Board of Directors deemed relevant in determining their independence, including the beneficial ownership of our capital stock by each non-employee director, and the transactions involving them described in “Certain relationships and related party transactions.”
BOARD COMMITTEES
Our Board of Directors currently has an Audit Committee, a Compensation Committee, a Nominating and Corporate Governance Committee and a Risk Management Committee. The composition and responsibilities of each of the committees of our Board of Directors is described below. Members will serve on these committees until their resignation or until otherwise determined by our Board of Directors.
Audit Committee
Our Audit Committee, established in May 2014, comprises John C. Dean, Stephen B. Galasso and Stephen J. Shaper. Mr. Shaper serves as our Audit Committee Chairperson. Mr. Dean, Mr. Galasso and Mr. Shaper meet the requirements for independence of Audit Committee members under current New York Stock Exchange listing standards and SEC rules and regulations. Each member of our Audit Committee meets the financial literacy requirements of the current listing standards. In addition, our Board of Directors has determined that Mr. Dean is an audit committee financial expert within the meaning of Item 407(d) of Regulation S-K under the Securities Act of 1933, as amended, or the “Securities Act.” The responsibilities of our Audit Committee include, among other things:
| Ø | appointing, as well as reviewing and approving the compensation, retention and termination of, the independent registered public accounting firm engaged to audit our financial statements; |
| Ø | helping to ensure the independence of and overseeing the performance of the independent registered public accounting firm; |
| Ø | reviewing and pre-approving audit and non-audit services and fees; |
| Ø | reviewing financial statements and discussing with management and the independent registered public accounting firm our annual audited and quarterly financial statements, the results of the independent audit and the quarterly reviews, and the reports and certifications regarding internal controls over financial reporting and disclosure controls; |
151
Table of Contents
Management
| Ø | preparing the Audit Committee report that the SEC requires be included in our annual proxy statement; |
| Ø | reviewing reports and communications from the independent registered public accounting firm; |
| Ø | reviewing the adequacy and effectiveness of our internal controls over financial reporting; |
| Ø | assisting the board of directors in overseeing our internal audit function; |
| Ø | reviewing and overseeing related party transactions; and |
| Ø | establishing and maintaining procedures for the receipt, retention and treatment of complaints regarding accounting, internal accounting controls, auditing matters, or federal and state rules and regulations, and the confidential, anonymous submission by our employees of concerns regarding questionable accounting or auditing matters. |
Our Audit Committee will operate under a written charter, to be effective prior to the completion of this offering, that satisfies the applicable rules of the SEC and the listing standards of the New York Stock Exchange. We intend to comply with future requirements to the extent they become applicable to us. The Audit Committee charter will be available on our website at www.elevate.com following the completion of the offering.
Compensation Committee
Our Compensation Committee, established in May 2014, comprises John C. Dean and John C. Rosenberg. We currently have a vacancy on the Committee, which we plan to fill in the near term. Mr. Rosenberg serves as our Compensation Committee Chairperson. The composition of our Compensation Committee meets the requirements for independence under current listing standards of the New York Stock Exchange and SEC rules and regulations. Each member of the Compensation Committee is also a non-employee director, as defined pursuant to Rule 16b-3 promulgated under the Securities Exchange Act of 1934, or the “Exchange Act,” and an outside director, as defined pursuant to Section 162(m) of the Internal Revenue Code, or the “Code.” The purpose of our Compensation Committee is to oversee our compensation policies, plans and benefit programs and to discharge the responsibilities of our Board of Directors relating to compensation of our executive officers and employees. The responsibilities of our Compensation Committee include, among other things:
| Ø | overseeing our overall compensation philosophy and compensation policies, plans and benefit programs; |
| Ø | reviewing and approving for our executive officers: the annual base salary, annual incentive bonus (including the specific goals and amounts), equity compensation, employment agreements, severance agreements, change in control arrangements, and any other benefits, compensation or arrangements; |
| Ø | to the extent determined appropriate by the Compensation Committee, reviewing, approving and/or making recommendations to our Board of Directors with respect to employee compensation and overseeing equity compensation for our service providers; |
| Ø | preparing the Compensation Committee report that the SEC requires to be included in our annual proxy statement; and |
| Ø | administering our equity compensation plans. |
Our Compensation Committee will operate under a written charter, to be effective prior to the completion of this offering, that satisfies the applicable rules of the SEC and the listing standards of the New York Stock Exchange. We intend to comply with future requirements to the extent they become applicable to us. The Compensation Committee charter will be available on our website at www.elevate.com following the completion of the offering.
152
Table of Contents
Management
Nominating and Corporate Governance Committee
Our Nominating and Corporate Governance Committee, established in June 2015, comprises Tyler Head, Robert L. Johnson and John C. Rosenberg. Mr. Head serves as our Nominating and Corporate Governance Committee Chairperson. The composition of our Nominating and Corporate Governance Committee meets the requirements for independence under current New York Stock Exchange listing standards and SEC rules and regulations. The responsibilities of our Nominating and Corporate Governance Committee include, among other things:
| Ø | identifying, evaluating and selecting, or making recommendations to our Board of Directors regarding, nominees for election to our Board of Directors and its committees; |
| Ø | considering and making recommendations to our Board of Directors regarding the composition of our Board of Directors and its committees; |
| Ø | reviewing developments in corporate governance practices; |
| Ø | evaluating the adequacy of our corporate governance practices and reporting; |
| Ø | developing and making recommendations to our Board of Directors regarding our corporate governance guidelines; |
| Ø | reviewing the succession planning for each of our executive officers; |
| Ø | evaluating the performance of our Board of Directors and of individual directors; and |
| Ø | reviewing and making recommendations to our Board of Directors regarding director compensation. |
Our Nominating and Corporate Governance Committee will operate under a written charter, to be effective prior to the completion of this offering, that satisfies the applicable rules of the SEC and the listing standards of the New York Stock Exchange. We intend to comply with future requirements to the extent they become applicable to us. The Nominating and Corporate Governance Committee charter will be available on our website at www.elevate.com following the completion of the offering.
Risk Management Committee
Our Risk Management Committee, established in January 2016, comprises Stephen B. Galasso, Stephen J. Shaper and Jason Harvison. Mr. Galasso serves as our Risk Management Committee Chairperson. The responsibilities of our Risk Management Committee include, among other things:
| Ø | overseeing our risk governance framework and reviewing our policies and practices on risk assessment and risk management; |
| Ø | overseeing our policies and procedures regarding compliance with applicable laws and regulations; |
| Ø | reviewing management’s implementation of risk policies and procedures to assess their effectiveness; |
| Ø | reviewing our risk appetite and risk tolerance, methods of risk measurement, risk limits, and the guidelines for monitoring and mitigating such risks; |
| Ø | reviewing with management the categories of risk we face, including risk concentrations and risk interrelationships, likelihood of occurrence, and potential impact; |
| Ø | evaluating reports regarding our risks, our management function, and the results of risk management reviews and assessments; and |
| Ø | reviewing and discussing with management our risks, our management function and its effectiveness, and coordinating with management subcommittees regarding oversight of certain categories of risk determined by the Risk Management Committee. |
153
Table of Contents
Management
Additionally, Mr. Shaper’s and Mr. Galasso’s duties as Risk Management Committee members include conducting on-site meetings with management for four days each quarter.
Our Risk Management Committee will operate under a written charter that will be effective prior to the completion of this offering. The Risk Management Committee charter will be available on our website at www.elevate.com following the completion of the offering.
BOARD OF DIRECTORS’ ROLE IN RISK MANAGEMENT
Our full Board of Directors oversees our risk management process. Our Board of Directors oversees a company-wide approach to risk management, carried out by our management. Our full Board of Directors determines the appropriate risk for us generally, assesses the specific risks faced by us, and reviews the steps taken by management to manage those risks.
While the full Board of Directors maintains the ultimate oversight responsibility for the risk management process, its committees oversee risks in certain specified areas. Our Risk Management Committee reviews our business strategy and management’s assessment of the related risk and discusses with management our appropriate level of risk. Our Compensation Committee oversees risks associated with incentive compensation to ensure proper alignment of incentive compensation with both our strategic objectives and risk appetite. Our Audit Committee oversees financial risk exposures, including monitoring the integrity of the consolidated financial statements, internal control over financial reporting and the independence of our independent registered public accounting firm. Our Board of Directors, through our Audit Committee, receives periodic internal controls and related assessments from our finance department. In fulfilling its oversight responsibility with respect to compliance matters, our Board of Directors, through our Audit Committee, meets at least quarterly with our finance department, independent registered public accounting firm and internal or external legal counsel to discuss risks related to our financial reporting function.
BOARD LEADERSHIP
Our Corporate Governance Guidelines provide that the roles of Chairman of the Board of Directors and Chief Executive Officer may be separate or combined, and our Board of Directors has flexibility to decide whether it is in the best interests of Elevate, at any given point in time, for the roles of the Chief Executive Officer and Chairman to be separate or combined. Currently, the roles are combined, with Mr. Rees serving as Chairman and Chief Executive Officer. We believe that we are well-served by a flexible leadership structure. Our Board of Directors will continue to consider whether the positions of Chairman and Chief Executive Officer should be separate or combined at any given time as part of our succession planning process.
Our Corporate Governance Guidelines provide that whenever our Chairman is also our Chief Executive Officer, the Board of Directors will designate an independent, non-employee director as Lead Director whose duties will include chairing executive sessions of the Board of Directors, serving as the principal liaison between the Chairman and the independent directors, approving information sent to the Board of Directors, approving meeting agendas and schedules for the Board of Directors, and ensuring that he or she is available for consultation and direct communication with stockholders, if requested. The Lead Director has the authority to call meetings of the independent directors. We currently have a vacancy for our Lead Director, which we intend to fill in the near future.
154
Table of Contents
Management
CORPORATE GOVERNANCE GUIDELINES
The Board of Directors has developed and adopted a set of corporate governance principles to provide the framework for the governance of Elevate and to assist our Board in the exercise of its responsibilities. These guidelines reflect the Board’s commitment to monitoring the effectiveness of policy and decision making both at the Board and management level, with a view to enhancing stockholder value over the long term. These guidelines provide a framework for the conduct of the Board’s business.
The Corporate Governance Guidelines will be available on our website at www.elevate.com following the completion of the offering.
CODE OF BUSINESS CONDUCT AND ETHICS POLICY
We have adopted a Code of Business Conduct and Ethics Policy that is applicable to all of our employees, officers and directors, including our Chief Executive Officer, Chief Financial Officer, Chief Operating Officer and other executive and senior financial officers. The Code of Business Conduct and Ethics Policy will be available on our website at www.elevate.com following the completion of the offering. We expect that any amendments to the code, or any waivers of its requirements, will be disclosed on our website.
COMPENSATION COMMITTEE INTERLOCKS AND INSIDER PARTICIPATION
None of the members of our Compensation Committee is or has at any time during the past fiscal year been one of our officers or employees. None of our executive officers currently serves or in the past fiscal year has served as a member of the Compensation Committee or Board of Directors of any other entity that has one or more executive officers serving as a member of our Board of Directors or Compensation Committee.
NON-EMPLOYEE DIRECTOR COMPENSATION
During the year ended December 31, 2015, two of our non-employee members of the Board of Directors, Stephen B. Galasso and Stephen J. Shaper, received $161,375 and $69,750, respectively, for service to us as a director. Mr. Shaper also served as a member of the board of directors of TFI and was compensated for such service by TFI. In January 2015, we granted Mr. Shaper an option to purchase 62,500 shares of our common stock with a per share exercise price of $5.59. All shares subject to the option were fully vested on the grant date.
During the year ended December 31, 2015, two directors, Mr. Rees, our Chief Executive Officer, and Mr. Harvison, our Chief Operating Officer, were employees. Mr. Rees’ and Mr. Harvison’s compensation is discussed in “Executive compensation.”
155
Table of Contents
Management
Our non-employee director compensation policy, which will take effect upon the completion of this offering, is described below:
Cash compensation
Each year, each non-employee director will receive a cash retainer of $40,000 for serving on the Board of Directors.
The Chairpersons and non-chair members of the following Board committees will be entitled to cash retainers each year as described below:
| Board Committee | Chairperson retainer |
Non-chair member retainer |
||||||
| Audit Committee |
$ | 10,000 | $7,500 | |||||
| Compensation Committee |
10,000 | 5,000 | ||||||
| Corporate Governance and Nominating Committee |
10,000 | 5,000 | ||||||
| Risk Management Committee |
58,000 | (1) | 55,500 | (1) | ||||
| (1) | Retainer amounts to be paid to each of Stephen B. Galasso, our Risk Management Committee Chairperson, and Stephen J. Shaper reflect the additional significant duties they will have as members of the Risk Management Committee, namely conducting onsite meetings with management for four days each quarter. Mr. Harvison will not receive a cash retainer for his membership on the Risk Management Committee as he is an employee. |
Equity compensation
Upon joining the Board of Directors, each newly elected non-employee director will receive an equity award of restricted stock units with a grant date fair value of $300,000, which will vest annually over a four-year period.
Each non-employee director will also receive an annual equity award of restricted stock units with a grant date fair value of $110,000. This award will fully vest upon the earlier of the 12-month anniversary of the grant date or the next annual meeting.
156
Table of Contents
As an emerging growth company, we have opted to comply with the executive compensation disclosure rules applicable to “smaller reporting companies,” as such term is defined under the Securities Act. For 2015, our named executive officers under such rules are:
| Ø | Kenneth E. Rees, our Chief Executive Officer and Chairman; |
| Ø | Jason Harvison, our Chief Operating Officer; and |
| Ø | Christopher Lutes, our Chief Financial Officer. |
SUMMARY COMPENSATION TABLE
The following table provides information regarding the compensation of our named executive officers during the years ended December 31, 2014 and 2015.
| Name and principal position | Year | Salary | Bonus(9) | Option awards(10) |
All other compensation |
Total | ||||||||||||||||||
| Kenneth E. Rees(1) |
||||||||||||||||||||||||
| Chief Executive Officer and Chairman |
|
2015 2014 |
|
$
|
585,846 409,231 |
(4)(5) (6) |
$
|
596,609 — |
|
$
|
452,119 516,718 |
(11) (12) |
$
|
32,103 20,239 |
(16) (16) |
$
|
1,666,677 946,188 |
| ||||||
| Jason Harvison(2) |
||||||||||||||||||||||||
| Chief Operating Officer |
|
2015 2014 |
|
|
415,385 263,462 |
(4) (7) |
|
270,205 86,058 |
|
|
301,316 44,400 |
(13) (14) |
|
34,500 27,051 |
(17) (17) |
|
1,021,406 420,971 |
| ||||||
| Christopher Lutes |
||||||||||||||||||||||||
| Chief Financial Officer |
|
2015 2014 |
(3) |
|
392,308 — |
(4)(8)
|
|
63,692 — |
|
|
68,000 — |
(15)
|
|
27,971 — |
(18)
|
|
551,971 — |
| ||||||
| (1) | In 2014 and 2015, Mr. Rees also served as a director of our company but did not receive any compensation for such services. |
| (2) | In 2014 and 2015, Mr. Harvison also served as a director of our company but did not receive any compensation for such services. |
| (3) | Prior to joining us in 2015, Mr. Lutes did not receive any compensation from us. As described in the Outstanding Equity Awards at Fiscal Year-End table, below, stock options that were granted to Mr. Lutes by TFI during, and in connection with, his employment with TFI, were converted to options covering our common stock in connection with our separation from TFI on May 1, 2014, and were not compensation from us. |
| (4) | The annual base salaries for the NEOs are determined based on 26 bi-weekly periods. In 2015, there were 27 bi-weekly periods, and the NEOs received base salary payments for the additional pay period. |
| (5) | Mr. Rees’ base salary was increased from $560,000 to $600,000 in November 2015. |
| (6) | Represents the pro rata portion of Mr. Rees’ $560,000 base salary following our spin-off from TFI. |
| (7) | Represents the pro rata portion of Mr. Harvison’s $350,000 base salary following our spin-off from TFI, which was increased to $400,000 in October 2014. |
| (8) | Represents the pro rata portion of Mr. Lutes’ $400,000 base salary following his commencement of service with us in January 2015. |
| (9) | The amount reported in the “bonus” column represents the cash incentive bonus paid to Mr. Harvison in 2014 and 2015, and Mr. Lutes in 2015, under the Elevate Bonus Plan, described below. Under our bonus plan, each of Messrs. Harvison and Lutes was eligible to receive bi-annual incentive cash bonuses, subject to their continued employment with us through the payment date, based on their individual earnings, target percentages (each, 80%), and performance modifiers, which performance modifiers were determined by our Board of Directors. For 2014 and 2015, Mr. Rees was eligible to receive an annual incentive cash bonus, subject to his continued employment with us through the payment date, based on his individual earnings, target percentage (100%), and performance modifier as determined by our Board of Directors. Because Mr. Rees’ cash incentive bonus is paid on an annual, as opposed to a bi-annual basis, and subject to continued employment with us through the payment date, Mr. Rees’ cash incentive bonus from us for 2014 was earned in 2014 and paid in 2015. In 2015, the amount reported for Mr. Rees also includes a years of service award of $10,000. With respect to the years of service award, we reward all employees for 5, 10, 15 and 20 years of continuous service to us, including prior service to TFI. To earn an award, an employee must be employed with us on the payment date. The amount of the award is determined by |
(footnotes continued on following page)
157
Table of Contents
Executive compensation
| multiplying the relevant years of service by $1,000. All employees who receive an award also receive a gross-up payment for taxes associated with the award. |
| (10) | The amounts reported in the “option awards” column represent the grant date fair value of the stock options granted to the named executive officers during 2014 and 2015, computed in accordance with Financial Accounting Standards Board Accounting Standards Codification Topic 718, or FASB ASC Topic 718. The assumptions used in calculating the grant date fair value of the stock options reported in the “option awards” column are set forth in Note 10 to the combined and consolidated financial statements included in this prospectus. Note that the amounts reported in this column reflect the accounting cost for these stock options and do not correspond to the actual economic value that may be received by the named executive officers upon exercise of the options. |
| (11) | Mr. Rees received two options in 2015. 25% of the shares subject to the options vest on June 19, 2016, and 1/48 of the shares subject to the options vest monthly thereafter, subject to continued service with us on each such vesting date. One option, covering 199,068 shares, is a “reload” grant related to Mr. Rees’ “cashless” exercise of an option expiring on November 18, 2015, and covers the number of shares withheld in connection with such exercise. 100% of the shares subject to this option vest upon our initial public offering, subject to continued service with us on such vesting date. |
| (12) | 25% of the shares subject to the option vest on November 21, 2015, and 1/48 of the shares subject to the option vest monthly thereafter, subject to continued service with us on each such vesting date. 100% of the shares subject to the option vest upon our initial public offering, subject to continued service with us on such vesting date. The option is a “reload” grant related to Mr. Rees’ “cashless” exercise of an option expiring on October 31, 2014, and covers the number of shares withheld in connection with such exercise. |
| (13) | Mr. Harvison received three options in 2015. 25% of the shares subject to two options, covering 68,173 shares and 37,500 shares, respectively, vest on June 19, 2016, and 1/48 of the shares subject to such two options vest monthly thereafter, subject to continued service with us on each such vesting date. 25% of the shares subject to the third option, covering 70,188 shares, vest on February 20, 2016, and 1/48 of the shares subject to such option vest monthly thereafter, subject to continued service with us on each such vesting date. 100% of the shares subject to two options, covering 70,188 shares and 68,173 shares, respectively, vest upon our initial public offering, subject to continued service with us on such vesting date. These two options, covering 70,188 and 68,173 shares, respectively, are “reload” grants related to Mr. Harvison’s “cashless” exercise of options expiring on February 28, 2015, and November 18, 2015, respectively, and cover the number of shares withheld in connection with each such exercise. |
| (14) | 25% of the shares subject to the option vest on December 12, 2015, and 1/48 of the shares subject to the option vest monthly thereafter, subject to continued service with us on each such vesting date. The option was granted in connection with Mr. Harvison’s promotion to the Chief Operating Officer position. |
| (15) | 25% of the shares subject to the option vest on June 19, 2016, and 1/48 of the shares subject to the option vest monthly thereafter, subject to continued service with us on each vesting date. |
| (16) | The amount reported in the “all other compensation” column represents $10,400 and $10,600 in matching contributions to our 401(k) plan, for 2014 and 2015, respectively, and $9,839 and $14,276 in health and life insurance premiums, for 2014 and 2015, respectively. The amount reported in the “all other compensation” column for 2015 also represents $7,227 in gross-up taxes for Mr. Rees’ years of service award, described above. |
| (17) | The amount reported in the “all other compensation” column represents $10,400 and $10,600 in matching contributions to our 401(k) plan, for 2014 and 2015, respectively, and $16,651 and $23,900 in health and life insurance premiums for 2014 and 2015, respectively. |
| (18) | The amount reported in the “all other compensation” column represents $10,600 in matching contributions to our 401(k) plan and $17,371 in health and life insurance premiums. |
ELEVATE BONUS PLAN
Our bonus plan generally rewards eligible employees based on our performance during six-month performance periods. Bonus payments are based on individual targets, measured as a percentage of eligible earnings, adjusted by a performance modifier that is determined by our Board of Directors. Bonus payments are contingent on employment through the date of payment.
158
Table of Contents
Executive compensation
EXECUTIVE EMPLOYMENT ARRANGEMENTS
Kenneth E. Rees
Mr. Rees is party to an Employment, Confidentiality and Non-Compete Agreement, as amended, with us, or the “Rees Agreement,” which provides for an annual base salary of $600,000, a discretionary bonus of 100% of his annual base salary as determined by our Board of Directors, paid time off and participation in our benefit plans. The Rees Agreement provides that if Mr. Rees’ employment with us is terminated by us without cause, he will receive, subject to his execution and non-revocation of a release of claims, (i) continued payment of base salary for 24 months and (ii) a lump sum payment equal to the premiums that he would be required to pay for his and his dependents’ continued healthcare coverage pursuant to COBRA for 24 months, regardless of whether he elects COBRA coverage. If Mr. Rees’ employment with us is terminated by us without cause or by him for good reason either 3 months prior to or within 24 months following a change in control of us, the Rees Agreement provides that Mr. Rees will receive, subject to his execution and non-revocation of a release of claims, (i) the severance payments described above, (ii) a lump sum bonus equal to 100% of his target annual incentive and (iii) accelerated vesting of the unvested portion of all equity awards held by him. The Rees Agreement also provides that if Mr. Rees’ employment with us is terminated for any reason other than by us for cause prior to a public offering of our stock, we will provide him with loans for purposes of exercising certain vested stock options. In the event that any of the payments or benefits under the Rees Agreement or otherwise would become subject to excise taxes imposed by Section 4999 of the Internal Revenue Code (the “Excise Tax”), such payments or benefits will be (i) delivered in full, or (ii) reduced such that no portion of the payments or benefits will be subject to the Excise Tax, whichever is more favorable on an after tax basis to Mr. Rees.
Jason Harvison
Mr. Harvison is party to an Employment, Confidentiality and Non-Compete Agreement, as amended, with us, or the “Harvison Agreement,” which provides for an annual base salary of $400,000, a discretionary bonus of 80% of his annual base salary as determined by our Board of Directors, paid time off and participation in our benefit plans. The Harvison Agreement provides that if Mr. Harvison’s employment with us is terminated by us without cause, he will receive, subject to his execution and non-revocation of a release of claims, (i) continued payment of base salary for 12 months and (ii) a lump sum payment equal to the premiums that he would be required to pay for his and his dependents’ continued healthcare coverage pursuant to COBRA for 12 months, regardless of whether he elects COBRA coverage. If Mr. Harvison’s employment with us is terminated by us without cause or by him for good reason either 3 months prior to or within 24 months following a change in control of us, the Harvison Agreement provides that Mr. Harvison will receive, subject to his execution and non-revocation of a release of claims, (i) the severance payments described above, (ii) a lump sum bonus equal to 50% of his target annual incentive and (iii) accelerated vesting of the unvested portion of all equity awards held by him. The Harvison Agreement also provides that if Mr. Harvison’s employment with us is terminated for any reason other than by us for cause prior to a public offering of our stock, we will provide him with loans for purposes of exercising certain vested stock options. In the event that any of the payments or benefits under the Harvison Agreement or otherwise would become subject to the Excise Tax, such payments or benefits will be (i) delivered in full, or (ii) reduced such that no portion of the payments or benefits will be subject to the Excise Tax, whichever is more favorable on an after tax basis to Mr. Harvison.
159
Table of Contents
Executive compensation
Christopher Lutes
Mr. Lutes is party to an Employment, Confidentiality and Non-Compete Agreement, as amended, with us, or the “Lutes Agreement,” which provides for an annual base salary of $400,000, a discretionary bonus of 80% of his annual base salary as determined by our Board of Directors, paid time off and participation in our benefit plans. The Lutes Agreement provides that if Mr. Lutes’ employment with us is terminated by us without cause, he will receive, subject to his execution and non-revocation of a release of claims, (i) continued payment of base salary for 12 months and (ii) a lump sum payment equal to the premiums that he would be required to pay for his and his dependents’ continued healthcare coverage pursuant to COBRA for 12 months, regardless of whether he elects COBRA coverage. If Mr. Lutes’ employment with us is terminated by us without cause or by him for good reason either 3 months prior to or within 24 months following a change in control of us, the Lutes Agreement provides that Mr. Lutes will receive, subject to his execution and non-revocation of a release of claims, (i) the severance payments described above, (ii) a lump sum bonus equal to 50% of his target annual incentive and (iii) accelerated vesting of the unvested portion of all equity awards held by him. In the event that any of the payments or benefits under the Lutes Agreement or otherwise would become subject to the Excise Tax, such payments or benefits will be (i) delivered in full, or (ii) reduced such that no portion of the payments or benefits will be subject to the Excise Tax, whichever is more favorable on an after tax basis to Mr. Lutes.
POTENTIAL PAYMENTS UPON TERMINATION OR CHANGE IN CONTROL
As described above, if a named executive officer’s employment with us is terminated by us without cause, or by him for good reason, either 3 months prior to or within 24 months following a change in control of us, he will receive, subject to his execution and non-revocation of a release of claims, (i) continued payment of base salary for 12 months (24 months for Mr. Rees), (ii) a lump sum payment equal to the premiums that he would be required to pay for his and his dependents’ continued healthcare coverage pursuant to COBRA for 12 months (24 months for Mr. Rees), regardless of whether he elects COBRA coverage, (iii) a lump sum bonus equal to 50% of his target annual incentive (100% for Mr. Rees) and (iv) accelerated vesting of the unvested portion of all equity awards held by him. In the event that any of the payments or benefits under a named executive officer’s employment agreement, as amended, or otherwise would become subject to the Excise Tax, such payments or benefits will be (i) delivered in full, or (ii) reduced such that no portion of the payments or benefits will be subject to the Excise Tax, whichever is more favorable on an after tax basis to the named executive officer. With respect to Messrs. Rees and Harvison, if the named executive officer’s employment with us is terminated for any reason other than by us for cause prior to a public offering of our stock, we will provide him with loans for purposes of exercising certain vested stock options.
160
Table of Contents
Executive compensation
OUTSTANDING EQUITY AWARDS AT FISCAL YEAR-END
The following table presents certain information concerning equity awards held by our named executive officers at the end of the fiscal year ended December 31, 2015. Options granted to a named executive officer prior to the Spin-Off were granted by TFI during, and in connection with, the named executive officer’s employment with TFI. Such options were converted to options covering our common stock in connection with our separation from TFI on May 1, 2014, and have a grant date of May 1, 2014.
| Option awards(1) | ||||||||||||||||||||
| Name | Grant date |
Number of securities underlying unexercised options exercisable |
Number of securities underlying unexercised options unexercisable |
Option exercise price |
Option expiration date |
|||||||||||||||
| Kenneth E. Rees(2) |
5/1/2014 | (3) | 187,500 | — | $ | 2.12 | 3/15/2017 | |||||||||||||
| 5/1/2014 | (3) | 250,000 | — | 2.13 | 2/17/2021 | |||||||||||||||
| 11/21/2014 | (4) | 78,798 | 212,148 | 5.15 | 11/20/2024 | |||||||||||||||
| 6/19/2015 | (5) | — | 62,500 | 6.31 | 6/18/2025 | |||||||||||||||
| 6/19/2015 | (6) | — | 199,068 | 6.31 | 6/18/2025 | |||||||||||||||
| Jason Harvison |
5/1/2014 | (3) | 12,500 | — | 2.13 | 1/14/2020 | ||||||||||||||
| 5/1/2014 | (3) | 125,000 | — | 2.13 | 2/17/2021 | |||||||||||||||
| 12/12/2014 | (7) | 6,250 | 18,750 | 5.15 | 12/11/2024 | |||||||||||||||
| 2/20/2015 | (9) | — | 70,188 | 5.59 | 2/19/2025 | |||||||||||||||
| 6/19/2015 | (5) | — | 37,500 | 6.31 | 6/18/2025 | |||||||||||||||
| 6/19/2015 | (6) | — | 68,173 | 6.31 | 6/18/2025 | |||||||||||||||
| Christopher Lutes |
5/1/2014 | (3)(8) | 225,000 | — | 2.12 | 1/14/2017 | ||||||||||||||
| 5/1/2014 | (3)(8) | 50,000 | — | 2.13 | 1/14/2020 | |||||||||||||||
| 5/1/2014 | (3)(8) | 125,000 | — | 2.13 | 2/17/2021 | |||||||||||||||
| 6/19/2015 | (5) | — | 31,250 | 6.31 | 6/18/2025 | |||||||||||||||
| (1) | Options granted to a named executive officer prior to the Spin-Off were granted by TFI during, and in connection with, the named executive officer’s employment with TFI, and were converted to options covering our common stock in connection with our separation from TFI on May 1, 2014. |
| (2) | Prior to the Spin-Off, Mr. Rees was granted an option by TFI during, and in connection with his employment with TFI, covering 204,000 shares of TFI. The option was converted to an option covering 204,000 shares of our common stock (prior to the 2.5-for-1 forward stock-split) in connection with our separation from TFI on May 1, 2014. Mr. Rees exercised the option in 2014, prior to December 31, 2014. As a result, the option is not reflected in this table. |
| (3) | 100% of the shares subject to the option were vested as of December 31, 2015. |
| (4) | 25% of the shares subject to the option vest on November 21, 2015, and 1/48 of the shares subject to the option vest monthly thereafter, subject to continued service with us on each such vesting date. 100% of the shares subject to the option vest upon our initial public offering, subject to continued service with us on such vesting date. |
| (5) | 25% of the shares subject to the option vest on June 19, 2016, and 1/48 of the shares subject to the option vest monthly thereafter, subject to continued service with us on such vesting date. |
| (6) | 25% of the shares subject to the option vest on June 19, 2016, and 1/48 of the shares subject to the option vest monthly thereafter on the first day of the month, subject to continued service with us on each such vesting date. 100% of the shares subject to the option vest upon our initial public offering, subject to continued service with us on such vesting date. |
| (7) | 25% of the shares subject to the option vest on December 12, 2015, and 1/48 of the shares subject to the option vest monthly thereafter, subject to continued service with us on each such vesting date. |
| (8) | Options granted to Mr. Lutes were granted by TFI during, and in connection with, his employment with TFI, and were converted to options covering our common stock in connection with our separation from TFI on May 1, 2014. |
| (9) | 25% of the shares subject to the option vest on February 20, 2016, and 1/48 of the shares subject to the option vest monthly thereafter, subject to continued service with us on each such vesting date. 100% of the shares subject to the option vest upon our initial public offering, subject to continued service with us on such vesting date. |
161
Table of Contents
Executive compensation
DIRECTOR COMPENSATION TABLE
The following table shows the compensation earned by our directors who are not named executive officers during the year ended December 31, 2015.
| Name | Fees Earned or Paid in Cash |
Option Awards |
Non-Equity Incentive Plan Compensation |
All Other Compensation(5) |
Total | |||||||||||||||
| Stephen B. Galasso |
$ | 161,375 | (1) | $ | — | (2) | — | $ | 19,596 | $ | 180,971 | |||||||||
| Robert L. Johnson |
— | — | (3) | — | — | — | ||||||||||||||
| Stephen Shaper |
69,750 | (1) | 98,750 | (4) | — | 21,802 | 190,302 | |||||||||||||
| (1) | The amount reported in the “fees earned or paid in cash” column represents fees paid to Mr. Galasso and Mr. Shaper, as the case may be, for services provided to us in each’s capacity as a director under a Director Agreement with us and a Services Agreement with us. The Director Agreement and the Services Agreement have been terminated. |
| (2) | As of December 31, 2015, Mr. Galasso held a stock option for 12,500 shares, 9,895 of which were vested and exercisable. |
| (3) | As of December 31, 2015, Mr. Johnson held a stock option for 62,500 shares, 50,782 of which were vested and exercisable. |
| (4) | As of December 31, 2015, Mr. Shaper held a stock option for 62,500 shares, 100% of which was vested and exercisable. |
| (5) | The amount reported in the “all other compensation” column represents reimbursements for business expenses. |
EMPLOYEE BENEFIT AND STOCK PLANS
2014 Equity Incentive Plan
The 2014 Plan was adopted by our Board of Directors on May 1, 2014, and approved by our stockholders on May 1, 2014.
The 2014 Plan provides for the grant of incentive stock options, within the meaning of Section 422 of the Code to our employees and any parent or subsidiary employees, and to employees of TFI and any parent or subsidiary of TFI, and for the grant of non-qualified stock options and restricted stock to our employees, directors, and consultants, any parent or subsidiary employees, directors, and consultants, and to employees, directors and consultants of TFI or any parent or subsidiary of TFI.
Our Board of Directors or a committee of our Board of Directors, which we refer to as the “administrator” in this description, administers the 2014 Plan. Subject to the provisions of the 2014 Plan, the administrator has the authority, in its discretion, to determine the fair market value of our common stock, to select the service providers to whom awards may be granted under the 2014 Plan, to determine the number of shares of common stock to be covered by each award granted under the 2014 Plan, to approve forms of award agreements for use under the 2014 Plan, to determine the terms and conditions, not inconsistent with the terms of the 2014 Plan, of any award granted thereunder, to institute and determine the terms and conditions of an exchange program under which outstanding awards may be exchanged for other awards and/or cash, transferred to a financial institution or other person or entity selected by the administrator, or under which the exercise price of options may be increased or decreased, to construe and interpret the terms of the 2014 plan and awards granted pursuant to the 2014 Plan, to prescribe, amend and rescind rules and regulations relating to the 2014 Plan, including rules and regulations relating to sub-plans established for the purpose of satisfying applicable foreign laws or for qualifying for favorable tax treatment under applicable foreign laws, to modify or amend each award (subject to the terms of the 2014 Plan), to allow participants to satisfy withholding tax obligations in a manner prescribed under the 2014 Plan, to authorize any person to execute on behalf of us any instrument required to effect the grant of an award previously granted by the administrator, to allow a participant to defer the receipt of the payment of cash or the delivery of shares of our common stock that otherwise would be due to such participant under an award, and to make all other determinations deemed necessary or advisable for administering the 2014 Plan.
162
Table of Contents
Executive compensation
The per share exercise price for the shares to be issued pursuant to the exercise of an option is determined by the administrator, but may be no less than 100% of the fair market value per share on the date of grant. In the case of an incentive stock option granted to an employee who owns stock representing more than 10% of the voting power of all classes of stock of us or any parent or subsidiary of us, the per share exercise price will be no less than 110% of the fair market value per share on the date of grant. Options may be granted with a per share exercise price of less than 100% of the fair market value per share on the date of grant pursuant to certain transactions in a manner consistent with applicable laws.
The term of an option will be no more than ten years from the date of grant. In the case of an incentive stock option granted to a participant who, at the time of grant, owns stock representing more than 10% of the total combined voting power of all classes of stock of us or any parent or subsidiary, the term will be five years from the date of grant or such shorter term as may be provided in the award agreement.
If a participant ceases to be a service provider, the participant may exercise his or her option within such period of time as is specified in the award agreement (but in no event later than the expiration of the term of such option and subject to certain minimum periods for participants residing in certain states) to the extent that the option is vested on the date of termination.
The 2014 Plan allows for the grant of restricted stock. Restricted stock awards are shares of our common stock that vest in accordance with terms and conditions established by the administrator. The administrator, in its sole discretion, may impose such restrictions on shares of restricted stock as it may deem advisable or appropriate. Shares of restricted stock that do not vest revert back to us.
Unless determined otherwise by the administrator, awards may not be sold, pledged, assigned, hypothecated, or otherwise transferred in any manner other than by will or by the laws of descent and distribution (subject to certain further restrictions for participants residing in certain states), and may be exercised, during the lifetime of the participant, only by the participant. Further, until we become subject to the reporting requirements of Section 13 or 15(d) of the Exchange Act, or after the administrator determines that it is, will, or may no longer be relying upon the exemption from registration under the Exchange Act as set forth in Rule 12h-1(f) promulgated under the Exchange Act, an option, or prior to exercise, the shares subject to the option, may not be pledged, hypothecated or otherwise transferred or disposed of, in any manner, including by entering into any short position, any “put equivalent position” or any “call equivalent position,” other than to (i) family members through gifts or domestic relations orders or (ii) to an executor or guardian of the participant upon the death or disability of the participant. Notwithstanding the foregoing sentence, the administrator, in its sole discretion, may determine to permit transfers to us or in connection with certain changes in control or other acquisition transactions involving us to the extent permitted by Rule 12h-1(f).
In the event that any dividend or other distribution (whether in the form of cash, shares of our common stock, other securities, or other property), recapitalization, stock split, reverse stock split, reorganization, merger, consolidation, split-up, spin-off, combination, repurchase, or exchange of our shares of common stock or other securities of ours, or other change in the corporate structure of us affecting our shares of common stock occurs, the administrator, in order to prevent diminution or enlargement of the benefits or potential benefits intended to be made available under the 2014 Plan, will adjust the number and class of shares of our common stock that may be delivered under the 2014 Plan and/or the number, class, and price of shares of our common stock covered by each outstanding award. In the event of the proposed dissolution or liquidation of us, the administrator will notify each participant as soon as practicable prior to the effective date of such proposed transaction. To the extent it has not been previously exercised, an award will terminate immediately prior to the consummation of such proposed action.
163
Table of Contents
Executive compensation
In the event of a merger or certain changes in control, each outstanding award will be treated as the administrator determines without a participant’s consent. In taking any such action, the administrator will not be obligated to treat all awards, all awards held by a participant, or all awards of the same type, similarly. Notwithstanding the foregoing, In the event that the successor corporation does not assume or substitute for an award (or portion thereof), the participant will fully vest in and have the right to exercise all of his or her outstanding options, including shares as to which such award would not otherwise be vested or exercisable, all restrictions on restricted stock will lapse, and, with respect to awards with performance-based vesting, all performance goals or other vesting criteria will be deemed achieved at 100% of target levels and all other terms and conditions met.
Our Board of Directors may at any time amend, alter, suspend or terminate the 2014 Plan. We will obtain stockholder approval of any plan amendment to the extent necessary and desirable to comply with applicable laws. Our 2014 Plan will automatically terminate on the tenth anniversary of the later of (a) effective date of the 2014 Plan, or (b) the earlier of the most recent Board or stockholder approval of an increase in the number of shares reserved for issuance under the 2014 Plan, unless we terminate it sooner.
As of December 31, 2015, we had reserved 5,931,250 shares of our common stock for issuance under the 2014 Plan. As of December 31, 2015, we had granted options to purchase 5,734,622 shares, options to purchase 1,664,425 of these shares had been exercised, options to purchase 120,472 shares have expired and returned to the pool, and as a result 317,100 of these shares remained available for future grant. The options to purchase 3,949,725 shares outstanding as of December 31, 2015 had a weighted-average exercise price of $3.81 per share. We intend to adopt a new stock incentive plan to become effective on the date of the completion of this offering. As a result, we will not grant any additional awards under the 2014 Plan following that date, and the 2014 Plan will terminate at that time. However, any outstanding awards granted under the 2014 Plan will remain outstanding, subject to the terms of the 2014 Plan and applicable agreements, until such outstanding awards are exercised (if applicable) or terminate or expire by their terms.
2016 Omnibus Incentive Plan (“2016 Plan”)
Our 2016 Plan was adopted by our Board of Directors on January 5, 2016 and approved by our stockholders thereafter. The 2016 Plan will become effective prior to the completion of this offering. The 2016 Plan will provide for the grant of incentive stock options, within the meaning of Section 422 of the Code, to our employees and any parent and subsidiary employees, and for the grant of non-qualified stock options, stock appreciation rights, restricted stock, restricted stock units, dividend equivalent rights, cash-based awards (including annual cash incentives and long-term cash incentives), and any combination thereof to our employees, directors, and consultants and to employees, directors, and consultants of certain affiliated entities.
In connection with this offering, we have reserved for issuance under the 2016 Plan shares of our common stock equal to the sum of: (i) 3,150,000 shares of common stock; and (ii) up to 4,264,223 shares of our common stock underlying awards granted under our 2014 Equity Incentive Plan and outstanding when the 2016 Plan becomes effective that are forfeited, canceled, or expire (whether voluntarily or involuntarily). In addition, the 2016 Plan provides for an annual increase to the number of shares of our common stock available for issuance thereunder on the first business day of each calendar year beginning with the calendar year following the calendar year in which the 2016 Plan becomes effective, equal to the lesser of (x) 2,800,000 shares, (y) 4.0 percent of the number of shares of our common stock outstanding as of the last day of the immediately preceding calendar year, and (z) a lesser number of shares determined by the administrator (as defined below).
164
Table of Contents
Executive compensation
Our Board of Directors or a committee of our Board of Directors, which we refer to as the “administrator” in this description, will administer the 2016 Plan. In the case of awards intended to qualify as “performance-based compensation” within the meaning of Section 162(m) of the Code, the administrator will consist of two or more “outside directors” within the meaning of Section 162(m) of the Code. The administrator will have the power to determine and interpret the terms and conditions of the awards, including, as applicable, the employees, directors, and consultants who will receive awards, the exercise price, the number of shares subject to each award, the vesting schedule and exercisability of the awards, the restrictions on transferability of awards, and the form of consideration payable upon exercise. The administrator also will have the authority to reduce the exercise price of any outstanding stock options and the base appreciation amount of any stock appreciation rights if the exercise price or base appreciation amount exceeds the fair market value of the underlying shares, and to cancel such options and stock appreciation rights in exchange for new awards, in each case without stockholder approval.
The 2016 Plan will allow for the grant of incentive stock options that qualify under Section 422 of the Code only to our employees and employees of any of our parents or subsidiaries. Non-qualified stock options may be granted to our employees and directors and those of certain of our affiliates. The per share exercise price of all options granted under the 2016 Plan must be equal to at least the per share fair market value of our common stock on the date of grant. The term of an incentive stock option may not exceed 10 years, except that with respect to any employee who owns more than 10% of the voting power of all classes of our outstanding stock or any parent or subsidiary corporation as of the grant date, the term must not exceed 5 years, and the exercise price must equal at least 110% of the fair market value on the grant date.
After the continuous service of an employee, director or consultant terminates, he or she may exercise his or her option, to the extent vested, for the period of time specified in the option agreement. However, an option may not be exercised later than the expiration of its term.
The 2016 Plan will allow for the grant of stock appreciation rights. Stock appreciation rights allow the recipient to receive the appreciation in the fair market value of our common stock between the date of grant and the exercise date. The administrator will determine the terms of stock appreciation rights, including when such rights become exercisable and whether to pay the increased appreciation in cash or with shares of our common stock, or a combination thereof, except that the base appreciation amount used to determine the cash or shares to be issued pursuant to the exercise of a stock appreciation right will be no less than 100% of the fair market value per share on the date of grant. After the continuous service of an employee, director or consultant terminates, he or she may exercise his or her stock appreciation right, to the extent vested, only to the extent provided in the stock appreciation right agreement.
The 2016 Plan will allow for the grant of restricted stock. Restricted stock awards are shares of our common stock that vest in accordance with terms and conditions, if any, established by the administrator. The administrator will determine the number of shares of restricted stock granted to any employee, director or consultant. The administrator may impose whatever conditions, if any, on vesting it determines to be appropriate. For example, the administrator may set restrictions based on the achievement of specific performance goals. Shares of restricted stock that do not vest are subject to our right of repurchase or forfeiture.
The 2016 Plan will allow for the grant of restricted stock units. Restricted stock units are awards that will result in payment to a recipient at the end of a specified period only if the vesting criteria established by the administrator, if any, are achieved or the award otherwise vests. The administrator may impose
165
Table of Contents
Executive compensation
whatever conditions, if any, to vesting, or restrictions and conditions, if any, to payment that it determines to be appropriate. The administrator may set restrictions based on the achievement of specific performance goals or on the continuation of service or employment. Payments of earned restricted stock units may be made, in the administrator’s discretion, in cash, with shares of our common stock or other securities, or a combination thereof.
The 2016 Plan also will allow for the grant of awards denominated in cash that may be settled in cash or shares of common stock, which may be subject to restrictions, as established by the administrator. Prior to the first stockholder meeting at which directors are to be elected to our Board of Directors that occurs after the close of the third calendar year following the calendar year in which this offering occurs, the maximum aggregate amount of cash that may be issued pursuant to awards under the 2016 Plan to employees who would otherwise be covered by Section 162(m) of the Code will be $80,000,000. Section 162(m) of the Code generally applies to a public company’s chief executive officer and its three other most highly compensated executive officers, other than its chief financial officer.
The administrator will determine the provisions, terms, and conditions of each award including vesting schedules, forfeiture provisions, form of payment (cash, shares, or other consideration) upon settlement of the award, payment contingencies, and satisfaction of any performance criteria. The performance criteria established by the administrator for any awards intended to qualify as “performance-based compensation” for purposes of Section 162(m) of the Code, will be one of, or combination of, the following: net earnings or net income (before or after taxes); earnings per share; revenues or sales (including net sales or revenue growth); net operating profit; return measures (including return on assets, net assets, capital, invested capital, equity, sales, or revenue); cash flow (including operating cash flow, free cash flow, cash flow return on equity, and cash flow return on investment); earnings before or after taxes, interest, depreciation, or amortization; gross or operating margins; productivity ratios; share price (including growth measures and total stockholder return); expense targets; margins; operating efficiency; market share; working capital targets and change in working capital; economic value added or EVA® (net operating profit after tax minus the sum of capital multiplied by the cost of capital); or net operating income. The performance criteria may be applicable to our company, our affiliates or any individual business units of our company or any affiliate and may be measured over any specified period, on an absolute basis or relative to a pre-established target, to previous years’ results or to a designated comparison group, in each case as specified by the administrator.
The 2016 Plan will allow for the transfer of awards under the 2016 Plan only (i) by will, (ii) by the laws of descent and distribution and (iii) for awards other than incentive stock options, to the extent authorized by the administrator to certain persons or entities. Only the recipient of an incentive stock option may exercise such award during his or her lifetime.
In the event of certain changes in our capitalization, to prevent enlargement of the benefits or potential benefits available under the 2016 Plan, the administrator will make adjustments to one or more of the number of shares that are covered by outstanding awards, the exercise or purchase price of outstanding awards, the numerical share limits contained in the 2016 Plan, and any other terms that the administrator determines require adjustment.
The 2016 Plan provides that in the event of certain corporate transactions, as such term is defined in the 2016 Plan, the portion of each outstanding award that is neither continued by us nor assumed or replaced by the successor entity or its parent will automatically terminate. In connection with a corporate transaction or change in control, as such term is defined in the 2016 Plan, the administrator has the authority to provide for the full or partial automatic vesting and exercisability of one or more
166
Table of Contents
Executive compensation
outstanding unvested awards under the 2016 Plan and the release from restrictions on transfer or forfeiture rights of such awards on such terms and conditions as the administrator may specify. In addition, any incentive stock option accelerated in connection with a corporate transaction or change in control will remain exercisable as an incentive stock option to the extent the dollar limitation under the Code is not exceeded, with any excess becoming a nonqualified stock option.
The 2016 Plan will automatically terminate 10 years following the date it becomes effective, unless we terminate it sooner. In addition, our Board of Directors has the authority to amend, suspend or terminate the 2016 Plan provided such action does not impair the rights under any outstanding award.
2016 Employee Stock Purchase Plan (“ESPP”)
The ESPP was adopted by our Board of Directors in January 2016 and will become effective prior to the completion of this offering and will enable eligible employees of ours and designated affiliates to purchase shares of our common stock at a discount following its effectiveness. In this description, we sometimes refer to an eligible employee’s right to purchase shares of our common stock under the ESPP as an “option”. Purchases will be accomplished through participation in discrete offering periods. The ESPP is intended to qualify as an employee stock purchase plan under Section 423 of the Code. We initially reserved 525,000 shares of our common stock for issuance under the ESPP. In addition, the ESPP provides for an annual increase to the number of shares of our common stock available for issuance thereunder on the first business day of each calendar year beginning with the calendar year following the calendar year in which the ESPP becomes effective, equal to the lesser of (x) 700,000 shares, (y) 1.0 percent of the number of shares of our common stock outstanding as of the last day of the immediately preceding calendar year, and (z) a lesser number of shares determined by the administrator (as defined below).
Our Board of Directors or a committee designated by the board, which we refer to as the “administrator” in this description, will administer the ESPP. Our employees generally are eligible to participate in the ESPP (except for employees (i) whose customary employment is 20 hours or less per week, (ii) whose customary employment is for not more than 5 months in any calendar year, (iii) who have not been employed for such continuous period as the administrator may require (up to a maximum of 2 years), or (iv) who are citizens or residents of a non-US jurisdiction under certain circumstances, although the administrator may permit such categories of employees to participate in the ESPP in its discretion). Employees who are 5% stockholders, or would become 5% stockholders as a result of their participation in the ESPP, are ineligible to participate in the ESPP. We may impose additional restrictions on eligibility. Under the ESPP, eligible employees generally will be able to acquire shares of our common stock by accumulating funds through payroll deductions. Our eligible employees will be able to select a rate of payroll deduction between 1% and 15% of their eligible compensation.
When an offering period commences, our employees who meet the eligibility requirements and wish to participate in the ESPP will be required to enroll in a timely manner. Once an employee is enrolled, participation will be automatic in subsequent offering periods. An employee’s participation automatically ends upon termination of employment for any reason.
It is anticipated that the offering periods will be for six months. The duration of the first offering period may be shorter or longer.
No participant will have the right to purchase our shares in an amount, when aggregated with purchase rights under all our employee stock purchase plans that are also in effect in the same calendar year(s),
167
Table of Contents
Executive compensation
that has a fair market value of more than $25,000, determined as of the first day of the applicable offering period, for each calendar year in which that right is outstanding. In addition, no participant will be permitted to purchase more than 1,250 shares during any one offering period or such lesser amount determined by the administrator. The purchase price for shares of our common stock purchased under the ESPP may be as low as 85% of the lower of the fair market value of our common stock on the first trading day of the applicable offering period or the last trading day of the applicable offering period.
In the event of certain corporate transactions (as defined in the ESPP), each option will be assumed by the successor corporation or a parent or subsidiary of the successor corporation, unless the administrator determines to shorten the offering period then in progress, in which case the options will either be exercised automatically or we will pay the option holder an amount equal to the excess, if any, of (x) the fair market value of the shares subject to the options over (y) the purchase price due had the options been exercised automatically.
The ESPP will terminate on the 10th anniversary of its adoption by our Board of Directors, unless it is terminated earlier by the administrator. The administrator may at any time and for any reason terminate or amend the ESPP. Except in connection with certain corporate transactions or changes in capitalization, no such termination can adversely affect options previously granted, provided that the ESPP may be terminated by the administrator under certain circumstances if the administrator determines that the termination of the ESPP or one or more offering periods is in our best interests or in the best interests of our stockholders. Except as described in the previous sentence, or in connection with certain corporate transactions or changes in capitalization, no amendment may make any change in any option theretofore granted which adversely affects the rights of any participant without the consent of affected participants. To the extent necessary to comply with Section 423 of the Code (or any successor rule or provision or any other applicable law), we will obtain stockholder approval of any amendment in such a manner and to such a degree as required.
401(k) plan
We maintain a tax-qualified retirement plan, or our 401(k) plan, that provides eligible employees with an opportunity to save for retirement on a tax-advantaged basis. Eligible employees are able to participate in our 401(k) plan as of the first day of the month following the date they meet our 401(k) plan’s eligibility requirements, and participants are able to defer up to 100% of their eligible compensation subject to applicable annual Code limits. All participants’ interests in their deferrals are 100% vested when contributed. Our 401(k) plan permits us to make matching contributions and discretionary contributions to eligible participants. We make a safe harbor matching contribution equal to 100% of the first 4% of an eligible employee’s eligible compensation, and the eligible employee is 100% vested in such contribution when made.
Pension benefits
Aside from our 401(k) Plan, we do not maintain any pension plan or arrangement under which our named executive officers are entitled to participate or receive post-retirement benefits.
Nonqualified deferred compensation
We do not maintain any nonqualified deferred compensation plans.
168
Table of Contents
Executive compensation
Health and welfare plans
Our named executive officers are eligible to participate in our health and welfare employee benefit plans, including our medical, dental, vision, group life and accidental death and dismemberment insurance plans, and short-term and long-term disability insurance plans, on the same basis as all of our other US employees.
Limitations on liability and indemnification matters
The amended and restated certificate of incorporation that we expect to adopt, which will become effective upon the closing of this offering, limits the liability of our directors to the fullest extent permitted by Delaware law as presently in existence or as may be amended from time to time. Our directors will not be personally liable for monetary damages for breach of their fiduciary duties as directors, except liability for any of the following acts:
| Ø | any breach of their duty of loyalty to the corporation or its stockholders; |
| Ø | acts or omissions not in good faith or which involve intentional misconduct or a knowing violation of law; |
| Ø | unlawful payments of dividends or unlawful stock repurchases or redemptions; or |
| Ø | any transaction from which the director derived an improper personal benefit. |
These limitations of liability do not apply to liabilities arising under federal securities laws and do not affect the availability of equitable remedies such as injunctive relief or rescission.
The amended and restated bylaws that we expect to adopt, which will become effective upon the closing of this offering, provide that we will indemnify our directors, officers, employees and other agents to the fullest extent permitted by Delaware law or other applicable law. The amended and restated bylaws that we expect to adopt also permit us to secure insurance on behalf of any officer, director, employee or other agent for us, or anybody serving at our request as a director, officer, employee or agent of another corporation, partnership, joint venture, trust or other enterprise for any liability asserted against such person and incurred by such person in any such capacity, or arising out of such person’s status as such, regardless of whether we have the power to indemnify such person against such liability under the provisions of Delaware law. We expect to obtain an insurance policy that insures our directors and officers against certain liabilities, including liabilities arising under applicable securities laws.
We also plan to enter into separate indemnification agreements with our directors and executive officers, in addition to the indemnification provided for in the amended and restated bylaws that we plan to adopt. These agreements, among other things, provide that we will indemnify our directors and executive officers for certain expenses, including attorneys’ fees, judgments, penalties, fines and settlement amounts incurred by a director or executive officer in any action or proceeding arising out of their services as one of our directors or executive officers, or any of our subsidiaries or any other company or enterprise to which the person provides services at our request. The indemnification agreements also set forth certain procedures that will apply in the event of a claim for indemnification thereunder.
169
Table of Contents
Certain relationships and related party transactions
In addition to the director and executive officer compensation arrangements and indemnification arrangements discussed above in the sections titled “Management” and “Executive compensation” and the registration rights described in “Description of capital stock—Registration Rights,” the following is a description of each transaction since the Spin-Off when we started operations, and each currently proposed transaction in which:
| Ø | we have been or are to be a participant; |
| Ø | the amount involved exceeded or exceeds $120,000; and |
| Ø | any of our directors, executive officers or holders of more than 5% of our capital stock, or any immediate family member of or person sharing the household with any of these individuals, had or will have a direct or indirect material interest. |
The transactions below include those with TFI. On May 1, 2014, TFI contributed to Elevate certain net assets and liabilities associated with the direct lending and branded product businesses of TFI valued at approximately $246.1 million, based on the fair market value of the contributed businesses at the time, and distributed its interest in Elevate to its stockholders. See “Business—Our History.” Prior to the Spin-Off, we were a subsidiary of TFI; however, TFI currently does not hold any of our equity interests, and, other than the tax sharing agreement and sublease agreements detailed below, there are no ongoing contractual relationships between TFI and us.
Additionally, certain of our directors and executive officers have held or currently hold positions at TFI:
| Ø | Our Chief Executive Officer and Chairman, Kenneth E. Rees, was Chief Executive Officer of TFI until April 30, 2014 and Chairman of both TFI and Elevate until May 15, 2015. Mr. Rees is neither an employee nor a director of TFI. |
| Ø | Our Chief Financial Officer, Christopher Lutes, was Chief Financial Officer of TFI from 2007 until October 2014 and Assistant Chief Financial Officer of TFI from October 2014 until January 2015. In January 2015, Mr. Lutes became our Chief Financial Officer. Mr. Lutes is neither an employee nor a director of TFI. |
| Ø | Our Chief Credit Officer, Walt Ramsey, previously served as Chief Risk Officer of TFI until 2014. Mr. Ramsey is currently neither an employee nor a director of TFI. |
| Ø | Jason Harvison, who is currently our Chief Operating Officer and a director, was previously our Chief Financial Officer from the time of the Spin-Off until Mr. Lutes’ appointment to such position, also served as a member of the board of directors of TFI until August 21, 2015. Mr. Harvison is neither an employee nor a director of TFI. |
| Ø | Tyler Head, a member of our Board of Directors, also served as a member of the board of directors of TFI until August 21, 2015. Mr. Head is neither an employee nor a director of TFI. |
| Ø | Stephen J. Shaper, another member of our Board of Directors, currently serves as a director on the board of TFI. |
None of our other directors or executive officers is currently an employee or director of TFI.
170
Table of Contents
Certain relationships and related party transactions
SPIN-OFF AGREEMENTS WITH TFI
Separation and distribution agreement
In connection with the Spin-Off, on May 1, 2014, we and TFI entered into the separation and distribution agreement, which sets forth the key provisions relating to the separation of our business from TFI’s other business lines.
Treatment of assets and liabilities
The separation and distribution agreement described the assets and liabilities that were transferred to us and those that remained with TFI. Included in the assets that were contributed to us in the Spin-Off was certain consumer lending software known as the IQ Technology Platform. On January 1, 2015, our subsidiary, Elevate Decision Sciences, LLC, entered into an intellectual property assignment agreement with TC Decision Sciences, LLC, a subsidiary of TFI, pursuant to which an undivided co-ownership interest was granted to TC Decision Sciences, LLC, in the IQ Technology Platform, in exchange for the payment of a portion of the development costs for such software. As a result of this agreement, TC Decision Sciences, LLC, has the unrestricted right to make any use of the IQ Technology Platform without further obligation to Elevate Credit, Inc. On September 30, 2015, we entered into an amendment to this agreement to clarify the scope of the co-owned subject matter and to add Think Finance, Inc. and Elevate Credit, Inc. as parties to the agreement.
Distribution of stock
The separation and distribution agreement also described the terms of TFI’s distribution of all of our then outstanding shares to TFI’s stockholders in the number of whole shares of our common and preferred stock that is equal to the respective number of shares of TFI common and preferred stock held by each relevant TFI stockholder. Certain of such TFI stockholders were or are members of our directors, executive officers or holders of more than 5% of our capital stock. The below table describes the distribution of Elevate common stock, Series A Preferred Stock and Series B Preferred Stock to such stockholders (including holders of more than 5% of our capital stock that became such holders due to such initial distribution) in connection with the Spin-Off.
| Stockholder | Common stock | Series A preferred stock(1) |
Series B preferred stock(1) |
|||||||||
| Named executive officers and directors: |
||||||||||||
| Kenneth E. Rees(2) |
718,377 | 235,622 | — | |||||||||
| John C. Dean(3) |
275,025 | 80,880 | — | |||||||||
| Tyler Head(4) |
3,180,927 | — | — | |||||||||
| Stephen J. Shaper(5) |
80,230 | — | — | |||||||||
| Michael L. Goguen(6) |
37,772 | 5,661,765 | 1,676,470 | |||||||||
| John C. Rosenberg(7) |
37,770 | 938,232 | 5,029,407 | |||||||||
| 5% holders(8): |
||||||||||||
| 7HBF No. 2 Ltd. |
3,973,240 | 61,050 | — | |||||||||
| Linda Stinson(9) |
2,698,700 | 91,577 | — | |||||||||
| Affiliates of Sequoia Capital(6) |
37,772 | 5,661,765 | 1,676,470 | |||||||||
| Affiliates of Technology Crossover Ventures(7) |
37,770 | 938,232 | 5,029,407 | |||||||||
| (1) | Series A and Series B Preferred Stock are convertible into shares of our common stock on a one-for-one basis. The share amounts in the table above give effect to the 2.5-for-1 forward stock split. |
| (2) | Kenneth E. Rees is our chief executive officer and Chairman of our Board of Directors. |
(footnotes continued on following page)
171
Table of Contents
Certain relationships and related party transactions
| (3) | John C. Dean is a member of our Board of Directors. Consists of shares held by Startup Capital Ventures, L.P., of which Mr. Dean is the managing partner. |
| (4) | Tyler Head is a member of our Board of Directors. Consists of shares held by The Tyler W.K. Head Trust dated March 20, 2014, a voting trust of which Mr. Head is the voting trustee. |
| (5) | Stephen J. Shaper is a member of our Board of Directors. |
| (6) | Michael Goguen was a member of our Board of Directors and a partner at Sequoia Capital. He was removed from the Board of Directors on March 11, 2016 pursuant to the terms of our current certificate of incorporation and the investors’ rights agreement entered into between us and the holders of our Series A Preferred Stock and Series B Preferred Stock. Consists solely of holdings of affiliates of Sequoia Capital for which shares are aggregated for purposes of reporting share ownership information and which received shares of our common or preferred stock, as applicable, comprising Sequoia Capital Growth Fund III, L.P., Sequoia Capital Entrepreneurs Annex Fund, L.P., Sequoia Capital Franchise Fund, L.P., Sequoia Capital Franchise Partners, L.P., Sequoia Capital Growth III Principals Fund, LLC, Sequoia Capital Growth Partners III, L.P. and Sequoia Capital IX, L.P. Mr. Goguen did not receive shares in his individual capacity. |
| (7) | John Rosenberg is a member of our Board of Directors and a general partner at Technology Crossover Ventures. Consists solely of holdings of affiliates of Technology Crossover Ventures for which shares are aggregated for purposes of reporting share ownership information and which received shares of our common or preferred stock, as applicable, comprising TCV Member Fund, L.P. and TCV V, L.P. Mr. Rosenberg did not receive shares in his individual capacity. |
| (8) | Based on 11,607,832 shares of common stock, 7,392,647 shares of Series A Preferred Stock and 6,705,877 shares of Series B Preferred Stock (in each case, giving effect to the 2.5-for-1 forward stock split), on a fully converted basis, outstanding immediately after the distribution pursuant to the terms of the separation and distribution agreement. |
| (9) | Includes 19,072 shares of our common stock held by The Stinson 2009 Grantor Retained Annuity Trust, dated May 1, 2009. |
Treatment of existing inter-company agreements
The separation and distribution agreement also provided for the termination without further liability of any and all agreements, arrangements, commitments or understandings, whether or not in writing, between TFI and us, except for (i) the separation and distribution agreement and ancillary agreements (and each other agreement or instrument expressly contemplated by the separation and distribution agreement or any ancillary agreement to be entered into by the parties to the separation and distribution agreement or members of their groups), (ii) any intercompany documented accounts payable or accounts receivable accrued as of the distribution date and (iii) any shared contracts (contracts for which both TFI and we are entitled to the rights and benefits thereof and assume a related portion of any liabilities thereunder) as set forth in the separation and distribution agreement. We and TFI each agreed to indemnify, defend and hold harmless the other party and its subsidiaries, and each of their respective directors, officers and employees, and each of their respective heirs, executors, successors and assigns, from any and all liabilities (as defined in the agreement) relating to, arising out of or resulting from, among other things, each of our respective businesses and liabilities, as applicable. The separation and distribution agreement also provided that we and TFI would each, as soon as reasonably practical, effect the transfer of the assets and liabilities being transferred in connection with the Spin-Off that had not yet been transferred as of the date of the Spin-Off.
Ancillary agreements
In connection with the Spin-Off, we, including certain members of our group, and TFI, including certain members of the TFI group, entered into various ancillary agreements, each as of May 1, 2014, to govern various interim relationships between us and TFI. Each ancillary agreement is summarized below.
Shared services agreement
Our wholly owned subsidiary, Elevate Credit Service, LLC, or “ECS,” entered into a shared services agreement with TFI’s wholly owned subsidiary, TC Loan Service, LLC, or “TCLS,” which detailed the continuation of certain services provided by each of TCLS and ECS to the other following the Spin-Off. Such services included human resource services, accounting and other finance services, facilities management, IT services, fraud and decisions services and operations services. Pursuant to the
172
Table of Contents
Certain relationships and related party transactions
agreement, we paid a total of $3.1 million in fees under the shared services agreement in accordance with the terms of the agreement, representing payment for services demonstrably attributable to or for the benefit of us and for our pro rata portion of the cost plus overhead of such other services based on the proportion of monthly revenues attributable to us to the total combined monthly revenues of the parties to the agreement and their respective affiliates. The term of the shared services agreement was six months from its effective date and expired in accordance with such terms on November 1, 2014.
Data sharing and support agreement
Our subsidiary, Elevate Decision Sciences, LLC, entered into a data sharing and support agreement with a subsidiary of TFI, TC Decision Sciences, LLC, to provide for the transition of their respective business operations after the Spin-Off, including through the sharing of data related to transferred products and fraud prevention, as well as the hosting of information, and which allowed for a continuity of services to their respective customers. Because the activities of the parties contemplated by the agreement mutually benefit both parties and their clients, and are further ancillary to the shared services agreement described above, which contemplates the payment of certain consideration, no separate or additional consideration was required pursuant to the data sharing and support agreement. The data sharing and support agreement expired by its terms as of December 31, 2014.
Data services letter agreement
Elevate Decision Sciences, LLC, entered into a data services letter agreement with TC Decision Sciences, LLC, and the Rise family of companies comprising all other parties thereto, which detailed the sharing of certain confidential information between the parties thereto for the purposes of fraud mitigation and prevention services and underwriting model validation and development. The data services letter agreement expired on December 31, 2014.
Elevate financing agreements
These agreements comprised a credit facility agreement in respect of a $75 million subordinated secured promissory note entered into by and between ECS, as borrower, us, as a guarantor, the other guarantors party thereto (each of which is subsidiary of ours), and TFI, as lender; a related subordinated pledge and security agreement with TFI as the secured party and such other parties as the obligors; and, a subordinated secured promissory note entered into by ECS.
Credit facility agreement
The credit facility agreement set forth the terms and conditions for the sale of the subordinated secured promissory note by ECS to TFI. The credit facility agreement terminated on January 1, 2015 following the payment in full on December 31, 2014 of the $24.8 million aggregate principal amount of the note then outstanding. During the period for which the note remained outstanding, we paid a total of $0.9 million in interest. Pursuant to the credit facility agreement, use of the proceeds received were limited to funding fees and expenses associated with the consummation of the transactions contemplated by the credit facility agreement, paying operating expenses and funding working capital and other general corporate purposes, and such proceeds could not be used to originate any consumer loans or other consumer credit products. The outstanding principal balance of the note was due in full on the maturity date, unless accelerated or prepaid in accordance with the agreement. Interest on the unpaid principal amount of the note during the time the note was outstanding was 8% per annum paid monthly in arrears. The interest rate upon the occurrence of an event of default was 10%. The maturity date of the credit facility agreement was the earlier of April 30, 2018 and such earlier date as the unpaid principal balance of the note becomes due and payable pursuant to the terms of the agreement and the note.
173
Table of Contents
Certain relationships and related party transactions
Subordinated pledge and security agreement
Pursuant to the subordinated pledge and security agreement, the assets of ECS and the guarantors, amounting to approximately $151.4 million at the Spin-Off, were pledged as collateral to secure the obligations of ECS. Upon the occurrence and continuation of an event of default, among other things, all voting and other rights of ECS and the guarantors over pledged companies, as applicable, will cease and become vested in TFI and all rights to distributions payable in respect of such pledged companies or other pledged equity collateral (which constitutes equity held by the obligors and, for the avoidance of doubt, excludes the equity securities issued by us) shall be paid or delivered to, or held for the benefit of, TFI. The subordinated pledge and security agreement was terminated on January 1, 2015 in connection with the payment of all obligations thereunder.
Subordinated secured promissory note
The subordinated secured promissory note was issued in an initial amount of $75 million, with a total amount drawn on the credit facility of $24.8 million, and was redeemed in full, with interest in the amount detailed above, on December 31, 2014.
Employee matters agreement
The employee matters agreement was entered into between TFI and us in order to detail certain employment arrangements with respect to employees of TCLS (a) transitioning to ECS and working exclusively for ECS and its affiliates or (b) staying at TCLS and working exclusively for TCLS and its affiliates or for both TCLS and ECS and their respective affiliates. Pursuant to the employee matters agreement, the definition of “service provider” in each of the TFI 2005 stock incentive plan and our 2014 equity incentive plan was amended to mean any officer, director, employee or consultant to either (i) TFI or its affiliates or (ii) us or our affiliates. Additionally, each holder of outstanding options to purchase common stock of TFI pursuant to the TFI 2005 stock incentive plan received an option to purchase an equal number of shares of our common stock pursuant to our equity incentive plan on an identical vesting schedule and expiration date as those received from TFI. Such options were granted on May 1, 2014, the effective date of the Spin-Off. Some such options were granted to our directors and executive officers. Additionally, TCLS’ executive bonus plan was amended such that each employee of TCLS who was transferred to ECS and had received an award continued to be eligible to receive any unpaid amounts under such award. See “Executive compensation.”
There are no outstanding obligations under the employee matters agreement.
Tax sharing agreement
The tax sharing agreement was entered into between TFI and us and generally states that (i) TFI shall pay any and all income taxes, transfer taxes and distribution taxes imposed on or payable by TFI or any of its subsidiaries (including members of our group) for any tax period and (ii) we shall pay any and all income taxes (but not any transfer or distribution taxes) imposed on or payable by any member of the Elevate group for any post-spin off tax period and any taxes other than income taxes, transfer taxes and distribution taxes imposed on or payable by any member of the Elevate group for any post-spin off tax period (subject to our covenant not to take any action inconsistent with our officer’s certificate, discussed in more detail below). Distribution taxes are any and all taxes imposed on or payable by us, TFI or any of its subsidiaries resulting from, or directly arising in connection with, the failure of the Spin-Off to qualify as tax free. Pursuant to the agreement, TFI will be responsible for, and shall indemnify, defend and hold harmless us and our indemnitees from and against all (i) TFI taxes for any tax period, subject to
174
Table of Contents
Certain relationships and related party transactions
certain limitations, (ii) transfer taxes and (iii) distribution taxes. Similarly, we will be responsible for, and shall indemnify, defend and hold harmless TFI and TFI’s indemnitees from and against all taxes that we shall pay, as described above. Notwithstanding the foregoing, if we take an action inconsistent with our officer’s certificate signed in connection with the Spin-Off prior to June 1, 2017, we may be responsible for all or a portion of any distribution taxes that arise as a consequence of such action. Following the close of the fiscal year ending December 31, 2017, we anticipate that we will no longer have any liability to TFI under the tax sharing agreement.
Stockholders agreements
The Series A and Series B Preferred Stock agreements summarized below were entered into on May 1, 2014. Each of the below agreements, which are in effect as of the date of this prospectus, will automatically terminate in connection with the closing of the offering contemplated by this prospectus, with the exception of the investors’ rights agreement, which we anticipate will be amended and restated as detailed below.
Investors’ rights agreement
We entered into an investors’ rights agreement with the holders of our Series A Preferred Stock and Series B Preferred Stock, which delineates the rights of such stockholders, including a right of first refusal exercisable in certain circumstances by certain major stockholders for the purchase of a pro rata portion of new securities issued by us with a related right of over-allotment, as well as the terms of the stock, including limits on transferability. The investors’ rights agreement also includes certain financial information and inspection rights and certain board observer rights provided to certain holders who are a party to such agreement. We anticipate that we will enter into an amended and restated investors’ rights agreement, which will be effective upon completion of this offering, which eliminates all substantive rights detailed below other than the registration rights of, and certain indemnification provisions relating to, the holders of our Series A and Series B Preferred Stock.
The investors’ rights agreement further includes registration rights for holders of our Series A and Series B Preferred Stock, applicable in certain circumstances and subject to certain limitations. Pursuant to the investors’ rights agreement, we will also, in certain circumstance, indemnify, to the extent permitted by law, each stockholder party, and each underwriter, if any, and certain other persons against claims arising in connection with any prospectus or other similar or incident document, or any violation or alleged violation of applicable securities laws, rules or regulations by us. Similarly, each such stockholder party will, if the registrable securities held by such stockholder party are included in the securities to be registered, indemnify us, each underwriter, if any, of our securities, each other stockholder party and certain other persons, against similar claims arising in connection with and to the extent made in reliance upon and in conformity with written information furnished by such stockholder and stated to be specifically for use in any such prospectus or document. Such registration rights are described in detail in “Description of capital stock—Registration Rights.”
Right of first refusal and co-sale agreement
We entered into a right of first refusal and co-sale agreement with the investors in our Series A Preferred Stock and investors in our Series B Preferred Stock listed in the schedules thereto and the holders listed in the schedules thereto, each of whom is also a holder of our common stock, Series A Preferred Stock and/or Series B Preferred Stock. The right of first refusal and co-sale agreement establishes certain procedures for the transfer of shares of our common stock and convertible securities and our rights in respect of such transfers. The right of first refusal and co-sale agreement, which is in effect as of the date of this prospectus, will automatically terminate in connection with the completion of this offering.
175
Table of Contents
Certain relationships and related party transactions
Voting agreement
The voting agreement was entered into by and among us, the investors in our Series A Preferred Stock and investors in our Series B Preferred Stock listed in the schedules thereto and the holders listed in the schedules thereto, each of whom is also a holder of our common stock, Series A Preferred Stock and/or Series B Preferred Stock. The agreement details the intention of the voting parties to maintain, as members of our Board of Directors, the director designees of certain holder entities as detailed in the agreement and further details certain voting arrangements of certain holders. The voting agreement, which is in effect as of the date of this prospectus, will automatically terminate in connection with the completion of this offering.
Management Rights Agreement
The management rights agreement was entered into by us and TCV V, L.P. This agreement provides certain managerial rights to TCV V, L.P., including the right to consult with and advise our management on significant business issues, including annual and quarterly operating plans, as well as certain examination rights and, for as long as a representative of TCV V, L.P., is not a member of our Board of Directors, certain observation and participation rights. The management rights agreement, which is in effect as of the date of this prospectus, will automatically terminate in connection with the completion of this offering.
SUBLEASE AGREEMENTS
We have leased and currently lease certain of our properties from TFI as detailed below.
California property
We rented approximately 3,300 square feet of office space as sublessee pursuant to a sublease agreement with TCLS dated May 1, 2014. Pursuant to the terms of the sublease, we paid TCLS $9,075 per month in base rent, as well as 100% of operating expenses allocated by the landlord to TCLS, such expenses per month are nominal. This leased expired on April 30, 2015. On July 13, 2015, we amended this sublease to extend the expiration date to April 30, 2019, and the monthly base rent amount increased to $9,339.
Fort Worth property
We rented approximately 42,244 square feet of office space from TCLS as sublessee pursuant to a sublease agreement also dated May 1, 2014. On December 1, 2014 and October 12, 2015, we amended this sublease to add an additional 3,233 and 8,785 square feet, respectively, of office space to the sublease. Following the amendments, we sublease an aggregate of 51,029 square feet of office space from TCLS. Pursuant to the terms of the sublease, we paid TCLS $63,366 per month in base rent, as well as 66.7235% of the common area operating expenses allocated by the landlord to TCLS, representing the pro rata portion of the space we sublease compared to the total space TCLS leases from the landlord, for the period from May 1, 2014 through November 30, 2014. Commencing on December 1, 2014, the base rent pursuant to the sublease increased to $67,946 per month; there was no change to the portion of the common area expenses for which we pay additional rent, such expenses are approximately $4,308 per month. On October 12, 2015, the base rent pursuant to the sublease increased to $84,821 per month with an increase in common area expenses representing the pro rata portion of the space we sublease. On May 22, 2015 the parties to the lease entered into a second amendment to the sublease extending its term. The terms of the sublease provide that the sublease will expire on August 31, 2016.
176
Table of Contents
Certain relationships and related party transactions
Addison property
We rented approximately 12,674 square feet of office space from TLCS as sublessee pursuant to a sublease agreement dated May 1, 2014. On December 1, 2014, we amended this sublease to add an additional 12,674 square feet of office space to the sublease, and extend the expiration date to August 31, 2018. Following the amendment, we sublease an aggregate of 25,348 square feet of office space from TCLS. Pursuant to the terms of the sublease, we paid TCLS $21,642 per month in base rent, as well as approximately $1,755 per month for common area operating expenses allocated by the landlord to TCLS, for the period from May 1, 2014 through November 30, 2014. Commencing on December 1, 2014, the base rent pursuant to the sublease increased to $43,283 per month, and common area operating expenses increased to approximately $3,284 per month. On May 22, 2015, the parties to the lease entered into a second amendment to the sublease extending its term. The terms of the sublease provide that the sublease will expire on September 30, 2018.
TRANSACTIONS WITH RLJ FINANCIAL LLC
On August 1, 2012, a subsidiary of TFI, TF Payroll, LLC, or “TFP,” as purchaser, and RLJ Financial LLC, or “RLJ,” as seller, entered into an asset purchase agreement, whereby TFP purchased from RLJ all assets, including intellectual property, goodwill and other intangible assets, related to RLJ’s consumer financial products and services business, including certain of RLJ’s payroll advance products and services. Affiliates of TFP and RLJ were previously parties to a referral and revenues sharing agreement, an administrative agency agreement and a guaranty, which were terminated in connection with the asset purchase agreement. TFP paid a total purchase price of $5 million. The asset purchase agreement also obligated TFP to make earn-out payments for a period of ten years after the closing in an amount equal to 10% of the net profits from payroll-linked credit products offered or operated by TFP, or an affiliate of TFP, involving data and information provided by payroll service providers or employers or payroll software providers. RLJ is majority owned by The RLJ Companies, LLC, or “The RLJ Companies.” Robert L. Johnson, our director, is the managing member, majority owner and sole voting member of The RLJ Companies. The net assets acquired pursuant to the August 1, 2012 asset purchase agreement were subsequently transferred to us in the Spin-Off. On June 1, 2015, we entered into a consulting agreement with RLJ, which calls for monthly payments for a period of five years, totaling $1.5 million. For the year ended December 31, 2015, we paid RLJ a total of $150,000 pursuant to the terms of the consulting agreement. As a part of the consulting agreement, RLJ agreed to release us from our legal obligation to make earn-out payments. In addition, during 2013, we paid RLJ $1.5 million towards certain marketing costs to be incurred on our behalf in connection with certain promotional efforts to be undertaken by Mr. Johnson and employees of The RLJ Companies.
DIRECTED SHARE PROGRAM
At our request, the underwriters have reserved up to 5% of the common stock being offered by this prospectus for sale at the initial public offering price to our directors, director nominees, officers, employees and other individuals associated with us and members of their families. The sales will be made by a selected dealer affiliated with an underwriter of this offering. These shares, if purchased, will be through a directed share program, as described in this prospectus, at the initial public offering price. We do not know if any eligible persons will choose to purchase all or any portion of these reserved shares, but any purchases they do make will reduce the number of shares available to the general public. Any reserved shares not so purchased will be offered by the underwriters to the general public on the same terms as the other shares of common stock. Any shares sold in the directed share program to our directors, director nominees or executive officers shall be subject to the lock-up agreements described in “Underwriting—No Sale of Similar Securities.”
177
Table of Contents
Certain relationships and related party transactions
POLICIES AND PROCEDURES FOR TRANSACTIONS WITH RELATED PERSONS
Following the closing of the offering contemplated by this prospectus, our Audit Committee will have the primary responsibility for reviewing and approving or disapproving “related party transactions,” which are transactions between us and related persons in which the aggregate amount involved exceeds or may be expected to exceed $120,000 and in which a related person has or will have a direct or indirect material interest. For purposes of this policy, a related person will be defined as a director, executive officer, nominee for director, or greater than 5% beneficial owner of our common stock, in each case since the beginning of the most recently completed year, and their immediate family members.
178
Table of Contents
The following table sets forth information regarding beneficial ownership of our common stock as of April 30, 2016, as adjusted to reflect the shares of common stock to be issued and sold by us in this offering, by:
| Ø | each person or group of affiliated persons known by us to be the beneficial owner of more than 5% of our common stock; |
| Ø | each of our named executive officers; |
| Ø | each of our directors; and |
| Ø | all of our executive officers and directors as a group. |
We have determined beneficial ownership in accordance with the rules of the SEC and the information is not necessarily indicative of beneficial ownership for any other purpose. Unless otherwise indicated below, to our knowledge, the persons and entities named in the table have sole voting and sole investment power with respect to all shares that they beneficially own, subject to community property laws where applicable. In computing the number of shares of our common stock beneficially owned by a person and the percentage ownership of that person, we deemed outstanding shares of our common stock subject to options held by that person that are currently exercisable or exercisable within 60 days of April 30, 2016. We did not deem these shares outstanding, however, for the purpose of computing the percentage ownership of any other person.
We have based percentage ownership of our common stock prior to this offering on 26,897,985 shares of our common stock outstanding as of April 30, 2016, assuming the conversion of all outstanding shares of our convertible preferred stock (prior to the 2.5-for-1 forward stock split) and the application of the 2.5-for-1 forward stock split to all common stock after such conversion. Percentage ownership of our common stock after this offering assumes the sale by us of 3,600,000 shares of common stock in this offering, assumes no exercise of the underwriters’ option to purchase an additional 540,000 shares of common stock from us and excludes any shares that might be purchased by the listed stockholders pursuant to the directed share program or otherwise in connection with this offering.
179
Table of Contents
Principal stockholders
Unless otherwise indicated, the address of each beneficial owner listed on the table below is c/o Elevate Credit, Inc., 4150 International Plaza, Suite 300, Fort Worth, Texas 76109.
| Shares beneficially owned |
Percentage of shares beneficially owned |
|||||||||||
| Name of beneficial owner | Number | Before offering |
After |
|||||||||
| 5% stockholders: |
||||||||||||
| Entities affiliated with Sequoia Capital(1) |
7,376,007 | 27.4 | 24.2 | |||||||||
| Entities affiliated with Technology Crossover Ventures(2) |
6,005,410 | 22.3 | 19.7 | |||||||||
| 7HBF No. 2, Ltd.(3) |
3,830,290 | 14.2 | 12.6 | |||||||||
| Linda Stinson |
2,702,275 | 10.0 | 8.9 | |||||||||
| Named executive officers and directors: |
||||||||||||
| Kenneth E. Rees(4) |
2,395,589 | 8.9 | 7.9 | |||||||||
| Jason Harvison(5) |
279,925 | 1.0 | * | |||||||||
| Christopher Lutes(6) |
400,000 | 1.5 | 1.3 | |||||||||
| John C. Dean(7) |
355,905 | 1.3 | 1.2 | |||||||||
| Stephen B. Galasso(8) |
62,500 | * | * | |||||||||
| Saundra D. Schrock(9) |
— | * | * | |||||||||
| Tyler Head(10) |
3,182,327 | 11.8 | 10.4 | |||||||||
| Robert L. Johnson(11) |
57,290 | * | * | |||||||||
| John C. Rosenberg(2) |
6,005,410 | 22.3 | 19.7 | |||||||||
| Stephen J. Shaper(12) |
142,730 | * | * | |||||||||
| All current executive officers and directors as a group (10 persons)(13) |
12,881,676 | 47.9 | 42.2 | |||||||||
| * | Represents beneficial ownership of less than 1%. |
| (1) | Consists of (i) 117,747 shares held by Sequoia Capital Franchise Partners, L.P., (ii) 905,760 shares held by Sequoia Capital IX, L.P., (iii) 37,735 shares held by Sequoia Capital Entrepreneurs Annex Fund, L.P., (iv) 5,142,718 shares held by Sequoia Capital Growth Fund III, L.P., (v) 251,850 shares held by Sequoia Capital Growth III Principals Fund, LLC, (vi) 863,505 shares held by Sequoia Capital Franchise Fund, L.P. and (vii) 56,692 shares held by Sequoia Capital Growth Partners III, L.P. SCFF Management, LLC, or “SCFF Management,” is the general partner of Sequoia Capital Franchise Fund L.P. and Sequoia Capital Franchise Partners, L.P., collectively, the “FF Funds.” The managing members of SCFF Management are Douglas M. Leone, Michael J. Moritz and Mark Stevens. As a result, and by virtue of the relationships described in this footnote, each of the managing members of SCFF III Management, LLC may be deemed to share beneficial ownership of the shares held by the FF Funds. SC IX.I Management, LLC is the General Partner of each of Sequoia Capital IX, L.P. and Sequoia Capital Entrepreneurs Annex Fund, L.P., collectively, the “IX Funds.” The managing members of SC IX.I Management, LLC are Douglas M. Leone, Michael J. Moritz and Mark Stevens. As a result, and by virtue of the relationships described in this footnote, each of the managing members of SC IX.I Management, LLC may be deemed to share beneficial ownership of the shares held by the IX Funds. SCGF III Management, LLC is the general partner of Sequoia Capital Growth Partners III, L.P. and Sequoia Capital Growth Fund III, L.P. and is the managing member of Sequoia Capital Growth III Principals Fund, LLC, collectively, the “GFIII Funds.” The managing members of SCGF III Management, LLC are Roelof Botha, James J. Goetz, Douglas M. Leone and Michael J. Moritz. As a result, and by virtue of the relationships described in this footnote, each of the managing members of SCGF III Management, LLC may be deemed to share beneficial ownership of the shares held by the GFIII Funds. The address for each of the entities identified in this footnote is 2800 Sand Hill Road, Suite 101, Menlo Park, California 94025. |
(footnotes continued on following page)
180
Table of Contents
Principal stockholders
| (2) | Consists of (i) 116,780 shares held by TCV Member Fund, L.P. and (ii) 5,888,630 shares held by TCV V, L.P. Jay C. Hoag, Richard H. Kimball, John L. Drew and Jon Q. Reynolds, Jr., collectively, the “TCM Members,” are Class A Members of Technology Crossover Management V, L.L.C., or “TCM V,” which is the general partner of TCV V, L.P., or “TCV V,” and a general partner of TCV Member Fund, L.P., or “Member Fund,” and together with TCV V, the “TCV Funds.” John C. Rosenberg is an Assignee of TCM V but does not share voting or dispositive power over the shares held by TCV V or Member Fund. Mr. Rosenberg, the TCM Members and TCM V may be deemed to beneficially own the securities held by the TCV Funds, but each of Mr. Rosenberg, the TCM Members and TCM V disclaim beneficial ownership of such securities except to the extent of their pecuniary interest therein. The TCV Funds are organized as “blind pool” partnerships in which the limited partners (or equivalents) have no discretion over investment or sales decisions, are not able to withdraw from the TCV Funds, except under exceptional circumstances, and generally participate ratably in each investment made by the TCV Funds. The address for each of the entities identified in this footnote is c/o Technology Crossover Ventures, 528 Ramona Street, Palo Alto, California 94301. |
| (3) | 7HBF Management Co., Ltd. is the general partner of 7HBF No. 2, Ltd. John D. Harvison is a manager of 7HBF Management Co., Ltd. The address for this entity is 5070 Mark IV Parkway, Fort Worth, Texas 76106. |
| (4) | Consists of (i) 924,495 shares held by Kenneth Earl Rees Family Investments, Ltd., (ii) 924,492 shares held by Jeanne Margaret Gulner Family Investments, Ltd. and (iii) 546,602 shares subject to options exercisable within 60 days of April 30, 2016. Mr. Rees is the spouse of Jeanne M. Gulner and may be deemed by the SEC under Rule 13d-3 of the Exchange Act to have shared voting power and shared power to dispose of shares held directly or indirectly by Jeanne M. Gulner. |
| (5) | Includes 168,285 shares subject to options exercisable within 60 days of April 30, 2016. |
| (6) | Consists of 400,000 shares subject to options exercisable within 60 days of April 30, 2016. |
| (7) | Consists of shares held of record by Startup Capital Ventures, L.P., of which Mr. Dean is the managing partner. |
| (8) | Includes 12,500 shares subject to options exercisable within 60 days of April 30, 2016. |
| (9) | Ms. Schrock joined our Board of Directors on May 10, 2016. |
| (10) | Consists of (i) 3,180,927 shares held by The Tyler W.K. Head Trust dated March 20, 2014, a voting trust of which Mr. Head is the voting trustee, and (ii) 1,400 shares held by Hannah Stinson Head. Mr. Head is the spouse of Hannah Stinson Head and may be deemed by the SEC under Rule 13d-3 of the Exchange Act to have shared voting power and shared power to dispose of shares held by Hannah Stinson Head. |
| (11) | Consists of 57,290 shares subject to options exercisable within 60 days of April 30, 2016. |
| (12) | Includes 62,500 shares subject to options exercisable within 60 days of April 30, 2016. |
| (13) | Represents 11,634,499 shares and 1,247,177 shares subject to options exercisable within 60 days of April 30, 2016. |
181
Table of Contents
GENERAL
The following description summarizes the most important terms of our capital stock, as they are expected to be in effect upon the completion of this offering. We expect to adopt an amended and restated certificate of incorporation and amended and restated bylaws in connection with the completion of this offering, and this description summarizes the provisions that are expected to be included in such documents. We also expect to enter into an amended and restated investors’ rights agreement, which will be effective upon the completion of this offering, which will eliminate all substantive rights provided to the current holders of our Series A and Series B Preferred Stock other than the registration rights of, and certain indemnification provisions relating to, such holders. This description summarizes the provisions that we expect will be in effect under such amended and restated investors’ rights agreement upon consummation of this offering. See “Certain relationships and related party transactions—Spin-Off Agreements with TFI—Stockholder agreements—Investors’ rights agreement” for further information regarding the amended and restated investors’ rights agreement into which we expect to enter.
This summary does not purport to be complete and is qualified in its entirety by the provisions of our amended and restated certificate of incorporation, amended and restated bylaws and amended and restated investors’ rights agreement, which will be available once adopted. For a complete description of our capital stock, you should refer to our amended and restated certificate of incorporation, amended and restated bylaws and amended and restated investors’ rights agreement that, upon adoption, will be included as exhibits to the registration statement of which this prospectus forms a part and to the applicable provisions of Delaware law.
Upon the completion of this offering, our authorized capital stock will consist of 324,500,000 shares, with a par value of $0.0004 per share, of which:
| Ø | 300,000,000 shares will be designated common stock; and |
| Ø | 24,500,000 shares will be designated preferred stock. |
As of March 31, 2016, and after giving effect to the conversion of all of our outstanding convertible preferred stock into 5,639,410 shares (prior to the 2.5-for-1 forward stock split) of common stock upon completion of this offering, there were outstanding:
| Ø | 26,897,985 shares of our common stock held by approximately 43 stockholders; and |
| Ø | 3,997,278 shares issuable upon the exercise of outstanding stock options. |
Our Board of Directors is authorized, without stockholder approval, to issue additional shares of our capital stock.
COMMON STOCK
Dividend rights
Subject to preferences that may be applicable to any then outstanding preferred stock and the prior consent of VPC, holders of our common stock are entitled to receive dividends, if any, as may be declared from time to time by our Board of Directors out of legally available funds. We have never declared or paid cash dividends on any of our capital stock and currently do not anticipate paying any cash dividends after this offering or in the foreseeable future.
182
Table of Contents
Description of capital stock
Voting rights
Each holder of our common stock is entitled to one vote for each share on all matters submitted to a vote of the stockholders, including the election of directors. Our stockholders do not have cumulative voting rights in the election of directors. Accordingly, holders of a majority of the voting shares are able to elect all of the directors. Our amended and restated certificate of incorporation that we expect to be in effect upon the completion of this offering establishes a classified Board of Directors, to be divided into three classes with staggered three-year terms. Only one class of directors will be elected at each annual meeting of our stockholders, with the other classes continuing for the remainder of their respective three-year terms.
No preemptive or similar rights
Holders of our common stock have no preemptive, conversion, subscription or other rights, and there are no redemption or sinking fund provisions applicable to our common stock. The rights, preferences and privileges of the holders of our common stock are subject to and may be adversely affected by, the rights of the holders of shares of any series of our preferred stock that we may designate in the future.
Right to receive liquidation distributions
In the event of our liquidation, dissolution or winding up, holders of our common stock will be entitled to share ratably in the net assets legally available for distribution to stockholders after the payment of all of our debts and other liabilities and the satisfaction of any liquidation preference granted to the holders of any then outstanding shares of preferred stock.
PREFERRED STOCK
All of our currently outstanding shares of convertible preferred stock will automatically convert into common stock, effective upon the completion of this offering. All series of convertible preferred stock will convert at a ratio of one share of common stock for each share of convertible preferred stock.
Following the completion of this offering, our Board of Directors will have the authority, without further action by our stockholders, to issue up to 24,500,000 shares of preferred stock in one or more series and to fix the rights, preferences, privileges and restrictions thereof. These rights, preferences and privileges could include dividend rights, conversion rights, voting rights, terms of redemption, liquidation preferences, sinking fund terms and the number of shares constituting any series or the designation of such series, any or all of which may be greater than the rights of common stock. The issuance of preferred stock by us could adversely affect the voting power of holders of common stock and the likelihood that such holders will receive dividend payments and payments upon liquidation. The issuance of preferred stock, while providing flexibility in connection with possible acquisitions and other corporate purposes, could, among other things, have the effect of delaying, deferring or preventing a change in control of our company and might adversely affect the market price of our common stock and the voting and other rights of the holders of our common stock. Upon the completion of this offering, no shares of preferred stock will be outstanding, and we have no present plan to issue any shares of preferred stock.
183
Table of Contents
Description of capital stock
STOCK OPTIONS
As of March 31, 2016, we had outstanding options to purchase 3,997,278 shares of our common stock, with a weighted-average exercise price of $3.90 per share.
REGISTRATION RIGHTS
After the completion of this offering, the holders of an aggregate of 14,098,525 shares of our common stock, or their permitted transferees, will be entitled to rights with respect to the registration of such shares under the Securities Act. We refer to these shares as registrable securities. These rights are provided under the terms of the amended and restated investors’ rights agreement that we intend to enter into between us and the holders of registrable securities and include demand registration rights, piggyback registration rights and Form S-3 registration rights.
Demand registration rights
Under the amended and restated investors’ rights agreement that we intend to enter into, upon the written request of the holders of 40% or more of our registrable securities that we file a registration statement under the Securities Act with an anticipated aggregate price to the public of at least $5 million (net of underwriters’ discounts and selling expenses), we will be obligated to notify all holders of registrable securities of the written request and use commercially reasonable efforts to effect the registration of all registrable securities that holders request to be registered. We are not required to effect a registration statement (i) until 180 days after our initial public offering or April 30, 2018, whichever is earlier, (ii) if we have already effected more than two registration statements, counting for these purposes only registrations which have been declared or ordered effective and pursuant to which securities have been sold and forfeited demand registrations subject to certain conditions, (iii) during the period 60 days prior to, and 180 days after the effective date of, the filing of a registration initiated by us, or (iv) if the initiating holders propose to dispose of registrable securities that may be immediately registered on Form S-3 under the Securities Act. We may postpone the filing of a registration statement for up to 90 days once in a 12-month period if in the good-faith judgment of our Board of Directors such registration would be detrimental to us, provided that we do not register any securities for our account or that of any other stockholder during such 90-day period other than with respect to a registration related to a company stock plan or a registration related to a transaction under Rule 145 of the Securities Act.
Piggyback registration rights
If we register any of our securities for public sale, we are required use commercially reasonable efforts to afford each holder of registrable securities an opportunity to include in the registration statement all or part of the holder’s registrable securities. As a result, whenever we propose to file a registration statement under the Securities Act, other than with respect to a registration related to a company stock plan, a registration relating to the offer and sale of debt securities, a registration related to a transaction under Rule 145 of the Securities Act or a registration on any registration form that does not period secondary sales, the holders of these shares are entitled to notice of the registration and have the right to include their shares in the registration.
Each holder desiring to include all or any part of the registrable securities held by it in any such registration statement is required to notify us within 20 days of being notified by us of the registration. The underwriter of any underwritten offering will have the right to limit, due to marketing reasons, the number of shares registered by these holders to 25% of the total shares covered by the registration statement, unless the offering is our initial public offering and the registration statement does not include
184
Table of Contents
Description of capital stock
shares of any other selling stockholders, in which event any or all of the registrable securities of the holders may be excluded by the underwriter. The holders of registrable securities waived their registration rights to participate in this offering.
Form S-3 registration rights
The holders of registrable securities may make a written request that we register all or a portion of their shares on Form S-3 if we are eligible to file a registration statement on Form S-3 and the aggregate price to the public of the shares offered is at least $1.0 million. We are not required to effect such registration (i) until 180 days after our initial public offering or April 30, 2018, whichever is earlier, (ii) during the period 60 days prior to, and 180 days after the effective date of, the filing of a registration initiated by us, or (iii) if, in a given 12-month period, we have already effected more than two such registrations. We may postpone the filing of a registration statement for up to 90 days once in a 12-month period if in the good-faith judgment of our Board of Directors such registration would be detrimental to us, provided that we do not register any securities for our account or that of any other stockholder during such 90-day period other than with respect to a registration related to a company stock plan or a registration related to a transaction under Rule 145 of the Securities Act.
Registration expenses
We will pay the registration expenses (other than underwriting discounts and commissions) in connection with the registrations described above, including the reasonable fees and disbursements of one counsel for participating holders of registrable securities.
Expiration of registration rights
Under the amended and restated investors’ rights agreement that we intend to enter into, the registration rights described above will survive our initial public offering and will terminate after our initial public offering upon the earlier of:
| Ø | five years after the closing this offering; and |
| Ø | as to each holder of registrable securities, the date on or after the closing of this offering on which (x) all shares of registrable securities held by such holder may immediately be sold under Rule 144 under the Securities Act or (y) such holder of registrable securities holds 1% or less of our then-outstanding common stock and all registrable securities held by such holder (together with any affiliate of the holder with whom such holder must aggregate its sales under Rule 144 under the Securities Act) can be sold during any 90-day period without registration in compliance with Rule 144 under the Securities Act. |
ANTI-TAKEOVER EFFECTS OF DELAWARE LAW AND OUR CERTIFICATE OF INCORPORATION AND BYLAWS
The provisions of Delaware law and the amended and restated certificate of incorporation and amended and restated bylaws that we expect to adopt in connection with the completion of this offering may have the effect of delaying, deferring or discouraging another person from acquiring control of our company. These provisions, which are summarized below, may have the effect of discouraging takeover bids. They are also designed, in part, to encourage persons seeking to acquire control of us to negotiate first with our Board of Directors. We believe that the benefits of increased protection of our potential ability to negotiate with an unfriendly or unsolicited acquirer outweigh the disadvantages of discouraging a proposal to acquire us because negotiation of these proposals could result in an improvement of their terms.
185
Table of Contents
Description of capital stock
Delaware Law
We are governed by the provisions of Section 203 of the Delaware General Corporation Law. In general, Section 203 prohibits a public Delaware corporation from engaging in a “business combination” with an “interested stockholder” for a period of three years after the date of the transaction in which the person became an interested stockholder, unless the business combination is approved in a prescribed manner. A “business combination” includes mergers, asset sales or other transactions resulting in a financial benefit to the stockholder. An “interested stockholder” is a person who, together with affiliates and associates, owns, or within three years of the date on which it is sought to be determined whether such person is an “interested stockholder,” did own, 15% or more of the corporation’s outstanding voting stock. These provisions may have the effect of delaying, deferring or preventing a change in our control.
Anticipated Amended and Restated Certificate of Incorporation and Amended and Restated Bylaw provisions
The amended and restated certificate of incorporation and amended and restated bylaws, that will be effective upon the completion of this offering, will include a number of provisions that could deter hostile takeovers or delay or prevent changes in control of our management team, including the following:
| Ø | Board of Directors vacancies. Our amended and restated certificate of incorporation and amended and restated bylaws will authorize only our Board to fill vacant directorships, including newly created seats. In addition, the number of directors constituting our Board will be permitted to be set only by a resolution adopted by our Board. These provisions would prevent a stockholder from increasing the size of our Board and then gaining control of our Board by filling the resulting vacancies with its own nominees. This makes it more difficult to change the composition of our Board but promotes continuity of management. |
| Ø | Classified Board. Our amended and restated certificate of incorporation and amended and restated bylaws will provide that our Board is classified into three classes of directors. A third party may be discouraged from making a tender offer or otherwise attempting to obtain control of us as it is more difficult and time consuming for stockholders to replace a majority of the directors on a classified board of directors. See “Management—Board Composition” for additional information. |
| Ø | Stockholder action; special meeting of stockholders. Our amended and restated certificate of incorporation will provide that our stockholders may not take action by written consent, but may only take action at a duly called annual or special meetings of our stockholders. As a result, a holder controlling a majority of our capital stock would not be able to amend our amended and restated bylaws or our amended and restated certificate of incorporation, or remove directors without holding a meeting of our stockholders called in accordance with our amended and restated bylaws. Our amended and restated bylaws will further provide that special meetings of our stockholders may be called only by a majority of our Board of Directors, the Chairman of our Board of Directors, our Chief Executive Officer or our president, thus prohibiting a stockholder from calling a special meeting. These provisions might delay the ability of our stockholders to force consideration of a proposal or for stockholders controlling a majority of our capital stock to take any action, including the removal of directors. |
| Ø | Advance notice requirements for stockholder proposals and director nominations. Our amended and restated bylaws will provide advance notice procedures for stockholders seeking to bring business before our annual meeting of stockholders or to nominate candidates for election as directors at our annual meeting of stockholders. Our amended and restated bylaws will also specify certain requirements regarding the form and content of a stockholder’s notice. These provisions might |
186
Table of Contents
Description of capital stock
| preclude our stockholders from bringing matters before our annual meeting of stockholders or from making nominations for directors at our annual meeting of stockholders if the proper procedures are not followed. We expect that these provisions may also discourage or deter a potential acquirer from conducting a solicitation of proxies to elect the acquirer’s own slate of directors or otherwise attempting to obtain control of our company. |
| Ø | No cumulative voting. The Delaware General Corporation Law provides that stockholders are not entitled to the right to cumulate votes in the election of directors unless a corporation’s certificate of incorporation provides otherwise. Our amended and restated certificate of incorporation and amended and restated bylaws will not provide for cumulative voting. |
| Ø | Directors removed only for cause. Our amended and restated certificate of incorporation will provide that stockholders may remove directors only for cause. |
| Ø | Amendment of charter provisions. Any amendment of the above provisions in our amended and restated certificate of incorporation would require approval by holders of at least two-thirds of our then outstanding common stock. |
| Ø | Issuance of undesignated preferred stock. Our Board of Directors will have the authority, without further action by the stockholders, to issue up to 24,500,000 shares of undesignated preferred stock with rights and preferences, including voting rights, designated from time to time by our Board of Directors. The existence of authorized but unissued shares of preferred stock would enable our Board of Directors to render more difficult or to discourage an attempt to obtain control of us by means of a merger, tender offer, proxy contest or other means. |
CHOICE OF FORUM
Our amended and restated certificate of incorporation and amended and restated bylaws will provide that the Court of Chancery of the State of Delaware will be the exclusive forum for (i) any derivative action or proceeding brought on behalf of our company, (ii) any action asserting a claim for breach of a fiduciary duty owed by any of our directors, officers, employees or agents to us or our stockholders, (iii) any action asserting a claim arising pursuant to the Delaware General Corporation Law, our amended and restated certificate of incorporation or amended and restated bylaws or (iv) any action asserting a claim governed by the internal affairs doctrine. The enforceability of similar choice of forum provisions in other companies’ certificates of incorporation has been challenged in legal proceedings, and it is possible that a court could find these types of provisions to be inapplicable or unenforceable.
TRANSFER AGENT AND REGISTRAR
Upon the completion of this offering, the transfer agent and registrar for our common stock will be Computershare Trust Company, N.A. Our shares of common stock will be issued in uncertificated form only, subject to limited circumstances.
MARKET LISTING
Our common stock has been approved for listing on the New York Stock Exchange under the symbol “ELVT.”
187
Table of Contents
Shares eligible for future sale
Prior to this offering, there has been no public market for our common stock, and we cannot predict the effect, if any, that market sales of shares of our common stock or the availability of shares of our common stock for sale will have on the market price of our common stock prevailing from time to time. Future sales of our common stock in the public market, or the availability of such shares for sale in the public market, could adversely affect market prices prevailing from time to time. As described below, only a limited number of shares will be available for sale shortly after this offering due to contractual and legal restrictions on resale. Nevertheless, sales of our common stock in the public market after such restrictions lapse, or the perception that those sales may occur, could adversely affect the prevailing market price at such time and our ability to raise equity capital in the future.
Following the completion of this offering, and after giving effect to the automatic conversion of all outstanding shares of our convertible preferred stock which will occur upon the completion of this offering, based on the number of shares of our capital stock outstanding as of March 31, 2016, we will have a total of 30,497,985 shares of our common stock outstanding. Of these outstanding shares, all of the shares of common stock sold in this offering by us, plus any shares sold upon exercise of the underwriters’ option to purchase up to an additional 540,000 shares of common stock from us in this offering, will be freely tradable, except that any shares purchased in this offering by our affiliates, as that term is defined in Rule 144 under the Securities Act, would only be able to be sold in compliance with the Rule 144 limitations described below.
The remaining outstanding shares of our common stock will be deemed “restricted securities” as defined in Rule 144. Restricted securities may be sold in the public market only if they are registered or if they qualify for an exemption from registration under Rule 144 or Rule 701 under the Securities Act, which rules are summarized below. In addition, holders of all or substantially all of our equity securities have entered into lock-up agreements with the underwriters under which they have agreed, subject to specific exceptions, not to sell any of our stock for at least 180 days following the date of this prospectus, as described below. As a result of these agreements, subject to the provisions of Rule 144 or Rule 701, based on an assumed offering date of March 31, 2016, shares will be available for sale in the public market as follows:
| Ø | beginning on the date of this prospectus, the 3,600,000 shares of common stock sold in this offering will be immediately available for sale in the public market; |
| Ø | beginning 181 days after the date of this prospectus, 26,897,985 additional shares of common stock will become eligible for sale in the public market pursuant to Rule 144 or as a registered security, of which 22,789,397 shares will be held by affiliates and subject to the volume and other restrictions of Rule 144, as described below. |
LOCK-UP AGREEMENTS
We, our officers and directors and holders of substantially all of our common stock and securities convertible into or exchangeable for our common stock, have agreed that, subject to certain exceptions and under certain conditions, for a period of 180 days after the date of this prospectus, we and they will not, without the prior written consent of UBS Securities LLC, Jefferies LLC and Stifel Nicolaus & Company Incorporated, dispose of or hedge any shares or any securities convertible into or exchangeable for shares of our capital stock. UBS Securities LLC, Jefferies LLC and Stifel Nicolaus & Company Incorporated may, in their discretion, release any of the securities subject to these lock-up agreements at any time.
188
Table of Contents
Shares eligible for future sale
The restrictions described in the immediately preceding paragraph are subject to certain exceptions as set forth in “Underwriting.”
RULE 10B5-1 TRADING PLANS
Certain of our employees, including our executive officers and/or directors may enter into written trading plans that are intended to comply with Rule 10b5-1 under the Exchange Act. Sales under these trading plans would not be permitted until the expiration of the lock-up agreements described above.
RULE 144
In general, under Rule 144 as currently in effect, once we have been subject to the public company reporting requirements of Section 13 or Section 15(d) of the Exchange Act for at least 90 days, a person who is not deemed to have been one of our affiliates for purposes of the Securities Act at any time during the 90 days preceding a sale and who has beneficially owned the shares proposed to be sold for at least six months, including the holding period of any prior owner other than our affiliates, is entitled to sell those shares without complying with the manner of sale, volume limitation or notice provisions of Rule 144, subject to compliance with the public information requirements of Rule 144. If such a person has beneficially owned the shares proposed to be sold for at least one year, including the holding period of any prior owner other than our affiliates, then that person would be entitled to sell those shares without complying with any of the requirements of Rule 144.
In general, under Rule 144 as currently in effect, and upon expiration of the lock-up agreements described above, our affiliates or persons selling shares on behalf of our affiliates are entitled to sell within any three-month period, a number of shares that does not exceed the greater of:
| Ø | 1% of the number of shares of our common stock then outstanding, which will equal approximately 304,980 shares immediately after this offering assuming no exercise by the underwriters of their option to purchase up to an additional 540,000 shares of common stock from us in this offering; or |
| Ø | the average weekly trading volume of our common stock during the four calendar weeks preceding the filing of a notice on Form 144 with respect to that sale; |
provided, in each case, that we have been subject to the Exchange Act periodic reporting requirements for at least 90 days before the sale. Sales under Rule 144 by our affiliates or persons selling shares on behalf of our affiliates are also subject to certain manner of sale provisions and notice requirements and to the availability of current public information about us.
RULE 701
Rule 701 generally allows a stockholder who purchased shares of our common stock pursuant to a written compensatory plan or contract and who is not deemed to have been an affiliate of our company during the immediately preceding 90 days to sell these shares in reliance upon Rule 144, but without being required to comply with the public information, holding period, volume limitation or notice provisions of Rule 144. Rule 701 also permits affiliates of our company to sell their Rule 701 shares under Rule 144 without complying with the holding period requirements of Rule 144. All holders of Rule 701 shares, however, are required by that rule to wait until 90 days after the date of this prospectus before selling those shares pursuant to Rule 701.
189
Table of Contents
Shares eligible for future sale
REGISTRATION RIGHTS
After the completion of this offering, the holders of 14,098,525 shares of our common stock, or their transferees, will be entitled to various rights with respect to the registration of these shares under the Securities Act. Registration of these shares under the Securities Act would result in these shares becoming fully tradable without restriction under the Securities Act immediately upon the effectiveness of the registration, except for shares purchased by affiliates. See “Description of capital stock—Registration Rights” for additional information.
EQUITY INCENTIVE PLANS
Following the completion of this offering, we intend to file a registration statement on Form S-8 under the Securities Act to register shares of our common stock issued or reserved for issuance under our 2014 Plan. The registration statement on Form S-8 will become effective immediately upon filing, and shares covered by such registration statement will thereupon be eligible for sale in the public markets, subject to vesting restrictions, the lock-up agreements described above and Rule 144 limitations applicable to affiliates. See the section titled “Executive compensation—Employee Benefit and Stock Plans” for additional information.
190
Table of Contents
Material US federal income tax consequences to non-US holders of our common stock
The following is a summary of the material US federal income tax consequences applicable to non-US holders (as defined below) with respect to the acquisition, ownership and disposition of shares of our common stock, but does not purport to be a complete analysis of all potential tax considerations related thereto. This summary is based on current provisions of the Code, final, temporary or proposed Treasury regulations promulgated thereunder, administrative rulings and judicial opinions, all of which are subject to change, possibly with retroactive effect. We have not sought any ruling from the US Internal Revenue Service, or the “IRS,” with respect to the statements made and the conclusions reached in the following summary, and there can be no assurance that the IRS will agree with such statements and conclusions.
This summary is limited to non-US holders who purchase shares of our common stock issued pursuant to this offering and who hold such shares of our common stock as capital assets (within the meaning of Section 1221 of the Code).
This discussion does not address all aspects of US federal income taxation that may be important to a particular non-US holder in light of that non-US holder’s individual circumstances, nor does it address the potential application of the Medicare contribution tax, any aspects of US federal estate or gift tax laws, or tax considerations arising under the laws of any non-US, state or local jurisdiction. This discussion also does not address tax considerations applicable to a non-US holder subject to special treatment under the US federal income tax laws, including without limitation:
| Ø | banks, insurance companies or other financial institutions; |
| Ø | partnerships or other pass-through entities; |
| Ø | tax-exempt organizations; |
| Ø | tax-qualified retirement plans; |
| Ø | dealers in securities or currencies; |
| Ø | traders in securities that elect to use a mark-to-market method of accounting for their securities holdings; |
| Ø | US expatriates and certain former citizens or long-term residents of the US; |
| Ø | controlled foreign corporations; |
| Ø | passive foreign investment companies; |
| Ø | persons that own, or have owned, actually or constructively, more than 5% of our common stock; and |
| Ø | persons that will hold common stock as a position in a hedging transaction, “straddle” or “conversion transaction” for tax purposes. |
If a partnership (or entity classified as a partnership for US federal income tax purposes) is a beneficial owner of shares of our common stock, the tax treatment of a partner in the partnership (or member in such other entity) will generally depend upon the status of the partner and the activities of the partnership. Any partner in a partnership holding shares of our common stock (and such partnership) should consult their own tax advisors.
PROSPECTIVE INVESTORS ARE URGED TO CONSULT THEIR TAX ADVISORS WITH RESPECT TO THE APPLICATION OF THE US FEDERAL INCOME TAX LAWS TO THEIR
191
Table of Contents
Material US federal income tax consequences to non-US holders of our common stock
PARTICULAR SITUATIONS AS WELL AS ANY TAX CONSEQUENCES OF THE PURCHASE, OWNERSHIP AND DISPOSITION OF SHARES OF OUR COMMON STOCK ARISING UNDER THE US FEDERAL ESTATE OR GIFT TAX RULES OR UNDER THE LAWS OF ANY STATE, LOCAL, NON-US OR OTHER TAXING JURISDICTION OR UNDER ANY APPLICABLE TAX TREATY.
DEFINITION OF NON-US HOLDER
For purposes of this summary, a “non-US holder” is any beneficial owner of shares of our common stock (other than a partnership or other entity treated as a partnership for US federal income tax purposes) that is not a US person. A “US person” is any of the following:
| Ø | an individual citizen or resident of the US; |
| Ø | a corporation created or organized in or under the laws of the US, any state thereof or the District of Columbia (or entity treated as such for US federal income tax purposes); |
| Ø | an estate, the income of which is includible in gross income for US federal income tax purposes regardless of its source; or |
| Ø | a trust if (a) a court within the US is able to exercise primary supervision over the administration of the trust and one or more US persons have the authority to control all substantial decisions of the trust or (b) it has a valid election in effect under applicable Treasury regulations to be treated as a US person. |
DISTRIBUTIONS ON OUR COMMON STOCK
As described in “Dividend policy,” we currently do not anticipate paying dividends on our common stock in the foreseeable future. If, however, we make cash or other property distributions on our common stock (other than certain pro rata distributions of shares of our common stock), such distributions will constitute dividends for US federal income tax purposes to the extent paid from our current earnings and profits for that taxable year or accumulated earnings and profits, as determined under US federal income tax principles. Amounts not treated as dividends for US federal income tax purposes will constitute a return of capital and will first be applied against and reduce a holder’s adjusted tax basis in the shares of our common stock, but not below zero. Any excess will be treated as gain realized on the sale or other disposition of shares of our common stock and will be treated as described under “—Gain on Sale or Other Disposition of Shares of our Common Stock” below.
Dividends paid to a non-US holder of our common stock generally will be subject to US federal withholding tax at a rate of 30% of the gross amount of the dividends, or such lower rate specified by an applicable income tax treaty. To receive the benefit of a reduced treaty rate, a non-US holder must furnish to us or our paying agent a valid IRS Form W-8BEN or W-8BEN-E (or applicable successor form) certifying, under penalties of perjury, such holder’s qualification for the reduced rate. This certification must be provided to us or our paying agent prior to the payment of dividends and must be updated periodically.
If a non-US holder holds shares of our common stock in connection with the conduct of a trade or business in the US, and dividends paid on shares of our common stock are effectively connected with such holder’s US trade or business (and, if required by an applicable income tax treaty, are attributable to a permanent establishment maintained by the non-US holder in the US), the non-US holder will be exempt from the aforementioned US federal withholding tax. To claim the exemption, the non-US holder must furnish to us or our paying agent a properly executed IRS Form W-8ECI (or applicable successor form).
192
Table of Contents
Material US federal income tax consequences to non-US holders of our common stock
Such effectively connected dividends generally will be subject to US federal income tax on a net income basis at the regular graduated US federal income tax rates in the same manner as if such holder were a resident of the US. A non-US holder that is a non-US corporation also may be subject to an additional branch profits tax equal to 30% (or such lower rate specified by an applicable income tax treaty) of a portion of its effectively connected earnings and profits for the taxable year. Non-US holders should consult any applicable income tax treaties that may provide for different rules.
A non-US holder that claims exemption from withholding or the benefit of an applicable income tax treaty generally will be required to satisfy applicable certification and other requirements prior to the distribution date. Non-US holders that do not timely provide us or our paying agent with the required certification, may obtain a refund of any excess amounts withheld by timely filing an appropriate claim for refund with the IRS. Non-US holders should consult their tax advisors regarding their entitlement to benefits under a relevant income tax treaty or applicability of other exemptions from withholding.
GAIN ON SALE OR OTHER DISPOSITION OF SHARES OF OUR COMMON STOCK
Subject to the discussion below regarding backup withholding, a non-US holder generally will not be subject to US federal income tax on any gain realized upon the sale or other disposition of shares of our common stock unless:
| Ø | the gain is effectively connected with a trade or business carried on by the non-US holder in the US and, if required by an applicable income tax treaty, the gain is attributable to a permanent establishment of the non-US holder maintained in the US; |
| Ø | the non-US holder is an individual present in the US for 183 days or more in the taxable year of disposition and certain other requirements are met; or |
| Ø | we are or have been a US real property holding corporation, or a “USRPHC,” for US federal income tax purposes at any time within the shorter of the five-year period preceding the disposition and the non-US holder’s holding period for the shares of our common stock, and our common stock has ceased to be traded on an established securities market prior to the beginning of the calendar year in which the sale or other disposition occurs. The determination of whether we are a USRPHC depends on the fair market value of our US real property interests relative to the fair market value of our other trade or business assets and our foreign real property interests. |
We believe we currently are not, and we do not anticipate becoming, a USRPHC for US federal income tax purposes.
Gain described in the first bullet point above will be subject to US federal income tax on a net income basis at regular graduated US federal income tax rates generally in the same manner as if such holder were a resident of the US. A non-US holder that is a non-US corporation also may be subject to an additional branch profits tax equal to 30% (or such lower rate specified by an applicable income tax treaty) of a portion of its effectively connected earnings and profits for the taxable year. Non-US holders should consult any applicable income tax treaties that may provide for different rules.
Gain described in the second bullet point above will be subject to US federal income tax at a flat 30% rate (or such lower rate specified by an applicable income tax treaty) but may be offset by US source capital losses (even though the individual is not considered a resident of the US), provided that the non-US holder has timely filed US federal income tax returns with respect to such losses. Non-US holders should consult any applicable income tax treaties that may provide for different rules.
193
Table of Contents
Material US federal income tax consequences to non-US holders of our common stock
BACKUP WITHHOLDING AND INFORMATION REPORTING
Generally, we must report annually to the Internal Revenue Service, or the “IRS,” and to each non-US holder the amount of dividends paid to, and the tax withheld with respect to, each non-US holder. This information also may be made available under a specific treaty or agreement with the tax authorities in the country in which the non-US holder resides or is established. Backup withholding, currently at a 28% rate, generally will not apply to distributions to a non-US holder of shares of our common stock provided the non-US holder furnishes to us or our paying agent the required certification as to its non-US status, such as by providing a valid IRS Form W-8BEN, IRS Form W-8BEN-E, or IRS Form W-8ECI, or certain other requirements are met. Notwithstanding the foregoing, backup withholding may apply if either we or our paying agent has actual knowledge, or reason to know, that the holder is a US person that is not an exempt recipient.
Backup withholding is not an additional tax. Any amounts withheld under the backup withholding rules may be allowed as a refund or a credit against a non-US holder’s US federal income tax liability, provided the required information is timely furnished to the IRS.
FOREIGN ACCOUNT TAX COMPLIANCE ACT
Legislation and administrative guidance, commonly referred to as “FATCA,” may impose a 30% withholding tax on any dividends paid after December 31, 2013 and the proceeds of a sale of our common stock paid after December 31, 2016 to a “foreign financial institution,” as specially defined under such rules, and certain other foreign entities, unless various information reporting and due diligence requirements (generally relating to ownership by US persons of interests in, or accounts with, those entities) have been met or an exemption applies. If FATCA withholding is imposed, a beneficial owner that is not a foreign financial institution generally will be entitled to a refund of any amounts withheld by filing a US federal income tax return (which may entail significant administrative burden). Prospective investors should consult their tax advisors regarding FATCA.
194
Table of Contents
We are offering the shares of our common stock described in this prospectus through the underwriters named below. UBS Securities LLC, Jefferies LLC and Stifel, Nicolaus & Company, Incorporated are acting as joint book-running managers of this offering and as representatives of the underwriters. We have entered into an underwriting agreement with the representatives. Subject to the terms and conditions of the underwriting agreement, each of the underwriters has severally agreed to purchase, and we have severally agreed to sell to the underwriters, the number of shares of common stock listed next to its name in the following table.
| Underwriters | Number of shares |
|||
| UBS Securities LLC |
||||
| Jefferies LLC |
||||
| Stifel, Nicolaus & Company, Incorporated |
||||
| William Blair & Company L.L.C. |
||||
| BB&T Capital Markets, a division of BB&T Securities, LLC |
||||
|
|
|
|||
| Total |
3,600,000 | |||
|
|
|
|||
The underwriting agreement provides that the underwriters must buy all of the shares of common stock if they buy any of them. However, the underwriters are not required to pay for the shares covered by the underwriters’ option to purchase additional shares as described below.
Our common stock is offered subject to a number of conditions, including:
| Ø | receipt and acceptance of our common stock by the underwriters; and |
| Ø | the underwriters’ right to reject orders in whole or in part. |
We have been advised by the representatives that the underwriters intend to make a market in our common stock but that they are not obligated to do so and may discontinue making a market at any time without notice.
In connection with this offering, certain of the underwriters or securities dealers may distribute prospectuses electronically.
OPTION TO PURCHASE ADDITIONAL SHARES
We have granted the underwriters an option to buy up to an aggregate of 540,000 additional shares of our common stock. The underwriters have 30 days from the date of this prospectus to exercise this option. If the underwriters exercise this option, they will each purchase additional shares of common stock approximately in proportion to the amounts specified in the table above.
UNDERWRITING DISCOUNT
Shares sold by the underwriters to the public will initially be offered at the initial offering price set forth on the cover of this prospectus. Any shares sold by the underwriters to securities dealers may be sold at a discount of up to $ per share from the initial public offering price. Sales of shares made outside of the US may be made by affiliates of the underwriters. If all the shares are not sold at the initial public
195
Table of Contents
Underwriting
offering price, the representatives may change the offering price and the other selling terms. Upon execution of the underwriting agreement, the underwriters will be obligated to purchase the shares at the prices and upon the terms stated therein.
The following table shows the per share and total underwriting discount we will pay to the underwriters assuming both no exercise and full exercise of the underwriters’ option to purchase up to 540,000 additional shares.
| No exercise | Full exercise |
|||||||
| Per share |
$ | $ | ||||||
| Total |
$ | $ | ||||||
We estimate that the total expenses of the offering payable by us, not including the underwriting discount, will be approximately $ million. We have also agreed to reimburse the underwriters for certain FINRA-related expenses incurred by them in connection with this offering in an amount up to $30 thousand.
NO SALES OF SIMILAR SECURITIES
We, our executive officers and directors, and holders of substantially all of our common stock have entered into lock-up agreements with the underwriters. Under the lock-up agreements, subject to certain exceptions, we and each of these persons may not, without the prior written approval of UBS Securities LLC, Jefferies LLC and Stifel, Nicolaus & Company, Incorporated, offer, sell, contract to sell, pledge, or otherwise dispose of, directly or indirectly, or hedge our common stock or securities convertible into or exchangeable or exercisable for our common stock. These restrictions will be in effect for a period of 180 days after the date of this prospectus.
The foregoing restrictions do not apply to certain transactions, including but not limited to:
| Ø | the shares of our common stock to be sold by us in this offering; |
| Ø | transfers or dispositions by will or by intestacy, provided that no filing under the Exchange Act, shall be required or shall be voluntarily made during the restricted period; |
| Ø | bona fide gifts, provided that each recipient sign and deliver a lock-up letter substantially in the same form as executed by the locked-up party and no filing under the Exchange Act, shall be required or shall be voluntarily made during lock-up period; |
| Ø | dispositions to any trust or other entity for the benefit of the locked-up party and/or the immediate family of the locked-up party, provided that each donee sign and deliver a lock-up letter substantially in the same form as executed by the locked-up party and no filing under the Exchange Act, shall be required or shall be voluntarily made during the lock-up period; |
| Ø | the surrender or forfeiture of our common stock or other securities to us to cover (i) tax withholding obligations upon exercise or vesting or (ii) the exercise price of stock options or certain other rights to acquire our common stock, provided that any such securities remain subject to the lock-up agreement and no filing under the Exchange Act, shall be required or shall be voluntarily made during the lock-up period; |
| Ø | the exercise of any option or other rights to acquire common stock, the settlement of any stock-settled stock appreciation rights, restricted stock or restricted stock units or the conversion of any convertible security into common stock, provided that any such securities remain subject to the lock-up agreement; |
196
Table of Contents
Underwriting
| Ø | the entry into any trading plan established pursuant to Rule 10b5-1 under the Exchange Act, provided that such plan does not provide for any sale or other dispositions of common stock during the lock-up period and no filing under the Exchange Act or public announcement is made or required to be made by or on behalf of the undersigned or the Company regarding the establishment of such plan; |
| Ø | transactions relating to shares of common stock or other securities acquired in this offering or in the open market after the completion of this offering, provided that no filing under the Exchange Act, shall be required or shall be voluntarily made during the lock-up period; |
| Ø | distributions to stockholders, limited partners or members of the locked-up party, provided that each such distributee sign and deliver a lock-up letter substantially in the same form as executed by the locked-up party and no filing under the Exchange Act, shall be required or shall be voluntarily made during the lock-up period; |
| Ø | distributions to the locked-up party’s affiliates or other entity controlled or managed by the locked-up party, provided that each such transferee shall sign and deliver a lock-up letter substantially in the same form as executed by the locked-up party and no filing under the Exchange Act, shall be required or shall be voluntarily made during the lock-up period; and |
| Ø | the issuance of shares of common stock by us in connection with acquisitions, joint ventures, commercial relationships or other strategic corporate transactions, provided that the aggregate number of shares of common stock that we may issue or agree to issue during the lock-up period may not exceed 5% of the total number of our shares of common stock issued and outstanding immediately following the completion of this offering, and further provided that the recipient of any such shares must execute and deliver a lock-up letter substantially in the same form as executed by the locked up party. |
UBS Securities LLC, Jefferies LLC and Stifel, Nicolaus & Company, Incorporated may collectively, at any time and in their sole discretion, release some or all the securities from these lock-up agreements. If the restrictions under the lock-up agreements are waived, shares of our common stock may become available for resale into the market, subject to applicable law, which could reduce the market price of our common stock.
INDEMNIFICATION
We have agreed to indemnify the several underwriters against certain liabilities, including certain liabilities under the Securities Act. If we are unable to provide this indemnification, we have agreed to contribute to payments the underwriters may be required to make in respect of those liabilities.
NEW YORK STOCK EXCHANGE
Our common stock has been approved for listing on the New York Stock Exchange under the symbol “ELVT.”
PRICE STABILIZATION, SHORT POSITIONS
In connection with this offering, the underwriters may engage in activities that stabilize, maintain or otherwise affect the price of our common stock during and after this offering, including:
| Ø | stabilizing transactions; |
| Ø | short sales; |
197
Table of Contents
Underwriting
| Ø | purchases to cover positions created by short sales; |
| Ø | imposition of penalty bids; and |
| Ø | syndicate covering transactions. |
Stabilizing transactions consist of bids or purchases made for the purpose of preventing or retarding a decline in the market price of our common stock while this offering is in progress. Stabilization transactions permit bids to purchase the underlying security so long as the stabilizing bids do not exceed a specified maximum. These transactions may also include making short sales of our common stock, which involve the sale by the underwriters of a greater number of shares of common stock than they are required to purchase in this offering and purchasing shares of common stock on the open market to cover short positions created by short sales. Short sales may be “covered short sales,” which are short positions in an amount not greater than the underwriters’ option to purchase additional shares referred to above, or may be “naked short sales,” which are short positions in excess of that amount.
The underwriters may close out any covered short position by either exercising their option, in whole or in part, or by purchasing shares in the open market. In making this determination, the underwriters will consider, among other things, the price of shares available for purchase in the open market as compared to the price at which they may purchase shares through the over-allotment option.
Naked short sales are short sales made in excess of the over-allotment option. The underwriters must close out any naked short position by purchasing shares in the open market. A naked short position is more likely to be created if the underwriters are concerned that there may be downward pressure on the price of the common stock in the open market that could adversely affect investors who purchased in this offering.
The underwriters also may impose a penalty bid. This occurs when a particular underwriter repays to the underwriters a portion of the underwriting discount received by it because the representatives have repurchased shares sold by or for the account of that underwriter in stabilizing or short covering transactions.
These stabilizing transactions, short sales, purchases to cover positions created by short sales, the imposition of penalty bids and syndicate covering transactions may have the effect of raising or maintaining the market price of our common stock or preventing or retarding a decline in the market price of our common stock. As a result of these activities, the price of our common stock may be higher than the price that otherwise might exist in the open market. The underwriters may carry out these transactions on the New York Stock Exchange, in the over-the-counter market or otherwise. Neither we nor the underwriters make any representation or prediction as to the effect that the transactions described above may have on the price of the shares. Neither we, nor any of the underwriters make any representation that the underwriters will engage in these stabilization transactions or that any transaction, once commenced, will not be discontinued without notice.
DETERMINATION OF OFFERING PRICE
Prior to this offering, there was no public market for our common stock. The initial public offering price will be determined by negotiation among us and the representatives of the underwriters. The principal factors to be considered in determining the initial public offering price include:
| Ø | the information set forth in this prospectus and otherwise available to the representatives; |
198
Table of Contents
Underwriting
| Ø | our history and prospects and the history and prospects for the industry in which we compete; |
| Ø | our past and present financial performance; |
| Ø | our prospects for future earnings and the present state of our development; |
| Ø | the general condition of the securities market at the time of this offering; |
| Ø | the recent market prices of, and demand for, publicly traded common stock of generally comparable companies; and |
| Ø | other factors deemed relevant by the underwriters and us. |
The estimated public offering price range set forth on the cover page of this prospectus is subject to change as a result of market conditions and other factors. Neither we nor the underwriters can assure investors that an active trading market will develop for our common stock or that the common stock will trade in the public market at or above the initial public offering price.
AFFILIATIONS
The underwriters and their respective affiliates are full service financial institutions engaged in various activities, which may include securities trading, commercial and investment banking, financial advisory, investment management, investment research, principal investment, hedging, financing and brokerage activities. The underwriters and their affiliates may from time to time in the future engage with us and perform services for us or in the ordinary course of their business for which they will receive customary fees and expenses. In the ordinary course of their various business activities, the underwriters and their respective affiliates may make or hold a broad array of investments and actively trade debt and equity securities (or related derivative securities) and financial instruments (including bank loans) for their own account and for the accounts of their customers, and such investment and securities activities may involve securities and/or instruments of us. The underwriters and their respective affiliates may also make investment recommendations and/or publish or express independent research views in respect of these securities or instruments and may at any time hold, or recommend to clients that they acquire, long and/or short positions in these securities and instruments.
DIRECTED SHARE PROGRAM
At our request, the underwriters have reserved up to 5% of the common stock being offered by this prospectus for sale at the initial public offering price to our directors, director nominees, officers, employees and other individuals associated with us and members of their families. The sales will be made by UBS Financial Services Inc., a selected dealer affiliated with UBS Securities LLC, an underwriter of this offering, through a directed share program. We do not know if any eligible persons will choose to purchase all or any portion of these reserved shares, but any purchases they do make will reduce the number of shares available to the general public. Any reserved shares not so purchased will be offered by the underwriters to the general public on the same terms as the other shares of common stock. Participants in the directed share program who purchase more than $1,000,000 of shares shall be subject to a 25-day lock-up with respect to any shares sold to them pursuant to that program. This lock-up will have similar restrictions and an identical extension provision to the lock-up agreements described below. Any shares sold in the directed share program to our directors, director nominees or executive officers shall be subject to the lock-up agreements described above.
199
Table of Contents
Underwriting
OTHER ACTIVITIES AND RELATIONSHIPS
Solebury Capital LLC, or “Solebury,” a FINRA member, is acting as a financial advisor in connection with the offering. Solebury is not acting as an underwriter and will not sell or offer to sell any securities and will not identify, solicit or engage directly with potential investors. In addition, Solebury will not underwrite or purchase any of the offered securities or otherwise participate in any such undertaking.
ELECTRONIC DISTRIBUTION
A prospectus in electronic format may be made available on the Internet sites or through other online services maintained by one or more of the underwriters participating in this offering, or by their affiliates. In those cases, prospective investors may view offering terms online and, depending upon the particular underwriter, prospective investors may be allowed to place orders online. The underwriters may agree with us to allocate a specific number of shares for sale to online brokerage account holders. Any such allocation for online distributions will be made by the underwriters on the same basis as other allocations. Other than the prospectus in electronic format, the information on any underwriter’s website and any information contained in any other website maintained by an underwriter is not part of the prospectus or the registration statement of which this prospectus forms a part, has not been approved and/or endorsed by us or any underwriter in its capacity as underwriter and should not be relied upon by investors.
NOTICE TO PROSPECTIVE INVESTORS IN EUROPEAN ECONOMIC AREA
In relation to each Member State of the European Economic Area which has implemented the Prospectus Directive (each, a “Relevant Member State”) an offer to the public of any shares which are the subject of the offering contemplated by this prospectus, or the “Shares,” may not be made in that Relevant Member State except that an offer to the public in that Relevant Member State of any Shares may be made at any time under the following exemptions under the Prospectus Directive, if they have been implemented in that Relevant Member State:
| (a) | to any legal entity which is a qualified investor as defined under the Prospectus Directive; |
| (b) | by the Managers to fewer than 100, or, if the Relevant Member State has implemented the relevant provisions of the 2010 PD Amending Directive, 150, natural or legal persons (other than qualified investors as defined in the Prospectus Directive) subject to obtaining the prior consent of Lead Manager for any such offer; or |
| (c) | in any other circumstances falling within Article 3(2) of the Prospectus Directive, provided that no such offer of Shares shall result in a requirement for the Issuer or any Manager to publish a prospectus pursuant to Article 3 of the Prospectus Directive or supplement a prospectus pursuant to Article 16 of the Prospectus Directive. |
For the purposes of this provision, the expression an “offer to the public” in relation to any Shares in any Relevant Member State means the communication in any form and by any means of sufficient information on the terms of the offer and any Shares to be offered so as to enable an investor to decide to purchase any Shares, as the same may be varied in that Member State by any measure implementing the Prospectus Directive in that Member State. The expression “Prospectus Directive” means Directive 2003/71/EC (and amendments thereto, including the 2010 PD Amending Directive, to the extent implemented in the Relevant Member State), and includes any relevant implementing measure in each Relevant Member State and the expression “2010 PD Amending Directive” means Directive 2010/73/EU.
The EEA selling restriction is in addition to any other selling restrictions set out in this prospectus.
200
Table of Contents
Underwriting
NOTICE TO PROSPECTIVE INVESTORS IN AUSTRALIA
This offering memorandum is not a formal disclosure document and has not been, nor will be, lodged with the Australian Securities and Investments Commission. It does not purport to contain all information that an investor or their professional advisers would expect to find in a prospectus or other disclosure document (as defined in the Corporations Act 2001 (Australia)) for the purposes of Part 6D.2 of the Corporations Act 2001 (Australia) or in a product disclosure statement for the purposes of Part 7.9 of the Corporations Act 2001 (Australia), in either case, in relation to the securities.
The securities are not being offered in Australia to “retail clients” as defined in sections 761G and 761GA of the Corporations Act 2001 (Australia). This offering is being made in Australia solely to “wholesale clients” for the purposes of section 761G of the Corporations Act 2001 (Australia) and, as such, no prospectus, product disclosure statement or other disclosure document in relation to the securities has been, or will be, prepared.
This offering memorandum does not constitute an offer in Australia other than to persons who do not require disclosure under Part 6D.2 of the Corporations Act 2001 (Australia) and who are wholesale clients for the purposes of section 761G of the Corporations Act 2001 (Australia). By submitting an application for our securities, you represent and warrant to us that you are a person who does not require disclosure under Part 6D.2 and who is a wholesale client for the purposes of section 761G of the Corporations Act 2001 (Australia). If any recipient of this offering memorandum is not a wholesale client, no offer of, or invitation to apply for, our securities shall be deemed to be made to such recipient and no applications for our securities will be accepted from such recipient. Any offer to a recipient in Australia, and any agreement arising from acceptance of such offer, is personal and may only be accepted by the recipient. In addition, by applying for our securities you undertake to us that, for a period of 12 months from the date of issue of the securities, you will not transfer any interest in the securities to any person in Australia other than to a person who does not require disclosure under Part 6D.2 and who is a wholesale client.
NOTICE TO PROSPECTIVE INVESTORS IN CANADA
(A) Resale Restrictions
The distribution of the common stock in Canada is being made only in the provinces of Ontario, Québec, Alberta and British Columbia, and therein only on a private placement basis in reliance on an exemption(s) from the requirement that we prepare and file a prospectus with the securities regulatory authorities in each province where trades of these securities are made in connection with this offering. Any resale of the common stock in Canada must be made under applicable securities laws which may vary depending on the relevant jurisdiction, and which may require resales to be made in accordance with prospectus and registration requirements or, alternatively, under an available statutory exemption from the prospectus and registration requirements or under a discretionary exemption granted by the applicable Canadian securities regulatory authority. Purchasers are advised to seek legal advice prior to any resale of the securities.
(B) Representations of Canadian Purchasers
By purchasing the shares of common stock in Canada and accepting delivery of a purchase confirmation, each Canadian purchaser is hereby representing to us and each dealer from whom a purchase confirmation is received that:
| Ø | the purchaser is entitled under applicable provincial securities laws to purchase the common stock without the benefit of a prospectus qualified under those securities laws as it is an “accredited investor” as such term is defined under National Instrument 45-106 – Prospectus Exemptions, or NI 45-106 |
201
Table of Contents
Underwriting
| Ø | the purchaser is a “permitted client” as such term is defined in National Instrument 31-103 - Registration Requirements, Exemptions and Ongoing Registrant Obligations, |
| Ø | where required by law, the purchaser is purchasing the common stock as principal, or is deemed to be purchasing as principal in accordance with the applicable securities laws of the province in which the investor is resident, for its own account and not as agent for the benefit of another person, and is purchasing for investment only and not with a view to resale or distribution, |
| Ø | the purchaser has reviewed the text above under (A) Resale Restrictions and agrees not to resell common stock purchased in this offering except in compliance with applicable Canadian resale restrictions; and |
| Ø | by purchasing common stock in this offering, each Canadian purchaser will be deemed to have agreed to provide us and the underwriters, as applicable, with any and all information about the purchaser and its purchase of common stock in the offering necessary to permit us and the underwriters, as applicable, to properly complete and file Form 45-106F1 Report of Exempt Distribution and, in British Columbia, as applicable, Form 45-106F6 British Columbia Report of Exempt Distribution, as required under NI 45-106. |
(C) Conflicts of Interest
Canadian purchasers are hereby notified that we and each underwriter in this offering are relying on the exemption set out in section 3A.3 of National Instrument 33-105 –Underwriting Conflicts and, therefore, are not required to provide Canadian investors with disclosure pertaining to conflicts of interest and any “connected issuer” and “related issuer” relationships that may exist between us and the underwriters, where applicable, as otherwise required to be disclosed pursuant to subsection 2.1(1) of NI 33-105 in connection with this offering.
(D) Statutory Rights of Action
Securities legislation in certain provinces or territories of Canada may provide a purchaser with remedies for rescission or damages if the offering memorandum (including any amendment thereto) such as this document contains a misrepresentation, provided that the remedies for rescission or damages are exercised by the purchaser within the time limit prescribed by the securities legislation of the purchaser’s province or territory. The purchaser of these securities in Canada should refer to any applicable provisions of the securities legislation of the purchaser’s province or territory for particulars of these rights or consult with a legal advisor.
(E) Enforcement of Legal Rights
All of our directors and officers and the experts named herein may be located outside of Canada and, as a result, it may not be possible for Canadian purchasers to effect service of process within Canada upon us or those persons. All or a substantial portion of our assets and the assets of those persons may be located outside of Canada and, as a result, it may not be possible to satisfy a judgment against us or those persons in Canada or to enforce a judgment obtained in Canadian courts against us or those persons outside of Canada.
(F) Taxation and Eligibility for Investment
Canadian purchasers of the common stock should consult their own legal and tax advisors with respect to the tax consequences of an investment in the common stock in their particular circumstances and about the eligibility of the common stock for investment by the purchaser under relevant Canadian legislation.
202
Table of Contents
Underwriting
(G) Language of Documents
Upon receipt of this document, each Canadian investor hereby confirms that it has expressly requested that all documents evidencing or relating in any way to the sale of the securities described herein (including for greater certainty any purchase confirmation or any notice) be drawn up in the English language only. Par la réception de ce document, chaque investisseur canadien confirme par les présentes qu’il a expressément exigé que tous les documents faisant foi ou se rapportant de quelque manière que ce soit à la vente des valeurs mobilières décrites aux présentes (incluant, pour plus de certitude, toute confirmation d’achat ou tout avis) soient rédigés en anglais seulement.
NOTICE TO PROSPECTIVE INVESTORS IN HONG KONG
The contents of this prospectus have not been reviewed by any regulatory authority in Hong Kong. You are advised to exercise caution in relation to the offer. If you are in any doubt about any of the contents of this prospectus, you should obtain independent professional advice. Please note that (i) our securities may not be offered or sold in Hong Kong, by means of this prospectus or any document other than to “professional investors” within the meaning of Part I of Schedule 1 of the Securities and Futures Ordinance (Cap.571, Laws of Hong Kong) (SFO) and any rules made thereunder, or in other circumstances which do not result in the document being a “prospectus” within the meaning of the Companies Ordinance (Cap.32, Laws of Hong Kong) (CO) or which do not constitute an offer or invitation to the public for the purpose of the CO or the SFO, and (ii) no advertisement, invitation or document relating to our securities may be issued or may be in the possession of any person for the purpose of issue (in each case whether in Hong Kong or elsewhere) which is directed at, or the contents of which are likely to be accessed or read by, the public in Hong Kong (except if permitted to do so under the securities laws of Hong Kong) other than with respect to the securities which are or are intended to be disposed of only to persons outside Hong Kong or only to “professional investors” within the meaning of the SFO and any rules made thereunder.
NOTICE TO PROSPECTIVE INVESTORS IN JAPAN
Our securities have not been and will not be registered under the Financial Instruments and Exchange Law of Japan (the Financial Instruments and Exchange Law) and our securities will not be offered or sold, directly or indirectly, in Japan, or to, or for the benefit of, any resident of Japan (which term as used herein means any person resident in Japan, including any corporation or other entity organized under the laws of Japan), or to others for re-offering or resale, directly or indirectly, in Japan, or to a resident of Japan, except pursuant to an exemption from the registration requirements of, and otherwise in compliance with, the Financial Instruments and Exchange Law and any other applicable laws, regulations and ministerial guidelines of Japan.
NOTICE TO PROSPECTIVE INVESTORS IN SINGAPORE
This document has not been registered as a prospectus with the Monetary Authority of Singapore. Accordingly, this document and any other document or material in connection with the offer or sale, or invitation for subscription or purchase, of our securities may not be circulated or distributed, nor may our securities be offered or sold, or be made the subject of an invitation for subscription or purchase, whether directly or indirectly, to persons in Singapore other than (i) to an institutional investor under Section 274 of the Securities and Futures Act, Chapter 289 of Singapore, or the “SFA,” (ii) to a relevant person pursuant to Section 275(1), or any person pursuant to Section 275(1A), and in accordance with the conditions specified in Section 275, of the SFA, or (iii) otherwise pursuant to, and in accordance with the conditions of, any other applicable provision of the SFA.
203
Table of Contents
Underwriting
Where our securities are subscribed or purchased under Section 275 by a relevant person which is:
| (a) | a corporation (which is not an accredited investor (as defined in Section 4A of the SFA)) the sole business of which is to hold investments and the entire share capital of which is owned by one or more individuals, each of whom is an accredited investor; or |
| (b) | a trust (where the trustee is not an accredited investor) whose sole purpose is to hold investments and each beneficiary of the trust is an individual who is an accredited investor, |
securities (as defined in Section 239(1) of the SFA) of that corporation or the beneficiaries’ rights and interest (howsoever described) in that trust shall not be transferred within six months after that corporation or that trust has acquired our securities pursuant to an offer made under Section 275 except:
| (1) | to an institutional investor or to a relevant person defined in Section 275(2) of the SFA, or to any person arising from an offer referred to in Section 275(1A) or Section 276(4)(i)(B) of the SFA; |
| (2) | where no consideration is or will be given for the transfer; |
| (3) | where the transfer is by operation of law; or |
| (4) | as specified in Section 276(7) of the SFA. |
NOTICE TO PROSPECTIVE INVESTORS IN SWITZERLAND
The securities may not be publicly offered in Switzerland and will not be listed on the SIX Swiss Exchange, or “SIX,” or on any other stock exchange or regulated trading facility in Switzerland. This Offering Memorandum has been prepared without regard to the disclosure standards for issuance prospectuses under art. 652a or art. 1156 of the Swiss Code of Obligations or the disclosure standards for listing prospectuses under art. 27 ff. of the SIX Listing Rules or the listing rules of any other stock exchange or regulated trading facility in Switzerland. Neither this Offering Memorandum nor any other offering or marketing material relating to the securities or the offering may be publicly distributed or otherwise made publicly available in Switzerland.
Neither this Offering Memorandum nor any other offering or marketing material relating to the offering, the Company or the securities have been or will be filed with or approved by any Swiss regulatory authority. In particular, this Offering Memorandum will not be filed with, and the offer of securities will not be supervised by, the Swiss Financial Market Supervisory Authority FINMA, and the offer of securities has not been and will not be authorized under the Swiss Federal Act on Collective Investment Schemes, or “CISA.” The investor protection afforded to acquirers of interests in collective investment schemes under the CISA does not extend to acquirers of securities.
NOTICE TO PROSPECTIVE INVESTORS IN UNITED KINGDOM
This prospectus is only being distributed to and is only directed at: (1) persons who are outside the United Kingdom; (2) investment professionals falling within Article 19(5) of the Financial Services and Markets Act 2000 (Financial Promotion) Order 2005 (the “Order”); or (3) high net worth companies, and other persons to whom it may lawfully be communicated, falling within Article 49(2)(a) to (d) of the Order (all such persons falling within (1)-(3) together being referred to as “relevant persons”). The shares are only available to, and any invitation, offer or agreement to subscribe, purchase or otherwise acquire such shares will be engaged in only with, relevant persons. Any person who is not a relevant person should not act or rely on this prospectus or any of its contents.
204
Table of Contents
The validity of the shares of common stock offered hereby will be passed upon for us by Morrison & Foerster LLP, San Francisco, California. The underwriters are being represented by Orrick, Herrington & Sutcliffe LLP, San Francisco, California in connection with this offering.
The audited consolidated financial statements included in this prospectus and elsewhere in the registration statement have been so included in reliance upon the report of Grant Thornton LLP, independent registered public accountants, upon the authority of said firm as experts in accounting and auditing.
Where you can find more information
We have filed with the SEC a registration statement on Form S-1 under the Securities Act with respect to the shares of common stock offered by this prospectus. This prospectus, which constitutes a part of the registration statement, does not contain all of the information set forth in the registration statement, some of which is contained in exhibits to the registration statement as permitted by the rules and regulations of the SEC. For further information with respect to us and our common stock, we refer you to the registration statement, including the exhibits filed as a part of the registration statement. Statements contained in this prospectus concerning the contents of any contract or any other document is not necessarily complete. If a contract or document has been filed as an exhibit to the registration statement, please see the copy of the contract or document that has been filed. Each statement in this prospectus relating to a contract or document filed as an exhibit is qualified in all respects by the filed exhibit. You may obtain copies of this information by mail from the Public Reference Section of the SEC, 100 F Street, N.E., Room 1580, Washington, D.C. 20549, at prescribed rates. You may obtain information on the operation of the public reference rooms by calling the SEC at 1-800-SEC-0330. The SEC also maintains an internet website that contains reports, proxy statements and other information about issuers, like us, that file electronically with the SEC. The address of that website is www.sec.gov.
As a result of this offering, we will become subject to the information and reporting requirements of the Exchange Act and, in accordance with this law, will file periodic reports, proxy statements and other information with the SEC. These periodic reports, proxy statements and other information will be available for inspection and copying at the SEC’s public reference facilities and the website of the SEC referred to above. We also maintain a website at www.elevate.com. Upon completion of this offering, you may access these materials free of charge as soon as reasonably practicable after they are electronically filed with, or furnished to, the SEC. Information contained on our website is not a part of this prospectus and the inclusion of our website address in this prospectus is an inactive textual reference only.
205
Table of Contents
Index to combined and consolidated financial statements
CONTENTS
F-1
Table of Contents
Report of Independent Registered Public Accounting Firm
Board of Directors and Stockholders
Elevate Credit, Inc.
We have audited the accompanying consolidated balance sheets of Elevate Credit, Inc., a Delaware corporation, and subsidiaries (the “Company”) as of December 31, 2015 and 2014, and the related combined and consolidated statements of operations, comprehensive loss, changes in stockholders’ equity, and cash flows for each of the two years in the period ended December 31, 2015. These financial statements are the responsibility of the Company’s management. Our responsibility is to express an opinion on these financial statements based on our audits.
We conducted our audits in accordance with the standards of the Public Company Accounting Oversight Board (United States). Those standards require that we plan and perform the audit to obtain reasonable assurance about whether the financial statements are free of material misstatement. We were not engaged to perform an audit of the Company’s internal control over financial reporting. Our audits included consideration of internal control over financial reporting as a basis for designing audit procedures that are appropriate in the circumstances, but not for the purpose of expressing an opinion on the effectiveness of the Company’s internal control over financial reporting. Accordingly, we express no such opinion. An audit also includes examining, on a test basis, evidence supporting the amounts and disclosures in the financial statements, assessing the accounting principles used and significant estimates made by management, as well as evaluating the overall financial statement presentation. We believe that our audits provide a reasonable basis for our opinion.
In our opinion, the combined and consolidated financial statements referred to above present fairly, in all material respects, the financial position of Elevate Credit, Inc. and subsidiaries as of December 31, 2015 and 2014, and the results of their operations and their cash flows for each of the two years in the period ended December 31, 2015, in conformity with accounting principles generally accepted in the United States of America.
/s/ GRANT THORNTON LLP
Dallas, TX
April 27, 2016
F-2
Table of Contents
Elevate Credit, Inc. and Subsidiaries
| December 31, | ||||||||
| (Dollars in thousands except per share amounts) | 2015 | 2014 | ||||||
| ASSETS | ||||||||
| Cash and cash equivalents* |
$ | 29,050 | $ | 29,519 | ||||
| Restricted cash |
1,996 | 8,356 | ||||||
| Loans receivable, net of allowance for loan losses of $59,771 and $44,914, respectively* |
274,208 | 147,823 | ||||||
| Prepaid expenses and other assets* |
8,988 | 4,888 | ||||||
| Bank reserve deposit |
9,287 | — | ||||||
| Receivable from CSO lenders |
9,719 | 7,452 | ||||||
| Receivable from payment processors* |
13,851 | 7,259 | ||||||
| Deferred tax assets, net |
26,856 | 20,096 | ||||||
| Property and equipment, net |
17,770 | 17,324 | ||||||
| Goodwill |
16,027 | 16,027 | ||||||
| Intangible assets, net |
2,484 | 2,690 | ||||||
| Assets of discontinued operations |
— | 278 | ||||||
|
|
|
|
|
|||||
| Total assets |
$ | 410,236 | $ | 261,712 | ||||
|
|
|
|
|
|||||
| LIABILITIES AND STOCKHOLDERS’ EQUITY | ||||||||
| Accounts payable and accrued liabilities (including $304 and $1,266 payable to Think Finance, respectively)* |
$ | 36,258 | $ | 28,546 | ||||
| State and other taxes payable |
803 | 632 | ||||||
| Notes payable* |
339,800 | 174,800 | ||||||
| Contingent consideration payable |
— | 5,529 | ||||||
| Liabilities of discontinued operations |
— | 15 | ||||||
|
|
|
|
|
|||||
| Total liabilities |
376,861 | 209,522 | ||||||
|
|
|
|
|
|||||
| COMMITMENTS, CONTINGENCIES AND GUARANTEES (Note 14) |
||||||||
| STOCKHOLDERS’ EQUITY |
||||||||
| Common stock; $0.001 par value; 16,670,700 authorized shares; 5,118,743 and 4,842,968 issued and outstanding, respectively |
5 | 5 | ||||||
| Convertible preferred stock; Series A, $0.001 par value; 2,957,059 shares authorized, issued and outstanding, liquidation preference of $22,850 |
3 | 3 | ||||||
| Convertible preferred stock; Series B, $0.001 par value; 2,682,351 shares authorized, issued and outstanding, liquidation preference of $40,000 |
3 | 3 | ||||||
| Accumulated other comprehensive gain (loss), net of tax benefit of $2,206 and $1,701, respectively |
286 | (311 | ) | |||||
| Additional paid-in capital |
87,090 | 86,591 | ||||||
| Accumulated deficit |
(54,012 | ) | (34,101 | ) | ||||
|
|
|
|
|
|||||
| Total stockholders’ equity |
33,375 | 52,190 | ||||||
|
|
|
|
|
|||||
| Total liabilities and stockholders’ equity |
$ | 410,236 | $ | 261,712 | ||||
|
|
|
|
|
|||||
| * | These balances include certain assets and liabilities of a variable interest entity (“VIE”) that can only be used to settle the liabilities of that VIE. All assets of the Company are pledged as security for the Company’s outstanding debt, including debt held by the VIE. For further information regarding the assets and liabilities included in our consolidated accounts, see Note 5—Variable Interest Entity. |
The accompanying notes are an integral part of these combined and consolidated financial statements.
F-3
Table of Contents
Elevate Credit, Inc. and Subsidiaries
COMBINED AND CONSOLIDATED STATEMENTS OF OPERATIONS
| For the years ended December 31, | ||||||||
| (Dollars in thousands except per share amounts) | 2015 | 2014 | ||||||
| Revenues |
$ | 434,006 | $ | 273,718 | ||||
| Provision for loan losses |
232,650 | 170,908 | ||||||
| Direct marketing costs |
61,032 | 60,166 | ||||||
| Other cost of sales |
15,197 | 10,603 | ||||||
|
|
|
|
|
|||||
| Gross profit |
125,127 | 32,041 | ||||||
|
|
|
|
|
|||||
| Operating expenses |
||||||||
| Compensation and benefits |
60,568 | 48,010 | ||||||
| Professional services |
25,134 | 18,662 | ||||||
| Selling and marketing |
7,567 | 7,366 | ||||||
| Occupancy and equipment |
9,690 | 8,043 | ||||||
| Depreciation and amortization |
8,898 | 8,317 | ||||||
| Other |
4,303 | 2,766 | ||||||
|
|
|
|
|
|||||
| Total operating expenses |
116,160 | 93,164 | ||||||
|
|
|
|
|
|||||
| Operating income (loss) |
8,967 | (61,123 | ) | |||||
| Net interest expense (including $860 paid to Think Finance for the year ended December 31, 2014) |
(36,674 | ) | (12,939 | ) | ||||
| Foreign currency transaction loss |
(2,385 | ) | (1,408 | ) | ||||
| Non-operating income |
5,523 | — | ||||||
|
|
|
|
|
|||||
| Loss before taxes |
(24,569 | ) | (75,470 | ) | ||||
| Income tax benefit |
(4,658 | ) | (20,710 | ) | ||||
|
|
|
|
|
|||||
| Loss from continuing operations |
$ | (19,911 | ) | $ | (54,760 | ) | ||
| Income from discontinued operations, net of tax |
— | 135 | ||||||
|
|
|
|
|
|||||
| Net loss |
$ | (19,911 | ) | $ | (54,625 | ) | ||
|
|
|
|
|
|||||
| Basic and diluted (loss) earnings per share: |
||||||||
| Loss from continuing operations |
$ | (3.97 | ) | $ | (11.62 | ) | ||
| Income from discontinued operations |
— | 0.03 | ||||||
|
|
|
|
|
|||||
| Net loss |
$ | (3.97 | ) | $ | (11.59 | ) | ||
|
|
|
|
|
|||||
| Basic and diluted weighted average shares outstanding |
5,010,339 | 4,711,794 | ||||||
The accompanying notes are an integral part of these combined and consolidated financial statements.
F-4
Table of Contents
Elevate Credit, Inc. and Subsidiaries
COMBINED AND CONSOLIDATED STATEMENTS OF COMPREHENSIVE LOSS
| For the years ended December 31, | ||||||||
| (Dollars in thousands) | 2015 | 2014 | ||||||
| Net loss |
$ | (19,911 | ) | $ | (54,625 | ) | ||
| Other comprehensive income, net of tax: |
||||||||
| Foreign currency translation adjustment, net of tax |
597 | 827 | ||||||
|
|
|
|
|
|||||
| Total other comprehensive income, net of tax |
597 | 827 | ||||||
|
|
|
|
|
|||||
| Total comprehensive loss |
$ | (19,314 | ) | $ | (53,798 | ) | ||
|
|
|
|
|
|||||
The accompanying notes are an integral part of these combined and consolidated financial statements.
F-5
Table of Contents
Elevate Credit, Inc. and Subsidiaries
COMBINED AND CONSOLIDATED STATEMENTS OF STOCKHOLDERS’ EQUITY
For the years ended December 31, 2015 and 2014
| (Dollars in thousands) |
Common Stock |
Series A |
Series B |
Additional paid-in capital |
Accumu- deficit |
Accumulated other comprehensive loss |
Total | |||||||||||||||||||||||||||||||||||||
| Owner’s net investment |
Shares | Amount | Shares | Amount | Shares | Amount | ||||||||||||||||||||||||||||||||||||||
| Balances at December 31, 2013 |
95,036 | — | — | — | — | — | — | — | — | (1,138 | ) | 93,898 | ||||||||||||||||||||||||||||||||
| Net transfers from Think Finance |
12,515 | — | — | — | — | — | — | — | — | — | 12,515 | |||||||||||||||||||||||||||||||||
| Contribution from Think Finance |
(87,027 | ) | 4,643,133 | 5 | 2,957,059 | 3 | 2,682,351 | 3 | 87,016 | — | — | — | ||||||||||||||||||||||||||||||||
| Stock-based compensation |
— | — | — | — | — | — | — | 364 | — | — | 364 | |||||||||||||||||||||||||||||||||
| Exercise of stock options |
— | 199,835 | — | — | — | — | — | (789 | ) | — | — | (789 | ) | |||||||||||||||||||||||||||||||
| Comprehensive income: |
||||||||||||||||||||||||||||||||||||||||||||
| Foreign currency translation adjustment net of tax expense of $2,147 |
— | — | — | — | — | — | — | — | — | 827 | 827 | |||||||||||||||||||||||||||||||||
| Net loss |
(20,524 | ) | — | — | — | — | — | — | — | (34,101 | ) | — | (54,625 | ) | ||||||||||||||||||||||||||||||
|
|
|
|
|
|
|
|
|
|
|
|
|
|
|
|
|
|
|
|
|
|
|
|||||||||||||||||||||||
| Balances at December 31, 2014 |
$ | — | 4,842,968 | $ | 5 | 2,957,059 | $ | 3 | 2,682,351 | $ | 3 | $ | 86,591 | $ | (34,101 | ) | $ | (311 | ) | $ | 52,190 | |||||||||||||||||||||||
|
|
|
|
|
|
|
|
|
|
|
|
|
|
|
|
|
|
|
|
|
|
|
|||||||||||||||||||||||
| Stock-based compensation |
— | — | — | — | — | — | — | 847 | — | — | 847 | |||||||||||||||||||||||||||||||||
| Exercise of stock options |
— | 275,775 | — | — | — | — | — | (1,429 | ) | — | — | (1,429 | ) | |||||||||||||||||||||||||||||||
| Tax benefit of equity issuance costs |
— | — | — | — | — | — | — | 1,081 | — | — | 1,081 | |||||||||||||||||||||||||||||||||
| Comprehensive income: |
— | |||||||||||||||||||||||||||||||||||||||||||
| Foreign currency translation adjustment net of tax benefit of $506 |
— | — | — | — | — | — | — | — | — | 597 | 597 | |||||||||||||||||||||||||||||||||
| Net loss |
— | — | — | — | — | — | — | — | (19,911 | ) | — | (19,911 | ) | |||||||||||||||||||||||||||||||
|
|
|
|
|
|
|
|
|
|
|
|
|
|
|
|
|
|
|
|
|
|
|
|||||||||||||||||||||||
| Balances at December 31, 2015 |
$ | — | 5,118,743 | $ | 5 | 2,957,059 | $ | 3 | 2,682,351 | $ | 3 | $ | 87,090 | $ | (54,012 | ) | $ | 286 | $ | 33,375 | ||||||||||||||||||||||||
|
|
|
|
|
|
|
|
|
|
|
|
|
|
|
|
|
|
|
|
|
|
|
|||||||||||||||||||||||
The accompanying notes are an integral part of these combined and consolidated financial statements.
F-6
Table of Contents
Elevate Credit, Inc. and Subsidiaries
COMBINED AND CONSOLIDATED STATEMENTS OF CASH FLOWS
| For the years ended December 31, | ||||||||
| (Dollars in thousands) | 2015 | 2014 | ||||||
| CASH FLOWS FROM OPERATING ACTIVITIES: |
||||||||
| Net loss |
$ | (19,911 | ) | $ | (54,625 | ) | ||
| Less: Net income from discontinued operations, net of tax |
— | (135 | ) | |||||
|
|
|
|
|
|||||
| Net loss from continuing operations |
(19,911 | ) | (54,760 | ) | ||||
| Adjustments to reconcile net loss to net cash provided by operating activities: |
||||||||
| Depreciation and amortization |
8,898 | 8,317 | ||||||
| Provision for loan losses |
232,650 | 170,908 | ||||||
| Stock-based compensation |
847 | 496 | ||||||
| Amortization of debt issuance costs |
199 | 74 | ||||||
| Amortization of loan premium |
454 | — | ||||||
| Deferred income tax expense, net |
(5,173 | ) | (20,917 | ) | ||||
| Unrealized loss from foreign currency transactions |
2,385 | 1,357 | ||||||
| Non-operating gain |
(5,523 | ) | — | |||||
| Changes in operating assets and liabilities: |
||||||||
| Prepaid expenses and other assets |
(1,023 | ) | (218 | ) | ||||
| Reserve deposits |
(9,287 | ) | — | |||||
| Receivables from payment processors |
(6,837 | ) | (4,000 | ) | ||||
| Receivables from CSO lenders |
(2,267 | ) | (3,686 | ) | ||||
| Interest receivable |
(70,859 | ) | (54,401 | ) | ||||
| State and other taxes payable |
178 | 160 | ||||||
| Deferred revenue |
(963 | ) | 2,217 | |||||
| Accounts payable and accrued liabilities (including $(962) and $1,266, respectively, from payable to Think Finance) |
4,664 | 9,731 | ||||||
|
|
|
|
|
|||||
| Net cash provided by continuing operating activities |
128,432 | 55,278 | ||||||
| Net cash provided by discontinued operating activities |
— | 370 | ||||||
|
|
|
|
|
|||||
| Net cash provided by operating activities |
128,432 | 55,648 | ||||||
|
|
|
|
|
|||||
| CASH FLOWS FROM INVESTING ACTIVITIES: |
||||||||
| Loans receivable originated or participations purchased |
(667,433 | ) | (427,905 | ) | ||||
| Principal collections and recoveries on loans receivable |
381,044 | 214,185 | ||||||
| Participation premium paid |
(1,019 | ) | — | |||||
| Change in restricted cash |
6,357 | (3,882 | ) | |||||
| Purchases of property and equipment |
(9,272 | ) | (9,274 | ) | ||||
| Change in notes receivable |
— | 124 | ||||||
| Domain name acquisition |
— | (230 | ) | |||||
|
|
|
|
|
|||||
| Net cash used in investing activities |
(290,323 | ) | (226,982 | ) | ||||
|
|
|
|
|
|||||
The accompanying notes are an integral part of these combined and consolidated financial statements.
F-7
Table of Contents
Elevate Credit, Inc. and Subsidiaries
COMBINED AND CONSOLIDATED STATEMENTS OF CASH FLOWS — (Continued)
| For the years ended December 31, | ||||||||
| (Dollars in thousands) | 2015 | 2014 | ||||||
| CASH FLOWS FROM FINANCING ACTIVITIES: |
||||||||
| Proceeds from notes payable (including $0 and $24,800 from Think Finance) |
$ | 165,000 | $ | 199,600 | ||||
| Repayment of notes payable to Think Finance |
— | (24,800 | ) | |||||
| Payment of capital lease obligations |
(228 | ) | (197 | ) | ||||
| Debt issuance costs paid |
(489 | ) | (517 | ) | ||||
| Equity issuance costs paid |
(2,863 | ) | — | |||||
| Payment of deferred consideration |
— | (1 | ) | |||||
| Proceeds from stock option exercises |
436 | 27 | ||||||
| Contribution from Think Finance |
— | 24,032 | ||||||
|
|
|
|
|
|||||
| Net cash provided by continuing financing activities |
161,856 | 198,144 | ||||||
| Net cash used in discontinued financing activities |
— | (412 | ) | |||||
|
|
|
|
|
|||||
| Net cash provided by financing activities |
161,856 | 197,732 | ||||||
|
|
|
|
|
|||||
| Effect of exchange rates on cash |
(712 | ) | (1,335 | ) | ||||
|
|
|
|
|
|||||
| Net (decrease) increase in cash and cash equivalents |
(747 | ) | 25,063 | |||||
| Less: increase in cash and cash equivalents from discontinued operations |
— | 41 | ||||||
|
|
|
|
|
|||||
| Change in cash and cash equivalents from continuing operations |
(747 | ) | 25,104 | |||||
| Cash and cash equivalents, beginning of period (including $278 of cash classified as Assets of discontinued operations at December 31, 2014) |
29,797 | 4,415 | ||||||
|
|
|
|
|
|||||
| Cash and cash equivalents, end of period |
$ | 29,050 | $ | 29,519 | ||||
|
|
|
|
|
|||||
| Supplemental cash flow information: |
||||||||
| Interest paid |
$ | 34,476 | $ | 11,747 | ||||
| Taxes paid |
438 | — | ||||||
In the years ended December 31, 2015 and 2014, the Company purchased equipment of $0.0 million and $0.7 million, respectively, through a capital lease, which is recorded in Property and equipment, net and Accounts payable and accrued liabilities in the Combined and Consolidated Balance Sheets. In the years ended December 31, 2015 and 2014, the Company had net exercises of stock options of approximately $1.1 million and $0.8 million, respectively, which were recorded in Additional paid-in capital and Accounts payable and accrued liabilities in the Consolidated Balance Sheets.
The table below reconciles Contribution from Think Finance within Cash flows from financing activities in the Combined and Consolidated Statements of Cash Flows with Net transfers from Think Finance in the Combined and Consolidated Statements of Stockholders’ Equity for the four months ended April 30, 2014:
| Contribution from Think Finance |
$ | 24,032 | ||
| Net cash used in financing activities from discontinued operations |
(309 | ) | ||
| Stock-based compensation |
132 | |||
| Write off of deferred tax assets retained by Think Finance (including $(440) related to discontinued operations) |
(11,340 | ) | ||
|
|
|
|||
| Net transfers from Think Finance |
$ | 12,515 | ||
|
|
|
The accompanying notes are an integral part of these combined and consolidated financial statements.
F-8
Table of Contents
Elevate Credit, Inc. and Subsidiaries
NOTES TO COMBINED AND CONSOLIDATED FINANCIAL STATEMENTS
For the years ended December 31, 2015 and 2014
NOTE 1—SUMMARY OF SIGNIFICANT ACCOUNTING POLICIES
The Company’s accounting and reporting policies are in accordance with accounting principles generally accepted in the United States (“US GAAP”) and conform, as applicable, to general practices within the finance company industry. The following is a description of the more significant of these policies used in preparing the combined and consolidated financial statements.
Business Operations
Elevate Credit, Inc. (the “Company”) is a Delaware corporation. The Company provides technology-driven, progressive online credit solutions to non-prime consumers. The Company uses advanced technology and proprietary risk analytics to provide more convenient and more responsible financial options to its customers, who are not well-served by either banks or legacy non-prime lenders. The Company currently offers unsecured online installment loans and lines of credit in the United States (the “US”) and the United Kingdom (the “UK”). The Company’s products, Rise, Elastic and Sunny, reflect its mission of “Good Today, Better Tomorrow” and provide customers with access to competitively priced credit and services while helping them build a brighter financial future with credit building and financial wellness features. In the UK, the Company directly offers unsecured installment loans via the internet through its wholly owned subsidiary, Elevate Credit International (UK), Limited, (“ECI”) under the brand name of Sunny.
Stock Split
The Company’s previously issued financial statements as of and for the year ended December 31, 2014 reported the effects of the 2.5-for-1 stock split as if the stock split had occurred prior to the issuance of those financial statements. Because the stock split will not be effected until the closing of the Company’s IPO, the financial statements have been revised to remove the effects of the stock split. However, unaudited pro forma earnings per share is disclosed to give effect to the stock split as if the split had occurred prior to the issuance of the financial statements. All numbers of shares of common stock and per share common stock data in the accompanying combined and consolidated financial statements and related notes have not been adjusted to reflect a 2.5-for-1 forward stock split. See Note 20—Stock Split for more details.
Spin-Off
On January 31, 2014, Think Finance, Inc. (“Think Finance”), the predecessor parent company, formed a new company, Elevate Credit, Inc. On May 1, 2014 (effective at the beginning of the day), Think Finance contributed to the Company certain assets and liabilities associated with its direct lending businesses and completed a tax-free spin-off of 100% of the Company on a carryover basis to the stockholders of Think Finance, in accordance with the distribution agreement (the “Spin-Off”). In connection with the Spin-Off, the Company entered into several other agreements with Think Finance that govern shared services, tax sharing, data sharing, employee matters and a credit facility. The Company accounted for this transaction in accordance with the guidance in Accounting Standards Codification (“ASC”) 505-60-25, Equity—Spinoffs and Reverse Spinoffs. The assets and liabilities associated with the Think Finance service provider business remained at Think Finance and were not contributed to the Company.
As a result of the Spin-Off, the Company recognized the par value and additional paid-in capital in connection with the issuance of 4,643,133 shares of common stock, 2,957,059 shares of Convertible
F-9
Table of Contents
Elevate Credit, Inc. and Subsidiaries
NOTES TO COMBINED AND CONSOLIDATED FINANCIAL STATEMENTS — (Continued)
For the years ended December 31, 2015 and 2014
Series A Preferred Stock, and 2,682,351 shares of Convertible Series B Preferred Stock, exchanged for the net assets contributed at that time, and the Company began accumulating retained earnings upon completion of the Spin-Off on May 1, 2014.
Basis of Presentation
The combined and consolidated financial statements include the accounts of the Company and its wholly owned subsidiaries as of December 31, 2014. In addition to the accounts of the Company and its wholly owned subsidiaries, a variable interest entity (“VIE”) where the company is the primary beneficiary is also included in our combined and consolidated financial statements as of December 31, 2015. See Note 5—Variable Interest Entity for more information on the evaluation of this variable interest. The combined financial statements include amounts prior to the Spin-Off that have been derived from the consolidated financial statements and accounting records of Think Finance, using the historical results of operations, and historical basis of assets and liabilities of the direct lending business. In preparing these combined and consolidated financial statements, management has made certain assumptions or used methodologies to allocate various expenses from Think Finance to the Company. All such costs and expenses are assumed to be settled with Think Finance through Owner’s net investment equity account in the period in which the costs were incurred. Current income taxes are also assumed to be settled with Think Finance through Owner’s net investment and settlement is deemed to occur in the year of recognition in the current income tax provision. Management believes the assumptions and methodologies used in these allocations are reasonable. However, the combined financial statements included herein may not necessarily reflect the Company’s results of operations, financial position and cash flows in the future or what its results of operations, financial position and cash flows would have been had the Company been a stand-alone company during the periods presented.
Beginning May 1, 2014, the Company’s consolidated financial statements include all majority-owned subsidiaries and assets and liabilities of the Company. Beginning July 1, 2015, the Company’s consolidated financial statements include a VIE where the Company is the primary beneficiary. All material intercompany transactions between and among the Company and its subsidiaries (including the VIE) have been eliminated. Prior to May 1, 2014, all intercompany transactions between the Company and Think Finance have been included within the combined and consolidated financial statements and are considered to be effectively settled through contributions or distributions within Owner’s net investment at the time the transactions were recorded. The total net effect of these intercompany transactions is reflected in the Combined and Consolidated Statements of Cash Flows as financing activities.
Allocation of Expenses from Think Finance
The Combined Statements of Operations prior to the Spin-Off include expense allocations for certain corporate functions historically provided by Think Finance. These allocations were made on a specifically identifiable basis or using allocation methods such as revenues, headcount or other reasonable methods.
The Company entered into a shared services agreement with Think Finance from the date of the Spin-Off through October 2014 to provide for an orderly transition of services to customers. Per this agreement, certain functions including human resources, finance, facilities management, and information technology were to be shared between the Company and Think Finance. To the extent that a shared-services cost was not demonstrably attributable to either party, the cost was allocated ratably on a percentage of revenues basis. See Note 17—Related Parties for further discussion of allocated expenses.
F-10
Table of Contents
Elevate Credit, Inc. and Subsidiaries
NOTES TO COMBINED AND CONSOLIDATED FINANCIAL STATEMENTS — (Continued)
For the years ended December 31, 2015 and 2014
Use of Estimates
The preparation of the combined and consolidated financial statements in conformity with US GAAP requires management to make estimates and assumptions that affect the reported amounts of assets and liabilities, disclosure of contingent assets and liabilities at the date of the combined and consolidated financial statements and the reported amounts of revenues and expenses during the reporting period.
Significant items subject to such estimates and assumptions include the valuation of the allowance for loan losses, goodwill, long-lived and intangible assets, deferred revenues, contingencies, the income tax provision and the valuation allowance against deferred tax assets. The Company bases its estimates on historical experience with Think Finance, current data and experience since the Spin-Off, and assumptions that are believed to be reasonable. Actual results could differ from those estimates.
Immaterial Correction of an Error in Previously Issued Consolidated Financial Statements
The Company determined that it had previously incorrectly reported the net exercise of one grant of stock options, which were originally determined to be exercised as of February 28, 2015. Upon subsequent review, the Company determined that the exercise had occurred on October 31, 2014 and should have been reflected in the previously issued consolidated financial statements as of and for the period from May 1, 2014 through December 31, 2014. The Company has corrected its Common stock and Additional paid-in capital to reflect the issuance of these shares as of October 31, 2014. The Company also corrected its Accrued expenses within its consolidated liabilities due to the withholding taxes associated with the net exercise effective as of October 31, 2014. The correction did not result in a change to the Company’s previously reported revenues, expenses, net loss or total assets, and the Company does not believe the impact on the previously issued financial statements is material.
The following tables reconcile the Company’s consolidated Common stock, Additional paid-in-capital and Accrued expenses from the previously-reported results to the corrected amounts for the year ended December 31, 2014:
| Consolidated balance sheet (dollars in thousands) | ||||
| Common stock (as previously reported) |
$ | 5 | ||
| Impact of stock exercise effective October 31, 2014 |
— | |||
|
|
|
|||
| Common stock (as corrected) |
$ | 5 | ||
|
|
|
|||
| Additional paid-in capital (as previously reported) |
$ | 87,406 | ||
| Impact of stock exercise effective October 31, 2014 |
(815 | ) | ||
|
|
|
|||
| Additional paid-in capital (as corrected) |
$ | 86,591 | ||
|
|
|
|||
| Accounts payable and accrued expenses (as previously reported) |
$ | 27,731 | ||
| Impact of stock exercise effective October 31, 2014 |
815 | |||
|
|
|
|||
| Accounts payable and accrued expenses (as corrected) |
$ | 28,546 | ||
|
|
|
|||
Reclassification
Certain amounts have been reclassified due to the presentation of discontinued operations as of and for the year ended December 31, 2014. See Note 3—Discontinued Operations. In addition, a reclassification
F-11
Table of Contents
Elevate Credit, Inc. and Subsidiaries
NOTES TO COMBINED AND CONSOLIDATED FINANCIAL STATEMENTS — (Continued)
For the years ended December 31, 2015 and 2014
of approximately $12.1 million between Loans receivable originated or participations purchased and Principal collections and recoveries on loans receivable was made within investing activities on the Combined and Consolidated Statements of Cash Flows for the year ended December 31, 2014 to properly reflect the incremental funding associated with refinanced loans within loan origination cash outflows. Certain immaterial amounts have also been reclassified between State and other taxes payable on the Consolidated Balance Sheets in order to conform to the current year presentation.
Cash and Cash Equivalents
The Company considers all highly-liquid investments purchased with an original maturity of three months or less to be cash equivalents.
Restricted Cash
Amounts restricted under lending agreements, third-party processing agreements and state licensing requirements are classified separately as restricted cash.
Revenue Recognition
The Company recognizes consumer loan fees as revenues for each of the loan products it offers. Revenues on the Combined and Consolidated Statements of Operations include: finance charges, lines of credit fees, fees for services provided through CSO programs (“CSO Fees”), and nonsufficient funds fees (“NSF fees”), as well as any other fees or charges permitted by applicable laws and pursuant to the agreement with the borrower. The Company also recorded revenues related to the sale of customer applications to unrelated third parties. These applications are sold with the customer’s consent in the event that the Company or its CSO lenders are unable to offer the customer a loan. Revenue is recognized at the time of the sale. Other revenues also include marketing and licensing fees received from the third-party lender related to the Elastic product. Revenue related to these fees is recognized when service is performed.
The Company accrues finance charges on installment loans on a constant yield basis over their terms. The Company accrues fixed charges such as CSO and lines of credit fees as they are earned over the term of the loan. The Company does not accrue finance charges and other fees on installment loans or lines of credit for which payment is 60 days past due. Installment loans and lines of credit are considered past due if a scheduled payment is not paid on its due date. Payments received on past due loans are applied against the loan and accrued interest balance to bring the loan current. Payments are first applied to accrued fees and interest, and then to the loan balance.
Effective through April 30, 2015, the Company offered a reward program for certain installment loan customers. Customers could earn points for performing various activities such as making a consecutive number of timely loan payments or completing financial education courses provided by the Company. These points could then be used to reduce the interest rate of an outstanding loan. The Company estimated the expected future interest discounts to be provided based on the likelihood that the customer would earn enough points over the life of the loan to achieve a discount. If a discount would be achieved, an effective yield over the life of the loan was calculated (considering the future discounts) and any interest collected in excess of the effective yield was deferred. The reward program was discontinued on April 30, 2015.
F-12
Table of Contents
Elevate Credit, Inc. and Subsidiaries
NOTES TO COMBINED AND CONSOLIDATED FINANCIAL STATEMENTS — (Continued)
For the years ended December 31, 2015 and 2014
Installment Loans and Lines of Credit
Installment loans and lines of credit, including receivables for finance charges and fees, are unsecured and reported as Loans receivable on the Consolidated Balance Sheets. Installment loans are multi-payment loans that require the pay-down of portions of the outstanding principal balance in multiple installments. Line of credit accounts include customer cash advances made through the Elastic line of credit product. The lines of credit represent participation interests acquired from a third-party lender. Based on agreements with the third-party lender, the VIE pays a loan premium on the participation interests acquired. The loan premium is amortized over the expected life of the outstanding draw. See Note 5—Variable Interest Entity for more information regarding these participation interests.
The Company considers impaired loans as accounts over 60 days past due or loans which become uncollectible based on information that the Company becomes aware of (e.g., receipt of customer bankruptcy notice). The impaired loans are charged-off at the time that they are deemed to be uncollectible.
Allowance for Loan Losses
The Company has adopted Financial Accounting Standards Board (“FASB”) guidance for disclosures about the credit quality of financing receivables and the allowance for loan losses (“allowance”). The Company maintains an allowance for loan losses for loans and interest receivable at a level estimated to be adequate to absorb credit losses inherent in the outstanding loans receivable. The Company primarily utilizes historical loss rates by product, stratified by delinquency ranges, to determine the allowance, but also considers recent collection and delinquency trends, as well as macro-economic conditions that may affect portfolio losses. Additionally, due to the uncertainty of economic conditions and cash flow resources of the Company’s customers, the estimate of the allowance for loan losses is subject to change in the near-term and could significantly impact the combined and consolidated financial statements. If a loan is deemed to be uncollectible before it is fully reserved, it is charged-off at that time.
Increases in the allowance are created by recording a provision for loan losses in the Combined and Consolidated Statements of Operations. Installment loans and lines of credit are charged off, which reduces the allowance, when they are over 60 days past due, or earlier if deemed uncollectible. Recoveries on losses previously charged to the allowance are credited to the allowance when collected.
Credit Service Organization
The Company also provides services in connection with installment loans originated by independent third-party lenders (“CSO lenders”), whereby the Company acts as a credit services organization/credit access business on behalf of consumers in accordance with applicable state laws (the “CSO program”). The CSO program includes arranging loans with CSO lenders, assisting in the loan application, documentation and servicing processes.
Under the CSO program, the Company guarantees the repayment of the customer’s loan to the CSO lenders as part of the credit services it provides to the customer. A customer who obtains a loan through the CSO program pays the Company a fee for the credit services, including the guaranty, and enters into a contract with the CSO lenders governing the credit services arrangement. The CSO fee received is recognized over the life of the loan. We estimate a liability for losses associated with the guaranty provided
F-13
Table of Contents
Elevate Credit, Inc. and Subsidiaries
NOTES TO COMBINED AND CONSOLIDATED FINANCIAL STATEMENTS — (Continued)
For the years ended December 31, 2015 and 2014
to the CSO lenders using assumptions and methodologies similar to the allowance for loan losses detailed previously. The CSO program requires that the Company fund a cash reserve equal to 20%-30% of the outstanding loan principal within the CSO program portfolio.
The Company also had a Receivable from CSO lenders related primarily to CSO fees received by the CSO lenders from customers. As of December 31, 2015 and 2014, respectively, estimated losses of approximately $6.0 million and $3.6 million for the CSO owned loans of approximately $44.1 million and $25.0 million, respectively, are initially recorded at fair value and are included in Accounts payable and accrued expenses in the Consolidated Balance Sheets. See Note 4—Loans Receivable and Revenues for additional information on loans receivable and the provision for loan losses. During 2015, the cash restriction securing the guaranty of CSO loan balances was released. The receivables and restricted cash related to the CSO lenders as of December 31, 2015 and 2014 are as follows:
| (Dollars in thousands) | 2015 | 2014 | ||||||
| Receivable related to 20%-30% cash reserve |
$ | 8,473 | $ | 5,216 | ||||
| Receivable related to CSO fees collected by CSO lenders |
1,246 | 2,236 | ||||||
| Restricted cash securing guaranty of loan balances |
— | 6,259 | ||||||
The CSO lenders are considered VIE’s of the Company under ASC 815-10-65, Variable Interest Entities. The Company does not have any ownership interest in the CSO lenders, does not exercise control over them, and is not the primary beneficiary, and therefore, does not consolidate the CSO lenders’ results with its results.
Receivables from Payment Processors
The Company has entered into agreements with third-party service providers to conduct processing activities, including the funding of new customer loans and the collection of customer payments for those loans. In accordance with contractual agreements, these funds are settled back to the Company within one to three business days after the date of the originating transaction. Accordingly, the Company had approximately $13.9 million and $7.3 million due from processing providers as of December 31, 2015 and 2014, respectively, which is included in Receivable from payment processors in the Consolidated Balance Sheets.
Direct Marketing Costs
Marketing expenses consist of online marketing costs such as sponsored search and advertising on social networking sites, and other marketing costs such as purchased television and radio air time and direct mail print advertising. In addition, marketing expense includes affiliate costs paid to marketers in exchange for information for applications from potential customers. Online marketing, affiliate costs and other marketing costs are expensed as incurred.
Selling and Marketing Costs
Selling and marketing costs include costs associated with the use of agencies that perform creative services and monitor and measure the performance of the various marketing channels. Selling and marketing costs also include the production costs associated with media advertisements that are expensed as incurred over the licensing or production period.
F-14
Table of Contents
Elevate Credit, Inc. and Subsidiaries
NOTES TO COMBINED AND CONSOLIDATED FINANCIAL STATEMENTS — (Continued)
For the years ended December 31, 2015 and 2014
Property and Equipment, net
Property and equipment are stated at cost, net of accumulated depreciation and amortization. The Company capitalizes all acquisitions of property and equipment of $0.5 thousand or greater. The Company capitalizes certain software development costs. Costs incurred in the preliminary stages of development are expensed. Costs incurred thereafter, including external direct costs of materials and services as well as payroll and payroll-related costs, are capitalized.
Software development costs, which are included in Property and equipment, net on the Consolidated Balance Sheets, as of December 31, 2015 and 2014, and related depreciation expense, which is included in Depreciation and amortization within the Combined and Consolidated Statements of Operations for the years ended December 31, 2015 and 2014 were as follows:
| (Dollars in thousands) | 2015 | 2014 | ||||||
| Software development cost |
$ | 26,377 | $ | 21,665 | ||||
| Less: accumulated depreciation |
(19,303 | ) | (12,783 | ) | ||||
|
|
|
|
|
|||||
| Net book value |
$ | 7,074 | $ | 8,882 | ||||
|
|
|
|
|
|||||
| Depreciation expense |
$ | 6,520 | $ | 6,328 | ||||
Maintenance and repairs that do not extend the useful life of the assets are expensed as incurred. Depreciation is computed using the straight-line method over the estimated useful lives of the depreciable assets as follows:
| Furniture and fixtures |
7 years | |
| Equipment |
3-5 years | |
| Leasehold improvements |
The lesser of the related lease term or useful life of 3-5 years | |
| Software and software development |
3 years |
Debt Issuance Costs
Costs incurred for issuing the Notes payable are deferred and amortized using the straight-line method over the life of the related debt, which approximates the effective interest method. The unamortized balance of debt issuance costs was approximately $0.7 million and $0.4 million at December 31, 2015 and 2014, respectively, and is included in Prepaid expenses and other assets in the Consolidated Balance Sheets. Amortization of debt issuance costs of approximately $0.2 million and $0.1 million was recognized for the years ended December 31, 2015 and 2014, respectively, and is included within Net interest expense in the Combined and Consolidated Statements of Operations.
Equity Issuance Costs
Costs incurred related to the Company’s anticipated initial public offering have been deferred, and will be charged against the gross proceeds of the offering. The balance of these equity issuance costs at December 31, 2015 was approximately $2.9 million, and is included in Prepaid expenses and other assets in the Consolidated Balance Sheet.
F-15
Table of Contents
Elevate Credit, Inc. and Subsidiaries
NOTES TO COMBINED AND CONSOLIDATED FINANCIAL STATEMENTS — (Continued)
For the years ended December 31, 2015 and 2014
Income Taxes
The Company’s operating results were previously included in Think Finance’s consolidated US federal and state income tax returns, as well as in certain foreign jurisdictions. The Company filed a separate federal consolidated income tax return for the period May 1, 2014 through December 31, 2014. The provision for income taxes in the combined financial statements prior to the Spin-Off was determined on a separate return basis as if the Company was a separate filer. The deferred tax assets and liabilities allocated to the Company by Think Finance were treated as an equity contribution by Think Finance upon completion of the Spin-Off. See Note 13—Income Taxes for further discussion.
Income taxes are accounted for under the asset and liability method. Deferred tax assets and liabilities are recognized for the future tax consequences attributable to differences between the financial statement carrying amounts of existing assets and liabilities and their respective tax bases and operating loss and tax credit carryforwards. Deferred tax assets and liabilities are measured using enacted tax rates expected to apply to taxable income in the years in which those temporary differences are expected to be recovered or settled. The effect on deferred tax assets and liabilities of a change in tax rates is recognized in income in the period that includes the enactment date. Valuation allowances are established when necessary to reduce deferred tax assets to the amounts that are more likely than not to be realized.
Relative to uncertain tax positions, the Company accrues for losses it believes are probable and can be reasonably estimated. The amount recognized is subject to estimate and management judgment with respect to the likely outcome of each uncertain tax position. The amount that is ultimately sustained for an individual uncertain tax position or for all uncertain tax positions in the aggregate could differ from the amount recognized. If the amounts recorded are not realized or if penalties and interest are incurred, the Company has elected to record all amounts within income tax expense.
The Company has no recorded liabilities for US uncertain tax positions at December 31, 2015 and 2014. Tax periods from fiscal years 2014-2015 remain open and subject to examination for US federal and state tax purposes. As the Company had no operations nor had filed US federal tax returns prior to May 1, 2014, there are no other US federal or state tax years subject to examination.
The Company has reduced the deferred tax asset related to the UK net operating loss carryforward due to an uncertain tax position at December 31, 2015 and 2014. For UK taxes, tax periods from fiscal years 2010-2015 remain open and subject to examination as ECI was a legal entity acquired by Think Finance on December 31, 2010 and transferred to the Company as part of the Spin-Off transaction.
Goodwill and Indefinite Lived Intangible Assets
Goodwill represents the excess of the purchase price over the fair value of the net tangible and identifiable intangible assets acquired in each business combination. In accordance with ASC 350-20-35, Goodwill—Subsequent Measurement, the Company performs an impairment review of goodwill and intangible assets with an indefinite life annually at October 31 and between annual tests if an event occurs or circumstances change that would more likely than not reduce the fair value of a reporting unit below its carrying amount. The Company completed its annual test and determined that there was no evidence of impairment of goodwill or indefinite lived intangible assets. No events or circumstances occurred between October 31 and December 31, 2015 that would more likely than not reduce the fair value of the reporting units below the carrying amount.
F-16
Table of Contents
Elevate Credit, Inc. and Subsidiaries
NOTES TO COMBINED AND CONSOLIDATED FINANCIAL STATEMENTS — (Continued)
For the years ended December 31, 2015 and 2014
The Company’s impairment evaluation of goodwill is based on comparing the fair value of the Company’s reporting units to their carrying value. The fair value of the reporting units was determined based on a weighted average of the income and market approaches. The income approach establishes fair value based on estimated future cash flows of the reporting units, discounted by an estimated weighted-average cost of capital developed using the capital asset pricing model, which reflects the overall level of inherent risk of the reporting units. The income approach uses the Company’s projections of financial performance for a six to nine-year period and includes assumptions about future revenues growth rates, operating margins and terminal values. The market approach establishes fair value by applying cash flow multiples to the reporting units’ operating performance. The multiples are derived from other publicly traded companies that are similar but not identical from an operational and economic standpoint.
Intangible Assets Subject to Amortization
Intangible assets primarily include the fair value assigned to non-compete agreements at acquisition less any accumulated amortization. Non-compete agreements are amortized on a straight line basis over the term of the agreement. An evaluation of the recoverability of intangible assets subject to amortization is performed whenever the facts and circumstances indicate that the carrying value may be impaired. An impairment loss is recognized if the future undiscounted cash flows associated with the asset and the estimated fair value of the asset are less than the asset’s corresponding carrying value. The amount of the impairment loss, if any, is the excess of the asset’s carrying value over its estimated fair value. No impairment losses related to intangible assets subject to amortization occurred during the years ended December 31, 2015 and 2014.
Deferred Rent
The Company recognizes escalating lease payments on a straight-line basis over the term of each respective lease with the difference between cash payment and rent expense recorded as a deferred rent liability. As of December 31, 2015 and 2014, the Company had a deferred rent liability of $17 thousand and $1 thousand, respectively.
Foreign Currency Translations and Transactions
The functional currency for ECI is the British Pound (“GBP”). The assets and liabilities of ECI are translated into US dollars (“USD”) at the exchange rates in effect at each balance sheet date, and the resulting adjustments are recorded in Accumulated other comprehensive income (loss), net as a separate component of equity. Revenues and expenses are translated at the monthly average exchange rates occurring during each period.
The Company has designated its intercompany loan with ECI as long-term. The intercompany loan is denominated in GBP. As a result, gains and losses related to the remeasurement of this balance are recognized in Accumulated other comprehensive income (loss), net in the accompanying Combined and Consolidated Statements of Stockholders’ Equity.
On October 1, 2014, the Company refinanced a portion of the intercompany loan balance as part of a third-party credit facility that was amended to include ECI (see Note 8—Notes Payable). The total intercompany balance at that date was approximately $85.6 million. The portion of the intercompany
F-17
Table of Contents
Elevate Credit, Inc. and Subsidiaries
NOTES TO COMBINED AND CONSOLIDATED FINANCIAL STATEMENTS — (Continued)
For the years ended December 31, 2015 and 2014
balance that was expected to be settled from proceeds from the third-party credit facility, totaling approximately $27.3 million, was no longer considered to be of a long-term investment nature, and gains and losses related to the remeasurement of that portion of the intercompany loan balance were recognized in Foreign currency transaction loss in the accompanying Combined and Consolidated Statements of Operations, starting from October 1, 2014. This resulted in a loss of approximately $0.7 million for the year ended December 31, 2014. The Company did not intend to settle any further portion of the intercompany loan balance in the foreseeable future at that date, and therefore, the remaining portion of approximately $58.3 million at October 1, 2014 was considered to be of a long-term investment nature. The Company did intend to continue settling periodic interest payments, and therefore, gains and losses related to the remeasurement of the corresponding interest receivable were recognized in Foreign currency transaction loss in the accompanying Combined and Consolidated Statements of Operations from October 1, 2014 through December 31, 2014. The foreign currency remeasurement loss related to interest receivable resulted in a loss of $20 thousand for the year ended December 31, 2014. Effective November 30, 2015, the Company converted the intercompany loan principal balance to equity, and forgave the interest (which eliminates upon consolidation) that was accrued and unpaid on the loan at that date. The foreign currency remeasurement loss related to intercompany accounts was $0.3 million for the year ended December 31, 2015. These intercompany loan transactions had no impact to our consolidated results of operations.
As ECI’s term note under the third-party credit facility is denominated in USD, ECI remeasures its term note monthly. The unrealized foreign currency loss from foreign remeasurement was approximately $2.1 million and $0.6 million for the years ended December 31, 2015 and 2014, respectively, and is included in Foreign currency transaction loss in the Combined and Consolidated Statements of Operations. Realized foreign currency losses of $0 and $51 thousand for the years ended December 31, 2015 and 2014, respectively, were recognized from the settlement of foreign currency denominated transactions and also included in Foreign currency transaction loss in the Combined and Consolidated Statements of Operations.
Comprehensive Income
Accumulated other comprehensive loss, net is comprised solely of the impact of foreign currency translation adjustments. For the years ended December 31, 2015 and 2014, the change in total other comprehensive income, net of tax was a gain (loss) of approximately $0.6 million and $0.8 million, respectively, and no amounts have been reclassified from accumulated other comprehensive income to net income.
Concentration of Credit Risk
The Company maintains cash and cash equivalent balances in bank deposit accounts that, at times, may exceed federally insured limits. The Company has not experienced any losses in such accounts. The Company believes it is not exposed to any significant credit risk on cash and cash equivalents.
Fair Value Measurements
The Company applies the provisions of ASC Topic 820, Fair Value Measurements and Disclosures, for fair value measurements of financial and non-financial assets and liabilities that are recognized or disclosed at fair value in the financial statements on a recurring or non-recurring basis, as applicable. This guidance defines fair value as the price that would be received to sell an asset or paid to transfer a
F-18
Table of Contents
Elevate Credit, Inc. and Subsidiaries
NOTES TO COMBINED AND CONSOLIDATED FINANCIAL STATEMENTS — (Continued)
For the years ended December 31, 2015 and 2014
liability in an orderly transaction between market participants at the measurement date (also referred to as an exit price). This guidance also establishes a framework for measuring fair value and expands disclosures about fair value measurements. See Note 12—Fair Value Measurements for additional information on fair value measurements.
Transfers and Servicing of Financial Assets
The Company applies the provisions of ASC Topic 860, Transfers and Servicing, for accounting for transfers and servicing of financial assets, which requires that specific criteria are met in order to record a transfer of financial assets as a sale. To qualify for sale treatment, the guidance requires that the Company does not have continuing involvement with the sold assets and also requires the Company to no longer retain effective control of the assets. During the years ended December 31, 2015 and 2014, the Company entered into sales agreements with third-party firms whereby the Company sold charged off customer loans to the third party. The agreements meet the sale criteria, and as a result, proceeds of approximately $13.0 million and $8.6 million for the years ended December 31, 2015 and 2014, respectively, were recorded as a recovery of charged off loans in the Allowance for loan losses.
A VIE acquired certain loan participations in unsecured lines of credit originated by a third-party lender to individual borrowers, which meet the criteria of a participation interest. Per the terms of the participation arrangement with the third-party lender, loan servicing is retained by the third-party lender, and the VIE reimburses the lender for the proportionate share of the servicing costs. See Note 5—Variable Interest Entity for additional information related to the participation interests purchased.
Stock-Based Compensation
In accordance with ASC Topic 718, Compensation-Stock Compensation, all stock-based compensation made to employees is measured based on the grant-date fair value of the awards and recognized as compensation expense on a straight-line basis over the period during which the option holder is required to perform services in exchange for the award (the vesting period). The Company uses the Black-Scholes-Merton Option Pricing Model to estimate the fair value of stock options. The use of the option valuation model requires subjective assumptions, including the fair value of the Company’s common stock, the expected term of the option and the expected stock price volatility based on peer companies. Additionally, the recognition of stock-based compensation expense requires an estimation of the number of options that will ultimately vest and the number of options that will ultimately be forfeited.
Recently Adopted Accounting Standards
In April 2014, the FASB issued Accounting Standards Update (“ASU”) 2014-08, Presentation of Financial Statements (Topic 205) and Property, Plant, and Equipment (Topic 360): Reporting Discontinued Operations and Disclosures of Disposals of Components of an Entity (“ASU 2014-08”). The amendments in ASU 2014-08 change the criteria for reporting discontinued operations and enhance disclosures in this area. The new guidance requires expanded disclosures about discontinued operations that will provide financial statement users with more information about the assets, liabilities, income, and expenses of discontinued operations. The new guidance also requires disclosure of the pre-tax income or loss attributable to a disposal of an individually significant component of an organization that does not qualify for discontinued operations presentation in the financial statements. The Company is
F-19
Table of Contents
Elevate Credit, Inc. and Subsidiaries
NOTES TO COMBINED AND CONSOLIDATED FINANCIAL STATEMENTS — (Continued)
For the years ended December 31, 2015 and 2014
required to adopt ASU 2014-08 prospectively for all disposals (or classifications as held for sale) of components of an entity that occur within annual periods beginning on or after December 15, 2014 and interim periods within those years. Early adoption is permitted, and the Company adopted ASU 2014-08 in December 2014. The adoption of ASU 2014-08 did not have a material effect on the Company’s combined and consolidated financial statements.
Accounting Standards to be Adopted in Future Periods
In March 2016, the FASB issued ASU No. 2016-09, Compensation—Stock Compensation (Topic 718): Improvements to Employee Share-Based Payment Accounting (“ASU 2016-09”). ASU 2016-09 is intended to simplify the accounting for share-based payment transactions, including the income tax consequences, classification of awards as either equity or liabilities and classification on the statement of cash flows. ASU 2016-09 is effective for fiscal years beginning after December 15, 2016, including interim periods within those fiscal years. Early adoption is permitted. The Company is still assessing the potential impact of ASU 2016-09 on its consolidated financial statements.
In February 2016, the FASB issued ASU No. 2016-02, Leases (Topic 842) (“ASU 2016-02”). ASU 2016-02 is intended to improve the reporting of leasing transactions to provide users of financial statements with more decision-useful information. ASU 2016-02 will require organizations that lease assets to recognize on the balance sheet the assets and liabilities for the rights and obligations created by those leases. ASU 2016-02 is effective for fiscal years beginning after December 15, 2018, including interim periods within those fiscal years. Early adoption is permitted. The Company is still assessing the potential impact of ASU 2016-02 on its consolidated financial statements.
In January 2016, the FASB issued ASU No. 2016-01, Financial Instruments—Overall (Subtopic 825-10): Recognition and Measurement of Financial Assets and Financial Liabilities (“ASU 2016-01”). ASU 2016-01 is intended to enhance the reporting model for financial instruments to provide users of financial statements with more decision-useful information. ASU 2016-01 is effective for fiscal years beginning after December 15, 2017, including interim periods within those fiscal years. The Company is still assessing the potential impact of ASU 2016-01 on its consolidated financial statements.
In June 2015, the FASB issued ASU No. 2015-10, Technical Corrections and Improvements (“ASU 2015-10”). The amendments in ASU 2015-10 represent changes to clarify the Codification, correct unintended application of guidance, or make minor improvements to the Codification that are not expected to have a significant effect on current accounting practice or create a significant administrative cost to most entities. In addition, some of the amendments are intended to make the Codification easier to understand and easier to apply by eliminating inconsistencies, providing needed clarifications, and improving the presentation of guidance in the Codification. ASU 2015-10 is effective for fiscal years (and interim reporting periods within those years) beginning after December 15, 2015. Early adoption is permitted. The Company has evaluated the effects of this standard and does not expect it to have a material impact on its consolidated financial statements.
In April 2015, the FASB issued ASU No 2015-03, Interest—Imputation of Interest (Subtopic 835-30): Simplifying the Presentation of Debt Issuance Costs (“ASU 2015-03”). The amendments in ASU 2015-03 are intended to simplify the presentation of debt issuance costs. These amendments require that debt issuance costs related to a recognized debt liability be presented in the balance sheet as a direct deduction from the carrying amount of that debt liability, consistent with debt discounts. The recognition and
F-20
Table of Contents
Elevate Credit, Inc. and Subsidiaries
NOTES TO COMBINED AND CONSOLIDATED FINANCIAL STATEMENTS — (Continued)
For the years ended December 31, 2015 and 2014
measurement guidance for debt issuance costs are not affected by the amendments in this ASU. In August 2015, the FASB issued ASU No. 2015-15, Interest—Imputation of Interest (Subtopic 835-30): Presentation and Subsequent Measurement of Debt Issuance Costs Associated with Line-of-Credit Arrangements (“ASU 2015-15”). ASU 2015-15 amends Subtopic 835-30 to include that the Securities and Exchange Commission would not object to the deferral and presentation of debt issuance costs as an asset and subsequent amortization of debt issuance costs over the term of the line-of-credit arrangement, whether or not there are any outstanding borrowings on the line-of-credit arrangement. ASU 2015-03 is effective for fiscal years (and interim reporting periods within those years) beginning after December 15, 2015. Early adoption is permitted. The Company has evaluated the effects of these standards and does not expect them to have a material impact on its consolidated financial statements.
In February 2015, the FASB issued ASU 2015-02, Consolidation (Topic 810): Amendments to the Consolidation Analysis (“ASU 2015-02”). The amendments in ASU 2015-02 provide guidance for reporting entities that are required to evaluate whether they should consolidate certain legal entities. In accordance with ASU 2015-02, all legal entities are subject to reevaluation under the revised consolidation model. ASU 2015-02 is effective for public business entities for annual periods, and interim periods within those annual periods, beginning after December 15, 2015. Early adoption is permitted. The Company has evaluated the effects of this standard and does not expect it to have a material impact on its consolidated financial statements.
In January 2015, the FASB issued ASU 2015-01, Income Statement—Extraordinary and Unusual Items (Subtopic 225-20): Simplifying Income Statement Presentation by Eliminating the Concept of Extraordinary Items (“ASU 2015-01”). The amendments in ASU 2015-01 eliminate from GAAP the concept of extraordinary items. If an event or transaction meets the criteria for extraordinary classification, it is segregated from the results of ordinary operations and is shown as a separate item in the income statement, net of tax. ASU 2015-01 is effective for annual periods, and interim periods within those annual periods, beginning after December 15, 2015. Early adoption is permitted. The Company has evaluated the effects of this standard and does not expect it to have a material impact on its consolidated financial statements.
In August 2014, the FASB issued ASU 2014-15, Presentation of Financial Statements—Going Concern (Subtopic 205-40): Disclosure of Uncertainties about an Entity’s Ability to Continue as a Going Concern (“ASU 2014-15”). The amendments in ASU 2014-15 require management to evaluate, in connection with financial statement preparation for each annual and interim reporting period, whether there are conditions or events that raise substantial doubt about the entity’s ability to continue as a going concern within one year after the date the financial statements are issued, and to provide related disclosures. ASU 2014-15 applies to all entities and is effective for annual periods ending after December 15, 2016, and interim periods thereafter. Early adoption is permitted. The Company is still assessing the potential impact of ASU 2014-15 on its consolidated financial statements.
In May 2014, the FASB issued ASU 2014-09, Revenue from Contracts with Customers (Topic 606) (“ASU 2014-09”). ASU 2014-09 is a comprehensive new revenue recognition model that requires a company to recognize revenue to depict the transfer of goods or services to a customer at an amount that reflects the consideration it expects to receive in exchange for those goods or services. ASU 2014-09 also requires additional disclosure about the nature, amount, timing and uncertainty of revenue and cash flows arising from customer contracts, including significant judgments and changes in judgments and assets recognized
F-21
Table of Contents
Elevate Credit, Inc. and Subsidiaries
NOTES TO COMBINED AND CONSOLIDATED FINANCIAL STATEMENTS — (Continued)
For the years ended December 31, 2015 and 2014
from costs incurred to obtain or fulfill a contract. In August 2015, the FASB issued ASU No. 2015-14, Revenue from Contracts with Customers (Topic 606): Deferral of Effective Date (“ASU 2015-14”), which defers the effective date of this guidance by one year, to the annual reporting periods beginning after December 15, 2017, including interim periods within that reporting period. A reporting entity may choose to early adopt the guidance as of the original effective date. In April 2016, the FASB issued ASU 2016-09, Revenues from Contracts with Customers (Topic 606): Identifying Performance Obligations and Licensing (“ASU 2016-10”), which clarifies the guidance related to identifying performance obligations and licensing implementation. The Company is still assessing the potential impact of ASU 2014-09 on its consolidated financial statements.
NOTE 2—EARNINGS PER SHARE
Basic earnings (loss) per share is computed by dividing net income or loss by the weighted average number of shares outstanding during each period. Diluted earnings per share is computed based on the weighted average number of common shares outstanding (“WASO”) plus the effect of dilutive potential common shares that could be issued if stock options were exercised, using the treasury stock method, and the conversion feature of preferred stock was exercised using the if-converted method.
The number of shares issued upon completion of the Spin-Off was used to determine both basic and diluted earnings (loss) per share for period from January 1, 2014 through the date of the Spin-Off, as no Company equity awards were outstanding prior to the Spin-Off. Basic earnings (loss) per share subsequent to the Spin-Off was computed using the WASO from the date of the completion of the Spin-Off through December 31, 2014. WASO used in determining diluted earnings per share subsequent to the Spin-Off was computed from the date of the completion of the Spin-Off through December 31, 2014, adjusted for the diluted potential common shares outstanding during the same period.
The computation of earnings (loss) per share was as follows for December 31, 2015 and 2014:
| (Dollars in thousands except per share amounts) | 2015 | 2014 | ||||||
| Numerator (basic and diluted): |
||||||||
| Net loss from continuing operations |
$ | (19,911 | ) | $ | (54,760 | ) | ||
| Income from discontinued operations |
— | 135 | ||||||
|
|
|
|
|
|||||
| Net loss |
$ | (19,911 | ) | $ | (54,625 | ) | ||
|
|
|
|
|
|||||
| Denominator: |
||||||||
| Weighted average number of shares outstanding (basic and diluted) |
5,010,339 | 4,711,794 | ||||||
|
|
|
|
|
|||||
| Basic and diluted (loss) earnings per share: |
||||||||
| Net loss from continuing operations |
$ | (3.97 | ) | $ | (11.62 | ) | ||
| Income from discontinued operations |
— | 0.03 | ||||||
|
|
|
|
|
|||||
| Net loss |
$ | (3.97 | ) | $ | (11.59 | ) | ||
|
|
|
|
|
|||||
Due to the net losses incurred in 2015 and 2014, we excluded 5,639,410 and 3,759,607 potential common shares issuable upon conversion of the Series A and Series B convertible preferred stock and 632,578 and 457,311 potential common shares for 2015 and 2014, respectively, issuable upon exercise of the Company’s stock options from the diluted earnings per share calculation because including these shares would be anti-dilutive.
F-22
Table of Contents
Elevate Credit, Inc. and Subsidiaries
NOTES TO COMBINED AND CONSOLIDATED FINANCIAL STATEMENTS — (Continued)
For the years ended December 31, 2015 and 2014
The Company understands that the holders of a majority of the convertible preferred shares intend to convert 100% of the Company’s outstanding preferred stock into common stock in connection with the initial public offering (“IPO”). Had this conversion occurred prior to the end of the most recent period presented in these financial statements, this transaction would have changed materially the number of common shares outstanding. However, given the net loss reported in the most recent period, including these common shares in the denominator of a pro forma earnings per share calculation would automatically result in anti-dilution. As such, no pro forma earnings per share is presented in these combined and consolidated financial statements for the anticipated conversion of preferred stock.
NOTE 3—DISCONTINUED OPERATIONS
In December 2013, the Company decided to discontinue its rent-to-own product (“Presta”), and stopped making new leases to customers during January 2014. The Company continued to service and collect on existing leases during 2014 until the final leases expired in February 2015. The remaining inventory was sold in May 2014, and a gain of $0.1 million was recognized. The Company recorded after-tax earnings for Presta of $0.1 million for the year ended December 31, 2014, which was reported as Income from discontinued operations, net of tax in the Combined and Consolidated Statements of Operations. After-tax earnings for Presta for the year ended December 31, 2015 were immaterial.
All revenues and expenses reported in the combined and consolidated financial statements have been adjusted to reflect reclassification of all discontinued operations. The following table summarizes the results that have been reclassified as discontinued operations in the Consolidated Balance Sheets and Combined and Consolidated Statements of Operations as of and for the year ended December 31, 2014:
| (Dollars in thousands except per share amounts) | 2014 | |||
| Revenues |
$ | 488 | ||
| Direct marketing |
(5 | ) | ||
| Other cost of sales |
(299 | ) | ||
|
|
|
|||
| Gross profit |
184 | |||
|
|
|
|||
| Operating expenses: |
||||
| Professional services |
71 | |||
| Selling and marketing |
(16 | ) | ||
| Occupancy and equipment |
51 | |||
| Other |
28 | |||
|
|
|
|||
| Total operating expenses |
134 | |||
|
|
|
|||
| Operating income |
50 | |||
| Non-operating income |
85 | |||
|
|
|
|||
| Net income |
$ | 135 | ||
|
|
|
|||
| Income from discontinued operations per basic and diluted share |
$ | 0.03 | ||
|
|
|
|||
| Assets |
$ | 278 | ||
| Liabilities |
$ | 15 | ||
F-23
Table of Contents
Elevate Credit, Inc. and Subsidiaries
NOTES TO COMBINED AND CONSOLIDATED FINANCIAL STATEMENTS — (Continued)
For the years ended December 31, 2015 and 2014
NOTE 4—LOANS RECEIVABLE AND REVENUES
Revenues generated from the Company’s consumer loans for the years ended December 31, 2015 and 2014 were as follows:
| (Dollars in thousands) | 2015 | 2014 | ||||||
| Finance charges |
$ | 347,445 | $ | 229,296 | ||||
| CSO fees |
61,259 | 42,908 | ||||||
| Lines of credit fees |
23,681 | 71 | ||||||
| Other |
1,621 | 1,443 | ||||||
|
|
|
|
|
|||||
| Total Revenues |
$ | 434,006 | $ | 273,718 | ||||
|
|
|
|
|
|||||
The Company’s portfolio consists of both installment loans and lines of credit, which are considered the portfolio segments at December 31, 2015 and 2014. The following reflects the credit quality of the Company’s loans receivable as of December 31, 2015 and 2014 as delinquency status has been identified as the primary credit quality indicator. Loans are determined to be past due when they are one day past due without a payment. All impaired loans as of December 31, 2015 and 2014 have been charged off.
| December 31, 2015 | ||||||||||||
| (Dollars in thousands) | Installment | Line of Credit | Total | |||||||||
| Current loans |
$ | 211,144 | $ | 68,742 | $ | 279,886 | ||||||
| Past due loans |
46,804 | 6,536 | 53,340 | |||||||||
|
|
|
|
|
|
|
|||||||
| Total loans receivable |
257,948 | 75,278 | 333,226 | |||||||||
| Net unamortized loan premium |
— | 753 | 753 | |||||||||
| Less: Allowance for loan losses |
(49,755 | ) | (10,016 | ) | (59,771 | ) | ||||||
|
|
|
|
|
|
|
|||||||
| Loans receivable, net |
$ | 208,193 | $ | 66,015 | $ | 274,208 | ||||||
|
|
|
|
|
|
|
|||||||
| December 31, 2014 | ||||||||||||
| (Dollars in thousands) | Installment | Line of Credit | Total | |||||||||
| Current loans |
$ | 156,965 | $ | 145 | $ | 157,110 | ||||||
| Past due loans |
35,590 | 37 | 35,627 | |||||||||
|
|
|
|
|
|
|
|||||||
| Total loans receivable |
192,555 | 182 | 192,737 | |||||||||
| Net unamortized loan premium |
— | — | — | |||||||||
| Less: Allowance for loan losses |
(44,876 | ) | (38 | ) | (44,914 | ) | ||||||
|
|
|
|
|
|
|
|||||||
| Loans receivable, net |
$ | 147,679 | $ | 144 | $ | 147,823 | ||||||
|
|
|
|
|
|
|
|||||||
Total loans receivable includes approximately $21.9 million and $16.0 million of interest receivable at December 31, 2015 and 2014, respectively. The carrying value for Loans receivable, net of the allowance for loan losses approximates the fair value due to the short-term nature of the loans receivable.
F-24
Table of Contents
Elevate Credit, Inc. and Subsidiaries
NOTES TO COMBINED AND CONSOLIDATED FINANCIAL STATEMENTS — (Continued)
For the years ended December 31, 2015 and 2014
The changes in the allowance for loan losses for the years ended December 31, 2015 and 2014 are as follows:
| December 31, 2015 | ||||||||||||
| (Dollars in thousands) | Installment | Line of Credit | Total | |||||||||
| Balance beginning of year |
$ | 48,453 | $ | 38 | $ | 48,491 | ||||||
| Provision for loan losses |
212,828 | 19,822 | 232,650 | |||||||||
| Charge-offs |
(221,343 | ) | (9,998 | ) | (231,341 | ) | ||||||
| Recoveries of prior charge-offs |
16,392 | 154 | 16,546 | |||||||||
| Effect of changes in foreign currency rates |
(562 | ) | — | (562 | ) | |||||||
|
|
|
|
|
|
|
|||||||
| Total |
55,768 | 10,016 | 65,784 | |||||||||
| Accrual for CSO lender owned loans (Note 1) |
(6,013 | ) | — | (6,013 | ) | |||||||
|
|
|
|
|
|
|
|||||||
| Balance end of year |
$ | 49,755 | $ | 10,016 | $ | 59,771 | ||||||
|
|
|
|
|
|
|
|||||||
| December 31, 2014 | ||||||||||||
| (Dollars in thousands) | Installment | Line of Credit | Total | |||||||||
| Balance beginning of year |
$ | 16,826 | $ | — | $ | 16,826 | ||||||
| Provision for loan losses |
170,831 | 77 | 170,908 | |||||||||
| Charge-offs |
(148,753 | ) | (44 | ) | (148,797 | ) | ||||||
| Recoveries of prior charge-offs |
10,233 | 5 | 10,238 | |||||||||
| Effect of changes in foreign currency rates |
(684 | ) | — | (684 | ) | |||||||
|
|
|
|
|
|
|
|||||||
| Total |
48,453 | 38 | 48,491 | |||||||||
| Accrual for CSO lender owned loans (Note 1) |
(3,577 | ) | — | (3,577 | ) | |||||||
|
|
|
|
|
|
|
|||||||
| Balance end of year |
$ | 44,876 | $ | 38 | $ | 44,914 | ||||||
|
|
|
|
|
|
|
|||||||
NOTE 5—VARIABLE INTEREST ENTITY
The Company is involved with an entity that is deemed to be a VIE. Under ASC 815-10-65, Variable Interest Entities., a VIE is an entity that: (1) has an insufficient amount of equity investment at risk to permit the entity to finance its activities without additional subordinated financial support by other parties; (2) the equity investors are unable to make significant decisions about the entity’s activities through voting rights or similar rights; or (3) the equity investors do not have the obligation to absorb expected losses or the right to receive residual returns of the entity. The Company is required to consolidate a VIE if it is determined to be the primary beneficiary, that is, the enterprise that has both (1) the power to direct the activities of a VIE that most significantly impact the entity’s economic performance and (2) the obligation to absorb losses of the entity that could potentially be significant to the VIE. The Company evaluates its relationships with VIEs to determine whether it is the primary beneficiary of a VIE at the time it becomes involved with the entity and it re-evaluates that conclusion each reporting period.
Elastic SPV, Ltd.
On July 1, 2015, the Company entered into several agreements with a third-party lender and Elastic SPV, Ltd. (“ESPV”), a new entity formed by third party investors for the purpose of purchasing loan participations from the third-party lender. On that date, approximately $20.2 million of loan
F-25
Table of Contents
Elevate Credit, Inc. and Subsidiaries
NOTES TO COMBINED AND CONSOLIDATED FINANCIAL STATEMENTS — (Continued)
For the years ended December 31, 2015 and 2014
participations in the Elastic lines of credit outstanding held by the Company were transferred to ESPV for no gain or loss. Per the terms of the agreements, the Company provides customer acquisition services to drive the volume of loan applications submitted to the third-party lender. In addition, the Company provides loan underwriting software and services to evaluate the credit quality of those loan applications in accordance with the third-party lender’s credit policies. ESPV accounts for the loan participations acquired in accordance with ASC 860-10-40, Transfers and Services, Derecognition, as the lines of credit acquired meet the criteria of a participation interest.
Once the third-party lender originates the loan, ESPV has the right, but not the obligation, to purchase a 90% interest in each Elastic line of credit. Victory Park Capital Advisors, LLC (“VPC”) entered into an agreement (the “ESPV Facility”) under which it shall loan ESPV all funds necessary (with a maximum borrowing amount of $50 million) to purchase such participation interests in exchange for a fixed return. On October 21, 2015, the ESPV Facility was amended, providing a maximum borrowing amount of $100 million. The fixed return is comprised of a base rate (defined as the greater of the 3-month LIBOR rate or 1% per annum) plus 13% for the outstanding balance up to $50 million and a base rate plus 12% for the outstanding balance greater than $50 million. The Company entered into a separate credit default protection agreement with ESPV whereby the Company agreed to provide credit protection to the investors in ESPV against Elastic loan losses in return for a credit premium. The Company does not hold a direct ownership interest in ESPV, however, as a result of the credit default protection agreement, ESPV was determined to be a VIE and the Company qualifies as the primary beneficiary.
The following table summarizes the assets and liabilities of the VIE that are included within the Company’s consolidated balance sheet at December 31, 2015:
| (Dollars in thousands) | 2015 | |||
| ASSETS |
||||
| Cash and cash equivalents |
$ | 3,015 | ||
| Loans receivable, net of allowance for loan losses of $10,016 |
66,015 | |||
| Prepaid expenses and other assets |
9,661 | |||
| Receivable from payment processors |
1,701 | |||
|
|
|
|||
| Total assets |
$ | 80,392 | ||
|
|
|
|||
| LIABILITIES AND MEMBERS’ EQUITY |
||||
| Accounts payable and accrued liabilities ($639 eliminates upon consolidation) |
$ | 3,567 | ||
| Reserve deposit liability ($11,325 eliminates upon consolidation) |
11,325 | |||
| Notes payable |
65,500 | |||
| Members’ equity |
— | |||
|
|
|
|||
| Total liabilities and members’ equity |
$ | 80,392 | ||
|
|
|
|||
CSO Lenders
The CSO lenders are considered VIE’s of the Company under ASC 815-10-65. The Company does not have any ownership interest in the CSO lenders, does not exercise control over them, and is not the primary beneficiary, and therefore, does not consolidate the CSO lenders’ results with its results.
F-26
Table of Contents
Elevate Credit, Inc. and Subsidiaries
NOTES TO COMBINED AND CONSOLIDATED FINANCIAL STATEMENTS — (Continued)
For the years ended December 31, 2015 and 2014
NOTE 6—PROPERTY AND EQUIPMENT
Property and equipment as of December 31, 2015 and 2014 consists of the following:
| (Dollars in thousands) | 2015 | 2014 | ||||||
| Furniture and fixtures |
$ | 2,037 | $ | 1,838 | ||||
| Equipment |
8,419 | 5,875 | ||||||
| Leasehold improvements |
237 | 295 | ||||||
| Software development cost |
26,377 | 21,665 | ||||||
| Software-purchased |
5,873 | 4,354 | ||||||
|
|
|
|
|
|||||
| 42,943 | 34,027 | |||||||
| Less accumulated depreciation |
(25,173 | ) | (16,703 | ) | ||||
|
|
|
|
|
|||||
| $ | 17,770 | $ | 17,324 | |||||
|
|
|
|
|
|||||
The following summarizes the balances above which were acquired through leasing arrangements that qualify as capital leases as of December 31, 2015:
| (Dollars in thousands) | 2015 | 2014 | ||||||
| Equipment |
$ | 687 | $ | 687 | ||||
| Less: accumulated depreciation |
(420 | ) | (191 | ) | ||||
|
|
|
|
|
|||||
| $ | 267 | $ | 496 | |||||
|
|
|
|
|
|||||
The capital lease obligation is included in Accounts payable and accrued liabilities in the Consolidated Balance Sheets. Depreciation expense, which includes depreciation related to capital leases, was approximately $8.7 million and $8.1 million for the years ended December 31, 2015 and 2014, respectively.
NOTE 7—ACCOUNTS PAYABLE AND ACCRUED LIABILITIES
Accounts payable and accrued liabilities at December 31, 2015 and 2014 consist of the following:
| (Dollars in thousands) | 2015 | 2014 | ||||||
| Accounts payable |
$ | 13,037 | $ | 9,437 | ||||
| Accounts payable to related party (Note 17) |
304 | 1,266 | ||||||
| Accrued compensation |
9,454 | 8,199 | ||||||
| Liability for losses on CSO lender-owned consumer loans |
6,013 | 3,577 | ||||||
| Deferred revenues |
1,729 | 2,692 | ||||||
| Interest payable |
4,357 | 2,316 | ||||||
| Capital lease liability |
262 | 490 | ||||||
| Other accrued liabilities |
1,102 | 569 | ||||||
|
|
|
|
|
|||||
| $ | 36,258 | $ | 28,546 | |||||
|
|
|
|
|
|||||
F-27
Table of Contents
Elevate Credit, Inc. and Subsidiaries
NOTES TO COMBINED AND CONSOLIDATED FINANCIAL STATEMENTS — (Continued)
For the years ended December 31, 2015 and 2014
NOTE 8—NOTES PAYABLE
On January 30, 2014, Rise SPV, LLC (“RSPV,” a subsidiary of the Company) entered into an agreement with Victory Park Management, LLC (“VPC”) providing a credit facility with a maximum borrowing amount of $250 million (the “VPC Facility”). On May 20, 2015, the VPC Facility was amended, providing a credit facility with a maximum total borrowing amount of $335 million to RSPV, ECI and Elevate Credit Services, LLC (“ELCS”), all subsidiaries of the Company. As discussed in Note 19—Subsequent Events, on February 11, 2016, the VPC Facility was amended, providing a credit facility with a maximum total borrowing amount of $345 million to RSPV, ECI and ELCS. This facility provides the following term notes at December 31, 2015:
| Ø | A maximum borrowing amount of $250 million at a base rate (defined as the 3-month LIBOR rate) plus 15% for the outstanding balance up to $75 million, 14% for the outstanding balance greater than $75 million and up to $150 million, and 13% for the outstanding balance greater than $150 million used to fund the Rise loan portfolio (“US Term Note”). |
| Ø | A maximum borrowing amount of $50 million at a base rate (defined as the 3-month LIBOR rate) plus 16% used to fund the UK Sunny loan portfolio (“UK Term Note”). |
| Ø | A maximum borrowing amount of $35 million at a base rate (defined as the 3-month LIBOR rate) plus 18% used to fund working capital (“ELCS Sub-debt Term Note”). |
On July 13, 2015, ESPV, entered into an agreement with VPC, providing a credit facility with a maximum borrowing amount of $50 million (the “ESPV Facility”). On October 21, 2015, the ESPV Facility was amended, providing a credit facility with a maximum borrowing amount of $100 million. Interest is charged at a base rate (defined as the greater of the 3-month LIBOR rate or 1% per annum) plus 13% for the outstanding balance up to $50 million and plus 12% for the outstanding balance greater than $50 million. The ESPV Facility is used to purchase loan participations from the third party bank partner.
The outstanding balance of Notes payable are as follows:
| Year ended December 31, | ||||||||
| (Dollars in thousands) | 2015 | 2014 | ||||||
| US Term Note bearing interest at 3-month LIBOR + 13-15% |
$ | 197,000 | $ | 129,800 | ||||
| UK Term Note bearing interest at 3-month LIBOR + 16% |
42,300 | 30,000 | ||||||
| ELCS Sub-debt Term Note bearing interest at 3-month LIBOR + 18% |
35,000 | 15,000 | ||||||
| ESPV Term Note bearing interest at 1% per annum + 12-13% |
65,500 | — | ||||||
|
|
|
|
|
|||||
| Total |
$ | 339,800 | $ | 174,800 | ||||
|
|
|
|
|
|||||
There are no principal payments due or scheduled until the credit facility maturity dates of January 30, 2018 (VPC Facility) and July 1, 2019 (ESPV Facility). All assets of ESPV are pledged as collateral to secure the ESPV Facility. All assets of the Company are pledged as collateral to secure both the VPC and ESPV Facilities. The agreements contain financial covenants, including a borrowing base calculation and certain financial ratios. The Company was in compliance with all covenants related to the VPC Facility as of December 31, 2015 and 2014. ESPV was in compliance with all covenants related to the ESPV Facility as of December 31, 2015.
F-28
Table of Contents
Elevate Credit, Inc. and Subsidiaries
NOTES TO COMBINED AND CONSOLIDATED FINANCIAL STATEMENTS — (Continued)
For the years ended December 31, 2015 and 2014
Future debt maturities as of December 31, 2015 are as follows:
| Year (dollars in thousands) | Amount | |||
| 2016 |
$ | — | ||
| 2017 |
— | |||
| 2018 |
274,300 | |||
| 2019 |
65,500 | |||
| 2020 |
— | |||
|
|
|
|||
| Total |
$ | 339,800 | ||
|
|
|
|||
On May 1, 2014, and in connection with the Spin-Off, ELCS entered into an agreement with Think Finance, whereby Think Finance provided a credit facility with a maximum borrowing amount of $75 million (“TF Credit Facility”). Interest was charged at an annual rate of 8%. The agreement contains financial covenants, including compliance with the VPC Facility covenants. The Company was in compliance with all covenants as of December 31, 2014.
ELCS made draws on the TF Credit Facility of $24.8 million during the year ended December 31, 2014 and paid off the facility and had no amounts outstanding under the credit facility at December 31, 2014. ELCS recognized interest expense of approximately $0.9 million on this credit facility for the year ended December 31, 2014, which is included within Net interest expense in the Combined and Consolidated Statements of Operations. The TF Credit Facility was terminated effective January 1, 2015.
The Company has evaluated the interest rates for its debt and believes they represent market rates based on the Company’s size, industry, operations and recent amendments. As a result, the carrying value for the debt approximates the fair value.
NOTE 9—GOODWILL AND INTANGIBLE ASSETS
The carrying value of goodwill at December 31, 2015 and 2014 was approximately $16 million. There were no changes to goodwill during the years ended December 31, 2015 and 2014. Goodwill represents the excess purchase price over the estimated fair market value of the net assets acquired by the predecessor parent company, Think Finance, related to the Elastic and UK reporting units. Of the total goodwill balance, approximately $0.7 million is deductible for tax purposes.
The carrying value of acquired intangible assets as of December 31, 2015, is presented in the table below:
| (Dollars in thousands) | Cost | Accumulated Amortization |
Net | |||||||||
| Assets subject to amortization: |
||||||||||||
| Acquired technology |
$ | 946 | $ | (946 | ) | $ | — | |||||
| Non-compete |
3,404 | (1,600 | ) | 1,804 | ||||||||
| Customers |
126 | (126 | ) | — | ||||||||
| Assets not subject to amortization: |
||||||||||||
| Domain names |
680 | — | 680 | |||||||||
|
|
|
|
|
|
|
|||||||
| $ | 5,156 | $ | (2,672 | ) | $ | 2,484 | ||||||
|
|
|
|
|
|
|
|||||||
F-29
Table of Contents
Elevate Credit, Inc. and Subsidiaries
NOTES TO COMBINED AND CONSOLIDATED FINANCIAL STATEMENTS — (Continued)
For the years ended December 31, 2015 and 2014
The carrying value of acquired intangible assets as of December 31, 2014, is presented in the table below:
| (Dollars in thousands) | Cost | Accumulated Amortization |
Net | |||||||||
| Assets subject to amortization: |
||||||||||||
| Acquired technology |
$ | 946 | $ | (946 | ) | $ | — | |||||
| Non-compete |
3,404 | (1,415 | ) | 1,989 | ||||||||
| Customers |
126 | (105 | ) | 21 | ||||||||
| Assets not subject to amortization: |
||||||||||||
| Domain names |
680 | — | 680 | |||||||||
|
|
|
|
|
|
|
|||||||
| $ | 5,156 | $ | (2,466 | ) | $ | 2,690 | ||||||
|
|
|
|
|
|
|
|||||||
Total amortization expense recognized for the years ended December 31, 2015 and 2014, respectively, was approximately $0.2 million and $0.2 million. The weighted average remaining amortization period for the intangible assets was 10.00 and 10.87 years at December 31, 2015 and 2014, respectively.
Estimated amortization expense relating to intangible assets subject to amortization for the succeeding five years is as follows:
| Year (dollars in thousands) | Amount | |||
| 2016 |
$ | 180 | ||
| 2017 |
180 | |||
| 2018 |
180 | |||
| 2019 |
180 | |||
| 2020 |
180 | |||
NOTE 10—LEASES
The Company has non-cancelable operating leases for facility space and equipment, including subleases with Think Finance (see Note 17—Related Parties). Rent expense for the years ended December 31, 2015 and 2014 was approximately $2.7 million and $2.5 million, respectively, and is reported in Occupancy and equipment in the Combined and Consolidated Statements of Operations. Future minimum lease payments as of December 31, 2015 are as follows:
| Year (dollars in thousands) | Amount | |||
| 2016 |
$ | 2,661 | ||
| 2017 |
795 | |||
| 2018 |
662 | |||
| 2019 |
74 | |||
| 2020 |
— | |||
| Thereafter |
— | |||
|
|
|
|||
| Total |
$ | 4,192 | ||
|
|
|
|||
As discussed in Note 6—Property And Equipment, the Company purchased equipment through leasing arrangements that qualify as capital leases. The capital leases include provisions which allow for the
F-30
Table of Contents
Elevate Credit, Inc. and Subsidiaries
NOTES TO COMBINED AND CONSOLIDATED FINANCIAL STATEMENTS — (Continued)
For the years ended December 31, 2015 and 2014
purchase of the equipment at de minimis amounts at the end of their lease term. Future minimum lease payments as of December 31, 2015 are as follows:
| Year (dollars in thousands) | Amount | |||
| 2016 |
$ | 250 | ||
| 2017 |
21 | |||
|
|
|
|||
| Subtotal |
271 | |||
| Interest and executory costs |
(9 | ) | ||
|
|
|
|||
| Total, net |
$ | 262 | ||
|
|
|
|||
NOTE 11—STOCK OPTIONS
Prior to the Spin-Off, the Company’s employees were granted stock options under the Think Finance stock option plan. The Think Finance stock option plan was administered by the Think Finance Board of Directors, who determined the option price, vesting schedule and exercise period for each grant.
The Company adopted a stock option plan (the “Stock Option Plan”) on May 1, 2014, and Think Finance option holders at the Spin-Off date were granted similar awards in the Company’s Stock Option Plan on that date in order to preserve the economic terms of their pre-Spin-Off Think Finance options. The number of options on shares, vesting and expiration schedules were carried over from the Think Finance stock option plan. Further, the awards granted to the Think Finance option holders in this regard did not give such option holders any additional benefits that they did not have before the Spin-Off. The exercise prices for Think Finance options were modified to allocate the exercise prices between the Think Finance options and the newly granted options in the Company, based on the relative fair value of each company at the Spin-Off date. The aggregate exercise prices remained the same, such that the spread between the aggregate fair market value of the Think Finance shares and the Company shares subject to the options immediately after the Spin-Off over the aggregate exercise prices of such options, is not more than the spread between the aggregate fair market value of the Think Finance shares subject to the options immediately before the Spin-Off over the aggregate former exercise prices of such options. As such, following the Spin-Off, employees of the Company held stock options to purchase both the stock of Think Finance and stock of the Company. The compensation expense relating to employees of the Company, which includes the cost of both types of options, are recorded on the Company’s books in all periods presented.
The following table summarizes the Company’s share-based compensation expense reported within Compensation expense in the Combined and Consolidated Statements of Operations for the years ended December 31, 2015 and 2014:
| (Dollars in thousands) | 2015 | 2014 | ||||||
| Elevate stock option plan expense |
$ | 847 | $ | 364 | ||||
| Allocated from Think Finance * |
— | 132 | ||||||
|
|
|
|
|
|||||
| Total |
$ | 847 | $ | 496 | ||||
|
|
|
|
|
|||||
| Total intrinsic value of stock options exercised |
$ | 5,798 | $ | 4,100 | ||||
|
|
|
|
|
|||||
| * | The allocation is made using a proportional allocation methodology, which management has deemed to be reasonable. |
F-31
Table of Contents
Elevate Credit, Inc. and Subsidiaries
NOTES TO COMBINED AND CONSOLIDATED FINANCIAL STATEMENTS — (Continued)
For the years ended December 31, 2015 and 2014
These amounts relate to options granted to employees and board members. The Company recognizes compensation costs over the requisite service period for the entire award.
Think Finance Stock Option Plan Prior to Spin-off:
The following is a summary of activity in the Think Finance stock option plan for the period from January 1, 2014 to April 30, 2014 (the period prior to the Spin-off), which includes the number of shares and the weighted-average exercise price.
| Shares | Weighted Average Exercise Price |
|||||||
| Outstanding at December 31, 2013 |
1,909,354 | $ | 7.60 | |||||
| Granted |
56,000 | 19.03 | ||||||
| Expired or forfeited |
(11,354 | ) | 10.39 | |||||
|
|
|
|
|
|||||
| Outstanding at April 30, 2014 |
1,954,000 | $ | 7.91 | |||||
|
|
|
|
|
|||||
The weighted-average grant-date fair value for options granted during the four months ended April 30, 2014 was $6.54.
The assumptions used to determine the fair value of options granted for the period from January 1, 2014 to April 30, 2014 (the period prior to the Spin-off) using the Black-Scholes-Merton model are as follows:
| Dividend yield |
0% | |
| Risk-free interest rate |
0.79% to 0.91% | |
| Expected volatility |
50% | |
| Expected term |
3 years |
The expected term of the options granted is the period of time from the grant date to the date of expected exercise estimated using historical data. The expected volatility was determined based on an average of companies in similar industries and other factors. The risk-free interest rate used is the current yield on US Treasury notes with a term equal to the expected term of the options at the grant date. The expected dividend yield is based on annualized dividends on the underlying share during the expected term of the option.
Elevate Credit, Inc. Stock Option Plan Subsequent to the Spin-off:
The purpose of the Stock Option Plan is to encourage ownership of the Company’s common stock by key employees and to provide increased incentive for key employees to render services and to exert maximum effort for the success of the Company. The Stock Option Plan is administered by the Company’s Board of Directors. Under the provisions of the Stock Option Plan, a total of 2,372,500 shares of common stock are available to be granted. In addition, there were 204,000 options granted outside the Stock Option Plan. The Stock Option Plan allows for net settlement upon the exercise of stock options. The option price, vesting schedule and exercise period are determined for each grant after the Spin-Off date by the Board of Directors.
F-32
Table of Contents
Elevate Credit, Inc. and Subsidiaries
NOTES TO COMBINED AND CONSOLIDATED FINANCIAL STATEMENTS — (Continued)
For the years ended December 31, 2015 and 2014
The following is a summary of activity in the Company’s Stock Option Plan for the eight months ended December 31, 2014:
| Shares | Weighted Average Exercise Price |
Weighted Average Remaining Contractual Life (in years) |
||||||||||
| Granted on May 1, 2014 |
1,954,000 | $ | 5.42 | |||||||||
| Granted |
171,378 | 12.96 | ||||||||||
| Exercised |
(365,250 | ) | 3.78 | |||||||||
| Forfeited |
(11,250 | ) | 6.53 | |||||||||
|
|
|
|
|
|||||||||
| Outstanding at December 31, 2014 |
1,748,878 | $ | 6.49 | 4.79 | ||||||||
|
|
|
|
|
|
|
|||||||
| Options exercisable at December 31, 2014 |
1,382,062 | 3.70 | ||||||||||
|
|
|
|
|
|||||||||
| Available for grant at December 31, 2014 |
212,372 | |||||||||||
|
|
|
|||||||||||
The following is a summary of activity in the Company’s Stock Option Plan for the year ended December 31, 2015:
| Shares | Weighted Average Exercise Price |
Weighted Average Remaining Contractual Life (in years) |
||||||||||
| Outstanding at December 31, 2014 |
1,748,878 | $ | 6.49 | |||||||||
| Granted |
372,471 | 16.16 | ||||||||||
| Exercised |
(504,520 | ) | 3.89 | |||||||||
| Forfeited |
(36,939 | ) | 9.59 | |||||||||
|
|
|
|
|
|||||||||
| Outstanding at December 31, 2015 |
1,579,890 | 9.53 | 6.24 | |||||||||
|
|
|
|
|
|
|
|||||||
| Options exercisable at December 31, 2015 |
1,040,061 | 4.77 | ||||||||||
|
|
|
|
|
|||||||||
| Available for grant at December 31, 2015 |
126,840 | |||||||||||
|
|
|
|||||||||||
Management estimates that all outstanding options will vest based on retention expectations and other factors that are reviewed periodically and could change in the near term.
The weighted-average grant-date fair value for options granted under the Company’s Stock Option Plan in 2015 and 2014 was $5.03 and $4.46, respectively.
The assumptions used to determine the fair value of options granted in the year ended December 31, 2015 and the eight months ended December 31, 2014 using the Black-Scholes-Merton model are as follows:
| 2015 | 2014 | |||||||
| Dividend yield |
0% | 0% | ||||||
| Risk-free interest rate |
0.85% to 1.31% | 0.86% to 0.98% | ||||||
| Expected volatility |
50% | 50% | ||||||
| Expected term |
2-3 years | 3 years | ||||||
F-33
Table of Contents
Elevate Credit, Inc. and Subsidiaries
NOTES TO COMBINED AND CONSOLIDATED FINANCIAL STATEMENTS — (Continued)
For the years ended December 31, 2015 and 2014
The expected term of the options granted is the period of time from the grant date to the date of expected exercise estimated using historical data. The expected volatility was determined based on an average of companies in similar industries and other factors. The risk-free interest rate used is the current yield on US Treasury notes with a term equal to the expected term of the options at the grant date. The expected dividend yield is based on annualized dividends on the underlying share during the expected term of the option.
At December 31, 2015, the following options were outstanding at their respective exercise price:
| Exercise Price | Options Outstanding | |||
| $5.29 – 5.33 |
817,500 | |||
| $7.89 |
10,000 | |||
| $10.65 – 10.91 |
115,000 | |||
| $11.42 – 12.88 |
188,878 | |||
| $13.26 – 13.98 |
129,116 | |||
| $15.77 |
269,396 | |||
| $20.23 – 20.72 |
50,000 | |||
|
|
|
|||
| Total |
1,579,890 | |||
|
|
|
|||
All outstanding options have a contractual term of 10 years. For options granted related to the Spin-Off, the contractual term carried over from their option grant at Think Finance such that all of those options will have contractual terms less than 10 years from the Spin-Off date. The options vest 25% on the first anniversary of the effective date and 2.083% each month, thereafter. Full vesting of the options occurs on the fourth anniversary of the effective date.
The total fair value of options vested at December 31, 2015 and 2014 was approximately $2.3 million and $2.1 million, respectively.
At December 31, 2015 and 2014, there was approximately $2.4 million and $1.4 million, respectively, of total unrecognized compensation cost related to non-vested stock-based compensation arrangements granted under the Company’s Stock Option Plan. That cost is expected to be recognized over a weighted average period of 4.0 years as of December 31, 2015.
NOTE 12—FAIR VALUE MEASUREMENTS
The accounting guidance on fair value measurements establishes a fair value hierarchy that prioritizes the inputs to valuation techniques used to measure fair value. The hierarchy gives the highest priority to unadjusted quoted prices in active markets for identical assets or liabilities (Level 1 measurements) and the lowest priority to measurements involving significant unobservable inputs (Level 3 measurements).
We group our assets and liabilities measured at fair value in three levels of the fair value hierarchy, based on the fair value measurement technique, as described below:
Level 1—Valuation is based upon quoted prices (unadjusted) for identical assets and liabilities in active exchange markets that the Company has the ability to access at the measurement date.
Level 2—Valuation is based upon quoted prices for similar instruments in active markets, quoted prices for identical or similar instruments in markets that are not active, and model-based valuation techniques with significant assumptions and inputs that are observable in the market or can be derived principally from or corroborated by observable market data.
F-34
Table of Contents
Elevate Credit, Inc. and Subsidiaries
NOTES TO COMBINED AND CONSOLIDATED FINANCIAL STATEMENTS — (Continued)
For the years ended December 31, 2015 and 2014
Level 3—Valuation is derived from model-based techniques that use inputs and significant assumptions that are supported by little or no observable market data. These unobservable assumptions reflect estimates of assumptions that market participants would use in pricing the asset or liability. Valuation techniques include the use of pricing models, discounted cash flow models and similar techniques.
The level of fair value hierarchy within which a fair value measurement in its entirety falls is based on the lowest-level input that is most significant to the fair value measurement in its entirety. In the determination of the classification of assets and liabilities in Level 2 or Level 3 of the fair value hierarchy, we consider all available information, including observable market data, indications of market conditions, and our understanding of the valuation techniques and significant inputs used. Based upon the specific facts and circumstances, judgments are made regarding the significance of the Level 3 inputs to the fair value measurements of the respective assets and liabilities in their entirety. If the valuation techniques that are most significant to the fair value measurements are principally derived from assumptions and inputs that are corroborated by little or no observable market data, the asset or liability is classified as Level 3.
The Company has evaluated Loans receivable, net of allowance for loan losses, Receivable from CSO lenders, Receivable from payment processors, Accounts payable and accrued expenses and Contingent consideration payable, and believes the carrying value approximates the fair value due to the short-term nature of these balances. The Company has also evaluated the interest rates for Notes payable and believes they represent market rates based on the Company’s size, industry, operations, and recent amendments. As a result, the carrying value for Notes payable approximates the fair value. The Company classifies its fair value measurement techniques for the fair value disclosures associated with Loans receivable, net of allowance for loan losses, Receivable from CSO lenders, Receivable from payment processors, Accounts payable and accrued liabilities, Contingent consideration payable and Notes payable as Level 3 in accordance with ASC 820-10, Fair Value Measurements and Disclosures (“ASC 820-10”).
The Company has recorded a long-term liability related to agreements to pay additional consideration to a related party for the acquisitions associated with the Elastic product, based on earnings performance from 2015 through 2027. A liability of approximately $5.5 million was recorded at fair value and was included within Contingent consideration payable on the Consolidated Balance Sheets at December 31, 2014. In June 2015, the Company entered into a consulting agreement with the seller, which requires the Company to pay a total of $1.5 million over the next five years. The agreement effectively extinguished the additional consideration liability, and in accordance with ASC 450-10, a gain of approximately $5.5 million was recognized in Non-operating income for the year ended December 31, 2015 in the Combined and Consolidated Statements of Operations. This liability is considered to be Level 3 in accordance with ASC 820-10. This liability was evaluated pursuant to FASB guidance under the income approach using a weighted average cost of capital of 21%.
The table below summarizes the changes in the contingent consideration liability for the years ended December 31, 2015 and 2014:
| (Dollars in thousands) | 2015 | 2014 | ||||||
| Beginning Balance |
$ | 5,529 | $ | 5,530 | ||||
| Fair value adjustments |
— | — | ||||||
| Extinguishment of earn-out liability |
(5,529 | ) | — | |||||
| Earn–out payments |
— | (1 | ) | |||||
|
|
|
|
|
|||||
| Balance at December 31 |
$ | — | $ | 5,529 | ||||
|
|
|
|
|
|||||
F-35
Table of Contents
Elevate Credit, Inc. and Subsidiaries
NOTES TO COMBINED AND CONSOLIDATED FINANCIAL STATEMENTS — (Continued)
For the years ended December 31, 2015 and 2014
NOTE 13—INCOME TAXES
Prior to the Spin-Off, the Company’s results were included in the consolidated US federal and state income tax returns of Think Finance. The tax provision and current and deferred tax balances have been presented on a separate company basis as if the Company was a separate filer. Income tax expense (benefit) for the years ended December 31, 2015 and 2014 consists of the following:
| (Dollars in thousands) | 2015 | 2014 | ||||||
| Federal |
||||||||
| Current |
$ | 264 | $ | — | ||||
| Deferred |
(4,717 | ) | (17,895 | ) | ||||
| State |
||||||||
| Current |
251 | 207 | ||||||
| Deferred |
(456 | ) | (3,022 | ) | ||||
| Foreign |
||||||||
| Current |
— | — | ||||||
| Deferred |
— | — | ||||||
|
|
|
|
|
|||||
| Total |
$ | (4,658 | ) | $ | (20,710 | ) | ||
|
|
|
|
|
|||||
The differences between the provision for income tax and the amount that would result if the federal statutory rate were applied to the pre-tax financial income for the years ended December 31, 2015 and 2014 were as follows:
| (Dollars in thousands) | 2015 | 2014 | ||||||
| Federal statutory rate of 35% |
$ | (8,599 | ) | $ | (26,414 | ) | ||
| State income tax provision |
(166 | ) | (1,829 | ) | ||||
| Permanent differences |
640 | 351 | ||||||
| Change in valuation allowance |
(3,131 | ) | 2,533 | |||||
| Rate differential |
1,588 | 2,960 | ||||||
| Change in foreign statutory tax rate |
2,753 | — | ||||||
| Change in reserve for uncertain tax positions |
1,491 | 1,516 | ||||||
| Other |
766 | 173 | ||||||
|
|
|
|
|
|||||
| Total |
$ | (4,658 | ) | $ | (20,710 | ) | ||
|
|
|
|
|
|||||
F-36
Table of Contents
Elevate Credit, Inc. and Subsidiaries
NOTES TO COMBINED AND CONSOLIDATED FINANCIAL STATEMENTS — (Continued)
For the years ended December 31, 2015 and 2014
The tax effects of temporary differences that give rise to significant portions of deferred tax assets and deferred tax liabilities at December 31, 2015 and 2014 are presented below:
| (Dollars in thousands) | 2015 | 2014 | ||||||
| Deferred Tax Assets: |
||||||||
| Allowance for losses on loans receivable |
$ | 17,680 | $ | 15,007 | ||||
| Net operating loss carryforward – foreign |
6,631 | 9,806 | ||||||
| Net operating loss carryforward – domestic |
8,489 | 5,408 | ||||||
| Deferred revenues |
361 | 1,026 | ||||||
| Cumulative translation adjustment – domestic |
2,206 | 1,701 | ||||||
| Accrued expenses |
3,433 | 1,989 | ||||||
| Deferred equity issuance costs |
1,081 | — | ||||||
| Other |
1,099 | 841 | ||||||
|
|
|
|
|
|||||
| Total deferred tax assets |
40,980 | 35,778 | ||||||
| Deferred Tax Liabilities: |
||||||||
| Property and equipment, principally due to differences in depreciation |
(1,797 | ) | (1,076 | ) | ||||
| Amortization of intangible assets |
(4,844 | ) | (3,697 | ) | ||||
| Prepaid expenses |
(862 | ) | (1,157 | ) | ||||
|
|
|
|
|
|||||
| Net deferred tax assets before valuation allowance |
33,477 | 29,848 | ||||||
| Valuation allowance |
(6,621 | ) | (9,752 | ) | ||||
|
|
|
|
|
|||||
| Deferred tax assets, net |
$ | 26,856 | $ | 20,096 | ||||
|
|
|
|
|
|||||
Uncertain tax positions
The following table sets forth the changes in the Company’s unrecognized tax benefits for the years ended December 31, 2015 and 2014:
| (Dollars in thousands) | 2015 | 2014 | ||||||
| Balance at beginning of the year |
$ | 2,720 | $ | 1,204 | ||||
| Reductions for tax positions related to the prior year |
(220 | ) | (180 | ) | ||||
| Additions for tax positions related to the current year |
1,711 | 1,696 | ||||||
|
|
|
|
|
|||||
| Balance at the end of the period |
$ | 4,211 | $ | 2,720 | ||||
|
|
|
|
|
|||||
If the cumulative unrecognized tax benefit is recognized, there will be no effect on our effective tax rate due to the full valuation allowance. Due to the nature of the unrecognized tax benefits and the existence of tax attributes, we have not accrued any interest or penalties associated with unrecognized tax benefits in the Combined and Consolidated Statements of Operations nor have we recognized a liability in the Consolidated Balance Sheets. We do not believe the total amount of unrecognized benefit as of December 31, 2015 will increase or decrease significantly in the next twelve months.
For purposes of evaluating the need for a deferred tax valuation allowance, significant weight is given to evidence that can be objectively verified. The following provides an overview of the assessment that was performed for both the domestic and foreign deferred tax assets, net.
US deferred tax assets, net
The Company is required to assess its US deferred tax assets (“DTA”) and the need for a valuation allowance on a combined group return basis, and to exclude from that assessment the utilization of all or a portion of those US taxable losses by Think Finance, which are attributable to the Company, under the
F-37
Table of Contents
Elevate Credit, Inc. and Subsidiaries
NOTES TO COMBINED AND CONSOLIDATED FINANCIAL STATEMENTS — (Continued)
For the years ended December 31, 2015 and 2014
separate return method. This assessment requires considerable judgment on the part of management with respect to benefits that could be realized from future US taxable income, as well as other positive and negative factors. To the extent that Think Finance has utilized a portion of the Company’s operating losses in their consolidated returns, the Company has not been reimbursed for the utilization of those US losses prior to the Spin-Off. At the Spin-Off, a deferred tax asset of approximately $10.9 million related to the net operating loss (“NOL”) generated prior to the Spin-Off date was written off and reflected within Net transfers from Think Finance.
At December 31, 2015 and 2014, the Company did not establish a valuation allowance for the US DTA based on management’s expectation of generating sufficient taxable income in a look forward period over the next three to five years. The net operating loss carryforward from US operations at December 31, 2015 was approximately $22.7 million. The NOL carryforward expires beginning in 2034. The ultimate realization of the resulting deferred tax asset is dependent upon generating sufficient taxable income prior to the expiration of this carryforward. The Company considered the following positive and negative factors when making their assessment regarding the ultimate realizability of the deferred tax assets.
| Ø | Significant positive factors include an improving earnings trend as the Company has continued to scale the business to match its cost structure. In addition, at December 31, 2015, the Company was forecasted to generate US taxable income and to begin utilizing its NOL in 2016, including the effects of the ESPV structure change (see discussion below). Management’s success in developing accurate forecasts (proven through their time at Think Finance) and management’s track record of launching new and successful products at Think Finance, which generated significant taxable income, is another source of positive evidence which was evaluated. The Company believes that the unique circumstance of the Spin-Off from a successful company provides us with several positive objectively verifiable factors that would not normally be available to a new company with a limited operating history. |
| Ø | A significant negative factor includes cumulative losses and a lack of taxable income since the Spin-Off date. A net taxable loss was incurred for the years ended December 31, 2015 and 2014 (including carve-out amounts for the four months ended April 30, 2014) due to the assumption and establishment of an infrastructure for the Company separate from Think Finance while the Company was scaling the growth of the relatively new products of Rise and Elastic. In addition, direct marketing costs were a significant contributor to the net taxable loss as these costs were incurred as the loan portfolio and number of new customer loans grew significantly in 2015 and 2014. At December 31, 2014, the Company originally forecasted positive taxable income for the year ended December 31, 2015. The restructure of the Elastic product and purchase of participating interest by the ESPV entity during mid-2015 (described in Note 5—Variable Interest Entity) resulted in a change in the composition of taxable income for the remainder of the year and resulted in a net taxable loss incurred in 2015. |
The Company has given due consideration to all the factors and believes the positive evidence outweighs the negative evidence and has concluded that the US deferred tax asset is expected to be realized based on management’s expectation of generating sufficient taxable income in a look forward period over the next three to five years. Although realization is not assured, management believes it is more likely than not that all of the recorded deferred tax assets will be realized. The amount of the deferred tax assets considered realizable, however, could be adjusted in the future if estimates of future taxable income change. As a result, at December 31, 2015 and 2014, the Company did not establish a valuation allowance for the US DTA.
F-38
Table of Contents
Elevate Credit, Inc. and Subsidiaries
NOTES TO COMBINED AND CONSOLIDATED FINANCIAL STATEMENTS — (Continued)
For the years ended December 31, 2015 and 2014
The Company also had a US stock option deduction carryforward of approximately $8.5 million at December 31, 2015, for which the tax benefit would be applied as a credit directly to additional paid-in capital. The stock option deduction carryforward expires in 2034.
UK deferred tax assets, net
At December 31, 2015 and 2014, the Company recognized a full valuation allowance for its foreign deferred tax assets due to the lack of sufficient objective evidence regarding the realization of these assets in the foreseeable future. For the years ended December 31, 2015 and 2014, the valuation allowance decreased by approximately $3.1 million and increased by approximately $2.5 million, respectively, due to the decrease and increase, respectively, of the net deferred tax assets related to the UK, which primarily consists of the net operating loss carryforward. Regardless of the deferred tax valuation allowance recognized at December 31, 2015 and 2014, the Company continues to retain net operating loss carryforwards for foreign income tax purposes of approximately $39.4 million and $40.7 million, respectively, available to offset future foreign taxable income. To the extent that the Company generates taxable income in the future to utilize the tax benefits of the related deferred tax assets, subject to certain potential limitations, it may be able to reduce its effective tax rate by reducing the valuation allowance. The Company’s foreign net operating loss carryforward of approximately $39.4 million and $40.7 million for December 31, 2015 and 2014, respectively, can be carried forward indefinitely.
NOTE 14—COMMITMENTS, CONTINGENCIES AND GUARANTEES
Contingencies
Currently and from time to time, the Company may become defendants in various legal and regulatory actions. While we cannot determine the ultimate outcome of these actions, we believe their resolution will not have a material adverse effect on our financial condition, results of operations or liquidity.
The Company is cooperating with the Consumer Financial Protection Bureau (“CFPB”) related to a civil investigative demand (“CID”) received by Think Finance requesting information about the operations of Think Finance prior to the Spin-Off. The CFPB has not made any specific allegation of violation(s) of law or initiated litigation in connection with the CID as of this date.
Commitments
The Elastic product, which offers lines of credit to consumers, had approximately $31.0 million and $0.2 million in available and unfunded credit lines at December 31, 2015 and 2014, respectively. While these amounts represented the total available unused credit lines, ESPV has not experienced and does not anticipate that all line of credit customers will access their entire available credit lines at any given point in time. ESPV has not recorded a loan loss reserve for unfunded credit lines as ESPV has the ability to cancel commitments with a relatively short timeframe.
Guarantees
In connection with its CSO programs, the Company guarantees consumer loan payment obligations to CSO lenders and is required to purchase any defaulted loans it has guaranteed. The guarantee represents an obligation to purchase specific loans that go into default. See Note 1—Summary of Significant Accounting Policies for more information related to this guarantee obligation.
F-39
Table of Contents
Elevate Credit, Inc. and Subsidiaries
NOTES TO COMBINED AND CONSOLIDATED FINANCIAL STATEMENTS — (Continued)
For the years ended December 31, 2015 and 2014
NOTE 15—CONVERTIBLE PREFERRED STOCK
On May 1, 2014, the Company issued 2,957,059 shares of Series A Preferred Stock and 2,682,351 shares of Series B Preferred Stock. There have been no changes in preferred stock outstanding from the issuance date through December 31, 2015. The terms and conditions of both the Series A Preferred and the Series B Preferred are as follows:
Dividends rights
The holders of the outstanding Series A and B Preferred Stock shall be entitled to receive dividends declared by the Board of Directors. The right to receive dividends shall not be cumulative. No dividends on Series B Preferred or Common Stock shall be paid until all declared dividends on Series A Preferred have been paid. The Series A Preferred dividend is at an annual rate of $0.43 per share, and the Series B Preferred dividend is at an annual rate of $0.83 per share.
Liquidation rights
In the event of any liquidation of the Company, either voluntary or involuntary, the holders of the Series A Preferred Stock shall be entitled to receive, prior and in preference to the holders of the Series B Preferred Stock and Common Stock, an amount per share for each share of Series A Preferred Stock held by them equal to the greater of (i) the sum of (A) the Series A Liquidation Preference of $7.73 specified for such share of Series A Preferred Stock and (B) all declared but unpaid dividends (if any) on such share of Series A Preferred Stock or (ii) the amount per share that such Series A Preferred Stock would have received had such share of Series A Preferred Stock been converted into Common Stock immediately prior to such liquidation.
In the event of any liquidation of the Company, either voluntary or involuntary, the holders of the Series B Preferred Stock shall be entitled to receive, prior and in preference to the holders of Common Stock, an amount per share for each share of Series B Preferred Stock held by them equal to the greater of (i) the sum of (A) the Series B Liquidation Preference of $14.91 specified for such share of Series B Preferred Stock and (B) all declared but unpaid dividends (if any) on such share of Series B Preferred Stock or (ii) the amount per share that such Series B Preferred Stock would have received had such share of Series B Preferred Stock been converted into Common Stock immediately prior to such liquidation.
Redemption
The holders of Series A Preferred Stock can be redeemed at any time after August 30, 2018, and at the election of the holders of at least two-thirds of the then outstanding Series A Preferred Stock, at a redemption price of $5.35 per share plus 8% compounded annually from the Series A issuance date, plus all declared and unpaid dividends.
The holders of Series B Preferred Stock can be redeemed at any time after the holders of Series A Preferred Stock have been redeemed, and at the election of the holders of at least two-thirds of the then outstanding Series B Preferred Stock, at a redemption price of $10.33 per share plus 8% compounded annually from the Series B issuance date, plus all declared and unpaid dividends.
The holders of Series A and B Preferred Stock signed a Waiver Agreement by which they defer and waive their rights to exercise the redemption rights or otherwise obligate the Company to redeem the Preferred Stock, unless and until the Notes Payable have been paid in full.
F-40
Table of Contents
Elevate Credit, Inc. and Subsidiaries
NOTES TO COMBINED AND CONSOLIDATED FINANCIAL STATEMENTS — (Continued)
For the years ended December 31, 2015 and 2014
Voting rights
The holders of Series A and B Preferred Stock shall have one vote for each full share of Common Stock into which their shares are convertible, and the holders of Common Stock shall have one vote per share of Common Stock.
Automatic Conversion Upon Initial Public Offering
Upon the occurrence of an event of conversion, each share of Series A and B Preferred Stock (outstanding) shall be automatically converted into one share of fully paid and non-assessable share of Common Stock provided that the offering price per share is not less than $10.70 (as adjusted for the stock split), and the aggregate gross proceeds to the Company are not less than $25 million.
NOTE 16—OPERATING SEGMENT INFORMATION
The Company determines operating segments based on how our chief operating decision maker manages the business, including making operating decisions, deciding how to allocate resources and evaluating operating performance. Our chief operating decision-maker is our Chief Executive Officer, who reviews our operating results on a consolidated basis.
The Company has one reportable segment, which provides online credit products for subprime consumers, which is composed of the Company’s operations in the United States and the United Kingdom. The Company has aggregated all components of its business into a single reportable segment based on the similarities in the products, the distribution methods, the type of customers, and the nature of the regulatory environments.
The following tables summarize the allocation of net revenues and long-lived assets based on geography.
| Year ended December 31, | ||||||||
| (Dollars in thousands) | 2015 | 2014 | ||||||
| Revenues |
||||||||
| United States |
$ | 353,511 | $ | 206,653 | ||||
| United Kingdom |
80,495 | 67,065 | ||||||
|
|
|
|
|
|||||
| Total |
$ | 434,006 | $ | 273,718 | ||||
|
|
|
|
|
|||||
| Long-lived assets |
||||||||
| United States |
$ | 24,391 | $ | 24,163 | ||||
| United Kingdom |
11,890 | 11,878 | ||||||
|
|
|
|
|
|||||
| Total |
$ | 36,281 | $ | 36,041 | ||||
|
|
|
|
|
|||||
NOTE 17—RELATED PARTIES
As discussed in Note 8—Notes Payable, on May 1, 2014, the Company entered into an agreement with Think Finance whereby Think Finance agreed to provide a credit facility with a maximum borrowing amount of $75 million. There were no amounts drawn on the facility at that date and $24.8 million in subsequent amounts drawn were entirely repaid by December 31, 2014.
F-41
Table of Contents
Elevate Credit, Inc. and Subsidiaries
NOTES TO COMBINED AND CONSOLIDATED FINANCIAL STATEMENTS — (Continued)
For the years ended December 31, 2015 and 2014
The Company also has entered into sublease agreements with Think Finance for office space and equipment that expire beginning in 2016 through 2019. Total rent and utility payments made to Think Finance for office space were approximately $1.7 million and $0.8 million for the years ended December 31, 2015 and 2014, respectively. Rent and utility expense is included in Occupancy and equipment within the Combined and Consolidated statements of operations. Total payments for equipment were approximately $0.3 million and $0.2 million in years ended December 31, 2015 and 2014, respectively, and were included as a reduction of the capital lease liability included in Accounts payable and accrued liabilities within the Consolidated Balance Sheets and as interest expense included in Net interest expense within the Combined and Consolidated Statements of Operations. The Company also made $0.3 million in tax settlement payments to Think Finance in accordance with the tax sharing agreement for the year ended December 31, 2015, and $0.6 million in payments related to other expense reimbursements for the year ended December 31, 2015. For the year ended December 31, 2014, the Company received a tax settlement payment from Think Finance of $0.4 million.
As discussed in Note 1—Summary of Significant Accounting Policies, the Company entered into a shared services agreement with Think Finance from the date of the Spin-Off through October 2014. The Company incurred total costs of approximately $3.1 million during the year ended December 31, 2014, respectively, related to the shared services agreement. These expenses are included in Compensation and benefits, Professional services, Occupancy and equipment, and Other within the Combined and Consolidated Statements of Operations. At December 31, 2015, the Company had approximately $0.3 million in Accounts payable due to Think Finance related to reimbursable costs, which is included in Accounts payable and accrued liabilities within the Consolidated Balance Sheets. At December 31, 2014, the Company had approximately $1.3 million in Accounts payable due to Think Finance related to shared services expenses, reimbursable costs and tax sharing arrangements, net of accounts receivable.
The following table contains the amount of expenses allocated to the Company from Think Finance prior to the Spin-Off, and shared services expenses incurred from the date of the Spin-Off through October 2014, for the year ended December 31, 2014.
| (Dollars in thousands) | 2014 | |||
| Expense allocations: |
||||
| Direct marketing costs |
$ | 10,128 | ||
| Other cost of sales |
898 | |||
| Compensation and benefits |
10,550 | |||
| Professional services |
3,914 | |||
| Selling and marketing |
1,031 | |||
| Occupancy and equipment |
1,656 | |||
| Depreciation and amortization |
2,241 | |||
| Other |
505 | |||
| Expenses under the shared services agreement: |
||||
| Compensation and benefits |
2,537 | |||
| Professional services |
176 | |||
| Occupancy and equipment |
318 | |||
| Other |
67 | |||
|
|
|
|||
| $ | 34,021 | |||
|
|
|
|||
F-42
Table of Contents
Elevate Credit, Inc. and Subsidiaries
NOTES TO COMBINED AND CONSOLIDATED FINANCIAL STATEMENTS — (Continued)
For the years ended December 31, 2015 and 2014
During the years ended December 31, 2015 and 2014, the Company incurred consulting costs and travel expense reimbursements of approximately $0.3 million and $0.1 million, respectively, associated with certain board members. Stock compensation expense of $0.2 million and $0.1 million was also recorded for certain board members during the years ended December 31, 2015 and 2014, respectively. These expenses are included in Professional services and Other operating expenses within the Combined and Consolidated Statements of Operations. In addition, during the year ended December 31, 2015, the Company incurred consulting costs of approximately $0.2 million related to a consulting agreement with a related party, which is described in Note 12—Fair Value Measurements. These expenses are included in Professional services within the Combined and Consolidated Statements of Operations.
NOTE 18—401(k) PLAN
Prior to the Spin-Off, all US employees participated in the Think Finance 401(k) plan. The Company adopted a 401(k) Plan (the “Plan”) on June 1, 2014 with substantially the same terms as the Think Finance 401(k) plan. All employees are eligible to participate in the Plan upon reaching the age of 21 years and completing one month of service with the Company. The Plan is a “safe harbor 401k plan” and the Company matches 100% of each participant’s first 4% of compensation that is contributed to the Plan each year. Participants may contribute up to 70% of their eligible earnings to the applicable Plan, subject to regulatory and other plan restrictions. Company and employee contributions are fully vested at the time of contribution. The Company’s consolidated matching contributions in the years ended December 31, 2015 and 2014 totaled approximately $1.2 million and $1.0 million (of which approximately $0.3 million related to the Think Finance Plan at December 31, 2014), respectively.
In addition, the Company operates a defined contribution pension scheme for its employees in the United Kingdom. The assets of the scheme are held separately to those of the Company in an independently administered fund. The pension cost charge represents approximately $0.3 million and $0.2 million in contributions paid by the Company to the fund during the years ended December 31, 2015 and 2014, respectively.
NOTE 19—SUBSEQUENT EVENTS
The Company has evaluated all subsequent events and transactions through April 27, 2016, the date that the combined and consolidated financial statements were available to be issued, and noted no subsequent events requiring financial statement recognition or disclosure, except as noted below.
On February 11, 2016, the VPC Facility (see Note 8—Notes Payable) was amended such that the ELCS Subdebt Term Note included an additional $10 million to fund working capital, thereby bringing the maximum borrowing amount to $45 million.
On February 22, 2016, the UK subsidiary has received full authorization from the country’s regulator, the Financial Conduct Authority (“FCA”). The UK had been operating and providing its Sunny credit products under interim permission since the FCA commenced its regulation of the UK consumer credit sector in April 2014. All UK consumer credit lenders were required to apply to receive full authorization from the FCA to ensure that their culture, systems, controls and operations were in compliance with the FCA’s standards.
F-43
Table of Contents
Elevate Credit, Inc. and Subsidiaries
NOTES TO COMBINED AND CONSOLIDATED FINANCIAL STATEMENTS — (Continued)
For the years ended December 31, 2015 and 2014
NOTE 20—STOCK SPLIT
On December 11, 2015, the Board of Directors approved the ratio that will be included in an amended and restated certificate of incorporation to effect a 2.5-for-1 forward stock split of its common stock to be effective in connection with the completion of the Company’s initial public offering. The stock split will cause an adjustment to the par value for the common stock, from $0.001 per share to $0.0004 per share, and reflects a two and a half times increase in the number of authorized and outstanding shares of common stock. As a result of the stock split, the share amounts under its employee incentive plan will also be adjusted. The conversion of shares of preferred stock will occur on a one-to-one basis without additional consideration into an aggregate of 5,639,410 shares of common stock immediately prior to the 2.5-for-1 forward stock split of our common stock. The 2.5-for-1 forward stock split will thereafter be applied to the resulting total amount of common stock. Unless otherwise noted, the Company has accordingly presented unaudited pro forma basic and diluted net loss per share for the fiscal years ended December 31, 2015 and 2014.
Unaudited pro forma basic and diluted net loss per share are computed by dividing net loss by the basic and diluted pro forma weighted average number of common shares outstanding, after giving effect to the transactions described above as though the split had occurred as of December 31, 2013, the beginning of the fiscal year ended December 31, 2014.
The impact of the 2.5-for-1 forward stock split on the weighted average number of common shares on a historical and pro forma basis and the earnings per share on a pro forma basis for the fiscal years ended December 31, 2015 and 2014 are as follows:
| 2015 | 2014 | |||||||
| (Dollars in thousands except per share amounts) | Basic and Diluted | Basic and Diluted | ||||||
| Net loss from continuing operations |
$ | (19,911 | ) | $ | (54,760 | ) | ||
| Income from discontinued operations |
— | 135 | ||||||
|
|
|
|
|
|||||
| Net loss |
$ | (19,911 | ) | $ | (54,625 | ) | ||
|
|
|
|
|
|||||
| Historical weighted average number of common shares |
5,010,339 | 4,711,794 | ||||||
| Impact of 2.5-for-1 forward stock split |
7,515,508 | 7,067,691 | ||||||
|
|
|
|
|
|||||
| Pro forma weighted average number of common shares |
12,525,847 | 11,779,485 | ||||||
|
|
|
|
|
|||||
| Pro forma basic and diluted (loss) earnings per share: |
||||||||
| Net loss from continuing operations |
$ | (1.59 | ) | $ | (4.65 | ) | ||
| Income from discontinued operations |
— | 0.01 | ||||||
|
|
|
|
|
|||||
| Net loss |
$ | (1.59 | ) | $ | (4.64 | ) | ||
|
|
|
|
|
|||||
F-44
Table of Contents
Elevate Credit, Inc. and Subsidiaries
CONDENSED CONSOLIDATED BALANCE SHEETS
| (Dollars in thousands, except share and per share amounts) | March 31, 2016 |
December 31, 2015 |
||||||
| (unaudited) | ||||||||
| ASSETS | ||||||||
| Cash and cash equivalents* |
$ | 72,871 | $ | 29,050 | ||||
| Restricted cash |
1,994 | 1,996 | ||||||
| Loans receivable, net of allowance for loan losses of $51,296 and $59,771, respectively* |
257,763 | 274,208 | ||||||
| Prepaid expenses and other assets* |
10,047 | 8,265 | ||||||
| Bank reserve deposit* |
10,000 | 9,287 | ||||||
| Receivable from CSO lenders |
9,255 | 9,719 | ||||||
| Receivable from payment processors* |
11,345 | 13,851 | ||||||
| Deferred tax assets, net |
20,973 | 26,856 | ||||||
| Property and equipment, net |
16,833 | 17,770 | ||||||
| Goodwill |
16,027 | 16,027 | ||||||
| Intangible assets, net |
2,439 | 2,484 | ||||||
|
|
|
|
|
|||||
| Total assets |
$ | 429,547 | $ | 409,513 | ||||
|
|
|
|
|
|||||
| LIABILITIES AND STOCKHOLDERS’ EQUITY | ||||||||
| Accounts payable and accrued liabilities (including $24 and $304 payable to Think Finance, respectively)* |
$ | 32,249 | $ | 36,258 | ||||
| State and other taxes payable |
679 | 803 | ||||||
| Notes payable, net* |
357,148 | 339,077 | ||||||
|
|
|
|
|
|||||
| Total liabilities |
390,076 | 376,138 | ||||||
| COMMITMENTS, CONTINGENCIES AND GUARANTEES (Note 10) |
||||||||
| STOCKHOLDERS’ EQUITY |
||||||||
| Common stock; $0.001 par value; 16,670,700 authorized shares; 5,119,784 and 5,118,743 issued and outstanding, respectively |
5 | 5 | ||||||
| Convertible preferred stock; Series A, $0.001 par value; 2,957,059 shares authorized, issued and outstanding, liquidation preference of $22,850 |
3 | 3 | ||||||
| Convertible preferred stock; Series B, $0.001 par value; 2,682,351 shares authorized, issued and outstanding, liquidation preference of $40,000 |
3 | 3 | ||||||
| Accumulated other comprehensive gain, net of tax benefit of $2,206 and $2,206, respectively |
411 | 286 | ||||||
| Additional paid-in capital |
87,269 | 87,090 | ||||||
| Accumulated deficit |
(48,220 | ) | (54,012 | ) | ||||
|
|
|
|
|
|||||
| Total stockholders’ equity |
39,471 | 33,375 | ||||||
|
|
|
|
|
|||||
| Total liabilities and stockholders’ equity |
$ | 429,547 | $ | 409,513 | ||||
|
|
|
|
|
|||||
| * | These balances include certain assets and liabilities of a variable interest entity (“VIE”) that can only be used to settle the liabilities of that VIE. All assets of the Company are pledged as security for the Company’s outstanding debt, including debt held by the VIE. For further information regarding the assets and liabilities included in our consolidated accounts, see Note 4—Variable Interest Entity. |
The accompanying notes are an integral part of these unaudited condensed consolidated financial statements.
F-45
Table of Contents
Elevate Credit, Inc. and Subsidiaries
CONDENSED CONSOLIDATED STATEMENTS OF INCOME (UNAUDITED)
| For the three months ended March 31, | ||||||||
| (Dollars in thousands, except share and per share amounts) | 2016 | 2015 | ||||||
| Revenues |
$ | 130,722 | $ | 89,506 | ||||
| Cost of sales: |
||||||||
| Provision for loan losses |
59,089 | 39,284 | ||||||
| Direct marketing costs |
9,606 | 9,866 | ||||||
| Other cost of sales |
3,583 | 2,606 | ||||||
|
|
|
|
|
|||||
| Total cost of sales |
72,278 | 51,756 | ||||||
|
|
|
|
|
|||||
| Gross profit |
58,444 | 37,750 | ||||||
| Operating expenses: |
||||||||
| Compensation and benefits |
16,100 | 13,921 | ||||||
| Professional services |
7,249 | 4,748 | ||||||
| Selling and marketing |
2,505 | 2,490 | ||||||
| Occupancy and equipment |
2,735 | 2,333 | ||||||
| Depreciation and amortization |
2,633 | 2,068 | ||||||
| Other |
706 | 569 | ||||||
|
|
|
|
|
|||||
| Total operating expenses |
31,928 | 26,129 | ||||||
|
|
|
|
|
|||||
| Operating income |
26,516 | 11,621 | ||||||
| Other expense: |
||||||||
| Net interest expense |
(13,500 | ) | (6,755 | ) | ||||
| Foreign currency transaction loss |
(1,358 | ) | (1,459 | ) | ||||
|
|
|
|
|
|||||
| Total other expense |
(14,858 | ) | (8,214 | ) | ||||
|
|
|
|
|
|||||
| Income before taxes |
11,658 | 3,407 | ||||||
| Income tax expense |
5,866 | 2,509 | ||||||
|
|
|
|
|
|||||
| Net income |
$ | 5,792 | $ | 898 | ||||
|
|
|
|
|
|||||
| Basic earnings per share |
$ | 1.13 | $ | 0.18 | ||||
| Diluted earnings per share |
$ | 0.51 | $ | 0.08 | ||||
| Basic weighted average shares outstanding |
5,118,983 | 4,892,431 | ||||||
| Diluted weighted average shares outstanding |
11,359,870 | 10,986,502 | ||||||
The accompanying notes are an integral part of these unaudited condensed consolidated financial statements.
F-46
Table of Contents
Elevate Credit, Inc. and Subsidiaries
CONDENSED CONSOLIDATED STATEMENTS OF COMPREHENSIVE INCOME (UNAUDITED)
| For the three months ended March 31, | ||||||||
| (Dollars in thousands) | 2016 | 2015 | ||||||
| Net income |
$ | 5,792 | $ | 898 | ||||
| Other comprehensive income, net of tax: |
||||||||
| Foreign currency translation adjustment, net of tax |
125 | (18 | ) | |||||
|
|
|
|
|
|||||
| Total other comprehensive income, net of tax |
125 | (18 | ) | |||||
|
|
|
|
|
|||||
| Total comprehensive income |
$ | 5,917 | $ | 880 | ||||
|
|
|
|
|
|||||
The accompanying notes are an integral part of these unaudited condensed consolidated financial statements.
F-47
Table of Contents
Elevate Credit, Inc. and Subsidiaries
CONDENSED CONSOLIDATED STATEMENTS OF STOCKHOLDERS’ EQUITY (UNAUDITED)
For the three months ended March 31, 2016 and 2015
| (Dollars in thousands) |
Common Stock |
Series A Convertible |
Series B Convertible |
Additional paid-in capital |
Accumu- deficit |
Accumulated other comprehensive loss |
Total | |||||||||||||||||||||||||||||||||
| Shares | Amount | Shares | Amount | Shares | Amount | |||||||||||||||||||||||||||||||||||
| Balances at December 31, 2014 |
4,842,968 | 5 | 2,957,059 | 3 | 2,682,351 | 3 | 86,591 | (34,101 | ) | (311 | ) | 52,190 | ||||||||||||||||||||||||||||
| Stock-based compensation |
— | — | — | — | — | — | 260 | — | — | 260 | ||||||||||||||||||||||||||||||
| Exercise of stock options |
131,151 | — | — | — | — | — | (750 | ) | — | — | (750 | ) | ||||||||||||||||||||||||||||
| Comprehensive income: |
||||||||||||||||||||||||||||||||||||||||
| Foreign currency translation adjustment net of tax expense of $0 |
— | — | — | — | — | — | — | — | (18 | ) | (18 | ) | ||||||||||||||||||||||||||||
| Net income |
— | — | — | — | — | — | — | 898 | — | 898 | ||||||||||||||||||||||||||||||
|
|
|
|
|
|
|
|
|
|
|
|
|
|
|
|
|
|
|
|
|
|||||||||||||||||||||
| Balances at March 31, 2015 |
4,974,119 | 5 | 2,957,059 | 3 | 2,682,351 | 3 | 86,101 | (33,203 | ) | (329 | ) | 52,580 | ||||||||||||||||||||||||||||
|
|
|
|
|
|
|
|
|
|
|
|
|
|
|
|
|
|
|
|
|
|||||||||||||||||||||
|
|
|
|
|
|
|
|
|
|
|
|
|
|
|
|
|
|
|
|
|
|||||||||||||||||||||
| Balances at December 31, 2015 |
5,118,743 | $ | 5 | 2,957,059 | $ | 3 | 2,682,351 | $ | 3 | $ | 87,090 | $ | (54,012 | ) | $ | 286 | $ | 33,375 | ||||||||||||||||||||||
|
|
|
|
|
|
|
|
|
|
|
|
|
|
|
|
|
|
|
|
|
|||||||||||||||||||||
| Stock-based compensation |
— | — | — | — | — | — | 166 | — | — | 166 | ||||||||||||||||||||||||||||||
| Exercise of stock options |
1,041 | — | — | — | — | — | 13 | — | — | 13 | ||||||||||||||||||||||||||||||
| Comprehensive income: |
||||||||||||||||||||||||||||||||||||||||
| Foreign currency translation adjustment net of tax expense of $0 |
— | — | — | — | — | — | — | — | 125 | 125 | ||||||||||||||||||||||||||||||
| Net income |
— | — | — | — | — | — | — | 5,792 | — | 5,792 | ||||||||||||||||||||||||||||||
|
|
|
|
|
|
|
|
|
|
|
|
|
|
|
|
|
|
|
|
|
|||||||||||||||||||||
| Balances at March 31, 2016 |
5,119,784 | 5 | 2,957,059 | 3 | 2,682,351 | 3 | 87,269 | (48,220 | ) | 411 | 39,471 | |||||||||||||||||||||||||||||
|
|
|
|
|
|
|
|
|
|
|
|
|
|
|
|
|
|
|
|
|
|||||||||||||||||||||
The accompanying notes are an integral part of these unaudited condensed consolidated financial statements.
F-48
Table of Contents
Elevate Credit, Inc. and Subsidiaries
CONDENSED CONSOLIDATED STATEMENTS OF CASH FLOWS (UNAUDITED)
| For the three months ended March 31, | ||||||||
| (Dollars in thousands) | 2016 | 2015 | ||||||
| CASH FLOWS FROM OPERATING ACTIVITIES: |
||||||||
| Net Income |
$ | 5,792 | $ | 898 | ||||
| Adjustments to reconcile net income to net cash provided by operating activities: |
||||||||
| Depreciation and amortization |
2,633 | 2,068 | ||||||
| Provision for loan losses |
59,089 | 39,284 | ||||||
| Stock-based compensation |
166 | 260 | ||||||
| Amortization of debt issuance costs |
71 | 36 | ||||||
| Amortization of loan premium |
439 | — | ||||||
| Deferred income tax expense, net |
5,613 | 6,123 | ||||||
| Unrealized loss from foreign currency transactions |
1,259 | 1,459 | ||||||
| Changes in operating assets and liabilities: |
||||||||
| Prepaid expenses and other assets |
(1,069 | ) | 733 | |||||
| Reserve deposits |
(713 | ) | — | |||||
| Receivables from payment processors |
2,363 | (7,206 | ) | |||||
| Receivables from CSO lenders |
464 | 429 | ||||||
| Interest receivable |
(16,924 | ) | (10,493 | ) | ||||
| State and other taxes payable |
(107 | ) | (16 | ) | ||||
| Deferred tax assets |
271 | (3,614 | ) | |||||
| Deferred revenue |
3,880 | (213 | ) | |||||
| Accounts payable and accrued liabilities |
(5,942 | ) | (8,786 | ) | ||||
|
|
|
|
|
|||||
| Net cash provided by operating activities |
57,285 | 20,962 | ||||||
| CASH FLOWS FROM INVESTING ACTIVITIES: |
||||||||
| Loans receivable originated or participations purchased |
(164,430 | ) | (89,291 | ) | ||||
| Principal collections and recoveries on loans receivable |
135,978 | 79,126 | ||||||
| Participation premium paid |
(439 | ) | — | |||||
| Change in restricted cash |
— | 473 | ||||||
| Purchases of property and equipment |
(1,727 | ) | (1,377 | ) | ||||
|
|
|
|
|
|||||
| Net cash used in investing activities |
(30,618 | ) | (11,069 | ) | ||||
The accompanying notes are an integral part of these unaudited condensed consolidated financial statements.
F-49
Table of Contents
Elevate Credit, Inc. and Subsidiaries
CONDENSED CONSOLIDATED STATEMENTS OF CASH FLOWS (UNAUDITED) — (Continued)
| For the three months ended March 31, | ||||||||
| (Dollars in thousands) | 2016 | 2015 | ||||||
| CASH FLOWS FROM FINANCING ACTIVITIES: |
||||||||
| Proceeds from notes payable |
18,000 | — | ||||||
| Payment of capital lease obligations |
(59 | ) | (56 | ) | ||||
| Equity issuance costs paid |
(760 | ) | — | |||||
| Proceeds from stock option exercises |
14 | 101 | ||||||
|
|
|
|
|
|||||
| Net cash provided by financing activities |
17,195 | 45 | ||||||
| Effect of exchange rates on cash and cash equivalents |
(41 | ) | (358 | ) | ||||
|
|
|
|
|
|||||
| Net increase in cash and cash equivalents |
43,821 | 9,580 | ||||||
| Cash and cash equivalents, beginning of period (including $278 of cash classified as Assets of discontinued operations at December 31, 2014) |
29,050 | 29,797 | ||||||
|
|
|
|
|
|||||
| Cash and cash equivalents, end of period |
$ | 72,871 | $ | 39,377 | ||||
|
|
|
|
|
|||||
| Supplemental cash flow information: |
||||||||
| Interest paid |
$ | 13,087 | $ | 6,712 | ||||
| Taxes paid |
$ | 14 | $ | 16 | ||||
The accompanying notes are an integral part of these unaudited condensed consolidated financial statements.
F-50
Table of Contents
Elevate Credit, Inc. and Subsidiaries
NOTES TO CONDENSED CONSOLIDATED FINANCIAL STATEMENTS
(UNAUDITED)
For the three months ended March 31, 2016 and 2015
NOTE 1—SUMMARY OF SIGNIFICANT ACCOUNTING POLICIES
The Company’s accounting and reporting policies are in accordance with accounting principles generally accepted in the United States (“US GAAP”) and conform, as applicable, to general practices within the finance company industry. The following is a description of the more significant of these policies used in preparing the condensed consolidated financial statements.
Business Operations
Elevate Credit, Inc. (the “Company”) is a Delaware corporation. The Company provides technology-driven, progressive online credit solutions to non-prime consumers. The Company uses advanced technology and proprietary risk analytics to provide more convenient and more responsible financial options to its customers, who are not well-served by either banks or legacy non-prime lenders. The Company currently offers unsecured online installment loans and lines of credit in the United States (the “US”) and the United Kingdom (the “UK”). The Company’s products, Rise, Elastic and Sunny, reflect its mission of “Good Today, Better Tomorrow” and provide customers with access to competitively priced credit and services while helping them build a brighter financial future with credit building and financial wellness features. In the UK, the Company directly offers unsecured installment loans via the internet through its wholly owned subsidiary, Elevate Credit International (UK), Limited, (“ECI”) under the brand name of Sunny.
Spin-Off
On January 31, 2014, Think Finance, Inc. (“Think Finance”), the predecessor parent company, formed a new company, Elevate Credit, Inc. On May 1, 2014 (effective at the beginning of the day), Think Finance contributed to the Company certain assets and liabilities associated with its direct lending businesses and completed a tax-free spin-off of 100% of the Company on a carryover basis to the stockholders of Think Finance, in accordance with the distribution agreement (the “Spin-Off”). In connection with the Spin-Off, the Company entered into several other agreements with Think Finance that govern shared services, tax sharing, data sharing, employee matters and a credit facility. The Company accounted for this transaction in accordance with the guidance in Accounting Standards Codification (“ASC”) 505-60-25, Equity—Spinoffs and Reverse Spinoffs. The assets and liabilities associated with Think Finance’s service provider business remained with Think Finance and were not contributed to the Company.
As a result of the Spin-Off, the Company recognized the par value and additional paid-in capital in connection with the issuance of 4,643,133 shares of common stock, 2,957,059 shares of Convertible Series A Preferred Stock, and 2,682,351 shares of Convertible Series B Preferred Stock, exchanged for the net assets contributed at that time, and the Company began accumulating retained earnings upon completion of the Spin-Off on May 1, 2014.
Basis of Presentation
The condensed consolidated financial statements include the accounts of the Company, its wholly owned subsidiaries and from July 1, 2015 and thereafter a variable interest entity (“VIE”) (See Note 4—Variable Interest Entity). All significant intercompany transactions and accounts have been eliminated. The unaudited condensed consolidated financial information included in this report has been prepared in
F-51
Table of Contents
Elevate Credit, Inc. and Subsidiaries
NOTES TO CONDENSED CONSOLIDATED FINANCIAL STATEMENTS
(UNAUDITED) — (Continued)
For the three months ended March 31, 2016 and 2015
accordance with US GAAP for interim financial information and Article 10 of SEC Regulation S-X. The principles for interim financial information do not require the inclusion of all the information and footnotes required by generally accepted accounting principles for complete financial statements. Therefore, these unaudited condensed consolidated financial statements should be read in conjunction with the Company’s most recent annual consolidated financial statements for the year ended December 31, 2015, appearing elsewhere in this prospectus. In the opinion of the Company’s management, the unaudited condensed consolidated financial statements include all adjustments, all of which are of a normal recurring nature, necessary for a fair presentation of the results for the interim periods. The results of operations for the three months ended March 31, 2016 are not necessarily indicative of the results to be expected for the full year or the results for any future periods.
Use of Estimates
The preparation of the condensed consolidated financial statements in conformity with US GAAP requires management to make estimates and assumptions that affect the reported amounts of assets and liabilities, disclosure of contingent assets and liabilities at the date of the condensed consolidated financial statements and the reported amounts of revenues and expenses during the reporting period.
Significant items subject to such estimates and assumptions include the valuation of the allowance for loan losses, goodwill, long-lived and intangible assets, deferred revenues, contingencies, the income tax provision, valuation of stock-based compensation and the valuation allowance against deferred tax assets. The Company bases its estimates on historical experience with Think Finance, current data and experience since the Spin-Off, and assumptions that are believed to be reasonable. Actual results could differ from those estimates.
Revenue Recognition
The Company recognizes consumer loan fees as revenues for each of the loan products it offers. Revenues on the Condensed Consolidated Statements of Income include: finance charges, lines of credit fees, fees for services provided through Credit Service Organization (“CSO”) programs (“CSO Fees”), and nonsufficient funds fees (“NSF fees”), as well as any other fees or charges permitted by applicable laws and pursuant to the agreement with the borrower. The Company also recorded revenues related to the sale of customer applications to unrelated third parties. These applications are sold with the customer’s consent in the event that the Company or its CSO lenders are unable to offer the customer a loan. Revenue is recognized at the time of the sale. Other revenues also include marketing and licensing fees received from the third-party lenders related to the Elastic product and from CSO Fees related to the Rise product. Revenue related to these fees is recognized when service is performed.
The Company accrues finance charges on installment loans on a constant yield basis over their terms. The Company accrues fixed charges such as CSO and lines of credit fees as they are earned over the term of the loan. The Company does not accrue finance charges and other fees on installment loans or lines of credit for which payment is 60 days past due. Installment loans and lines of credit are considered past due if a scheduled payment is not paid on its due date. Payments received on past due loans are applied against the loan and accrued interest balance to bring the loan current. Payments are first applied to accrued fees and interest, and then to the loan balance.
F-52
Table of Contents
Elevate Credit, Inc. and Subsidiaries
NOTES TO CONDENSED CONSOLIDATED FINANCIAL STATEMENTS
(UNAUDITED) — (Continued)
For the three months ended March 31, 2016 and 2015
Effective through April 30, 2015, the Company offered a reward program for certain installment loan customers. Customers could earn points for performing various activities such as making a consecutive number of timely loan payments or completing financial education courses provided by the Company. These points could then be used to reduce the interest rate of an outstanding loan. The Company estimated the expected future interest discounts to be provided based on the likelihood that the customer would earn enough points over the life of the loan to achieve a discount. If a discount would be achieved, an effective yield over the life of the loan was calculated (considering the future discounts) and any interest collected in excess of the effective yield was deferred. The reward program was discontinued on April 30, 2015.
Credit Service Organization
The Company also provides services in connection with installment loans originated by independent third-party lenders (“CSO lenders”), whereby the Company acts as a credit services organization/credit access business on behalf of consumers in accordance with applicable state laws (the “CSO program”). The CSO program includes arranging loans with CSO lenders, assisting in the loan application, documentation and servicing processes.
Under the CSO program, the Company guarantees the repayment of the customer’s loan to the CSO lenders as part of the credit services it provides to the customer. A customer who obtains a loan through the CSO program pays the Company a fee for the credit services, including the guaranty, and enters into a contract with the CSO lenders governing the credit services arrangement. The CSO fee received is recognized over the life of the loan. We estimate a liability for losses associated with the guaranty provided to the CSO lenders using assumptions and methodologies similar to the allowance for loan losses detailed previously. The CSO program requires that the Company fund a cash reserve equal to 20%-30% of the outstanding loan principal within the CSO program portfolio.
The Company also had a Receivable from CSO lenders related primarily to CSO fees received by the CSO lenders from customers. As of March 31, 2016 and December 31, 2015, respectively, estimated losses of approximately and $4.3 million and $6.0 million for the CSO owned loans of approximately and $36.8 million and $44.1 million, respectively, are initially recorded at fair value and are included in Accounts payable and accrued liabilities in the Condensed Consolidated Balance Sheets. See Note 3—Loans Receivable and Revenues for additional information on loans receivable and the provision for loan losses.
| (Dollars in thousands) | March 31, 2016 |
December 31, 2015 |
||||||
| Receivable related to 20%-30% cash reserve |
$ | 8,293 | $ | 8,473 | ||||
| Receivable related to CSO fees collected by CSO lenders |
962 | 1,246 | ||||||
|
|
|
|
|
|||||
| Total receivable from CSO lenders |
$ | 9,255 | $ | 9,719 | ||||
|
|
|
|
|
|||||
The CSO lenders are considered VIE’s of the Company; however, the Company does not have any ownership interest in the CSO lenders, does not exercise control over them, is not the primary beneficiary, and therefore, does not consolidate the CSO lenders’ results with its results.
F-53
Table of Contents
Elevate Credit, Inc. and Subsidiaries
NOTES TO CONDENSED CONSOLIDATED FINANCIAL STATEMENTS
(UNAUDITED) — (Continued)
For the three months ended March 31, 2016 and 2015
Debt Issuance Costs
Costs incurred for issuing the Notes payable are deferred and amortized using the straight-line method over the life of the related debt, which approximates the effective interest method. The unamortized balance of debt issuance costs was approximately $0.7 million at both March 31, 2016 and December 31, 2015 and is included in Notes payable, net in the Condensed Consolidated Balance Sheets. Amortization of debt issuance costs of approximately $71 thousand and $36 thousand was recognized for the three months ended March 31, 2016 and 2015, respectively, and is included within Net interest expense in the Condensed Consolidated Statements of Income.
Convertible Preferred Stock Redemption
The holders of Series A Preferred Stock can be redeemed at any time after August 30, 2018, and at the election of the holders of at least two-thirds of the then outstanding Series A Preferred Stock, at a redemption price of $5.35 per share (prior to the 2.5-for-1 forward stock split) plus 8% compounded annually from the Series A issuance date, plus all declared and unpaid dividends.
The holders of Series B Preferred Stock can be redeemed at any time after the holders of Series A Preferred Stock have been redeemed, and at the election of the holders of at least two-thirds of the then outstanding Series B Preferred Stock, at a redemption price of $10.33 per share (prior to the 2.5-for-1 forward stock split) plus 8% compounded annually from the Series B issuance date, plus all declared and unpaid dividends.
The holders of Series A and B Preferred Stock signed a Waiver Agreement by which they defer and waive their rights to exercise the redemption rights or otherwise obligate the Company to redeem the Preferred Stock, unless and until the Notes payable have been paid in full.
All of our currently outstanding shares of convertible preferred stock will automatically convert into common stock, effective upon completion of this offering. All series of convertible preferred stock will convert at a ratio of one share of common stock for each share of preferred stock.
Recently Adopted Accounting Standards
In June 2015, the FASB issued ASU No. 2015-10, Technical Corrections and Improvements (“ASU 2015-10”). The amendments in ASU 2015-10 represent changes to clarify the Codification, correct unintended application of guidance, or make minor improvements to the Codification that are not expected to have a significant effect on current accounting practice or create a significant administrative cost to most entities. In addition, some of the amendments are intended to make the Codification easier to understand and easier to apply by eliminating inconsistencies, providing needed clarifications, and improving the presentation of guidance in the Codification. ASU 2015-10 is effective for fiscal years (and interim reporting periods within those years) beginning after December 15, 2015. The Company has adopted this standard and it did not have a material impact on its consolidated financial statements.
In April 2015, the FASB issued ASU No 2015-03, Interest—Imputation of Interest (Subtopic 835-30): Simplifying the Presentation of Debt Issuance Costs (“ASU 2015-03”). The amendments in ASU 2015-03 are intended to simplify the presentation of debt issuance costs. These amendments require that debt issuance costs related to a recognized debt liability be presented in the balance sheet as a direct deduction
F-54
Table of Contents
Elevate Credit, Inc. and Subsidiaries
NOTES TO CONDENSED CONSOLIDATED FINANCIAL STATEMENTS
(UNAUDITED) — (Continued)
For the three months ended March 31, 2016 and 2015
from the carrying amount of that debt liability, consistent with debt discounts. The recognition and measurement guidance for debt issuance costs are not affected by the amendments in this ASU. In August 2015, the FASB issued ASU No. 2015-15, Interest—Imputation of Interest (Subtopic 835-30): Presentation and Subsequent Measurement of Debt Issuance Costs Associated with Line-of-Credit Arrangements (“ASU 2015-15”). ASU 2015-15 amends Subtopic 835-30 to include that the Securities and Exchange Commission would not object to the deferral and presentation of debt issuance costs as an asset and subsequent amortization of debt issuance costs over the term of the line-of-credit arrangement, whether or not there are any outstanding borrowings on the line-of-credit arrangement. ASU 2015-03 is effective for fiscal years (and interim reporting periods within those years) beginning after December 15, 2015. Early adoption is permitted. The Company has adopted this guidance for the period ended March 31, 2016, and all prior period financial information presented has been adjusted to reflect the retrospective application of this guidance resulting in a reduction to Other assets and to Notes payable, net of $0.7 million as of March 31, 2016 and December 31, 2015.
In February 2015, the FASB issued ASU 2015-02, Consolidation (Topic 810): Amendments to the Consolidation Analysis (“ASU 2015-02”). The amendments in ASU 2015-02 provide guidance for reporting entities that are required to evaluate whether they should consolidate certain legal entities. In accordance with ASU 2015-02, all legal entities are subject to reevaluation under the revised consolidation model. ASU 2015-02 is effective for public business entities for annual periods, and interim periods within those annual periods, beginning after December 15, 2015. Early adoption is permitted. The Company has adopted this standard and it did not have a material impact on its consolidated financial statements.
In January 2015, the FASB issued ASU 2015-01, Income Statement—Extraordinary and Unusual Items (Subtopic 225-20): Simplifying Income Statement Presentation by Eliminating the Concept of Extraordinary Items (“ASU 2015-01”). The amendments in ASU 2015-01 eliminate from GAAP the concept of extraordinary items. If an event or transaction meets the criteria for extraordinary classification, it is segregated from the results of ordinary operations and is shown as a separate item in the income statement, net of tax. ASU 2015-01 is effective for annual periods, and interim periods within those annual periods, beginning after December 15, 2015. Early adoption is permitted. The Company has adopted this standard and it did not have a material impact on its consolidated financial statements.
Accounting Standards to be Adopted in Future Periods
In March 2016, the FASB issued ASU No. 2016-09, Compensation—Stock Compensation (Topic 718): Improvements to Employee Share-Based Payment Accounting (“ASU 2016-09”). ASU 2016-09 is intended to simplify the accounting for share-based payment transactions, including the income tax consequences, classification of awards as either equity or liabilities and classification on the statement of cash flows. ASU 2016-09 is effective for fiscal years beginning after December 15, 2016, including interim periods within those fiscal years. Early adoption is permitted. The Company is still assessing the potential impact of ASU 2016-09 on its consolidated financial statements.
In February 2016, the FASB issued ASU No. 2016-02, Leases (Topic 842) (“ASU 2016-02”). ASU 2016-02 is intended to improve the reporting of leasing transactions to provide users of financial statements with more decision-useful information. ASU 2016-02 will require organizations that lease assets to recognize on
F-55
Table of Contents
Elevate Credit, Inc. and Subsidiaries
NOTES TO CONDENSED CONSOLIDATED FINANCIAL STATEMENTS
(UNAUDITED) — (Continued)
For the three months ended March 31, 2016 and 2015
the balance sheet the assets and liabilities for the rights and obligations created by those leases. ASU 2016-02 is effective for fiscal years beginning after December 15, 2018, including interim periods within those fiscal years. Early adoption is permitted. The Company is still assessing the potential impact of ASU 2016-02 on its consolidated financial statements.
In January 2016, the FASB issued ASU No. 2016-01, Financial Instruments—Overall (Subtopic 825-10): Recognition and Measurement of Financial Assets and Financial Liabilities (“ASU 2016-01”). ASU 2016-01 is intended to enhance the reporting model for financial instruments to provide users of financial statements with more decision-useful information. ASU 2016-01 is effective for fiscal years beginning after December 15, 2017, including interim periods within those fiscal years. The Company is still assessing the potential impact of ASU 2016-01 on its consolidated financial statements.
In August 2014, the FASB issued ASU 2014-15, Presentation of Financial Statements—Going Concern (Subtopic 205-40): Disclosure of Uncertainties about an Entity’s Ability to Continue as a Going Concern (“ASU 2014-15”). The amendments in ASU 2014-15 require management to evaluate, in connection with financial statement preparation for each annual and interim reporting period, whether there are conditions or events that raise substantial doubt about the entity’s ability to continue as a going concern within one year after the date the financial statements are issued, and to provide related disclosures. ASU 2014-15 applies to all entities and is effective for annual periods ending after December 15, 2016, and interim periods thereafter. Early adoption is permitted. The Company is still assessing the potential impact of ASU 2014-15 on its consolidated financial statements.
In May 2014, the FASB issued ASU 2014-09, Revenue from Contracts with Customers (Topic 606) (“ASU 2014-09”). ASU 2014-09 is a comprehensive new revenue recognition model that requires a company to recognize revenue to depict the transfer of goods or services to a customer at an amount that reflects the consideration it expects to receive in exchange for those goods or services. ASU 2014-09 also requires additional disclosure about the nature, amount, timing and uncertainty of revenue and cash flows arising from customer contracts, including significant judgments and changes in judgments and assets recognized from costs incurred to obtain or fulfill a contract. In August 2015, the FASB issued ASU No. 2015-14, Revenue from Contracts with Customers (Topic 606): Deferral of Effective Date (“ASU 2015-14”), which defers the effective date of this guidance by one year, to the annual reporting periods beginning after December 15, 2017, including interim periods within that reporting period. A reporting entity may choose to early adopt the guidance as of the original effective date. In April 2016, the FASB issued ASU 2016-09, Revenues from Contracts with Customers (Topic 606): Identifying Performance Obligations and Licensing (“ASU 2016-10”), which clarifies the guidance related to identifying performance obligations and licensing implementation. The Company is still assessing the potential impact of ASU 2014-09 on its consolidated financial statements.
NOTE 2—EARNINGS PER SHARE
Basic earnings per share is computed by dividing net income by the weighted average number of shares outstanding during each period. Diluted earnings per share is computed based on the weighted average number of common shares outstanding (“WASO”) plus the effect of dilutive potential common shares that could be issued if stock options were exercised, using the treasury stock method, and the conversion feature of preferred stock was exercised using the if-converted method.
F-56
Table of Contents
Elevate Credit, Inc. and Subsidiaries
NOTES TO CONDENSED CONSOLIDATED FINANCIAL STATEMENTS
(UNAUDITED) — (Continued)
For the three months ended March 31, 2016 and 2015
The computation of earnings per share was as follows for the three months ended March 31, 2016 and 2015:
| (Dollars in thousands, except share and per share amounts) | 2016 | 2015 | ||||||
| Numerator (basic and diluted): |
||||||||
| Net income |
$ | 5,792 | $ | 898 | ||||
| Denominator: |
||||||||
| Basic weighted average number of shares outstanding |
5,118,983 | 4,892,431 | ||||||
| Diluted weighted average number of shares outstanding |
11,359,870 | 10,986,502 | ||||||
| Basic earnings per share |
$ | 1.13 | $ | 0.18 | ||||
| Diluted earnings per share |
$ | 0.51 | $ | 0.08 | ||||
ASC Topic 260, “Earnings Per Share” (“ASC Topic 260”) requires companies with participating securities to utilize a two-class method for the computation of net income attributable to the Company per share. The two-class method requires a portion of net income attributable to the Company to be allocated to participating securities, which are securities with non-forfeitable rights to receive dividends or dividend equivalents, if declared. The Company had no outstanding participating securities for the three month periods ended March 31, 2016 and 2015.
NOTE 3—LOANS RECEIVABLE AND REVENUES
Revenues generated from the Company’s consumer loans for the three months ended March 31, 2016 and 2015 were as follows:
| (Dollars in thousands) | 2016 | 2015 | ||||||
| Finance charges |
$ | 96,243 | $ | 75,726 | ||||
| CSO fees |
18,471 | 13,215 | ||||||
| Lines of credit fees |
15,838 | 301 | ||||||
| Other |
170 | 264 | ||||||
|
|
|
|
|
|||||
| Total Revenues |
$ | 130,722 | $ | 89,506 | ||||
|
|
|
|
|
|||||
F-57
Table of Contents
Elevate Credit, Inc. and Subsidiaries
NOTES TO CONDENSED CONSOLIDATED FINANCIAL STATEMENTS
(UNAUDITED) — (Continued)
For the three months ended March 31, 2016 and 2015
The Company’s portfolio consists of both installment loans and lines of credit, which are considered the portfolio segments at March 31, 2016 and December 31, 2015. The following reflects the credit quality of the Company’s loans receivable as of March 31, 2016 and December 31, 2015 as delinquency status has been identified as the primary credit quality indicator. Loans are determined to be past due when they are one day past due without a payment. All impaired loans as of March 31, 2016 and December 31, 2015 have been charged off.
| March 31, 2016 | ||||||||||||
| (Dollars in thousands) | Installment | Line of Credit | Total | |||||||||
| Current loans |
$ | 172,821 | $ | 70,814 | $ | 243,635 | ||||||
| Past due loans |
57,606 | 7,114 | 64,720 | |||||||||
|
|
|
|
|
|
|
|||||||
| Total loans receivable |
230,427 | 77,928 | 308,355 | |||||||||
| Net unamortized loan premium |
— | 704 | 704 | |||||||||
| Less: Allowance for loan losses |
(42,235 | ) | (9,061 | ) | (51,296 | ) | ||||||
|
|
|
|
|
|
|
|||||||
| Loans receivable, net |
$ | 188,192 | $ | 69,571 | $ | 257,763 | ||||||
|
|
|
|
|
|
|
|||||||
| December 31, 2015 | ||||||||||||
| (Dollars in thousands) | Installment | Line of Credit | Total | |||||||||
| Current loans |
$ | 211,144 | $ | 68,742 | $ | 279,886 | ||||||
| Past due loans |
46,804 | 6,536 | 53,340 | |||||||||
|
|
|
|
|
|
|
|||||||
| Total loans receivable |
257,948 | 75,278 | 333,226 | |||||||||
| Net unamortized loan premium |
— | 753 | 753 | |||||||||
| Less: Allowance for loan losses |
(49,755 | ) | (10,016 | ) | (59,771 | ) | ||||||
|
|
|
|
|
|
|
|||||||
| Loans receivable, net |
$ | 208,193 | $ | 66,015 | $ | 274,208 | ||||||
|
|
|
|
|
|
|
|||||||
Total loans receivable includes approximately $19.0 million and $21.9 million of interest receivable at March 31, 2016 and December 31, 2015, respectively.
F-58
Table of Contents
Elevate Credit, Inc. and Subsidiaries
NOTES TO CONDENSED CONSOLIDATED FINANCIAL STATEMENTS
(UNAUDITED) — (Continued)
For the three months ended March 31, 2016 and 2015
The changes in the allowance for loan losses for the three months ended March 31, 2016 and 2015 are as follows:
| March 31, 2016 | ||||||||||||
| (Dollars in thousands) | Installment | Line of Credit | Total | |||||||||
| Balance beginning of year |
$ | 55,768 | $ | 10,016 | $ | 65,784 | ||||||
| Provision for loan losses |
51,944 | 7,145 | 59,089 | |||||||||
| Charge-offs |
(66,581 | ) | (8,100 | ) | (74,681 | ) | ||||||
| Recoveries of prior charge-offs |
5,671 | — | 5,671 | |||||||||
| Effect of changes in foreign currency rates |
(271 | ) | — | (271 | ) | |||||||
|
|
|
|
|
|
|
|||||||
| Total |
46,531 | 9,061 | 55,592 | |||||||||
| Accrual for CSO lender owned loans (Note 1) |
(4,296 | ) | — | (4,296 | ) | |||||||
|
|
|
|
|
|
|
|||||||
| Balance end of period |
$ | 42,235 | $ | 9,061 | $ | 51,296 | ||||||
|
|
|
|
|
|
|
|||||||
| March 31, 2015 | ||||||||||||
| (Dollars in thousands) | Installment | Line of Credit | Total | |||||||||
| Balance beginning of year |
$ | 48,453 | $ | 38 | $ | 48,491 | ||||||
| Provision for loan losses |
39,015 | 269 | 39,284 | |||||||||
| Charge-offs |
(49,077 | ) | (50 | ) | (49,127 | ) | ||||||
| Recoveries of prior charge-offs |
3,433 | — | 3,433 | |||||||||
| Effect of changes in foreign currency rates |
(363 | ) | — | (363 | ) | |||||||
|
|
|
|
|
|
|
|||||||
| Total |
41,461 | 257 | 41,718 | |||||||||
| Accrual for CSO lender owned loans (Note 1) |
(2,971 | ) | — | (2,971 | ) | |||||||
|
|
|
|
|
|
|
|||||||
| Balance end of period |
$ | 38,490 | $ | 257 | $ | 38,747 | ||||||
|
|
|
|
|
|
|
|||||||
NOTE 4—VARIABLE INTEREST ENTITY
The Company is involved with an entity that is deemed to be a VIE. Under ASC 815-10-65, Variable Interest Entities., a VIE is an entity that: (1) has an insufficient amount of equity investment at risk to permit the entity to finance its activities without additional subordinated financial support by other parties; (2) the equity investors are unable to make significant decisions about the entity’s activities through voting rights or similar rights; or (3) the equity investors do not have the obligation to absorb expected losses or the right to receive residual returns of the entity. The Company is required to consolidate a VIE if it is determined to be the primary beneficiary, that is, the enterprise that has both (1) the power to direct the activities of a VIE that most significantly impact the entity’s economic performance and (2) the obligation to absorb losses of the entity that could potentially be significant to the VIE. The Company evaluates its relationships with VIEs to determine whether it is the primary beneficiary of a VIE at the time it becomes involved with the entity and it re-evaluates that conclusion each reporting period.
F-59
Table of Contents
Elevate Credit, Inc. and Subsidiaries
NOTES TO CONDENSED CONSOLIDATED FINANCIAL STATEMENTS
(UNAUDITED) — (Continued)
For the three months ended March 31, 2016 and 2015
Elastic SPV, Ltd.
On July 1, 2015, the Company entered into several agreements with a third-party lender and Elastic SPV, Ltd. (“ESPV”), a new entity formed by third party investors for the purpose of purchasing loan participations from the third-party lender. On that date, approximately $20.2 million of loan participations in the Elastic lines of credit outstanding held by the Company were transferred to ESPV for no gain or loss. Per the terms of the agreements, the Company provides customer acquisition services to drive the volume of loan applications submitted to the third-party lender. In addition, the Company provides loan underwriting software and services to evaluate the credit quality of those loan applications in accordance with the third-party lender’s credit policies. ESPV accounts for the loan participations acquired in accordance with ASC 860-10-40, Transfers and Services, Derecognition, as the lines of credit acquired meet the criteria of a participation interest.
Once the third-party lender originates the loan, ESPV has the right, but not the obligation, to purchase a 90% interest in each Elastic line of credit. Victory Park Capital Advisors, LLC (“VPC”) entered into an agreement (the “ESPV Facility”) under which it shall loan ESPV all funds necessary (with an initial maximum borrowing amount of $50 million) to purchase such participation interests in exchange for a fixed return. On October 21, 2015, the ESPV Facility was amended, providing a maximum borrowing amount of $100 million. The fixed return is comprised of a base rate (defined as the greater of the 3-month LIBOR rate or 1% per annum) plus 13% for the outstanding balance up to $50 million and a base rate plus 12% for the outstanding balance greater than $50 million. The Company entered into a separate credit default protection agreement with ESPV whereby the Company agreed to provide credit protection to the investors in ESPV against Elastic loan losses in return for a credit premium. The Company does not hold a direct ownership interest in ESPV, however, as a result of the credit default protection agreement, ESPV was determined to be a VIE and the Company qualifies as the primary beneficiary.
The following table summarizes the assets and liabilities of the VIE that are included within the Company’s Condensed Consolidated Balance Sheets at March 31, 2016 and December 31, 2015:
| (Dollars in thousands) | March 31, 2016 |
December 31, 2015 |
||||||
| ASSETS |
||||||||
| Cash and cash equivalents |
$ | 10,467 | $ | 3,015 | ||||
| Loans receivable, net of allowance for loan losses of $9,061 and $10,016, respectively |
69,571 | 66,015 | ||||||
| Prepaid expenses and other assets |
10,000 | 9,288 | ||||||
| Receivable from payment processors |
1,822 | 1,701 | ||||||
|
|
|
|
|
|||||
| Total assets |
$ | 91,860 | $ | 80,019 | ||||
|
|
|
|
|
|||||
| LIABILITIES AND MEMBERS’ EQUITY |
||||||||
| Accounts payable and accrued liabilities ($2,769 and $639, respectively, eliminates upon consolidation) |
$ | 6,082 | $ | 3,567 | ||||
| Reserve deposit liability ($12,625 and $11,325, respectively, eliminates upon consolidation) |
12,625 | 11,325 | ||||||
| Notes payable, net |
73,153 | 65,127 | ||||||
| Members’ equity |
— | — | ||||||
|
|
|
|
|
|||||
| Total liabilities and members’ equity |
$ | 91,860 | $ | 80,019 | ||||
|
|
|
|
|
|||||
F-60
Table of Contents
Elevate Credit, Inc. and Subsidiaries
NOTES TO CONDENSED CONSOLIDATED FINANCIAL STATEMENTS
(UNAUDITED) — (Continued)
For the three months ended March 31, 2016 and 2015
CSO Lenders
The CSO lenders are considered VIE’s of the Company; however, the Company does not have any ownership interest in the CSO lenders, does not exercise control over them, and is not the primary beneficiary, and therefore, does not consolidate the CSO lenders’ results with its results.
NOTE 5—ACCOUNTS PAYABLE AND ACCRUED LIABILITIES
Accounts payable and accrued liabilities at March 31, 2016 and December 31, 2015 consist of the following:
| (Dollars in thousands) | March 31, 2016 |
December 31, 2015 |
||||||
| Accounts payable |
$ | 8,717 | $ | 13,037 | ||||
| Accounts payable to related party (see Note 12) |
24 | 304 | ||||||
| Accrued compensation |
7,304 | 9,454 | ||||||
| Liability for losses on CSO lender-owned consumer loans |
4,296 | 6,013 | ||||||
| Deferred revenues |
5,609 | 1,729 | ||||||
| Interest payable |
4,687 | 4,357 | ||||||
| Capital lease liability |
203 | 262 | ||||||
| Other accrued liabilities |
1,409 | 1,102 | ||||||
|
|
|
|
|
|||||
| Total |
$ | 32,249 | $ | 36,258 | ||||
|
|
|
|
|
|||||
NOTE 6—NOTES PAYABLE
On January 30, 2014, Rise SPV, LLC (“RSPV,” a subsidiary of the Company) entered into an agreement with VPC providing a credit facility with a maximum borrowing amount of $250 million (the “VPC Facility”). On May 20, 2015, the VPC Facility was amended, providing a credit facility with a maximum total borrowing amount of $335 million to RSPV, ECI and Elevate Credit Services, LLC (“ELCS”), all subsidiaries of the Company. On February 11, 2016, the VPC Facility was amended, providing a credit facility with a maximum total borrowing amount of $345 million to RSPV, ECI and ELCS. This facility provides the following term notes at March 31, 2016:
| Ø | A maximum borrowing amount of $250 million at a base rate (defined as the 3-month LIBOR rate) plus 15% for the outstanding balance up to $75 million, 14% for the outstanding balance greater than $75 million and up to $150 million, and 13% for the outstanding balance greater than $150 million used to fund the Rise loan portfolio (“US Term Note”). The interest rate at March 31, 2016 and December 31, 2015 was 15.03% and 14.82%, respectively. |
| Ø | A maximum borrowing amount of $50 million at a base rate (defined as the 3-month LIBOR rate) plus 16% used to fund the UK Sunny loan portfolio (“UK Term Note”). The interest rate at March 31, 2016 and December 31, 2015 was 16.63% and 16.42%, respectively. |
| Ø | A maximum borrowing amount of $45 million at a base rate (defined as the 3-month LIBOR rate) plus 18% used to fund working capital (“ELCS Sub-debt Term Note”). The interest rate at March 31, 2016 and December 31, 2015 was 18.63% and 18.42%, respectively. |
F-61
Table of Contents
Elevate Credit, Inc. and Subsidiaries
NOTES TO CONDENSED CONSOLIDATED FINANCIAL STATEMENTS
(UNAUDITED) — (Continued)
For the three months ended March 31, 2016 and 2015
On July 13, 2015, ESPV, entered into an agreement with VPC, providing a credit facility with a maximum borrowing amount of $50 million (the “ESPV Facility”). On October 21, 2015, the ESPV Facility was amended, providing a credit facility with a maximum borrowing amount of $100 million. Interest is charged at a base rate (defined as the greater of the 3-month LIBOR rate or 1% per annum) plus 13% for the outstanding balance up to $50 million and plus 12% for the outstanding balance greater than $50 million. The ESPV Facility is used to purchase loan participations from a third-party lender. The interest rate at March 31, 2016 and December 31, 2015 was 13.71% and 13.79%, respectively.
The outstanding balance of Notes payable, net of debt issuance costs, are as follows:
| (Dollars in thousands) | March 31, 2016 |
December 31, 2015 |
||||||
| US Term Note bearing interest at 3-month LIBOR + 13-15% |
$ | 197,000 | $ | 197,000 | ||||
| UK Term Note bearing interest at 3-month LIBOR + 16% |
42,300 | 42,300 | ||||||
| ELCS Sub-debt Term Note bearing interest at 3-month LIBOR + 18% |
45,000 | 35,000 | ||||||
| ESPV Term Note bearing interest at 1% per annum + 12-13% |
73,500 | 65,500 | ||||||
| Deferred debt issuance costs |
(652 | ) | (723 | ) | ||||
|
|
|
|
|
|||||
| Total |
$ | 357,148 | $ | 339,077 | ||||
|
|
|
|
|
|||||
There are no principal payments due or scheduled until the credit facility maturity dates of January 30, 2018 (VPC Facility) and July 1, 2019 (ESPV Facility). All assets of ESPV are pledged as collateral to secure the ESPV Facility. All assets of the Company are pledged as collateral to secure both the VPC and ESPV Facilities. The agreements contain financial covenants, including a borrowing base calculation and certain financial ratios. The Company was in compliance with all covenants related to the VPC Facility as of March 31, 2016 and December 31, 2015 . ESPV was in compliance with all covenants related to the ESPV Facility as of March 31, 2016 and December 31, 2015.
Future debt maturities as of March 31, 2016 are as follows:
| Year (dollars in thousands) | Amount | |||
| Remainder of 2016 |
$ | — | ||
| 2017 |
— | |||
| 2018 |
284,300 | |||
| 2019 |
73,500 | |||
| 2020 |
— | |||
|
|
|
|||
| Total |
$ | 357,800 | ||
|
|
|
|||
NOTE 7—STOCK OPTIONS
The Company adopted a stock option plan (the “Stock Option Plan”) on May 1, 2014. The Stock Option Plan permits the grant of incentive stock options, nonstatutory stock options, and restricted stock. Nonstatutory stock options and restricted stock may be granted to service providers (i.e.: employees, directors or consultants) and incentive stock options may be granted only to employees.
F-62
Table of Contents
Elevate Credit, Inc. and Subsidiaries
NOTES TO CONDENSED CONSOLIDATED FINANCIAL STATEMENTS
(UNAUDITED) — (Continued)
For the three months ended March 31, 2016 and 2015
During the three months ended March 31, 2016, the Company granted 46,500 incentive stock options with a weighted average exercise price of $20.80 per share and a weighted average fair value of $6.87 per share. These options have a contractual term of 10 years and vest 25% on the first anniversary of the effective date and 2.083% each month, thereafter until full vesting on the fourth anniversary of the effective date.
Stock-based compensation expense recognized in the three months ended March 31, 2016 and 2015 totaled approximately $0.2 million and $0.3 million, respectively.
The following is a summary of activity in the Company’s Stock Option Plan for the three months ended March 31, 2016:
| Shares | Weighted Average Exercise Price |
Weighted Average Term (in years) |
||||||||||
| Outstanding at December 31, 2015 |
1,579,890 | $ | 9.53 | |||||||||
| Granted |
46,500 | 20.80 | ||||||||||
| Exercised |
(1,041 | ) | 13.26 | |||||||||
| Forfeited |
(26,438 | ) | 15.62 | |||||||||
|
|
|
|
|
|||||||||
| Outstanding at March 31, 2016 |
1,598,911 | $ | 9.75 | 6.06 | ||||||||
|
|
|
|
|
|
|
|||||||
| Options exercisable at March 31, 2016 |
1,083,566 | 4.61 | ||||||||||
|
|
|
|
|
|||||||||
| Available for grant at March 31, 2016 |
106,778 | |||||||||||
|
|
|
|||||||||||
NOTE 8—FAIR VALUE MEASUREMENTS
The accounting guidance on fair value measurements establishes a fair value hierarchy that prioritizes the inputs to valuation techniques used to measure fair value. The hierarchy gives the highest priority to unadjusted quoted prices in active markets for identical assets or liabilities (Level 1 measurements) and the lowest priority to measurements involving significant unobservable inputs (Level 3 measurements).
We group our assets and liabilities measured at fair value in three levels of the fair value hierarchy, based on the fair value measurement technique, as described below:
Level 1—Valuation is based upon quoted prices (unadjusted) for identical assets and liabilities in active exchange markets that the Company has the ability to access at the measurement date.
Level 2—Valuation is based upon quoted prices for similar instruments in active markets, quoted prices for identical or similar instruments in markets that are not active, and model-based valuation techniques with significant assumptions and inputs that are observable in the market or can be derived principally from or corroborated by observable market data.
Level 3—Valuation is derived from model-based techniques that use inputs and significant assumptions that are supported by little or no observable market data. These unobservable assumptions reflect estimates of assumptions that market participants would use in pricing the asset or liability. Valuation techniques include the use of pricing models, discounted cash flow models and similar techniques.
F-63
Table of Contents
Elevate Credit, Inc. and Subsidiaries
NOTES TO CONDENSED CONSOLIDATED FINANCIAL STATEMENTS
(UNAUDITED) — (Continued)
For the three months ended March 31, 2016 and 2015
The level of fair value hierarchy within which a fair value measurement in its entirety falls is based on the lowest-level input that is most significant to the fair value measurement in its entirety. In the determination of the classification of assets and liabilities in Level 2 or Level 3 of the fair value hierarchy, we consider all available information, including observable market data, indications of market conditions, and our understanding of the valuation techniques and significant inputs used. Based upon the specific facts and circumstances, judgments are made regarding the significance of the Level 3 inputs to the fair value measurements of the respective assets and liabilities in their entirety. If the valuation techniques that are most significant to the fair value measurements are principally derived from assumptions and inputs that are corroborated by little or no observable market data, the asset or liability is classified as Level 3.
The Company classifies its fair value measurement techniques for the fair value disclosures associated with Loans receivable, net of allowance for loan losses, Receivable from CSO lenders, Receivable from payment processors, Accounts payable and accrued liabilities, Contingent consideration payable and Notes payable as Level 3 in accordance with ASC 820-10, Fair Value Measurements and Disclosures (“ASC 820-10”).
The Company has recorded a long-term liability related to agreements to pay additional consideration to a related party for the acquisitions associated with the Elastic product, based on earnings performance from 2015 through 2027. A liability of approximately $5.5 million was recorded at fair value and was included within Contingent consideration payable on the Consolidated Balance Sheets at March 31, 2015. In June 2015, the Company entered into a consulting agreement with the seller, which requires the Company to pay a total of $1.5 million over the next five years. The agreement effectively extinguished the additional consideration liability, and in accordance with ASC 450-10. This liability is considered to be Level 3 in accordance with ASC 820-10. This liability was evaluated pursuant to FASB guidance under the income approach using a weighted average cost of capital of 21%.
The table below summarizes the changes in the contingent consideration liability for the three months ended March 31, 2016 and 2015:
| (Dollars in thousands) | March 31, 2016 |
March 31, 2015 |
||||||
| Beginning Balance |
$ | — | $ | 5,529 | ||||
| Fair value adjustments |
— | — | ||||||
| Extinguishment of earn-out liability |
— | — | ||||||
| Earn–out payments |
— | — | ||||||
|
|
|
|
|
|||||
| Balance at March 31 |
$ | — | $ | 5,529 | ||||
|
|
|
|
|
|||||
F-64
Table of Contents
Elevate Credit, Inc. and Subsidiaries
NOTES TO CONDENSED CONSOLIDATED FINANCIAL STATEMENTS
(UNAUDITED) — (Continued)
For the three months ended March 31, 2016 and 2015
NOTE 9—INCOME TAXES
Income tax expense for the three months ended March 31, 2016 and 2015 consists of the following:
| (Dollars in thousands) | 2016 | 2015 | ||||||
| Federal |
||||||||
| Current |
$ | 129 | $ | (2,685 | ) | |||
| Deferred |
5,169 | 5,158 | ||||||
| State |
||||||||
| Current |
125 | (930 | ) | |||||
| Deferred |
443 | 966 | ||||||
| Foreign |
||||||||
| Current |
— | — | ||||||
| Deferred |
— | — | ||||||
|
|
|
|
|
|||||
| Total |
$ | 5,866 | $ | 2,509 | ||||
|
|
|
|
|
|||||
The Company’s income tax expense was $5.9 million and $2.5 million for the three months ended March 31, 2016 and 2015, respectively. The Company’s US effective tax rates for the three months ended March 31, 2016 and 2015 were 45% and 37%, respectively. The company’s US effective tax rates are different from the standard corporate federal income tax rate of 35% primarily due to its corporate state tax obligations in the states where it has lending activities and its permanent non-deductible items. The Company’s UK operations have generated net operating losses which have a full valuation allowance provided due to the lack of sufficient objective evidence regarding the realizability of the asset. Therefore, no UK tax benefit has been recognized in the financial statements for the three months ended March 31, 2016 and 2015.
For purposes of evaluating the need for a deferred tax valuation allowance, significant weight is given to evidence that can be objectively verified. The following provides an overview of the assessment that was performed for both the domestic and foreign deferred tax assets, net.
US deferred tax assets, net
The Company is required to assess its US deferred tax assets (“DTA”) and the need for a valuation allowance on a combined group return basis, and to exclude from that assessment the utilization of all or a portion of those US taxable losses by Think Finance, which are attributable to the Company, under the separate return method. This assessment requires considerable judgment on the part of management with respect to benefits that could be realized from future US taxable income, as well as other positive and negative factors. To the extent that Think Finance has utilized a portion of the Company’s operating losses in their consolidated returns, the Company has not been reimbursed for the utilization of those US losses prior to the Spin-Off. At the Spin-Off, a deferred tax asset of approximately $10.9 million related to the net operating loss (“NOL”) generated prior to the Spin-Off date was written off and reflected initially within Net transfers from Think Finance which was ultimately transferred to Additional paid-in capital as a result of the Spin-Off.
F-65
Table of Contents
Elevate Credit, Inc. and Subsidiaries
NOTES TO CONDENSED CONSOLIDATED FINANCIAL STATEMENTS
(UNAUDITED) — (Continued)
For the three months ended March 31, 2016 and 2015
At March 31, 2016 and December 31, 2015, the Company did not establish a valuation allowance for the US DTA based on management’s expectation of generating sufficient taxable income in a look forward period over the next three to five years. The net operating loss carryforward from US operations at March 31, 2016 and December 31, 2015 was approximately $22.7 million. The NOL carryforward expires beginning in 2034. The ultimate realization of the resulting deferred tax asset is dependent upon generating sufficient taxable income prior to the expiration of this carryforward. The Company considered the following positive and negative factors when making their assessment regarding the ultimate realizability of the deferred tax assets.
| Ø | Significant positive factors include an improving earnings trend as the Company has continued to scale the business to match its cost structure. In addition, for the three-months ended March 31, 2016, the Company generated US taxable income and expects to begin utilizing its NOL in 2016, including the effects of the ESPV structure change (see discussion below). Management’s success in developing accurate forecasts (proven through their time at Think Finance) and management’s track record of launching new and successful products at Think Finance, which generated significant taxable income, is another source of positive evidence which was evaluated. The Company believes that the unique circumstance of the Spin-Off from a successful company provides several positive objectively verifiable factors that would not normally be available to a new company with a limited operating history. |
| Ø | A significant negative factor includes cumulative losses and a lack of taxable income since the Spin-Off date through December 31, 2015. A net taxable loss was incurred for the years ended December 31, 2015 and 2014 (including carve-out amounts for the four months ended April 30, 2014) due to the assumption and establishment of an infrastructure for the Company separate from Think Finance while the Company was scaling the growth of the relatively new products of Rise and Elastic. In addition, direct marketing costs were a significant contributor to the net taxable loss as these costs were incurred as the loan portfolio and number of new customer loans grew significantly in 2015 and 2014. At December 31, 2014, the Company originally forecasted positive taxable income for the year ended December 31, 2015. The restructure of the Elastic product and purchase of participating interest by the ESPV entity during mid-2015 (described in Note 4—Variable Interest Entity) resulted in a change in the composition of taxable income for the remainder of the year and resulted in a net taxable loss incurred in 2015. |
The Company has given due consideration to all the factors and believes the positive evidence outweighs the negative evidence and has concluded that the US deferred tax asset is expected to be realized based on management’s expectation of generating sufficient taxable income over the next three to five years. Although realization is not assured, management believes it is more likely than not that all of the recorded deferred tax assets will be realized. The amount of the deferred tax assets considered realizable, however, could be adjusted in the future if estimates of future taxable income change. As a result, at March 31, 2016 and December 31, 2015, the Company did not establish a valuation allowance for the US DTA.
The Company also had a US stock option deduction carryforward of approximately $8.5 million at March 31, 2016 and December 31, 2015, for which the tax benefit would be applied as a credit directly to additional paid-in capital. The stock option deduction carryforward expires in 2034.
F-66
Table of Contents
Elevate Credit, Inc. and Subsidiaries
NOTES TO CONDENSED CONSOLIDATED FINANCIAL STATEMENTS
(UNAUDITED) — (Continued)
For the three months ended March 31, 2016 and 2015
UK deferred tax assets, net
At March 31, 2016 and December 31, 2015, the Company recognized a full valuation allowance for its foreign deferred tax assets due to the lack of sufficient objective evidence regarding the realization of these assets in the foreseeable future. The Company assesses the UK deferred tax assets on an annual basis, and, as a result, there have been no changes as of March 31, 2016. Regardless of the deferred tax valuation allowance recognized at March 31, 2016 and December 31, 2015, the Company continues to retain net operating loss carryforwards for foreign income tax purposes of approximately $39.4 million, available to offset future foreign taxable income. To the extent that the Company generates taxable income in the future to utilize the tax benefits of the related deferred tax assets, subject to certain potential limitations, it may be able to reduce its effective tax rate by reducing the valuation allowance. The Company’s foreign net operating loss carryforward of approximately $39.4 million at March 31, 2016 and December 31, 2015 can be carried forward indefinitely.
NOTE 10—COMMITMENTS, CONTINGENCIES AND GUARANTEES
Contingencies
Currently and from time to time, the Company may become a defendant in various legal and regulatory actions. While the Company cannot determine the ultimate outcome of these actions, it believes their resolution will not have a material adverse effect on the Company’s financial condition, results of operations or liquidity.
The Company is cooperating with the Consumer Financial Protection Bureau (“CFPB”) related to a civil investigative demand (“CID”) received by Think Finance requesting information about the operations of Think Finance prior to the Spin-Off. The CFPB has not made any specific allegation of violation(s) of law or initiated litigation in connection with the CID as of this date.
Commitments
The Elastic product, which offers lines of credit to consumers, had approximately $51.5 million and $31.0 million in available and unfunded credit lines at March 31, 2016 and December 31, 2015, respectively. While these amounts represented the total available unused credit lines, ESPV has not experienced and does not anticipate that all line of credit customers will access their entire available credit lines at any given point in time. ESPV has not recorded a loan loss reserve for unfunded credit lines as ESPV has the ability to cancel commitments with a relatively short timeframe.
Guarantees
In connection with its CSO programs, the Company guarantees consumer loan payment obligations to CSO lenders and is required to purchase any defaulted loans it has guaranteed. The guarantee represents an obligation to purchase specific loans that go into default. See Note 1—Summary of Significant Accounting Policies—Credit Service Organization for more information related to this guarantee obligation.
F-67
Table of Contents
Elevate Credit, Inc. and Subsidiaries
NOTES TO CONDENSED CONSOLIDATED FINANCIAL STATEMENTS
(UNAUDITED) — (Continued)
For the three months ended March 31, 2016 and 2015
NOTE 11—OPERATING SEGMENT INFORMATION
The Company determines operating segments based on how our chief operating decision maker manages the business, including making operating decisions, deciding how to allocate resources and evaluating operating performance. Our chief operating decision-maker is our Chief Executive Officer, who reviews our operating results on a consolidated basis.
The Company has one reportable segment, which provides online credit products for subprime consumers, which is composed of the Company’s operations in the United States and the United Kingdom. The Company has aggregated all components of its business into a single reportable segment based on the similarities in the products, the distribution methods, the type of customers, and the nature of the regulatory environments.
The following tables summarize the allocation of net revenues and long-lived assets based on geography.
| For the three months ended March 31, |
||||||||
| (Dollars in thousands) | 2016 | 2015 | ||||||
| Revenues |
||||||||
| United States |
$ | 107,272 | $ | 73,666 | ||||
| United Kingdom |
23,450 | 15,840 | ||||||
|
|
|
|
|
|||||
| Total |
$ | 130,722 | $ | 89,506 | ||||
|
|
|
|
|
|||||
| March 31, 2016 |
December 31, 2015 |
|||||||
| Long-lived assets |
||||||||
| United States |
$ | 23,578 | $ | 24,391 | ||||
| United Kingdom |
11,721 | 11,890 | ||||||
|
|
|
|
|
|||||
| Total |
$ | 35,299 | $ | 36,281 | ||||
|
|
|
|
|
|||||
NOTE 12—RELATED PARTIES
The Company has entered into sublease agreements with Think Finance for office space and equipment that expire beginning in 2016 through 2019. Total rent and utility payments made to Think Finance for office space were approximately $0.5 million and $0.4 million for the three months ended March 31, 2016 and 2015, respectively. Rent and utility expense is included in Occupancy and equipment within the Condensed Consolidated Statements of Income. Total payments for equipment were approximately $63 thousand for both of the three month periods ended March 31, 2016 and 2015, and were included as a reduction of the capital lease liability included in Accounts payable and accrued liabilities within the Condensed Consolidated Balance Sheets and as interest expense included in Net interest expense within the Condensed Consolidated Statements of Income. Payments related to other expense reimbursements for the three months ended March 31, 2016 were not material.
At March 31, 2016 and December 31, 2015, the Company had approximately $24 thousand and $304 thousand, respectively, of Accounts payable due to Think Finance related to reimbursable costs, which is included in the Accounts payable and accrued liabilities within the Condensed Consolidated Balance Sheets.
F-68
Table of Contents
Elevate Credit, Inc. and Subsidiaries
NOTES TO CONDENSED CONSOLIDATED FINANCIAL STATEMENTS
(UNAUDITED) — (Continued)
For the three months ended March 31, 2016 and 2015
During the three month periods ended March 31, 2016 and 2015, the Company incurred board of director fees and travel expense reimbursements associated with certain board members of $94 thousand and $49 thousand, respectively. Stock compensation expense of $8 thousand and $9 thousand was incurred for certain board members for the three month periods ended March 31, 2016 and 2015. These expenses are included in Professional services and Other operating expenses within the Condensed Consolidated Statements of Income.
NOTE 13—STOCK SPLIT
On December 11, 2015, the Board of Directors approved the ratio that will be included in an amended and restated certificate of incorporation to effect a 2.5-for-1 forward stock split of its common stock to be effective in connection with the completion of the Company’s initial public offering. The stock split will cause an adjustment to the par value for the common stock, from $0.001 per share to $0.0004 per share, and reflects a two and a half times increase in the number of authorized and outstanding shares of common stock. As a result of the stock split, the share amounts under its employee incentive plan will also be adjusted. The conversion of shares of preferred stock will occur on a one-to-one basis without additional consideration into an aggregate of 5,639,410 shares of common stock immediately prior to the 2.5-for-1 forward stock split of our common stock. The 2.5-for-1 forward stock split will thereafter be applied to the resulting total amount of common stock. Unless otherwise noted, the Company has accordingly presented unaudited pro forma basic and diluted net income per share for the three months ended March 31, 2016 and 2015.
Unaudited pro forma basic and diluted net income per share are computed by dividing net income by the basic and diluted pro forma weighted average number of common shares outstanding, after giving retroactive effect to the transactions described above for the periods presented below.
The impact of the 2.5-for-1 forward stock split on the weighted average number of common shares on a historical and pro forma basis and the earnings per share on a pro forma basis for the three months ended March 31, 2016 and 2015 are as follows:
| For the three months ended March 31, |
||||||||
| (Dollars in thousands, except share and per share amounts) | 2016 | 2015 | ||||||
| Net income |
$ | 5,792 | $ | 898 | ||||
|
|
|
|
|
|||||
| Historical basic weighted average number of shares outstanding |
5,118,983 | 4,892,431 | ||||||
| Impact of 2.5-for-1 forward stock split |
7,678,475 | 7,338,647 | ||||||
|
|
|
|
|
|||||
| Pro forma basic weighted average number of shares outstanding |
12,797,458 | 12,231,078 | ||||||
|
|
|
|
|
|||||
| Historical diluted weighted average number of shares outstanding |
11,359,870 | 10,986,502 | ||||||
| Impact of 2.5-for-1 forward stock split |
17,039,805 | 16,479,753 | ||||||
|
|
|
|
|
|||||
| Pro forma diluted weighted average number of shares outstanding |
28,399,675 | 27,466,255 | ||||||
|
|
|
|
|
|||||
| Pro forma basic earnings per share: |
$ | 0.45 | $ | 0.07 | ||||
| Pro forma diluted earnings per share: |
$ | 0.20 | $ | 0.03 | ||||
F-69
Table of Contents
Elevate Credit, Inc. and Subsidiaries
NOTES TO CONDENSED CONSOLIDATED FINANCIAL STATEMENTS
(UNAUDITED) — (Continued)
For the three months ended March 31, 2016 and 2015
NOTE 14—SUBSEQUENT EVENTS
The Company evaluated subsequent events through June 3, 2016, the date these financial statements were issued. There were no material subsequent events that required recognition or additional disclosure in these financial statements.
F-70
Table of Contents

Everyone deserves a lift.
E/evate
Table of Contents

Better borrowing leads to brighter futures. E/evate
Table of Contents
Part II
INFORMATION NOT REQUIRED IN THE PROSPECTUS
Item 13. Other expenses of issuance and distribution.
Estimated expenses, other than underwriting discounts and commissions, payable by the Registrant in connection with the sale of the common stock being registered under this registration statement are as follows:
| SEC registration fee |
$ | 10,070 | ||
| NYSE listing fee |
25,000 | |||
| Printing and engraving expenses |
660,000 | |||
| Legal fees and expenses |
3,100,000 | |||
| Accounting fees and expenses |
675,000 | |||
| Transfer agent and registrar fees and expenses |
2,500 | |||
| Miscellaneous |
327,430 | |||
|
|
|
|||
| Total |
$ | 4,800,000 | ||
|
|
|
Item 14. Indemnification of directors and officers.
On completion of this offering, the Registrant’s amended and restated certificate of incorporation will contain provisions that eliminate, to the maximum extent permitted by the General Corporation Law of the State of Delaware, the personal liability of the Registrant’s directors and executive officers for monetary damages for breach of their fiduciary duties as directors or officers. The Registrant’s amended and restated certificate of incorporation and bylaws will provide that the Registrant must indemnify its directors and executive officers and may indemnify its employees and other agents to the fullest extent permitted by the General Corporation Law of the State of Delaware.
Sections 145 and 102(b)(7) of the General Corporation Law of the State of Delaware provide that a corporation may indemnify any person made a party to an action by reason of the fact that he or she was a director, executive officer, employee or agent of the corporation or is or was serving at the request of a corporation against expenses (including attorneys’ fees), judgments, fines and amounts paid in settlement actually and reasonably incurred by him or her in connection with such action if he or she acted in good faith and in a manner he or she reasonably believed to be in, or not opposed to, the best interests of the corporation and, with respect to any criminal action or proceeding, had no reasonable cause to believe his or her conduct was unlawful, except that, in the case of an action by or in right of the corporation, no indemnification may generally be made in respect of any claim as to which such person is adjudged to be liable to the corporation.
The Registrant has entered into indemnification agreements with its directors and executive officers, in addition to the indemnification provided for in its amended and restated certificate of incorporation and bylaws, and intends to enter into indemnification agreements with any new directors and executive officers in the future.
The Registrant has purchased and intends to maintain insurance on behalf of each and any person who is or was a director or officer of the Registrant against any loss arising from any claim asserted against him or her and incurred by him or her in any such capacity, subject to certain exclusions.
II-1
Table of Contents
The underwriting agreement (Exhibit 1.1 hereto) provides for indemnification by the underwriters of the Registrant and its executive officers and directors, and by the Registrant of the underwriters, for certain liabilities, including liabilities arising under the Securities Act.
See also the undertakings set out in response to Item 17 herein.
Item 15. Recent sales of unregistered securities.
During the three year period preceding March 31, 2016, we sold the following unregistered securities:
Spin-Off Issuances
In May 2014, in connection with the Spin-Off from TFI and our formation and initial capitalization, we issued to TFI one share of our common stock (not taking into account the stock split) for par value.
In May 2014, further pursuant to the Spin-Off, we issued to TFI 4,643,133 shares (prior to the 2.5-for-1 forward stock split) of our common stock, 2,957,059 shares (prior to the 2.5-for-1 forward stock split) of our Series A preferred stock and 2,682,351 shares (prior to the 2.5-for-1 forward stock split) of our Series B preferred stock in exchange for the one share of our common stock then held by TFI, which share was cancelled upon completion of the Spin-Off. These shares of common and preferred stock were then distributed by TFI pro-rata to the stockholders of TFI, comprising employees, officers and directors of TFI and certain accredited investors.
2014 Equity Incentive Plan Issuances
Subsequent to the Spin-Off, we granted to our directors, officers and employees options to purchase 1,475,872 shares of common stock under our 2014 Equity Incentive Plan at per share exercise prices ranging from $5.15 to $8.32.
Options for 1,667,028 shares of our common stock have been exercised by option holders under our 2014 Equity Incentive Plan at per share exercise prices ranging from $1.37 to $5.30, for aggregate consideration of $2,657,260, a portion of which consideration was comprised of vested exercised shares, resulting in a net issuance of 975,176 shares of our common stock.
Issuance Related to Option Granted Outside of 2014 Equity Incentive Plan
In May 2014, we granted to Kenneth E. Rees, outside of any equity plan and pursuant to an employment agreement by and between Mr. Rees and the Registrant, an option to purchase 510,000 shares of our common stock at a per share exercise price of $1.34. In October 2014, Mr. Rees exercised his option to purchase 510,000 shares of our common stock for aggregate consideration of $683,400, a portion of which consideration was comprised of 290,945 vested exercised shares, resulting in a net issuance of 219,055 shares of our common stock.
Each of the foregoing issuances by Elevate was made in a transaction not involving a public offering pursuant to an exemption from the registration requirements of the Securities Act in reliance upon Section 4(a)(2) of the Securities Act, or Regulation D or Rule 701 promulgated under the Securities Act.
II-2
Table of Contents
Item 16. Exhibits and financial statement schedules.
(a) Exhibits:
We have filed the exhibits listed on the accompanying Exhibit Index of this registration statement, which Exhibit Index is incorporated herein by reference.
(b) Financial Statement Schedules.
All other schedules have been omitted because the information required to be presented in them is not applicable or is shown in the combined and consolidated financial statements or related notes.
Item 17. Undertakings.
The Registrant hereby undertakes to provide to the underwriters at the closing as specified in the underwriting agreement certificates in such denominations and registered in such names as required by the underwriters to permit prompt delivery to each purchaser.
Insofar as indemnification for liabilities arising under the Securities Act of 1933, as amended, may be permitted to directors, officers and controlling persons of the Registrant pursuant to the foregoing provisions, or otherwise, the Registrant has been advised that in the opinion of the Securities and Exchange Commission such indemnification is against public policy as expressed in the Securities Act of 1933, as amended, and is, therefore, unenforceable. In the event that a claim for indemnification against such liabilities (other than the payment by the Registrant of expenses incurred or paid by a director, officer or controlling person of the Registrant in the successful defense of any action, suit or proceeding) is asserted by such director, officer or controlling person in connection with the securities being registered, the Registrant will, unless in the opinion of its counsel the matter has been settled by controlling precedent, submit to a court of appropriate jurisdiction the question whether such indemnification by it is against public policy as expressed in the Securities Act of 1933, as amended, and will be governed by the final adjudication of such issue.
The Registrant hereby undertakes that:
(1) For purposes of determining any liability under the Securities Act of 1933, as amended, the information omitted from a form of prospectus filed as part of this registration statement in reliance upon Rule 430A and contained in the form of prospectus filed by the Registrant pursuant to Rule 424(b)(1) or (4) or 497(h) under the Securities Act of 1933, as amended, shall be deemed to be part of this registration statement as of the time it was declared effective.
(2) For the purpose of determining any liability under the Securities Act of 1933, as amended, each post-effective amendment that contains a form of prospectus shall be deemed to be a new registration statement relating to the securities offered therein, and the offering of such securities at that time shall be deemed to be the initial bona fide offering thereof.
II-3
Table of Contents
Signatures
Pursuant to the requirements of the Securities Act of 1933, the registrant has duly caused this registration statement to be signed on its behalf by the undersigned, thereunto duly authorized, in the City of Fort Worth, State of Texas, on June 3, 2016.
| ELEVATE CREDIT, INC. | ||
| By: | /s/ Kenneth E. Rees | |
| Kenneth E. Rees | ||
| Chief Executive Officer and Chairman | ||
Pursuant to the requirements of the Securities Act of 1933, this registration statement has been signed by the following persons in the capacities indicated below:
| Signature | Title | Date | ||
| /s/ Kenneth E. Rees Kenneth E. Rees |
Chief Executive Officer and Chairman (Principal Executive Officer) | June 3, 2016 | ||
| /s/ Christopher Lutes Christopher Lutes |
Chief Financial Officer (Principal Financial Officer) |
June 3, 2016 | ||
| /s/ Nelda Bruce Nelda Bruce |
Chief Accounting Officer (Principal Accounting Officer) |
June 3, 2016 | ||
| * Jason Harvison |
Chief Operating Officer and Director | June 3, 2016 | ||
| * John C. Dean |
Director | June 3, 2016 | ||
| * Stephen B. Galasso |
Director | June 3, 2016 | ||
| * Tyler Head |
Director | June 3, 2016 | ||
| * John C. Rosenberg |
Director | June 3, 2016 | ||
| * Robert L. Johnson |
Director | June 3, 2016 | ||
| * Stephen J. Shaper |
Director | June 3, 2016 | ||
| *By: | /s/ Kenneth E. Rees | |
| Kenneth E. Rees | ||
| As Attorney-in-fact |
II-4
Table of Contents
POWER OF ATTORNEY
KNOW ALL PERSONS BY THESE PRESENT, that Saundra Schrock, whose signature appears below, constitutes and appoints Kenneth E. Rees, Christopher Lutes and Sarah Fagin Cutrona, jointly and severally, as his or her true and lawful attorneys-in-fact and agents, with full power of substitution and resubstitution, for him or her and in his or her name, place and stead, in any and all capacities, to sign the registration statement on Form S-1 of Elevate Credit, Inc. and any or all amendments (including post-effective amendments) thereto and any new registration statement with respect to the offering contemplated thereby filed pursuant to Rule 462(b) of the Securities Act, and to file the same, with all exhibits thereto, and other documents in connection therewith, with the Securities and Exchange Commission, granting unto said attorneys-in-fact and agents full power and authority to do and perform each and every act and thing requisite or necessary to be done in and about the premises hereby ratifying and confirming all that said attorneys-in-fact and agents, or his, or their substitute or substitutes, may lawfully do or cause to be done by virtue hereof.
| Signature | Title | Date | ||
| /s/ Saundra Schrock Saundra Schrock |
Director | June 3, 2016 | ||
II-5
Table of Contents
Exhibit index
| Exhibit number |
Description | |
| 1.1# | Form of Underwriting Agreement. | |
| 3.1# | Amended and Restated Certificate of Incorporation of the Registrant, as currently in effect. | |
| 3.1.1# | Form of Certificate of Amendment of Amended and Restated Certificate of Incorporation of the Registrant, to effect the stock split in connection with the completion of the offering. | |
| 3.2# | Form of Amended and Restated Certificate of Incorporation of the Registrant, to be in effect upon the completion of this offering. | |
| 3.3# | Bylaws of the Registrant, as currently in effect. | |
| 3.4# | Form of Amended and Restated Bylaws of the Registrant, to be in effect upon the completion of this offering. | |
| 4.1# | Form of common stock certificate. | |
| 4.2# | Form of Amended and Restated Investors’ Rights Agreement by and among the Registrant and certain of its stockholders. | |
| 5.1# | Opinion of Morrison & Foerster LLP. | |
| 10.1# | Tax Sharing Agreement, dated May 1, 2014, by and between Think Finance, Inc. and the Registrant. | |
| 10.2# | Second Amendment to Financing Agreement, dated May 20, 2015, by and among Rise SPV, LLC, Elevate Credit International Ltd., Elevate Credit Services, LLC, the guarantors party thereto, the lenders party thereto, and Victory Park Management, LLC, as administrative agent an collateral agent. | |
| 10.3¥# | Amended and Restated Financing Agreement, dated August 15, 2014, by and among Rise SPV, LLC, Think Finance (UK) Ltd., Elevate Credit Services, LLC, the guarantors party thereto, the lenders party thereto, and Victory Park Management, LLC, as agent. | |
| 10.4# | Amended and Restated Intellectual Property Assignment Agreement, dated September 30, 2015, by and among the Registrant, Elevate Decision Sciences, LLC, TC Decision Sciences, LLC and Think Finance, Inc. | |
| 10.5¥# | Amended and Restated Joint Marketing Agreement, dated July 1, 2015, by and between Republic Bank & Trust Company and Elevate@Work, LLC. | |
| 10.6¥# | Amended and Restated License and Support Agreement, dated July 1, 2015, by and between Republic Bank & Trust Company and Elevate Decision Sciences, LLC. | |
| 10.7¥# | Administrative Services Agreement, dated July 1, 2015, by and between Elastic SPV, Ltd. and Elevate@Work Admin, LLC. | |
| 10.8¥# | Credit Default Protection Agreement, dated July 1, 2015, by and between Elastic@Work, LLC and Elastic SPV, Ltd. | |
| 10.9¥# | Financing Agreement, dated July 1, 2015, by and among Elastic SPV, Ltd., the guarantors party thereto, the lenders party thereto, and Victory Park Management, LLC, as agent. | |
| 10.10# | Intercreditor Agreement, dated July 1, 2015, by and among the Registrant, Rise SPV, LLC, Elevate Credit International Ltd., Elevate Credit Service, LLC, Elastic SPV, Ltd., the grantors party thereto, and Victory Park Management, LLC, as Collateral Agent. | |
II-6
Table of Contents
| Exhibit number |
Description | |
| 10.11¥# | Participation Interest Purchase and Sale Agreement, dated July 1, 2015, by and between Elastic SPV, Ltd. and Elastic@Work, LLC. | |
| 10.12# | Second Amendment to the Fort Worth Sublease Agreement, dated May 22, 2015, by and between TC Loan Service, LLC and Elevate Credit Service, LLC. | |
| 10.13¥# | Amendment to Fort Worth Sublease Agreement, dated December 1, 2014, by and between TC Loan Services, LLC and Elevate Credit Services, LLC. | |
| 10.14¥# | Fort Worth Sublease Agreement, dated May 1, 2014, by and between TC Loan Services, LLC and Elevate Credit Services, LLC. | |
| 10.15# | Second Amendment to the Addison Sublease Agreement, dated May 22, 2015, by and between TC Loan Service, LLC and Elevate Credit Service, LLC. | |
| 10.16¥# | Amendment to Addision Sublease Agreement, dated December 1, 2014, by and between TC Loan Services, LLC and Elevate Credit Services, LLC. | |
| 10.17¥# | Addison Sublease Agreement, dated May 1, 2014, by and between TC Loan Service, LLC and Elevate Credit Service, LLC. | |
| 10.18+# | Forms of Indemnification Agreements between the Registrant and each of its directors and its officers. | |
| 10.19+# | Elevate 2014 Equity Incentive Plan. | |
| 10.20+# | Elevate Form Stock Option Agreement. | |
| 10.21+# | Elevate Form Stock Option Agreement with vesting acceleration for Kenneth E. Rees and Jason Harvison. | |
| 10.22+# | Employment Option Agreement, dated as of May 1, 2014, by and between the Registrant and Kenneth E. Rees. | |
| 10.23+# | Consulting Agreement, dated June 1, 2015, by and between RLJ Financial LLC and Elevate Credit Services, LLC. | |
| 10.24+# | Employment, Confidentiality and Non-Compete Agreement, dated May 1, 2014, by and between Kenneth E. Rees and Elevate Credit Services, LLC. | |
| 10.25+# | Employment, Confidentiality and Non-Compete Agreement, dated May 1, 2014, by and between Jason Harvison and Elevate Credit Services, LLC. | |
| 10.26+# | Employment, Confidentiality and Non-Compete Agreement, dated January 5, 2015, by and between Christopher Lutes and Elevate Credit Services, LLC. | |
| 10.27+# | Employment, Confidentiality and Non-Compete Agreement, dated May 1, 2014, by and between Walt Ramsey and Elevate Credit Services, LLC. | |
| 10.28¥# | Program Agreement between Credit Services Organization and Third-Party Lender, dated June 26, 2015, by and between Sentral Financial LLC and RISE Credit Service of Ohio, LLC. | |
| 10.29# | Parent Guaranty Agreement, dated June 26, 2015, by the Registrant to and for the benefit of Sentral Financial LLC. | |
| 10.30# | Guaranty, dated June 26, 2015, by RISE Credit Services of Ohio, LLC to and for the benefit of Sentral Financial LLC. | |
II-7
Table of Contents
| Exhibit number |
Description | |
| 10.31# | Amendment to Guaranty, dated October 5, 2015, between Sentral Financial LLC and Rise Credit Services of Ohio, LLC. | |
| 10.32¥# | Special Limited Agency Agreement, dated June 26, 2015, by and between First Financial Loan Company LLC and RISE Credit Service of Texas, LLC. | |
| 10.33¥# | Amendment to Special Limited Agency Agreement, dated October 5, 2015, between First Financial Loan Company LLC and RISE Credit Service of Texas, LLC. | |
| 10.34¥# | TransUnion Master Agreement for Consumer Reporting and Ancillary Services, dated April 3, 2014, by and between Trans Union LLC and the Registrant. | |
| 10.35# | Third Amendment to Financing Agreement, dated October 21, 2015, by and among Rise SPV, LLC, Elevate Credit International Ltd., Elevate Credit Service, LLC, the guarantors party thereto, and Victory Park Management, LLC, as administrative agent and collateral agent. | |
| 10.36# | First Amendment to Financing Agreement, dated October 21, 2015, by and among Elastic SPV, Ltd., the guarantors party thereto, the lenders party thereto, and Victory Park Management, LLC, as agent. | |
| 10.37+# | Elevate 2016 Omnibus Incentive Plan. | |
| 10.38+# | Elevate 2016 Employee Stock Purchase Plan. | |
| 10.39+# | First Amendment to Employment, Confidentiality and Non-Compete Agreement, dated December 11, 2015, by and between Kenneth E. Rees and Elevate Credit Services, LLC. | |
| 10.40+# | First Amendment to Employment, Confidentiality and Non-Compete Agreement, dated December 11, 2015, by and between Jason Harvison and Elevate Credit Services, LLC. | |
| 10.41+# | First Amendment to Employment, Confidentiality and Non-Compete Agreement, dated December 11, 2015, by and between Christopher Lutes and Elevate Credit Services, LLC. | |
| 10.42+# | First Amendment to Employment, Confidentiality and Non-Compete Agreement, dated December 11, 2015, by and between Walt Ramsey and Elevate Credit Services, LLC. | |
| 10.43+# | Form of Elevate 2016 Omnibus Incentive Plan Notice of Restricted Stock Bonus Award. | |
| 10.44+# | Form of Elevate 2016 Omnibus Incentive Plan Notice of Restricted Stock Unit Award. | |
| 10.45+# | Form of Elevate 2016 Omnibus Incentive Plan Notice of Stock Option Award. | |
| 10.46+# | Form of Elevate 2016 Omnibus Incentive Plan Notice of Stock Option Award (Section 16 Grantees). | |
| 10.47+# | Form of Elevate 2016 Omnibus Incentive Plan Notice of Restricted Stock Bonus Award (Section 16 Grantees). | |
| 10.48+# | Form of Elevate 2016 Omnibus Incentive Plan Notice of Restricted Stock Unit Award (Section 16 Grantees). | |
| 10.49# | Fourth Amendment to Financing Agreement, dated December 16, 2015, by and among Rise SPV, LLC, Elevate Credit International Ltd., Elevate Credit Service, LLC, the guarantors party thereto, and Victory Park Management, LLC, as administrative agent and collateral agent. | |
| 10.50+# | Termination of Director Agreement and Services Agreement Letter, dated January 5, 2016, by Stephen B. Galasso and SBG Resources. | |
II-8
Table of Contents
| Exhibit number |
Description | |
| 10.51+# | Termination of Agreement Regarding Director and Consulting Services Letter, dated January 5, 2016, by Stephen J. Shaper and Middlemarch Capital. | |
| 10.52 | Fifth Amendment to Financing Agreement, dated February 11, 2016, by and among Rise SPV, LLC, Elevate Credit International Ltd., Elevate Credit Service, LLC, the guarantors party thereto, and Victory Park Management, LLC, as administrative agent and collateral agent. | |
| 21.1# | List of subsidiaries of the Registrant. | |
| 23.1 | Consent of Grant Thornton, Independent Registered Public Accounting Firm. | |
| 23.2# | Consent of Morrison & Foerster LLP (included in Exhibit 5.1). | |
| 24.1# | Power of Attorney (see page II-4 and page II-5 to the filings of this registration statement on Form S-1 filed on November 9, 2015 and June 3, 2016, respectively). | |
| 99.1¥# | Participation Agreement, dated July 1, 2015, by and between Elastic SPV, Ltd. and Republic Bank & Trust Company. | |
| + | Indicates a management contract or compensatory plan. |
| # | Previously filed. |
| ¥ | Confidential treatment has been granted as to certain portions of this exhibit, which portions have been omitted and submitted separately to the Securities and Exchange Commission. |
II-9