Attached files
| file | filename |
|---|---|
| 8-K - FORM 8-K - Stagwell Inc | v441519_8-k.htm |
Exhibit 99.1

Strategic & Financial Update

FORWARD LOOKING STATEMENTS & OTHER INFORMATION This presentation, including our “ 2016 Financial Outlook”, contains forward - looking statements. The Company’s representatives may also make forward - looking statements orally from time to time. Statements in this presentation that are not historical facts, including statements about the Company’s beliefs and expectations, earnings guidance, recent business and economic trends, potential acquisitions, estimates of amounts for deferred acquisition consideration and “put” option rights, constitute forward - looking statements. These statements are based on current plans, estimates and projections, and are subject to change based on a number of factors, including those outlined in this section. Forward - looking statements speak only as of the date they are made, and the Company undertakes no obligation to update publicly any of them in light of new information or future events, if any. Forward - looking statements involve inherent risks and uncertainties. A number of important factors could cause actual results to differ materially from those contained in any forward - looking statements. Such risk factors include, but are not limited to, the following: • risks associated with the SEC’s ongoing investigation and the related class action litigation claims; • risks associated with severe effects of international, national and regional economic conditions; • the Company’s ability to attract new clients and retain existing clients; • the spending patterns and financial success of the Company’s clients; • the Company’s ability to retain and attract key employees; • the Company’s ability to remain in compliance with its debt agreements and the Company’s ability to finance its contingent payment obligations when due and payable, including but not limited to those relating to redeemable noncontrolling interests and deferred acquisition consideration; • the successful completion and integration of acquisitions which compliment and expand the Company’s business capabilities; and • foreign currency fluctuations. The Company’s business strategy includes ongoing efforts to engage in acquisitions of ownership interests in entities in the marketing communications services industry. The Company intends to finance these acquisitions by using available cash from operations, from borrowings under the credit agreement and through incurrence of bridge or other debt financing, any of which may increase the Company’s leverage ratios, or by issuing equity, which may have a dilutive impact on existing shareholders proportionate ownership. At any given time the Company may be engaged in a number of discussions that may result in one or more acquisitions. These opportunities require confidentiality and may involve negotiations that require quick responses by the Company. Although there is uncertainty that any of these discussions will result in definitive agreements or the completion of any transactions, the announcement of any such transaction may lead to increased volatility in the trading price of the Company’s securities. Investors should carefully consider these risk factors and the additional risk factors outlined in more detail in the Annual Report on Form 10 - K for the year ended December 31, 2015 under the caption “Risk Factors” and in the Company’s other SEC filings.
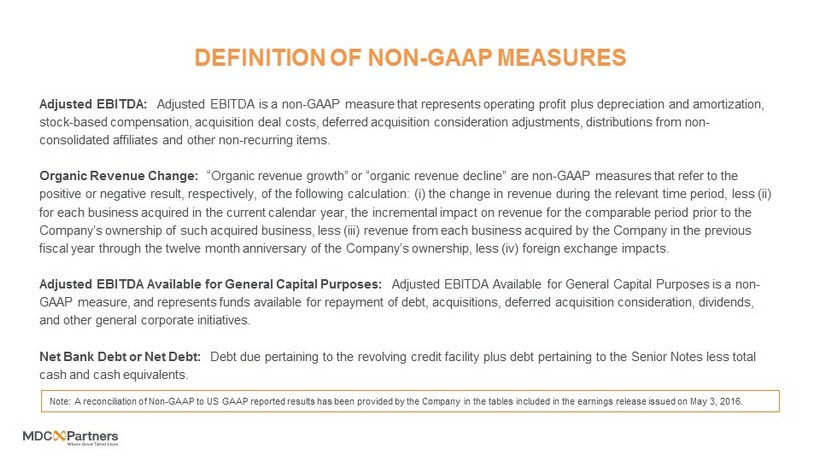
DEFINITION OF NON - GAAP MEASURES Adjusted EBITDA: Adjusted EBITDA is a non - GAAP measure that represents operating profit plus depreciation and amortization, stock - based compensation, acquisition deal costs, deferred acquisition consideration adjustments, distributions from non - consolidated affiliates and other non - recurring items. Organic Revenue Change: “Organic revenue growth” or “organic revenue decline” are non - GAAP measures that refer to the positive or negative result, respectively, of the following calculation: ( i ) the change in revenue during the relevant time period, less (ii) for each business acquired in the current calendar year, the incremental impact on revenue for the comparable period prior to th e Company’s ownership of such acquired business, less (iii) revenue from each business acquired by the Company in the previous fiscal year through the twelve month anniversary of the Company’s ownership, less (iv) foreign exchange impacts. Adjusted EBITDA Available for General Capital Purposes: Adjusted EBITDA Available for General Capital Purposes is a non - GAAP measure, and represents funds available for repayment of debt, acquisitions, deferred acquisition consideration, dividen ds, and other general corporate initiatives . Net Bank Debt or Net Debt: Debt due pertaining to the revolving credit facility plus debt pertaining to the Senior Notes less total cash and cash equivalents. Note: A reconciliation of Non - GAAP to US GAAP reported results has been provided by the Company in the tables included in the ea rnings release issued on May 3, 2016.

Strategic Update Scott Kauffman Chairman & CEO, MDC Partners
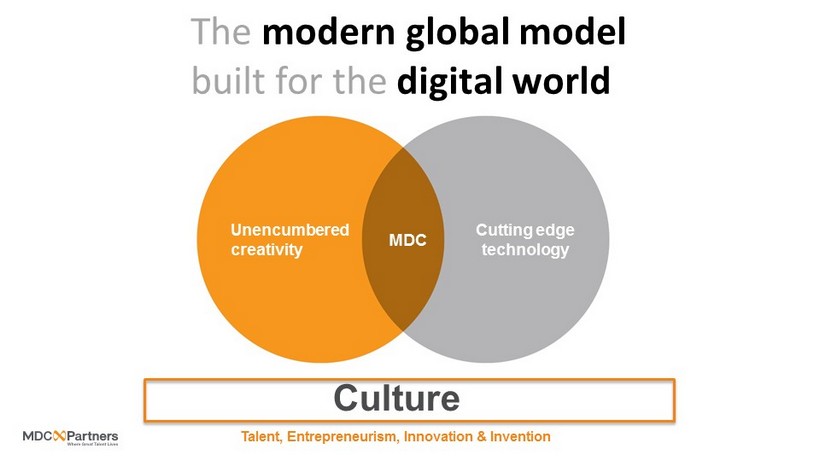
Unencumbered creativity Cutting edge technology MDC Culture Talent, Entrepreneurism, Innovation & Invention The modern global model built for t he digital world

A PORTFOLIO FOR TODAY’S CMO

CLIENTS WHO INSPIRE OUR WORK Communications / Media Retail Food & Beverage Consumer Products Technology Automotive Financials Healthcare

Industry Recognition

Consumer Recognition Most Watched SuperBowl Ad – 3 Years in a Row Budweiser: “Lost Dog” (2015), “Puppy Love” (2014), “The Clydesdales” (2013) – Anomaly The Budweiser puppy has done what the Seattle Seahawks could not — it won back - to - back Super Bowls. If you're keeping score, not only is that two in a row for the puppy, but three in a row for Anheuser - Busch and the 13th time in the past 15 years that Anheuser - Busch has won USA TODAY's Ad Meter ranking of all the ads by a consumer panel . For the 27th consecutive year, USA TODAY'S Ad Meter's ….. Duracell, “Battle for Christmas Morning” – Anomaly Adidas Football, “There Will Be Haters” – 72andSunny December 30, 2015 YouTube Crowns its Ad of the Decade Turkish Airlines. “The Selfie Shootout” – CPB Celebrities taking selfies is a hallmark of the modern entertainment age. And in the end, even “The Force” is powerless to stop it. Turkish Airlines’ “Kobe vs. Messi: The Selfie Shootout” commercial from 2013 ran away with the public vote and has been named ad of the decade by YouTube, as part of its 10 th anniversary celebrations. The runner - up was Volkswagen’s beloved 2011 Super Bowl spot “The Force,”, with a mini Darth Vader bending a Passat to his will. Kobe and Messi’s Turkish Airlines spot outruns Litter Vader June 3, 2015, 6:14 AM EDT


VISION FOR GROWTH 1. S caling our agencies globally 2. Fueling the next wave 3. Leveraging emerging technologies 4. Bolstering high demand services 5. Enhancing collaboration to drive incremental opportunities

SCALING OUR AGENCIES: GLOBAL GROWTH 2012 2013 2014 2015 Q1 - 16+ Key Public Wins* % of MDC Revenue 4.5% 5.3% 6.5% 8.5% 9.2% Int’l Organic Growth +53% +31% +28% +32% +41% Brazil * Includes wins in the public domain only Outside of North America: 11 countries, 15 cities, 12 agencies

FUELING THE NEXT WAVE

LEVERAGING EMERGING TECHNOLOGIES: MOBILE AND ANALYTICS

BOLSTERING HIGH DEMAND SERVICES: MEDIA Varick Media Management established as first agency programmatic trading desk Varick joins The Media Kitchen, MDC’s existing boutique media agency born out of KBS <2% of MDC Revenue 2008 2015 2016 2010 - 12 2014 2013 MDC acquires the pieces that would later be aligned together to form a scaled media platform - Integrated Media Strategies - RJ Palmer - Doner - TargetCast TCM LocalBizNow acquired Industry veteran Martin Cass hired to lead MDC’s media strategy Assembly formed by merger of IMS, RJ Palmer, Doner Media and TargetCast Umbrella structure re - branded as MDC Media Partners Closer integration of capabilities under MDC Media Partners umbrella Key 2016 Wins: EnPlay out - of - home agency launced as a start - up Unique Influence acquired, bolstering social, mobile and search marketing capability >10% of MDC Revenue
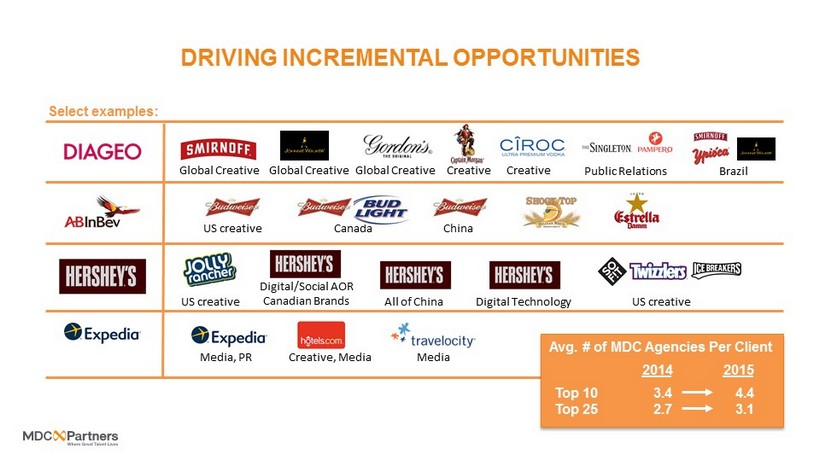
DRIVING INCREMENTAL OPPORTUNITIES US creative All of China Media, PR Creative, Media M edia US creative Canada China Global Creative Global Creative Public Relations Brazil Select examples: 2014 2015 Top 10 3.4 4.4 Top 25 2.7 3.1 Avg. # of MDC Agencies Per Client Global Creative Creative Creative US creative Digital/Social AOR Canadian Brands Digital Technology


Financial Update David Doft Chief Financial Officer, MDC Partners

ROBUST NEW BUSINESS TRENDS * Includes wins in the public domain only 2015 New Business* Brazil 55 2016 YTD New Business* m 2016 YTD Net New Business $

PORTFOLIO RISK REDUCTION AS WE GROW 2009 1 2015 » Revenue $546 million $1.33 billion » Adjusted EBITDA $70 million $198 million » CFO 2 less Capex $55 million $141 million » Contracted retainer based revenue 63% 81% » Client concentration - top 10 49% 24% » Agency concentration - largest >30% teens % » # of countries / cities / agencies outside the US and Canada 3 / 3 / 3 12 / 17 / 12 1 As reported with Full Year 2009 and Full Year 2012 results at the time, respectively 2 Defined as Cash Flow From Continuing Operations Note : See appendix for definitions of non - GAAP measures

SOLID UNDERLYING SEGMENT PROFITABILITY Advertising & Communications 18.1% Corporate - 3.2% Total MDC Partners 14.9% * 2015 Adjusted EBITDA margins. See appendix for definitions of non - GAAP measures.

CORPORATE EFFICIENCY Gross Savings Reduced CEO compensation Exited Toronto HQ facility De - listed from TSX Cut unproductive s pending Accelerated Investments New business r esources Education/talent initiatives Information technology = $10 million net savings incremental in 2016

ADJUSTED EBITDA MARGIN UPSIDE POTENTIAL

DISTINCTIVE M&A STRATEGY » Self - selection ensures right fit for MDC with leaders in it for long term » Financial alignment with agency leadership underpinned through minority equity ownership and earnout structure » Deals generally self - funding beyond closing payment » Priority return structure underwrites 20% internal rate of return » 100%+ cumulative cash - on - cash return through life of the deal » 100% ownership at deal completion without future obligations » Succession planning to ensure sustainability longer - term
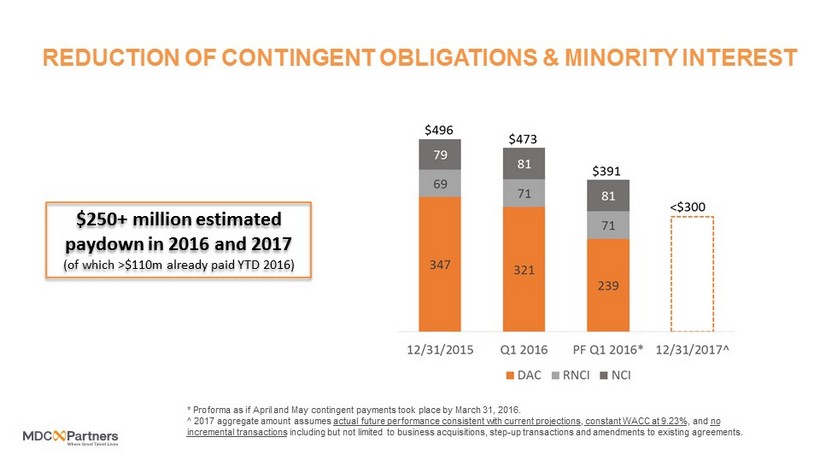
REDUCTION OF CONTINGENT OBLIGATIONS & MINORITY INTEREST * Proforma as if April and May contingent payments took place by March 31, 2016. ^ 2017 aggregate amount assumes actual future performance consistent with current projections , constant WACC at 9.23% , and no incremental transactions including but not limited to business acquisitions, step - up transactions and amendments to existing agreements. $250+ million estimated paydown in 2016 and 2017 (of which >$110m already paid YTD 2016)

DE - LEVERAGING THE BALANCE SHEET 3.4 x 2.5 x or below 12/31/2015 2 to 3 years 1 turn de - leveraging over next 2 - 3 years Net Debt / Adjusted EBITDA

CLEAR VISIBILITY INTO 2H ACCELERATION Timing + New Business + Billable Pass - through Costs = 2H Revenue Acceleration

TIMING OF PROJECTS $ in millions Q1 Q2 Q3 Q4 FY Yr / Yr Chg 2014 $2,796 $1,317 $2,722 $1,682 $8,516 2015 $4,833 $2,278 $2,009 $2,405 $11,575 +36% 2016 $2,458 flat to up $2.4m timing impact in Q1, or nearly 1% drag to organic growth An Actual Client Example

BILLABLE PASS - THROUGH COSTS One More Actual Client Example Historical MDC Organic Revenue and Pass - Through Impact Organic Revenue Impact 2014 10.8% 60bp 1Q2015 7.4% - 50bp 2Q2015 8.3% - 10bp 3Q2015 5.7% - 420bp 4Q2015 7.2% - 230bp 2015 7.1% - 190bp 1Q2016 2.2% - 240bp Q1 2015 Q1 2016 $ in millions Actual Actual Gross Revenue $6,724 $3,839 Net Revenue $464 $492 Direct Costs $6,260 $3,347 Margin % 6.9% 12.8% Note : See appendix for definitions of non - GAAP measures - $3 million drag from pass - through cost decline, or ~1% to organic growth

2016 FINANCIAL OUTLOOK Revenue Adjusted EBITDA Adjusted EBITDA Available for General Capital Purposes Implied Adjusted EBITDA Margin $1.326 billion $197.7 million $113.4 million 14.9% $1.410 to $1.440 billion $225 to $235 million $130 to $140 million 15.8% to 16.4% +6.3% to +8.6% +13.8% to +18.9% +14.6% to +23.4% +90 to +150 basis points 2015 Actuals Implied Year over Year Change Revised 2016 Guidance May 3, 2016 $1.410 to $1.440 billion $225 to $235 million $135 to $145 million 15.8% to 16.4% Initial 2016 Guidance February 18, 2016 1 Financial guidance offered on May 3, 2016

THE PATH TO LONG - TERM GROWTH North American Creative + New Services (e.g. media, mobile, analytics, public relations, healthcare) + International Expansion = 5 - 7% organic growth = 2x industry growth (industry average 2.8% since 2007)

MDC FINANCIAL FRAMEWORK Double - Digit Total Revenue Growth 50 - 100 bps Annual Margin Expansion 25 - 30% Compounded Adjusted EBITDA Available for General Capital Purposes Growth Mid - Teens Adjusted EBITDA Growth +20% Organic Compounded Adjusted EBITDA Available for General Capital Purposes Growth Accretive acquisitions can accelerate value creation Without Acquisitions With Acquisitions (Add 3 - 5% annually via tuck - in acquisitions) 5 - 7% Year - over - Year Organic Revenue Growth 50 - 100 bps Annual Organic Margin Expansion Double - Digit Compounded Adjusted EBITDA Growth

KEY TAKEAWAYS 1. P ortfolio management optimizes performance and limits risk 2. Self - funding acquisition model creates long - term asset value 3. Balance sheet at inflection point 4. Poised for topline acceleration beginning in 3Q 5. Long - term financial framework never stronger

Appendix

ADJUSTED EBITDA SCHEDULE

CASH GENERATION

REVENUE TRENDING SCHEDULE (US$ in thousands, except percentages) 2016 Q1-14 Q2-14 Q3-14 Q4-14 FY 2014 Q1-15 Q2-15 Q3-15 Q4-15 FY 2015 Q1-16 Revenue United States $228,833 $243,128 $249,128 $272,385 $993,474 $252,018 $271,375 $270,512 $291,146 $1,085,051 $252,198 Canada 30,913 39,028 38,052 42,397 150,390 29,825 35,432 29,559 34,222 129,038 28,406 North America 259,746 282,156 287,180 314,782 1,143,864 281,843 306,807 300,071 325,368 1,214,089 280,604 Other 15,108 17,200 22,211 25,129 79,648 20,379 29,799 28,344 33,645 112,167 28,437 Total $274,854 $299,356 $309,391 $339,911 $1,223,512 $302,222 $336,606 $328,415 $359,013 $1,326,256 $309,042 % of Revenue United States 83.3% 81.2% 80.5% 80.1% 81.2% 83.4% 80.6% 82.4% 81.1% 81.8% 81.6% Canada 11.2% 13.0% 12.3% 12.5% 12.3% 9.9% 10.5% 9.0% 9.5% 9.7% 9.2% North America 94.5% 94.3% 92.8% 92.6% 93.5% 93.3% 91.1% 91.4% 90.6% 91.5% 90.8% Other 5.5% 5.7% 7.2% 7.4% 6.5% 6.7% 8.9% 8.6% 9.4% 8.5% 9.2% Total 100.0% 100.0% 100.0% 100.0% 100.0% 100.0% 100.0% 100.0% 100.0% 100.0% 100.0% Total Growth % United States 14.6% 12.6% 13.6% 15.6% 14.1% 10.1% 11.6% 8.6% 6.9% 9.2% 0.1% Canada -3.6% 15.0% 12.3% 18.6% 10.9% -3.5% -9.2% -22.3% -19.3% -14.2% -4.8% North America 12.1% 12.9% 13.4% 16.0% 13.7% 8.5% 8.7% 4.5% 3.4% 6.1% -0.4% Other 33.5% 33.8% 55.8% 40.4% 41.4% 34.9% 73.3% 27.6% 33.9% 40.8% 39.5% Total 13.1% 13.9% 15.7% 17.5% 15.2% 10.0% 12.4% 6.1% 5.6% 8.4% 2.3% Organic Growth % United States 12.0% 9.5% 7.7% 10.5% 9.9% 6.9% 6.6% 6.1% 5.9% 6.4% -1.2% Canada -2.2% 3.5% 14.0% 22.1% 9.7% 3.2% 2.1% -5.5% -4.3% -1.4% 4.5% North America 10.0% 8.7% 8.5% 12.1% 9.9% 6.5% 6.0% 4.6% 4.5% 5.4% -0.6% Other 29.0% 27.8% 37.4% 19.5% 27.8% 23.7% 45.5% 20.0% 39.9% 31.9% 41.4% Total 10.9% 9.6% 10.1% 12.5% 10.8% 7.4% 8.3% 5.7% 7.2% 7.1% 2.2% 2014 2015

Thank You Investor Contact: Matt Chesler , CFA Head of Investor Relations mchesler@mdc - partners.com