Attached files
| file | filename |
|---|---|
| EX-99.2 - EXHIBIT 99.2 - PINNACLE WEST CAPITAL CORP | exhibit992pressrelease.htm |
| 8-K - 8-K - PINNACLE WEST CAPITAL CORP | a8-kfor6x1x16ratecasefiling.htm |

Powering Growth, Delivering Value APS Rate Case Filing Overview l June 2016 POWERING GROWTH DELIVERING VALUE

Powering Growth, Delivering Value2 FORWARD LOOKING STATEMENTS This presentation contains forward-looking statements based on current expectations, including statements regarding our earnings guidance and financial outlook and goals. These forward-looking statements are often identified by words such as “estimate,” “predict,” “may,” “believe,” “plan,” “expect,” “require,” “intend,” “assume” and similar words. Because actual results may differ materially from expectations, we caution you not to place undue reliance on these statements. A number of factors could cause future results to differ materially from historical results, or from outcomes currently expected or sought by Pinnacle West or APS. These factors include, but are not limited to: our ability to manage capital expenditures and operations and maintenance costs while maintaining high reliability and customer service levels; variations in demand for electricity, including those due to weather seasonality, the general economy, customer and sales growth (or decline), and the effects of energy conservation measures and distributed generation; power plant and transmission system performance and outages; competition in retail and wholesale power markets; regulatory and judicial decisions, developments and proceedings; new legislation, ballot initiatives and regulation, including those relating to environmental requirements, regulatory policy, nuclear plant operations and potential deregulation of retail electric markets; fuel and water supply availability; our ability to achieve timely and adequate rate recovery of our costs, including returns on and of debt and equity capital investments; our ability to meet renewable energy and energy efficiency mandates and recover related costs; risks inherent in the operation of nuclear facilities, including spent fuel disposal uncertainty; current and future economic conditions in Arizona, including in real estate markets; the development of new technologies which may affect electric sales or delivery; the cost of debt and equity capital and the ability to access capital markets when required; environmental and other concerns surrounding coal-fired generation, including regulation of greenhouse gas emissions; volatile fuel and purchased power costs; the investment performance of the assets of our nuclear decommissioning trust, pension, and other postretirement benefit plans and the resulting impact on future funding requirements; the liquidity of wholesale power markets and the use of derivative contracts in our business; potential shortfalls in insurance coverage; new accounting requirements or new interpretations of existing requirements; generation, transmission and distribution facility and system conditions and operating costs; the ability to meet the anticipated future need for additional generation and associated transmission facilities in our region; the willingness or ability of our counterparties, power plant participants and power plant land owners to meet contractual or other obligations or extend the rights for continued power plant operations; and restrictions on dividends or other provisions in our credit agreements and ACC orders. These and other factors are discussed in Risk Factors described in Part I, Item 1A of the Pinnacle West/APS Annual Report on Form 10-K for the fiscal year ended December 31, 2015, which you should review carefully before placing any reliance on our financial statements, disclosures or earnings outlook. Neither Pinnacle West nor APS assumes any obligation to update these statements, even if our internal estimates change, except as required by law.
Powering Growth, Delivering Value3 2016 APS RATE CASE APPLICATION • Filed June 1, 2016* • Propose new rates go into effect on July 1, 2017 • Docket Number: E-01345A-16-0036 • Additional details, including filing, can be found at http://www.azenergyfuture.com/rate-review/ * 1-month sufficiency review period by ACC

Powering Growth, Delivering Value4 2016 RATE CASE KEY FINANCIALS APS has requested a rate increase to become effective July 1, 2017 Test year ended December 31, 2015 Total Rate Base - Adjusted $8.01 Billion ACC Rate Base - Adjusted $6.77 Billion Allowed Return on Equity 10.5% Capital Structure Long-term debt 44.2% Common equity 55.8% Base Fuel Rate (¢/kWh) 2.9882 Post-test year plant period 18 months Overview of Rate Increase ($ in Millions) Total stated base rate increase (inclusive of existing adjustor transfers) $ 433.43 15.00% Less: Transfer to base rates of various adjustors already in effect (267.55) (9.26) Net Customer Bill Impact $ 165.88 5.74%

Powering Growth, Delivering Value5 Focus on Clean Energy Focus on Customers Focus on Innovation Focus on Sustainability • Generate power from diverse portfolio and support environmental improvements • Create sustainable path forward for flexible resource portfolio • Optimize customer service and reliability • Better align rates with the true cost of service • Provide rate gradualism and bill stability for customers by managing overall rate trajectory and the transition to new rate design • Prudently invest in new technologies • Implement new customer information system to enable adaptable customer programs and rates • Modernize rates to enable advanced technologies and grid services • Achieve an earned return that provides for financial stability and allows for sustainable investments in Arizona • Maintain structure of constructive regulatory support • Improve concurrent cost recovery of plant investments 2016 RATE CASE FRAMEWORK “A Bridge to the Future” Rate Case Objectives

Powering Growth, Delivering Value6 2016 RATE CASE SUMMARY Focus on Clean Energy Focus on Customers Focus on Innovation Focus on Sustainability Ocotillo Modernization Project • Requesting cost deferral order from in-service dates in 2018 and 2019 to effective date of rates in next rate case Four Corners Selective Catalytic Reduction (SCR) Equipment • Requesting cost deferral order from in-service dates to incorporation of the SCR costs in rates using a step-increase beginning in 2019 Residential Rate Design Modernization • Transition to 3-part residential rate structure including a variable (energy kWh) charge, a fixed (basic service) charge, and a demand charge • Modify net energy metering to differentiate compensation between energy consumed on site and exported energy General Service (Business) • Retire AG-1; introduce aggregation discount for customers with multiple sites, a new rate for customers with extra high load factors and a economic development rate Solar Partners Programs • Installing 10 MW of APS-owned residential PV systems on 1,600 homes with advanced inverters, including 4 MW of battery storage Red Rock Solar Generating Station • 40 MW utility-scale solar facility (post-test year plant) Microgrid Projects • Two microgrids in service by 3Q16; partnered with Marine Corps Air Station Yuma and Aligned Data Center in Phoenix Power Supply Adjustment • Include environmental chemical costs, generation-related water costs, and energy storage products from 3rd party providers Environmental Improvement Surcharge • Increase from ~$5M total cap to $10M year-over- year cap Depreciation Rate Changes • Change depreciation life schedules including Cholla Units 1 & 3, Ocotillo Units 1 & 2, Yucca Units 1-4 and AMI meters
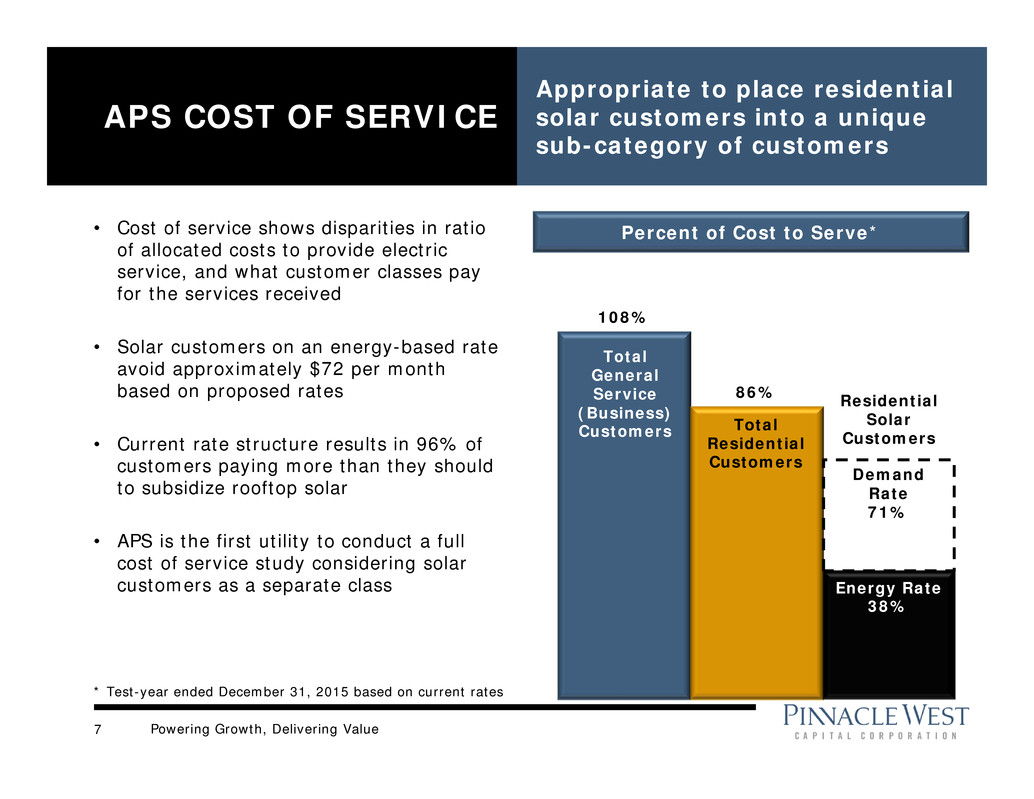
Powering Growth, Delivering Value7 APS COST OF SERVICE Appropriate to place residential solar customers into a unique sub-category of customers 108% 86% Percent of Cost to Serve* Residential Solar Customers Demand Rate 71% • Cost of service shows disparities in ratio of allocated costs to provide electric service, and what customer classes pay for the services received • Solar customers on an energy-based rate avoid approximately $72 per month based on proposed rates • Current rate structure results in 96% of customers paying more than they should to subsidize rooftop solar • APS is the first utility to conduct a full cost of service study considering solar customers as a separate class Energy Rate 38% Total General Service (Business) Customers Total Residential Customers * Test-year ended December 31, 2015 based on current rates
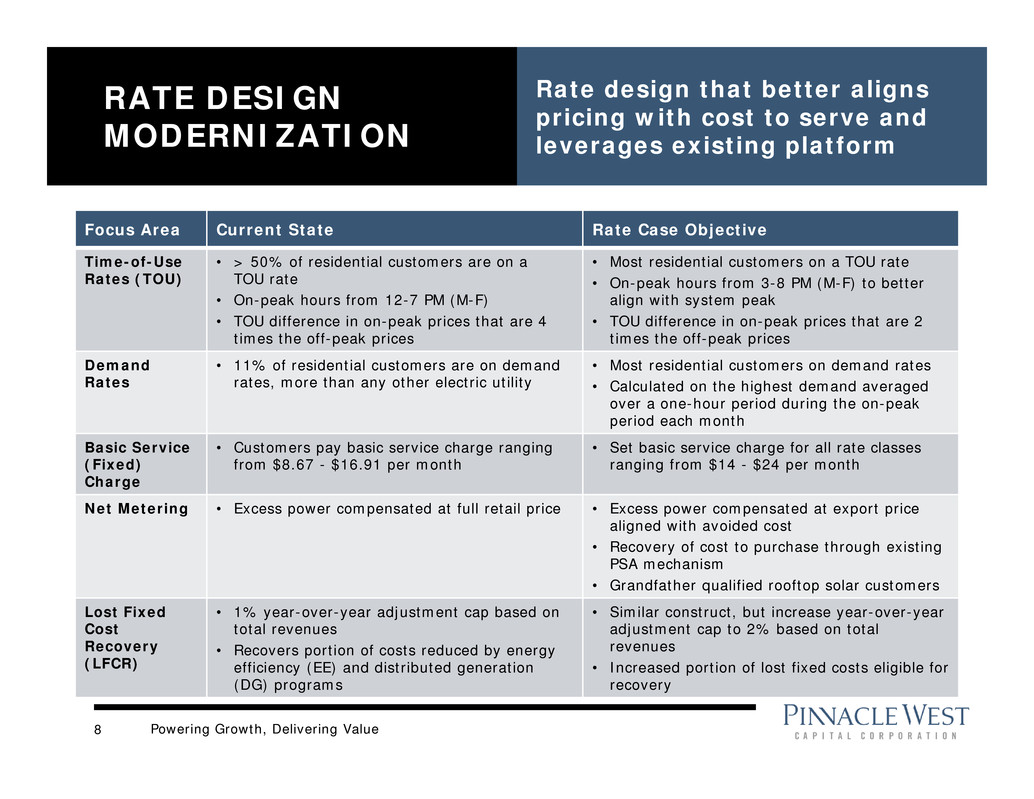
Powering Growth, Delivering Value8 Focus Area Current State Rate Case Objective Time-of-Use Rates (TOU) • > 50% of residential customers are on a TOU rate • On-peak hours from 12-7 PM (M-F) • TOU difference in on-peak prices that are 4 times the off-peak prices • Most residential customers on a TOU rate • On-peak hours from 3-8 PM (M-F) to better align with system peak • TOU difference in on-peak prices that are 2 times the off-peak prices Demand Rates • 11% of residential customers are on demand rates, more than any other electric utility • Most residential customers on demand rates • Calculated on the highest demand averaged over a one-hour period during the on-peak period each month Basic Service (Fixed) Charge • Customers pay basic service charge ranging from $8.67 - $16.91 per month • Set basic service charge for all rate classes ranging from $14 - $24 per month Net Metering • Excess power compensated at full retail price • Excess power compensated at export price aligned with avoided cost • Recovery of cost to purchase through existing PSA mechanism • Grandfather qualified rooftop solar customers Lost Fixed Cost Recovery (LFCR) • 1% year-over-year adjustment cap based on total revenues • Recovers portion of costs reduced by energy efficiency (EE) and distributed generation (DG) programs • Similar construct, but increase year-over-year adjustment cap to 2% based on total revenues • Increased portion of lost fixed costs eligible for recovery RATE DESIGN MODERNIZATION Rate design that better aligns pricing with cost to serve and leverages existing platform

Powering Growth, Delivering Value9 RATE DESIGN MODERNIZATION Key residential rate proposals designed to reduce cost shift among customers • Streamlined rate choices for residential customers including combinations of the following: – Reductions to kWh (variable) charges; – Increases in basic service (fixed) charges; and – Variations of demand (kW) charges applied to on-peak hours • Modify the net energy metering transaction, while providing a grandfathering program for qualifying customers with rooftop solar Variable Variable (lower cost per kWh) Fixed Fixed Demand Current Customer Bill Proposed Customer Bill

Powering Growth, Delivering Value10 OCOTILLO MODERNIZATION PROJECT AND FOUR CORNERS SCRs Ocotillo Modernization Project Four Corners SCRs In-Service Dates Units 6, 7 – Fall 2018 Units 3, 4 and 5 – Spring 2019 Unit 5 – Late 2017 Unit 4 – Spring 2018 Total Cost (APS) $500 million $400 million Estimated Cost Deferral $45 million (through 2019) $30 million (through 2018) Rate Request Requesting cost deferral from date of commercial operation to the effective date of rates in next rate case Requesting cost deferral order from time of installation to incorporation of the SCR costs in rates using a step increase beginning in 2019 • Requesting Accounting Deferral Orders for two large generation-related capital investments – Ocotillo Modernization Project: Retiring two aging, steam-based, natural gas units, and replacing with 5 new, fast-ramping, combustion turbine units – Four Corners Power Plant: Install Selective Catalytic Reduction (SCR) equipment to comply with Federal environmental standards

Powering Growth, Delivering Value APPENDIX

Powering Growth, Delivering Value12 RATE BASE APS’s revenues come from a regulated retail rate base and meaningful transmission business $6.0 $6.5 $7.9 $1.3 $1.4 $1.7 2014 2015 2016 2017 2018 APS Rate Base Growth Year-End ACC FERC Total Approved Rate Base Projected Most Recent Rate Decisions ACC FERC Rate Effective Date 7/1/2012 6/1/2016 Test Year Ended 12/31/2010* 12/31/2015 Rate Base $5.7B $1.4B Equity Layer 54% 56% Allowed ROE 10.00% 10.75% *Adjusted to include post test-year plant in service through 3/31/2012 83% 17% Generation & Distribution Transmission Rate base $ in billions, rounded

Powering Growth, Delivering Value13 $263 $220 $218 $298 $66 $77 $234 $115 $44 $232 $194 $90 $58 $110 $1 $1 $201 $114 $200 $150 $340 $364 $354 $382 $85 $88 $84 $88 2015 2016 2017 2018 CAPITAL EXPENDITURES Capital expenditures are funded primarily through internally generated cash flow ($ Millions) $1,205 $1,285 Other Distribution Transmission Renewable Generation Environmental1 Traditional Generation Projected $1,124 New Gas Generation2 $1,057 • The table does not include capital expenditures related to El Paso's 7% interest in Four Corners Units 4 and 5 of $3 million in 2015, $30 million in 2016 and $25 million in 2017. • 2016 – 2018 as disclosed in First Quarter 2016 Form 10-Q. 1 Includes Selective Catalytic Reduction controls at Four Corners with in-service dates of late 2017 (Unit 5) and Spring 2018 (Unit 4) 2 Ocotillo Modernization Project: 2 units scheduled for completion in Fall 2018, 3 units schedule for completion in Spring 2019
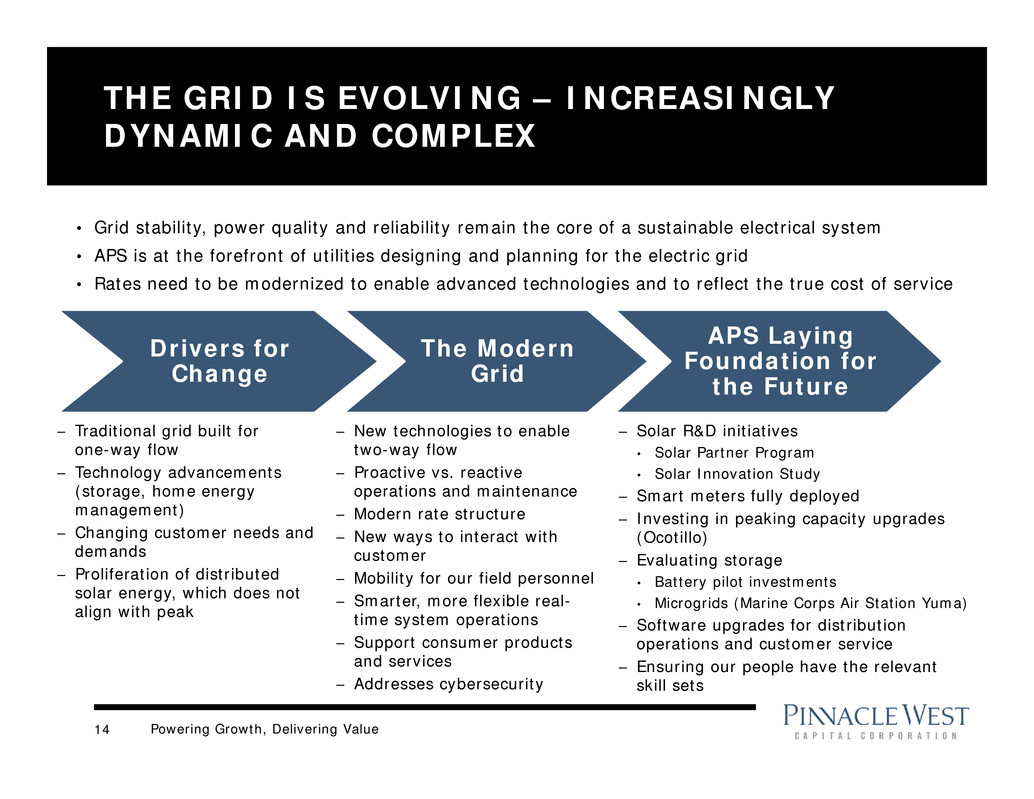
Powering Growth, Delivering Value14 THE GRID IS EVOLVING – INCREASINGLY DYNAMIC AND COMPLEX Drivers for Change – Traditional grid built for one-way flow – Technology advancements (storage, home energy management) – Changing customer needs and demands – Proliferation of distributed solar energy, which does not align with peak The Modern Grid – New technologies to enable two-way flow – Proactive vs. reactive operations and maintenance – Modern rate structure – New ways to interact with customer – Mobility for our field personnel – Smarter, more flexible real- time system operations – Support consumer products and services – Addresses cybersecurity APS Laying Foundation for the Future – Solar R&D initiatives • Solar Partner Program • Solar Innovation Study – Smart meters fully deployed – Investing in peaking capacity upgrades (Ocotillo) – Evaluating storage • Battery pilot investments • Microgrids (Marine Corps Air Station Yuma) – Software upgrades for distribution operations and customer service – Ensuring our people have the relevant skill sets • Grid stability, power quality and reliability remain the core of a sustainable electrical system • APS is at the forefront of utilities designing and planning for the electric grid • Rates need to be modernized to enable advanced technologies and to reflect the true cost of service

Powering Growth, Delivering Value15 APS RATE DESIGN: A SOLID FOUNDATION TO BUILD ON Over 50% of APS residential customers are already on time-of-use rates, including 11% on demand rates 0% 25% 50% 75% 100% Standard TOU - Energy TOU - Demand
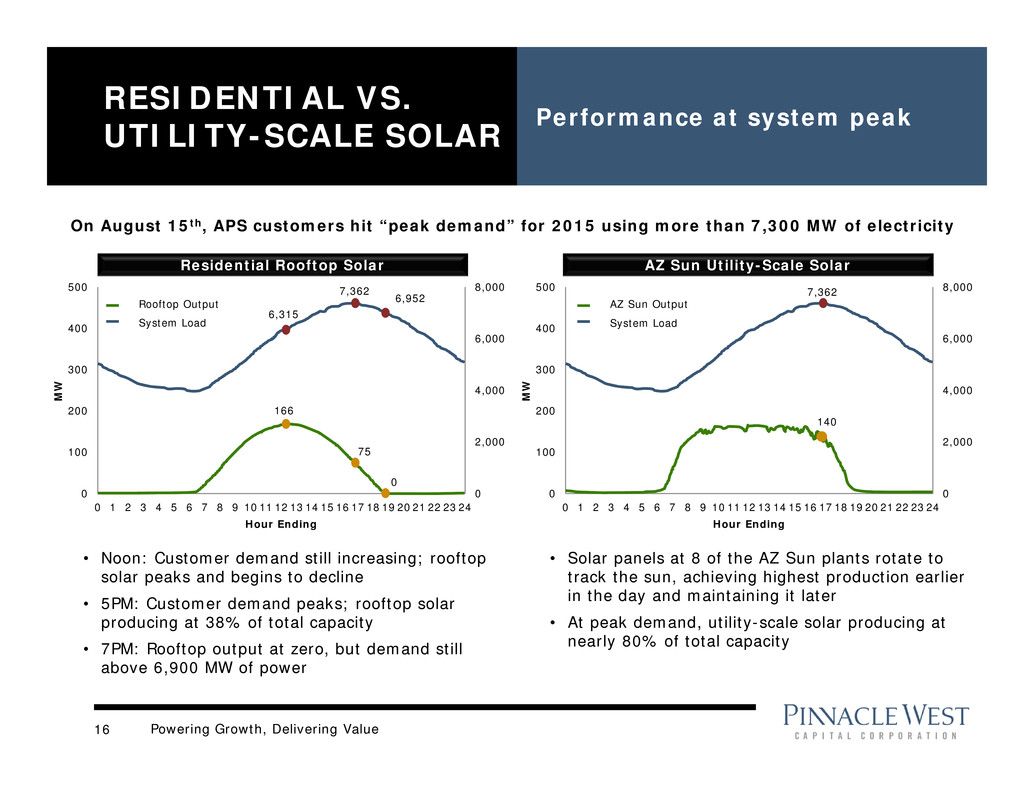
Powering Growth, Delivering Value16 RESIDENTIAL VS. UTILITY-SCALE SOLAR Performance at system peak 0 2,000 4,000 6,000 8,000 0 100 200 300 400 500 0 1 2 3 4 5 6 7 8 9 10 11 12 13 14 15 16 17 18 19 20 21 22 23 24 M W Hour Ending On August 15th, APS customers hit “peak demand” for 2015 using more than 7,300 MW of electricity 0 2,000 4,000 6,000 8,000 0 100 200 300 400 500 0 1 2 3 4 5 6 7 8 9 10 11 12 13 14 15 16 17 18 19 20 21 22 23 24 M W Hour Ending Rooftop Output System Load 6,315 166 7,362 75 6,952 0 AZ Sun Output System Load 7,362 140 • Noon: Customer demand still increasing; rooftop solar peaks and begins to decline • 5PM: Customer demand peaks; rooftop solar producing at 38% of total capacity • 7PM: Rooftop output at zero, but demand still above 6,900 MW of power • Solar panels at 8 of the AZ Sun plants rotate to track the sun, achieving highest production earlier in the day and maintaining it later • At peak demand, utility-scale solar producing at nearly 80% of total capacity Residential Rooftop Solar AZ Sun Utility-Scale Solar
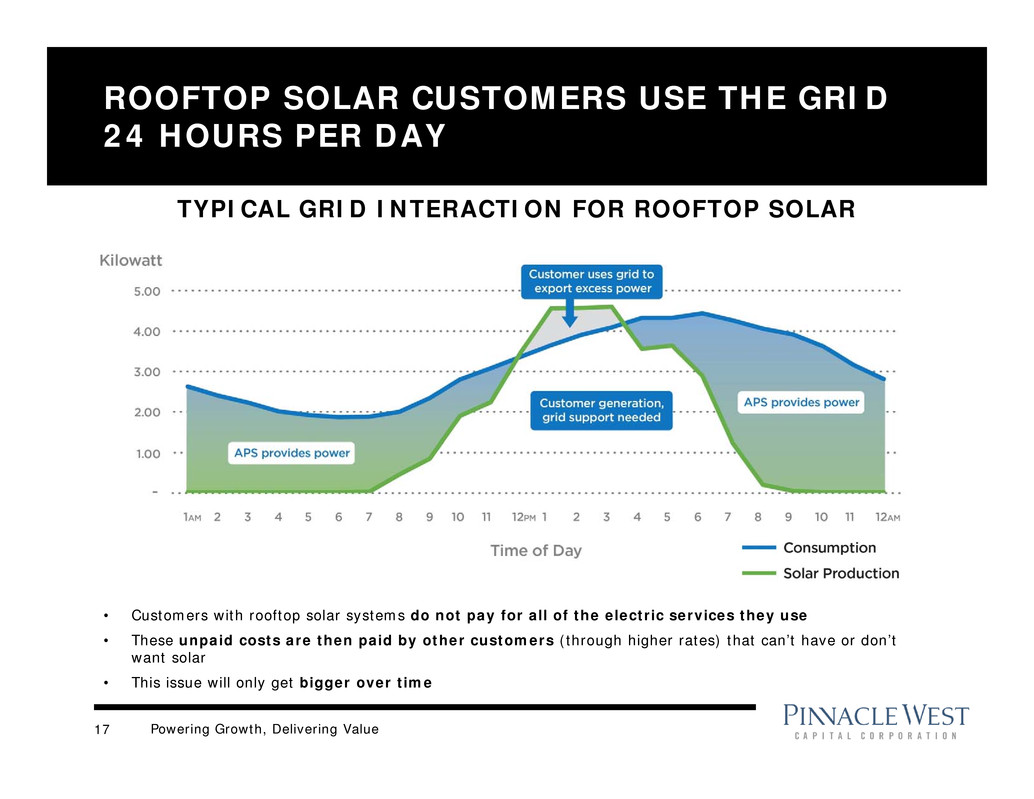
Powering Growth, Delivering Value17 ROOFTOP SOLAR CUSTOMERS USE THE GRID 24 HOURS PER DAY TYPICAL GRID INTERACTION FOR ROOFTOP SOLAR • Customers with rooftop solar systems do not pay for all of the electric services they use • These unpaid costs are then paid by other customers (through higher rates) that can’t have or don’t want solar • This issue will only get bigger over time

Powering Growth, Delivering Value18 Bob Stump (R)* Tom Forese (R) Doug Little (R) Chairman Terms to January 2019Terms to January 2017 Bob Burns (R) Other State Officials Andy Tobin (R) ARIZONA CORPORATION COMMISSION * Term limited - elected to four-year terms (limited to two consecutive terms) ACC Utility Division Director - Tom Broderick RUCO Director - David Tenney

Powering Growth, Delivering Value19 2016 KEY DATES ACC Key Dates Docket # Q1 Q2 Q3 Q4 Key Recurring Regulatory Filings Lost Fixed Cost Recovery E-01345A-11-0224 Jan 15 Transmission Cost Adjustor E-01345A-11-0224 May 15 Renewable Energy Surcharge TBD Jul 1 APS Rate Case E-01345A-16-0036 Jan 29: Notice of Intent Filing Jun 1: Initial filing TBD TBD Resource Planning and Procurement E-00000V-15-0094 Mar 1: Preliminary IRP filed Oct 1: File updates to preliminary IRP* Value and Cost of Distributed Generation E-00000J- 14-0023 Feb 25: DG Methodologies & supporting testimony filed Apr 7: Rebuttal testimony and alternate proposals due Apr 15: Pre-hearing Apr 18: Hearing; Jun 8-9 Hearing Jun 13: Responses Due Jun 20: Initial briefs Jul 8: Reply briefs TBD: ALJ Order ACC Open Meetings - ACC Open Meetings Held Monthly * April 2017: Final IRP due Other Key Dates Docket # Q1 Q2 Q3 Q4 Arizona State Legislature n/a In session Jan 11- May 7 (Adjourned) Elections n/a Aug 30: Primary Nov 8: General All Source Request for Proposal (RFP) n/a Mar 11: RFP Issued Jun 9: Responses Due

Powering Growth, Delivering Value20 ARIZONA ELECTRIC UTILITIES GENERAL RATE CASES UNS Electric (93,000 customers) Docket # E-04204A-15-0142 Application filed May 5, 2015 Direct testimony - ex rate design, cost of service (Nov 6, 2015) Direct testimony - rate design, cost of service (Dec 9, 2015) Rebuttal testimony (Jan 19, 2016) Surrebuttal testimony (Feb 23, 2016) Rejoinder testimony (Feb 29, 2016) Pre-hearing (Feb 26, 2016) Hearing (Mar 1, 2016) Post hearing initial briefs (April 25, 2016) Reply briefs (May 11, 2016) ALJ order expected in July; followed by ACC decision Tucson Electric Power Company (415,000 customers) Docket # E-01933A-15-0322 Application filed Sep 4, 2015 Direct testimony – ex rate design and cost of service (Jun 3, 2016) Direct testimony – rate design and cost of service (Jun 24, 2016) Rebuttal testimony (Jul 25, 2016) Surrebuttal testimony (Aug 18, 2016) Rejoinder testimony (Aug 25, 2016) Pre-hearing (Aug 25, 2016) Hearing (Aug 31, 2016) Sulphur Springs Valley Electric Cooperative (58,000 customers) Docket # E-01575A-15-0312 Application filed Aug 31, 2015 Direct testimony - ex rate design, cost of service (Mar 18, 2016) Direct testimony - rate design, cost of service (Apr 1, 2016) Rebuttal testimony (Apr 15, 2016) Surrebuttal testimony (May 4, 2016) Rejoinder (May 11, 2016) Pre-hearing (May 13, 2016) Hearing (May 17, 2016) Settlement discussions began April 15, 2016 Trico Electric Cooperative (38,000 customers) Docket # E-01461A-15-0363 Application filed Oct 23, 2015 Direct testimony - ex rate design, cost of service (May 4, 2016) Direct testimony - rate design, cost of service (May 25, 2016) Rebuttal testimony (Jun 22, 2016) Surrebuttal testimony (Jul 8, 2016) Rejoinder (Jul 15, 2016) Pre-hearing (Jul 18, 2016) Hearing (Jul 19, 2016)

Powering Growth, Delivering Value21 INVESTOR RELATIONS CONTACTS Paul J. Mountain, CFA General Manager, Investor Relations & Audit Services (602) 250-4952 paul.mountain@pinnaclewest.com Ted Geisler Director, Investor Relations (602) 250-3200 ted.geisler@pinnaclewest.com Chalese Haraldsen (602) 250-5643 chalese.haraldsen@pinnaclewest.com Pinnacle West Capital Corporation P.O. Box 53999, Mail Station 9998 Phoenix, Arizona 85072-3999 Visit us online at: www.pinnaclewest.com
