Attached files
| file | filename |
|---|---|
| 8-K - FORM 8-K - M&T BANK CORP | d189558d8k.htm |
 Deutsche
Bank Global Financial Services Conference
June 1, 2016 Exhibit 99.1 |
| 2 Disclaimer This presentation contains forward- looking statements within the meaning of the Private Securities Litigation Reform Act of
1995 giving M&T Bank Corporation’s (“M&T”) expectations or
predictions of future financial or business performance or conditions.
Forward-looking statements are typically identified by words such as “believe,” “expect,” “anticipate,” “intend,” “target,” “estimate,” “continue,” “positions,” “prospects” or “potential,” by future
conditional verbs such as “will,” “would,”
“should,” “could” or “may”, or by variations of such
words or by similar expressions. These forward-looking statements
are subject to numerous assumptions, risks and uncertainties which change
over time. Forward-looking statements speak only as
of the date they are made and we assume no duty to update forward-looking
statements. Actual results may differ materially from current
projections. Forward-looking statements involve known and unknown
risks and uncertainties. A number of factors, many of which are
beyond M&T’s control, could cause our actual results, events or developments,
or industry results to be materially different from any future results,
events or developments expressed, implied or anticipated by such forward-looking statements and so our business and financial condition and results of operations could be materially and adversely affected. In addition to factors
previously disclosed in M&T’s reports filed with the U.S.
Securities and Exchange Commission (the “SEC”) and those identified elsewhere in this document, the following factors, among others, could cause actual results to differ materially from forward-
looking statements or historical performance: difficulties and delays in integrating
the M&T and Hudson City businesses or fully realizing cost savings
and other benefits; business disruption following the merger; changes in asset quality and credit risk; the inability to sustain revenue and earnings growth; changes in interest rates and capital markets; inflation; customer acceptance
of M&T products and services; customer borrowing, repayment, investment and deposit
practices; customer disintermediation; the introduction, withdrawal,
success and timing of business initiatives; competitive pressures; the inability to realize cost savings or revenues or to implement integration plans and other consequences associated with mergers, acquisitions and
divestitures; general economic conditions and weakening in the economy; deteriorating
credit quality; political developments, wars or other hostilities may
disrupt or increase volatility in securities markets or other economic conditions; changes in accounting policies or procedures; significant litigation; and the impact, extent and timing of technological changes, capital
management activities, and other actions of the Federal Reserve Board and other
legislative and regulatory actions and reforms.
Annualized, pro forma, projected and estimated numbers are used for illustrative
purpose only, are not forecasts and may not reflect actual
results. |
 3 Who is M&T Bank Corporation? Top 20 US-based commercial bank holding company Have grown substantially from $2 billion in assets in 1983 to $125 billion at March 31, 2016 17,153 employees across 808 domestic branches in eight states and Washington DC 3.8 million customers representing 6.0 million accounts $73 billion of assets under management 1 Lowest percentage credit losses among the large money-center / superregional
banks through the financial crisis
1 of only 2 commercial banks (out of 20) in S&P 500 not to reduce
dividend M&T has not posted a loss going back to 1976
– 159 quarters
All data as of first quarter 2016. (1) Includes affiliated manager. |
 4 M&T’s Operating Model Long-tenured management team and workforce Consistent credit culture Focus on operating leverage / efficiency Disciplined capital allocation and acquisitions Opportunistic growth Low credit and earnings volatility Outperformance in stressed environments Consistent capital generation Consistent Operating Model Results Superior Long-Term Performance |
 5 M&T Talent and Leadership M&T’s 14-member Management Group averages 25 years of service Average 11 years on Management Group Deep experience integrating deals with 24 mergers over last 28 years, including
11 thrifts Generally develop general manager talent in-house Two executive training programs in place for over 30 years; recruited 1,859 graduates
Actively complement with external hires having industry expertise
Bank-wide, M&T’s employee tenure averages 10.4 years –
more than twice that of
the financial services industry
Our depth of talent is a key competitive advantage |
 6 Key Metrics (1) The Efficiency Ratio and Pre-tax, Pre-provision Net Revenue are non-GAAP financial measures. A reconciliation of GAAP to
non-GAAP financial measures is available in the appendix.
(2) Excludes merger-related gains and expenses and amortization expense associated with intangible assets. Tangible common equity and tangible
asset calculations are available in the appendix.
(3) Years prior to 2011 not restated for change of accounting policy for LIHTC (4) Annual and quarterly PPNR to Risk Weighted Assets calculated using average of quarterly reported RWA balances
2010 2011 2012 2013 2014 2015 1Q'15 1Q'16 Superior Pre-Credit Earnings Net Interest Margin 3.84% 3.73% 3.73% 3.65% 3.31% 3.14% 3.17% 3.18% Net Operating Efficiency Ratio (1)(3) 53.71% 59.49% 55.28% 55.98% 59.29% 57.98% 61.46% 57.00% PPNR (1)(3) 1,461 1,531 1,796 1,951 1,766 1,845 413 517 PPNR to RWA (1)(3)(4) 2.28% 2.26% 2.43% 2.61% 2.35% 2.14% 2.28% 2.20% Strong Credit Metrics Allowance to Loans (As At) 1.74% 1.51% 1.39% 1.43% 1.38% 1.09% 1.37% 1.10% Net Charge-Offs to Loans 0.67% 0.47% 0.30% 0.28% 0.19% 0.19% 0.22% 0.19% Focused on Returns Net Operating Return on: Tangible Assets (1) (2) 1.17% 1.26% 1.40% 1.47% 1.23% 1.18% 1.08% 1.09% Tangible Common Equity (1) (2) 18.95% 17.96% 19.42% 17.79% 13.76% 13.00% 11.90% 11.62% Consistent Capital Generation Tangible Common Equity to Tangible Assets 6.19% 6.40% 7.20% 8.39% 8.11% 8.69% 8.17% 8.71% Tier 1 Common Capital Ratio 6.51% 6.86% 7.57% 9.22% 9.83% 11.26% 9.99% 11.28% Common Equity Tier 1 Ratio NA NA NA NA NA 11.08% 9.78% 11.06% Tier 1 Capital Ratio 9.47% 9.67% 10.22% 12.00% 12.47% 12.68% 11.68% 12.35% Balance Sheet (As At) Loans to Deposits 104.39% 101.18% 101.46% 95.46% 90.60% 95.14% 91.17% 93.27% Securities to Assets 10.51% 9.85% 7.32% 10.33% 13.44% 12.75% 14.63% 12.41% |
 7 M&T’s Business Model – a Historical Perspective Years prior to 2011 not restated for LIHTC. Refer to appendix for peer group list and GAAP reconciliation. 57.00% 68.21% 61.96% 53.71% 40% 45% 50% 55% 60% 65% 70% 75% 80% 85% Net Operating Efficiency Ratio % MTB Peer Maximum Peer Median Peer Minimum 2.20% 2.80% 1.86% 1.32% 0.0% 1.0% 2.0% 3.0% 4.0% 5.0% 6.0% PPNR to RWA% MTB Peer Maximum Peer Median Peer Minimum 11.62% 17.76% 11.03% 3.48% -30% -20% -10% 0% 10% 20% 30% 40% 50% Return on Tangible Common Equity % MTB Peer Maximum Peer Median Peer Minimum 3.18% 3.43% 3.05% 2.75% 2.0% 2.5% 3.0% 3.5% 4.0% 4.5% 5.0% 5.5% 6.0% Net Interest Margin % MTB (SNL) Peer Maximum Peer Median Peer Minimum |
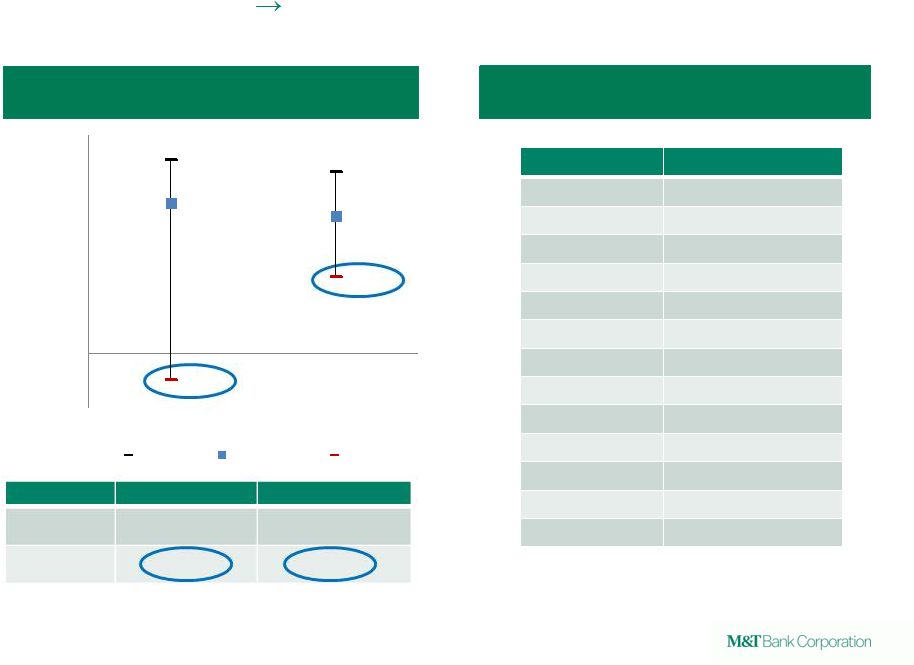 8 Low-Volatility Model Low Cost of Capital Return on Average Tangible Assets 25 Years (1991-2015) Relative Cost of Capital 10 Year Beta Average Peers MTB Median 1.38% 1.27% Volatility (Std Deviation) 0.44% 0.25% 1.78% 1.67% 1.38% 1.27% -0.23% 0.71% -0.5% 0.0% 0.5% 1.0% 1.5% 2.0% Peer Median MTB Max Median Min Company Beta 1 Peer 1 1.57 Peer 2 1.51 Peer 3 1.48 Peer 4 1.46 Peer 5 1.45 Peer 6 1.45 Peer Median 1.45 Peer 7 1.34 Peer 8 1.33 Peer 9 1.24 Peer 10 1.23 MTB 1.11 Peer 11 1.10 Source: SNL Interactive, Regulatory and GAAP filings. Refer to appendix for peer group list and GAAP reconciliation. (1) Daily stock price beta over a 250 trading day holding period versus the S&P 500. |
 9 Outperformance Through the Credit Cycle Source: SNL Interactive, Regulatory and GAAP filings, Recession periods as defined by the National Bureau of Economic Research.
(1) Top 25 publicly traded commercial banks each year. 2009 Excludes
First Republic Bank. NCOs/Loans
MTB Top 25 Median MTB Advantage 25 Year Average 0.38% 0.82% 0.43% Recessions 3Q90-1Q91 0.39% 1.30% 0.91% 1Q01-4Q01 0.31% 0.62% 0.31% 4Q07-2Q09 0.79% 1.47% 0.68% 1 0.00% 0.25% 0.50% 0.75% 1.00% 1.25% 1.50% 1.75% 2.00% 2.25% 2.50% 2.75% 3.00% NCOs / Average Loans Recessions MTB Top 25 Median |
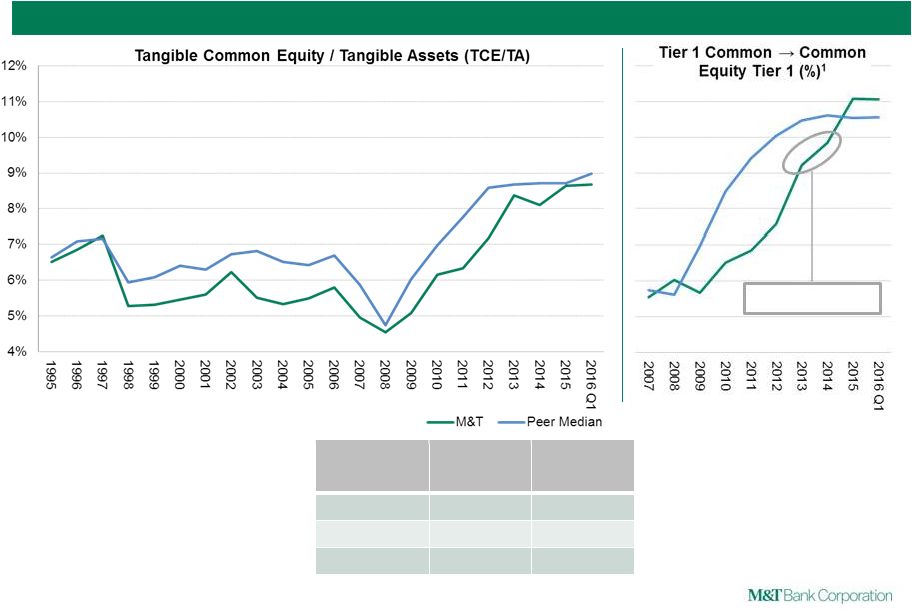 Historically Efficient Capital Structure Aligned With Risk Profile
Tangible and Regulatory Capital
Source: SNL Interactive and Regulatory Filings.
(1) For periods prior to 2015, reflects the Tier 1 Common ratio calculated under
previous Basel rules. TCE/TA
20-Year Average 3/31/16 MTB 6.2% 8.7% Peer Median 6.9% 9.0% Difference (0.7%) (0.3%) 11.1% 10.6% CCAR 2014 & 2015 10 |
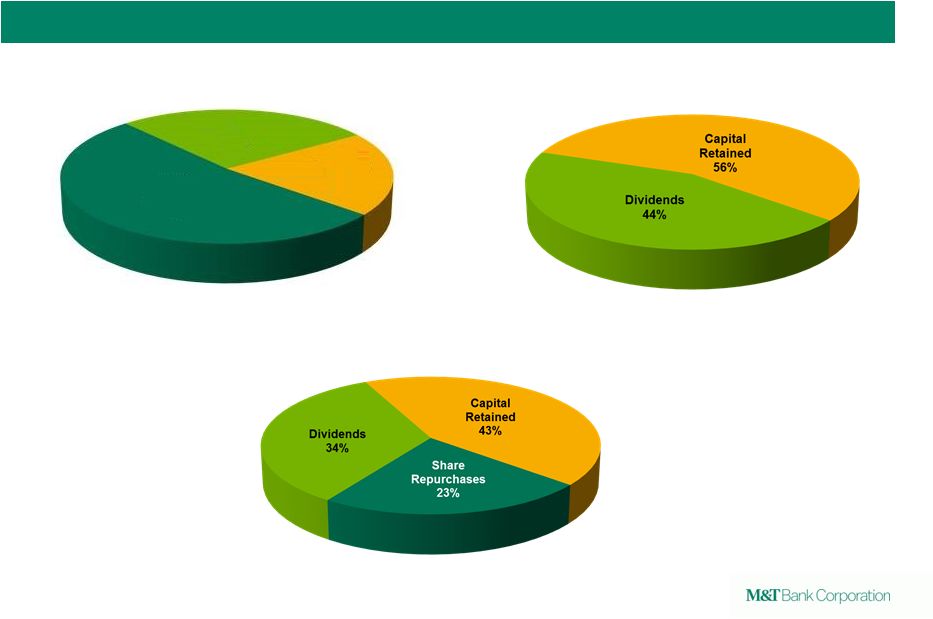 11 Cumulative Capital Retained, Dividends and Share Repurchases Deploying Capital Where and When it Makes Sense 5 Years 2003 - 2007 8 Years 2008 - 2015 30 Years 1986 – 2015 Calculated using Net Operating Income – see appendix. Share Repurchases 52% Dividends 28% Capital Retained 20% |
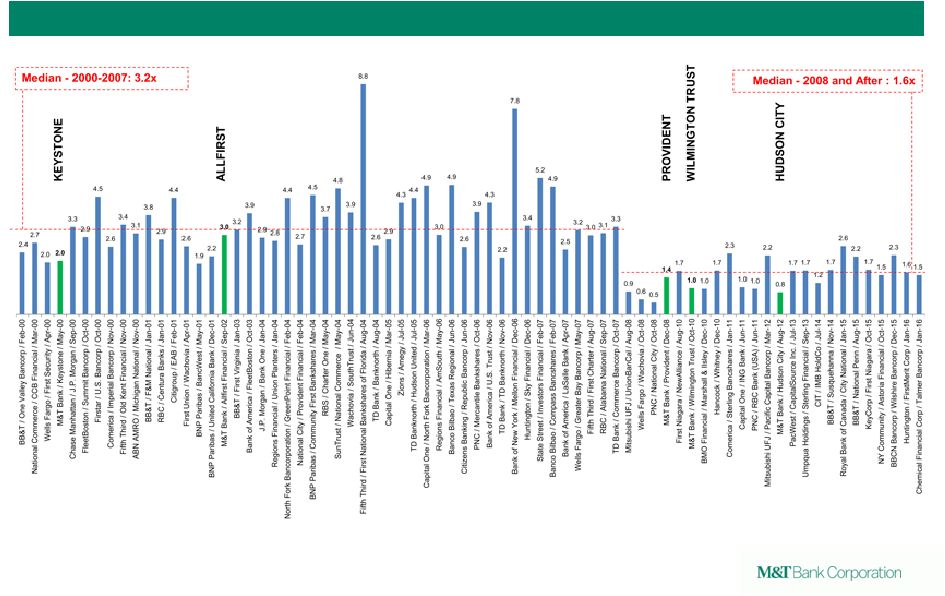 12 M&T’s acquisitions vs. bank deals greater than $1B since 2000: Deal value / TCE
Disciplined Approach to Acquisitions
Source: SNL Financial, Company Filings
Deal value at announcement and tangible common equity at most recent quarter before
announcement. Although M&T’s acquisitions of Provident and
Wilmington were both less than $1.0 billion in deal value, they have been included for reference. |
  13 Strategic Focus: Disciplined Growth and Capital Efficiency Consistent Credit Culture Sustaining credit discipline Focus on Operating Leverage / Efficiency Technology investments for growth and efficiency Potential upside from asset sensitive balance sheet Disciplined Capital Allocation Capital structure optimization – deploy excess capital Investments in franchise Dividends Repurchases Acquisitions? Opportunistic Growth Building commercial bank in New Jersey Capitalize on market disruption Prudent management of shareholders’ capital (investment or distribution) remains at the core of M&T’s operating philosophy |
 14 18.3% Annual rate of return since 1980 1 In the top 30 of the entire universe 2 of U.S. based stocks traded publicly since 1980 M&T Bank Corporation…a solid investment (1) CAGR calculated assuming reinvestment of dividends through March 31, 2016 (2) Includes 591 U.S. based publicly traded stocks Rank Company Name Industry Annual Return 1 L Brands, Inc. Consumer Discretionary 23.4 2 Eaton Vance Corp. Financials 22.9 3 TJX Companies, Inc. Consumer Discretionary 22.5 4 Hasbro, Inc. Consumer Discretionary 22.1 5 Stryker Corporation Health Care 22.0 6 Mylan N.V. Health Care 21.2 7 Valspar Corporation Materials 21.1 8 Gap, Inc. Consumer Discretionary 21.0 9 Progressive Corporation Financials 21.0 10 Wal-Mart Stores, Inc. Consumer Staples 20.0 11 Sherwin-Williams Company Materials 19.9 12 Danaher Corporation Industrials 19.8 13 Berkshire Hathaway Inc. Class A Financials 19.6 14 Equifax Inc. Industrials 19.6 15 Robert Half International Inc. Industrials 19.2 16 Walgreens Boots Alliance Inc Consumer Staples 19.2 17 State Street Corporation Financials 19.1 18 Astronics Corporation Industrials 19.0 19 Constellation Brands, Inc. Class B Consumer Staples 19.0 20 V.F. Corporation Consumer Discretionary 19.0 21 Lowe's Companies, Inc. Consumer Discretionary 18.9 22 HollyFrontier Corporation Energy 18.9 23 Graco Inc. Industrials 18.8 24 Flowers Foods, Inc. Consumer Staples 18.7 25 Aflac Incorporated Financials 18.7 26 RLI Corp. Financials 18.7 27 Church & Dwight Co., Inc. Consumer Staples 18.6 28 M&T Bank Corporation Financials 18.3 29 Helen of Troy Limited Consumer Discretionary 17.8 30 Sysco Corporation Consumer Staples 17.8 $2,251 invested in M&T in 1980 would be worth $1 million as of today |
 15 Appendix and GAAP Reconciliations |
 16 Reconciliation of GAAP and Non-GAAP Measures (1) Years prior to 2011 not restated for change of accounting policy for LIHTC Net Income 2010 2011 2012 2013 2014 2015 1Q15 1Q16 $ in millions Net income $736.2 $859.5 $1,029.5 $1,138.5 $1,066.2 $1,079.7 $241.6 $298.5 Intangible amortization* 35.3 37.6 37.0 28.6 20.7 16.2 4.2 7.5 Merger-related items* (16.3) (12.8) 6.0 7.5 - 60.8 - 14.0 Net operating income $755.2 $884.3 $1,072.5 $1,174.6 $1,086.9 $1,156.6 $245.8 $320.1 PPNR (1) Net Income for EPS $675.9 $781.8 $953.4 $1,062.5 $978.6 $978.7 $218.8 $275.7 Preferred Div., Amort. of Pref. Stock & Unvested Stock Awards $60.3 $77.7 $76.1 $75.9 $87.7 $92.0 $22.8 $22.8 Income Taxes $356.6 $401.3 $562.5 $627.1 $576.0 $595.0 $133.8 $169.3 GAAP Pre-tax Income $1,092.8 $1,260.8 $1,592.0 $1,765.6 $1,642.2 $1,674.7 $375.4 $467.8 Provision for credit losses 368.0 270.0 204.0 185.0 124.0 170.0 38.0 49.0 Pre-Tax, Pre-Provision Income $1,460.8 $1,530.8 $1,796.0 $1,950.6 $1,766.2 $1,844.7 $413.4 $516.8 Earnings Per Share Diluted earnings per share $5.69 $6.35 $7.54 $8.20 $7.42 $7.18 $1.65 $1.73 Intangible amortization* 0.29 0.30 0.29 0.22 0.15 0.12 0.03 0.05 Merger-related items* (0.14) (0.10) 0.05 0.06 - 0.44 - 0.09 Diluted net operating earnings per share $5.84 $6.55 $7.88 $8.48 $7.57 $7.74 $1.68 $1.87 Efficiency Ratio (1) $ in millions Non-interest expenses $1,914.8 $2,441.9 $2,469.8 $2,587.9 $2,689.5 $2,822.9 $686.4 $776.1 less: intangible amortization 58.1 61.6 60.6 46.9 33.8 26.4 6.8 12.3 less: merger-related expenses 0.8 83.7 9.9 12.4 - 76.0 - 23.2 Non-interest operating expenses $1,856.0 $2,296.6 $2,399.2 $2,528.6 $2,655.7 $2,720.5 $679.6 $740.6 Tax equivalent revenues $3,399.6 $3,998.6 $4,292.2 $4,563.4 $4,479.4 $4,692.1 $1,105.6 $1,299.2 less: gain/(loss) on sale of securities 2.8 150.2 0.0 56.5 - (0.1) (0.10) 0.00 less: net OTTI losses recognized (86.3) (77.0) (47.8) (9.8) - - - - less: merger-related gains 27.5 64.9 - - - - - - Denominator for efficiency ratio $3,455.6 $3,860.5 $4,340.0 $4,516.7 $4,479.4 $4,692.2 $1,105.7 $1,299.2 Net operating efficiency ratio 53.7% 59.5% 55.3% 56.0% 59.3% 58.0% 61.5% 57.0% *Net of tax |
 17 Reconciliation of GAAP and Non-GAAP Measures Average Assets 2010 2011 2012 2013 2014 2015 1Q15 1Q16 $ in millions Average assets 68,380 $ 73,977 $ 79,983 $ 83,662 $ 92,143 $ 101,780 $ 95,892 $ 123,252 $ Goodwill (3,525) (3,525) (3,525) (3,525) (3,525) (3,694) (3,525) (4,593) Core deposit and other intangible assets (153) (168) (144) (90) (50) (45) (31) (134) Deferred taxes 29 43 42 27 15 16 10 52 Average tangible assets 64,731 $ 70,327 $ 76,356 $ 80,074 $ 88,583 $ 98,057 $ 92,346 $ 118,577 $ Average Common Equity $ in millions Average common equity 7,367 $ 8,207 $ 8,834 $ 9,844 $ 10,905 $ 11,996 $ 11,227 $ 15,047 $ Goodwill (3,525) (3,525) (3,525) (3,525) (3,525) (3,694) (3,525) (4,593) Core deposit and other intangible assets (153) (168) (144) (90) (50) (45) (31) (134) Deferred taxes 29 43 42 27 15 16 10 52 Average tangible common equity 3,718 $ 4,557 $ 5,207 $ 6,256 $ 7,345 $ 8,273 $ 7,681 $ 10,372 $ |
| 18 BB&T Corporation M&T Bank Corporation PNC Financial Services Group, Inc. Comerica Incorporated Regions Financial Corporation Fifth Third Bancorp Wells Fargo & Company SunTrust Banks, Inc. Huntington Bancshares Incorporated Zions Bancorporation KeyCorp M&T Peer Group U.S. Bancorp |