Attached files
| file | filename |
|---|---|
| 8-K - FORM 8-K - FIFTH THIRD BANCORP | d176006d8k.htm |
 Deutsche
Bank Global Financial Services Conference
Greg D. Carmichael President & Chief Executive Officer June 1, 2016 Refer to earnings release dated April 21, 2016, and Form 10-Q for the quarter
ended March 31, 2016 for further information
Fifth Third Bancorp | All Rights Reserved
Exhibit 99.1 |
 Cautionary
statement 2
Fifth Third Bancorp | All Rights Reserved
This presentation contains statements that we believe are “forward-looking
statements” within the meaning of Section 27A of the Securities Act of 1933, as amended, and Rule 175 promulgated thereunder, and Section 21E of the Securities Exchange Act of 1934, as amended, and Rule 3b-6 promulgated
thereunder. These statements relate to our financial condition, results
of operations, plans, objectives, future performance or business. They usually can be identified by the use of forward-looking language such as “will likely result,” “may,” “are expected to,”
“anticipates,” “potential,” “estimate,” “forecast,” “projected,” “intends to,” or may include other similar words or phrases such as “believes,” “plans,” “trend,”
“objective,” “continue,” “remain,” or similar expressions, or future or conditional verbs such as “will,” “would,” “should,” “could,” “might,” “can,” or
similar verbs. You should not place undue reliance on these statements, as they are subject to risks and uncertainties, including but not limited to the risk factors set forth in our most recent Annual Report on Form 10-K
as updated from time to time by our Quarterly Reports on Form 10-Q.
When considering these forward-looking statements, you should keep in mind these risks and uncertainties, as well as any cautionary statements we may make. Moreover, you should treat these statements as speaking only as of the date they are made and
based only on information then actually known to us. There is a risk that
additional information may become known during the company’s quarterly closing process or as a result of subsequent events that could affect the accuracy of the statements and financial information contained herein. There are a number of important factors that could cause future results to differ materially from historical performance and these
forward-looking statements. Factors that might cause such a
difference include, but are not limited to: (1) general economic or real estate market conditions, either nationally or in the states in which Fifth Third, one or more acquired entities and/or the combined company do business, weaken or are less favorable than expected; (2)
deteriorating credit quality; (3) political developments, wars or other
hostilities may disrupt or increase volatility in securities markets or other economic conditions; (4) changes in the interest rate environment reduce interest margins; (5) prepayment speeds, loan origination and sale volumes, charge-offs and
loan loss provisions; (6) Fifth Third’s ability to maintain required
capital levels and adequate sources of funding and liquidity; (7) maintaining capital requirements and adequate sources of funding and liquidity may limit Fifth Third’s operations and potential growth; (8) changes and trends in capital
markets; (9) problems encountered by larger or similar financial
institutions may adversely affect the banking industry and/or Fifth Third; (10) competitive pressures among depository institutions increase significantly; (11) effects of critical accounting policies and judgments; (12) changes in accounting policies or
procedures as may be required by the Financial Accounting Standards Board
(FASB) or other regulatory agencies; (13) legislative or regulatory changes or actions, or significant litigation, adversely affect Fifth Third, one or more acquired entities and/or the combined company or the businesses in which Fifth Third, one
or more acquired entities and/or the combined company are engaged,
including the Dodd-Frank Wall Street Reform and Consumer Protection Act; (14) ability to maintain favorable ratings from rating agencies; (15) fluctuation of Fifth Third’s stock price; (16) ability to attract and retain key personnel;
(17) ability to receive dividends from its subsidiaries; (18) potentially
dilutive effect of future acquisitions on current shareholders’ ownership of Fifth Third; (19) effects of accounting or financial results of one or more acquired entities; (20) difficulties from Fifth Third’s investment in, relationship with, and nature of the
operations of Vantiv, LLC; (21) loss of income from any sale or potential
sale of businesses (22) difficulties in separating the operations of any branches or other assets divested; (23) inability to achieve expected benefits from branch consolidations and planned sales within desired timeframes, if at all; (24) ability to secure confidential
information and deliver products and services through the use of computer
systems and telecommunications networks; and (25) the impact of reputational risk created by these developments on such matters as business generation and retention, funding and liquidity. You also should refer to our periodic and current
reports filed with the Securities and Exchange Commission, or
“SEC,” for further information on other factors, which could cause actual results to be significantly different from those expressed or implied by these forward-looking statements. This presentation also includes certain non-GAAP financial measures including "pre-provision net revenue" or "PPNR,”
“adjusted efficiency ratio,” “core return on average
tangible common equity." Management believes these measures may assist investors, analysts and regulators in analyzing our financials. Although we have procedures in place to ensure that these measures are calculated using the appropriate GAAP or regulatory components, they have
limitations as analytical tools and should not by considered in
isolation, or as a substitute for analysis of results under GAAP. For more information regarding these measures and to view reconciliations to the most comparable GAAP measures, please refer to the Appendix to this presentation. |
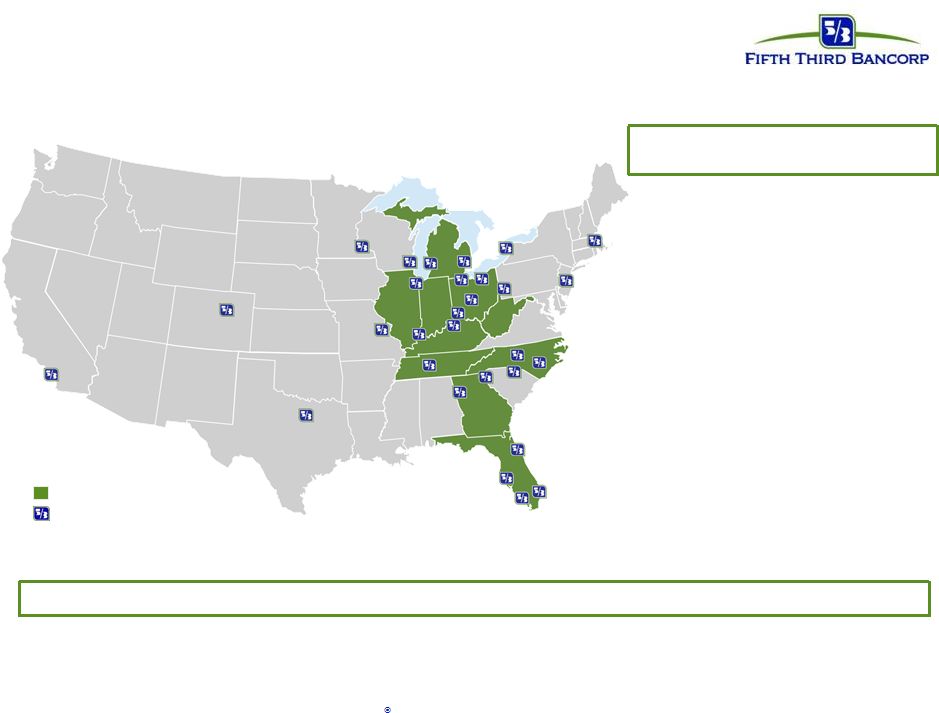 3 Fifth Third Bancorp | All Rights Reserved Top 10 National Commercial and Consumer Bank #8 Equipment Finance Treasury Management #8 #9 Commercial & Industrial Loans Well-positioned franchise and focused footprint #7 #10 Non-Captive Prime Auto Originator 5 Retail Bank 4 In footprint markets National commercial hub cities Source: 1The 2014 Monitor 100, 2E&Y 2015 Cash Management Services Surveys, 3SNL Financial - regulatory filing as of Q1 2016, 4Oliver
Wyman 2015 Survey of Consumers, and 5Experian Auto Count US States
originations in units 2016 through 03/31/2016 1 2 3 Ranked 2nd in J.D. Power 2015 U.S. Primary Mortgage Origination Satisfaction Study |
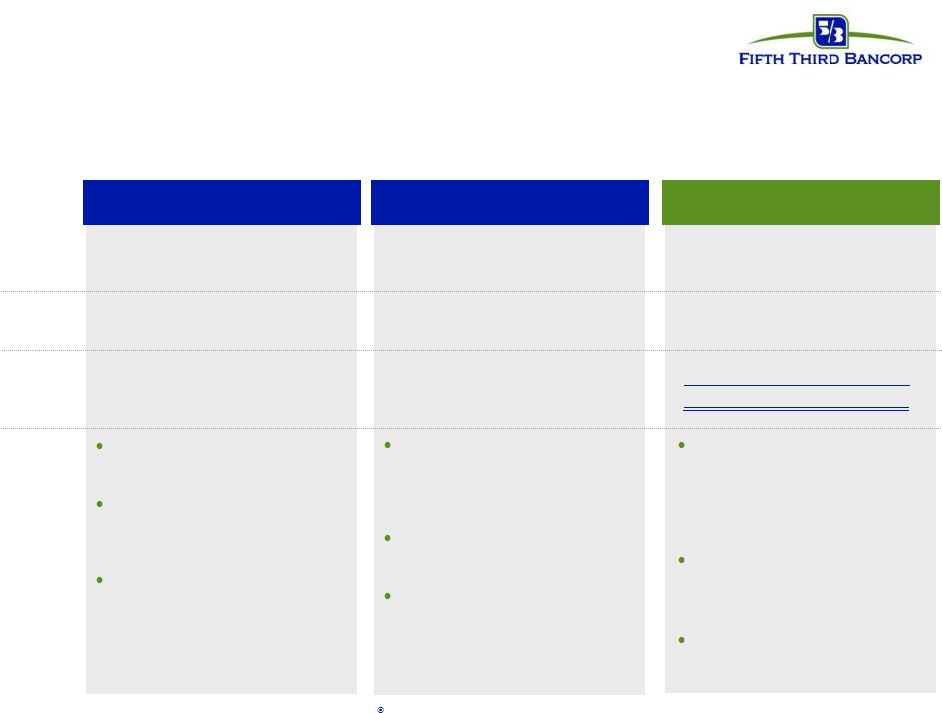
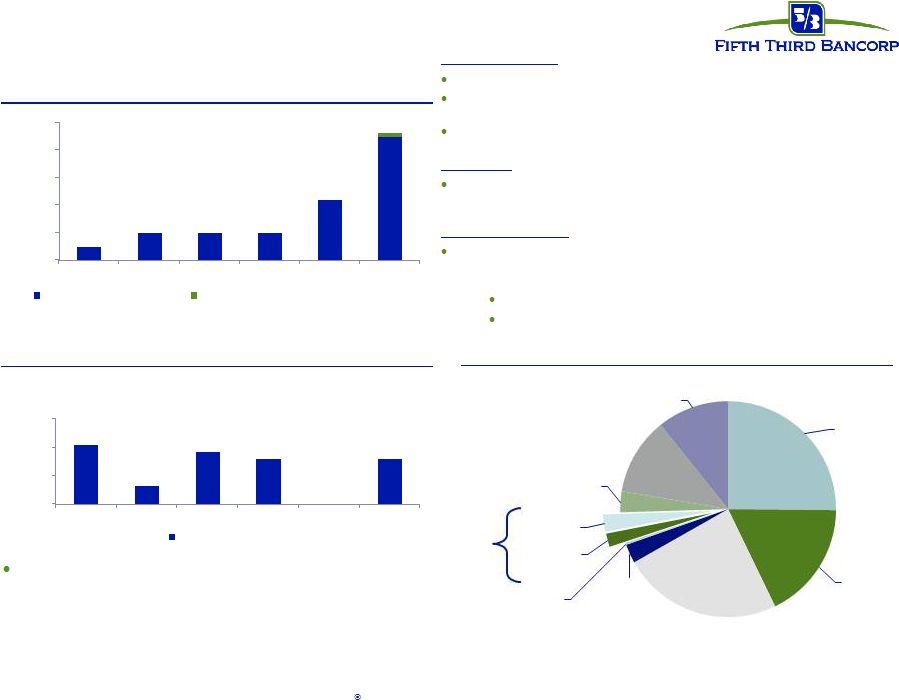
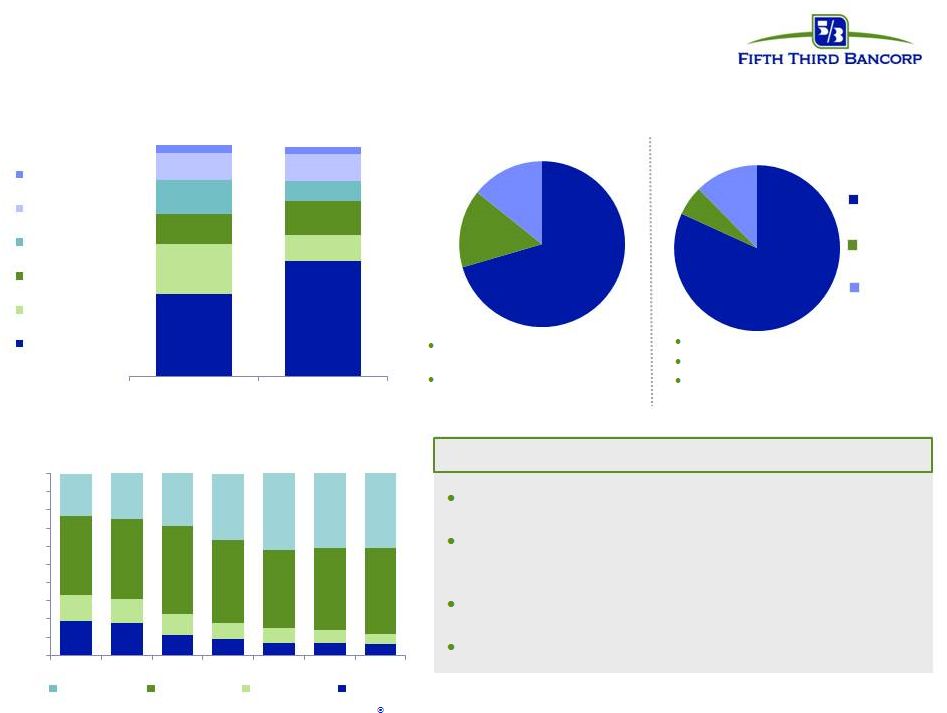 We are a
very different bank now than we were pre-crisis
Reduced exposure to commercial real estate
Significant improvement in commercial loan credit
profile Exited the mortgage broker business Greater mix of stable core deposits Better Balance Sheet Positioning Loan Portfolio Composition Core Deposits Funding and Liquidity Composition Heavily-reliant on overnight borrowings ~40% of wholesale borrowings matured within 90 days Short-term Borrowing Long-term Borrowing Commercial Portfolio Distribution by Probability of Default (PD) PD 1-5 PD 6-8 PD 9 PD 10-13 Strong core deposit base Limited reliance short term borrowings LCR at 118%, in excess of fully implemented LCR requirement 19% 18% 11% 9% 7% 7% 6% 14% 13% 12% 9% 8% 7% 6% 43% 44% 48% 45% 43% 45% 47% 23% 25% 29% 36% 42% 41% 41% 0% 10% 20% 30% 40% 50% 60% 70% 80% 90% 100% 2010 2011 2012 2013 2014 2015 1Q16 36% 50% 22% 11% 13% 15% 15% 9% 11% 12% 3% 3% 4Q07 1Q16 Other Consumer Auto Loans Home Equity Resi Mortgage Commercial Real Estate C&I + Commercial Lease 82% 6% 12% 1Q 2016 70% 15% 14% 4Q 2007 4 Fifth Third Bancorp | All Rights Reserved |
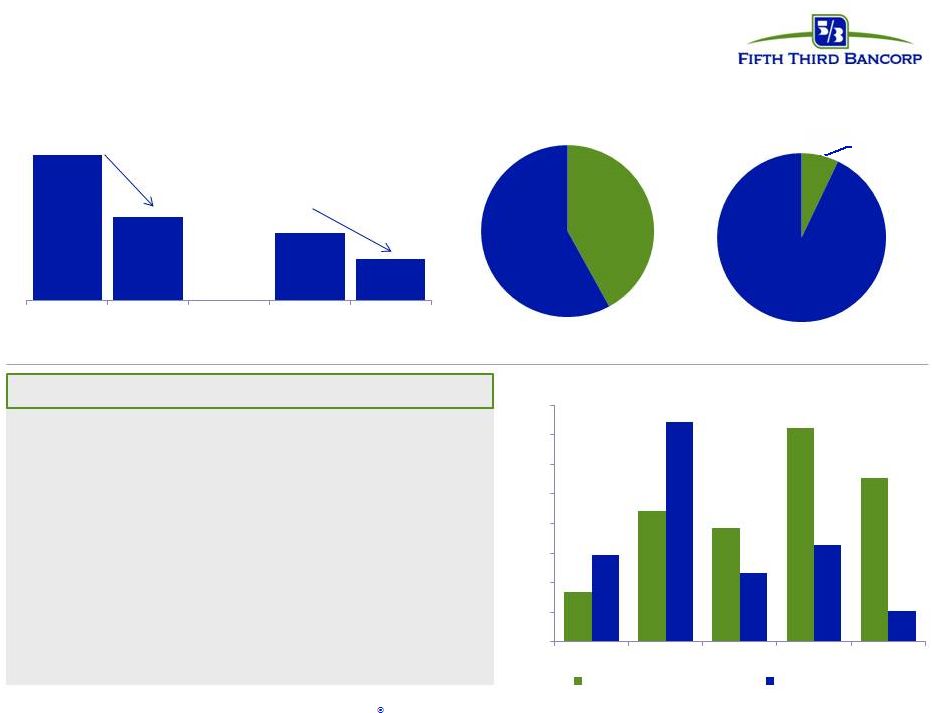 Lower CRE
balances and limited energy exposure
Non-owner Occupied Portfolio Distribution ($MM)
CRE Balances ($MM) Construction Mortgage 1Q 2016 - Limited Energy Exposures $11,862 $6,864 $5,561 $3,428 4Q07 1Q16 4Q07 1Q16 -42% -38% Residential & Land $4,513 Other $6,242 4Q 2007 Other $6,044 $170 $443 $385 $722 $552 $294 $742 $232 $327 $105 $0 $100 $200 $300 $400 $500 $600 $700 $800 OFS RBL Oil & Gas Midstream Refining Total Energy Exposure ($MM) Unfunded Commitments Outstandings 5 Fifth Third Bancorp | All Rights Reserved • Energy balances stable at $1.7B – Total unfunded commitments of $2.3B • 76% of total energy loans outstanding are SNCs • $9.2MM charge-offs in OFS (oil field services) • $168MM increase in NPAs sequentially; predominantly RBL (reserve-based lending) – All RBLs current on interest and well-collateralized • Reserves of 6.20% of funded loans, up from 4.75% in 4Q15 Residential & Land $462 1Q 2016 |
 1Q16:
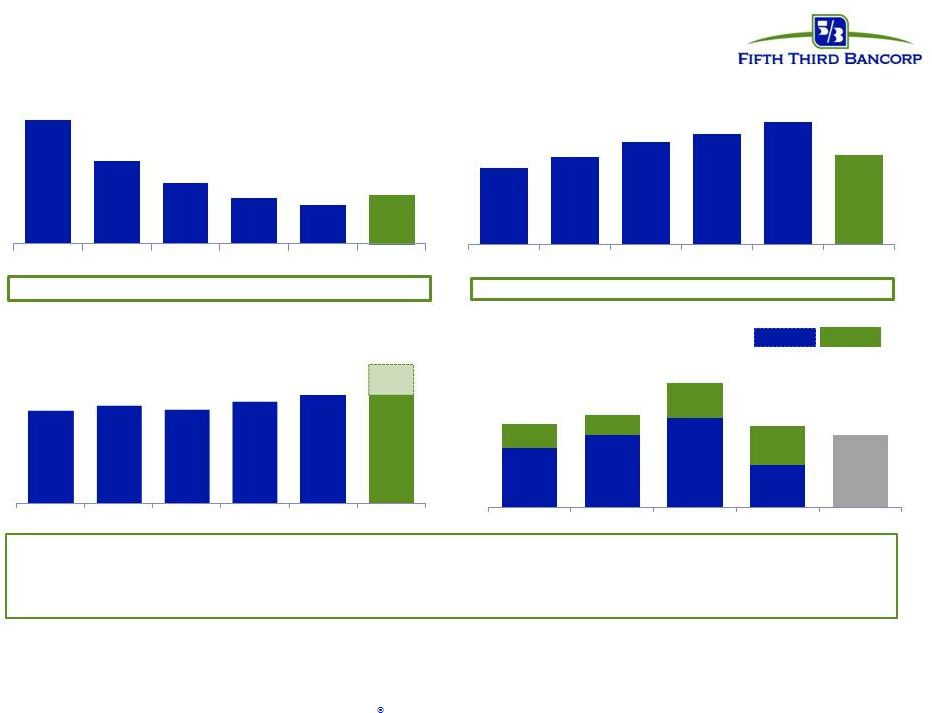
excluding energy, ALLL/NPLs would have been 234% Solid balance sheet
positioning Nonperforming asset ratio
Common Equity Tier 1 Ratio
ALLL / NPLs 1 Excludes $1.56BN in energy loans & leases ($1.7BN total balances including operating leases)
2 Tier 1 Common from 2011-2014; Common Equity Tier 1 (CET1) for 2015 and 1Q16; CET1 shown on transition basis (U.S. GAAP).
3 Adjusted CET1 ratio includes unrealized after-tax Vantiv position as of 3/31/16. [{($53.88 Vantiv stock price x 35M shares) less the carrying
value of Vantiv of $373M] x 0.65 ] / Risk-Weighted Assets. Assumes no share buyback from Vantiv sales. 4 Leverage ratio minimum represents well-capitalized minimum; no Basel III buffered minimum applies.
5 This ratio has been included herein to facilitate a greater understanding of the Bancorp's capital structure and financial condition. See the
Regulation G Non-GAAP Reconciliation table for a reconciliation of these ratios to U.S. GAAP. • Strong Common Equity Tier 1 ratio above targets and requirements • Significantly increased the quantity and quality of capital since the crisis • Problem assets well-contained (excluding energy, NPAs would be at lowest levels since before the crisis)
Capital ratios Basel III buffered minimum Excess over minimum 1Q16: excluding energy, the NPA ratio would have been 0.69% 5 10.6% 4 2.23% 1.49% 1.10% 0.82% 0.70% 0.88% 2011 2012 2013 2014 2015 1Q16 9.4% 9.5% 9.5% 9.7% 9.8% 9.8% 2011 2012 2013 2014 2015 1Q16 157% 180% 211% 228% 252% 185% 2011 2012 2013 2014 2015 1Q16 7.0% 8.5% 10.5% 5.0% 2.8% 2.4% 4.2% 4.6% 8.6% CET1 Tier 1 Total Leverage TCE 9.8% 10.9% 14.7% 9.6% 6 Fifth Third Bancorp | All Rights Reserved 1 1 2 3 |
 Focused on
generating attractive returns through the cycle
• Simplifying and enhancing value proposition of our product offerings • Leveraging innovation, partnerships, and select non-bank acquisitions to develop and deploy new products and solutions • Accelerating growth in assets with higher capital returns Key Areas of Focus Stability Growth Profitability • Focusing on key industry verticals and de-emphasizing lower ROE businesses • Making strategic investments to drive higher returns • Growing fee-based revenues (Treasury Management fees, insurance revenue, M&A Advisory) • Maintaining balance sheet strength – Strong liquidity (LCR well in-excess of fully-phased requirements) – Capital levels remain strong even under 2015 Fed Severe scenario 1 • Conservative underwriting used to target lower credit losses through the cycle 1 Capital ratio strength refers to CCAR 2015 results; CCAR 2016 results to be disclosed by the Federal Reserve by June 30, 2016.
7 Fifth Third Bancorp | All Rights Reserved |
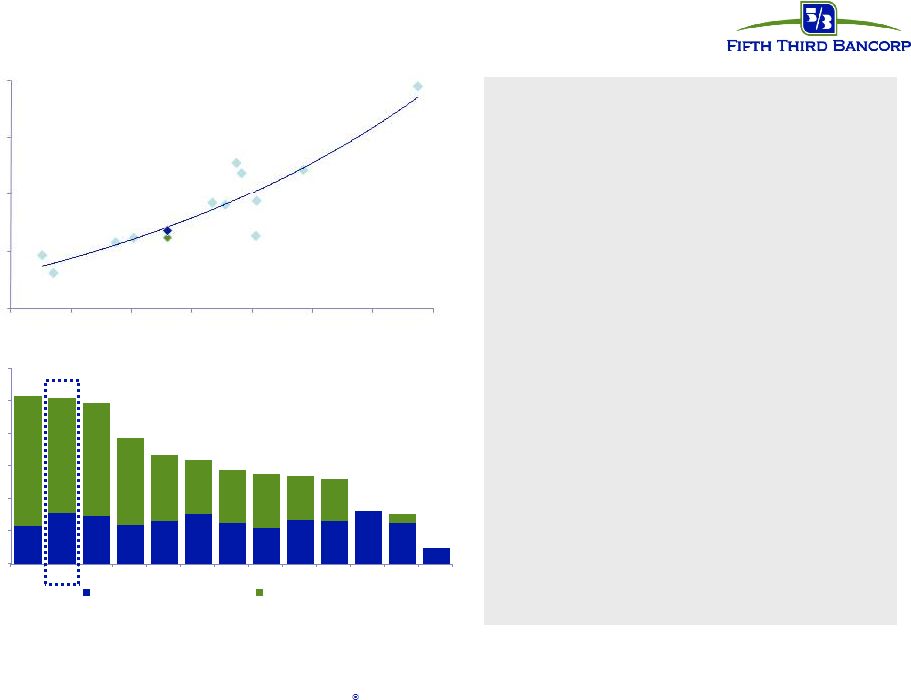
 Outstanding Balances ($MM)
Expanding and growing industry verticals
Fifth Third’s Commercial strategy includes utilizing specialized industry verticals
to augment the traditional Commercial lending business
Key benefits: – Experienced bankers offering specialized industry knowledge and a superior client value proposition
– Subject matter experts with knowledge of both the market dynamics and the regulatory environment
– More opportunities for fee revenues (e.g., TM services, M&A advisory) enhance Fifth Third ROA
Case Study: Healthcare sector success
• Fifth Third stood up the healthcare vertical in 2008 and has consistently improved
profitability through lending offerings as well as an increased focus on fee
revenue Revenue Mix
Balance Growth • Q1 2016: 40% fee revenue mix driven by continued success generating capital markets, syndication and bridge fee revenue • Highest fee-generating quarter for vertical since inception 1 Represents balances generated from Fifth Third’s National Healthcare Vertical Group
1 $21MM $45MM $61MM $89MM $23MM $15MM 1,252 3,677 Q4 2010 Q1 2016 26% 33% 40% 74% 67% 60% 2010 2015 Q1 2016 Fee Revenue NII 8 Fifth Third Bancorp | All Rights Reserved |
 9 Fifth Third Bancorp | All Rights Reserved Strategic investment strategy Our strategic investment planning categorizes initiatives into three categories, all of which
are key to Fifth Thirds long-term success
• Includes continued focus to ensure compliance with all regulatory requirements • Select examples include: – Continued automation and workflow enhancements – Enhanced fraud tools and mobile alerts to improve customer experience and reduce
fraud – IT investments to provide an integrated customer experience • Investing in core business to drive higher revenues • Select examples include: – Consumer and Commercial credit card enhanced customer utilization – Small Business lending initiative to improve loan origination levels – Insurance brokerage • Streamlining processes to reduce expenses • Select examples include: – Branch operations digitization – Expanded business processes moving to offshore operations – Continue to look at branch optimization strategies Revenue Enhancing Cost Saving IT and Risk & Compliance Infrastructure |
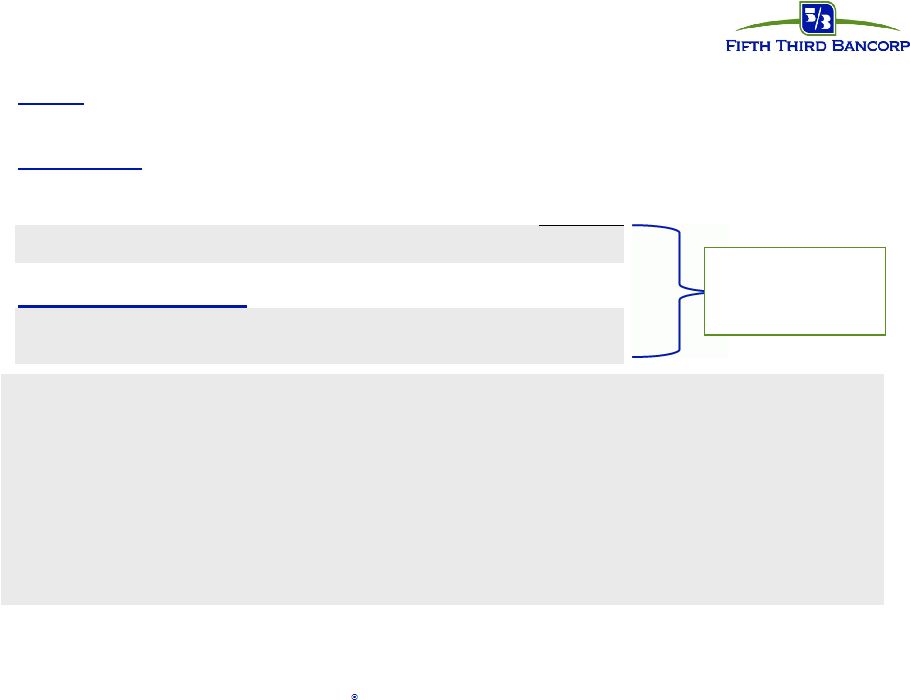
  Continuing
to transform the retail branch network
Fifth Third is continuing to transform the core retail business to optimize the branch
network in order to address evolving customer behavior, preferences and
expectations FTE
reduction (total banking center) Financial Impact ($MM) Branch & Job Re-Design Branch Closures Digital Transformation Description ~1,600 FTE (19%) ~400 FTE (6%) 2015-2016 2016-2017 2013-2015 $60MM Annual run-rate (cost savings) Omni-channel infrastructure designed to accelerate revenue growth and improve customer service quality through enhanced digital capabilities Branch digitization to substantially reduce back office personnel and office supply costs Hired Chief Digital Officer to drive initiatives Exited retail operations in two markets (Pittsburgh and St. Louis) and consolidated select branch locations (8% reduction) Non-recurring net impairment of ($89MM) 41 branches closed, 34 branches sold, additional 32 closed in April Drove digital adoption through mobile and ATM Redefined staffing models & modified roles (Universal Bankers) Redesigned branch through process and technology enhancements Strategic Initiative Execution Timeframe $60MM Annual run-rate (cost savings) 10 Fifth Third Bancorp | All Rights Reserved 2018 2019 2020 $8MM $21MM $35MM |
 11 Fifth Third Bancorp | All Rights Reserved 2.3% 3.1% 2.9% 2.4% 2.7% 3.1% 2.5% 2.2% 2.7% 2.6% 3.3% 2.5% 1.0% 8.0% 7.1% 7.0% 5.3% 4.1% 3.3% 3.3% 3.4% 2.7% 2.6% 0.6% 0% 2% 4% 6% 8% 10% 12% COF FITB RF PNC STI WFC USB CMA KEY HBAN BBT MTB ZION Dividend Payout Yield Buyback Yield Fifth Third value proposition Total payout yield (regional peers) 3 • FITB has traded at a discount of approximately 8% relative to peers based on the best fit line implied by an analysis of P/TBV to Core ROTCE • If FITB were to generate the expected gains shown on slide 12 from monetizing the Vantiv equity position 4 at the best-fit multiple, the P/TBV would imply an additional ~8% in upside potential • FITB’s dividend payout ratio was 2 nd highest among peer
banks •
For FITB to get to the current
peer median dividend yield, share price would need to increase to ~$22 (as of
May 20, 2016)
• Incorporating the impact of share repurchases, total payout yield was ~83% of earnings P/TBV 1 10.3% 10.2% 9.9% 7.7% 6.4% 5.8% 5.6% 5.4% 5.3% 3.3% 9.8% 3.1% 1.0% 6.7% 3/31/16 peer median dividend yield = 2.6% (2.4% as of 5/20/16) All returns are shown on a trailing 4 quarter basis, ending Q1 2016. 1 Share price as of 5/20/16; Tangible Book Value per share as of Q1 2016, per SNL Financial
2 Core ROTCE, or core return on average common equity, is a non-GAAP measure. All peer core net income available to common shareholders figures
per SNL Financial, trailing 12 months ended Q1 2016; P/TBV as of 5/20/16,
except FITB figures based on Company calculations shown in the reconciliations in the Appendix. 3 Payout ratios calculated with share prices and market capitalization as of 03/31/16 given the combined dividend and repurchase analysis; Fifth
Third’s dividend payout ratio as of 5/20/16 was 2.8% 4
Assumption based on Fifth Third’s 2015 capital plan; Fifth Third’s 2016
capital plan is subject to Federal Reserve objection or non-objection to be announced by June 30, 2016. Unrecognized pre-tax equity ownership value shown on page 12 ($1.514BN) 5% 7% 9% 11% 13% 15% 17% 19% Core ROTCE 2 FITB 0.5x 1.0x 1.5x 2.0x 2.5x |
 12 Fifth Third Bancorp | All Rights Reserved Unrecognized value in Vantiv ownership Not recognized on Fifth Third’s balance sheet • Equity Ownership - As of March 31, 2016, Fifth Third has an approximate 18% ownership interest in Vantiv Holding, LLC. for which it records equity method earnings. • Warrant - As of March 31, 2016, Fifth Third owns a warrant associated with Vantiv Holding, LLC. to
purchase approximately 7.8 million Class C (non-voting) units in Vantiv at an
exercise price of $15.98 per unit. The warrant is carried at fair value on
the balance sheet as a derivative asset. •
Tax Receivable Agreement –
Annually Fifth Third recognizes income as part of a Tax Receivable
Agreement (TRA) with Vantiv. This agreement entitles Fifth Third to receive
economic benefits of certain tax deductions or benefits recognized by
Vantiv, Inc. 1
Fifth Third Bancorp’s Q1 2016 10-Q as of March 31, 2016. Subject to changes in Vantiv’s stock price 2 As of 3/31/2016; VNTV closing price of $53.88 x 35MM units. Subject to changes in Vantiv’s stock price 3 Based on the analysis performed by Vantiv, Inc. disclosed in its first quarter Form 10-Q. Estimated cash flow from additional share
sales assumes that Fifth Third Bank had exchanged its remaining Class B Units of Vantiv Holding, had exercised its remaining warrant and exchanged the resulting Class C Units of Vantiv Holding, all for Class A Shares of Vantiv, Inc. common stock on March 31, 2016. TRA cash flows are undiscounted and may vary based on a number of factors, including the amount and timing of Vantiv’s future taxable income and the tax rate then applicable, the use of loss carryovers and amortizable basis and are subject to material change based on changes in Fifth Third Bank’s tax basis in the partnership interest, changes in tax rates, or
significant changes in Vantiv, Inc.’s stock price. Cash flows based on additional share sales are dependent on Fifth Third’s desire and ability to sell additional shares at comparable share prices in desired time
frames. ($s in millions)
Warrant Book Value of Warrant (carried at Fair Value) 1 308 $ Equity Interest Book Value of Ownership 1 374 Market Value of Ownership 2 1,888 Unrecognized pre-tax value from Vantiv share ownership 1,514 $ Tax Receivable Agreement Gross Cash Flows from Existing TRA 3 802 $ Estimated Cash Flow Potential from Additional Share Sales 3 1,100 $ |
 13 Fifth Third Bancorp | All Rights Reserved We are investing prudently to drive higher returns We are committed to driving attractive ROEs through cycles We are a very different bank than we were pre-crisis In summary All of this is intended to create shareholder value over time Growth Profitability Stability |
 14 Fifth Third Bancorp | All Rights Reserved Appendix |
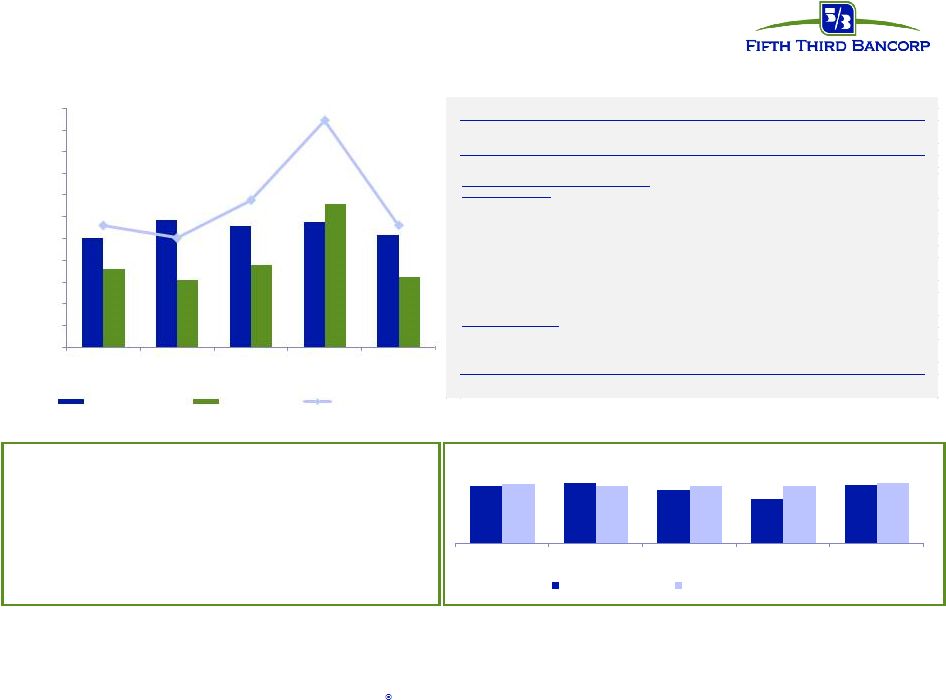
 • Strong NII and NIM; continued benefit from steady interest rate risk management strategy • Solid fee income despite market volatility Strong corporate banking activity • Tightly controlled operational expenses • Executed on defined strategies • Credit quality excluding energy in line; monitoring energy portfolio closely First quarter 2016 highlights Earnings Per Share Reported $0.40 •Included $0.03 net benefit from certain items* Net Income to Common $312 million LCR 118% *Significant pre-tax items in 1Q16 results include: $47MM pre-tax (~$31MM after-tax) positive valuation adjustment on the Vantiv
warrant, $8MM pre-tax (~$5MM after-tax) gain on sale on St. Louis
branches, ($14MM) pre-tax (~$9MM after-tax) voluntary early retirement expense 15 Fifth Third Bancorp | All Rights Reserved |
 16 Fifth Third Bancorp | All Rights Reserved Pre-tax pre-provision earnings 1 PPNR trend 1 Non-GAAP measure; see Reg. G reconciliation on page 22 in the appendix. 2 Presented on a fully taxable equivalent basis. 3 Prior quarters include similar adjustments. • PPNR decreased 46% sequentially, reflecting: – $469MM net benefit in 4Q15 primarily related to Vantiv gains • Adjusted PPNR down 11% sequentially – Primarily due to the $31MM annual Vantiv tax receivable payment recorded in 4Q15 PPNR reconciliation Efficiency ratio 2 65.4% 62.3% 58.2% 48.0% 63.8% 64.9% 61.9% 62.7% 62.2% 1Q15 2Q15 3Q15 4Q15 1Q16 Efficiency Ratio Adjusted Efficiency Ratio 65.3% 1Q15 2Q15 3Q15 4Q15 1Q16 $0 $100 $200 $300 $400 $500 $600 $700 $800 $900 $1,000 $1,100 Adjusted PPNR Net Income Reported PPNR ($ in millions) 1Q15 2Q15 3Q15 4Q15 1Q16 Net interest income 2 $852 $892 $906 $904 $909 Total non-interest income 630 556 713 1,104 637 Total non-interest expense 923 947 943 963 986 PPNR $559 $501 $676 $1,045 $560 Adjustments to remove (benefit) / detriment : 3 In noninterest income: Gain on sale of Vantiv shares - - - (331) - Gain on Vantiv warrant actions - - - (89) - Vantiv TRA settlement payment - - - (49) - Vantiv warrant valuation (70) (14) (130) (21) (47) Gain on sale of certain branches - - - - (8) Branch and land valuation adjustments - 97 - - - Gain from sales of troubled debt restructurings (37) - - - - Impairment associated with aircraft leases 30 - - - - Valuation of 2009 Visa total return swap 17 2 8 10 (1) Securities (gains) / losses (4) (4) - (1) (3) In noninterest expense: Contribution to Fifth Third Foundation 4 - - 10 - Severance expense 1 2 3 2 15 Litigation reserve charges 2 (1) (5) - - Executive Retirements - - 6 - - Adjusted PPNR $502 $583 $558 $577 $516 |
 17 Fifth Third Bancorp | All Rights Reserved $2,100 $650 $1,850 $1,600 $1,600 $0 $1,000 $2,000 $3,000 2016 2017 2018 2019 2020 2021 On Fifth Third Bank Fifth Third Bank 2 1 Available and contingent borrowing capacity (1Q16): – FHLB ~$10.6B available, ~$14.2B total – Federal Reserve ~$23.5B Holding company unsecured debt maturities ($MM) Bank unsecured debt maturities ($MM – excl. Retail Brokered CDs) Heavily core funded Strong liquidity profile S-T wholesale 3% 1 $1B matured in 1Q16 2 $700MM matured in 1Q16 3 (Debt maturities, common and preferred dividends, interest and other expenses) without accessing capital markets; relying on dividends from
subsidiaries or any other discretionary actions Holding
Company: Holding Company cash at 03/31/16: $2.3B
$1B maturity in January 2016, was pre-funded with the $1.1B Holding
Company issuance executed in 3Q15
Cash currently sufficient to satisfy all fixed obligations in a stressed
environment for ~26 months
Bank Entity: Of the $2.5B maturing this year, $700MM matured in 1Q16. During the quarter the Bank issued $1.5B of long term debt, comprised of $750MM of senior debt and $750MM of sub debt 2016 Funding Plans: Due to the Moody’s LGF methodology, we intend to replace all debt maturities this calendar year ($3.7B in total) in order to maintain our current senior debt ratings $1.5B of the $3.7B was replaced in 1Q16 It is likely that most of this replacement funding will take place at the Bank Entity Demand 25% Interest checking 18% Savings/ MMDA 24% Consumer time 3% Foreign Office 0% Non-Core Deposits 2% S-T borrowings 2% Other liabilities 3% Equity 12% L-T debt 11% $250 $500 $500 $500 $1,100 $2,312 $0 $500 $1,000 $1,500 $2,000 $2,500 2016 2017 2018 2019 2020 2021 on Fifth Third Bancorp Fifth Third Capital Trust (Bancorp) |
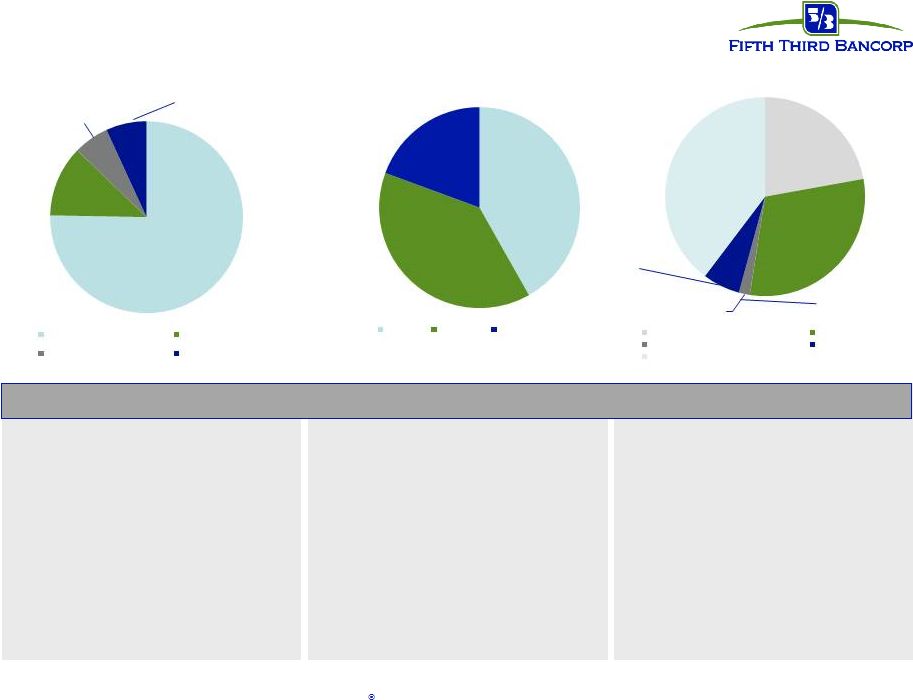 18 Fifth Third Bancorp | All Rights Reserved Portfolio compositions Commercial: Fixed: $10.2B 1 Float: $47.5B 1 • 1M Libor based: 68% • 3M Libor based: 8% • Prime based: 5% Weighted Avg. Life: 1.86 years 74% Float / 26% Fix 96% Float / 4% Fix 0% Float / 100% Fix 90% Float / 10% Fix 71% Float / 29% Fix 25% Float / 75% Fix 91% Float / 9% Fix 1% Float / 99% Fix 100% Float / 0% Fix Investments: 52% allocation to bullet/locked-out cash flow securities Investment portfolio yield: 3.14% Duration: 4.8 years Net unrealized pre-tax gain: $1B Portfolio Characteristics 0% Float / 100% Fix 0% Float / 100% Fix 17% Float / 83% Fix Consumer: Fixed: $23.3B 1 Float: $13.4B 1 • Prime based: 25% Weighted Avg. Life: 3.48 years Avg. duration of Auto book: 1.33 years 1 Includes HFS Loans & Leases 75% 12% 6% 7% 1 Commercial & Industrial Commercial Mortgage Commercial Construction Commercial Lease Bancorp Investment Portfolio (BV) Level 1 Level 2A Non -HQLA 42% 39% 19% 2% EOP Consumer Loans 1 Home Equity Auto Other Credit Card Resi Mortgage & Construction 22% 30% 6% 40% EOP Commercial Loans |
 19 Interest rate risk management Well-positioned for rising rates • NII benefits from asset re-pricings in a rising rate environment – 64% of total loans are floating rate (82% of commercial and 36% of consumer) – Investment portfolio duration less than 5 years – Short-term wholesale funding represents approximately 4% of total funding – Approximately $11B in non-core funding matures beyond one year • Interest rate sensitivity tables are based on conservative deposit assumptions – 70% beta on all interest-bearing deposit and sweep balances (~50% betas experienced in 2004 – 2006 Fed tightening cycle) – No modeled re-pricing lag – Modeled non-interest bearing commercial DDA runoff of approximately $2.5B (about 10%) for each 100 bps increase in
rates – DDA runoff rolls into an interest bearing product with a 100% beta Change in Interest Rates (bps) +200 bps Shock Change in Interest Rates +100 bps Shock +200 bps Ramp 2.12% 6.98% (4.00%) +25 bps Shock +100 bps Ramp 1.20% 4.27% - -50 bps Shock -50 bps Ramp (2.00%) (2.67%) - Betas 25% Higher Betas 25% Lower Change in Interest Rates 12 Months 13 to 24 Months 12 Months Change in Interest Rates 12 Months 13 to 24 Months 12 Months 13 to 24 Months +200 bps Ramp 1.84% 6.43% 2.40% +200 bps Ramp (1.11%) 0.52% 5.35% 13.44% +100 bps Ramp 1.06% 3.99% 1.34% +100 bps Ramp (0.41%) 1.04% 2.82% 7.50% ESTIMATED NII SENSITIVITY PROFILE ESTIMATED EVE SENSITIVITY PROFILE Percent Change in NII (FTE) ALCO Policy Limits Change in EVE ALCO Policy Limit 12 Months 13 to 24 Months 12 Months 13 to 24 Months (12.00%) (0.90%) (6.00%) (0.10%) - (0.32%) (2.85%) ESTIMATED NII SENSITIVITY with DEPOSIT BETA CHANGES Percent Change in NII (FTE) Percent Change in NII (FTE) $1B Balance Decrease $1B Balance Increase 13 to 24 Months 7.54% 4.54% - ESTIMATED NII SENSITIVITY with DEMAND DEPOSIT BALANCE CHANGES Actual results may vary from these simulated results due to differences between forecasted and actual balance sheet composition, timing,
magnitude, and frequency of interest rate changes, as well as other
changes in market conditions and management strategies. Re-pricing percentage or “beta” is the estimated change in yield over 12 months as a result of a shock or ramp 100 bps parallel
shift in the yield curve 1. 2. Fifth Third Bancorp | All Rights Reserved |
 Credit
trends Residential Mortgage
Commercial & Industrial
Home Equity & Automobile
Commercial Real Estate * Excludes loans held-for-sale. ($ in millions) 1Q15 2Q15 3Q15 4Q15 1Q16 EOP Balance* $42,052 $42,800 $42,948 $42,131 $43,433 Avg Loans* $41,426 $42,550 $43,149 $43,154 $43,089 90+ days delinquent $2 $2 $3 $7 $3 as % of loans NM NM 0.01% 0.02% 0.01% NPAs* $216 $193 $183 $272 $472 as % of loans 0.58% 0.45% 0.43% 0.65% 1.09% Net charge-offs $38 $34 $128 $30 $46 as % of loans 0.38% 0.32% 1.17% 0.28% 0.43% C&I ($ in millions) 1Q15 2Q15 3Q15 4Q15 1Q16 EOP Balance* $7,209 $7,150 $7,061 $6,957 $6,864 Avg Loans* $7,241 $7,148 $7,023 $7,032 $6,886 NPAs* $186 $166 $165 $138 $126 as % of loans 2.56% 2.31% 2.34% 1.98% 1.84% Net charge-offs $1 $11 $11 $3 $6 as % of loans 0.05% 0.62% 0.66% 0.19% 0.35% Commercial mortgage ($ in millions) 1Q15 2Q15 3Q15 4Q15 1Q16 EOP Balance* $2,302 $2,709 $3,101 $3,214 $3,428 Avg Loans* $2,197 $2,549 $2,965 $3,141 $3,297 NPAs* $16 $14 $19 $8 $8 as % of loans 0.67% 0.51% 0.61% 0.25% 0.23% Net charge-offs - - $3 - - as % of loans (0.06%) 0.00% 0.43% 0.00% (0.06%) Commercial construction ($ in millions) 1Q15 2Q15 3Q15 4Q15 1Q16 EOP Balance* $12,569 $12,933 $13,392 $13,716 $13,895 Avg Loans* $12,433 $12,831 $13,144 $13,504 $13,788 90+ days delinquent $48 $43 $40 $40 $44 as % of loans 0.38% 0.33% 0.30% 0.29% 0.32% NPAs* $113 $101 $91 $86 $77 as % of loans 0.91% 0.78% 0.68% 0.63% 0.55% Net charge-offs $6 $5 $3 $3 $2 as % of loans 0.19% 0.16% 0.10% 0.08% 0.07% Residential mortgage ($ in millions) 1Q15 2Q15 3Q15 4Q15 1Q16 EOP Balance* $8,714 $8,547 $8,427 $8,301 $8,112 90+ days delinquent - - - - - as % of loans NM NM NM NM NM Net charge-offs $14 $9 $9 $9 $8 as % of loans 0.61% 0.41% 0.42% 0.39% 0.36% Home equity ($ in millions) 1Q15 2Q15 3Q15 4Q15 1Q16 EOP Balance* $11,873 $11,909 $11,826 $11,493 $11,128 90+ days delinquent $7 $8 $8 $10 $8 as % of loans 0.06% 0.07% 0.07% 0.09% 0.07% Net charge-offs $8 $4 $7 $9 $9 as % of loans 0.28% 0.14% 0.23% 0.31% 0.32% Automobile 20 Fifth Third Bancorp | All Rights Reserved |
 Regulation G non-GAAP reconciliation
Fifth Third Bancorp and Subsidiaries
Regulation G Non-GAAP Reconciliation
$ and shares in millions
(unaudited) March December September June March 2016 2015 2015 2015 2015 Net interest income (U.S. GAAP) 903 899
901 887
847 Add:
Noninterest income 637 1,104
713
556 630
Less: Noninterest expense (986) (963) (943) (947) (923) Pre-provision net revenue
554 1,040
671
496 554
Net income available to common shareholders (U.S. GAAP) 312 634
366 292
346 Add:
Intangible amortization, net of tax
- -
- -
- Tangible net income available to common shareholders
(a) 312
634 366
292 346
Tangible net income available to common shareholders (annualized) (b)
1,255 2,515 1,452 1,171 1,403 Average Bancorp shareholders' equity (U.S. GAAP) 16,376 15,982 15,815 15,841 15,820 Less: Average preferred stock (1,331) (1,331) (1,331) (1,331) (1,331) Average goodwill (2,416) (2,416) (2,416) (2,416) (2,416) Average intangible assets and other servicing rights
(12) (13)
(14) (15)
(15) Average tangible common equity (c)
12,617 12,222 12,054 12,079 12,058 Total Bancorp shareholders' equity (U.S. GAAP) 16,323 15,839 15,826 15,605 15,864 Less: Preferred stock (1,331) (1,331) (1,331) (1,331) (1,331) Goodwill (2,416) (2,416) (2,416) (2,416) (2,416) Intangible assets and other servicing rights
(12) (13)
(13) (14)
(15) Tangible common equity, including unrealized gains /
losses (d) 12,564
12,079
12,066
11,844
12,102
Less: Accumulated other comprehensive
income (684)
(197) (522) (291) (588) Tangible common equity, excluding unrealized gains / losses
(e) 11,880
11,882
11,544
11,553
11,514
Total assets (U.S. GAAP)
142,430 141,048 141,883 141,628 140,437 Less: Goodwill (2,416) (2,416) (2,416) (2,416) (2,416) Intangible assets and other servicing rights
(12) (13)
(13) (14)
(15) Tangible assets, including unrealized gains / losses
(f) 140,002
138,619
139,454
139,198
138,006
Less: Accumulated other comprehensive income /
loss, before tax (1,052)
(303)
(803) (448) (905) Tangible assets, excluding unrealized gains / losses (g)
138,950 138,316 138,651 138,750 137,101 Common shares outstanding (h)
770 785
795 810
815 Ratios: Return on average tangible common equity (b) / (c) 9.9% 20.6% 12.0% 9.7% 11.7% Tangible common equity (excluding unrealized gains/losses) (e) / (g) 8.55% 8.59% 8.33% 8.33% 8.40% Tangible common equity (including unrealized gains/losses) (d) / (f) 8.97% 8.71% 8.65% 8.51% 8.77% Tangible book value per share (d) / (h) $16.32 $15.39 $15.18 $14.62 $14.85 For the Three Months Ended 21 Fifth Third Bancorp | All Rights Reserved |
 Regulation G non-GAAP reconciliation
Fifth Third Bancorp and Subsidiaries
Regulation G Non-GAAP Reconciliation
$ and shares in millions
(unaudited) March December September June March 2016 2015 2015 2015 2015 Non-interest income excluding certain items Non-interest income (U.S. GAAP) $637 $1,104 $713 $556 $630 Gain on sale of Vantiv shares - (331)
- -
- Gain on Vantiv warrant
actions -
(89) -
- -
Vantiv TRA settlement payment - (49)
- -
- Vantiv warrant
valuation (47)
(21) (130)
(14) (70)
Gain on sale of certain branches
(8) -
- -
- Branch and land valuation
adjustments -
- -
97 -
Gain from sales of troubled debt restructurings - -
- -
(37) Impairment associated with aircraft leases
- -
- -
30 Valuation of 2009 Visa total return swap
(1) 10
8 2
17 Securities (gains) / losses
(3) (1)
- (4)
(4) Adjusted non-interest income (i)
$578 $623 $591 $637 $566 Non-interest expense excluding certain items Non-interest expense (U.S. GAAP) $986 $963 $943 $947 $923 Contribution for Fifth Third Foundation - (10)
- -
(4) Severance expense
(15) (2)
(3) (2)
(1) Litigation reserve changes
- -
5 1
(2) Executive retirements
- -
(6) -
- Adjusted non-interest
expense (j) $971
$951 $939 $946 $916 PPNR Net Income 327 657 381 309 361 Less: Net income attributable to noncontrolling interests - -
- (6)
- Net income attributable to Bancorp
327 657 381 315 361 Dividends on preferred stock 15 23 15 23 15 Tangible net income available to common shareholders (a) $312 $634 $366 $292 $346 Combined pre-tax PPNR adjustments (44) (468) (118) 82 (57) Impact of assumed 35% rate on adjustments (15) (164)
(41) 29
(20) After tax impacts of certain item (k)
(29) (304)
(77) 53
(37) Core net income available to common shareholders
(l) $283
$330 $289 $345 $309 Average tangible common equity, including unrealized gains & losses, prior 4 quarters (m)
12,268 Core return on average tangible common equity, prior 4 quarters (l) / (m)
10.17% Adjusted Efficiency Ratio Reported net interest income (n) 909 904 906 892 852 Adjusted Efficiency Ratio (j) / ((i) + (n)) 65.3% 62.3% 62.7% 61.9% 64.6% For the Three Months Ended 22 Fifth Third Bancorp | All Rights Reserved |