Attached files
| file | filename |
|---|---|
| 8-K - 8-K - DYCOM INDUSTRIES INC | dyfy2016q48k-investorprese.htm |

DYCOM INDUSTRIES, INC. INVESTOR PRESENTATION JUNE 2016 Exhibit 99.1

2 Looking Statements and Non-GAAP Information This presentation contains “forward-looking statements”. Other than statements of historical facts, all statements contained in this presentation, including statements regarding the Company’s future financial position, future revenue, prospects, plans and objectives of management, are forward-looking statements. Words such as “outlook,” “believe,” “expect,” “anticipate,” “estimate,” “intend,” “should,” “could,” “project,” and similar expressions, as well as statements in future tense, identify forward-looking statements. You should not consider forward-looking statements as a guarantee of future performance or results. Forward-looking statements are based on information available at the time those statements are made and/or management’s good faith belief at that time with respect to future events. Such statements are subject to risks and uncertainties that could cause actual performance or results to differ materially from those expressed in or suggested by the forward-looking statements. Important factors, assumptions, uncertainties, and risks that could cause such differences are discussed in our most recent Annual Report on Form 10-K filed with the Securities and Exchange Commission (“SEC”) on September 4, 2015, our Quarterly Report on Form 10-Q filed with the SEC on May 27, 2016 and other filings with the SEC. The forward-looking statements in this presentation are expressly qualified in their entirety by this cautionary statement. The Company undertakes no obligation to update these forward-looking statements to reflect new information, or events or circumstances arising after such date. This presentation includes certain “Non-GAAP” financial measures as defined by Regulation G of the SEC. As required by the SEC, we have provided a reconciliation of those measures to the most directly comparable GAAP measures on the Regulation G slides included as slides 28 through 34 of this presentation. Non-GAAP financial measures should be considered in addition to, but not as a substitute for, our reported GAAP results.

3 Overview Leading supplier of specialty contracting services to telecommunication providers nationwide Telecommunications networks fundamental to economic progress Firm and strengthening end market opportunities Telephone companies deploying FTTX to enable video offerings and 1 gigabit connections Cable operators continuing to deploy fiber to small and medium businesses with overall cable capital expenditures, new build opportunities, and capacity expansion projects increasing Connect America Fund (“CAF”) II projects in planning and engineering, construction launching shortly. Have received assignments from one recipient for fixed wireless deployments Customers are consolidating supply chains creating opportunities for market share growth and increasing the long-term value of our maintenance business Encouraged that industry participants remain committed to multi-year capital spending initiatives which in most cases are meaningfully accelerating and expanding in scope

4 Nationwide footprint Operates in all 50 states, Washington, D.C. and in Canada Over 40 operating subsidiaries Strong revenue base and customer relationships Contract revenues of $664.6 million in Q3-16 and organic growth of 28.7% year-over-year Non-GAAP Adjusted EBITDA at 13.8% of revenue in Q3-16 compared to 12.8% in Q3-15 Non-GAAP Adjusted Diluted EPS increased to $1.08 in Q3-16 compared to $0.58* diluted earnings per share in Q3- 15 Solid financial profile Expanded credit facility in May 2016 Total facility capacity $800 million including $350 million term loan and $450 million revolving facility due 2020 Liquidity after amendment of $397.7 million on a pro forma basis as of April 23, 2016** Over 12,400 employees Nationwide Footprint and Significant Resources See “Regulation G Disclosure” slides 28-34 for a reconciliation of GAAP to Non-GAAP financial measures. * Q3-15 diluted earnings per share is on a GAAP basis, as there were no Non-GAAP adjustments to Q3-15. ** Availability on revolver of $178.3 million and cash on hand of $19.3 million as of April 23, 2016, plus the incremental $200 million of availability after amendment.
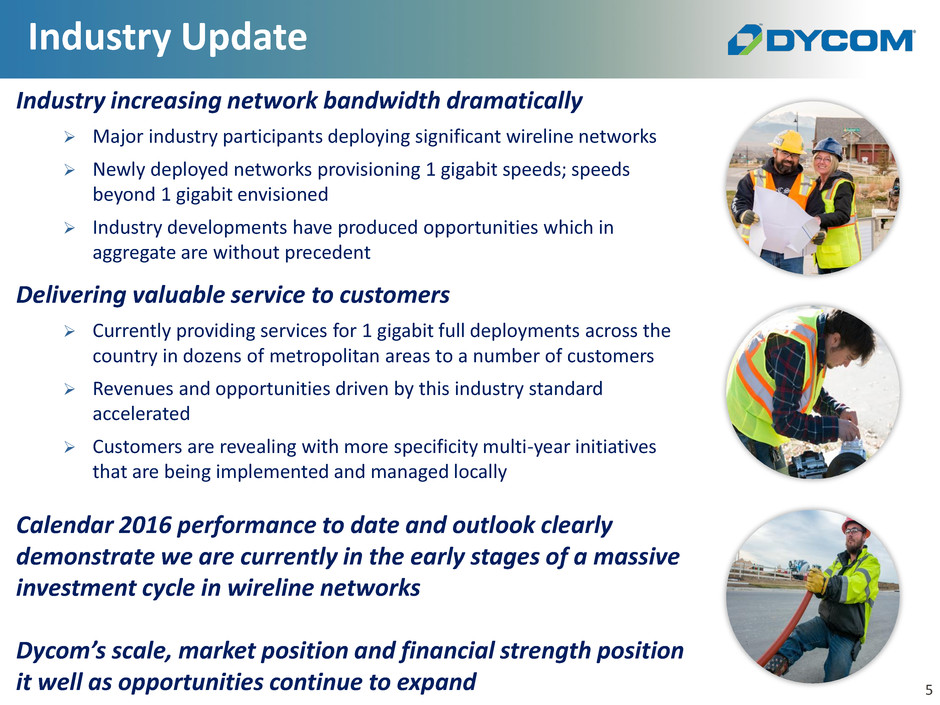
5 Industry increasing network bandwidth dramatically Major industry participants deploying significant wireline networks Newly deployed networks provisioning 1 gigabit speeds; speeds beyond 1 gigabit envisioned Industry developments have produced opportunities which in aggregate are without precedent Delivering valuable service to customers Currently providing services for 1 gigabit full deployments across the country in dozens of metropolitan areas to a number of customers Revenues and opportunities driven by this industry standard accelerated Customers are revealing with more specificity multi-year initiatives that are being implemented and managed locally Calendar 2016 performance to date and outlook clearly demonstrate we are currently in the early stages of a massive investment cycle in wireline networks Dycom’s scale, market position and financial strength position it well as opportunities continue to expand Industry Update

6 Intensely Focused on Telecommunications Market Outside Plant & Equipment Installation Premise Equipment Installation Wireless Engineering Underground Facility Locating Contract revenues of $664.6 million for Q3-16 Services Crucial to Customers’ Success Dycom is well-positioned to benefit from future growth opportunities Electric and Gas Utilities and Other Underground Facility Locating Telecommunications

7 Strong Secular Trend “It took 32 years – from 1984 to 2016 – to generate the first zettabyte of IP traffic annually. However, as this year’s Visual Networking Index forecasts, it will take only three additional years to reach the next zettabyte milestone when there will be more than 2 zettabytes of IP Traffic annually by 2019” Doug Webster, Vice President of Service Provider Products and Solutions Marketing, Cisco - May 2015 Sources: U.S. Telecom, The Broadband Association Cisco Visual Networking Index U.S. National Bureau of Economic Analysis Strong and stable growth in IP traffic even in times of GDP decline North America Internet Protocol Traffic vs. GDP Growth
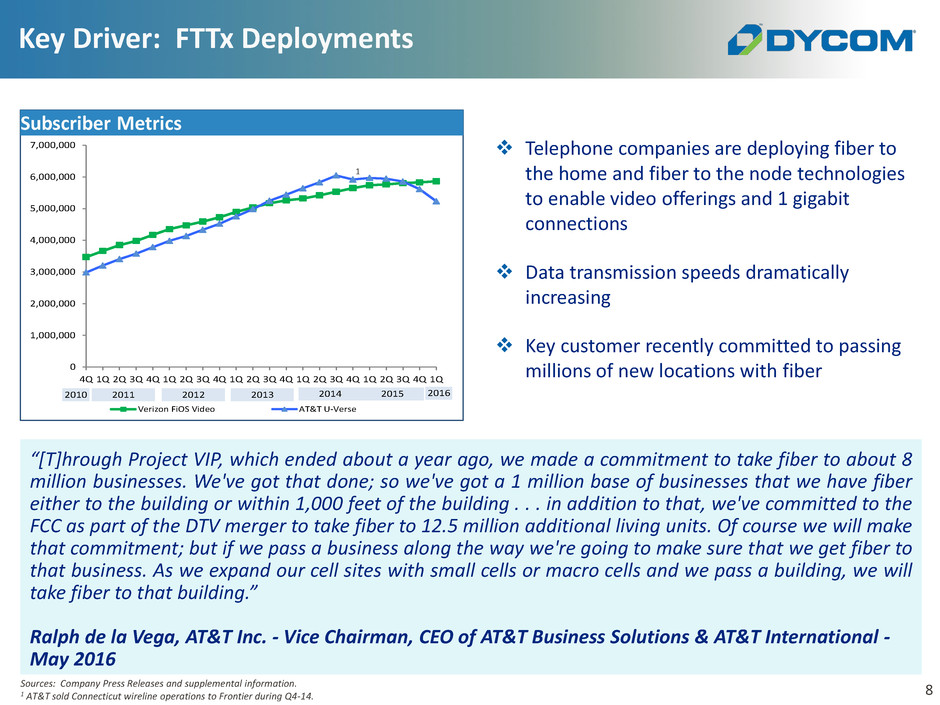
8 0 1,000,000 2,000,000 3,000,000 4,000,000 5,000,000 6,000,000 7,000,000 4Q 1Q 2Q 3Q 4Q 1Q 2Q 3Q 4Q 1Q 2Q 3Q 4Q 1Q 2Q 3Q 4Q 1Q 2Q 3Q 4Q 1Q Verizon FiOS Video AT&T U-Verse 2010 2011 2012 2013 2014 2015 2016 Key Driver: FTTx Deployments “[T]hrough Project VIP, which ended about a year ago, we made a commitment to take fiber to about 8 million businesses. We've got that done; so we've got a 1 million base of businesses that we have fiber either to the building or within 1,000 feet of the building . . . in addition to that, we've committed to the FCC as part of the DTV merger to take fiber to 12.5 million additional living units. Of course we will make that commitment; but if we pass a business along the way we're going to make sure that we get fiber to that business. As we expand our cell sites with small cells or macro cells and we pass a building, we will take fiber to that building.” Ralph de la Vega, AT&T Inc. - Vice Chairman, CEO of AT&T Business Solutions & AT&T International - May 2016 Telephone companies are deploying fiber to the home and fiber to the node technologies to enable video offerings and 1 gigabit connections Data transmission speeds dramatically increasing Key customer recently committed to passing millions of new locations with fiber Sources: Company Press Releases and supplemental information. 1 AT&T sold Connecticut wireline operations to Frontier during Q4-14. Subscriber Metrics 1
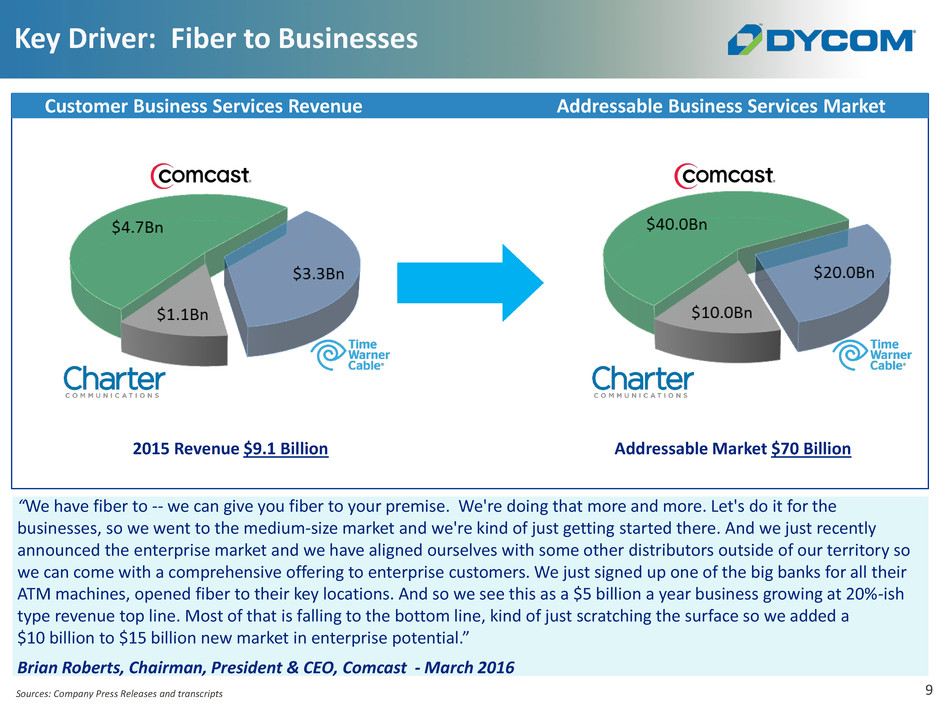
9 Key Driver: Fiber to Businesses Sources: Company Press Releases and transcripts “We have fiber to -- we can give you fiber to your premise. We're doing that more and more. Let's do it for the businesses, so we went to the medium-size market and we're kind of just getting started there. And we just recently announced the enterprise market and we have aligned ourselves with some other distributors outside of our territory so we can come with a comprehensive offering to enterprise customers. We just signed up one of the big banks for all their ATM machines, opened fiber to their key locations. And so we see this as a $5 billion a year business growing at 20%-ish type revenue top line. Most of that is falling to the bottom line, kind of just scratching the surface so we added a $10 billion to $15 billion new market in enterprise potential.” Brian Roberts, Chairman, President & CEO, Comcast - March 2016 Customer Business Services Revenue Addressable Business Services Market 2015 Revenue $9.1 Billion Addressable Market $70 Billion

10 Key Driver: Connect America Fund “CAF is a tremendous program. It's been a great public-private partnership for Windstream. We're going to provide over 400,000 locations with either basically underserved or unserved, 400,000 locations. It's frankly a fairly staggering amount of communities that are going to benefit from the work associated with our Connect America Fund programs. And when people look for, why are you optimistic about the broadband unit trends, they have something to do with the 400,000 locations that we're getting ready to dramatically improve the service work. And I think it's been a great program and we go to these communities and we can completely transform their experience. They go from an older technology, typically copper-fed ATM technology to fiber-fed Ethernet and navigating speeds up to 100-meg and much like the other ILECs where you're evaluating vectoring and other technologies where we expect you can get faster speeds over the old twisted pair of copper and providing even better products for our customers.” Tony Thomas, Windstream Holdings Inc. - President and CEO - March 2016 New projects from Connect America Fund deploying fiber deeper into networks Connect America Fund (“CAF”) is a FCC initiative to bring broadband access to rural communities CAF Phase II – FCC offers support of up to $1.676 billion annually to price cap carriers to expand broadband service to rural America Multi-year subsidies; must provision broadband speeds of at least 10 Mbps downstream/1 Mbps upstream Over $1.5 billion in funding was accepted in August 2015 by the price cap carriers (including AT&T, CenturyLink, Windstream, Frontier and others) with the remaining $175 million to be allocated through an auction process Sources: FCC.gov

11 Key Driver: Wireless Network Upgrades “[F]irst and most important is obviously network. So, when you think about the wireless network, the fiber network, that is really where our concentration is right now. With Wireless we continue to densify that LTE network, continue to spend capital at a pretty consistent rate, actually increasing year-over-year. And we are doing that for the densification of LTE, but also in preparation of 5G, and I am sure we will talk more about that. And then when you look at that underlying network, that obviously enables us to do a lot. And if you just look at the entire industry alone, data is going to continue to explode in this industry and everybody has positioned themselves to take a bigger piece of the pie that continues to grow.” Fran Shammo, Verizon Commuications Inc. - EVP & CFO – May 2016 Wireless carriers are upgrading to 4G technologies creating growth opportunities in the near to intermediate term Carriers enhancing coverage and capacity by increasing the number of small cells Increasing capacity where 4G technologies are already deployed Growth in Number of Cell Sites¹ 1 Source: Industry publications 0 50,000 100,000 150,000 200,000 250,000 300,000 350,000 400,000 450,000 500,000 2 0 0 0 2 0 0 1 2 0 0 2 2 0 0 3 2 0 0 4 2 0 0 5 2 0 0 6 2 0 0 7 2 0 0 8 2 0 0 9 2 0 1 0 2 0 1 1 2 0 1 2 2 0 1 3 2 0 1 4 2015 Es ti mat e s 2020 Es ti mat e s 2025 Es ti mat e s U S C el l Ci ti es

12 Local Credibility, National Capability Dycom headquarters Primary locations Subsidiaries Dycom’s Nationwide Presence
13 Focused on High Value Profitable Growth Anticipate emerging technology trends that drive capital spending Deliberately target high quality, long-term industry leaders which generate the vast majority of the industry’s profitable opportunities Selectively acquire businesses that complement our existing footprint and enhance our customer relationships Leverage our scale and expertise to expand margins through best practices

14 Well Established Customers Top Customers Dycom has established relationships with: Telephone companies Wireless carriers Cable television multiple system operators Electric utilities and others Customer Revenue Breakdown Q3-16 Blue-chip, investment grade customers comprise a substantial portion of revenue

15 Durable Customer Relationships $- $50 $100 $150 $200 $250 $300 $350 $400 $450 FY-06 FY-07 FY-08 FY-09 FY-10 FY-11 FY-12 FY-13 FY-14 FY-15 AT&T Comcast CenturyLink Verizon Charter Time Warner Cable Windstream Unnamed 33% 34% 33% 34% 34% 38% 40% 41% 42% 39% 67% 66% 67% 66% 66% 62% 60% 59% 58% 61% $995 $1,138 $1,230 $1,107 $989 $1,036 $1,201 $1,609 $1,812 $2,022 FY-06 FY-07 FY-08 FY-09 FY-10 FY-11 FY-12 FY-13 FY-14 FY-15 All Other customers Top 5 customers 1 Reflects the results of acquired businesses since dates of acquisition, including telecommunications infrastructure services subsidiaries acquired by Dycom during fiscal 2013 from Quanta Services, Inc. Revenues ( in millions) ¹

16 Anchored by Long-Term Agreements Dycom is party to hundreds of MSA’s and other arrangements with customers that extend for periods of one or more years Generally multiple agreements maintained with each customer Master Service Agreements (MSA’s) Multi-year, multi-million dollar arrangements covering thousands of individual work orders Generally exclusive requirement contracts Agreements can at times be negotiated Majority of contracts are based on units of delivery Backlog at $5.649 billion as of Q3-16 compared to $2.912 billion at Q3-15 Revenue by Contract Type for the Nine Months Ended April 23, 2016 Backlog ($ in millions) Our backlog estimates represent amounts under master service agreements and other contractual agreements for services projected to be performed over the terms of the contracts and are based on contract terms, our historical experience with customers and, more generally, our experience in similar procurements. The significant majority of our backlog estimates comprise services under master service agreements and long-term contracts. Backlog is not a measure defined by United States generally accepted accounting principles; however, it is a common measurement used in our industry. Our methodology for determining backlog may not be comparable to the methodologies used by others. Master Service Agreements Long-term contracts Short-term contracts

17 10+ Years of Robust Cash Flow Generation Sources and Uses of Cash ($ in millions) Notes: Amounts represent cumulative cash flow for fiscal 2006 – Q3 of fiscal 2016; See “Regulation G Disclosure” slides as set forth in the Appendix for a summary of amounts. Amounts may not add due to rounding. 1 Other cash flow includes borrowings, other financing and investing activities and beginning cash on hand. Strong operating cash flow of $1.017 billion since fiscal 2006 Prudent approach to capital allocation: $704 million in cap-ex, net of disposals, or approximately 38% of allocation $591 million invested in business acquisitions $579 million invested in share repurchases Robust cash flow generation and prudent capital allocation provide strong foundation for returns 32% Business Acquisitions 38% Cap-ex, net 31% Share Repurchases Fiscal 2006 – Q3-2016

Financial Update

19 Strong operating results Contract revenues of $664.6 million in Q3-16 compared to $492.4 million in Q3-15. Organic growth of 28.7% Non-GAAP Adjusted EBITDA of $91.9 million, or 13.8% of revenues in Q3-16, compared to $63.0 million, or 12.8% in Q3-15 Non-GAAP Adjusted Diluted EPS increased to $1.08 in Q3-16 compared to $0.58* diluted earnings per share in Q3-15 Solid financial profile Strong balance sheet and cash flows; Sound credit metrics and no near term debt maturities Expanded credit facility in May 2016 Total facility capacity $800 million including $350 million term loan and $450 million revolving facility due 2020 Liquidity after amendment of $397.7 million on a pro forma basis as of April 23, 2016 ** Capital structure designed to produce strong returns During Q3-16, repurchased 1,557,354 common shares for $100 million at an average price of $64.21 per share Financial Overview See “Regulation G Disclosure” slides 28-34 for a reconciliation of GAAP to Non-GAAP financial measures. * Q3-15 diluted earnings per share is on a GAAP basis as there were no Non-GAAP adjustments to Q3-15. ** Availability on revolver of $178.3 million and cash on hand of $19.3 million as of April 23, 2016, plus the incremental $200 million of availability after amendment.

20 Strong and sustained financial performance Contract Revenue Trend Annual Organic Revenue Trend Quarterly Contract Revenues Quarterly Organic Revenue Trend Annual Growth in Contract Revenues Financial charts - $ in millions See “Regulation G Disclosure” slides 28-34 for a reconciliation of GAAP to Non-GAAP financial measures.
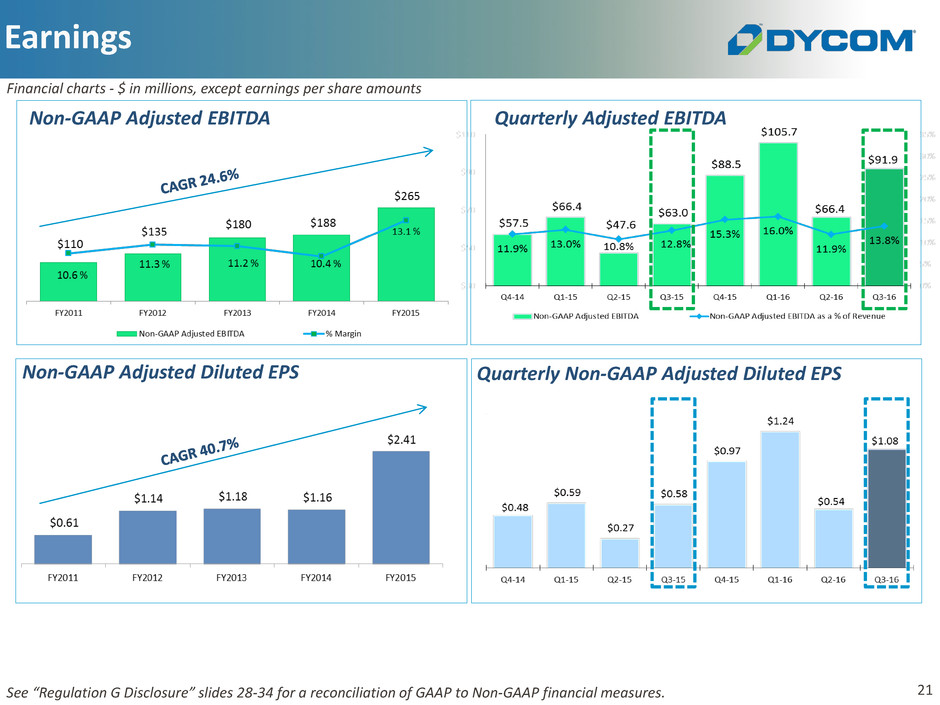
21 Earnings Non-GAAP Adjusted EBITDA Quarterly Adjusted EBITDA Non-GAAP Adjusted Diluted EPS Financial charts - $ in millions, except earnings per share amounts See “Regulation G Disclosure” slides 28-34 for a reconciliation of GAAP to Non-GAAP financial measures. Quarterly Non-GAAP Adjusted Diluted EPS

22 Strong balance sheet and robust liquidity Liquidity and Cash Flow Financial tables - $ in millions No significant near-term debt maturities Senior Credit Facility matures April 2020 0.75% Senior Convertible Notes mature September 2021 On May 20, 2016, added $200 million incremental Term Loan to our Credit Facility Funds used to pay down existing revolver borrowings, thereby increasing availability by an additional $200 million (a) Availability on Revolver presented net of $57.7 million for outstanding L/C’s under the Senior Credit Agreement at each of Q2-16 and Q3-16. Cap-ex, net, and as a % of Revenue* Operating cash flows support strong organic growth and cap-ex TTM Cap-ex, net of $155.8 million enabled organic revenue growth of $461.5 million and backlog growth of $2.7 billion year-over-year * Cap-ex, net represents capital expenditures less proceeds from sale of assets. *TTM Q3-2016 cap-ex, net equals the aggregate of quarterly cap-ex from Q3-16, Q2-16, Q1-16, and Q4-15, of $44.1 million, $48.7 million, $39.4 million, and $23.6 million, respectively. $49 $53 $59 $74 $94 $156 4.7% 4.4% 3.7% 4.1% 4.6% 6.3% FY2011 FY2012 FY2013 FY2014 FY2015 TTM Q3-16 Cap-ex, net Cap-ex as a % of Revenue

23 Capital Allocated to Maximize Returns Strong balance sheet, solid cash flow and long-term confidence in industry outlook drives capital allocation strategy Invest in organic growth Organic revenue grew 28.7 % in Q3-16, reflecting growth from several key customers Pursue complementary acquisitions Fiscal 2013 - 2016 acquisitions further strengthened Dycom’s customer base, geographic scope, and technical service offerings During fiscal 2015 and 2016, acquired 7 businesses for $80.5 million further strengthening customer relationships and expanding geographic reach Share repurchases Repurchased approximately 23.0 million shares for approximately $579 million since fiscal 2006 $100 million authorization available for share repurchases through October 2017 Dycom is committed to maximizing long term returns through prudent capital allocation See “Regulation G Disclosure” slides 28-34 for a reconciliation of GAAP to Non-GAAP financial measures.

Questions and Answers
Selected Information from Q3-16 Dycom Results Conference Call Materials The following slides 26-28 were used on May 25, 2016 in connection with the Company’s conference call to discuss fiscal 2016 third quarter results and are included for your convenience. Reference is made to slide 2 titled “Forward-Looking Statements and Non-GAAP Information” with respect to these slides. The information and statements contained in slides 26-28 that are forward-looking are based on information that was available at the time the slides were initially prepared and/or management’s good faith belief at that time with respect to future events. Except as required by law, the Company may not update forward-looking statements even though its situation may change in the future. For a full copy of the conference call materials, including the conference call transcript, see the Company’s Form 8-Ks filed with the Securities and Exchange Commission on May 25, 2016 and May 26, 2016.

26 Q4-2016 will have 14 weeks of operations as required by our 53 week fiscal calendar, compared to 13 weeks in Q4-2015 Q4-2015 Included for comparison Q4-2016 Outlook and Commentary (includes additional week of operations) Contract Revenues $ 578.5 $750 - $780 Broad range of demand from several large customers Robust 1 gigabit deployments, CAF II accelerating, core market share growth, cable capacity projects expanding Total revenue expected to include approximately $40.0 million in Q4-16 compared to $2.4 million in Q4-15 from businesses acquired in Q4-15 and Q1-16 Gross Margin % 22.9% Gross Margin % which increases from Q4-15 Solid mix of customer growth opportunities G&A Expense % 8.2% G&A as a % of revenue declines from Q4-15 G&A as a % of revenue supports our increased scale Outlook for G&A expense % includes share-based compensation Share-based compensation $ 3.1 $ 4.3 Depreciation & Amortization $ 25.9 $ 35.0 - $ 35.7 Depreciation and amortization reflects increased cap-ex and recently acquired businesses Includes amortization of approximately $5.0 million in Q4-16 compared to $4.4 million in Q4-15 Adjusted Interest Expense $ 6.9 Approximately $ 4.9 Non-GAAP Adjusted Interest Expense Q4-16 includes 0.75% cash coupon on Senior Convertible Notes, interest on Senior Credit Agreement, amortization of debt issuance costs and other interest Non-GAAP Adjusted interest expense excludes non-cash amortization of the debt discount of $4.6 million in Q4-16 Other Income $ 1.3 $ 2.2 - $ 2.7 Non-GAAP Adjusted EBITDA % 15.3% Non-GAAP Adjusted EBITDA % which increases from Q4-15 Adjusted EBITDA increases from revenue growth and improved operating performance Diluted Earnings per Share $ 0.97 Non-GAAP Adjusted Diluted EPS $ 1.45- $ 1.60 Non-GAAP Adjusted Diluted EPS excludes non-cash amortization of debt discount on Senior Convertible Notes. See slide 18 for reconciliation of guidance for Non-GAAP Adjusted Diluted Earnings per Common Share Effective tax rate of approximately 37.7% during Q4-16 Diluted Shares 34.8 million 32.1 million See “Regulation G Disclosure” slides 28-34 for a reconciliation of GAAP to Non-GAAP financial measures. Financial table- $ in millions, except earnings per share amounts (% as a percent of contract revenues) Q4-2016 Outlook – This slide was prepared and used on May 25, 2016 in connection with the Company’s conference call to discuss fiscal 2016 third quarter results and is included for your convenience. Reference is made to slide 2 titled “Forward-Looking Statements and Non-GAAP Information” with respect to this slide. The information and statements contained in this slide that are forward-looking is based on information that was available at the time the slide was initially prepared and/or management’s good faith belief at that time with respect to future events. Except as required by law, the Company may not update forward-looking statements even though its situation may change in the future. For a full copy of the conference call materials, including the conference call transcript, see the Company’s Form 8-Ks filed with the Securities and Exchange Commission on May 25, 2016 and May 26, 2016.

27 Q1-2016 Included for comparison Q1-2017 Outlook and Commentary Contract Revenues $ 659.3 Total revenue growth % in mid to high teens as a % of revenue compared to Q1-16 Broad range of demand from several large customers Robust 1 gigabit deployments, CAF II accelerating, core market share growth, cable capacity projects expanding Total revenue expected to include approximately $35.0 million in Q1-17 compared to $29.9 million in Q1-16 from businesses acquired in Q1-16 Gross Margin % 23.1% Gross Margin % which increases from Q1-16 Solid mix of customer growth opportunities G&A Expense % 7.8% G&A as a % of revenue declines slightly from Q1-16 G&A as a % of revenue supports our increased scale Outlook for G&A expense % includes share-based compensation Share-based compensation $ 4.5 $ 5.7 Depreciation & Amortization $ 27.4 $32.2 - $32.9 Depreciation reflects cap-ex which supports growth Includes amortization of approximately $4.5 million in Q1-17 compared to $4.8 million in Q1-16 Adjusted Interest Expense $ 7.4 Approximately $ 4.6 Non-GAAP Adjusted Interest Expense Q1-17 includes 0.75% cash coupon on Senior Convertible Notes, interest on Senior Credit Agreement, amortization of debt issuance costs and other interest Non-GAAP Adjusted Interest Expense excludes non-cash amortization of debt discount of $4.3 million in Q1-17 and $1.8 million in Q1-16 Other Income, net $ 1.5 $ 1.0 - $ 1.5 Loss on debt extinguishment $ 16.3 $ - Q1-16 included pre-tax charge of $16.3 million for loss on debt extinguishment in connection with the redemption of the 7.125% senior subordinated notes Non-GAAP Adjusted EBITDA % 16.0% Non-GAAP Adjusted EBITDA % which increases from Q1-16 Adjusted EBITDA increases from revenue growth and improved operating performance See “Regulation G Disclosure” slides 28-34 for a reconciliation of GAAP to Non-GAAP financial measures. Financial table- $ in millions (% as a percent of contract revenues) Looking Ahead To Q1-17– This slide was prepared and used on May 25, 2016 in connection with the Company’s conference call to discuss fiscal 2016 third quarter results and is included for your convenience. Reference is made to slide 2 titled “Forward-Looking Statements and Non-GAAP Information” with respect to this slide. The information and statements contained in this slide that are forward-looking is based on information that was available at the time the slide was initially prepared and/or management’s good faith belief at that time with respect to future events. Except as required by law, the Company may not update forward-looking statements even though its situation may change in the future. For a full copy of the conference call materials, including the conference call transcript, see the Company’s Form 8-Ks filed with the Securities and Exchange Commission on May 25, 2016 and May 26, 2016.

28 Reconciliation of Non-GAAP Financial Measures to Comparable GAAP Financial Measures Outlook – Diluted Earnings per Common Share Unaudited Use of Non-GAAP Financial Measures The Company reports its financial results in accordance with U.S. generally accepted accounting principles (GAAP). In our quarterly results releases, trend schedules, conference calls, slide presentations, and webcasts, we may use or discuss Non-GAAP financial measures, as defined by Regulation G of the SEC. See Explanation of Non-GAAP Measures on slide 34. (a) The fourth quarter of fiscal 2016 contains an additional week of operations as a result of the Company's 52/53 week fiscal year. (b) Guidance for Diluted earnings per common share and Non-GAAP Adjusted Diluted Earnings per Common Share for the three months ending July 30, 2016 were computed using approximately 32.1 million in diluted weighted average shares outstanding. (c) The Company expects to recognize approximately $4.6 million in pre-tax interest expense during the three months ending July 30, 2016 for non-cash amortization of the debt discount associated with its 0.75% Senior Convertible Notes. The Company excludes the effect of this non-cash amortization in its Non-GAAP financial measures. Outlook for the Three Months Ending July 30, 2016 (a)(b) Diluted earnings per common share $1.36 - $ 1.51 Adjustment After-tax non-cash amortization of debt discount (c) $ 0.09 Non-GAAP Adjusted Diluted Earnings per Common Share $ 1.45 - $ 1.60 Appendix: Regulation G Disclosure This slide was prepared and used on May 25, 2016 in connection with the Company’s conference call to discuss fiscal 2016 third quarter results and is included for your convenience. Reference is made to slide 2 titled “Forward-Looking Statements and Non-GAAP Information” with respect to this slide. The information and statements contained in this slide that are forward-looking is based on information that was available at the time the slide was initially prepared and/or management’s good faith belief at that time with respect to future events. Except as required by law, the Company may not update forward-looking statements even though its situation may change in the future. For a full copy of the conference call materials, including the conference call transcript, see the Company’s Form 8-Ks filed with the Securities and Exchange Commission on May 25, 2016 and May 26, 2016.
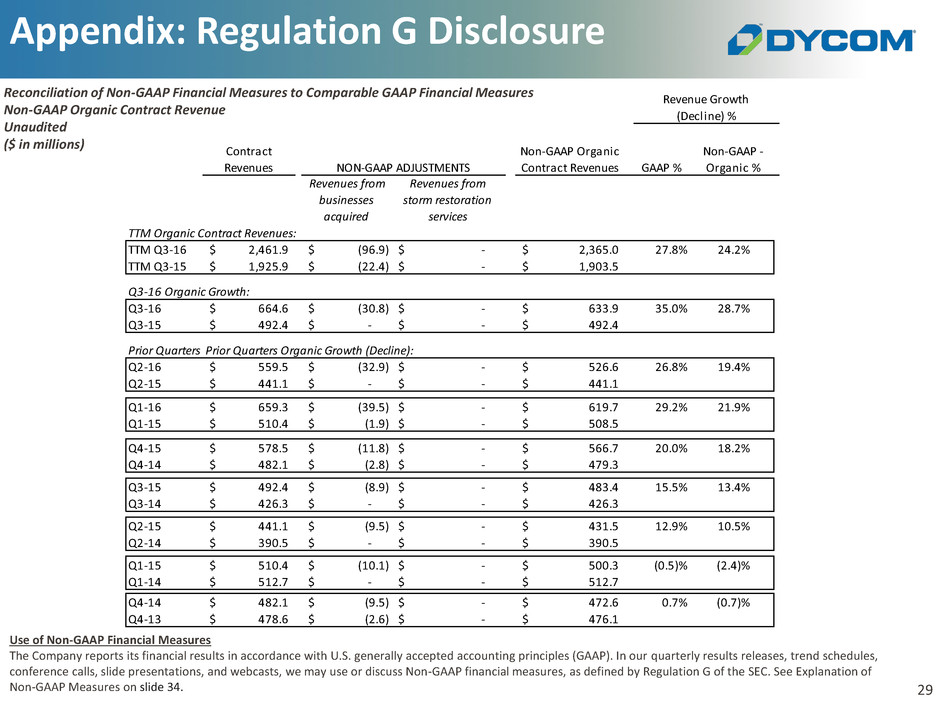
29 Appendix: Regulation G Disclosure Use of Non-GAAP Financial Measures The Company reports its financial results in accordance with U.S. generally accepted accounting principles (GAAP). In our quarterly results releases, trend schedules, conference calls, slide presentations, and webcasts, we may use or discuss Non-GAAP financial measures, as defined by Regulation G of the SEC. See Explanation of Non-GAAP Measures on slide 34. Reconciliation of Non-GAAP Financial Measures to Comparable GAAP Financial Measures Non-GAAP Organic Contract Revenue Unaudited ($ in millions) GAAP % Non-GAAP - Organic % Revenues from businesses acquired Revenues from storm restoration services TTM Organic Contract Revenues: TTM Q3-16 2,461.9$ (96.9)$ -$ 2,365.0$ 27.8% 24.2% TTM Q3-15 1,925.9$ (22.4)$ -$ 1,903.5$ Q3-16 Organic Growth: Q3-16 664.6$ (30.8)$ -$ 633.9$ 35.0% 28.7% Q3-15 492.4$ -$ -$ 492.4$ Prior Quarters Organic Growth (Decline):P ior Qua ters Organic Growth (Decline): Q2-16 559.5$ (32.9)$ -$ 526.6$ 26.8% 19.4% Q2-15 441.1$ -$ -$ 441.1$ Q1-16 659.3$ (39.5)$ -$ 619.7$ 29.2% 21.9% Q1-15 510.4$ (1.9)$ -$ 508.5$ Q4-15 578.5$ (11.8)$ -$ 566.7$ 20.0% 18.2% Q4-14 482.1$ (2.8)$ -$ 479.3$ Q3-15 492.4$ (8.9)$ -$ 483.4$ 15.5% 13.4% Q3-14 426.3$ -$ -$ 426.3$ Q2-15 441.1$ (9.5)$ -$ 431.5$ 12.9% 10.5% Q2-14 390.5$ -$ -$ 390.5$ Q1-15 510.4$ (10.1)$ -$ 500.3$ (0.5)% (2.4)% Q1-14 512.7$ -$ -$ 512.7$ Q4-14 482.1$ (9.5)$ -$ 472.6$ 0.7% (0.7)% Q4-13 478.6$ (2.6)$ -$ 476.1$ Contract Revenues NON-GAAP ADJUSTMENTS Revenue Growth (Decline) % Non-GAAP Organic Contract Revenues

30 Notes: Amounts may not add due to rounding. 1 Other financing activities represents net cash provided by (used in) financing activities less repurchases of common stock. 2 Other investing activities represents net cash provided by (used in) investing activities less capital expenditure, net of proceeds from asset sales and less cash paid for acquisitions, net of cash acquired. Reconciliation of Non-GAAP Financial Measures to Comparable GAAP Financial Measures Calculation of Cumulative Cash Flows Fiscal 2006 through Q3 of Fiscal 2016 Unaudited ($ in millions) Appendix: Regulation G Disclosure Net Cash Provided by Operating Activities Capital Expenditures, Net of Proceeds from Asset Sales Cash Paid for Acquisitions, net of cash acquired Repurchases of Common Stock Borrowings and Other Financing Activities 1 Other Investing Activities 2 Total Other Financing and Investing Activities Q3-16 YTD 79.0$ (132.3)$ (48.8)$ (170.0)$ 270.6$ (0.5)$ 270.2$ FY-15 141.9 (93.6) (31.9) (87.1) 75.9 (4.5) 71.4 FY-14 84.2 (73.7) (17.1) (10.0) 19.0 (0.3) 18.7 FY-13 106.7 (58.8) (330.3) (15.2) 263.5 0.1 263.6 FY-12 65.1 (52.8) - (13.0) 7.6 0.9 8.5 FY-11 43.9 (49.2) (36.5) (64.5) 47.5 0.2 47.7 FY-10 54.1 (46.6) - (4.5) (4.4) - (4.4) FY-09 126.6 (25.3) - (2.9) (15.7) (0.1) (15.8) FY-08 104.3 (62.3) 0.5 (25.2) (13.8) (0.3) (14.1) FY-07 108.5 (62.3) (61.8) - 7.7 (0.4) 7.3 FY-06 102.3 (47.3) (65.4) (186.2) 141.2 (0.3) 140.9 Cumulative 1,016.6$ (704.4)$ (591.3)$ (578.7)$ 799.1$ (5.1)$ 793.9$ Cash at July 30, 2005 83.1$ Cash at April 23, 2016 19.3 63.7$ 857.7$ Difference represents beginning cash used during the period Total amount provided by Other Financing and Investing Activities and beginning cash on hand
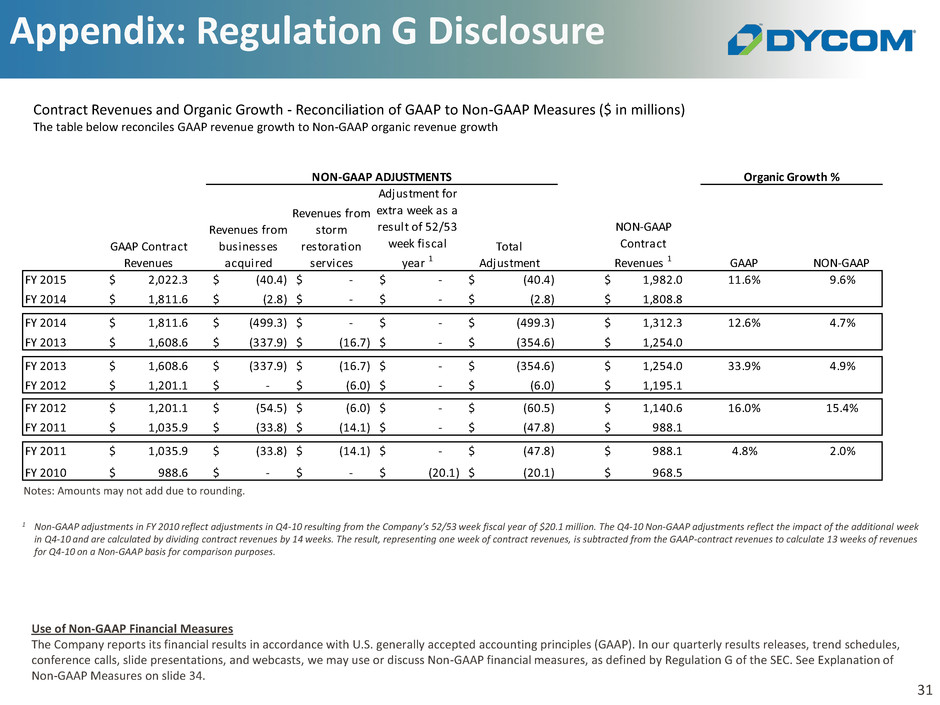
31 1 Non-GAAP adjustments in FY 2010 reflect adjustments in Q4-10 resulting from the Company’s 52/53 week fiscal year of $20.1 million. The Q4-10 Non-GAAP adjustments reflect the impact of the additional week in Q4-10 and are calculated by dividing contract revenues by 14 weeks. The result, representing one week of contract revenues, is subtracted from the GAAP-contract revenues to calculate 13 weeks of revenues for Q4-10 on a Non-GAAP basis for comparison purposes. Contract Revenues and Organic Growth - Reconciliation of GAAP to Non-GAAP Measures ($ in millions) The table below reconciles GAAP revenue growth to Non-GAAP organic revenue growth Revenues from businesses acquired Revenues from storm restoration services Adjustment for extra week as a result of 52/53 week fiscal year 1 Total Adjustment GAAP NON-GAAP FY 2015 2,022.3$ (40.4)$ -$ -$ (40.4)$ 1,982.0$ 11.6% 9.6%1,811.6 (2.8 (2.8 ,808.8 FY 2014 1,811.6$ (2.8)$ -$ -$ (2.8)$ 1,808.8$ FY 2014 1,811.6$ (499.3)$ -$ -$ (499.3)$ 1,312.3$ 12.6% 4.7%,608. 337.9 354.6 ,254.0 FY 2013 1,608.6$ (337.9)$ (16.7)$ -$ (354.6)$ 1,254.0$ FY 2013 1,608.6$ (337.9)$ (16.7)$ -$ (354.6)$ 1,254.0$ 33.9% 4.9%,2 1.1 - (6.0 ,195.1 FY 2012 1,201.1$ -$ (6.0)$ -$ (6.0)$ 1,195.1$ FY 2012 1,201.1$ (54.5)$ (6.0)$ -$ (60.5)$ 1,140.6$ 16.0% 15.4%,035.9 33.8 47.8 988.1 FY 2011 1,035.9$ (33.8)$ (14.1)$ -$ (47.8)$ 988.1$ FY 2011 1,035.9$ (33.8)$ (14.1)$ -$ (47.8)$ 988.1$ 4.8% 2.0%988.6 - (20.1) 6 .5 FY 2010 988.6$ -$ -$ (20.1)$ (20.1)$ 968.5$ GAAP Contract Revenues NON-GAAP ADJUSTMENTS NON-GAAP Contract Revenues 1 Organic Growth % Use of Non-GAAP Financial Measures The Company reports its financial results in accordance with U.S. generally accepted accounting principles (GAAP). In our quarterly results releases, trend schedules, conference calls, slide presentations, and webcasts, we may use or discuss Non-GAAP financial measures, as defined by Regulation G of the SEC. See Explanation of Non-GAAP Measures on slide 34. Notes: Amounts may not add due to rounding. Appendix: Regulation G Disclosure

32 Fiscal 2011 Fiscal 2012 Fiscal 2013 Fiscal 2014 Fiscal 2015 Adjusting Items: Write-off of deferred financing costs -$ -$ 0.3$ -$ -$ Loss on debt extinguishment, net 8.3$ -$ -$ -$ -$ Charges for settlement of wage and hour l itigation 0.6$ -$ 0.5$ 0.6$ -$ Acquisition related costs 0.2$ -$ 6.8$ -$ -$ Pre tax effect of Adjusting Items 9.1$ -$ 7.6$ 0.6$ -$ After tax effect of Adjusting Items 5.8$ -$ 4.6$ 0.4$ -$ Net income 16.1$ 39.4$ 35.2$ 40.0$ 84.3$ Provision for income taxes 12.4 25.2 23.0 26.3 51.3 Pre-tax income 28.5 64.6 58.2 66.3 135.6 Interest expense, net 15.9 16.7 23.3 26.8 27.0 Depreciation 55.7 56.2 64.8 74.5 79.3 Amortization 6.8 6.5 20.7 18.3 16.7 EBITDA 106.9 144.0 167.0 185.9 258.7 Gain on sale of fixed assets (10.2) (15.4) (4.7) (10.7) (7.1) Stock-based compensation expense 4.4 7.0 9.9 12.6 13.9 Pre-tax effect of Adjusting Items (from above) 1 9.1 - 7.6 0.6 - Non-GAAP Adjusted EBITDA 110.2$ 135.5$ 179.8$ 188.4$ 265.5$ -$ 1 Amounts exclude items already added back into the calculation of EBITDA 0 Net income 16.1$ 39.4$ 35.2$ 40.0$ 84.3$ Adjusting Items from above, after tax 5.8 - 4.6 0.4 - Non-GAAP Adjusted Net income 21.9$ 39.4$ 39.8$ 40.3$ 84.3$ Diluted Earnings Per Share Net income 0.45$ 1.14$ 1.04$ 1.15$ 2.41$ Adjusting Items from above, after tax 0.16 - 0.14 0.01 - Non-GAAP Adjusted Diluted Earnings Per Common Share 0.61$ 1.14$ 1.18$ 1.16$ 2.41$ Fully Diluted Shares (in thousands) 35,754 34,482 33,782 34,816 35,027 Reconciliation of Leverage Ratio, Net Leverage Ratio, and Fixed Interest Charge Ratios Current and long-term debt (including Note Premium) 187.8$ 187.6$ 452.0$ 457.8$ 525.6$ Note Premium on 7.125% Senior Subordinated Notes - - 3.6 3.2 2.8 Current and long-term debt (excludes Note Premium) 187.8$ 187.6$ 448.4$ 454.6$ 522.8$ less: Cash and equivalents 44.8 52.6 18.6 20.7 21.3 Net Debt (Cash) 143.0$ 135.0$ 429.8$ 433.9$ 501.5$ - - Non-GAAP Adjusted EBITDA 110.2$ 135.5$ 179.8$ 188.4$ 265.5$ Ratio of Debt to Non-GAAP Adjusted EBITDA 1.7x 1.4x 2.5x 2.4x 2.0x Ratio of Debt to EBITDA 1.8x 1.3x 2.7x 2.4x 2.0x Ratio of Net Debt (Cash) to Non-GAAP Adjusted EBITDA 1.3x 1.0x 2.4x 2.3x 1.9x- - - - - Ratio of Net Debt (Cash) to EBITDA 1.3x 0.9x 2.6x 2.3x 1.9x Ratio of EBITDA to Interest expense, net 6.7x 8.6x 7.2x 6.9x 9.6x Ratio of Non-GAAP Adjusted EBITDA to Interest expense, net 6.9x 8.1x 7.7x 7.0x 9.8x Reconciliation of Non-GAAP Adjusted EBITDA as a % of Revenue Total contract revenues 1,035.9$ 1,201.1$ 1,608.6$ 1,811.6$ 2,022.3$ EBITDA (from above) as a percentage of contract revenues 10.3% 12.0% 10.4% 10.3% 12.8% Non-GAAP Adjusted EBITDA (from above) as a percentage of contract revenues 10.6% 11.3% 11.2% 10.4% 13.1% Reconciliation of Net Income to Non-GAAP Adjusted EBITDA Reconciliation of Net Income to Non-GAAP Adjusted Net Income and Diluted EPS to Non-GAAP Adjusted Diluted EPS Notes: Amounts above may not add due to rounding. Reconciliation of Non-GAAP Financial Measures to Comparable GAAP Financial Measures Non-GAAP Adjusted EBITDA, Non-GAAP Adjusted Diluted EPS, and certain Credit Metrics Unaudited ($ in 000's, except per share amounts) Use of Non-GAAP Financial Measures: The Company reports its financial results in accordance with U.S. generally accepted accounting principles (GAAP). In our quarterly results releases, trend schedules, conference calls, slide presentations, and webcasts, we may use or discuss Non-GAAP financial measures, as defined by Regulation G of the SEC. See Explanation of Non-GAAP Measures on slide 34. Appendix: Regulation G Disclosure

33 Notes: Amounts above may not add due to rounding. Use of Non-GAAP Financial Measures: The Company reports its financial results in accordance with U.S. generally accepted accounting principles (GAAP). In our quarterly results releases, trend schedules, conference calls, slide presentations, and webcasts, we may use or discuss Non-GAAP financial measures, as defined by Regulation G of the SEC. See Explanation of Non-GAAP Measures on slide 34. Appendix: Regulation G Disclosure Reconciliation of Non-GAAP Financial Measures to Comparable GAAP Financial Measures Non-GAAP Adjusted EBITDA Unaudited ($ in 000's, except per share amounts) Q4-14 Q1-15 Q2-15 Q3-15 Q4-15 Q1-16 Q2-16 Q3-16 Adjusting Items: Loss on debt extinguishment -$ -$ -$ -$ -$ 16.3$ -$ -$ Amortization on debt discount - - - - - 1.8 4.1 4.2 Charges for settlement of wage and hour litigation 0.6 - - - - - - - Pre tax effect of Adjusting Items 0.6$ -$ -$ -$ -$ 18.0$ 4.1$ 4.2$ After tax effect of Adjusting Items 0.4$ -$ -$ -$ -$ 11.2$ 2.5$ 2.6$ Reconciliation of Net Income to Non-GAAP Adjusted EBITDA Net income 16.5$ 20.8$ 9.4$ 20.3$ 33.8$ 30.8$ 15.5$ 33.1$ Provision (benefit) for income taxes 10.7 13.5 6.1 12.0 19.6 18.6 10.0 19.4 Pre-tax income (loss) 27.2 34.3 15.6 32.3 53.4 49.5 25.5 52.5 Interest expense, net 6.6 6.7 6.7 6.6 6.9 9.1 7.9 8.0 Depreciation 18.9 18.8 19.2 19.8 21.5 22.7 25.2 27.0 Amortization 4.2 4.1 4.1 4.1 4.4 4.8 4.7 4.5 EBITDA 56.8 64.0 45.6 62.9 86.2 86.0 63.2 92.0 Gain on sale of fixed assets (2.8) (1.5) (1.7) (3.1) (0.9) (1.1) (1.0) (4.1) Stock-based compensation expense 2.9 3.9 3.7 3.2 3.2 4.5 4.2 3.9 Pre-tax effect of Adjusting Items (from above) 1 0.6 - - - - 16.3 - - Non-GAAP Adjusted EBITDA 57.5$ 66.4$ 47.6$ 63.0$ 88.5$ 105.7$ 66.4$ 91.9$ 1 Amounts exclude items already added back into the calculation of EBITDA (i.e. amortization of debt discount included in interest expense) Reconciliation of Non-GAAP Adjusted Interest Expense Interest expense, net 6.6$ 6.7$ 6.7$ 6.6$ 6.9$ 9.1$ 7.9$ 8.0$ Adjusting Items from above - - - - - (1.8) (4.1) (4.2) Non-GAAP Adjusted Interest Expense 6.6$ 6.7$ 6.7$ 6.6$ 6.9$ 7.4$ 3.8$ 3.8$ Reconciliation of Net Income to Non-GAAP Adjusted Net Income and Diluted EPS to Non-GAAP Adjusted Diluted EPS Net income 16.5$ 20.8$ 9.4$ 20.3$ 33.8$ 30.8$ 15.5$ 33.1$ Adjusting Items from above, after tax 0.4 - - - - 11.2 2.5 2.6 Non-GAAP Adjusted Net income 16.9$ 20.8$ 9.4$ 20.3$ 33.8$ 42.0$ 18.0$ 35.7$ Diluted Earnings Per Share Net income 0.47$ 0.59$ 0.27$ 0.58$ 0.97$ 0.91$ 0.46$ 1.00$ Adjusting Items from above, after tax 0.01 - - - - 0.33 0.08 0.08 Non-GAAP Adjusted Diluted Earnings Per Common Share 0.48$ 0.59$ 0.27$ 0.58$ 0.97$ 1.24$ 0.54$ 1.08$ Fully Diluted Shares (in thousands) 34,960 35,118 35,127 35,029 34,831 33,887 33,520 33,051 Reconciliation of Non-GAAP Adjusted EBITDA as a % of Revenue Total contract revenues 482.1$ 510.4$ 441.1$ 492.4$ 578.5$ 659.3$ 559.5$ 664.6$ EBITDA (from above) as a percentage of contract revenues 11.8% 12.5% 10.3% 12.8% 14.9% 13.1% 11.3% 13.8% Non-GAAP Adjusted EBITDA (from above) as a percentage of contract revenues 11.9% 13.0% 10.8% 12.8% 15.3% 16.0% 11.9% 13.8%

34 Explanation of Non-GAAP Measures The Company reports its financial results in accordance with U.S. generally accepted accounting principles (GAAP). In the Company’s quarterly results releases, trend schedules, conference calls, slide presentations, and webcasts, it may use or discuss Non-GAAP financial measures, as defined by Regulation G of the Securities and Exchange Commission. The Company believes that the presentation of certain Non-GAAP financial measures in these materials provides information that is useful to investors because it allows for a more direct comparison of the Company’s performance for the period reported with the Company’s performance in prior periods. The Company cautions that Non-GAAP financial measures should be considered in addition to, but not as a substitute for, the Company’s reported GAAP results. Management defines the Non-GAAP financial measures as follows: • Non-GAAP Organic Contract Revenues - contract revenues from businesses that are included for the entire period in both the current and prior year periods. Non-GAAP Organic Revenue growth (decline) is calculated as the percentage change in Non-GAAP Organic Contract Revenues over those of the comparable prior year period. Management believes organic growth (decline) is a helpful measure for comparing the Company’s revenue performance with prior periods. • Non-GAAP Adjusted EBITDA - net income before interest, taxes, depreciation and amortization, gain on sale of fixed assets, stock-based compensation expense, loss on debt extinguishment, and certain non-recurring items. Management believes Non-GAAP Adjusted EBITDA is a helpful measure for comparing the Company’s operating performance with prior periods as well as with the performance of other companies with different capital structures or tax rates. • Non-GAAP Adjusted Net Income - GAAP net income before loss on debt extinguishment, non-cash amortization of the debt discount, certain non-recurring items and any tax impact related to these items, and "Non-GAAP Adjusted Diluted Earnings per Common Share" as Non-GAAP Adjusted Net Income divided by weighted average diluted shares outstanding. Management excludes or adjusts each of the items identified below from Non-GAAP Adjusted Net Income and Non-GAAP Adjusted Diluted Earnings per Common Share: • Non-cash amortization of the debt discount - The Company’s 0.75% senior convertible notes due 2021 (the "Notes") were allocated between debt and equity components. The difference between the principal amount and the carrying amount of the liability component of the notes represents a debt discount. The debt discount will be amortized over the term of the notes but will not result in periodic cash interest payments. During the three months ended October 24, 2015, January 23, 2016, and April 23, 2016, the Company recognized approximately $1.8 million, $4.1 million, and $4.2 million, respectively, in pre-tax interest expense for non-cash amortization of the debt discount associated with the Notes. The Company has excluded the non-cash amortization of the debt discount from its Non-GAAP financial measures because it believes it is useful to analyze the component of interest expense for the Notes that will be paid in cash. The exclusion of the non-cash amortization from the Company’s Non-GAAP financial measures provides management with a consistent measure for assessing financial results. • Loss on debt extinguishment - The Company incurred a pre-tax charge of approximately $16.3 million for early extinguishment of debt in connection with the redemption of its 7.125% senior subordinated notes during the first quarter of fiscal 2016. Management believes excluding the loss on debt extinguishment from the Company’s Non-GAAP financial measures assists investors’ overall understanding of the Company's current financial performance. The Company believes this type of charge is not indicative of its core operating results. The exclusion of the loss on debt extinguishment from the Company’s Non-GAAP financial measures provides management with a consistent measure for assessing the current and historical financial results. • Tax impact of adjusted results - The tax impact of the adjusted results was calculated utilizing a Non-GAAP effective tax rate which approximates the Company’s effective tax rate used for financial planning. The tax impact included in the Company’s guidance for the quarter ending July 30, 2016 was calculated using an effective tax rate used for financial planning and forecasting future results. Appendix: Regulation G Disclosure

DYCOM INDUSTRIES, INC. INVESTOR PRESENTATION JUNE 2016
