Attached files
| file | filename |
|---|---|
| 8-K - AMID 8-K DATED JUNE 1, 2016 - American Midstream Partners, LP | amid8-kdatedjune12016.htm |

Investor Presentation June 2016

Cautionary statement 2 This presentation includes forward-looking statements. These statements relate to, among other things, projections of operational volumetrics and improvements, growth projects, cash flows and capital expenditures. We have used the words "anticipate,” "believe," "could," "estimate," "expect," "intend," "may," "plan," "predict," "project," "should," "will," "potential," and similar terms and phrases to identify forward-looking statements in this presentation. Although we believe the assumptions upon which these forward-looking statements are based are reasonable, any of these assumptions could prove to be inaccurate and the forward-looking statements based on these assumptions could be incorrect. Our operations and future growth involve risks and uncertainties, many of which are outside our control, and any one of which, or a combination of which, could materially affect our results of operations and whether the forward-looking statements ultimately prove to be correct. Actual results and trends in the future may differ materially from those suggested or implied by the forward-looking statements depending on a variety of factors, which are described in greater detail in our filings with the SEC. Construction of projects described in this presentation is subject to risks beyond our control including cost overruns and delays resulting from numerous factors. In addition, we face risks associated with the integration of acquired businesses, decreased liquidity, increased interest and other expenses, assumption of potential liabilities, diversion of management’s attention, and other risks associated with acquisitions and growth. Please see our Risk Factor disclosures included in our Annual Report on Form 10-K for the year ended December 31, 2015 filed on March 7, 2016 and on Form 10-Q for the quarter ended March 31, 2016 filed on May 9, 2016. All future written and oral forward-looking statements attributable to us or persons acting on our behalf are expressly qualified in their entirety by the previous statements. We undertake no obligation to update any information contained herein or to publicly release the results of any revisions to any forward-looking statements that may be made to reflect events or circumstances that occur, or that we become aware of, after the date of this presentation.
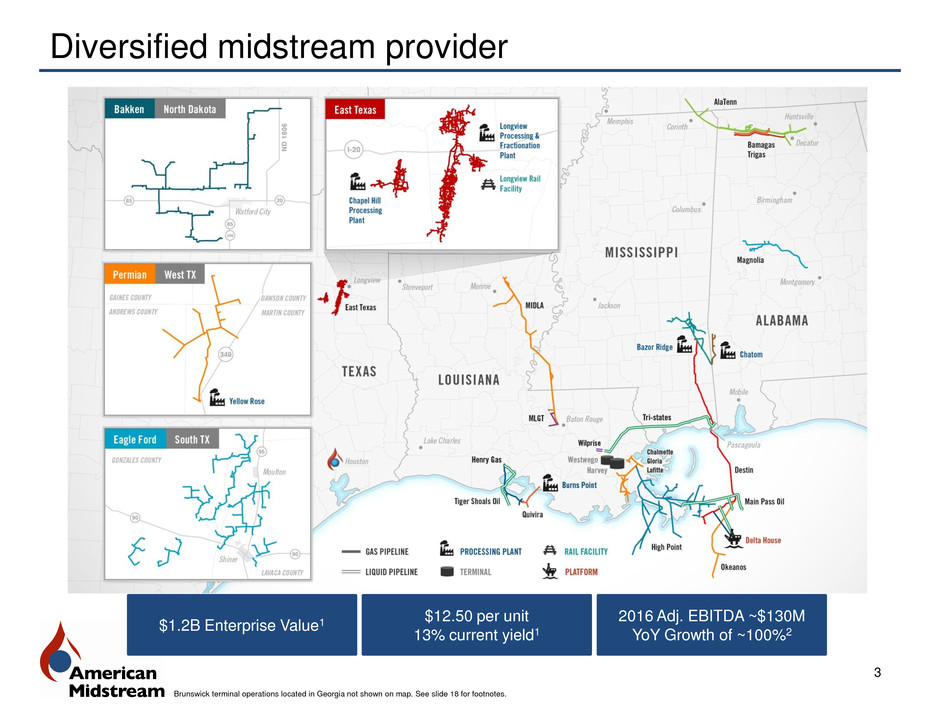
Diversified midstream provider 3 Brunswick terminal operations located in Georgia not shown on map. See slide 18 for footnotes. $1.2B Enterprise Value1 $12.50 per unit 13% current yield1 2016 Adj. EBITDA ~$130M YoY Growth of ~100%2

ArcLight $75M unit purchase program Delta House Drop Down of fee-based cash flow from deepwater Gulf of Mexico production completed at 5x Adjusted EBITDA multiple4 $45M Series A Preferred Equity 2015 4 Industry-knowledgeable sponsor with track record of multiple, accretive drop downs and significant financial support Strong growth trajectory Deliver long-term, sustainable cash flow growth • Continue to link complementary assets to create cost and commercial synergies with existing infrastructure • Repurpose underutilized assets to create new opportunities A s s et O p timi z ati o n A cq u is it io n s / D ro p D o w n s O rg anic G ro w th an d E xpa n sio n • Acquire complimentary assets to consolidate operations and enhance competitive positioning by participating across the value chain • Acquire strategic assets that provide organic growth • Continue to work with general partner on drop-down assets • Leverage development and operating expertise to establish new asset platforms within or outside existing geographic footprint • Expand key assets to develop competitive positioning within existing regions • Aggressively pursue new well connections, interconnects and markets 2016 Gulf of Mexico Acquisitions Expanded Gulf of Mexico footprint partially funded through Series C Preferred Equity3 Denver – Houston Consolidation 2013 2014 Blackwater Terminal Drop Down diversifies asset platform, adding fee-based gross margin High Point System Drop Down in the Eastern Gulf of Mexico funded through Series A Preferred Equity Equity Restructuring of IDRs incentivizes AMID Growth Series A Amendment to pay via PIK and/or cash Lavaca System Acquisition of fee-based gathering system and entry into the Eagle Ford Shale partially funded through Series B Preferred Equity Republic Midstream crude oil gathering system, central delivery terminal complex, and takeaway pipeline funded by ArcLight; AMID receives option to purchase interest in Republic 2016 ArcLight Capital acquires controlling interest in AMID general partner See slide 18 for footnotes.

Gulf of Mexico acquisitions – April 2016 5 Expands Gulf Coast footprint, improves distribution coverage and reduces leverage • Acquired multiple interests in natural gas and NGL pipelines that provide transport for rich-gas production from the Eastern Gulf of Mexico • Acquired majority interest in 200 miles of pipelines from Chevron, including the Henry Gas Gathering System, as well as an additional ~1% interest in Delta House • Total consideration of $225 million equates to multi-year Adjusted EBITDA multiple of approximately 6x • Partnership expects 2016 distribution coverage of greater than 1.5x and leverage of ~4.0x5,6 Diversifying across midstream components Improved financial flexibility Significant sponsor support Path to strong distribution coverage “The acquisition of strategic midstream infrastructure serving prolific areas of the Gulf of Mexico is an important step towards transforming American Midstream into a significant and integrated participant in offshore infrastructure, particularly in the deep-water.” Lynn Bourdon, Chairman, President and CEO See slide 18 for footnotes.

$31.9 $45.6 $66.3 2013 2014 2015 2016F $125 - $135 +100% $1.75 $1.85 $1.89 $1.65 2013 2014 2015 2016F 0.81x 1.02x >1.5x 1.08x 3.7x 4.4x 4.6x ~4.0x 2013 2014 2015 2016F 6 Improving financial strength and flexibility $16.2 $32.7 $46.6 2013 2014 2015 2016F $85 - $95 Building distribution coverage in the near-term5,6 Reducing Leverage to ~4.0x by 2016 YE5 ~100% Adjusted EBITDA Growth5 ~100% Distributable Cash Flow Growth5 +100% +0.69x (0.6)x See slide 18 for footnotes.

Compelling MLP investment Sustainable Distribution Fee-based Cash Flow Strong Balance Sheet Supportive Sponsor Growth Visibility Improved financial flexibility with conservative stance; reducing leverage to ~4.0x in 20165 Greater than 90% fee-based cash flow with investment grade-rated customers and producers Executing fee-based organic growth and actively pursuing strategic and accretive acquisitions Industry-knowledgeable sponsor with track record of multiple, accretive drop downs and significant financial support Building strong, near-term distribution coverage of greater than 1.5x5,6 7 Diversified Portfolio Well-positioned assets across multiple prolific basins and the deepwater Gulf of Mexico Experienced Team Highly experienced management team averaging 25 years of experience across operating segments See slide 18 for footnotes.
Appendix: Partnership Overview

2016 Forecast 9 ($ millions) 2016 Guidance 2015 Actual Percent change7 Adjusted EBITDA5 $125 - $135 $66.3 96.1% Distributable Cash Flow5 $85 - $95 $46.6 93.1% Growth Capital Expenditures8 $60 - $70 $126 (46.7)% Gross Margin by Segment as of Q1 2016 >90% Fee-based Cash Flow 2016+ Gathering and Processing 57% Transmission 32% Terminals 11% See slide 18 for footnotes. Fee- based >90% Other <10%

Gathering and Processing 10 Asset Overviews System1 Pipeline Design Capacity (MMcf/d) Processing Design Capacity (MMcf/d) Approx. Avg. Throughput (MMcf/d) Length of Pipeline (miles) Year Ended 12/31/14 Year Ended 12/31/15 Longview2* 50 50 21.7 17.2 620 Chapel Hill2* 20 20 18.9 14.6 90 Yellow Rose2 40 40 6.0 4.2 47 Mesquite* - - N/A N/A - Lavaca 218 N/A 65.0 119.1 203 Chatom* 25 25 6.4 5.9 24 Bazor Ridge 22 22 9.6 7.6 169 Magnolia 120 N/A 21.7 27.1 116 Burns Point N/A 200 62.9 71.4 N/A Quivira 140 N/A 44.3 45.6 34 Gloria / Lafitte 151 N/A 51.8 25.3 178 Other Systems 3 100 N/A 1.2 0.3 56 Total 886 357 309.5 338.2 1,537 Longview (East Texas) – Acquired October 2014 • Gathering system that feeds two cryogenic processing plants in Gregg County, TX • Off-spec processing includes fractionation and stabilization units with 7,000 bbls/d of condensate and off-spec NGL treating capacity Chapel Hill (East Texas) – Acquired October 2014 • Gathering system located in Tyler, TX that feeds a cryogenic processing plant, fractionation unit, 190,000 gallons of storage capacity, and truck racks to deliver propane Yellow Rose (Permian) – Acquired October 2014 • Gathering and processing system consists of low pressure, rich-gas gathering lines that feed a processing plant located in Martin County, TX Mesquite (Odessa, Texas) • Processing facility with 5,000 bbls/d high RVP condensate treatment and 5,000 bbls/d off-spec NGL treatment • Operations commenced April 2016 Lavaca (Eagle Ford) – Acquired January 2014 • Constructed in 2011 and located in the East Oil and East Gas Condensate zones of the Eagle Ford in Gonzales and Lavaca Counties, TX – 70,000 dedicated acres • Over 200 miles of low- and high-pressure pipeline ranging from three to 12 inches in diameter with over 31,000 hp of leased compression Chatom (AL / MS state line) • Gathers natural gas from onshore oil and natural gas wells in AL and MS • Provides processing, fractionation and sulfur recovery services Bazor Ridge (AL / MS state line) • Processes rich associated natural gas from oil wells targeting Upper Smackover Magnolia (AL) • Intrastate pipeline system gathers coal-bed methane in Central Alabama to sell primarily into the interstate market as well as a local distribution company, municipality, and small industrial facility • Delivers natural gas to a Transco interconnect • New SNG interconnect and additional compression added in Q4 2015 to meet customer demand Burns Point / Quivira (SE Louisiana) • Quivira gathering system originates in offshore Louisiana and terminates at Burns Point cryogenic processing plant Gloria / Lafitte (SE Louisiana) • Gloria System provides onshore and offshore natural gas gathering, compression, and processing services in SE Louisiana and Gulf of Mexico • The Lafitte gathering system delivers volumes to local refinery Bakken Crude Oil Gathering System (Bakken) – Acquired October 2014 • ~50-mile crude oil gathering system with 40,000 bbls/d of design capacity located in the core of McKenzie County, ND 1. Bakken crude oil gathering system not reflected in chart. 2. 2014 throughput reflects daily and average volume from Oct - Dec. 3. Includes Offshore Texas systems. *Longview fractionation capacity of 8,500 bbls/d; Chapel Hill 1,250 bbls/d; Chatom 1,900 bbls/d; and Mesquite 5,000 bbls/d. Longview operations, East Texas

Transmission 11 Asset Overviews High Point System (SE Louisiana) • Intrastate system connected to 75+ receipt points that collects natural gas from both onshore and offshore producing regions in SE Louisiana and the shallow-water and deep-shelf Gulf of Mexico • System comprised of FERC-regulated transmission assets and non- jurisdictional gathering assets • Gulf of Mexico water depths up to 500 feet with focus on oil and liquids-rich reservoirs • Delivers to TOCA gas processing plant, operated by Enterprise AlaTenn / Bamagas / Trigas (Primarily northern Alabama) • FERC-regulated interstate (AlaTenn) and intrastate (Bamagas and Trigas) gas pipelines supply natural gas to industrial end-users, local distribution companies, and municipal markets including cities of Athen, Decatur and Huntsville, Alabama • 100% of Bamagas capacity of 450 MMcf/d contracted under long- term firm transportation agreements Midla/MLGT (Eastern Louisiana) • FERC-regulated (“Midla”) interstate pipeline linking Monroe natural gas field in Northern Louisiana and other supply interconnects to various power plants owned by Entergy, serving local distribution companies and municipalities in Louisiana and Mississippi including Vidalia, Louisiana and Natchez, Mississippi • Midla received FERC approval to construct the Midla-Natchez pipeline with completion expected late 2016 • MLGT is an intrastate pipeline that serves the Baton Rouge Area in southern Louisiana with investment-credit grade rated customers Chalmette (SE Louisiana) • Intrastate asset serving industrial markets in Southeast New Orleans, LA System Approx. Pipeline Design Capacity (MMcf/d) Approximate Average Throughput (MMcf/d) Length of Pipeline (miles) Year Ended 12/31/14 Year Ended 12/31/15 High Point 1,120 427.3 371.6 574 AlaTenn/Bamagas/ Trigas 710 160.3 182.7 383 Midla/MLGT 518 183.8 139.7 432 Chalmette 125 7.5 14.6 39 Total 2,473 778.9 708.6 1,428 Duncanville Compressor Station, Magnolia

Terminals 12 Asset Overviews • Three facilities: Westwego, LA; Harvey, LA; Brunswick, GA • Majority of revenues derived from fee-based, “take-or-pay” storage agreements with remainder from fee-based ancillary services • Primary products stored include: caustic soda, vacuum gas oil, D.E.A., asphalt, fertilizer (UAN), synthetic drilling fluids, vegetable oils, biodiesel • Harvey is a full-service storage site, providing rail, truck, barge, and deep-water service with the potential to expand to more than 2 million barrels of storage capacity • Harvey and Westwego deep-water docks allow for vessels of up to 700 feet length overall (“LOA”) and 750 feet LOA, respectively Terminal Terminal Storage Capacity (Mbbls) Year Ended 12/31/14 Contracted Capacity 12/31/14 Year Ended 12/31/15 Contracted Capacity 12/31/15 Westwego 1,045 100% 1,045 93.9% Harvey 238 16.4% 535 72.9% Brunswick 221 100% 221 100% Total 1,504 86.8% 1,801 88.4% Harvey Deepwater Shipdock Harvey Storage Tanks
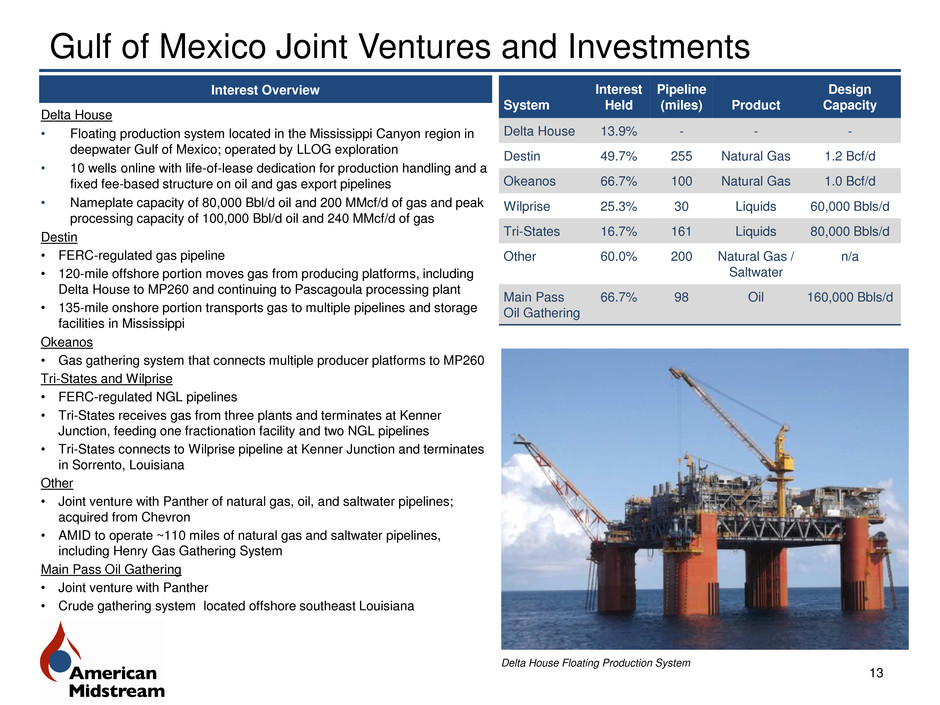
Gulf of Mexico Joint Ventures and Investments 13 Interest Overview System Interest Held Pipeline (miles) Product Design Capacity Delta House 13.9% - - - Destin 49.7% 255 Natural Gas 1.2 Bcf/d Okeanos 66.7% 100 Natural Gas 1.0 Bcf/d Wilprise 25.3% 30 Liquids 60,000 Bbls/d Tri-States 16.7% 161 Liquids 80,000 Bbls/d Other 60.0% 200 Natural Gas / Saltwater n/a Main Pass Oil Gathering 66.7% 98 Oil 160,000 Bbls/d Delta House Floating Production System Delta House • Floating production system located in the Mississippi Canyon region in deepwater Gulf of Mexico; operated by LLOG exploration • 10 wells online with life-of-lease dedication for production handling and a fixed fee-based structure on oil and gas export pipelines • Nameplate capacity of 80,000 Bbl/d oil and 200 MMcf/d of gas and peak processing capacity of 100,000 Bbl/d oil and 240 MMcf/d of gas Destin • FERC-regulated gas pipeline • 120-mile offshore portion moves gas from producing platforms, including Delta House to MP260 and continuing to Pascagoula processing plant • 135-mile onshore portion transports gas to multiple pipelines and storage facilities in Mississippi Okeanos • Gas gathering system that connects multiple producer platforms to MP260 Tri-States and Wilprise • FERC-regulated NGL pipelines • Tri-States receives gas from three plants and terminates at Kenner Junction, feeding one fractionation facility and two NGL pipelines • Tri-States connects to Wilprise pipeline at Kenner Junction and terminates in Sorrento, Louisiana Other • Joint venture with Panther of natural gas, oil, and saltwater pipelines; acquired from Chevron • AMID to operate ~110 miles of natural gas and saltwater pipelines, including Henry Gas Gathering System Main Pass Oil Gathering • Joint venture with Panther • Crude gathering system located offshore southeast Louisiana
Appendix: Non-GAAP Financial Measures

Non-GAAP Financial Measures This presentation includes forecasted and historical non-GAAP financial measures, including “Gross Margin,” “Adjusted EBITDA” and “Distributable Cash Flow.” Each has important limitations as an analytical tool because it excludes some, but not all, items that affect the most directly comparable GAAP financial measures. Management compensates for the limitations of these non-GAAP financial measures as analytical tools by reviewing the nearest comparable GAAP financial measures, understanding the differences between the measures and incorporating these data points into management’s decision-making process. You should not consider any of gross margin, Adjusted EBITDA or DCF in isolation or as a substitute for or more meaningful than our results as reported under GAAP. Gross margin, Adjusted EBITDA and DCF may be defined differently by other companies in our industry. Our definitions of these non-GAAP financial measures may not be comparable to similarly titled measures of other companies, thereby diminishing their utility. We define Adjusted EBITDA as net income (loss) attributable to the Partnership, plus interest expense, income tax expense, depreciation, amortization and accretion expense, certain non-cash charges such as non-cash equity compensation expense, unrealized losses on commodity derivative contracts, debt issuance costs, return of capital from unconsolidated affiliates, transaction expenses and selected charges that are unusual or nonrecurring, less interest income, income tax benefit, unrealized gains on commodity derivative contracts, and selected gains that are unusual or nonrecurring. The GAAP measure most directly comparable to our performance measure Adjusted EBITDA is Net income (loss) attributable to the Partnership. DCF is a significant performance metric used by us and by external users of the Partnership's financial statements, such as investors, commercial banks and research analysts, to compare basic cash flows generated by us to the cash distributions we expect to pay the Partnership's unitholders. Using this metric, management and external users of the Partnership's financial statements can compute the coverage ratio of estimated cash flows to planned cash distributions. DCF is also an important financial measure for the Partnership's unitholders since it serves as an indicator of the Partnership's success in providing a cash return on investment. Specifically, this financial measure may indicate to investors whether we are generating cash flow at a level that can sustain or support an increase in the Partnership's quarterly distribution rates. DCF is also a quantitative standard used throughout the investment community with respect to publicly traded partnerships and limited liability companies because the value of a unit of such an entity is generally determined by the unit's yield (which in turn is based on the amount of cash distributions the entity pays to a unitholder). DCF will not reflect changes in working capital balances. We define DCF as Adjusted EBITDA plus interest income, less cash paid for interest expense, normalized maintenance capital expenditures, and dividends related to the Series A and Series C convertible preferred units. The GAAP financial measure most comparable to DCF is Net income (loss) attributable to the Partnership. The GAAP measure most directly comparable to forecasted Adjusted EBITDA and DCF is forecasted net income (loss) attributable to the Partnership. Net income (loss) attributable to the Partnership is forecasted to be approximately $20 million to $25 million in 2016. Segment gross margin and gross margin are metrics that we use to evaluate our performance. We define segment gross margin in our Gathering and Processing segment as revenue generated from gathering and processing operations and realized gains or (losses) on commodity derivatives, less the cost of natural gas, crude oil, NGLs and condensate purchased and revenue from construction, operating and maintenance agreements ("COMA"). Revenue includes revenue generated from fixed fees associated with the gathering and treatment of natural gas and crude oil and from the sale of natural gas, crude oil, NGLs and condensate resulting from gathering and processing activities under fixed-margin and percent-of-proceeds arrangements. The cost of natural gas, NGLs and condensate includes volumes of natural gas, NGLs and condensate remitted back to producers pursuant to percent-of-proceeds arrangements and the cost of natural gas purchased for our own account, including pursuant to fixed-margin arrangements. We define segment gross margin in our Transmission segment as revenue generated from firm and interruptible transportation agreements and fixed-margin arrangements, plus other related fees, less the cost of natural gas purchased in connection with fixed-margin arrangements. Substantially all of our gross margin in this segment is fee-based or fixed-margin, with little to no direct commodity price risk. We define segment gross margin in our Terminals segment as revenue generated from fee-based compensation on guaranteed firm storage contracts and throughput fees charged to our customers less direct operating expense which includes direct labor, general materials and supplies and direct overhead. We define gross margin as the sum of our segment gross margin for our Gathering and Processing, Transmission and Terminals segments. The GAAP measure most directly comparable to gross margin is net income (loss) attributable to the Partnership. 15

Appendix: Non-GAAP Financial Measures 16 (a) Excludes amortization of debt issuance costs and mark-to-market adjustments related to interest rate derivatives. (b) Represents quarterly maintenance capital expenditures in each given period, which is what the Partnership expects to be required to maintain assets over the long term.
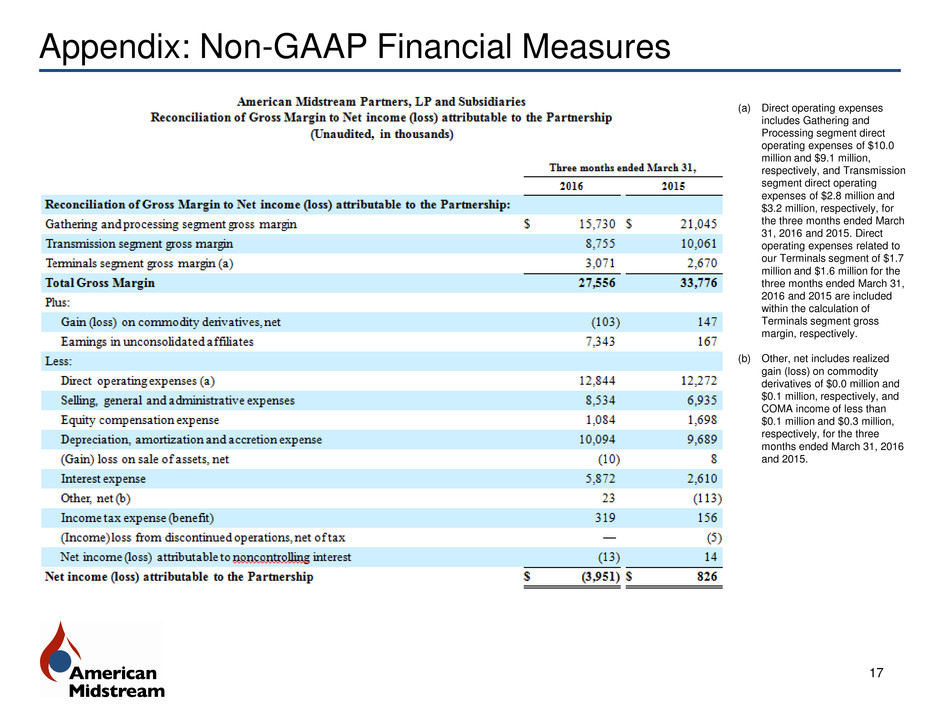
Appendix: Non-GAAP Financial Measures 17 (a) Direct operating expenses includes Gathering and Processing segment direct operating expenses of $10.0 million and $9.1 million, respectively, and Transmission segment direct operating expenses of $2.8 million and $3.2 million, respectively, for the three months ended March 31, 2016 and 2015. Direct operating expenses related to our Terminals segment of $1.7 million and $1.6 million for the three months ended March 31, 2016 and 2015 are included within the calculation of Terminals segment gross margin, respectively. (b) Other, net includes realized gain (loss) on commodity derivatives of $0.0 million and $0.1 million, respectively, and COMA income of less than $0.1 million and $0.3 million, respectively, for the three months ended March 31, 2016 and 2015.
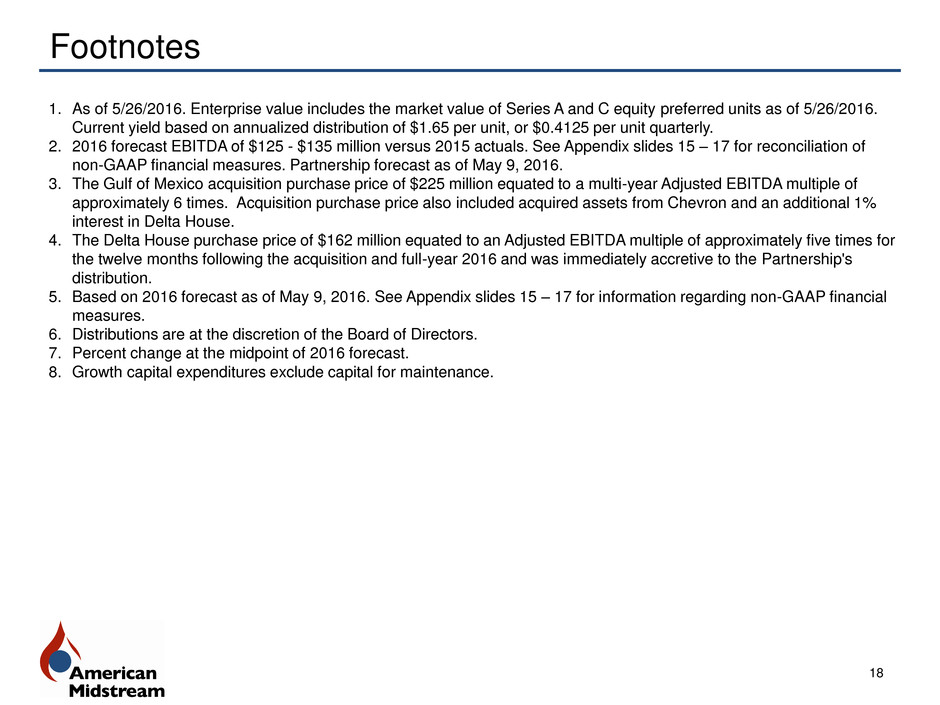
Footnotes 18 1. As of 5/26/2016. Enterprise value includes the market value of Series A and C equity preferred units as of 5/26/2016. Current yield based on annualized distribution of $1.65 per unit, or $0.4125 per unit quarterly. 2. 2016 forecast EBITDA of $125 - $135 million versus 2015 actuals. See Appendix slides 15 – 17 for reconciliation of non-GAAP financial measures. Partnership forecast as of May 9, 2016. 3. The Gulf of Mexico acquisition purchase price of $225 million equated to a multi-year Adjusted EBITDA multiple of approximately 6 times. Acquisition purchase price also included acquired assets from Chevron and an additional 1% interest in Delta House. 4. The Delta House purchase price of $162 million equated to an Adjusted EBITDA multiple of approximately five times for the twelve months following the acquisition and full-year 2016 and was immediately accretive to the Partnership's distribution. 5. Based on 2016 forecast as of May 9, 2016. See Appendix slides 15 – 17 for information regarding non-GAAP financial measures. 6. Distributions are at the discretion of the Board of Directors. 7. Percent change at the midpoint of 2016 forecast. 8. Growth capital expenditures exclude capital for maintenance.
