Attached files
| file | filename |
|---|---|
| 8-K - FORM 8-K - American Finance Trust, Inc | v441407_8k.htm |
Exhibit 99.1

A Public Non - Traded Real Estate Investment Trust* First Quarter 2016 Investor Presentation

2 Risk Factors Investing in our common stock involves a high degree of risk . See the section entitled “Risk Factors” in our most recent Annual Report on Form 10 - K for a discussion of the risks which should be considered in connection with American Finance Trust, Inc . (“AFIN” or the “Company”) Forward - Looking Statements This presentation may contain forward - looking statements . You can identify forward - looking statements by the use of forward - looking terminology such as “believes,” “expects,” “may,” “will,” “would,” “could,” “should,” “seeks,” “intends,” “plans,” “projects,” “estimates,” “anticipates,” “predicts,” or “potential” or the negative of these words and phrases or similar words or phrases . Please review the end of this presentation and the Company’s most recent Annual Report on Form 10 - K for a more complete list of risk factors, as well as a discussion of forward - looking statements and other details. American Finance Trust, Inc. IMPORTANT INFORMATION 2

American Finance Trust, Inc. 3 PORTFOLIO UPDATE: AS OF 3/31/2016 ▪ Strong Portfolio: 467 net lease assets with over 67% investment grade (1) tenants and 1 senior commercial mortgage loan as of March 31, 2016 ▪ 1 st Quarter Acquisitions: During the 1 st quarter of 2016, AFIN acquired 4 FedEx Ground distribution properties with a weighted average remaining lease term of 9.5 years ▪ Leverage: 47.9% total debt to total assets with a weighted average effective interest rate of 4.77% ▪ Flexible C ash P osition: Cash balance of $130.8 million provides operational flexibility ▪ Selective Acquisitions: Management will continue to evaluate real e state properties and real estate debt investments throughout 2016 ▪ Net A sset V alue: On March 17, 2016, the Company’s independent directors unanimously reaffirmed an estimated per - share net asset value (“Estimated Per - Share NAV”) equal to $24.17 as of December 31, 2015 ▪ Distribution R ate : AFIN continues to pay an annualized distribution per share of $1.65, or 6.83% based on the most recent Estimated Per - Share NAV (1) Calculated based on straight - line rent on a weighted - average basis.

American Finance Trust, Inc. 4 SUNTRUST UPDATE: SUBSEQUENT Q2 EVENT 1) For 209 properties, the lease agreements were set to expire December 31, 2017; the remaining 4 properties had lease expirations on March 31, 2018 . » AFIN had leasing agreements with SunTrust Bank (“SunTrust”) that were set to expire on December 31, 2017 (1) ▪ As of March 31, 2016 AFIN owned 213 SunTrust properties, and its leases represented 18% of total annualized rental income on a straight - line basis (“SLR”) – AFIN’s largest tenant » On May 12, 2016, AFIN and SunTrust executed various agreements to extend leases for the majority of the 213 SunTrust properties AFIN and SunTrust have Executed an Agreement to Extend the Majority of SunTrust Leases for 10+ years Lease Extensions Include x Long - term lease extensions with significant annual rent increases x 1.50% annually for 10+ years Increases WAVG Remaining Lease Term x Increases the overall AFIN weighted average lease term profile x Weighted average remaining lease term increases by 18% up to 9.8 years Mitigates Risk x Effectively eliminates significant uncertainty associated with SunTrust x SunTrust is a key tenant and an investment grade credit

American Finance Trust, Inc. 5 ($ and Sq. Ft. in millions) # of Properties 467 Rentable Square Feet 13.4 Number of Tenants 43 Number of Industries 18 Leased 100% Weighted Average Remaining Lease Term (1) 8.3 years SLR Expiring in Next 5 Years (2) 22% Actual / Implied Investment Grade (3) (% of SLR) 67% / 71% SLR $165.0 ($ and Sq. Ft. in millions) # of Properties 459 Rentable Square Feet 13.3 Number of Tenants 43 Number of Industries 18 Leased 100% Weighted Average Remaining Lease Term (1) 9.8 years SLR Expiring in Next 5 Years (2) 9% Actual / Implied Investment Grade (3) (% of SLR) 67% / 71% SLR $165.3 AFIN’s real estate portfolio, as of May 12, 2016, consists of $2.2 billion of net lease real estate assets measuring 13.3 million rentable square feet » Weighted average lease term has been increased to nearly 10 years, providing greater visibility and certainty of rental income streams » Increased SLR, despite a smaller asset base, highlights the higher productivity of the AFIN portfolio » A portion of the debt balance was paid off, reducing the Company’s future interest expense 1) Lease term remaining, calculated on a weighted average basis as of May 12, 2016. 2) Based on SLR that expires on or before March 31, 2021. 3) Actual ratings reflect the tenant rating. Implied Ratings are determined using a proprietary Moody’s analytical tool which co mpa res the risk metrics of the non - rated company to those of a company with an Actual Rating. A tenant with a parent that has an investment grade rating is included in implied investm ent grade. Ratings information is as of March 31, 2016 AFIN Portfolio – Prior to SunTrust Deal (as of 3/31/16) AFIN Portfolio – Post SunTrust Deal (as of 5/12/16) SUNTRUST UPDATE: SUBSEQUENT Q2 EVENT

American Finance Trust, Inc. 6 AFIN PORTFOLIO STRENGTH: PRO FORMA SUNTRUST AGREEMENT Property Type (1) Tenant Credit Rating (1 )(2) » Diverse, retail focused property mix » Over 71% Actual & Implied Investment Grade Tenant Ratings Tenant Industry (1) 1) Graphs percentages are based on $165.3 million of SLR as of May 12, 2016, which includes the new SunTrust lease terms . 2) Actual ratings reflect the tenant rating. Implied Ratings are determined using a proprietary Moody’s analytical tool which compares the risk metrics of the non - rated company to those of a company with an Actual Rating. A tenant with a parent that has an investment grade rating is included in implied investment grade. Ratings information is as of March 31, 2016 . » AFIN’s tenants operate in 18 different industries Retail 45.3% Office 29.3% Distribution 25.4% Retail Banking 19% Healthcare 15% Distribution 12% Financial Services 12% Refrigerated Warehousing 8% Supermarket 7% Restaurant 7% Home Maintenance 6% Pharmacy 4% Other 10% Actual IG 67.4% Implied IG 4.1% Actual Non - IG 20.2% Implied Non - IG and Not Rated 8.3%

American Finance Trust, Inc. 7 DEMAND FOR NET - LEASE CONTINUES (1) As of 5/20/2016 Favorable supply/demand fundamentals persist: supply of the net lease sector compressed by approximately 3 % quarter over quarter in Q1 2016 Private institutional and foreign investors are expected to remain active through the remainder of the year. Assets with strong credit and term will remain key for these buyers Single - tenant acquisitions by institutional buyers increased 9 % year over year in 2015, a result of ongoing focus on diversification and yield Net - lease buyers continue to operate in a market with favorable cost of borrowing with the 10 year treasury still under 2% (1) Diversification into secondary markets is growing. In Q1 2016, secondary market sales represented 50% of deal volume, compared to 44% for 2015 Sources: The Boulder Group: The Net Lease Market Report Q1 2016 JLL: Net Lease Investment Outlook Q1 2016
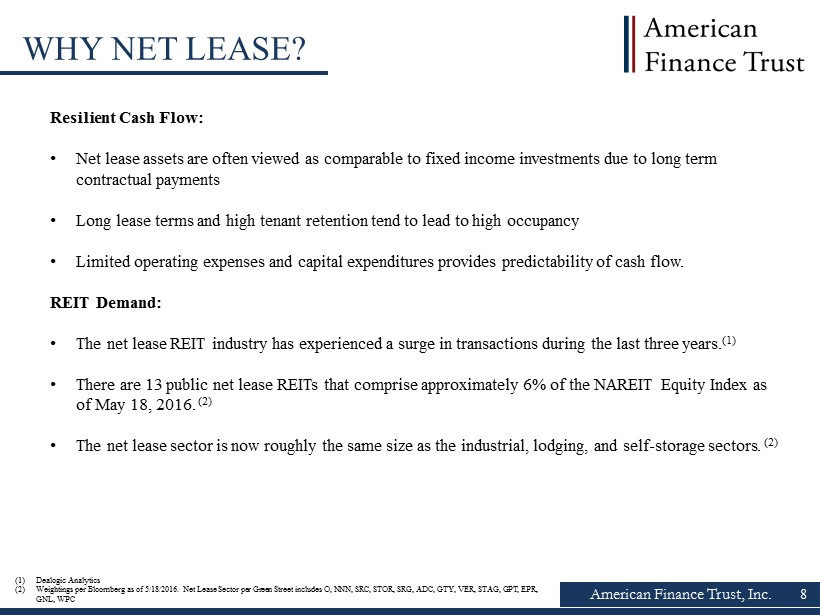
American Finance Trust, Inc. 8 WHY NET LEASE? Resilient Cash Flow: • Net lease assets are often viewed as comparable to fixed income investments due to long term contractual payments • Long lease terms and high tenant retention tend to lead to high occupancy • Limited operating expenses and capital expenditures provides predictability of cash flow. REIT Demand: • The net lease REIT industry has experienced a surge in transactions during the last three years. (1) • There are 13 public net lease REITs that comprise approximately 6% of the NAREIT Equity Index as of May 18, 2016. (2) • The net lease sector is now roughly the same size as the industrial, lodging, and self - storage sectors. (2) (1) Dealogic Analytics (2) Weightings per Bloomberg as of 5/18/2016. Net Lease Sector per Green Street includes O, NNN, SRC, STOR, SRG, ADC, GTY, VER, STA G, GPT, EPR, GNL, WPC

American Finance Trust, Inc. 9 FINANCIAL OVERVIEW • As of 3/31/2016, AFIN had cash and cash equivalents of $130.8 million. • Future short - term operating liquidity requirements are met through a combination of cash on hand, cash from operations and proceeds from secured mortgage financings. • The leverage ratio as of 3/31/2016 is 47.9 %. American Finance Trust, Inc. Balance Sheet Metrics – 3/31/2016 (all in $000s) Total Real Estate Investments, at Cost $2,253,230 Less: Accumulated Depreciation and Amortization (241,676) Total Real Estate Investments, Net 2,011,554 Cash and Cash Equivalents 130,794 Commercial mortgage loan, held for investment, net 17,142 Other Assets 30,739 Total Assets $2,190,229 Debt Outstanding: Mortgage Notes Payable (1) $1,048,435 Total Debt Outstanding 1,048,435 Other Liabilities 47,730 Total Liabilities 1,096,165 Total Equity 1,094,064 Total Liabilities and Equity $2,190,229 Total Debt / Total Assets 47.9% (1) Mortgage Notes Payable reflects the gross payable balance, including mortgage premiums, net and $18.9 million of net deferred financing costs.
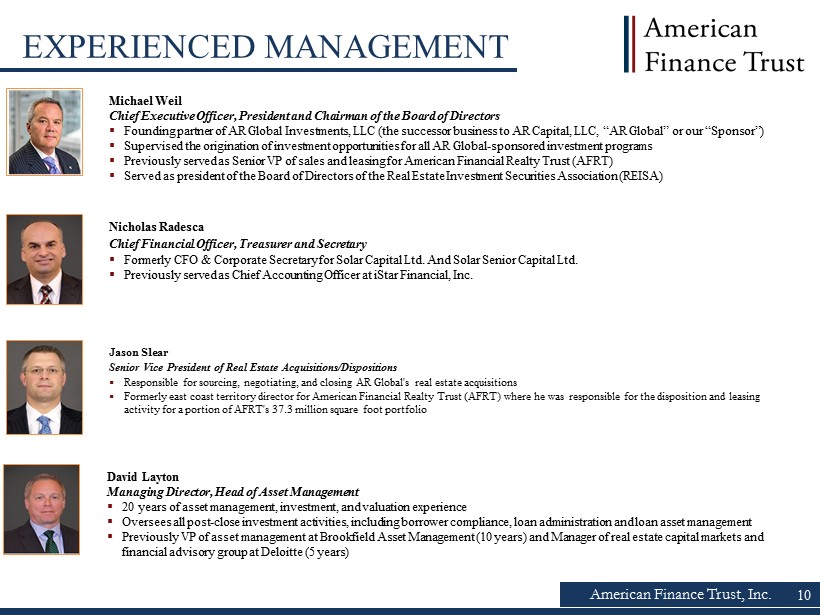
10 American Finance Trust, Inc. 10 EXPERIENCED MANAGEMENT David Layton Managing Director, Head of Asset Management ▪ 20 years of asset management, investment, and valuation experience ▪ Oversees all post - close investment activities, including borrower compliance, loan administration and loan asset management ▪ Previously VP of asset management at Brookfield Asset Management (10 years) and Manager of real estate capital markets and financial advisory group at Deloitte (5 years) Nicholas Radesca Chief Financial Officer, Treasurer and Secretary ▪ Formerly CFO & Corporate Secretary for Solar Capital Ltd. And Solar Senior Capital Ltd. ▪ Previously served as Chief Accounting Officer at iStar Financial, Inc. Michael Weil Chief Executive Officer, President and Chairman of the Board of Directors ▪ Founding partner of AR Global Investments, LLC (the successor business to AR Capital, LLC, “AR Global” or our “Sponsor”) ▪ Supervised the origination of investment opportunities for all AR Global - sponsored investment programs ▪ Previously served as Senior VP of sales and leasing for American Financial Realty Trust (AFRT) ▪ Served as president of the Board of Directors of the Real Estate Investment Securities Association (REISA) Jason Slear Senior Vice President of Real Estate Acquisitions/Dispositions ▪ Responsible for sourcing, negotiating, and closing AR Global's real estate acquisitions ▪ Formerly east coast territory director for American Financial Realty Trust (AFRT) where he was responsible for the dispositio n a nd leasing activity for a portion of AFRT's 37.3 million square foot portfolio

11 American Finance Trust, Inc. RISK FACTORS 11 Our potential risks and uncertainties are presented in the section titled “Item 1 A . Risk Factors” disclosed in our Annual Report on Form 10 - K for the year ended December 31 , 2015 and our Quarterly Reports on Form 10 - Q filed from time to time . The following are some of the risks and uncertainties, although not all risks and uncertainties, that could cause our actual results to differ materially from those presented in our forward - looking statements : ▪ All of our executive officers are also officers, managers or holders of a direct or indirect controlling interest in American Finance Advisors, LLC (our "Advisor") or other entities under common control with AR Global . As a result, our executive officers, our Advisor and its affiliates face conflicts of interest, including significant conflicts created by our Advisor's compensation arrangements with us and other investment programs advised by affiliates of our Sponsor and conflicts in allocating time among these entities and us, which could negatively impact our operating results . ▪ Although we previously announced our intention to list our shares of common stock on the New York Stock Exchange, there can be no assurance that our shares of common stock will be listed . No public market currently exists, or may ever exist, for shares of our common stock and our shares are, and may continue to be, illiquid . ▪ We depend on tenants for our rental revenue and, accordingly, our rental revenue is dependent upon the success and economic viability of our tenants . ▪ Our tenants may not achieve our rental rate incentives and our expenses could be greater, which may impact our results of operations .

12 American Finance Trust, Inc. RISK FACTORS 12 ▪ We have not generated, and in the future may not generate, operating cash flows sufficient to cover 100 % of our distributions, and, as such, we may be forced to source distributions from borrowings, which may be at unfavorable rates, or depend on our Advisor to waive reimbursement of certain expenses or fees . There is no assurance that our Advisor will waive reimbursement of expenses or fees . ▪ We may be unable to pay or maintain cash distributions at the current rate or increase distributions over time . ▪ We are obligated to pay fees, which may be substantial, to our Advisor and its affiliates . ▪ We are subject to risks associated with any dislocation or liquidity disruptions that may exist or occur in the credit markets of the United States of America . ▪ We may fail to continue to qualify to be treated as a real estate investment trust for U . S . federal income tax purposes, which would result in higher taxes, may adversely affect our operations and would reduce the value of an investment in our common stock and our cash available for distributions . ▪ We may be deemed by regulators to be an investment company under the Investment Company Act of 1940 , as amended (the "Investment Company Act"), and thus subject to regulation under the Investment Company Act .
AmericanFinanceTrust.com ▪ For account information, including balances and the status of submitted paperwork, please call us at (866) 902 - 0063 ▪ Financial Advisors may view client accounts, statements and tax forms at www.dstvision.com ▪ Shareholders may access their accounts at www.ar - global.com