Attached files
| file | filename |
|---|---|
| EX-23.3 - EX-23.3 - VALVOLINE INC | d176840dex233.htm |
| EX-23.2 - EX-23.2 - VALVOLINE INC | d176840dex232.htm |
| EX-23.1 - EX-23.1 - VALVOLINE INC | d176840dex231.htm |
Table of Contents
As filed with the Securities and Exchange Commission on May 31, 2016
Registration No. 333-
UNITED STATES
SECURITIES AND EXCHANGE COMMISSION
Washington, D.C. 20549
FORM S-1
REGISTRATION STATEMENT
UNDER
THE SECURITIES ACT OF 1933
Valvoline Inc.
(Exact name of registrant as specified in its Charter)
| Kentucky | 2992 | 30-0939371 | ||
| (State or other jurisdiction of incorporation or organization) |
(Primary Standard Industrial Classification Code Number) |
(I.R.S. Employer Identification No.) |
3499 Blazer Parkway
Lexington, KY 40509
(859) 357-7777
(Address, including zip code, and telephone number, including area code, of registrant’s principal executive office)
Samuel J. Mitchell, Jr.
Chief Executive Officer
Valvoline Inc.
3499 Blazer Parkway
Lexington, KY 40509
(859) 357-7777
(Name, address, including zip code, and telephone number, including area code, of agent for service)
With a copy to:
| Peter J. Ganz Senior Vice President, General Counsel and Secretary Ashland Inc. 50 E. RiverCenter Boulevard P.O. Box 391 Covington, KY 41012-0391 (859) 815-3333 |
Susan Webster Thomas E. Dunn Andrew J. Pitts Cravath, Swaine & Moore LLP Worldwide Plaza 825 Eighth Avenue New York, NY 10019 (212) 474-1000 |
Jonathan M. DeSantis Ilir Mujalovic Shearman & Sterling LLP 599 Lexington Avenue New York, NY 10022 (212) 848-4000 |
Approximate date of commencement of proposed sale to the public: As soon as practicable after the effective date of this registration statement.
If any of the securities being registered on this Form are to be offered on a delayed or continuous basis pursuant to Rule 415 under the Securities Act of 1933, check the following box. ¨
If this Form is filed to register additional securities for an offering pursuant to Rule 462(b) under the Securities Act, check the following box and list the Securities Act registration statement number of the earlier effective registration statement for the same offering. ¨
If this Form is a post-effective amendment filed pursuant to Rule 462(c) under the Securities Act, check the following box and list the Securities Act registration statement number of the earlier effective registration statement for the same offering. ¨
If this Form is a post-effective amendment filed pursuant to Rule 462(d) under the Securities Act, check the following box and list the Securities Act registration statement number of the earlier effective registration statement for the same offering. ¨
Indicate by check mark whether the registrant is a large accelerated filer, an accelerated filer, a non-accelerated filer, or a smaller reporting company. See the definitions of “large accelerated filer,” “accelerated filer” and “smaller reporting company” in Rule 12b-2 of the Exchange Act. (check one)
| Large Accelerated filer | ¨ | Accelerated filer | ¨ | |||
| Non-accelerated filer | x (Do not check if a smaller reporting company) | Smaller reporting company | ¨ | |||
CALCULATION OF REGISTRATION FEE
|
| ||||
| Title of Each Class of Securities to be Registered |
Proposed Maximum Offering Price(1)(2) |
Amount of Registration Fee | ||
| Common stock, par value $0.01 per share |
$100,000,000 | $10,070 | ||
|
| ||||
|
| ||||
| (1) | Estimated solely for the purpose of computing the amount of the registration fee pursuant to Rule 457 under the Securities Act of 1933. |
| (2) | Includes the aggregate offering price of shares of common stock that the underwriters have the option to purchase. |
The registrant hereby amends this registration statement on such date or dates as may be necessary to delay its effective date until the registrant shall file a further amendment which specifically states that this registration statement shall thereafter become effective in accordance with Section 8(a) of the Securities Act of 1933, as amended, or until the registration statement shall become effective on such date as the Securities and Exchange Commission, acting pursuant to Section 8(a), may determine.
Table of Contents
The information in this prospectus is not complete and may be changed. We may not sell these securities until the registration statement filed with the Securities and Exchange Commission is effective. This prospectus is not an offer to sell these securities and it is not soliciting an offer to buy these securities in any state where the offer or sale is not permitted.
Subject to Completion
Preliminary Prospectus dated May 31, 2016
PROSPECTUS
Shares
Valvoline Inc.
Common Stock
This is Valvoline Inc.’s initial public offering. We are selling shares of our common stock.
We expect the public offering price to be between $ and $ per share. Currently, no public market exists for the shares. After pricing of the offering, we expect that the shares will trade on the New York Stock Exchange under the symbol “VVV.”
Investing in the common stock involves risks that are described in the “Risk Factors” section beginning on page 19 of this prospectus.
| Per Share | Total | |||||||
| Public offering price |
$ | $ | ||||||
| Underwriting discount and commissions(1) |
$ | $ | ||||||
| Proceeds, before expenses, to us |
$ | $ | ||||||
| (1) | See “Underwriting” section beginning on page 167 of this prospectus for additional information regarding total underwriter compensation. |
The underwriters may also exercise their option to purchase up to an additional shares from us, at the public offering price, less the underwriting discount, to cover over allotments for 30 days after the date of this prospectus.
Neither the Securities and Exchange Commission nor any state securities commission has approved or disapproved of these securities or determined if this prospectus is truthful or complete. Any representation to the contrary is a criminal offense.
The shares will be ready for delivery on or about , 2016.
Joint Book-Running Managers
| BofA Merrill Lynch | Citigroup | Morgan Stanley |
The date of this prospectus is , 2016.
Table of Contents
| Page | ||||
| ii | ||||
| ii | ||||
| ii | ||||
| 1 | ||||
| 19 | ||||
| 40 | ||||
| 41 | ||||
| 42 | ||||
| 43 | ||||
| 44 | ||||
| 46 | ||||
| 49 | ||||
| Management’s Discussion and Analysis of Financial Condition and Results of Operations |
57 | |||
| 89 | ||||
| 108 | ||||
| 112 | ||||
| 148 | ||||
| 153 | ||||
| 154 | ||||
| 155 | ||||
| 162 | ||||
| Material U.S. Federal Income Tax Consequences for Non-U.S. Holders of Our Common Stock |
164 | |||
| 167 | ||||
| 175 | ||||
| 175 | ||||
| 175 | ||||
| F-1 | ||||
We have not and the underwriters have not authorized anyone to provide you with any information other than that contained in this prospectus or in any free writing prospectus prepared by or on behalf of us or to which we have referred you. We are offering to sell, and seeking offers to buy, shares of our common stock only in jurisdictions where such offers and sales are permitted. The information in this prospectus or any free writing prospectus is accurate only as of its date, regardless of its time of delivery or the time of any sale of shares of our common stock. Our business, financial condition, results of operations and prospects may have changed since that date.
Through and including , 2016 (the 25th day after the date of this prospectus), all dealers effecting transactions in these securities, whether or not participating in this offering, may be required to deliver a prospectus. This is in addition to a dealer’s obligation to deliver a prospectus when acting as an underwriter and with respect to an unsold allotment or subscription.
i
Table of Contents
FOR INVESTORS OUTSIDE THE UNITED STATES
Neither we nor the underwriters have done anything that would permit this offering or possession or distribution of this prospectus in any jurisdiction where action for that purpose is required, other than the United States. You are required to inform yourselves about and to observe any restrictions relating to this offering and the distribution of this prospectus.
TRADEMARKS, TRADE NAMES AND SERVICE MARKS
We use various trademarks, trade names and service marks in our business, including ValvolineTM, Valvoline Instant Oil ChangeSM, MaxLifeTM, SynPowerTM and Premium BlueTM. For convenience, we may not include the SM, ® or ™ symbols, but such omission is not meant to indicate that we would not protect our intellectual property rights to the fullest extent allowed by law. Any other trademarks, trade names or service marks referred to in this prospectus are the property of their respective owners.
This prospectus includes industry data and forecasts that we obtained from industry publications and surveys, public filings and internal company sources. Industry publications, surveys and forecasts generally state that the information contained therein has been obtained from sources believed to be reliable, but there can be no assurance as to the accuracy or completeness of the included information. Statements as to our ranking, market position and market estimates are based on independent industry publications, third-party forecasts, management’s estimates and assumptions about our markets and our internal research. We have not independently verified such third-party information nor have we ascertained the underlying economic assumptions relied upon in those sources, and we cannot assure you of the accuracy or completeness of such information contained in this prospectus. Such data involve risks and uncertainties and is subject to change based on various factors, including those discussed under “Risk Factors” and “Cautionary Statement Regarding Forward-Looking Statements.”
ii
Table of Contents
This summary highlights certain information about us and this offering contained elsewhere in this prospectus. This summary does not contain all of the information you should consider before investing in our common stock. You should read this entire prospectus carefully, especially the “Risk Factors” section and our financial statements and the related notes included elsewhere in this prospectus, before making an investment decision.
As used in this prospectus, the terms “Valvoline,” the “Company,” “we,” “us” and “our” may, depending on the context, refer to Valvoline Inc., to the Valvoline business segment of Ashland Inc. as described more particularly under “Certain Relationships and Related Party Transactions—Relationship with Ashland—Historical Relationship with Ashland” or to Valvoline Inc. and its consolidated subsidiaries after giving effect to the contribution and separation transactions described under “Certain Relationships and Related Party Transactions—Relationship with Ashland—Separation Steps.”
We describe in this prospectus the businesses that will be contributed to us by Ashland as part of our separation from Ashland as if they were our businesses for all historical periods described. Our historical financial results as part of Ashland contained in this prospectus may not reflect our financial results in the future as a standalone company or what our financial results would have been had we been a standalone company during the periods presented.
Immediately prior to the closing of this offering, Ashland Inc. and we will become subsidiaries of Ashland Global Holdings Inc., or “Ashland Global,” a newly formed public holding company. Accordingly, as used in this prospectus, references to “Ashland” in the context of any time prior to the date of this offering refer to Ashland Inc., and references to “Ashland” in the context of any time on or after the date of this offering refer to Ashland Global. At the time of the contribution (as described below), Ashland and certain of its consolidated subsidiaries (other than us) will hold substantially all of the historical assets and liabilities related to the business that Valvoline Inc. and its consolidated subsidiaries will acquire pursuant to the contribution.
Our fiscal year ends on September 30 of each year. We refer to the year ended September 30, 2015 as “fiscal 2015,” the year ended September 30, 2014 as “fiscal 2014” and the year ended September 30, 2013 as “fiscal 2013.”

Our Company
We are one of the most recognized and respected premium consumer brands in the global automotive lubricant industry, known for our high quality products and superior levels of service. Established in 1866, our heritage spans 150 years, during which we have developed powerful name recognition across multiple product and service channels. We have significant positions in the United States in all of the key lubricant sales channels, and also have a strong international presence with our products sold in approximately 140 countries.
In the United States and Canada, our products are sold to consumers through over 30,000 retail outlets, to installer customers with over 12,000 locations, and to approximately 1,050 Valvoline branded franchised and company-owned stores. We serve our customer base through an extensive sales force and technical support organization, allowing us to leverage our technology portfolio and customer relationships globally, while meeting customer demands locally. This combination of scale and strong local presence is critical to our success.
1
Table of Contents
We have a history of leading innovation with revolutionary products such as All Climate™, DuraBlend™, and MaxLife™. In addition to our iconic Valvoline-branded passenger car motor oils and other automotive lubricant products, we provide a wide array of lubricants used in heavy duty equipment, as well as automotive chemicals and fluids designed to improve engine performance and lifespan. Our premium branded product offerings enhance our high quality reputation and provide our customers with solutions that address a wide variety of needs.
We deliver products and services to our customers across three business segments:
| • | Core North America: We sell to consumers in the United States and Canada who perform their own automotive maintenance, referred to as “Do-It-Yourself” or “DIY” consumers, through retail outlets, including AutoZone, O’Reilly Auto Parts and Advance Auto Parts. We also sell to installer customers such as car dealers, general repair shops and third-party quick lube locations, including Goodyear, Monro, Express Oil Change, TBC Retail Group and Sears, directly and through distributors. Installers use our products to service vehicles owned by “Do-It-For-Me” or “DIFM” consumers. Our installer channel team also sells branded products and solutions to heavy duty customers, such as on-highway fleets and construction companies, and we have a strategic relationship with Cummins Inc. (“Cummins”), a leading heavy duty engine manufacturer, for co-branding products in the heavy duty business. |
| • | Quick Lubes: We operate the second-largest United States retail quick lube service chain by number of stores, Valvoline Instant Oil Change (“VIOC”), which provides fast, trusted service through approximately 720 franchised and 330 company-owned stores. Our VIOC company-owned stores have had nine years of consecutive same-store sales growth,* and consistently outperformed our competitors, delivering on average over 36% more daily oil changes during 2015 than competing quick lube service centers. Our franchisees have also enjoyed strong results, performing on average 22% more daily oil changes in 2015 than competitors. We also sell our products and provide Valvoline branded signage to independent quick lube operators through our Express Care program. In 2015, we estimate that VIOC and Express Care stores performed approximately 13% of the total oil changes in the quick lube market. |
| • | International: Our products are sold in approximately 140 countries outside of the United States and Canada, where, like in Core North America, Valvoline is positioned as a high performance, high quality brand. International sales include both passenger car products and heavy duty products used in a wide variety of heavy duty equipment. We sell our passenger car products to installer customers primarily through distributors, and our heavy duty products directly to customers, as well as through distributors. |
| * | We have historically determined same-store sales growth on a fiscal year basis, with new stores excluded from the metric until the completion of their first full fiscal year in operation. |
2
Table of Contents
Sales and Adjusted EBITDA contribution of each of our segments is as follows:
| Fiscal 2015 Sales Contribution |
Fiscal 2015 Adj. EBITDA Contribution | |
|
FY15 Sales: $2.0 Billion |
FY15 Adjusted EBITDA: $422 Million |
In fiscal 2015, we generated approximately $2.0 billion in sales, $422 million in Adjusted EBITDA and $196 million in net income. During the same period, our Adjusted EBITDA margin, which we define as Adjusted EBITDA as a percentage of sales, was 21.5%. In addition, we generated free cash flow of $285 million and cash flows provided by operating activities of $330 million during fiscal 2015. See “—Summary Historical and Pro Forma Combined Financial Data” for the definition of Adjusted EBITDA and free cash flow, each a non-GAAP measure, and a reconciliation of such measures to net income and cash flows provided by operating activities, as applicable.
Our Value Proposition and Business Model
Founded in 1866, the Valvoline brand stands for high quality and performance, allowing us to command premium pricing for our products. The strength of our business model is our ability to generate profitable sales across multiple channels to market, leveraging the Valvoline brand through effective marketing, innovative product technology and the capabilities of our team. We have delivered strong profits and return on capital, with balanced results across all of our sales channels. Today, Valvoline is a high margin, high free cash flow generating business, with significant growth opportunities across all of our business segments.
Our successful business model is further strengthened by our commitment to partnering with customers and channel partners to drive value-creating solutions. We drive growth by providing cutting edge innovations, high-quality products and dedicated customer service. Our “Hands on Expertise” customer service model, which pairs our deep automotive knowledge with a commitment to developing unparalleled customer solutions, is designed to help us outperform our competitors.
A Rich History of Innovation

We have a 150 year history of industry-leading innovation. The company’s history dates back to 1866, when Dr. John Ellis discovered the lubricating properties of crude oil. Valvoline was trademarked six years later, making it the first trademarked motor oil in U.S. history. By 1895 we began to cement our place in American racing culture, when a Valvoline lubricated race car won the first known automotive race in North American history. In the early 1900s, the Valvoline brand gained national prominence as one of the recommended motor oils for the iconic Ford Model T.
3
Table of Contents
During the 20th century, we furthered our tradition of innovation, pioneering one of the world’s first aircraft engine motor oils, developing All-Climate Motor Oil, which eliminated the need for seasonal oil changes, and introducing Valvoline Racing Motor Oil, which became, and is to this day, one of the best-selling racing motor oils of all time. In 1987, we expanded into the quick lube market with the acquisition of an 81 store chain. Two years later we franchised our first five VIOC stores. In 1998, we began a partnership with Cummins, a leading global designer, manufacturer and distributor of engines, filtration and power generation products, that includes the sale of Cummins-endorsed Valvoline lubricants such as Premium Blue™ heavy duty engine oil. We have been selling products outside the United States for over 90 years, and now sell products in approximately 140 countries.
We continued to be a leader in the lubricants industry in product innovation with the introduction of DuraBlend™ in 1996, our first synthetic motor oil blend, and MaxLife™ in 2000, the first motor oil specifically engineered for cars with over 75,000 miles. We continue to invest significant resources in our research and development programs and in developing relationships with original equipment manufacturers (“OEMs”) with a goal of creating new and innovative products to meet the current and future needs of our customers. It is this spirit of performance and innovation that has made us into a global business today and that we believe will continue to drive our growth in the future.
Our Market
We participate in the global finished lubricants market, which had demand of over 11.7 billion gallons, or $60 billion, in 2015. For the same period, demand for passenger car motor oil and motorcycle oil accounted for slightly over 24% of global lubricant demand, while the remaining 76% of demand was for commercial and industrial products. The United States has historically accounted for the largest amount of lubricant demand, followed by China and India. The lubricants market is impacted by the following key drivers and trends:
| • | Shift in Demand for High Performance Products: Global lubricants market demand is shifting towards higher performance finished lubricants, largely driven by advancements in vehicle/equipment design and OEM requirements for improved efficiency, reduced carbon footprints and optimized fuel consumption. This shift in customer demand requires high-end formulations from lubricant manufacturers and leads to ongoing investment in top tier base stocks (Group II/II+ and Group III/III+ base oils) to support synthetics growth in developed markets, like the United States. Establishing strong product lines of synthetic and bio-based lubricants have become key competitive aspects to attract OEMs focused on equipment efficiency and environmental sustainability. In many non-U.S. markets, older engine technologies remain more prevalent. We believe there will be an opportunity for increased sales of our high performance products as these engines are replaced by newer technology engines. |
| • | Environmental Health and Safety Regulations: There has been increasingly stringent regulation, particularly in North America and Europe, aimed at reducing toxic emissions, which has led to a continuous drive for innovation given changing specifications for lubricants. Recent regulatory trends include: European Commission Regulations; the Registration, Evaluation, Authorization, and Restriction of Chemicals (“REACH”) regulation; Euro Regulations; the Clean Air Act; and more stringent vehicle emission requirements. |
4
Table of Contents
Our Competitive Strengths
We believe the following strengths differentiate us from our competitors and are important to our success:
Iconic Brand with Premium Products
| Valvoline is a highly recognized and respected premium consumer brand. According to our research, we have a total awareness rate of 90% with consumers in the United States, and in many countries around the globe the Valvoline trademark is a symbol of high quality, which helps us to command premium prices. We are known for our high quality products, market leading technology and superior levels of service.
The consistent application of the Valvoline brand across all channels provides us with a significant marketing advantage. We use a variety of marketing techniques to build awareness of our |

|
brand, including social and digital media, search, direct marketing, radio and television. In addition, we selectively sponsor teams in high performance racing series, including a current sponsorship of Hendrick Motorsports, featuring drivers Dale Earnhardt Jr., Chase Elliott, Jimmie Johnson and Kasey Kahne. We believe our iconic brand and strong customer awareness support our ability to grow our retail base in existing and new markets.
Unique Multi-Channel Presence
We operate through multiple automotive maintenance outlets and are committed to delivering an outstanding customer experience against a diverse set of customer expectations, leveraging our strong channel partner and quick lube network. Whether the customer is a consumer driving in for a differentiated VIOC quick lube experience, an installer looking to improve the performance of its business, a heavy duty customer looking to effectively service on-road and off-road vehicles or a DIY consumer looking for high quality products to service their vehicles, we leverage our “Hands on Expertise” to provide a solution to their unique and individual needs.
Within our DIY and DIFM sales channels, we have been successful in driving premium lubricants growth through effective consumer marketing and strong retailer relationships, resulting in Valvoline holding a #3 position by volume in the United States DIY market in 2015. Within our Quick Lubes business, our “Hands on Expertise” approach is a differentiating factor and has led to nine consecutive years of VIOC company-owned same-store sales growth and resulted in VIOC being the #2 quick lube chain by store count in 2015. Internationally, we sell our products in approximately 140 countries and our relationships with leading OEMs have provided us with the opportunity to leverage the Valvoline brand to increase global growth and awareness in key markets. In particular, we have a strong partnership with Cummins, a leading global designer, manufacturer and distributor of engines, filtration and power generation products, that includes joint ventures in India and China and global marketing and product co-branding arrangements.
Industry-Leading, Valvoline-Branded Quick Lube Business
With over 330 company-owned VIOC stores and another 720 franchised locations, we are the largest franchisor of quick lube stores that owns and operates its own oil change centers. VIOC is committed to providing our customers with a quick, easy and trusted oil change experience. We believe that our ability to deliver an outstanding customer experience is based on the quality of our teams and their focus on execution and customer satisfaction. Our proprietary point-of-sale system allows us to leverage data, understand our customers’
5
Table of Contents
needs and customize service recommendations for each of our customers. SuperPro, our proprietary service process that sets forth rigorous protocols for both the steps that must be followed in the service of vehicles and for interactions with customers, is designed to deliver a consistently outstanding customer experience.
Operating our own stores allows us to continually improve all aspects of our business model, from store operations to marketing tactics, which enhances the profitability of our company-owned and franchised operations. In addition, our company-owned VIOC locations provide us with first-hand knowledge of the customer experience. We use this knowledge to improve the speed and quality of our services, resulting in performance improvements at our own stores, as well as the stores of our franchisees. Our focus on the total customer experience has resulted in consistently high customer satisfaction rates. We have had nine consecutive years of same-store sales growth, due in part to improved customer service experience and an increase in the number of oil changes per day. In addition, the visibility of approximately 1,050 VIOC and 340 Express Care stores across the United States further strengthens our brand in the markets in which our quick lube stores operate. As seen below, our company-owned VIOC stores have outperformed the competition in oil changes per day since 2009. Our franchisees have also enjoyed strong performance by executing the same business model.
Oil Changes Per Day, Per Store
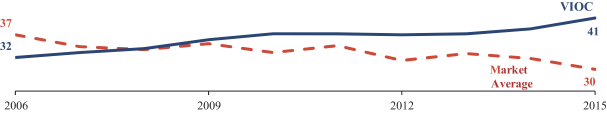
Note: Represents fiscal years.
Source: National Oil and Lube News.
We believe our vertical integration through our Quick Lubes business is an additional competitive advantage. By selling our own, high-quality motor oil and family of products to our owned stores, our franchisees and other quick lube channel partners, we generate value for the overall enterprise, as well as an additional profit pool.
Strong History of Innovation
We believe that innovation is central to the successful performance of our business. As a result, we invest significant resources in our research and development programs and in developing relationships with OEMs, with a goal of developing new and innovative products to meet the current and future needs of our customers. We have an established track record of pioneering new product categories, such as synthetic blends, high mileage motor oil and racing motor oil. The introduction of MaxLifeTM and Full Synthetic High Mileage has driven significant trade-up to our higher performing synthetic and other premium products, contributing to both retailer and installer profitability.
Innovations in our sales and marketing efforts have been a cornerstone of our success. We place a high priority on sales and marketing, with a focus on the following areas, which we believe yield the highest benefits:
| • | targeted innovative digital marketing, which has allowed us to more efficiently reach our consumers with relevant messaging; |
6
Table of Contents
| • | consumer relationship marketing and social media platforms, which provide forums for ongoing dialogue with consumers to increase brand commitment; and |
| • | selective investment in national advertising and sponsorships, including our current sponsorship of Hendrick Motorsports, featuring drivers Dale Earnhardt Jr., Chase Elliott, Jimmie Johnson and Kasey Kahne, which builds on our brand’s strong equity with racing fans. |
Independent, Focused Organization
Under the leadership of our Chief Executive Officer, Samuel J. Mitchell, Jr., our management team has extensive experience in the consumer products and lubricants industry in the areas of commercial operations, sales, marketing and research and development. Our leadership team has instituted a strong, unified corporate culture focused on speed and “Hands On” customer service. Our efficient global network of businesses and technical, supply chain and product support groups allow us to bring solutions to the market quickly. Our entire business, unlike our largest competitors, is focused on lubricants and automotive maintenance, enabling us to stay customer focused.
Our separation from Ashland will provide us the flexibility to invest in Valvoline’s growth initiatives and to act quickly in making decisions for the benefit of the business, our channel partners, customers and shareholders. We will enhance our strategic focus by aligning corporate support functions, such as information technology, human resources and finance, to the distinct needs of our business, providing greater control over both strategy and execution. As a standalone public company, we will be able to more effectively pursue our distinct operating priorities and strategies and our management will be able to solely focus on our opportunities for long-term growth and profitability.
Strong Financial Performance and Free Cash Flow Generation
Our high margin business is able to generate significant free cash flow. Our premium mix improvements, VIOC same-store sales growth, international volume and profit growth and proactive approach to changes in the base oil market resulted in fiscal 2015 Adjusted EBITDA of $422 million and Adjusted EBITDA margin of 21.5%. Strong earnings combined with efficient working capital management have led to high free cash flow, which grew from $133 million in fiscal 2014 to $285 million in fiscal 2015. This strong free cash flow provides us with significant financial flexibility.
Our Business and Growth Strategy
| “We are building the world’s
leading engine and automotive maintenance business
|

We intend to achieve sustainable growth and profitability by executing the following strategies:
7
Table of Contents
Grow and Strengthen Quick Lube Network
We are committed to growing the footprint of our profitable quick lube network. We expect this growth to be driven by both organic store expansion and opportunistic, high-quality acquisitions in both core and new markets within the VIOC system, as well as strong sales efforts to partner with new Express Care operators. In addition, we plan to continue delivering same-store sales growth within our existing stores.
VIOC Geographic Footprint as of March 31, 2016
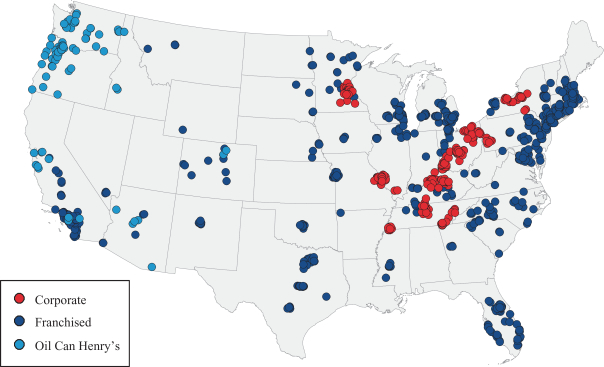
| • | Organic Store Expansion: We currently operate 330 company-owned and have an additional 720 franchised quick lube centers across 44 states. Given the strength of our brand and new unit economics, we believe we can continue growing our network in both new and existing company and franchise markets. Independently owned Express Care locations display Valvoline branding in exchange for a contractual obligation to purchase Valvoline motor oil and other products. We believe that continued expansion of our Express Care program will continue to provide wider exposure to our brand by penetrating channels, primarily smaller (typically single store) operators, which do not fit our franchised model and typically offer other non-quick lube services such as auto repair and car washes. |
| • | Opportunistic Acquisitions: There are over 9,000 known quick lube stores in the United States, the ownership of which, excluding the few largest networks of service centers, is largely fragmented. We believe that the large and fragmented nature of the North American quick lube market creates an opportunity for us to grow. Our distribution relationships in the DIFM installer space can be leveraged along with VIOC’s proprietary modeling tools to execute an acquisition strategy for both the larger, known systems, as well as smaller operators. VIOC’s acquisition of Oil Can Henry’s in February 2016 added 89 stores to our Quick Lube portfolio in the Pacific Northwest, Colorado, Arizona and southern California. We expect to continue to opportunistically look at acquisitions as a way of supplementing our organic store growth. |
8
Table of Contents
| • | Continue to Drive Additional Growth and Profitability from Existing Stores: We have generated nine consecutive years of VIOC same-store sales growth. We plan to continue delivering growth through the following strategies: |
| ¡ | Attract New Customers and Increase Customer Satisfaction and Loyalty: We strive to attract new customers through our targeted digital marketing efforts, which allows us to be more efficient and effective in reaching our prospective new customers. Our existing VIOC customers value our proposition as a quick, easy and trusted operator. Our proprietary point-of-sale system allows us to better understand our customers’ needs and develop performance drivers that enhance the productivity of our company-owned and franchised operations. Following the introduction of our enhanced SuperPro 10 in 2006, we have been able to deliver quicker and more consistent service times, and have seen improvements in both our overall customer satisfaction scores and retention. Our “Hands on Expertise” culture and approach has been essential in unifying our 10,000 member team across our approximately 1,050 VIOC company-owned and franchised stores towards delivering a preferred customer experience. |
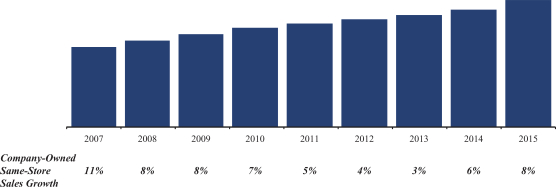
| ¡ | Increase Average Ticket Size: Between 2007 and 2015, average net ticket at our company-owned VIOC stores increased from $53.22 to $69.07. Given our focus on customer experience, our proprietary point-of-sale system, and our ability to pilot new concepts in our stores, we believe we can continue to strengthen average net ticket through improvements within our selling of premium oils, penetration of extra services, discount efficiency and pricing opportunities. |
Company-Owned Store Sales, 2007 – 2015
Accelerate International Growth across Key Markets
Our International business currently accounts for approximately 26% of combined sales. We plan to accelerate our growth internationally by focusing on key markets where demand for premium lubricants is growing. Our primary targets include China, India and select countries in Latin America. Our strategies for growth vary by market, but generally revolve around building strong distribution channels in underserved geographies, replacing less successful distributors and improving brand awareness among installer customers in those regions.
The sales, marketing and distribution capabilities that we have developed in the United States, combined with the strength of our brand, will assist our international expansion. We believe that large integrated oil brands are more focused on their upstream business in many of our targeted international markets, while local competitors often are not competitive in premium product categories. Operational expertise will allow us to benefit from these market dynamics at the same time that stricter regulations of emissions and fuel economy are increasing demand for more advanced lubricants.
9
Table of Contents
We also plan to expand our presence in the heavy duty lubricant space, which is an important channel in our targeted international markets, by developing products that will lower the total cost of ownership for fleet operators and users of other heavy duty equipment, leveraging our existing relationships with leading OEMs and building and strengthening other OEM relationships. These long-term relationships provide credibility to our International business, and we believe they will allow us to leverage the Valvoline brand to increase growth in key markets globally.
Leverage Innovation to Drive Market Share and Profitability in Core North America
Innovations in product development, packaging and marketing have driven improvements in our product mix, with United States premium-branded lubricant sales volume increasing to approximately 40% of total sales volume in 2015, up from approximately 31% in 2011.
We believe that our focus on innovation will continue to drive premium lubricant mix improvement in addition to increasing sales of our broader product portfolio, such as Valvoline Professional Series service chemicals, coolants, filters and other non-lubricant products. We plan to continue to grow higher margin synthetic sales, consistent with increased customer demand for these products due to OEM requirements.
We intend to leverage our expertise to continue to add significantly more value to our installer customers than our more cost-driven competitors. We do this by sharing our knowledge in sales, marketing and supply chain management to help them grow their businesses through improvements in customer acquisition, retention and sales volume. We believe that our differentiated service approach will allow us to continue to charge premium prices while growing our overall business.
We are also investing in e-commerce solutions with our existing business partners and a new digital infrastructure that will be used across our enterprise. We believe that this digital infrastructure will improve the speed, innovation and efficiency of our business, and also drive more effective customer engagement, acquisition and retention. Being able to interact with our customers when they need information will provide accurate real time access to training, marketing programs, product recommendations and order status and will differentiate us from our competition by building a more efficient customer-facing organization.
Ashland Ownership and Our Separation from Ashland
Prior to the completion of this offering, we will be a wholly owned subsidiary of Ashland. Immediately prior to the completion of this offering, we plan to amend and restate our articles of incorporation and by-laws and increase the total number of authorized shares of our common stock. In this prospectus, we refer to these transactions collectively as the “recapitalization.” After the completion of this offering, Ashland will own % of our outstanding common stock (or % if the underwriters exercise their overallotment option in full).
In connection with this offering, we and Ashland intend to enter into agreements and take certain actions to transfer to us substantially all of the assets and liabilities related to our business. Except for the nominal assets that we currently hold, Ashland holds all of the historical assets and liabilities related our business. We and Ashland will enter into a separation agreement that provides for the separation of our business from Ashland to take effect no later than the closing of this offering (the “Separation Agreement”). We also intend to enter into a tax matters agreement with Ashland that will govern the respective rights, responsibilities and obligations of Ashland and us after the closing of this offering with respect to all tax matters (including tax liabilities, tax attributes, tax returns and tax contests) (the “Tax Matters Agreement”). In addition, we and Ashland will enter into transition services agreements governing Ashland’s provision of various services to us, and our provision of various services to Ashland, on a transitional basis, and several other ancillary agreements in connection with the contribution and separation. In this prospectus, references to the “contribution” refer to Ashland’s transfer to us
10
Table of Contents
(in connection with certain reorganization transactions) of the assets and liabilities related to our business, and the term “separation” refers to the separation of our business from Ashland’s other businesses (including the contribution), along with the effectiveness of various agreements between us and Ashland. See “Certain Relationships and Related Party Transactions.”
Prior to the closing of this offering, we expect to incur new senior term loans (which may be secured or unsecured), new senior unsecured notes or a combination thereof in an aggregate principal amount of approximately $ million. We expect to transfer the proceeds of this indebtedness to Ashland through intercompany transfers. We also plan to obtain an accounts receivable securitization facility with up to $ million of available funding from qualified receivables. We refer to the transactions related to this incurrence of debt collectively as the “related financing transactions.” In addition to this indebtedness, in the event that the net proceeds of this offering are expected to exceed $ million, we may incur certain short-term indebtedness immediately prior to the closing of this offering and transfer the net proceeds thereof to a subsidiary of Ashland Global. See “Description of Indebtedness.” We plan to repay such short-term indebtedness in full from the net proceeds of this offering. We also intend to use the net proceeds of this offering to repay $ million of our indebtedness, with an interest rate of %. Any remaining proceeds will be used for general corporate purposes. See “Use of Proceeds.”
Ashland has informed us that, at some time in the future, but no earlier than the expiration of the 180-day lock-up period described under “Underwriting,” it intends to effect a tax-free spin-off of its remaining ownership interest in us to its shareholders (the “spin-off”). Ashland has no obligation to effect the spin-off and it may retain its ownership interest in us indefinitely or dispose of all or a portion of its ownership interest in us in a sale or other transaction. Any such spin-off or other disposition by Ashland of its remaining interest in us (an “other disposition”) would be subject to various conditions, including receipt of an opinion of tax counsel in connection with the spin-off, receipt of any necessary regulatory or other approvals and the existence of satisfactory market conditions. The conditions to a spin-off or other disposition by Ashland may not be satisfied. Ashland has no obligation to pursue or consummate any further disposition of its ownership interest in us by any specified date or at all, whether or not these conditions are satisfied.
We believe, and Ashland has advised us that it believes, that the separation, this offering and the spin-off will provide a number of benefits to our business, to Ashland’s business and to Ashland’s shareholders. These potential benefits include improving the strategic and operational flexibility of both companies, increasing the focus of the management teams on their respective business operations, and allowing each company to adopt the capital structure, investment policy and dividend policy best suited to its financial profile and business needs. In addition, as we will be a standalone company, potential investors will be able to invest directly in our business.
Risks Affecting Our Business
Investing in our common stock involves a high degree of risk. You should carefully consider the risks described in “Risk Factors” before making a decision to invest in our common stock. If any of these risks actually occurs, our business, financial condition and results of operations would likely be negatively affected. In such case, the trading price of our common stock would likely decline, and you may lose part or all of your investment. These risks include, but are not limited to:
| • | damage to our reputation or brand; |
| • | failure to meet the growth goals for our business; |
| • | reduced demand for our products or services as a result of market or other factors; |
| • | downward pressure on prices and margins due to competition; |
11
Table of Contents
| • | the loss of any of our largest customers; |
| • | failure to develop and successfully market new products and implement our digital platforms; |
| • | our substantial indebtedness and other liabilities; |
| • | failure to achieve the expected benefits and successfully execute the separation; |
| • | potential tax liabilities that may be created as a result of the spin-off or the separation; |
| • | operating as an independent publicly traded company, including compliance with applicable laws and regulations; and |
| • | our status as a controlled company and the possibility that Ashland’s interests may conflict with yours. |
Company Information
We were incorporated in Kentucky on May 13, 2016 in connection with our planned separation from Ashland. Our principal executive offices are at 3499 Blazer Parkway, Lexington, Kentucky 40509 and our telephone number is (859) 357-7777. Our website is http://www.valvoline.com. The information and other content contained on our website are not part of this prospectus.
12
Table of Contents
The Offering
| Issuer |
Valvoline Inc. |
| Common stock offered by us in this offering |
shares ( shares if the underwriters exercise their overallotment option in full) |
| Common stock to be held by Ashland immediately after this offering |
shares |
| Common stock to be outstanding immediately after this offering |
shares ( shares if the underwriters exercise their overallotment option in full) |
| Underwriters’ option |
We have granted the underwriters an option for a period of 30 days after the date of this prospectus to purchase up to additional shares of common stock solely to cover over allotments. |
| Use of proceeds |
We estimate that the net proceeds from this offering, after deducting the underwriting discount and estimated offering expenses payable by us, will be approximately $ million (or approximately $ million if the underwriters’ overallotment option is exercised in full), assuming that the shares of our common stock to be sold in this offering are sold at $ per share, the midpoint of the price range set forth on the cover page of this prospectus. |
| We intend to use the net proceeds of this offering to repay $ million of indebtedness, with an interest rate of %. As described in “Description of Indebtedness,” we may incur certain short-term indebtedness in the amount of $ million, with an interest rate of %, immediately prior to the closing of this offering. If we incur this short-term indebtedness, we plan to repay such short-term indebtedness in full with the net proceeds of this offering. Any remaining proceeds will be used for general corporate purposes. See “Use of Proceeds.” |
| Dividend policy |
We expect to pay quarterly cash dividends to holders of our common stock. The declaration and payment of dividends to holders of our common stock will be at the discretion of our board of directors in accordance with applicable law after taking into account various factors, including our financial condition, operating results, current and anticipated cash needs, cash flows, impact on our effective tax rate, indebtedness, legal requirements and other factors that our board of directors deems relevant. In addition, the instruments governing our indebtedness may limit our ability to pay dividends. |
| Risk factors |
You should read the “Risk Factors” section of this prospectus for a discussion of factors to consider carefully before deciding to invest in shares of our common stock. |
| Proposed NYSE symbol |
We intend to apply for listing of our common stock on the NYSE under the symbol “VVV.” |
13
Table of Contents
Unless indicated otherwise, the number of shares of common stock to be outstanding after this offering is based on shares of common stock outstanding as of , 2016 and excludes:
Unless otherwise indicated, the information presented in this prospectus:
| • | gives effect to the transactions described under “Certain Relationships and Related Party Transactions—Relationship with Ashland—Separation Steps;” |
| • | assumes that the shares of our common stock to be sold in this offering are sold at $ per share, the midpoint of the price range set forth on the cover page of this prospectus; and |
| • | assumes the underwriters will not exercise their overallotment option. |
14
Table of Contents
Summary Historical and Pro Forma Combined Financial Data
The following financial data should be read in conjunction with our audited and unaudited combined financial statements and the related notes, and our unaudited pro forma condensed combined financial statements and the related notes, included elsewhere in this prospectus.
The following table summarizes our historical and pro forma combined financial data. The summary historical combined balance sheet data as of September 30, 2015 and 2014 and statement of operations data for the years ended September 30, 2015, 2014, and 2013 is derived from our audited combined financial statements included elsewhere in this prospectus. The summary historical combined financial data as of and for the six months ended March 31, 2016 and 2015 is derived from our unaudited interim combined financial statements included elsewhere in this prospectus. The historical combined balance sheet data as of September 30, 2013 is derived from our unaudited annual combined financial statements, which are not included in this prospectus. In the opinion of management, the unaudited combined financial statements include all normal and recurring adjustments that we consider necessary for a fair presentation of the financial position and the operating results for these periods. The operating results for the six months ended March 31, 2016 are not necessarily indicative of the results that may be expected for the year ended September 30, 2016 or any other interim periods or any future year or period.
The summary historical combined financial data includes certain expenses of Ashland that were allocated to us for certain corporate functions including, treasury, legal, accounting, insurance, information technology, payroll administration, human resources, stock incentive plans and other services. Management believes the assumptions underlying the combined financial statements, including the assumptions regarding allocated expenses, reasonably reflect the utilization of services provided to or the benefit received by us during the periods presented. However, these shared expenses may not represent the amounts that we would have incurred had we operated autonomously or independently from Ashland. Actual costs that would have been incurred if we had been a standalone company would depend on multiple factors, including organizational structure and strategic decisions in various areas, such as information technology and infrastructure. In addition, our summary historical combined financial data does not reflect changes that we expect to experience in the future as a result of our separation from Ashland, including changes in our cost structure, personnel needs, tax structure, capital structure, financing and business operations.
The summary pro forma combined financial data reflects the impact of certain transactions, which comprise the following:
| • | the recapitalization, the contribution and the separation; |
| • | the receipt of approximately $ in net proceeds from the sale of shares of our common stock in this offering at an assumed initial offering price of $ per share, the midpoint of the price range set forth on the cover page of this prospectus, after deducting the underwriting discount and commissions and estimated offering expenses payable by us, and the use of approximately $ of these proceeds to repay indebtedness; |
| • | the indebtedness to be incurred in the related financing transactions; and |
| • | other adjustments described in the notes to the unaudited pro forma condensed combined financial statements. |
The unaudited pro forma condensed combined balance sheet reflects the separation as if it occurred on March 31, 2016, while the unaudited pro forma condensed combined statements of operations give effect to the separation as if it occurred on October 1, 2014, the beginning of the earliest period presented. The pro forma adjustments, described in “Unaudited Pro Forma Condensed Combined Financial Statements,” are based on currently available information and certain assumptions that management believes are reasonable. Excluded from the pro forma adjustments are items that are non-recurring in nature or are not material.
The unaudited pro forma condensed combined financial statements are provided for illustrative purposes only and are not necessarily indicative of the operating results or financial position that would have occurred had
15
Table of Contents
the separation from Ashland been completed on March 31, 2016 for the unaudited pro forma condensed combined balance sheet or on October 1, 2014 for the unaudited pro forma condensed combined statements of operations. The unaudited pro forma condensed combined financial statements should not be relied on as indicative of the historical operating results that we would have achieved or any future operating results or financial position that we will achieve after the completion of this offering.
The following summary combined financial data should be read in conjunction with “Management’s Discussion and Analysis of Financial Condition and Results of Operations” and the “Unaudited Pro Forma Condensed Combined Financial Statements” and accompanying notes and the interim and annual combined financial statements and accompanying notes included elsewhere in this prospectus.
| Pro forma | Historical | |||||||||||||||||||||||||||
| (Dollars in millions) | Six months ended March 31, |
Year ended September 30, |
Six months ended March 31, |
Year ended September 30, |
||||||||||||||||||||||||
| 2016 | 2015 | 2016 | 2015 | 2015 | 2014 | 2013 | ||||||||||||||||||||||
| (unaudited) | (unaudited) | (unaudited) | (unaudited) | |||||||||||||||||||||||||
| Statement of Operations Data: |
||||||||||||||||||||||||||||
| Sales |
$ | $ | $ | 935.7 | $ | 973.4 | $ | 1,966.9 | $ | 2,041.3 | $ | 1,996.2 | ||||||||||||||||
| Cost of sales |
567.9 | 634.9 | 1,281.8 | 1,408.9 | 1,338.3 | |||||||||||||||||||||||
|
|
|
|
|
|
|
|
|
|
|
|
|
|
|
|||||||||||||||
| Gross profit |
367.8 | 338.5 | 685.1 | 632.4 | 657.9 | |||||||||||||||||||||||
| Selling, general and administrative |
137.4 | 128.4 | 290.8 | 302.8 | 213.4 | |||||||||||||||||||||||
| Corporate expense allocation |
41.1 | 39.2 | 79.5 | 95.0 | 88.2 | |||||||||||||||||||||||
| Equity and other income (loss) |
10.7 | (2.0 | ) | 8.3 | 30.1 | 24.3 | ||||||||||||||||||||||
|
|
|
|
|
|
|
|
|
|
|
|
|
|
|
|||||||||||||||
| Operating income |
200.0 | 168.9 | 323.1 | 264.7 | 380.6 | |||||||||||||||||||||||
| Net loss on acquisition and divestiture |
(0.5 | ) | (26.0 | ) | (26.3 | ) | — | — | ||||||||||||||||||||
|
|
|
|
|
|
|
|
|
|
|
|
|
|
|
|||||||||||||||
| Income before income taxes |
199.5 | 142.9 | 296.8 | 264.7 | 380.6 | |||||||||||||||||||||||
| Income tax expense |
66.5 | 52.4 | 100.7 | 91.3 | 134.5 | |||||||||||||||||||||||
|
|
|
|
|
|
|
|
|
|
|
|
|
|
|
|||||||||||||||
| Net income |
$ | $ | $ | 133.0 | $ | 90.5 | $ | 196.1 | $ | 173.4 | $ | 246.1 | ||||||||||||||||
|
|
|
|
|
|
|
|
|
|
|
|
|
|
|
|||||||||||||||
| Pro forma | Historical | |||||||||||||||||||||||
| As of March 31, |
As of March 31, |
As of September 30, |
||||||||||||||||||||||
| 2016 | 2016 | 2015 | 2015 | 2014 | 2013 | |||||||||||||||||||
| (unaudited) | (unaudited) | (unaudited) | (unaudited) | |||||||||||||||||||||
| Balance Sheet Data: |
||||||||||||||||||||||||
| Cash and cash equivalents(1) |
$ | $ — | $ — | $ — | $ — | $ — | ||||||||||||||||||
| Current assets |
514.4 | 502.0 | 477.3 | 544.7 | 519.1 | |||||||||||||||||||
| Property, plant and equipment, net |
266.5 | 248.0 | 253.5 | 272.4 | 270.2 | |||||||||||||||||||
| Total assets |
1,117.4 | 999.3 | 977.9 | 1,082.5 | 1,062.0 | |||||||||||||||||||
| Current liabilities |
300.6 | 266.1 | 298.6 | 293.5 | 312.6 | |||||||||||||||||||
| Long-term debt (less current portion) |
— | — | — | — | — | |||||||||||||||||||
| Total liabilities |
377.8 | 327.3 | 360.8 | 357.7 | 378.3 | |||||||||||||||||||
16
Table of Contents
| Six months ended March 31, |
Year ended September 30, |
|||||||||||||||||||
| 2016 | 2015 | 2015 | 2014 | 2013 | ||||||||||||||||
| (unaudited) | (unaudited) | |||||||||||||||||||
| Cash Flow Data: |
||||||||||||||||||||
| Cash flow provided by operations |
$ | 91.1 | $ | 160.6 | $ | 329.8 | $ | 170.6 | $ | 272.9 | ||||||||||
| Capital expenditures |
14.4 | 17.7 | 45.0 | 37.2 | 40.9 | |||||||||||||||
| Six months ended March 31, |
Year ended September 30, |
|||||||||||||||||||
| Unaudited | 2016 | 2015 | 2015 | 2014 | 2013 | |||||||||||||||
| Other Financial Data: |
||||||||||||||||||||
| Free cash flow (2) |
$ | 76.7 | $ | 142.9 | $ | 284.8 | $ | 133.4 | $ | 232.0 | ||||||||||
| EBITDA (3) |
218.5 | 161.7 | 334.8 | 301.8 | 416.3 | |||||||||||||||
| Adjusted EBITDA (3) |
223.2 | 204.4 | 421.8 | 369.2 | 342.3 | |||||||||||||||
| (1) | Historically, cash and cash equivalents were held at the Ashland level utilizing Ashland’s centralized approach to cash management. |
| (2) | We use free cash flow as an additional non-GAAP metric of cash flow generation. By deducting capital expenditures and certain other adjustments as applicable from operating cash flows, we are able to provide a better indication of the ongoing cash being generated that is ultimately available for both debt and equity holders as well as other investment opportunities. Free cash flow does not reflect adjustments for certain non-discretionary cash flows. Our results of operations are presented based on our management structure and internal accounting practices. The structure and practices are specific to us; therefore, our financial results and free cash flow are not necessarily comparable with similar information for other comparable companies. Free cash flow has limitations as an analytical tool and should not be considered in isolation from, or as an alternative to, or more meaningful than, cash flows provided by operating activities as determined in accordance with U.S. GAAP. In evaluating free cash flow, you should be aware that in the future we may incur expenses similar to those for which adjustments are made in calculating free cash. Our presentation of free cash flow should not be construed as a basis to infer that our future results will be unaffected by unusual or non-recurring items. Because of these limitations, you should rely primarily on cash flows provided by operating activities as determined in accordance with U.S. GAAP and use free cash flow only as a supplement. |
The following table reconciles free cash flow to cash flows provided by operating activities for the periods presented.
| Six months ended March 31, |
Year ended September 30, |
|||||||||||||||||||
| (Dollars in millions) | 2016 | 2015 | 2015 | 2014 | 2013 | |||||||||||||||
| Cash flows provided by operating activities |
$ | 91.1 | $ | 160.6 | $ | 329.8 | $ | 170.6 | $ | 272.9 | ||||||||||
| Less: |
||||||||||||||||||||
| Additions to property, plant and equipment |
(14.4 | ) | (17.7 | ) | (45.0 | ) | (37.2 | ) | (40.9 | ) | ||||||||||
|
|
|
|
|
|
|
|
|
|
|
|||||||||||
| Free cash flow |
$ | 76.7 | $ | 142.9 | $ | 284.8 | $ | 133.4 | $ | 232.0 | ||||||||||
|
|
|
|
|
|
|
|
|
|
|
|||||||||||
| (3) | In addition to our net income determined in accordance with U.S. GAAP, we evaluate operating performance using certain non-GAAP measures including EBITDA, which we define as our net income, plus income tax expense (benefit), net interest and other financing expenses, and depreciation and amortization, and Adjusted EBITDA, which we define as EBITDA adjusted for losses (gains) on pension and other postretirement plans remeasurement, net gain (loss) on acquisitions and divestitures, impairment of equity investment, restructuring, other income and (expense) and other items. Management believes the use of non-GAAP measures on a combined and reportable segment basis assists investors in understanding the ongoing operating performance of our business by presenting comparable financial results between periods. The non-GAAP information provided is used by our management and may not be comparable to similar measures disclosed by other companies, because of differing methods used by other companies in calculating EBITDA and Adjusted EBITDA. EBITDA and Adjusted EBITDA provide a supplemental presentation of our operating performance on a combined and reportable segment basis. Adjusted EBITDA generally includes adjustments for unusual, non-operational or restructuring-related activities. |
The combined financial statements include actuarial gains and losses for defined benefit pension and other postretirement benefit plans recognized annually in the fourth quarter of each fiscal year and whenever a plan is determined to qualify for a remeasurement during a fiscal year. Actuarial gains and losses occur when actual experience differs from the estimates used to allocate the change in value of pension and other postretirement benefit plans to expense throughout the year or when assumptions change, as they may each year.
17
Table of Contents
Significant factors that can contribute to the recognition of actuarial gains and losses include changes in discount rates used to remeasure pension and other postretirement obligations on an annual basis or upon a qualifying remeasurement, differences between actual and expected returns on plan assets and other changes in actuarial assumptions, for example the life expectancy of plan participants. Management believes Adjusted EBITDA, which includes the expected return on pension plan assets and excludes both the actual return on pension plan assets and the impact of actuarial gains and losses, provides investors with a meaningful supplemental presentation of our operating performance. Management believes these actuarial gains and losses are primarily financing activities that are more reflective of changes in current conditions in global financial markets (and in particular interest rates) that are not directly related to the underlying business and that do not have an immediate, corresponding impact on the compensation and benefits provided to eligible employees and retirees.
EBITDA and Adjusted EBITDA each have limitations as an analytical tool and should not be considered in isolation from, or as an alternative to, or more meaningful than, net income as determined in accordance with U.S. GAAP. Because of these limitations, you should rely primarily on net income as determined in accordance with U.S. GAAP and use EBITDA and Adjusted EBITDA only as supplements. In evaluating EBITDA and Adjusted EBITDA, you should be aware that in the future we may incur expenses similar to those for which adjustments are made in calculating EBITDA and Adjusted EBITDA. Our presentation of EBITDA and Adjusted EBITDA should not be construed as a basis to infer that our future results will be unaffected by unusual or non-recurring items.
The following table reconciles EBITDA and Adjusted EBITDA to net income for the periods presented.
| Six months ended March 31, |
Year ended September 30, |
|||||||||||||||||||
| (Dollars in millions) | 2016 | 2015 | 2015 | 2014 | 2013 | |||||||||||||||
| Net income |
$ | 133.0 | $ | 90.5 | $ | 196.1 | $ | 173.4 | $ | 246.1 | ||||||||||
| Income tax expense |
66.5 | 52.4 | 100.7 | 91.3 | 134.5 | |||||||||||||||
| Depreciation and amortization |
19.0 | 18.8 | 38.0 | 37.1 | 35.7 | |||||||||||||||
|
|
|
|
|
|
|
|
|
|
|
|||||||||||
| EBITDA |
218.5 | 161.7 | 334.8 | 301.8 | 416.3 | |||||||||||||||
| Losses (gains) on pension and other postretirement plans remeasurement |
4.7 | 2.0 | 46.0 | 61.1 | (74.0 | ) | ||||||||||||||
| Net loss on divestiture |
— | 26.0 | 26.3 | — | — | |||||||||||||||
| Impairment of equity investment |
— | 14.3 | 14.3 | — | — | |||||||||||||||
| Restructuring |
— | 0.4 | 0.4 | 6.3 | — | |||||||||||||||
|
|
|
|
|
|
|
|
|
|
|
|||||||||||
| Adjusted EBITDA |
$ | 223.2 | $ | 204.4 | $ | 421.8 | $ | 369.2 | $ | 342.3 | ||||||||||
|
|
|
|
|
|
|
|
|
|
|
|||||||||||
18
Table of Contents
Investing in our common stock involves a high degree of risk. You should consider carefully the risks and uncertainties described below, together with all of the other information in this prospectus, including our financial statements and the related notes included elsewhere in this prospectus, before deciding whether to invest in shares of our common stock. We describe below what we believe are currently the material risks and uncertainties we face, but they are not the only risks and uncertainties we face. Additional risks and uncertainties that we are unaware of, or that we currently believe are not material, may also become important factors that adversely affect our business. If any of the following risks actually occur, our business, financial condition, results of operations and future prospects could be materially and adversely affected. In that event, the market price of our common stock could decline and you could lose part or all of your investment.
Risks Related to Our Business
Damage to our brand and reputation could have an adverse effect on our business.
Maintaining our strong reputation with both consumers and customers is a key component of our business. Product or service complaints or recalls, our inability to ship, sell or transport affected products, and governmental investigations may harm our reputation with consumers and customers, which may materially and adversely affect our business operations, decrease sales and increase costs.
We manufacture and market a variety of products, such as automotive and industrial lubricants and antifreeze, and provide automotive maintenance services. If allegations are made that some of our products have failed to perform up to consumers’ or customers’ expectations or have caused damage or injury to individuals or property, or that our services were not provided in a manner consistent with our vision and values, the public may develop a negative perception of our brands. In addition, if our franchisees or Express Care operators do not successfully operate their quick lube service centers in a manner consistent with our standards, our brand, image and reputation could be harmed, which in turn could negatively impact our business and operating results. A negative public perception of our brands, whether justified or not, could impair our reputation, involve us in litigation, damage our brand equity and have a material adverse effect on our business. In addition, damage to the reputation of our competitors or others in our industry could negatively impact our reputation and business.
We have set aggressive growth goals for our business, including increasing sales, cash flow, market share and margins, in order to achieve our long-term strategic objectives. Execution of our growth strategies and business plans to facilitate that growth involves a number of risks.
We have set aggressive growth goals for our business in order to meet our long-term strategic objectives and improve shareholder value. Our failure to meet one or more of these goals or objectives would negatively impact our business and is one of the most important risks that we face. Aspects of that risk include, among others, changes to the economic environment, changes to the competitive landscape, including those related to automotive maintenance recommendations and consumer preferences, attraction and retention of skilled employees, the potential failure of product innovation plans, failure to comply with existing or new regulatory schemes, failure to maintain a competitive cost structure and other risks outlined in greater detail in this “Risk Factors” section.
Demand for our products and services could be adversely affected by consumer spending trends, declining economic conditions, trends in our industry and a number of other factors, all of which are beyond our control.
Demand for our products and services may be affected by a number of factors we cannot control, including the number and age of vehicles in current service, regulation and legislation, technological advances in the automotive industry and changes in engine technology, including the adoption rate of electric or other alternative engine technologies. In addition, during periods of declining economic conditions, consumers may defer vehicle
19
Table of Contents
maintenance. Similarly, increases in energy prices may cause miles driven to decline, resulting in less wear and tear and lower demand for maintenance, which may lead to consumers deferring purchases of our products and services. All of these factors, which impact metrics such as drain intervals and oil changes per day, could result in a decline in the demand for our products and services and adversely affect our sales, cash flows and overall financial condition. Between 2007 and 2012, U.S. passenger car motor oil volumes declined. This decline in demand is a result of, among other factors, changing automotive OEM specifications and longer recommended intervals between oil changes. Over the past two years, however, market volume has increased, largely due to the increase in the number of cars on the road and miles driven.
The success of our growth initiatives depends on our ability to successfully develop and implement one or more integrated digital platforms that will help us better understand consumers and more effectively engage them.
We are in the process of designing and implementing a number of digital platforms that will integrate our operations with customer and consumer data. The successful development and implementation of these digital platforms will depend on our ability to identify an appropriate strategy, dedicate adequate resources and select technologies that will provide us with adequate flexibility to adapt to future developments in the marketplace and changes in consumer and customer behavior. We have incurred and expect to incur significant upfront investments to develop these digital platforms. There is a risk that once implemented, these digital platforms will not deliver all or part of the expected benefits, including additional sales. As we develop and implement our digital platforms, we may elect to modify, replace or abandon certain technology initiatives, which could result in write-downs.
Our success depends upon our ability to attract and retain key employees and the identification and development of talent to succeed senior management.
Our success depends on our ability to attract and retain key personnel, and we rely heavily on our senior management team. The inability to recruit and retain key personnel or the unexpected loss of key personnel may adversely affect our operations. This risk of unwanted employee turnover is substantial in positions that require certain technical expertise. This risk is also substantial in developing international markets we have targeted for growth and in North America, where attracting marketing and technical expertise to geographies necessary to support our management is important to our success. This risk is further enhanced by the planned separation from Ashland. In addition, because of our reliance on our senior management team, our future success depends, in part, on our ability to identify and develop or recruit talent to succeed our senior management and other key positions throughout the organization. If we fail to identify and develop or recruit successors, we are at risk of being harmed by the departures of these key employees.
We face significant competition from other companies, which places downward pressure on prices and margins and may adversely affect our business and results of operations.
We operate in highly competitive markets, competing against a number of domestic and foreign companies. Competition is based on several key criteria, including brand recognition, product performance and quality, product price, product availability and security of supply, ability to develop products in cooperation with customers, and customer service, as well as the ability to bring innovative products or services to the marketplace. Certain key competitors, including Shell/Pennzoil and Jiffy Lube, BP/Castrol and Exxon/Mobil, are significantly larger than us and have greater financial resources and more diverse portfolios of products and services, leading to greater operating and financial flexibility. As a result, these competitors may be better able to withstand adverse changes in conditions within the relevant industry, the prices of raw materials and energy or general economic conditions. In addition, competitors’ pricing decisions could compel us to decrease our prices, which could negatively affect our margins and profitability. Additional competition in markets served by us could adversely affect margins and profitability and could lead to a reduction in market share. Also, we compete in certain markets that are declining, such as the U.S. passenger car motor oil market. If our strategies for dealing with declining markets and leveraging market opportunities are not successful, our results of operations could be negatively affected.
20
Table of Contents
Because of the concentration of our sales to a small number of retailers, the loss of one or more of, or a significant reduction in orders from, our top retail customers could adversely affect our financial results, as could the loss of one of our distributor relationships.
Our Core North America segment’s sales represented approximately 54% of our total sales in fiscal 2015. Napa Auto Parts, AutoZone, Advance Auto Parts, O’Reilly Auto Parts and another large national retailer together accounted for 46% of Core North America’s fiscal 2015 sales and 50% of Core North America’s outstanding trade accounts receivable as of March 31, 2016. The loss of, or significant reduction in orders from, one of our top five retail customers or any other significant customer could have a material adverse effect on our business, financial condition, results of operations or cash flows, as could customer disputes regarding shipments, fees, merchandise condition or related matters. Our inability to collect accounts receivable from one of our major customers, or a significant deterioration in the financial condition of one of these customers, including a bankruptcy filing or a liquidation, could also have a material adverse effect on our financial condition, results of operations or cash flows. We also rely on independent distributors to sell and deliver our products. Disagreements or the loss of our relationship with a distributor could also have a material adverse effect on our financial condition, results of operations or cash flows.
Our marketing activities may not be successful.
We invest substantial resources in advertising, consumer promotions and other marketing activities in order to maintain and strengthen our brand image and product awareness. The Valvoline name and brand image are integral to the growth of our business and our expansion into new markets. Failure to adequately market and differentiate our products and services from competitive products and services could adversely affect our business. There can be no assurances that our marketing strategies will be effective or that our investments in advertising activities will result in a corresponding increase in sales of our products. If our marketing initiatives are not successful, we will have incurred significant expenses without the benefit of higher sales of our products. In addition, if any party with whom we have a sponsorship relationship were to generate adverse publicity, our brand image could be harmed.
Our business exposes us to potential product liability claims and recalls, which could adversely affect our financial condition and performance.
The development, manufacture and sale of automotive, commercial and industrial lubricants, automotive chemicals and the provision of automotive maintenance services involve an inherent risk of exposure to product liability claims, false advertising claims, product recalls, workplace exposure, product seizures and related adverse publicity. A product liability claim, false advertising claim or related judgment against us could also result in substantial and unexpected expenditures, affect consumer or customer confidence in our products, and divert management’s time and attention from other responsibilities. Although we maintain product liability insurance, there can be no assurance that the type or level of coverage we have is adequate or that we will be able to continue to maintain our existing insurance or obtain comparable insurance at a reasonable cost, if at all. A product recall or a partially or completely uninsured product liability judgment against us could have a material adverse effect on our reputation, results of operations and financial condition.
Failure to develop and market new products and production technologies could impact our competitive position and have an adverse effect on our business and results of operations.
The lubricants industry is subject to periodic technological change and ongoing product improvements. In order to maintain margins and remain competitive, we must successfully develop and introduce new products or improvements that appeal to our customers and ultimately to global consumers. Changes in additive technologies, base oil production techniques and sources, and the demand for improved performance by OEMs and consumers place particular pressure on us to continue to improve our product offerings. Our efforts to respond to changes in consumer demand in a timely and cost-efficient manner to drive growth could be adversely affected by difficulties or delays in product development and service innovation, including the inability to
21
Table of Contents
identify viable new products, successfully complete research and development, obtain regulatory approvals, obtain intellectual property protection or gain market acceptance of new products or service techniques. Due to the lengthy development process, technological challenges and intense competition, there can be no assurance that any of the products we are currently developing, or could develop in the future, will achieve substantial commercial success. The time and expense invested in product development may not result in commercial products or provide revenues. We could be required to write-off our investment in a new product that does not reach commercial viability. Moreover, we may experience operating losses after new products are introduced and commercialized because of high start-up costs, unexpected manufacturing costs or problems, or lack of demand.
The impact of changing laws or regulations or the manner of interpretation or enforcement of existing laws or regulations could adversely impact our financial performance and restrict our ability to operate our business or execute our strategies.
New laws or regulations, or changes in existing laws or regulations or the manner of their interpretation or enforcement, could increase our cost of doing business and restrict our ability to operate our business or execute our strategies. This risk includes, among other things, the possible taxation under U.S. law of certain income from foreign operations, the possible taxation under foreign laws of certain income we report in other jurisdictions, regulations related to the protection of private information of our employees and customers, regulations issued by the U.S. Federal Trade Commission (and analogous non-U.S. agencies) affecting us and our customers, compliance with the REACH regulation (and analogous non-EU initiatives). In addition, compliance with laws and regulations is complicated by our substantial and growing global footprint, which will require significant and additional resources to ensure compliance with applicable laws and regulations in the approximately 140 countries where we conduct business.
Our global operations expose us to trade and economic sanctions and other restrictions imposed by the United States, the European Union and other governments and organizations. The U.S. Departments of Justice, Commerce, State and Treasury and other federal agencies and authorities have a broad range of civil and criminal penalties they may seek to impose against corporations and individuals for violations of economic sanctions laws, export control laws, the Foreign Corrupt Practices Act (the “FCPA”) and other federal statutes and regulations, including those established by the Office of Foreign Assets Control (“OFAC”). Under these laws and regulations, as well as other anti-corruption laws, anti-money-laundering laws, export control laws, customs laws, sanctions laws and other laws governing our operations, various government agencies may require export licenses, may seek to impose modifications to business practices, including cessation of business activities in sanctioned countries or with sanctioned persons or entities and modifications to compliance programs, which may increase compliance costs, and may subject us to fines, penalties and other sanctions. A violation of these laws or regulations could adversely impact our business, results of operations and financial condition.
Although we have implemented policies and procedures in these areas, we cannot assure you that our policies and procedures are sufficient or that directors, officers, employees, representatives, distributors, consultants and agents have not engaged and will not engage in conduct for which we may be held responsible, nor can we assure you that our business partners have not engaged and will not engage in conduct that could materially affect their ability to perform their contractual obligations to us or even result in our being held liable for such conduct. Violations of the FCPA, OFAC restrictions or other export control, anti-corruption, anti-money-laundering and anti-terrorism laws or regulations may result in severe criminal or civil sanctions, and we may be subject to other liabilities, which could have a material adverse effect on our business, financial condition, cash flows and results of operations.
Our substantial global operations subject us to risks of doing business in foreign countries, which could adversely affect our business, financial condition and results of operations.
Sales from our International business segment accounted for 26% of our sales for fiscal 2015. We expect sales from international markets to continue to represent an even larger portion of our sales in the future. Also, a significant portion of our manufacturing capacity is located outside of the United States. Accordingly, our
22
Table of Contents
business is subject to risks related to the differing legal, political, cultural, social and regulatory requirements and economic conditions of many jurisdictions.
The global nature of our business presents difficulties in hiring and maintaining a workforce in certain countries. Fluctuations in exchange rates may affect product demand and may adversely affect the profitability in U.S. dollars of products and services provided in foreign countries. In addition, foreign countries may impose additional withholding taxes or otherwise tax our foreign income, or adopt other restrictions on foreign trade or investment, including currency exchange controls. The imposition of tariffs is also a risk that could impair our financial performance. In addition, joint ventures, particularly our existing joint ventures with Cummins in India and China, are an important part of our growth strategy internationally. If our relationship with one of our joint venture partners were to deteriorate, it could negatively impact our ability to achieve our growth goals internationally.
Certain legal and political risks are also inherent in the operation of a company with our global scope. For example, it may be more difficult for us to enforce our agreements or collect receivables through foreign legal systems. There is a risk that foreign governments may nationalize private enterprises in certain countries where we operate. In certain countries or regions, terrorist activities and the response to such activities may threaten our operations more than in the United States. Social and cultural norms in certain countries may not support compliance with our corporate policies including those that require compliance with substantive laws and regulations. Also, changes in general economic and political conditions in countries where we operate, particularly in Europe, the Middle East and emerging markets, are a risk to our financial performance and future growth. For example, we exited our Venezuelan joint venture in 2015 due in part to the continued lack of exchangeability between the Venezuelan bolivar and U.S. dollar and other Venezuelan regulations. In addition, in executing our global growth strategies, we have entered into several important strategic relationships with joint venture partners, such as Cummins, unaffiliated distributors, toll manufacturers and others. The need to identify financially and commercially strong partners to fill these roles who will comply with the high manufacturing and legal compliance standards we require is a risk to our financial performance.
As we continue to operate our business globally, our success will depend, in part, on our ability to anticipate and effectively manage these and other related risks. There can be no assurance that the consequences of these and other factors relating to our multinational operations will not have an adverse effect on our business, financial condition or results of operations.
The competitive nature of our markets may delay or prevent us from passing increases in raw material costs on to our customers. In addition, certain of our suppliers may be unable to deliver products or raw materials or may withdraw from contractual arrangements. The occurrence of either event could adversely affect our results of operations.
Rising and volatile raw material prices, especially for base oil and lubricant additives, may negatively impact our costs, results of operations and the valuation of our inventory. We are not always able to raise prices in response to increased costs of raw materials, and our ability to pass on the costs of such price increases is dependent upon market conditions. Likewise, reductions in the valuation of our inventory due to market volatility may not be recovered and could result in losses.
We purchase certain products and raw materials from suppliers, often pursuant to written supply contracts. If those suppliers are unable to meet our orders in a timely manner or choose to terminate or otherwise avoid contractual arrangements, we may not be able to make alternative supply arrangements. For base oils, our suppliers are primarily large oil producers, many of whom operate oil lubricant production and sales businesses as part of their enterprise. There are risks inherent in obtaining important raw materials from actual or potential competitors, including the risk that applicable antitrust laws may be inadequate to mitigate our exposure to these risks. For lubricant additives, we maintain material relationships with a very limited number of suppliers and there are a limited number of other potential suppliers with whom we could transact in the event of a disruption to our existing supply relationships. The inability of those suppliers to meet their contractual obligations to us could also have a material adverse effect on our business.
23
Table of Contents
Also, domestic and global government regulations related to the manufacture or transport of certain raw materials may impede our ability to obtain those raw materials on commercially reasonable terms. If we are unable to obtain and retain qualified suppliers under commercially acceptable terms, our ability to manufacture and deliver products in a timely, competitive and profitable manner or grow our business successfully could be adversely affected.
Acquisitions, strategic alliances and investments could result in operating difficulties, dilution and other harmful consequences that may adversely impact our business and results of operations.
Acquisitions, particularly for our VIOC business, and building strategic alliances for distribution and manufacturing, particularly in international markets, including through joint venture partnerships, product distribution and toll manufacturing arrangements, are important elements of our overall growth strategy. We expect to continue to evaluate and enter into discussions regarding a wide array of potential strategic transactions. These transactions and agreements could be material to our financial condition and results of operations. In addition, the process of integrating an acquired company, business, or product may create unforeseen operating difficulties or expenditures. The areas where we face risks include:
| • | diversion of management’s time and attention from operating our business to acquisition integration challenges; |
| • | failure to successfully grow the acquired business or product lines; |
| • | implementation or remediation of controls, procedures and policies at the acquired company; |
| • | integration of the acquired company’s accounting, human resources and other administrative systems, and coordination of product, engineering and sales and marketing functions; |
| • | transition of operations, users and customers onto our existing platforms; |
| • | reliance on the expertise of our strategic partners with respect to market development, sales, local regulatory compliance and other operational matters; |
| • | failure to obtain required approvals on a timely basis, if at all, from governmental authorities, or conditions placed upon approval under competition and antitrust laws which could, among other things, delay or prevent us from completing a transaction, or otherwise restrict our ability to realize the expected financial or strategic goals of an acquisition; |
| • | in the case of foreign acquisitions, the need to integrate operations across different cultures and languages and to address the particular economic, currency, political and regulatory risks associated with specific countries; |
| • | cultural challenges associated with integrating employees from the acquired company into our organization, and retention of employees from the companies we acquire; |
| • | liability for, or reputational harm from, activities of the acquired company before the acquisition or from our strategic partners, including patent and trademark infringement claims, violations of laws, commercial disputes, tax liabilities and other known and unknown liabilities; and |
| • | litigation or other claims in connection with the acquired company, including claims from terminated employees, customers, former securityholders or other third parties. |
Our failure to address these risks or other problems encountered in connection with our past or future acquisitions, investments or strategic alliances could cause us to fail to realize the anticipated benefits of such acquisitions, investments or strategic alliances, incur unanticipated liabilities and harm our business generally.
Our acquisitions, investments and strategic alliances could also result in dilutive issuances of our equity securities, the incurrence of debt, contingent liabilities or amortization expenses, impairment of goodwill or purchased long-lived assets, and restructuring charges, any of which could harm our financial condition, results of operations and cash flows. Also, the anticipated benefits of our acquisitions may not be realized. In addition,
24
Table of Contents
our balance sheet includes goodwill primarily related to acquisitions and future acquisitions may result in our recognition of additional goodwill. The impairment of a significant portion of this goodwill would negatively affect our financial results.
The business model for our VIOC business, including its dependence on franchised oil change centers, presents a number of risks.
VIOC is made up of a nation-wide network of both company-owned and franchised stores. Our success relies in part on the financial success and cooperation of our franchisees. However, we have limited influence over their operations. Our franchisees manage their businesses independently and are responsible for the day to day operations of approximately 69% of VIOC stores as of March 31, 2016. Our revenue and income growth from franchised stores are largely dependent on the ability of our franchisees to grow their sales. Our franchisees may have limited or no sales growth, and our revenues and margins could be negatively affected as a result. In addition, if sales or business performance trends worsen for franchisees, their financial results may deteriorate, which could result in, among other things, VIOC store closures, delayed or reduced payments to us, and reduced growth in the number of VIOC stores.
Our success also depends on the willingness and ability of our independent franchisees to implement major initiatives, which may require additional investment by them, and remain aligned with us on operating, promotional and capital intensive reinvestment plans. The ability of our franchisees to contribute to the achievement of our overall plans is dependent in large part on the availability of funding to our franchisees at reasonable interest rates and may be negatively impacted by the financial markets in general or the creditworthiness of individual franchisees.
Our operating performance and reputation could also be negatively impacted if our independent franchisees experience service failures or otherwise operate in a manner that projects a brand image inconsistent with our values, particularly if our contractual and other rights and remedies are limited, costly to exercise or subject to litigation. If our franchisees do not successfully operate VIOC stores in a manner consistent with our standards, our brand, image and reputation could be harmed, which in turn could negatively impact our business and operating results.
The ownership mix of company-owned and franchised VIOC stores also affects our results and financial condition. The decision to own stores or to operate under franchise or license agreements is driven by a large number of factors with a complex and changing interrelationship. In addition, the size of our largest franchisees creates additional risk due to our dependence on their particular growth, financial and operating performance and cooperation and alignment with our initiatives.
In addition, we are the primary supplier of products to all VIOC stores. The growth and performance of our lubricants and other product lines depends in large part on the performance of our VIOC business, potentially amplifying the negative affect of the other risks related to the VIOC business model. Poor performance by VIOC stores would negatively impact revenues and income for other Valvoline reporting segments.
Adverse developments in the global economy or in regional economies and potential disruptions of financial markets could negatively impact our customers and suppliers, and therefore have a negative impact on our results of operations.
A global or regional economic downturn may reduce customer demand or inhibit our ability to produce and sell products. Our business and operating results are sensitive to global and regional economic downturns, credit market tightness, declining consumer and business confidence, fluctuating commodity prices, volatile exchange rates, changes in interest rates, sovereign debt defaults and other challenges, including those related to international sanctions and acts of aggression or threatened aggression that can affect the global economy. With
25
Table of Contents
74% of our sales coming from North America in fiscal 2015, we are particularly sensitive to the risk of an economic slowdown or downturn in that region. In the event of adverse developments or stagnation in the economy or financial markets, our customers may experience deterioration of their businesses, reduced demand for their products, cash flow shortages and difficulty obtaining financing. As a result, existing or potential customers might delay or cancel plans to purchase products and may not be able to fulfill their obligations to us in a timely fashion. Further, suppliers may experience similar conditions, which could impact their ability to fulfill their obligations to us. A weakening or reversal of the global economy or a substantial part of it could negatively impact our business, results of operations, financial condition and ability to grow.
We use information technology (“IT”) systems to conduct business, and these IT systems are at risk from cyber security threats.
The nature of our business, the markets we serve and the geographic profile of our operations make us a target of cyber security threats. Despite steps we take to mitigate or eliminate them, cyber security threats to our systems are increasing and becoming more advanced and could occur as a result of the activity of hackers, employee error or employee misconduct. A breach of our IT systems could lead to the loss and destruction of trade secrets, confidential information, proprietary data, intellectual property, customer and supplier data, and employee personal information, and could disrupt business operations which could adversely affect our relationships with business partners and harm our brands, reputation and financial results. Our customer data may include names, addresses, phone numbers, email addresses and payment account information, among other information. Depending on the nature of the customer data that is compromised, we may also have obligations to notify users, law enforcement or payment companies about the incident and may need to provide some form of remedy, such as refunds for the individuals affected by the incident. We do not currently carry insurance for breaches of our IT systems.
We may fail to adequately protect our intellectual property rights or may be accused of infringing the intellectual property rights of third parties.
We rely heavily upon our trademarks, domain names and logos to market our brands and to build and maintain brand loyalty and recognition, as well as upon trade secrets. We also rely on a combination of laws and contractual restrictions with employees, customers, suppliers, affiliates and others, to establish and protect our various intellectual property rights. For example, we have generally registered and continue to register and renew, or secure by contract where appropriate, trademarks and service marks as they are developed and used, and reserve, register and renew domain names as appropriate. Effective trademark protection may not be available or may not be sought in every country in which our products are made available and contractual disputes may affect the use of marks governed by private contract. Similarly, not every variation of a domain name may be available or be registered, even if available.
We generally seek to apply for patents or for other similar statutory protections as and if we deem appropriate, based on then-current facts and circumstances, and will continue to do so in the future. No assurances can be given that any patent application we have filed or will file will result in a patent being issued, or that any existing or future patents will afford adequate or meaningful protection against competitors or against similar technologies. In addition, no assurances can be given that third parties will not create new products or methods that achieve similar results without infringing upon patents we own.
Despite these measures, our intellectual property rights may still not be protected in a meaningful manner, challenges to contractual rights could arise or third parties could copy or otherwise obtain and use our intellectual property without authorization. The occurrence of any of these events could result in the erosion of our brands and limit our ability to market our brands using our various trademarks, as well as impede our ability to effectively compete against competitors with similar products and services, any of which could adversely affect our business, financial condition and results of operations.
26
Table of Contents
From time to time, we have been subject to legal proceedings and claims, including claims of alleged infringement of trademarks, copyrights, patents and other intellectual property rights held by third parties. In addition, in the future, third parties may sue us for alleged infringement of their proprietary or intellectual property rights. We may not be aware of whether our products do or will infringe existing or future patents or the intellectual property rights of others. In addition, litigation may be necessary in the future to enforce our intellectual property rights, protect our trade secrets or determine the validity and scope of proprietary rights claimed by others. Any litigation of this nature, regardless of outcome or merit, could result in substantial costs and diversion of management and technical resources, any of which could adversely affect our business, financial condition and results of operations.
Our pension and postretirement benefit plan obligations are currently underfunded, and we may have to make significant cash payments to some or all of these plans, which would reduce the cash available for our businesses.
In connection with the separation, we will assume certain of Ashland’s historical U.S. postretirement benefit plans and qualified and non-qualified pension liabilities, including liabilities for multiemployer plans for certain employees covered by collective bargaining agreements. The funded status of our pension plans is dependent upon many factors, including returns on invested assets, the level of certain market interest rates and the discount rate used to determine pension obligations. Unfavorable returns on plan assets or unfavorable changes in applicable laws or regulations could materially change the timing and amount of required plan funding, which would reduce the cash available for our businesses. In addition, a decrease in the discount rate used to determine pension obligations could result in an increase in the valuation of pension obligations, which could affect the reported funding status of our pension plans and future contributions. Similarly, an increase in discount rates could increase the periodic pension cost in subsequent fiscal years. Our policy to recognize these variances annually through mark to market accounting could result in volatility in our results of operations, which could be material. In addition, our pension and postretirement benefit plan obligations are currently underfunded, and we may have to make significant cash payments to some or all of these plans, which would reduce the cash available for our businesses.
Under the Employee Retirement Income Security Act of 1974 (“ERISA”), as amended, the Pension Benefit Guaranty Corporation (“PBGC”) has the authority to terminate an underfunded tax-qualified pension plan under limited circumstances. In the event our tax-qualified pension plans are terminated by the PBGC, we could be liable to the PBGC for some portion of the underfunded amount.
Business disruptions from natural, operational and other catastrophic risks could seriously harm our operations and financial performance. In addition, a catastrophic event at one of our facilities or involving our products or employees could lead to liabilities that could further impair our operations and financial performance.
Business disruptions, including those related to operating hazards inherent with the production of lubricants, natural disasters, severe weather conditions, supply or logistics disruptions, increasing costs for energy,
temporary plant and/or power outages, information technology systems and network disruptions, cyber-security breaches, terrorist attacks, armed conflicts, war, pandemic diseases, fires, floods or other catastrophic events, could seriously harm our operations, as well as the operations of our customers and suppliers, and may adversely impact our financial performance. Although it is impossible to predict the occurrence or consequences of any such events, they could result in reduced demand for our products, make it difficult or impossible for us to manufacture our products or deliver products and services to our customers or to receive raw materials from suppliers, or create delays and inefficiencies in the supply chain. In addition to leading to a serious disruption of our businesses, a catastrophic event at one of our facilities or involving our products or employees could lead to substantial legal liability to or claims by parties allegedly harmed by the event.
While we maintain business continuity plans that are intended to allow us to continue operations or mitigate the effects of events that could disrupt our business, we cannot provide assurances that our plans would fully
27
Table of Contents
protect us from all such events. In addition, insurance maintained by us to protect against property damage, loss of business and other related consequences resulting from catastrophic events is subject to coverage limitations, depending on the nature of the risk insured. This insurance may not be sufficient to cover all of our damages or damages to others in the event of a catastrophe. In addition, insurance related to these types of risks may not be available now or, if available, may not be available in the future at commercially reasonable rates.
We have incurred, and will continue to incur, substantial costs as a result of environmental, health and safety (“EHS”), and hazardous substances liabilities and related compliance requirements. These costs could adversely impact our cash flow, and, to the extent they exceed our established reserves for these liabilities, our results of operations or financial condition.
We are subject to extensive federal, state, local and foreign laws, regulations, rules and ordinances relating to pollution, protection of the environment and human health and safety, as well as the generation, storage, handling, treatment, disposal and remediation of hazardous substances and waste materials. We have incurred, and will continue to incur, significant costs and capital expenditures to comply with these laws and regulations.
EHS regulations change frequently, and such regulations and their enforcement have tended to become more stringent over time. Accordingly, changes in EHS laws and regulations and the enforcement of such laws and regulations could interrupt our operations, require modifications to our facilities or cause us to incur significant liabilities, costs or losses that could adversely affect our profitability. Actual or alleged violations of EHS laws and regulations could result in restrictions or prohibitions on plant operations as well as substantial damages, penalties, fines, civil or criminal sanctions and remediation costs.
Our business involves the production, storage and transportation of hazardous substances. Under some environmental laws, we may be strictly liable and/or jointly and severally liable for environmental damages caused by releases of hazardous substances and waste materials into the environment. For instance, under relevant laws and regulations we may be deemed liable for soil and/or groundwater contamination at sites we currently own and/or operate even though the contamination was caused by a third party such as a former owner or operator, and at sites we formerly owned and operated if the release of hazardous substances or waste materials was caused by us or by a third party during the period we owned and/or operated the site. We also may be deemed liable for soil and/or groundwater contamination at sites to which we sent hazardous wastes for treatment or disposal, notwithstanding that the original treatment or disposal activity accorded with all applicable regulatory requirements.
We are responsible for, and have financial exposure to, liabilities from pending and threatened claims which could adversely impact our results of operations and cash flow.
There are various claims, lawsuits and administrative proceedings pending or threatened against us. Such actions are with respect to commercial matters, false advertising, product liability, toxic tort liability and other matters that seek remedies or damages, some of which are for substantial amounts. While these actions are being contested, their outcome is not predictable. Our results could be adversely affected by financial exposure to these liabilities. We could also be subject to additional legal proceedings in the future that may adversely affect our business, including administrative proceedings, class actions, employment and personal injury claims, disputes with current or former suppliers, claims by current or former franchisees, and intellectual property claims.
Insurance maintained by us to protect against claims for damages alleged by third parties is subject to coverage limitations, depending on the nature of the risk insured. This insurance may not be sufficient to cover all of our liabilities to others. In addition, insurance related to these types of risks may not be available now or, if available, may not be available in the future at commercially reasonable rates.
28
Table of Contents
Our substantial indebtedness may adversely affect our business, results of operations and financial condition.
After giving effect to the separation and the contribution transactions, we expect to have indebtedness of approximately $ . Our substantial indebtedness could adversely affect our business, results of operations and financial condition by, among other things:
| • | requiring us to dedicate a substantial portion of our cash flow from operations to pay principal and interest on our debt, which would reduce the availability of our cash flow to fund working capital, capital expenditures, acquisitions, execution of our growth strategy and other general corporate purposes; |
| • | limiting our ability to borrow additional amounts to fund working capital, capital expenditures, acquisitions, debt service requirements, execution of our growth strategy and other purposes; |
| • | making us more vulnerable to adverse changes in general economic, industry and regulatory conditions and in our business by limiting our flexibility in planning for, and making it more difficult for us to react quickly to, changing conditions; |
| • | placing us at a competitive disadvantage compared with our competitors that have less debt and lower debt service requirements; |
| • | making us more vulnerable to increases in interest rates since some of our indebtedness is subject to variable rates of interest; and |
| • | making it more difficult for us to satisfy our financial obligations. |
In addition, we may not be able to generate sufficient cash flow from our operations to repay our indebtedness when it becomes due and to meet our other cash needs. If we are not able to pay our debts as they become due, we could be in default under the terms of our indebtedness. We might also be required to pursue one or more alternative strategies to repay indebtedness, such as selling assets, refinancing or restructuring our indebtedness or selling additional debt or equity securities. We may not be able to refinance our debt or sell additional debt or equity securities or our assets on favorable terms, if at all, and if we must sell our assets, we may negatively affect our ability to generate revenues.
If we are unable to access the capital markets or obtain bank credit, our financial position, growth plans, liquidity and results of operations could be negatively impacted.
We are dependent on a stable, liquid, and well-functioning financial system to fund our operations and capital investments. In particular, we may rely on the public or private debt markets to fund portions of our capital investments and the commercial paper market and bank credit facilities to fund seasonal needs for working capital. Our access to these markets depends on multiple factors including the condition of debt capital markets, our operating performance and our credit ratings. If rating agencies lower our credit ratings, it could adversely impact our ability to access the debt markets, our cost of funds and other terms for new debt issuances. Each of the credit rating agencies reviews its rating periodically, and there is no guarantee our current credit rating will remain the same.
We are subject to payment-related risks for owned VIOC stores.
At our owned VIOC stores, we accept a variety of payment methods, including credit cards and debit cards. Accordingly, we are, and will continue to be, subject to significant and evolving regulations and compliance requirements, including obligations to implement enhanced authentication processes that could result in increased costs, reduce the ease of use of certain payment methods and expand liability for us. For certain payment methods, including credit and debit cards, we pay interchange and other fees, which may increase over time. We rely on independent service providers for payment processing, including credit and debit cards. If these
29
Table of Contents
independent service providers become unwilling or unable to provide these services to us or if the cost of using these providers increases, our business could be harmed. We are also subject to payment card association operating rules, including data security rules, certification requirements and rules governing electronic funds transfers, which could change or be reinterpreted to make it difficult or impossible for us to comply. If we fail to comply with these rules or requirements, or if our data security systems are breached or compromised, we may be liable for losses incurred by card issuing banks or consumers, subject to fines and higher transaction fees, lose our ability to accept credit and debit card payments from our customers or process electronic fund transfers or facilitate other types of payments and our brand, business and results of operations could be significantly harmed.
Risks Related to Our Separation from Ashland
The spin-off may not occur and the separation may not be successful.
Upon completion of this offering, we will be a standalone public company, although we will continue to be controlled by Ashland. Ashland has announced its intention to consummate the spin-off approximately six months after the closing of this offering. However, Ashland may abandon or change the structure of the spin-off if it determines, in its sole discretion, that the spin-off is not in the best interest of Ashland or its shareholders. Such determination may take into account, without limitation, the potential impact on the spin-off of a change in control of Ashland.
In addition, the process of becoming a standalone public company may distract our management from focusing on our business and strategic priorities. Further, although we expect to have direct access to the debt and equity capital markets following this offering, we may not be able to issue debt or equity on terms acceptable to us or at all. Moreover, even with equity compensation tied to our business, we may not be able to attract and retain employees as desired. We also may not fully realize the anticipated benefits of being a standalone public company if any of the risks identified in this “Risk Factors” section, or other events, were to occur. If we do not realize these anticipated benefits for any reason, our business may be negatively affected. In addition, the separation could adversely affect our operating results and financial condition.
As long as Ashland controls us, your ability to influence matters requiring shareholder approval will be limited.
After this offering, Ashland will own shares of our common stock, representing approximately % of the total outstanding shares of our common stock (or % if the underwriters exercise their overallotment option in full). For so long as Ashland beneficially owns shares of our common stock representing at least a majority of the votes entitled to be cast by the holders of our outstanding common stock, Ashland will be able to elect all of the members of our board of directors. Currently, members of our board of directors, William A. Wulfsohn and , are members of the Ashland board of directors, and Mr. Wulfsohn is the Chairman and Chief Executive Officer of Ashland.
The spin-off could result in significant tax liability to Ashland, and in certain circumstances, we could be required to indemnify Ashland for material taxes pursuant to indemnification obligations under the Tax Matters Agreement.
Ashland expects to obtain a written opinion of counsel to the effect that the spin-off should qualify for non-recognition of gain and loss under Section 355 of the Internal Revenue Code of 1986, as amended (the “Code”). The opinion of counsel would not address any U.S. state or local or foreign tax consequences of the spin-off. The opinion will assume that the spin-off will be completed according to the terms of the Separation Agreement and will rely on the facts as described in the Separation Agreement, the Tax Matters Agreement, other ancillary agreements, the information statement to be distributed to Ashland’s shareholders in connection with the spin-off and a number of other documents. In addition, the opinion will be based on certain representations as to factual matters from, and certain covenants by, Ashland and us. The opinion cannot be relied on if any of the assumptions, representations or covenants is incorrect, incomplete or inaccurate or is violated in any material respect.
30
Table of Contents
The opinion of counsel will not be binding on the Internal Revenue Service (the “IRS”) or the courts, and there can be no assurance that the IRS or a court will not take a contrary position. Ashland has not requested, and does not intend to request, a ruling from the IRS regarding the U.S. federal income tax consequences of the spin-off.
If the spin-off were determined not to qualify for non-recognition of gain and loss, then Ashland would recognize gain as if it had sold our common stock in a taxable transaction in an amount up to the fair market value of our common stock it distributed in the spin-off. In addition, certain reorganization transactions undertaken in connection with the separation and the spin-off could be determined to be taxable, which could result in additional taxable gain. Under certain circumstances, as described in “Certain Relationships and Related Party Transactions—Relationship with Ashland—Tax Matters Agreement,” we could have an indemnification obligation to Ashland with respect to tax on some or all of such gain.
We could have an indemnification obligation to Ashland if events or actions subsequent to the spin-off cause the spin-off to be taxable.
If, due to any of our covenants in the Tax Matters Agreement being breached, it were determined that the spin-off did not qualify for non-recognition of gain and loss, we could be required to indemnify Ashland for the resulting taxes and related expenses. In addition, Section 355(e) of the Code generally creates a presumption that the spin-off would be taxable to Ashland, but not to its shareholders, if we or our shareholders were to engage in transactions that result in a 50% or greater change (by vote or value) in the ownership of our stock during the four-year period beginning on the date that begins two years before the date of the spin-off, unless it were established that such transactions and the spin-off were not part of a plan or series of related transactions. If the spin-off were taxable for U.S. federal income tax purposes to Ashland due to a breach of our covenants or a 50% or greater change in the ownership of our stock, Ashland would recognize gain as if it had sold our common stock in a taxable transaction in an amount up to the fair market value of our stock held by it immediately before the spin-off, and we generally would be required to indemnify Ashland for the tax on such gain and related expenses, as well as any additional gain in connection with certain reorganization transactions undertaken to effect the separation and the spin-off. Any such obligation could have a material impact on our operations. See “Certain Relationships and Related Party Transactions—Relationship with Ashland—Tax Matters Agreement” for more information.
We intend to agree to numerous restrictions to preserve the non-recognition treatment of the spin-off, which may reduce our strategic and operating flexibility.
We intend to agree in the Tax Matters Agreement to covenants and indemnification obligations that address compliance with Section 355(e) of the Code. These covenants and indemnification obligations may limit our ability to pursue strategic transactions or engage in new businesses or other transactions that might be beneficial and could discourage or delay a strategic transaction that our shareholders may consider favorable. See “Certain Relationships and Related Party Transactions—Relationship with Ashland—Tax Matters Agreement” for more information.
Although we expect to enter into the Tax Matters Agreement with Ashland under which our tax liabilities effectively will be determined as if we were not part of any consolidated, combined or unitary tax group of Ashland and/or its subsidiaries, we nonetheless could be held liable for the tax liabilities of other members of these groups.
Our operations have been included in the tax returns filed by Ashland’s consolidated group for U.S. federal income tax purposes (the “consolidated group”). In addition, our operations have been included in certain consolidated, combined or unitary groups that include Ashland and/or certain of its subsidiaries for taxes other than U.S. federal income taxes (each, a “combined group”). We intend to continue to be included in the consolidated group and certain combined groups immediately following this offering until the spin-off. Pursuant
31
Table of Contents
to the Tax Matters Agreement, for any taxable period in which we or any of our subsidiaries are included in the consolidated group or any combined group, we and Ashland generally will make payments to each other such that the amount of taxes payable by us will be determined as if we and each of our subsidiaries included in such consolidated group or combined group filed our own consolidated, combined, unitary or separate tax return.
Each member of the consolidated group during any part of a consolidated return year is jointly and severally liable for tax on the consolidated return of such year and for any subsequently determined deficiency. Similarly, in some jurisdictions, each member of a combined group is jointly and severally liable for the state, local or foreign tax liability of each other member of such group. Accordingly, for any prior period in which we were included in the consolidated group or any combined group, we could be liable for taxes incurred by Ashland and/or its subsidiaries included in such group even if we are no longer a member of such consolidated group or combined group.
We have no operating history as a standalone public company, and our historical and pro forma financial information is not necessarily representative of the results we would have achieved as a standalone public company and may not be a reliable indicator of our future results.
The historical financial information we have included in this prospectus does not reflect, and the pro forma financial information included in this prospectus may not reflect, what our financial position, results of operations or cash flows would have been had we been a standalone entity during the historical periods presented, or what our financial position, results of operations or cash flows will be in the future as an independent entity.
The pro forma financial information included in this prospectus includes adjustments based upon available information we believe to be reasonable. However, the assumptions may change and actual results may differ. In addition, we have not made pro forma adjustments to reflect many significant changes that will occur in our cost structure, funding and operations as a result of our transition to becoming a public company, including changes in our employee base, potential increased costs associated with reduced economies of scale and increased costs associated with being a publicly traded, standalone company. For additional information about the basis of presentation of our pro forma financial information and historical financial information included in this prospectus, see “Selected Combined Financial Data” and “Unaudited Pro Forma Condensed Combined Financial Statements.”
If Ashland experiences a change in control, our current plans and strategies could be subject to change.
As long as Ashland controls us, it will have significant influence over our plans and strategies, including strategies relating to marketing and growth. In the event Ashland experiences a change in control, a new Ashland owner may attempt to cause us to revise or change our plans and strategies, as well as the agreements between Ashland and us, described in this prospectus. A new owner may also have different plans with respect to the contemplated spin-off of our common stock to Ashland shareholders, including not affecting such a spin-off.
Our ability to operate our business effectively may suffer if we are unable to cost-effectively establish our own administrative and other support functions in order to operate as a standalone company after the expiration of our shared services and other intercompany agreements with Ashland.
As a business segment of Ashland, we relied on administrative and other resources of Ashland, including information technology, accounting, finance, human resources and legal, to operate our business. In connection with this offering, we have entered into various service agreements to retain the ability for specified periods to use these Ashland resources. See “Certain Relationships and Related Party Transactions.” These services may not be provided at the same level as when we were a business segment within Ashland, and we may not be able to obtain the same benefits that we received prior to this offering. These services may not be sufficient to meet our needs, and after our agreements with Ashland expire (which will generally occur within 24 months following
32
Table of Contents
the closing of this offering), we may not be able to replace these services at all or obtain these services at prices and on terms as favorable as we currently have with Ashland. We will need to create our own administrative and other support systems or contract with third parties to replace Ashland’s systems. In addition, we have received informal support from Ashland which may not be addressed in the agreements we have entered into with Ashland, and the level of this informal support may diminish as we become a more independent company. Any failure or significant downtime in our own administrative systems or in Ashland’s administrative systems during the transitional period could result in unexpected costs, impact our results and/or prevent us from paying our suppliers or employees and performing other administrative services on a timely basis.
After this offering, we will be a smaller company relative to Ashland, which could result in increased costs because of a decrease in our purchasing power. We may also experience decreased revenue due to difficulty maintaining existing customer relationships and obtaining new customers.
Prior to this offering, we were able to take advantage of Ashland’s size and purchasing power in procuring goods, technology and services, including insurance, employee benefit support and audit and other professional services. We are a smaller company than Ashland, and we cannot assure you that we will have access to financial and other resources comparable to those available to us prior to this offering. As a standalone company, we may be unable to obtain office space, goods, technology and services at prices or on terms as favorable as those available to us prior to this offering, which could increase our costs and reduce our profitability. Our future success depends on our ability to maintain our current relationships with existing customers, and we may have difficulty attracting new customers.
In order to preserve the ability for Ashland to distribute its shares of our common stock on a tax-free basis, we may be prevented from pursuing opportunities to raise capital, to effectuate acquisitions or to provide equity incentives to our employees, which could hurt our ability to grow.
Beneficial ownership by Ashland of at least 80% of the total voting power of our classes of voting stock and 80% of each class of our non-voting stock is required in order for Ashland to effect the spin-off of us or certain other tax-free transactions. We have agreed that, so long as the spin-off could, in the reasonable discretion of Ashland, be effectuated, we will not knowingly take or fail to take, or permit any of our affiliates to knowingly take or fail to take, any action that could reasonably be expected to preclude Ashland’s ability to effectuate the spin-off. As a result, we may be precluded from pursuing certain growth initiatives, including the creation of a class of non-voting stock, unless Ashland were to purchase at least 80% of such class of shares of any subsequent equity offering.
Ashland has agreed to indemnify us for certain liabilities. However, there can be no assurance that the indemnity will be sufficient to insure us against the full amount of such liabilities, or that Ashland’s ability to satisfy its indemnification obligation will not be impaired in the future.
Pursuant to the Separation Agreement and certain other agreements with Ashland, Ashland has agreed to indemnify us for certain liabilities. However, third parties could also seek to hold us responsible for any of the liabilities that Ashland has agreed to retain, and there can be no assurance that the indemnity from Ashland will be sufficient to protect us against the full amount of such liabilities, or that Ashland will be able to fully satisfy its indemnification obligations in the future. Even if we ultimately succeed in recovering from Ashland any amounts for which we are held liable, we may be temporarily required to bear these losses. Each of these risks could negatively affect our business, financial position, results of operations and cash flows.
33
Table of Contents
Some of our directors and executive officers own Ashland common stock, restricted shares of Ashland common stock or options to acquire Ashland common stock and hold positions with Ashland, which could cause conflicts of interest, or the appearance of conflicts of interest, that result in our not acting on opportunities we otherwise may have.
Some of our directors and executive officers own Ashland common stock, restricted shares of Ashland stock or options to purchase Ashland common stock. In addition, Mr. Wulfsohn will serve as the Non-Executive Chairman of our board of directors, while retaining his role as Chairman and Chief Executive Officer of Ashland.
Ownership of Ashland common stock, restricted shares of Ashland common stock and options to purchase Ashland common stock by our directors and executive officers after this offering and the presence of executive officers or directors of Ashland on our board of directors could create, or appear to create, conflicts of interest with respect to matters involving both us and Ashland that could have different implications for Ashland than they do for us. For example, potential conflicts of interest could arise in connection with the resolution of any dispute between Ashland and us regarding terms of the agreements governing the separation and the relationship between Ashland and us thereafter, including the Separation Agreement, the employee matters agreement, the Tax Matters Agreement, the transition services agreements or any other commercial agreements between Ashland and us. Potential conflicts of interest could also arise if we enter into commercial arrangements with Ashland in the future. As a result of these actual or apparent conflicts of interest, we may be precluded from pursuing certain growth initiatives.
Ashland’s ability to control our board of directors may make it difficult for us to recruit high-quality independent directors.
So long as Ashland beneficially owns shares of our common stock representing at least a majority of the votes entitled to be cast by the holders of our outstanding voting stock, Ashland can effectively control and direct our board of directors. Currently, members of our board of directors are also members of the Ashland board of directors. Further, the interests of Ashland and our other shareholders may diverge. Under these circumstances, persons who might otherwise accept our invitation to join our board of directors may decline.
Our inability to resolve favorably any disputes that arise between us and Ashland with respect to our past and ongoing relationships may adversely affect our operating results.
Disputes may arise between Ashland and us in a number of areas relating to our ongoing relationships, including:
| • | labor, tax, employee benefit, indemnification and other matters arising from our separation from Ashland; |
| • | employee retention and recruiting; |
| • | business combinations involving us; and |
| • | the nature, quality and pricing of services that we and Ashland have agreed to provide each other. |
We may not be able to resolve potential conflicts, and even if we do, the resolution may be less favorable than if we were dealing with an unaffiliated party.
The agreements we have entered into with Ashland may be amended upon agreement between the parties. While we are controlled by Ashland, we may not have the leverage to negotiate amendments to these agreements if required on terms as favorable to us as those we would negotiate with an unaffiliated third party.
34
Table of Contents
We will be a “controlled company” within the meaning of the NYSE rules and, as a result, we intend to rely on exemptions from certain corporate governance requirements that provide protection to shareholders of other companies.
After the completion of this offering, Ashland will own more than 50% of the total voting power of our common stock and we will be a “controlled company” under the NYSE corporate governance standards. As a controlled company, certain exemptions under the NYSE corporate governance standards free us from the obligation to comply with certain of the NYSE corporate governance requirements, including the requirements:
| • | that a majority of our board of directors consists of independent directors; |
| • | that we have a compensation committee that is comprised entirely of independent directors with a written charter addressing the committees’ purpose and responsibilities; |
| • | that we have a governance and nominating committee that is comprised entirely of independent directors with a written charter addressing the committees’ purpose and responsibilities; and |
| • | the requirement for an annual performance evaluation of our nominating and governance and compensation committees. |
Consistent with these exceptions, while Ashland continues to control a majority of our outstanding common stock, we intend to elect not to comply with the corporate governance standards requiring (i) a majority of independent directors on the board; (ii) a fully independent compensation committee; and (iii) a fully independent governance and nominating committee. Accordingly, you will not have the same protections afforded to shareholders of companies that are subject to all of the corporate governance requirements of the NYSE. In the event that we cease to be a controlled company within the meaning of the NYSE rules, we will be required to comply with these requirements after specified transition periods.
Risks Related to This Offering and Ownership of Our Common Stock
No market currently exists for our common stock. We cannot assure you that an active trading market will develop for our common stock.
Prior to this offering, there has been no public market for shares of our common stock. We cannot predict the extent to which investor interest in our company will lead to the development of a trading market on the NYSE or otherwise, or how liquid that market might become. If an active market does not develop, you may have difficulty selling any shares of our common stock that you purchase in this initial public offering. The initial public offering price for the shares of our common stock will be determined by negotiations between us and the representatives of the underwriters, and may not be indicative of prices that will prevail in the open market following this offering.
If our stock price fluctuates after this offering, you could lose a significant part of your investment.
The market price of our common stock will be influenced by many factors, some of which are beyond our control, including those described above in “—Risks Related to Our Business” and the following:
| • | the failure of securities analysts to cover our common stock after this offering or changes in financial estimates by analysts; |
| • | the inability to meet the financial estimates of analysts who follow our common stock; |
| • | strategic actions by us or our competitors; |
| • | announcements by us or our competitors of significant contracts, acquisitions, joint marketing relationships, joint ventures or capital commitments; |
| • | variations in our quarterly operating results and those of our competitors; |
| • | general economic and stock market conditions; |
| • | risks related to our business and our industry, including those discussed above; |
35
Table of Contents
| • | changes in conditions or trends in our industry, markets or customers; |
| • | terrorist acts; |
| • | future sales of our common stock or other securities; |
| • | whether, when and in what manner Ashland completes the spin-off; and |
| • | investor perceptions of the investment opportunity associated with our common stock relative to other investment alternatives. |
As a result of these factors, investors in our common stock may not be able to resell their shares at or above the initial offering price or may not be able to resell them at all. These broad market and industry factors may materially reduce the market price of our common stock, regardless of our operating performance. In addition, price volatility may be greater if the public float and trading volume of our common stock is low.
We may change our dividend policy at any time.
Although following this offering we initially expect to pay quarterly cash dividends to holders of our common stock, we have no obligation to pay any dividend, and our dividend policy may change at any time without notice to our shareholders. The declaration and amount of any future dividends to holders of our common stock will be at the discretion of our board of directors in accordance with applicable law and after taking into account various factors, including our financial condition, operating results, current and anticipated cash needs, cash flows, impact on our effective tax rate, indebtedness, contractual obligations, legal requirements and other factors that our board of directors deems relevant. As a result, we cannot assure you that we will pay dividends at any rate or at all.
Future sales, or the perception of future sales, of our common stock may depress the price of our common stock.
The market price of our common stock could decline significantly as a result of sales or other distributions of a large number of shares of our common stock in the market after this offering, including shares which might be offered for sale or distributed by Ashland. The perception that these sales might occur could depress the market price of our common stock. These sales, or the possibility that these sales may occur, also might make it more difficult for us to sell equity securities in the future at a time and at a price that we deem appropriate.
Upon completion of this offering, we will have shares of common stock ( shares if the underwriters exercise their overallotment option in full) outstanding. The shares of common stock offered in this offering will be freely tradable without restriction under the Securities Act of 1933, as amended (the “Securities Act”), except for any shares of common stock that may be held or acquired by our directors, executive officers and other affiliates, as that term is defined in the Securities Act, which will be restricted securities under the Securities Act. Restricted securities may not be sold in the public market unless the sale is registered under the Securities Act or an exemption from registration is available. We will grant registration rights to Ashland with respect to shares of our common stock. Any shares registered pursuant to the registration rights agreement described in “Certain Relationships and Related Party Transactions” will be freely tradable in the public market following a 180-day lock-up period as described below.
In connection with this offering, we, our directors and executive officers and Ashland have each agreed to enter into a lock-up agreement and thereby be subject to a lock-up period, meaning that they and their permitted transferees will not be permitted to sell any of the shares of our common stock for 180 days after the date of this prospectus, without the prior consent of Merrill Lynch, Pierce, Fenner & Smith Incorporated, Citigroup Global Markets Inc. and Morgan Stanley & Co. LLC on behalf of the underwriters. Although we have been advised that there is no present intention to do so, Merrill Lynch, Pierce, Fenner & Smith Incorporated, Citigroup Global Markets Inc. and Morgan Stanley & Co. LLC, on behalf of the underwriters may, in their sole discretion and without notice, release all or any portion of the shares of our common stock from the restrictions in any of the lock-up agreements described above. See “Underwriting.”
36
Table of Contents
Also, in the future, we may issue our securities in connection with investments or acquisitions. The amount of shares of our common stock issued in connection with an investment or acquisition could constitute a material portion of our then-outstanding shares of our common stock.
You will experience immediate and substantial dilution in the net tangible book value of the shares you purchase in this offering, and you will suffer additional dilution if the underwriters exercise their overallotment option.
If you purchase shares of our common stock in this offering, you will experience immediate and substantial dilution, as the initial public offering price of our common stock will be substantially greater than the pro forma net tangible book value per share of our common stock. Based on the assumed initial offering price of $ per share, if you purchase our common stock in this offering, you will suffer immediate and substantial dilution of approximately $ per share. In connection with the separation, we will assume Ashland stock-based compensation awards of our employees, which may result in additional dilution to investors in this offering.
Our costs will increase significantly as a result of operating as a public company, and our management will be required to devote substantial time to complying with public company regulations.
We have historically operated our business as a division of a public company. As a standalone public company, we will have additional legal, accounting, insurance, compliance and other expenses that we have not incurred historically. After this offering, we will become obligated to file with the Securities Exchange Commission (“SEC”) annual and quarterly reports and other reports that are specified in Section 13 and other sections of the Securities Exchange Act of 1934, as amended (the “Exchange Act”). We will also be required to ensure that we have the ability to prepare financial statements that are fully compliant with all SEC reporting requirements on a timely basis. In addition, we will become subject to other reporting and corporate governance requirements, including certain requirements of the NYSE, and certain provisions of the Sarbanes-Oxley Act of 2002 (“Sarbanes-Oxley”) and the regulations promulgated thereunder, which will impose significant compliance obligations upon us.
Sarbanes-Oxley, as well as rules subsequently implemented by the SEC and the NYSE, have imposed increased regulation and disclosure and required enhanced corporate governance practices of public companies. We are committed to maintaining high standards of corporate governance and public disclosure, and our efforts to comply with evolving laws, regulations and standards in this regard are likely to result in increased selling and administrative expenses and a diversion of management’s time and attention from revenue-generating activities to compliance activities. These changes will require a significant commitment of additional resources. We may not be successful in implementing these requirements and implementing them could materially adversely affect our business, results of operations and financial condition. In addition, if we fail to implement the requirements with respect to our internal accounting and audit functions, our ability to report our operating results on a timely and accurate basis could be impaired. If we do not implement such requirements in a timely manner or with adequate compliance, we might be subject to sanctions or investigation by regulatory authorities, such as the SEC or the NYSE. Any such action could harm our reputation and the confidence of investors and customers in our company and could materially adversely affect our business and cause our share price to fall.
Failure to achieve and maintain effective internal controls in accordance with Section 404 of Sarbanes-Oxley could have a material adverse effect on our business and stock price.
As a public company, we will be required to document and test our internal control procedures in order to satisfy the requirements of Section 404 of Sarbanes-Oxley, which will require annual management assessments of the effectiveness of our internal control over financial reporting and a report by our independent registered public accounting firm that addresses the effectiveness of internal control over financial reporting. During the course of our testing, we may identify deficiencies which we may not be able to remediate in time to meet our deadline for compliance with Section 404. Testing and maintaining internal control can divert our management’s
37
Table of Contents
attention from other matters that are important to the operation of our business. We also expect the regulations under Sarbanes-Oxley to increase our legal and financial compliance costs, make it more difficult to attract and retain qualified officers and members of our board of directors, particularly to serve on our audit committee, and make some activities more difficult, time consuming and costly. We may not be able to conclude on an ongoing basis that we have effective internal control over financial reporting in accordance with Section 404 or our independent registered public accounting firm may not be able or willing to issue an unqualified report on the effectiveness of our internal control over financial reporting. If we conclude that our internal control over financial reporting is not effective, we cannot be certain as to the timing of completion of our evaluation, testing and remediation actions or their effect on our operations because there is presently no precedent available by which to measure compliance adequacy. If either we are unable to conclude that we have effective internal control over financial reporting or our independent auditors are unable to provide us with an unqualified report as required by Section 404, then investors could lose confidence in our reported financial information, which could have a negative effect on the trading price of our stock.
If securities or industry analysts do not publish research or reports about our business, if they adversely change their recommendations regarding our stock or if our operating results do not meet their expectations, our stock price could decline.
The trading market for our common stock will be influenced by the research and reports that industry or securities analysts publish about us or our business. If one or more of these analysts cease coverage of our company or fail to publish reports on us regularly, we could lose visibility in the financial markets, which in turn could cause our stock price or trading volume to decline. Moreover, if one or more of the analysts who cover our company downgrades our stock or if our operating results do not meet their expectations, our stock price could decline.
We could be subject to securities class action litigation.
In the past, securities class action litigation has often been instituted against companies whose securities have experienced periods of volatility in market price. Securities litigation brought against us following volatility in the price of our common stock, regardless of the merit or ultimate results of such litigation, could result in substantial costs, which would hurt our financial condition and results of operations and divert management’s attention and resources from our business.
Anti-takeover provisions in our charter documents and under Kentucky law could discourage, delay or prevent a change in control of our company and may result in an entrenchment of management and diminish the value of our common stock.
Several provisions of our amended and restated certificate of incorporation and amended and restated by-laws could make it difficult for our shareholders to change the composition of our board of directors, preventing them from changing the composition of management. In addition, the same provisions may discourage, delay or prevent a merger or acquisition that our shareholders may consider favorable.
These include:
| • | provisions in our amended and restated articles of incorporation and our amended and restated by-laws limiting the ability of our shareholders to remove directors without cause, change the authorized number of directors and fill director vacancies; |
| • | provisions in our amended and restated articles of incorporation prohibiting cumulative voting in the election of directors; |
| • | the availability under our amended and restated articles of incorporation of authorized but unissued shares of preferred stock for issuance by us from time to time at the discretion of our board of directors; |
38
Table of Contents
| • | provisions in our amended and restated by-laws requiring that shareholders provide advance notice in order to raise business or make nominations at shareholders’ meetings, which could have the effect of delaying shareholder action until the next shareholders’ meeting that is favored by the holders of a majority of our outstanding voting securities or may discourage or deter a potential acquirer from conducting a solicitation of proxies to elect its own slate of directors or otherwise attempting to obtain control of us; |
| • | provisions in our amended and restated articles of incorporation limiting the ability of shareholders to adopt, amend or repeal our amended and restated by-laws and to amend or repeal certain provisions in our amended and restated articles of incorporation; and |
| • | provisions in Section 271B.12 of the Kentucky Business Corporation Act and our amended and restated articles of incorporation preventing us from engaging in certain business combinations with an interested shareholder (generally defined as a beneficial owner of 10% or more of our outstanding voting power) for a period of five years after the date such shareholder became an interested shareholder, unless certain procedures are followed or certain conditions are satisfied. |
These anti-takeover provisions could substantially impede the ability of our shareholders to benefit from a change in control and, as a result, could materially adversely affect the market price of our common stock and your ability to realize any potential change-in-control premium. You should carefully review our amended and restated articles of incorporation and our amended and restated by-laws, forms of which are filed as exhibits to the registration statement of which this prospectus is a part, which will govern your rights as a shareholder, as well as “Description of Capital Stock” and the provisions of applicable Kentucky law.
Our board of directors will have the ability to issue blank check preferred stock, which may discourage or impede acquisition attempts or other transactions.
Our board of directors will have the power, subject to applicable law, to issue series of preferred stock that could, depending on the terms of the series, impede the completion of a merger, tender offer or other takeover attempt. For instance, subject to applicable law, a series of preferred stock may impede a business combination by including class voting rights, which would enable the holder or holders of such series to block a proposed transaction. Our board of directors will make any determination to issue shares of preferred stock on its judgment as to our and our shareholders’ best interests. Our board of directors, in so acting, could issue preferred stock having terms which could discourage an acquisition attempt or other transaction that some, or a majority, of the shareholders may believe to be in their best interests or in which shareholders would have received a premium for their stock over the then prevailing market price of the stock.
39
Table of Contents
CAUTIONARY STATEMENT REGARDING FORWARD-LOOKING STATEMENTS
This prospectus contains forward-looking statements. All statements, other than statements of historical facts, contained in this prospectus, including statements regarding our industry, position, goals, strategy, future operations, future financial position, future revenues, estimated costs, prospects, margins, profitability, capital expenditures, liquidity, capital resources, plans, and objectives of management, including those made in the sections entitled “Prospectus Summary,” Risk Factors,” “Management’s Discussion and Analysis of Financial Condition and Results of Operations” and “Business,” are forward-looking statements. The words “anticipate,” “believe,” “estimate,” “likely,” “expect,” “intend,” “may,” “plan,” “predict,” “project,” “forecast,” “target,” “potential,” “will,” “would,” “could,” “should,” “continue,” “contemplate,” “might,” “objective,” “on-going,” “seek” and similar expressions are intended to identify forward-looking statements, although not all forward-looking statements contain these identifying words.
These forward-looking statements are based on our current expectations and assumptions regarding, as of the date such statements are made, our future operating performance and financial condition, including our separation from Ashland, the expected timetable for the spin-off and our future financial and operating performance, strategic and competitive advantages, leadership and future opportunities, as well as the economy and other future events or circumstances. Our expectations and assumptions include, without limitation, internal forecasts and analyses of current and future market conditions and trends, management plans and strategies, operating efficiencies and economic conditions (such as prices, supply and demand, cost of raw materials, and the ability to recover raw-material cost increases through price increases), and risks and uncertainties associated with the following: demand for our products and services; sales growth in emerging markets; the prices and margins of our products and services; the strength of our reputation and brand; our ability to develop and successfully market new products and implement our digital platforms; our ability to retain our largest customers; potential product liability claims; achievement of the expected benefits of the separation; our substantial indebtedness (including the possibility that such indebtedness and related restrictive covenants may adversely affect our future cash flows, results of operations, financial condition and our ability to repay debt) and other liabilities; operating as a standalone public company; our ongoing relationship with Ashland; failure, caused by us, of Ashland’s spin-off of our common stock to its shareholders to qualify for tax-free treatment, which may result in significant tax liabilities to Ashland for which we may be required to indemnify Ashland; and the impact of acquisitions and/or divestitures we have made or may make (including the possibility that we may not realize the anticipated benefits from such transactions). These forward-looking statements are subject to a number of known and unknown risks, uncertainties and assumptions, including those described in “Risk Factors.” In light of these risks, uncertainties and assumptions, the forward-looking events and circumstances discussed in this prospectus may not occur, and actual results could differ materially and adversely from those anticipated or implied in the forward-looking statements.
You should not rely upon forward-looking statements as predictions of future events. Although we believe that the expectations reflected in the forward-looking statements are reasonable, we cannot guarantee future results, level of activity, performance or achievements. In addition, neither we nor any other person assumes responsibility for the accuracy and completeness of any of these forward-looking statements. In light of the significant uncertainties in these forward-looking statements, you should not regard these statements as a representation or warranty by us or any other person that we will achieve our objectives and plans in any specified time frame, or at all. These forward-looking statements speak only as of the date of this prospectus. Except as required by law, we assume no obligation to update or revise these forward-looking statements for any reason, even if new information becomes available in the future.
See “Risk Factors” for a more complete discussion of the risks and uncertainties mentioned above and for discussion of other risks and uncertainties. All forward-looking statements attributable to us are expressly qualified in their entirety by these cautionary statements as well as others made in this prospectus and hereafter in our other SEC filings and public communications. You should evaluate all forward-looking statements made by us in the context of these risks and uncertainties.
40
Table of Contents
Based on our assumed initial public offering price of $ per share (the midpoint of the price range set forth on the cover page of this prospectus), we estimate that the proceeds we will receive from the sale of our common stock in this offering will be approximately $ million (or approximately $ million if the underwriters’ overallotment option is exercised in full), after deducting the underwriting discount and commissions and estimated offering expenses payable by us. We intend to use the net proceeds of this offering to repay $ million of indebtedness, with an interest rate of %. As described in “Description of Indebtedness,” we may incur certain short-term indebtedness in the amount of $ million, with an interest rate of %, immediately prior to the closing of this offering. If we incur this short-term indebtedness, we plan to repay such short-term indebtedness in full with the net proceeds of this offering. Any remaining proceeds will be used for general corporate purposes.
A $1.00 increase (decrease) in the assumed initial public offering price of $ per share would increase (decrease) the net proceeds to us from this offering by $ million, assuming the expected number of shares to be sold by us in this offering remains the same and after deducting the underwriting discount and commissions and estimated offering expenses payable by us. If the underwriters exercise their overallotment option in full, we estimate our net proceeds will be approximately $ million. We may also increase or decrease the number of shares we are offering. Each increase (decrease) of 1,000,000 shares in the number of shares offered by us would increase (decrease) the net proceeds to us by approximately $ million, assuming that the assumed initial public offering price of $ per share (the midpoint of the price range set forth on the cover page of this prospectus) remains the same, and after deducting the underwriting discount and commissions and estimated offering expenses payable by us.
41
Table of Contents
We intend to pay quarterly cash dividends to holders of our common stock. The declaration and payment of dividends to holders of our common stock will be at the discretion of our board of directors in accordance with applicable law after taking into account various factors, including our financial condition, operating results, current and anticipated cash needs, cash flows, impact on our effective tax rate, indebtedness, legal requirements and other factors that our board of directors deems relevant. In addition, the instruments governing our indebtedness may limit our ability to pay dividends. Therefore, no assurance is given that we will pay any dividends to our shareholders, or as to the amount of any such dividends if our board of directors determines to do so.
42
Table of Contents
The following table sets forth our cash and cash equivalents and capitalization as of March 31, 2016 on an actual basis and on a pro forma basis to reflect the transactions described in “Unaudited Pro Forma Condensed Combined Financial Statements.”
The information below is not necessarily indicative of what our cash and cash equivalents and capitalization would have been had the separation and contribution transactions been completed as of March 31, 2016. In addition, it is not indicative of our future cash and cash equivalents and capitalization. This table is derived from, and is qualified in its entirety by reference to, our historical and pro forma financial statements and the notes thereto included elsewhere in this prospectus, and should be read in conjunction with “Selected Combined Financial Data,” “Unaudited Pro Forma Condensed Combined Financial Statements,” “Management’s Discussion and Analysis of Financial Condition and Results of Operations” and our combined financial statements and notes thereto included elsewhere in this prospectus.
| As of March 31, 2016 |
||||||||
| Actual | Pro forma(1) | |||||||
| (Unaudited) | ||||||||
| (Dollars in millions, except per share data) |
||||||||
| Cash and cash equivalents(2) |
$ | $ | ||||||
|
|
|
|
|
|||||
| Debt: |
||||||||
| Long-term debt |
— | $ | ||||||
|
|
|
|
|
|||||
| Total debt |
— | $ | ||||||
|
|
|
|
|
|||||
| Equity: |
||||||||
| Ashland’s net investment |
$ | — | ||||||
| Common stock, $0.01 par value ( shares authorized and shares issued and outstanding on a pro forma basis)(3) |
— | $ | ||||||
| Accumulated other comprehensive income (loss) |
— | |||||||
|
|
|
|
|
|||||
| Additional paid-in capital |
$ | $ | ||||||
|
|
|
|
|
|||||
| Total equity |
$ | $ | ||||||
|
|
|
|
|
|||||
| Total capitalization |
$ | $ | ||||||
|
|
|
|
|
|||||
| (1) | Each $1.00 increase (decrease) in the assumed initial public offering price of $ per share, the midpoint of the price range set forth on the cover page of this prospectus, would increase (decrease) total stockholders’ equity by approximately $ , assuming that the number of shares offered by us, as set forth on the cover page of this prospectus, remains the same, and after deducting the underwriting discount and commissions and estimated offering expenses payable by us. We may also increase or decrease the number of shares we are offering. Each increase (decrease) of 1,000,000 shares in the number of shares offered by us would increase (decrease) total stockholders’ equity by approximately $ , assuming that the assumed initial public offering price remains the same, and after deducting the underwriting discount and commissions and estimated offering expenses payable by us. The pro forma as adjusted information discussed above is illustrative only and will adjust based on the actual initial public offering price and other terms of this offering determined at pricing. |
| (2) | Ashland uses a centralized approach to cash management. Accordingly, cash and cash equivalents are held by Ashland at the corporate level and were not attributed to Valvoline for the period presented. Transfers of cash, both to and from Ashland’s centralized cash management system, are reflected as a component of Ashland’s net investment in Valvoline on the Combined Balance Sheet and as a financing activity within the accompanying Combined Statement of Cash Flows. |
| (3) | The number of shares of common stock issued and outstanding on a pro forma basis assumes the underwriters do not exercise their overallotment option. |
43
Table of Contents
Investors purchasing our common stock in this offering will experience immediate and substantial dilution in the pro forma net tangible book value of their shares of common stock. Dilution in pro forma net tangible book value represents the difference between the public offering price per share of our common stock and the pro forma as adjusted net tangible book value per share of our common stock immediately after this offering.
Pro forma net tangible book value represents our total tangible assets (total assets less intangible assets) less total liabilities, divided by the pro forma number of outstanding shares of common stock. As of March 31, 2016, our pro forma net tangible book value was $ million, or $ per share. After giving effect to the sale and issuance of shares of our common stock in this offering at an assumed initial public offering price of $ per share, the midpoint of the price range set forth on the cover page of this prospectus, and after deducting the underwriting discount and commissions and estimated offering expenses payable by us, our pro forma as adjusted net tangible book value as of March 31, 2016 would have been approximately $ million, or $ per share. This represents an immediate increase in pro forma as adjusted net tangible book value of $ per share to our existing shareholder, Ashland, and an immediate dilution of $ per share to new investors participating in this offering.
The following table illustrates this dilution on a per share basis to new investors:
| Assumed initial price to public per share |
$ | |||||||
| Pro forma net tangible book value per share as of March 31, 2016(1) |
$ | |||||||
| Increase per share attributable to new investors(2) |
$ | |||||||
|
|
|
|||||||
| Pro forma as adjusted net tangible book value per share after this offering(3) |
||||||||
|
|
|
|||||||
| Dilution per share to new investors |
$ | |||||||
|
|
|
| (1) | Determined by dividing the net tangible book value of the contributed tangible assets (total assets less intangible assets) less total liabilities by the total number of common shares ( common shares) to be issued to Ashland for its contribution of assets and liabilities to us in connection with the separation. |
| (2) | Represents the difference between pro forma as adjusted net tangible book value per share after this offering and pro forma net tangible book value per share as of March 31, 2016. |
| (3) | Determined by dividing (i) pro forma as adjusted net tangible book value, which is our pro forma net tangible book value plus the cash proceeds of this offering at an assumed initial public offering price of $ per share, the midpoint of the price range set forth on the cover page of this prospectus, and after deducting the underwriting discount and commissions and estimated offering expenses payable by us, by (ii) the total number of our common shares to be outstanding following this offering. |
Each $1.00 increase (decrease) in the assumed initial public offering price of $ per share, the midpoint of the price range set forth on the cover page of this prospectus, would increase (decrease) our pro forma as adjusted net tangible book value by approximately $ million, or approximately $ per share, and increase (decrease) the dilution per share to investors participating in this offering by approximately $ per share, assuming that the number of shares offered by us remains the same and after deducting the underwriting discount and commissions and estimated offering expenses payable by us. We may also increase or decrease the number of shares we are offering. An increase of 1,000,000 in the number of shares offered by us would increase our pro forma as adjusted net tangible book value by approximately $ million, or $ per share, and decrease the dilution per share to investors participating in this offering by $ per share, assuming that the assumed initial public offering price remains the same, and after deducting the underwriting discount and commissions and estimated offering expenses payable by us. Similarly, a decrease of 1,000,000 shares in the number of shares offered by us would decrease our pro forma as adjusted net tangible book value by approximately $ million, or $ per share, and increase the dilution per share to investors participating in this offering by $ per share, assuming that the assumed initial public offering price remains the same, and after deducting the underwriting discount and commissions and estimated offering expenses payable by us. The pro forma as adjusted information discussed above is illustrative only and will adjust based on the actual initial public offering price and other terms of this offering determined at pricing.
44
Table of Contents
If the underwriters exercise their overallotment option in full, the pro forma as adjusted net tangible book value per share after this offering would be $ per share, the incremental increase in the pro forma net tangible book value per share to our existing shareholder, Ashland, would be $ per share and the pro forma dilution to new investors participating in this offering would be $ per share.
The following table summarizes, on the pro forma as adjusted basis described above as of March 31, 2016, the differences between the number of shares of common stock purchased from us, the total consideration and the price per share paid by our existing shareholder, Ashland, and by investors participating in this offering at an assumed initial public offering price of $ per share, the midpoint of the price range set forth on the cover page of this prospectus, before deducting the underwriting discount and commissions and estimated offering expenses payable by us.
| Shares Purchased | Total Consideration (in thousands) |
Weighted- Average Price Per Share |
||||||||||||||||||
| Number | Percent | Amount | Percent | |||||||||||||||||
| Ashland |
(1) | % | $ | (2) | % | $ | ||||||||||||||
| Investors participating in this offering |
% | % | ||||||||||||||||||
|
|
|
|
|
|
|
|
|
|
|
|||||||||||
| Total |
100.0 | % | $ | % | $ | |||||||||||||||
|
|
|
|
|
|
|
|
|
|
|
|||||||||||
| (1) | Represents the total number of common shares ( common shares) to be issued to Ashland for its contribution of assets and liabilities to us. |
| (2) | Represents the net tangible book value as of , 2016 of the tangible assets (total assets less intangible assets) less total liabilities contributed in connection with the separation. |
Each $1.00 increase (decrease) in the assumed initial public offering price of $ per share would increase (decrease) total consideration paid by new investors by approximately $ million, assuming that the number of shares offered by us, as set forth on the cover page of this prospectus, remains the same and after deducting the underwriting discount and commissions and estimated offering expenses payable by us. We may also increase or decrease the number of shares we are offering. An increase (decrease) of 1,000,000 in the number of shares offered by us would increase (decrease) total consideration paid by new investors by approximately $ million, assuming that the assumed initial public offering price remains the same, and after deducting the underwriting discount and commissions and estimated offering expenses payable by us.
45
Table of Contents
SELECTED COMBINED FINANCIAL DATA
The following financial data should be read in conjunction with our audited and unaudited combined financial statements and the related notes, and our unaudited pro forma condensed combined financial statements and the related notes, included elsewhere in this prospectus.
The following table summarizes our historical combined financial data. The selected historical combined balance sheet data as of September 30, 2015 and 2014 and statement of operations data for the years ended September 30, 2015, 2014, and 2013 are derived from our audited combined financial statements included elsewhere in this prospectus. The selected historical combined financial data as of and for the six months ended March 31, 2016 and 2015 is derived from our unaudited interim combined financial statements included elsewhere in this prospectus. The historical combined balance sheet data as of September 30, 2013, 2012, and 2011 and statement of operations data for the years ended September 30, 2012 and 2011 are derived from our unaudited annual combined financial statements, which are not included in this prospectus. In the opinion of management, the unaudited combined financial statements include all normal and recurring adjustments that we consider necessary for a fair presentation of the financial position and the operating results for these periods. The operating results for the six months ended March 31, 2016 are not necessarily indicative of the results that may be expected for the year ended September 30, 2016 or any other interim periods or any future year or period.
The selected historical combined financial data includes certain expenses of Ashland that were allocated to us for certain corporate functions including, treasury, legal, accounting, insurance, information technology, payroll administration, human resources, stock incentive plans and other services. Management believes the assumptions underlying the combined financial statements, including the assumptions regarding allocated expenses, reasonably reflect the utilization of services provided to or the benefit received by us during the periods presented. However, these shared expenses may not represent the amounts that would have been incurred had we operated autonomously or independently from Ashland. Actual costs that would have been incurred if we had been a standalone company would depend on multiple factors, including organizational structure and strategic decisions in various areas, such as information technology and infrastructure. In addition, our historical combined financial data does not reflect changes that we expect to experience in the future as a result of our separation from Ashland, including changes in our cost structure, personnel needs, tax structure, capital structure, financing and business operations.
Our annual and interim combined financial statements also do not reflect the assignment of certain assets and liabilities between Ashland and us as reflected under “Unaudited Pro Forma Condensed Combined Financial Statements” included elsewhere in this prospectus. Consequently, the financial information included in this section may not necessarily reflect what our financial position, results of operations and cash flows would have been had we been a standalone company during the periods presented. Accordingly, these historical results should not be relied upon as an indicator of our future performance.
46
Table of Contents
The following selected historical combined financial data should be read in conjunction with “Management’s Discussion and Analysis of Financial Condition and Results of Operations” and the “Unaudited Pro Forma Condensed Combined Financial Statements” and accompanying notes and the interim and annual combined financial statements and accompanying notes included elsewhere in this prospectus.
| (Dollars in millions) | Six months ended March 31, |
Year ended September 30, |
||||||||||||||||||||||||||
| 2016 | 2015 | 2015 | 2014 | 2013 | 2012 | 2011 | ||||||||||||||||||||||
| (unaudited) | (unaudited) | (unaudited) | (unaudited) | |||||||||||||||||||||||||
| Statement of Operations Data: |
||||||||||||||||||||||||||||
| Sales |
$ | 935.7 | $ | 973.4 | $ | 1,966.9 | $ | 2,041.3 | $ | 1,996.2 | $ | 2,034.0 | $ | 1,971.1 | ||||||||||||||
| Cost of sales |
567.9 | 634.9 | 1,281.8 | 1,408.9 | 1,338.3 | 1,502.1 | 1,447.9 | |||||||||||||||||||||
|
|
|
|
|
|
|
|
|
|
|
|
|
|
|
|||||||||||||||
| Gross profit |
367.8 | 338.5 | 685.1 | 632.4 | 657.9 | 531.9 | 523.2 | |||||||||||||||||||||
| Selling, general and administrative |
137.4 | 128.4 | 290.8 | 302.8 | 213.4 | 302.3 | 298.8 | |||||||||||||||||||||
| Corporate expense allocation |
41.1 | 39.2 | 79.5 | 95.0 | 88.2 | 80.6 | 81.7 | |||||||||||||||||||||
| Equity and other income (loss) |
10.7 | (2.0 | ) | 8.3 | 30.1 | 24.3 | 22.5 | 19.6 | ||||||||||||||||||||
|
|
|
|
|
|
|
|
|
|
|
|
|
|
|
|||||||||||||||
| Operating income |
200.0 | 168.9 | 323.1 | 264.7 | 380.6 | 171.5 | 162.3 | |||||||||||||||||||||
| Net loss on acquisition and divestiture |
(0.5 | ) | (26.0 | ) | (26.3 | ) | — | — | — | — | ||||||||||||||||||
|
|
|
|
|
|
|
|
|
|
|
|
|
|
|
|||||||||||||||
| Income before income taxes |
199.5 | 142.9 | 296.8 | 264.7 | 380.6 | 171.5 | 162.3 | |||||||||||||||||||||
| Income tax expense |
66.5 | 52.4 | 100.7 | 91.3 | 134.5 | 57.7 | 52.4 | |||||||||||||||||||||
|
|
|
|
|
|
|
|
|
|
|
|
|
|
|
|||||||||||||||
| Net income |
$ | 133.0 | $ | 90.5 | $ | 196.1 | $ | 173.4 | $ | 246.1 | $ | 113.8 | $ | 109.9 | ||||||||||||||
|
|
|
|
|
|
|
|
|
|
|
|
|
|
|
|||||||||||||||
| As of March 31, |
As of September 30, |
|||||||||||||||||||||||||||
| 2016 | 2015 | 2015 | 2014 | 2013 | 2012 | 2011 | ||||||||||||||||||||||
| (unaudited) | (unaudited) | (unaudited) | (unaudited) | (unaudited) | ||||||||||||||||||||||||
| Balance Sheet Data: |
||||||||||||||||||||||||||||
| Current assets |
$ | 514.4 | $ | 502.0 | $ | 477.3 | $ | 544.7 | $ | 519.1 | $ | 496.2 | $ | 501.1 | ||||||||||||||
| Property, plant and equipment, net |
266.5 | 248.0 | 253.5 | 272.4 | 270.2 | 262.1 | 255.7 | |||||||||||||||||||||
| Total assets |
1,117.4 | 999.3 | 977.9 | 1,082.5 | 1,062.0 | 1,023.9 | 993.1 | |||||||||||||||||||||
| Current liabilities |
300.6 | 266.1 | 298.6 | 293.5 | 312.6 | 291.8 | 289.4 | |||||||||||||||||||||
| Total liabilities |
377.8 | 327.3 | 360.8 | 357.7 | 378.3 | 354.0 | 337.0 | |||||||||||||||||||||
| Six months ended March 31, |
Year ended September 30, |
|||||||||||||||||||||||||||
| Unaudited | 2016 | 2015 | 2015 | 2014 | 2013 | 2012 | 2011 | |||||||||||||||||||||
| Other Financial Data: |
||||||||||||||||||||||||||||
| Free cash flow (1) |
$ | 76.7 | $ | 142.9 | $ | 284.8 | $ | 133.4 | $ | 232.0 | $ | 98.1 | $ | 86.6 | ||||||||||||||
| EBITDA (2) |
218.5 | 161.7 | 334.8 | 301.8 | 416.3 | 207.2 | 199.9 | |||||||||||||||||||||
| Adjusted EBITDA (2) |
223.2 | 204.4 | 421.8 | 369.2 | 342.3 | 275.0 | 251.6 | |||||||||||||||||||||
47
Table of Contents
| (1) | For a complete discussion of the method of calculating free cash flow and its usefulness, refer to “Prospectus Summary—Summary Historical and Pro Forma Combined Financial Data” included elsewhere in this prospectus. |
| The following table reconciles free cash flow to cash flows provided by operating activities for the periods presented. |
| (Dollars in millions) | Six months ended March 31, |
Year ended September 30, |
||||||||||||||||||||||||||
| 2016 | 2015 | 2015 | 2014 | 2013 | 2012 | 2011 | ||||||||||||||||||||||
| Cash flows provided by operating activities |
$ | 91.1 | $ | 160.6 | $ | 329.8 | $ | 170.6 | $ | 272.9 | $ | 137.8 | $ | 122.7 | ||||||||||||||
| Less: |
||||||||||||||||||||||||||||
| Additions to property, plant and equipment |
(14.4) | (17.7) | (45.0) | (37.2) | (40.9) | (39.7) | (36.1) | |||||||||||||||||||||
|
|
|
|
|
|
|
|
|
|
|
|
|
|
|
|||||||||||||||
| Free cash flow |
$ | 76.7 | $ | 142.9 | $ | 284.8 | $ | 133.4 | $ | 232.0 | $ | 98.1 | $ | 86.6 | ||||||||||||||
|
|
|
|
|
|
|
|
|
|
|
|
|
|
|
|||||||||||||||
| (2) | For a complete discussion of the method of calculating EBITDA and Adjusted EBITDA and their usefulness, refer to “Prospectus Summary—Summary Historical and Pro Forma Combined Financial Data” included elsewhere in this prospectus. |
The following table reconciles EBITDA and Adjusted EBITDA to net income for the periods presented.
| (Dollars in millions) | Six months ended March 31, |
Year ended September 30, |
||||||||||||||||||||||||||
| 2016 | 2015 | 2015 | 2014 | 2013 | 2012 | 2011 | ||||||||||||||||||||||
| Net income |
$ | 133.0 | $ | 90.5 | $ | 196.1 | $ | 173.4 | $ | 246.1 | $ | 113.8 | $ | 109.9 | ||||||||||||||
| Income tax expense |
66.5 | 52.4 | 100.7 | 91.3 | 134.5 | 57.7 | 52.4 | |||||||||||||||||||||
| Depreciation and amortization |
19.0 | 18.8 | 38.0 | 37.1 | 35.7 | 35.7 | 37.6 | |||||||||||||||||||||
|
|
|
|
|
|
|
|
|
|
|
|
|
|
|
|||||||||||||||
| EBITDA |
218.5 | 161.7 | 334.8 | 301.8 | 416.3 | 207.2 | 199.9 | |||||||||||||||||||||
| Losses (gains) on pension and other postretirement plans remeasurement |
4.7 | 2.0 | 46.0 | 61.1 | (74.0 | ) | 67.8 | 51.7 | ||||||||||||||||||||
| Net loss on divestiture |
— | 26.0 | 26.3 | — | — | — | — | |||||||||||||||||||||
| Impairment of equity investment |
— | 14.3 | 14.3 | — | — | — | — | |||||||||||||||||||||
| Restructuring |
— | 0.4 | 0.4 | 6.3 | — | — | — | |||||||||||||||||||||
|
|
|
|
|
|
|
|
|
|
|
|
|
|
|
|||||||||||||||
| Adjusted EBITDA |
$ | 223.2 | $ | 204.4 | $ | 421.8 | $ | 369.2 | $ | 342.3 | $ | 275.0 | $ | 251.6 | ||||||||||||||
|
|
|
|
|
|
|
|
|
|
|
|
|
|
|
|||||||||||||||
48
Table of Contents
UNAUDITED PRO FORMA CONDENSED COMBINED FINANCIAL STATEMENTS
The unaudited pro forma condensed combined financial statements consist of the unaudited pro forma condensed combined statements of operations for the six months ended March 31, 2016 and for the year ended September 30, 2015, and the unaudited pro forma condensed combined balance sheet as of March 31, 2016. The unaudited pro forma condensed combined financial statements have been derived by application of pro forma adjustments to our historical combined financial statements included elsewhere in this prospectus.
The unaudited pro forma condensed combined balance sheet reflects the separation as if it occurred on March 31, 2016, while the unaudited pro forma condensed combined statements of operations give effect to the separation as if it occurred on October 1, 2014, the beginning of the earliest period presented. The pro forma adjustments, described in the related notes, are based on currently available information and certain assumptions that management believes are reasonable. Excluded from the pro forma adjustments are items that are non-recurring in nature or are not material.
The unaudited pro forma condensed combined financial statements are provided for illustrative purposes only and are not necessarily indicative of the operating results or financial position that would have occurred had the separation from Ashland been completed on March 31, 2016 for the unaudited pro forma condensed combined balance sheet or on October 1, 2014 for the unaudited pro forma condensed combined statements of operations. The unaudited pro forma condensed combined financial statements should not be relied on as indicative of the historical operating results that we would have achieved or any future operating results or financial position that we will achieve after the completion of this offering.
In addition, the preparation of financial statements in conformity with U.S. GAAP requires management to make estimates and assumptions. These estimates and assumptions affect the reported amounts of assets and liabilities and disclosure of contingent assets and liabilities at the date of the financial statements and the reported amounts of revenues and expenses during the reporting period. These estimates and assumptions are preliminary and have been made solely for purposes of developing these unaudited pro forma condensed combined financial statements. Actual results could differ, perhaps materially, from these estimates and assumptions.
The unaudited pro forma condensed combined financial statements reflect the impact of certain transactions, which comprise the following:
| • | the recapitalization, the contribution and the separation; |
| • | the receipt of approximately $ in net proceeds from the sale of shares of our common stock in this offering at an assumed initial offering price of $ per share, the midpoint of the price range set forth on the cover page of this prospectus, after deducting the underwriting discount and commissions and estimated offering expenses payable by us, and the use of approximately $ of these proceeds to repay indebtedness; |
| • | the indebtedness to be incurred in the related financing transactions; and |
| • | other adjustments described in the notes to the unaudited pro forma condensed combined financial statements. |
We have operated as a business segment of Ashland since 1950. As a result, Ashland provides certain corporate services to us, and costs associated with these functions have been allocated to us. These allocations include costs related to corporate services, such as executive management, supply chain, information technology, legal, finance and accounting, investor relations, human resources, risk management, tax, treasury, and other services, as well as stock-based compensation expense attributable to our employees and an allocation of stock-based compensation attributable to employees of Ashland. The costs of such services have been allocated to us based on the most relevant allocation method to the service provided, primarily based on relative percentage of total sales, relative percentage of headcount, or specific identification. The total amount of these allocations from
49
Table of Contents
Ashland was approximately $41.1 million in the six months ended March 31, 2016 and approximately $79.5 million in the year ended September 30, 2015. These cost allocations are primarily reflected within corporate expense allocation in the combined statements of operations and comprehensive income. Management believes the basis on which the expenses have been allocated to be a reasonable reflection of the utilization of services provided to or the benefit received by us during the periods presented. Following the completion of this offering, we expect Ashland to continue to provide some services related to these functions on a transitional basis for a fee. These services will be provided under the transitional services agreement described in “Certain Relationships and Related Party Transactions—Relationship with Ashland.” Upon completion of this offering, we will assume responsibility for all our standalone public company costs, including the costs of corporate services currently provided by Ashland.
The following unaudited pro forma condensed combined financial statements and the related notes should be read in conjunction with “Use of Proceeds,” “Capitalization,” “Management’s Discussion and Analysis of Financial Condition and Results of Operations,” and the interim and annual combined financial statements and the related notes included elsewhere in this prospectus.
50
Table of Contents
Valvoline
Unaudited Pro Forma Condensed Combined Statement of Operations
Six Months Ended March 31, 2016
(In millions except per share data)
| Valvoline Historical |
Adjustments | Valvoline Pro Forma |
||||||||||
| Sales |
$ | 935.7 | $ | $ | ||||||||
| Cost of sales |
567.9 | (A) | ||||||||||
|
|
|
|
|
|
|
|||||||
| Gross profit |
367.8 | |||||||||||
| Selling, general and administrative expenses |
137.4 | (A) | ||||||||||
| (B) | ||||||||||||
| (C) | ||||||||||||
| Corporate expense allocation |
41.1 | (A) | ||||||||||
| Equity and other income |
10.7 | |||||||||||
|
|
|
|
|
|
|
|||||||
| Operating income |
200.0 | |||||||||||
| Net interest and other financing expense |
— | (D) | ||||||||||
| Net loss on acquisition |
(0.5 | ) | ||||||||||
|
|
|
|
|
|
|
|||||||
| Income before income taxes |
199.5 | |||||||||||
| Income tax expense |
66.5 | (E) | ||||||||||
|
|
|
|
|
|
|
|||||||
| Net income |
$ | 133.0 | $ | $ | ||||||||
|
|
|
|
|
|
|
|||||||
| Earnings per Share, Basic and Diluted |
||||||||||||
| Basic |
N/A | $ | (F) | |||||||||
| Diluted |
N/A | $ | (F) | |||||||||
| Weighted Average Shares Outstanding |
||||||||||||
| Basic |
N/A | (F) | ||||||||||
| Diluted |
N/A | (F) | ||||||||||
See notes to unaudited pro forma condensed combined financial statements.
51
Table of Contents
Valvoline
Unaudited Pro Forma Condensed Combined Statement of Operations
Year Ended September 30, 2015
(In millions except per share data)
| Valvoline Historical |
Adjustments | Valvoline Pro Forma |
||||||||||
| Sales |
$ | 1,966.9 | $ | $ | ||||||||
| Cost of sales |
1,281.8 | (A) | ||||||||||
|
|
|
|
|
|
|
|||||||
| Gross profit |
685.1 | |||||||||||
| Selling, general and administrative expenses |
290.8 | (A) | ||||||||||
| (B) | ||||||||||||
| (C) | ||||||||||||
| Corporate expense allocation |
79.5 | (A) | ||||||||||
| Equity and other income |
8.3 | |||||||||||
|
|
|
|
|
|
|
|||||||
| Operating income |
323.1 | |||||||||||
| Net interest and other financing expense |
— | (D) | ||||||||||
| Net loss on divestitures |
(26.3 | ) | ||||||||||
|
|
|
|
|
|
|
|||||||
| Income before income taxes |
296.8 | |||||||||||
| Income tax expense |
100.7 | (E) | ||||||||||
|
|
|
|
|
|
|
|||||||
| Net income |
$ | 196.1 | $ | $ | ||||||||
|
|
|
|
|
|
|
|||||||
| Earnings per Share, Basic and Diluted |
||||||||||||
| Basic |
N/A | $ | (F) | |||||||||
| Diluted |
N/A | $ | (F) | |||||||||
| Weighted Average Shares Outstanding |
||||||||||||
| Basic |
N/A | (F) | ||||||||||
| Diluted |
N/A | (F) | ||||||||||
See notes to unaudited pro forma condensed combined financial statements.
52
Table of Contents
Valvoline
Unaudited Pro Forma Condensed Combined Balance Sheet
As of March 31, 2016
(In millions)
| Valvoline Historical |
Adjustments | Valvoline Pro Forma |
||||||||||
| Assets |
||||||||||||
| Current assets |
||||||||||||
| Cash and cash equivalents |
$ | — | $ | (G) | $ | |||||||
| Accounts receivable |
350.4 | (I) | ||||||||||
| Inventories |
142.8 | |||||||||||
| Other assets |
21.2 | |||||||||||
|
|
|
|
|
|
|
|||||||
| Total current assets |
514.4 | |||||||||||
| Noncurrent assets |
||||||||||||
| Property, plant and equipment, net |
266.5 | (I) | ||||||||||
| Goodwill |
253.0 | |||||||||||
| Intangibles |
3.5 | |||||||||||
| Equity method investments |
28.2 | |||||||||||
| Other assets |
51.8 | (E) | ||||||||||
| (H) | ||||||||||||
| (I) | ||||||||||||
|
|
|
|
|
|
|
|||||||
| Total noncurrent assets |
603.0 | |||||||||||
|
|
|
|
|
|
|
|||||||
| Total assets |
$ | 1,117.4 | $ | $ | ||||||||
|
|
|
|
|
|
|
|||||||
| Liabilities and stockholders’ equity |
||||||||||||
| Current liabilities |
||||||||||||
| Short-term debt |
$ | — | $ | (H) | $ | |||||||
| Current portion of long-term debt |
— | (H) | ||||||||||
| Trade and other payables |
168.0 | (I) | ||||||||||
| Accrued expenses and other liabilities |
132.6 | (B) | ||||||||||
| (I) | ||||||||||||
|
|
|
|
|
|
|
|||||||
| Total current liabilities |
300.6 | |||||||||||
| Noncurrent liabilities |
||||||||||||
| Long-term debt (less current portion) |
— | (H) | ||||||||||
| Employee benefit obligations |
12.1 | (B) | ||||||||||
| Deferred income taxes |
23.8 | (E) | ||||||||||
| Other liabilities |
41.3 | (I) | ||||||||||
|
|
|
|
|
|
|
|||||||
| Total noncurrent liabilities |
77.2 | |||||||||||
| Stockholders’ equity: |
||||||||||||
| Common stock |
— | |||||||||||
| Additional paid-in capital |
— | (J) | ||||||||||
| Invested equity attributable to Ashland Inc. |
795.5 | (J) | ||||||||||
| Accumulated other comprehensive income (loss) |
(55.9 | ) | (B) | |||||||||
|
|
|
|
|
|
|
|||||||
| Total stockholders’ equity |
739.6 | |||||||||||
|
|
|
|
|
|
|
|||||||
| Total liabilities and stockholders’ equity |
$ | 1,117.4 | $ | $ | ||||||||
|
|
|
|
|
|
|
|||||||
See notes to unaudited pro forma condensed combined financial statements.
53
Table of Contents
Notes to Unaudited Pro Forma Condensed Combined Financial Statements
(A) Costs from allocated pension and other postretirement plans
Adjustment represents the elimination of expenses associated with allocated pension and other postretirement plans included within our historical figures. For the year ended September 30, 2015, the reduction in expense totaled $ million, comprised of $ million within cost of sales, $ million within selling, general and administrative expenses and $ million within corporate expense allocation. The adjustment for the six months ended March 31, 2016 represents a reduction in expense totaling $ million, comprised of $ million within cost of sales, $ million within selling, general and administrative expenses and $ million within corporate expense allocation. As explained in Note B below, certain pension and other postretirement plans will be transferred to us. The costs associated with these plans are included as an adjustment to the pro forma condensed combined financial statements through Note B.
(B) Pension and other postretirement plans transferred to Valvoline
Reflects the addition of net pension and other postretirement plan liabilities that will be transferred to us by Ashland as part of the separation. Plans transferred to us by Ashland include a substantial portion of Ashland’s largest U.S. qualified pension plan and non-qualified U.S. pension plans.
This adjustment includes a $ million adjustment to accrued expense and other liabilities, a $ million adjustment to employee benefit obligations, a $ million adjustment, net of tax of $ million, to accumulated other comprehensive income and $ million of related deferred tax assets as of March 31, 2016. These benefit plan obligations are excluded from our historical combined balance sheet, which has been presented using the multiemployer approach as further described in the Notes to Combined Financial Statements.
The expense adjustment related to these plans was $ million for the year ended September 30, 2015 and $ million for the six months ended March 31, 2016 and reflects interest cost, expected return on plan assets, amortization of prior service credit and remeasurement gains and losses, including actuarial gains and losses. Additionally, these costs have been reclassified solely into selling, general and administrative expenses as a result of the freezing or elimination of benefits for the majority of the U.S. pension plans and certain U.S. postretirement plans announced by Ashland during March 2016. These announced plan changes resulted in a curtailment gain of $ million included within the adjustment for the year ended September 30, 2015.
(C) Executive performance incentive and retention program
Certain executives were granted performance-based restricted shares of Ashland in October 2015 in order to provide an incentive to remain employed with us in the period after the separation. The expense associated with these awards is not recognized until the spin-off occurs and will be recognized ratably over the vesting period, which is generally three years. The unaudited pro forma condensed combined statement of operations reflects the assumption that the spin-off occurred on October 1, 2014 and that the median amount of potential shares to be awarded will be earned and expensed over the service period. Therefore our estimate of the fair value of the awards resulted in expense of $ million and $ million for the year ended September 30, 2015 and the six months ended March 31, 2016, respectively.
(D) Interest expense
The unaudited pro forma condensed combined statements of operations reflect an adjustment for the expected interest expense and the amortization of deferred financing costs on our new indebtedness described in Note H below. Pro forma interest expense (i) reflects an adjustment of $ million in annual interest expense based on an estimated weighted average annual interest rate of % on indebtedness to be incurred in conjunction with the separation, and (ii) reflects annual amortization expense on the approximately $ million of deferred debt
54
Table of Contents
issuance costs associated with our new indebtedness, utilizing a weighted average maturity of years. A % increase or decrease in the weighted average annual interest rate would increase or decrease pro forma interest expense by $ million annually.
The following table reflects the adjustments in the unaudited pro forma condensed combined statements of operations to reflect the impact of the adjustments to interest expense.
| Year ended September 30, 2015 |
Six months ended March 31, 2016 |
|||||||
| Interest expense |
$ | $ | ||||||
| Amortization of deferred debt issuance costs |
||||||||
|
|
|
|
|
|||||
| Pro forma adjustment to interest expense |
$ | $ | ||||||
|
|
|
|
|
|||||
(E) Resulting tax effects
Reflects the tax effects of the pro forma adjustments at the applicable tax rates within the respective jurisdictions. The applicable tax rates could be different (either higher or lower) depending on activities subsequent to the separation.
(F) Pro forma earnings per share / weighted-average shares outstanding
The weighted-average number of shares used to compute pro forma basic earnings per share for the six months ended March 31, 2016 and the year ended September 30, 2015 is , which represents the number of shares we expect to be outstanding after giving effect to this offering.
The weighted-average number of shares used to compute pro forma diluted earnings per share for the year ended September 30, 2015 and the six months ended March 31, 2016 is , which represents the number of shares we expect to be outstanding after giving effect to this offering, adjusted for the dilutive impact of shares granted for the Executive Performance Incentive and Retention Program discussed in Note C and for estimated Ashland stock-based compensation awards that will be converted into Valvoline stock-based compensation awards in connection with the spin-off.
(G) Cash and cash equivalents
Represents $ million of cash that we will receive as a result of . Historically, cash and cash equivalents were held at the Ashland level utilizing Ashland’s centralized approach to cash management.
(H) New debt financing
The unaudited pro forma condensed combined balance sheet reflects the incurrence of the following events as if they occurred on March 31, 2016:
| • | the incurrence of new senior term loans (which may be secured or unsecured), new senior unsecured notes or a combination thereof in an aggregate principal amount of approximately $ million (the proceeds of which will be transferred to Ashland through intercompany transfers); and |
| • | the application of $ million of net proceeds of this offering to repay indebtedness incurred prior to the completion of this offering. |
The adjustment to long-term debt also reflects the capitalization of approximately $ million of new deferred debt issuance costs that we will incur in connection with the related financing transactions. These costs will be deferred and recognized over the terms of the respective debt agreements. The figures reflected in these adjustments are estimates and subject to change as the agreements are executed.
55
Table of Contents
(I) Legacy assets and liabilities
Represents certain Ashland legacy assets and liabilities that are expected to be transferred to us as a result of the separation. This adjustment includes a $ million adjustment to current assets, a $ million adjustment to other noncurrent assets, a $ million adjustment to current liabilities, and a $ million adjustment to other noncurrent liabilities as of March 31, 2016. No adjustments were made to the statements of operations as the effect on the periods presented was immaterial.
(J) Offering adjustments
Represents the receipt of approximately $ million by us associated with the sale of shares of common stock in this offering at the initial public offering price of $ per share (the midpoint of the price range set forth on the cover page of this prospectus). This represents the net proceeds of $ million, after deducting the underwriters’ discount and offering fees. In addition, it includes the reclassification of Ashland’s net investment in us, which was reclassified into additional paid-in capital and the required balancing entry to reflect the par value of our outstanding common stock. The issuance of common stock was at a par value of $0.01 per share.
The following reflects the adjustments in our unaudited pro forma condensed combined balance sheet to reflect the impact of the above transactions on cash and cash equivalents, Ashland’s net investment, common stock and additional paid-in capital:
| As of March 31, 2016 | ||||||||||||||||
| Proceeds from initial public offering/ Use of proceeds |
Capital contribution |
Conversion of Ashland’s net investment to additional paid-in capital |
Total use of proceeds |
|||||||||||||
| Cash and cash equivalents |
$ | $ | $ | $ | ||||||||||||
| Common stock |
||||||||||||||||
| Additional paid-in capital |
||||||||||||||||
| Invested equity attributable to Ashland Inc. |
||||||||||||||||
| Accumulated other comprehensive income (loss) |
||||||||||||||||
56
Table of Contents
MANAGEMENT’S DISCUSSION AND ANALYSIS OF FINANCIAL CONDITION AND RESULTS OF OPERATIONS
The following discussion and analysis should be read in conjunction with our audited and unaudited combined financial statements and the related notes, and our unaudited pro forma condensed combined financial statements and the related notes, included elsewhere in this prospectus.
This discussion and analysis contains forward-looking statements that are subject to risks and uncertainties. See “Cautionary Statement Regarding Forward-Looking Statements” for a discussion of the uncertainties, risks, and assumptions associated with those statements. Actual results could differ materially from those discussed in or implied by forward-looking statements as a result of various factors, including those discussed below and elsewhere in this prospectus, particularly in the section entitled “Risk Factors.”
Our fiscal year ends on September 30 of each year. We refer to the year ended September 30, 2016 as “fiscal 2016,” the year ended September 30, 2015 as “fiscal 2015,” the year ended September 30, 2014 as “fiscal 2014” and the year ended September 30, 2013 as “fiscal 2013.”
BUSINESS OVERVIEW
We are one of the most recognized and respected premium consumer brands in the global automotive lubricant industry, known for our high quality products and superior levels of service. Established in 1866, our heritage spans 150 years, during which we have developed powerful name recognition across multiple product and service channels. We have significant positions in the United States in all of the key lubricant sales channels, and also have a strong international presence with our products sold in approximately 140 countries.
In the United States and Canada, our products are sold to consumers through over 30,000 retail outlets, to installer customers with over 12,000 locations, and to approximately 1,050 Valvoline branded franchised and company-owned stores. We serve our customer base through an extensive sales force and technical support organization, allowing us to leverage our technology portfolio and customer relationships globally, while meeting customer demands locally. This combination of scale and strong local presence is critical to our success.
We have a history of leading innovation with revolutionary products such as All Climate™, DuraBlend™, and MaxLife™. In addition to our iconic Valvoline-branded passenger car motor oils and other automotive lubricant products, we provide a wide array of lubricants used in heavy duty equipment, as well as automotive chemicals and fluids designed to improve engine performance and lifespan. Our premium branded product offerings enhance our high quality reputation and provide our customers with solutions that address a wide variety of needs.
Reportable Segments
Our reporting structure is principally composed of three reportable segments: Core North America, Quick Lubes and International. We also have an Unallocated and other segment.
Core North America
Our Core North America business segment sells Valvoline™ and other branded products in the United States and Canada to both consumers who perform their own automotive maintenance, referred to as “Do-It-Yourself” or “DIY” consumers, as well as to installer customers who use our products to service vehicles owned by “Do-It-For-Me” or “DIFM” consumers. We sell to DIY consumers through over 30,000 retail outlets, such as AutoZone, Advance Auto Parts and O’Reilly Auto Parts, as well as leading mass merchandisers and independent auto parts stores. We sell to DIFM consumers through installers who collectively operate over 12,000 locations in the United States and Canada. Installer customers include car dealers, general repair shops and third-party quick lube chains. We directly serve these customers with our own sales force and fulfillment capabilities, through retailers such as NAPA, and a network of approximately 140 distributors. Our key installer customers include large national accounts such as Goodyear, Monro, Express Oil Change, TBC Retail Group and Sears. Our installer channel team also sells branded products and solutions
57
Table of Contents
to heavy duty customers such as on-highway fleets and construction companies, and we have a strategic relationship with Cummins for co-branding products in the heavy duty business.
Quick Lubes
Our Quick Lubes business segment services the passenger car and light truck quick lube market through two platforms: our company-owned and franchised VIOC stores, which we believe comprise the industry’s best retail quick lube service chain; and Express Care, a quick lube customer platform developed for independent operators who purchase Valvoline motor oil and other products pursuant to contracts while displaying Valvoline branded signage. VIOC, which is the second-largest United States retail quick lube service chain by number of stores, provides fast, trusted service through approximately 720 franchised and 330 company-owned stores. Our VIOC stores provide a broad range of preventive maintenance services, including full-service oil changes, OEM mileage-based services (transmission, radiator and gear box fluid exchange services), tire rotations, fuel system services and seasonal air conditioning coolant replacement services. Our VIOC company-owned stores have had nine years of consecutive same-store sales growth,* and consistently outperformed our competitors, delivering on average over 36% more daily oil changes during 2015 than competing quick lube service centers. Our franchisees have also enjoyed strong results, performing on average 22% more daily oil changes in 2015 than competitors. We also sell our products and provide Valvoline branded signage to independent quick lube operators through our Express Care program. The Express Care platform has been designed to support smaller (typically single store) operators that do not fit our franchised model and typically offer other non-quick lube services such as auto repair and car washes. In 2015, we estimate that VIOC and Express Care stores performed approximately 13% of the total oil changes in the quick lube market.
International
Our International business segment sells Valvoline™ and our other branded products in approximately 140 countries. Our key international markets include China, India, Latin America, Australia Pacific and EMEA. We have significant overall market share in India and Australia and a growing presence in a number of markets, with primary growth targets being China, India and select countries within Latin America. Our International business segment sells products for both consumer and commercial vehicles and equipment, and is served by company-owned manufacturing facilities in the United States, Australia and the Netherlands, a joint venture-owned facility in India and third-party warehouses and toll manufacturers in other regions. Our heavy duty products are used in a wide variety of heavy duty equipment, including on-road trucks and buses, agricultural equipment, construction and mining equipment, and power generation equipment. We go to market in our International business in three ways: (1) through our own local sales, marketing and back office support teams, which we refer to as our “wholly owned affiliate markets”; (2) through joint ventures; and (3) through independent distributors. In our wholly owned affiliate markets, we have a direct presence and maintain the sales and marketing teams required to build effective channels. We have 50/50 joint ventures with Cummins in India and China. We also have smaller joint ventures in select countries in Latin America. In other countries, we go to market via independent distributors, which provide access to these geographies with limited capital investment.
Business Results
Sales by each reportable segment expressed as a percentage of total combined sales were as follows:
| For the six months ended March 31, |
For the year ended September 30, | |||||||||||||||||||
| Sales by Reportable Segment |
2016 | 2015 | 2015 | 2014 | 2013 | |||||||||||||||
| Core North America |
51 | % | 55 | % | 54 | % | 55 | % | 56 | % | ||||||||||
| Quick Lubes |
24 | % | 20 | % | 20 | % | 18 | % | 17 | % | ||||||||||
| International |
25 | % | 25 | % | 26 | % | 27 | % | 27 | % | ||||||||||
|
|
|
|
|
|
|
|
|
|
|
|||||||||||
| 100 | % | 100 | % | 100 | % | 100 | % | 100 | % | |||||||||||
|
|
|
|
|
|
|
|
|
|
|
|||||||||||
| * | We have historically determined same-store sales growth on a fiscal year basis, with new stores excluded from the metric until the completion of their first full fiscal year in operation. |
58
Table of Contents
Sales by geography expressed as a percentage of total combined sales were as follows:
| For the six months ended March 31, |
For the year ended September 30, | |||||||||||||||||||
| Sales by Geography |
2016 | 2015 | 2015 | 2014 | 2013 | |||||||||||||||
| North America (a) |
75 | % | 75 | % | 74 | % | 73 | % | 73 | % | ||||||||||
| Europe |
7 | % | 7 | % | 8 | % | 8 | % | 9 | % | ||||||||||
| Asia Pacific |
13 | % | 14 | % | 14 | % | 14 | % | 14 | % | ||||||||||
| Latin America & other |
5 | % | 4 | % | 4 | % | 5 | % | 4 | % | ||||||||||
|
|
|
|
|
|
|
|
|
|
|
|||||||||||
| 100 | % | 100 | % | 100 | % | 100 | % | 100 | % | |||||||||||
|
|
|
|
|
|
|
|
|
|
|
|||||||||||
| (a) | We only include the United States and Canada in our North American designation. |
Our Adjusted EBITDA increased 14% during 2015 compared to 2014 from $369.2 million to $421.8 million (see U.S. GAAP reconciliation under “—Combined Review—Operating Income—EBITDA and Adjusted EBITDA”). The increase in Adjusted EBITDA was primarily due to an increase in Adjusted EBITDA in our Core North America and Quick Lubes reportable segments, while the International reportable segment’s Adjusted EBITDA was consistent with the prior year primarily due to the negative impact of foreign currency exchange. Core North America’s Adjusted EBITDA increased $36.0 million, or 20%, compared to 2014, while Quick Lubes’ Adjusted EBITDA increased $16.0 million, or 17%, compared to 2014. These increases were primarily driven by increased volumes and lower raw material costs, specifically relating to the price of base oil, which increased gross profit.
Acquisitions and Divestitures
Oil Can Henry’s Acquisition
In February 2016, Ashland acquired OCH International, Inc. (“Oil Can Henry’s”), which was the 13th largest quick-lube network in the United States, servicing approximately 1 million vehicles annually with 89 quick lube stores, comprised of 47 company-owned stores and 42 franchise locations, in Oregon, Washington, California, Arizona, Idaho and Colorado.
The acquisition of Oil Can Henry’s within the Quick Lubes reportable segment was valued at $72.0 million, which included acquired indebtedness of $10.5 million, working capital payments of $0.6 million and cash received of $2.4 million, for a total all-cash purchase price of $63.3 million. The net cash outlay for this acquisition during the quarter ended March 31, 2016 was $60.4 million.
Car Care Products Divestiture
During 2015, Ashland entered into a definitive sale agreement to sell our car care products within the Core North America reportable segment for $24.0 million, which included Car Brite™ and Eagle One™ automotive appearance products. Prior to the sale, we recognized a loss of $26.3 million before tax in 2015 to recognize the assets at fair value less cost to sell. The loss is reported within the net loss on divestiture caption within the combined statements of operations and comprehensive income. The transaction closed on June 30, 2015 and we received net proceeds of $19.3 million after adjusting for certain customary closing costs and final working capital amounts.
Venezuela Equity Method Investment Divestiture
During 2015, we sold the equity method investment in Venezuela within the International reportable segment. Prior to the sale, we recognized a $14.3 million impairment in 2015, for which there was no tax effect, within the equity and other income caption of the combined statements of operations and comprehensive income.
59
Table of Contents
Our decision to sell the equity investment and the resulting impairment charge recorded during 2015 was a result of the continued devaluation of the Venezuelan currency (bolivar) based on changes to the Venezuelan currency exchange rate mechanisms during the fiscal year. In addition, the continued lack of exchangeability between the Venezuelan bolivar and U.S. dollar had restricted the equity method investee’s ability to pay dividends and obligations denominated in U.S. dollars. These exchange regulations and cash flow limitations, combined with other recent Venezuelan regulations and the impact of declining oil prices on the Venezuelan economy, had significantly restricted our ability to conduct normal business operations through the joint venture arrangement.
CERTAIN FACTORS AFFECTING OUR FINANCIAL CONDITION AND RESULTS OF OPERATIONS
The Industry
The global finished lubricants market is a $60 billion market with demand for over 11.7 billion gallons of lubricants in 2015. For the same period, demand for passenger car motor oil and motorcycle oil accounted for slightly over 24% of global lubricant demand, while the remaining 76% of demand was for commercial and industrial products. The United States has historically accounted for the largest amount of lubricant demand, followed by China and India. The lubricants market is impacted by the following key drivers and trends:
| • | Global lubricants market demand is shifting towards higher performance finished lubricants, largely driven by advancements in vehicle/equipment design and OEM requirements for improved efficiency, reduced carbon footprints and optimized fuel consumption. |
| • | There has been increasingly stringent regulation, particularly in North America and Europe aimed at reducing toxic emissions, which has led to a continuous drive for innovation given changing specifications for lubricants. |
| • | Between 2007 and 2012, the North American transport lubes market experienced average annual volume declines of 2.7% per annum, due in part to an increase in oil change intervals, which have resulted from changing OEM recommendations and advancements in engine technology. Over the past two years, market volume has increased, largely due to the increase in the number of cars on the road and miles driven. |
| • | A surge in the number of cars on the road has led to rapid expansion of passenger vehicle lubricant sales in developing regions. For example, the number of passenger cars on the road in China grew from 59 million in 2010 to 121 million in 2014, representing a compound annual growth rate of 21%. |
Business and Growth Strategies
The strength of our business model is our ability to generate profitable sales across multiple channels to market, leveraging the Valvoline brand through effective marketing, innovative product technology and the capabilities of our team. We have delivered strong profits and return on capital, with balanced results across all of our sales channels. Today, Valvoline is a high margin, high free cash flow generating business, with significant growth opportunities across all of our business segments. Our key business and growth strategies include:
| • | growing and strengthening our quick lube network through organic store expansion, opportunistic, high-quality acquisitions in both core and new markets within the VIOC system and strong sales efforts to partner with new Express Care operators, in addition to continued same-store sales growth and profitability within our existing stores as a result of attracting new customers and increasing customer satisfaction, customer loyalty and average ticket size; |
| • | accelerating international growth across key markets where demand for premium lubricants is growing, such as China, India and select countries in Latin America, by building strong distribution channels in underserved geographies, replacing less successful distributors and improving brand awareness among installer customers in those regions; and |
| • | leveraging innovation, both in terms of product development, packaging, marketing and the implementation of our new digital infrastructure, to strengthen our market share and profitability in Core North America. |
60
Table of Contents
Raw Material Supply and Prices
The key raw materials used by our business are base oils, additives, packaging materials (high density polyethylene bottles and steel drums) and ethylene glycol. We continuously monitor global supply and cost trends of these key raw materials. We obtain these raw materials from a diversified network of large global suppliers and regional providers. Our sourcing strategy is to ensure supply through contracting a diversified supply base while leveraging market conditions to take advantage of spot opportunities whenever such conditions are available. We leverage our worldwide spend to obtain favorable contract terms from the global suppliers and use the regional providers to ensure market competitiveness and reliability in our supply chain. For materials that must be customized for us, we work with market leaders with global footprints and well developed business continuity plans. We also utilize our research and development resources to develop alternative product formulations, which provide flexibility in the event of supply interruptions. We closely monitor our supply chain and conduct annual supply risk assessments of our critical suppliers to reduce risk.
The prices of many of our products fluctuate based on the price of base oil. Historically, base oil prices have been volatile, causing sharp cost increases during periods of short supply, which was the case in 2011. Since that time, base oil supply has increased dramatically, causing base oil prices to fall and we have reduced our selling prices for many of our products. We have negotiated base oil supply contracts with terms that have reduced the impact of changes in the base oil market on our financial results. Additionally, we have revised our contracts with many of our customers to shorten the timing of adjustments to our selling prices in response to changes in raw material prices.
Our Relationship with Ashland
We are currently a business unit of Ashland and our combined financial statements have been derived from the consolidated financial statements and accounting records of Ashland. Our historical expenses are not necessarily indicative of the expenses we may incur in the future as a standalone public company. Although we intend to enter into certain agreements with Ashland in connection with this offering and the separation, the amount and composition of our expenses may vary from historical levels since the fees charged for the services under the agreements may be higher or lower than the costs reflected in the historical allocations. In addition, we intend to replace these services over time with ones supplied either internally by our employees or by third parties, the cost of which may be higher or lower than the historical allocations. We are currently investing in expanding our own administrative functions, including finance, legal and compliance and human resources, as well as our information technology infrastructure, to replace services currently provided by Ashland. See “Certain Relationships and Related Party Transactions—Relationship with Ashland” and “Unaudited Pro Forma Condensed Combined Financial Statements.”
Ashland provides certain corporate services to us, and costs associated with these functions have been allocated to us. These allocations include costs related to corporate services, such as executive management, supply chain, information technology, legal, finance and accounting, investor relations, human resources, risk management, tax, treasury, and other services, as well as stock-based compensation expense attributable to our employees and an allocation of stock-based compensation attributable to employees of Ashland. The costs of such services have been allocated to us based on the most relevant allocation method to the service provided, primarily based on relative percentage of total sales, relative percentage of headcount or specific identification. The total amount of these allocations from Ashland was approximately $41.1 million in the six months ended March 31, 2016 and approximately $79.5 million in the year ended September 30, 2015. These cost allocations are primarily reflected within corporate expense allocation in the combined statements of operations and comprehensive income. Management believes the basis on which the expenses have been allocated to be a reasonable reflection of the utilization of services provided to or the benefit received by us during the periods presented. Following the completion of this offering, we expect Ashland to continue to provide some services related to these functions on a transitional basis for a fee. These services will be provided under the transitional services agreement described in “Certain Relationships and Related Party Transactions—Relationship with Ashland.” Upon completion of this offering, we will assume responsibility for all our standalone public company costs, including the costs of corporate services currently provided by Ashland.
61
Table of Contents
Compensation
We expect to institute competitive compensation policies and programs as a standalone public company, the expense for which may differ from the compensation expense allocated by Ashland in our combined financial statements.
Pension and Other Post Retirement Plan Liabilities
We expect that approximately $ million in net unfunded pension and other postretirement plan liabilities will be transferred to us by Ashland as part of the separation. As announced by Ashland in March 2016, these plans are frozen to new participants and, effective September 2016, the accrual of pension benefits for participants will be frozen. Certain postretirement benefits were also eliminated or curtailed. Plans transferred to us by Ashland will include a substantial portion of the largest U.S. qualified pension plan and non-qualified U.S. pension plans.
Similar to our current standalone defined benefit pension plans, we will recognize the change in the fair value of plan assets and net actuarial gains and losses for the pension and other postretirement plan liabilities transferred to us by Ashland annually in the fourth quarter of each fiscal year and whenever a plan is determined to qualify for a remeasurement within the combined statement of operations and comprehensive income. The remaining components of pension and other postretirement benefits expense will be recorded ratably on a quarterly basis. Our policy to recognize these changes annually through mark to market accounting could result in volatility in our results of operations, which could be material.
Public Company Expenses
As a result of this offering, we will become subject to the reporting requirements of the Exchange Act and Sarbanes-Oxley. We will have to establish additional procedures and practices as a standalone public company. As a result, we will incur additional costs as a standalone public company, including internal audit, investor relations, director and officer insurance, stock administration and regulatory compliance costs.
Seasonality
Overall, there is little seasonality in our business. Our Quick Lubes business and, to a lesser extent, our Core North America business tend to experience slightly higher sales volume in the summer months due to summer vacations and increased driving, as well as during the periods of time leading into holidays. Both businesses also tend to slow a little from October to February due to inclement weather in parts of the United States and Canada. Our International business experiences almost no seasonality due to its geographic diversity and the high percentage of its business in the commercial and industrial lubricants market, which is less influenced by weather.
RESULTS OF OPERATIONS – COMBINED REVIEW
Non-GAAP Performance Metrics
In addition to our net income determined in accordance with U.S. GAAP, we evaluate operating performance using certain non-GAAP measures including EBITDA, which we define as our net income, plus income tax expense (benefit), net interest and other financing expenses, and depreciation and amortization, Adjusted EBITDA, which we define as EBITDA adjusted for losses (gains) on pension and other postretirement plans remeasurement, net gain (loss) on acquisitions and divestitures, impairment of equity investment, restructuring, other income and (expense) and other items, which may include pro forma impact of significant acquisitions or divestitures and restructuring costs, as applicable, and Adjusted EBITDA margin, which we define as Adjusted EBITDA as a percentage of sales. These measures are not prepared in accordance with U.S. GAAP and as related to pro forma adjustments, contain our best estimates of cost allocations and shared resource
62
Table of Contents
costs. Management believes the use of non-GAAP measures on a combined and reportable segment basis assists investors in understanding the ongoing operating performance of our business by presenting comparable financial results between periods. The non-GAAP information provided is used by our management and may not be comparable to similar measures disclosed by other companies, because of differing methods used by other companies in calculating EBITDA and Adjusted EBITDA. EBITDA and Adjusted EBITDA provide a supplemental presentation of our operating performance on a combined and reportable segment basis. Adjusted EBITDA generally includes adjustments for unusual, non-operational or restructuring-related activities.
The combined financial statements include actuarial gains and losses for defined benefit pension and other postretirement benefit plans recognized annually in the fourth quarter of each fiscal year and whenever a plan is determined to qualify for a remeasurement during a fiscal year. Actuarial gains and losses occur when actual experience differs from the estimates used to allocate the change in value of pension and other postretirement benefit plans to expense throughout the year or when assumptions change, as they may each year. Significant factors that can contribute to the recognition of actuarial gains and losses include changes in discount rates used to remeasure pension and other postretirement obligations on an annual basis or upon a qualifying remeasurement, differences between actual and expected returns on plan assets and other changes in actuarial assumptions, for example the life expectancy of plan participants. Management believes Adjusted EBITDA, which includes the expected return on pension plan assets and excludes both the actual return on pension plan assets and the impact of actuarial gains and losses, provides investors with a meaningful supplemental presentation of our operating performance. Management believes these actuarial gains and losses are primarily financing activities that are more reflective of changes in current conditions in global financial markets (and in particular interest rates) that are not directly related to the underlying business and that do not have an immediate, corresponding impact on the compensation and benefits provided to eligible employees and retirees.
We use free cash flow as an additional non-GAAP metric of cash flow generation. By deducting capital expenditures and certain other adjustments as applicable from operating cash flows, we are able to provide a better indication of the ongoing cash being generated that is ultimately available for both debt and equity holders as well as other investment opportunities. Free cash flow does not reflect adjustments for certain non-discretionary cash flows. Our results of operations are presented based on our management structure and internal accounting practices. The structure and practices are specific to us; therefore, our financial results are not necessarily comparable with similar information for other comparable companies.
EBITDA, Adjusted EBITDA and free cash flow each have limitations as an analytical tool and should not be considered in isolation from, or as an alternative to, or more meaningful than, net income and cash flows provided from operating activities as determined in accordance with U.S. GAAP. Because of these limitations, you should rely primarily on net income and cash flows provided from operating activities as determined in accordance with U.S. GAAP and use EBITDA, Adjusted EBITDA and free cash flow only as supplements. In evaluating EBITDA, Adjusted EBITDA and free cash flow, you should be aware that in the future we may incur expenses similar to those for which adjustments are made in calculating EBITDA, Adjusted EBITDA and free cash flow. Our presentation of EBITDA, Adjusted EBITDA and free cash flow should not be construed as a basis to infer that our future results will be unaffected by unusual or non-recurring items.
Combined Review
Net income
Our net income is primarily affected by results within operating income, income taxes and other significant events or transactions that are unusual or nonrecurring. Operating income includes our adjustment for the immediate recognition of the change in the fair value of the plan assets and net actuarial gains and losses for defined benefit pension plans and other postretirement benefit plans each fiscal year.
63
Table of Contents
Six months ended March 31, 2016 compared to six months ended March 31, 2015
Key financial results during the six months ended March 31, 2016 and 2015 included the following:
| • | our net income amounted to $133.0 million and $90.5 million during the six months ended March 31, 2016 and 2015, respectively; |
| • | the effective income tax rates of 33% and 37% for the six months ended March 31, 2016 and 2015, respectively, are generally in line with the U.S. statutory rate; and |
| • | operating income was $200.0 million and $168.9 million during the six months ended March 31, 2016 and 2015, respectively. |
Fiscal years ended September 30, 2015, 2014 and 2013
Key financial results for 2015, 2014 and 2013 included the following:
| • | our net income amounted to $196.1 million in 2015, $173.4 million in 2014 and $246.1 million in 2013; |
| • | the effective income tax rate of 34% for each of 2015 and 2014 and 35% for 2013 are generally in line with the U.S. statutory rate; and |
| • | operating income was $323.1 million, $264.7 million and $380.6 million during 2015, 2014 and 2013, respectively. |
For further information on the items reported above, see the discussion in the comparative “Combined Statements of Operations and Comprehensive Income – Caption Review.”
Operating income
Six months ended March 31, 2016 compared to six months ended March 31, 2015
Operating income was $200.0 million and $168.9 million during the six months ended March 31, 2016 and 2015, respectively. The current and prior periods’ operating income include certain key items that are excluded to arrive at Adjusted EBITDA. These key items are summarized as follows:
| • | expense of $4.7 million and $2.0 million during the six months ended March 31, 2016 and 2015, respectively, from the allocated pension and other postretirement plans remeasurement adjustments; and |
| • | restructuring costs include allocated expense of $0.4 million during the six months ended March 31, 2015. |
Operating income during the six months ended March 31, 2016 and 2015 included depreciation and amortization of $19.0 million and $18.8 million, respectively. EBITDA totaled $218.5 million and $161.7 million, respectively, during each period.
Fiscal years ended September 30, 2015, 2014 and 2013
Operating income amounted to $323.1 million, $264.7 million and $380.6 million in 2015, 2014 and 2013, respectively. The current and prior years’ operating income include certain key items that are excluded to arrive at Adjusted EBITDA. These key items are summarized as follows:
| • | expense of $46.0 million and $61.1 million in 2015 and 2014, respectively, and income of $74.0 million in 2013 from the allocated pension and other postretirement plans remeasurement adjustments; |
| • | restructuring costs include allocated expense of $0.4 million in 2015 and $6.3 million in 2014; and |
| • | $14.3 million impairment related to the joint venture equity investment within Venezuela during 2015. |
64
Table of Contents
Operating income for 2015, 2014 and 2013 included depreciation and amortization of $38.0 million, $37.1 million and $35.7 million, respectively. EBITDA totaled $334.8 million, $301.8 million and $416.3 million for 2015, 2014 and 2013, respectively.
EBITDA and Adjusted EBITDA
EBITDA and Adjusted EBITDA results in the following table have been prepared to illustrate the ongoing effects of our operations, which exclude certain key items since management believes the use of such non-GAAP measures on a combined and reportable segment basis assists investors in understanding the ongoing operating performance by presenting the financial results between periods on a more comparable basis.
| For the six months ended March 31, |
For the year ended September 30, |
|||||||||||||||||||
| (In millions) |
2016 | 2015 | 2015 | 2014 | 2013 | |||||||||||||||
| Net income |
$ | 133.0 | $ | 90.5 | $ | 196.1 | $ | 173.4 | $ | 246.1 | ||||||||||
| Income tax expense |
66.5 | 52.4 | 100.7 | 91.3 | 134.5 | |||||||||||||||
| Depreciation and amortization |
19.0 | 18.8 | 38.0 | 37.1 | 35.7 | |||||||||||||||
|
|
|
|
|
|
|
|
|
|
|
|||||||||||
| EBITDA |
218.5 | 161.7 | 334.8 | 301.8 | 416.3 | |||||||||||||||
| Losses (gains) on pension and other postretirement plans remeasurement |
4.7 | 2.0 | 46.0 | 61.1 | (74.0 | ) | ||||||||||||||
| Net loss on divestiture |
— | 26.0 | 26.3 | — | — | |||||||||||||||
| Impairment of equity investment |
— | 14.3 | 14.3 | — | — | |||||||||||||||
| Restructuring |
— | 0.4 | 0.4 | 6.3 | — | |||||||||||||||
|
|
|
|
|
|
|
|
|
|
|
|||||||||||
| Adjusted EBITDA |
$ | 223.2 | $ | 204.4 | $ | 421.8 | $ | 369.2 | $ | 342.3 | ||||||||||
|
|
|
|
|
|
|
|
|
|
|
|||||||||||
COMBINED STATEMENTS OF OPERATIONS AND COMPREHENSIVE INCOME – CAPTION REVIEW
Six months ended March 31, 2016 compared to six months ended March 31, 2015
A comparative analysis of our combined statements of operations and comprehensive income by caption is provided as follows for the six months ended March 31, 2016 and 2015.
| Six months ended March 31 | ||||||||||||
| (In millions) |
2016 | 2015 | Change | |||||||||
| Sales |
$ | 935.7 | $ | 973.4 | $ | (37.7 | ) | |||||
The following table provides a reconciliation of the change in sales between the six months ended March 31, 2016 and 2015.
| (In millions) |
Six months ended March 31, 2016 |
|||
| Pricing |
$ | (53.2 | ) | |
| Volume |
45.8 | |||
| Product mix |
17.0 | |||
| Currency exchange |
(26.3 | ) | ||
| Divestiture and acquisition |
(21.0 | ) | ||
|
|
|
|||
| Change in sales |
$ | (37.7 | ) | |
|
|
|
|||
Sales decreased $37.7 million, or 4%, to $935.7 million during the current period. Lower product pricing and unfavorable foreign currency exchange decreased sales by $53.2 million, or 5%, and $26.3 million, or 3%,
65
Table of Contents
respectively. Unfavorable foreign currency exchange was due to the U.S. dollar strengthening compared to various foreign currencies, primarily the Euro and Australian dollar. Higher volume levels and changes in product mix increased sales by $45.8 million, or 5%, and $17.0 million, or 2%, respectively. During the current period, lubricant gallons sold increased 6% to 84.2 million. The divestiture of car care products within the Core North America reportable segment, during fiscal 2015, decreased sales by $28.5 million, while the acquisition of Oil Can Henry’s within the Quick Lubes reportable segment, during fiscal 2016, increased sales by $7.5 million compared to the prior year period.
| Six months ended March 31 | ||||||||||||
| (In millions) |
2016 | 2015 | Change | |||||||||
| Cost of sales |
$ | 567.9 | $ | 634.9 | $ | (67.0 | ) | |||||
| Gross profit as a percent of sales |
39.3 | % | 34.8 | % | ||||||||
The following table provides a reconciliation of the changes in cost of sales between the six months ended March 31, 2016 and 2015.
| (In millions) |
Six months ended March 31, 2016 |
|||
| Product cost |
$ | (65.9 | ) | |
| Volume and product mix |
37.2 | |||
| Currency exchange |
(19.5 | ) | ||
| Divestiture and acquisition |
(18.6 | ) | ||
| Pension and other postretirement benefit plans expense (income) (including remeasurements) |
(0.2 | ) | ||
|
|
|
|||
| Change in cost of sales |
$ | (67.0 | ) | |
|
|
|
|||
Cost of sales decreased $67.0 million during the current period. Lower raw material costs decreased cost of sales by $65.9 million. Increases in volumes and changes in product mix combined to increase cost of sales by $37.2 million while favorable foreign currency exchange decreased cost of sales by $19.5 million. The divestiture of car care products, during fiscal 2015, decreased cost of sales by $24.6 million, while the acquisition of Oil Can Henry’s, during fiscal 2016, increased cost of sales by $6.0 million. Pension and other postretirement benefit plans income of $0.2 million includes remeasurement losses of $1.9 million and $1.2 million in the current and prior year period, respectively. This increase of $0.7 million in the remeasurement losses was more than offset by the increase in recurring pension and other postretirement income compared to the prior year period.
| Six months ended March 31 | ||||||||||||
| (In millions) |
2016 | 2015 | Change | |||||||||
| Selling, general and administrative expense |
$ | 137.4 | $ | 128.4 | $ | 9.0 | ||||||
| As a percent of sales |
14.7 | % | 13.2 | % | ||||||||
Selling, general and administrative expense increased $9.0 million, or 7%, during the current period as compared to the prior year period. Key drivers of this increase were:
| • | increased advertising and promotional costs of $4.7 million during the current period; |
| • | increased consulting and legal costs of $1.5 million during the current period, primarily related to digital infrastructure upgrades; |
| • | employee cost increase of $1.7 million during the current period; |
| • | increased bad debt expense of $1.0 million during the current period; and |
66
Table of Contents
| • | decreased pension and other postretirement plan income of $0.8 million compared to the prior year period, with $2.0 million of the decrease attributable to the increased remeasurement losses allocated to us during the current period of $2.8 million compared to $0.8 million in the prior year period. The remaining decrease is due to recurring pension and other postretirement income as the portion allocated to cost of sales increased during the current period compared to the prior year period. |
| Six months ended March 31 |
||||||||||||
| (In millions) |
2016 | 2015 | Change | |||||||||
| Corporate expense allocation |
$ | 41.1 | $ | 39.2 | $ | 1.9 | ||||||
Corporate expense allocations remained relatively consistent with the prior year period.
| Six months ended March 31 |
||||||||||||
| (In millions) |
2016 | 2015 | Change | |||||||||
| Equity and other income (loss) |
||||||||||||
| Equity income (loss) |
$ | 6.9 | $ | (7.8 | ) | $ | 14.7 | |||||
| Other income |
3.8 | 5.8 | (2.0 | ) | ||||||||
|
|
|
|
|
|
|
|||||||
| $ | 10.7 | $ | (2.0 | ) | $ | 12.7 | ||||||
|
|
|
|
|
|
|
|||||||
Equity and other income (loss) increased $12.7 million during the current period primarily as a result of the $14.3 million impairment of the Venezuelan equity method investment in the prior year period.
| Six months ended March 31 |
||||||||||||
| (In millions) |
2016 | 2015 | Change | |||||||||
| Net loss on acquisition and divestiture |
||||||||||||
| Valvoline car care products |
$ | — | $ | (26.0 | ) | $ | 26.0 | |||||
| Oil Can Henry’s |
(0.5 | ) | — | (0.5 | ) | |||||||
|
|
|
|
|
|
|
|||||||
| $ | (0.5 | ) | $ | (26.0 | ) | $ | 25.5 | |||||
|
|
|
|
|
|
|
|||||||
Net loss on acquisition and divestiture during the current period includes transaction costs related to the acquisition of Oil Can Henry’s while the prior year period included the impairment of car care products.
| Six months ended March 31 | ||||||||||||
| (In millions) |
2016 | 2015 | Change | |||||||||
| Income tax expense |
$ | 66.5 | $ | 52.4 | $ | 14.1 | ||||||
| Effective tax rate |
33 | % | 37 | % | ||||||||
The overall effective tax rate was 33% for the six months ended March 31, 2016 and was impacted by net favorable discrete items primarily related to the tax law change from the reinstatement of research and development credit. The overall effective tax rate of 37% for the six months ended March 31, 2015 was unfavorably impacted by the loss on the disposition of car care products and the impairment of the Venezuelan equity method investment for which no tax benefit was realized.
67
Table of Contents
Fiscal years ended September 30, 2015, 2014 and 2013
A comparative analysis of the Combined Statements of Operations and Comprehensive Income by caption is provided as follows for the years ended September 30, 2015, 2014 and 2013.
| (In millions) |
2015 | 2014 | 2013 | 2015 Change |
2014 Change |
|||||||||||||||
| Sales |
$ | 1,966.9 | $ | 2,041.3 | $ | 1,996.2 | $ | (74.4 | ) | $ | 45.1 | |||||||||
The following table provides a reconciliation of the change in sales between fiscal years 2015 and 2014 and between fiscal years 2014 and 2013.
| (In millions) |
2015 Change |
2014 Change |
||||||
| Pricing |
$ | (52.7 | ) | $ | 4.3 | |||
| Volume |
51.5 | 35.8 | ||||||
| Product mix |
11.2 | 15.6 | ||||||
| Currency exchange |
(70.4 | ) | (10.6 | ) | ||||
| Divestiture |
(14.0 | ) | — | |||||
|
|
|
|
|
|||||
| Change in sales |
$ | (74.4 | ) | $ | 45.1 | |||
|
|
|
|
|
|||||
2015 compared to 2014
Sales decreased $74.4 million, or 4%, to $1,966.9 million in 2015. Unfavorable foreign currency exchange and lower product pricing decreased sales by $70.4 million, or 3%, and $52.7 million, or 3%, respectively. Unfavorable foreign currency exchange was due to the U.S. dollar strengthening compared to various foreign currencies, primarily the Euro and Australian dollar. Higher volume levels and changes in product mix increased sales by $51.5 million, or 3%, and $11.2 million, respectively. During 2015, lubricant gallons sold increased 3% to 167.4 million. The divestiture of car care products within the Core North America reportable segment during fiscal 2015 decreased sales by $14.0 million compared to the prior year.
2014 compared to 2013
Sales increased $45.1 million, or 2%, to $2,041.3 million in 2014. Volume increased sales by $35.8 million, or 2%, as lubricant gallons sold increased 3% to 162.6 million gallons during 2014. Changes in product mix and improved pricing increased sales by $15.6 million and $4.3 million, respectively. Unfavorable foreign currency exchange decreased sales by $10.6 million.
| (In millions) |
2015 | 2014 | 2013 | 2015 Change |
2014 Change |
|||||||||||||||
| Cost of sales |
$ | 1,281.8 | $ | 1,408.9 | $ | 1,338.3 | $ | (127.1 | ) | $ | 70.6 | |||||||||
| Gross profit as a percent of sales |
34.8 | % | 31.0 | % | 33.0 | % | ||||||||||||||
Fluctuations in cost of sales are driven primarily by raw material prices, volume and changes in product mix, currency exchange, losses or gains on pension and other postretirement benefit plan remeasurements, and other certain charges incurred as a result of changes or events within the businesses or restructuring activities.
68
Table of Contents
The following table provides a reconciliation of the changes in cost of sales between fiscal years 2015 and 2014 and between fiscal years 2014 and 2013.
| (In millions) |
2015 Change |
2014 Change |
||||||
| Product cost |
$ | (105.7 | ) | $ | — | |||
| Currency exchange |
(52.0 | ) | (7.3 | ) | ||||
| Volume and product mix |
43.3 | 35.6 | ||||||
| Divestiture |
(11.4 | ) | — | |||||
| Pension and other postretirement benefit plans expense (income) (including remeasurements) |
(1.3 | ) | 42.3 | |||||
|
|
|
|
|
|||||
| Change in cost of sales |
$ | (127.1 | ) | $ | 70.6 | |||
|
|
|
|
|
|||||
2015 compared to 2014
Cost of sales decreased $127.1 million during 2015 compared to 2014. Lower raw material costs decreased cost of sales by $105.7 million primarily due to declining base oil prices in 2015. Favorable foreign currency exchange decreased cost of sales by $52.0 million, while changes in volume and product mix combined to increase cost of sales by $43.3 million. The divestiture of car care products during fiscal 2015 also decreased cost of sales by $11.4 million.
2014 compared to 2013
Cost of sales increased $70.6 million during 2014 compared to 2013. Changes in volume and product mix combined to increase cost of sales by $35.6 million, while favorable foreign currency exchange decreased cost of sales by $7.3 million. Pension and other postretirement plan expense increased $42.3 million compared to 2013 primarily due to the recognition of a remeasurement loss of $18.6 million in 2014 compared to a gain of $23.1 million in 2013 with the remainder due to the change in recurring pension and other postretirement income.
| (In millions) |
2015 | 2014 | 2013 | 2015 change |
2014 change |
|||||||||||||||
| Selling, general and administrative expense |
$ | 290.8 | $ | 302.8 | $ | 213.4 | $ | (12.0 | ) | $ | 89.4 | |||||||||
| As a percent of sales |
14.8 | % | 14.8 | % | 10.7 | % | ||||||||||||||
2015 compared to 2014
Selling, general and administrative expense decreased $12.0 million, or 4%, during 2015 as compared to 2014. Key drivers of this decrease were:
| • | a decrease of $14.3 million related to the pension and other postretirement costs. Specifically, a loss of $27.8 million on the pension and other postretirement plans remeasurement was recognized during 2015 compared to a loss of $42.5 million in 2014. The loss recognized, inclusive of both Valvoline specific plans and shared plans accounted for under the multi-employer approach, decreased primarily due to changes in the discount rate. See Note B in the Notes to Combined Financial Statements for further discussion on this accounting policy; |
| • | approximately $18.5 million of cost savings related to restructuring programs; |
| • | favorable foreign currency exchange of $9.3 million; |
| • | increase of $9.3 million due to costs associated with supply chain operations that, as described below, were included within the corporate expense allocations prior to 2015; |
69
Table of Contents
| • | increased advertising expense of $4.8 million; |
| • | increased legal, consultant and technology cost of $4.7 million; and |
| • | increased incentive compensation expense of $3.6 million. |
2014 compared to 2013
Selling, general and administrative expense increased $89.4 million, or 42%, during 2014 as compared to 2013. Key drivers of this increase were:
| • | an increase of $94.8 million related to pension and other postretirement costs attributable to Valvoline. Specifically, a loss of $42.5 million on the pension and other postretirement plans remeasurement was recognized during 2014 compared to a gain of $50.9 million in 2013, primarily impacted by a decrease in discount rates, the change in mortality assumptions, and the return on plan assets. The remaining increase was due to the change in recurring pension and other postretirement income; |
| • | severance costs associated with restructuring programs of $6.3 million; and |
| • | a decrease of $12.7 million in advertising and promotional expenses. |
| (In millions) |
2015 | 2014 | 2013 | 2015 change |
2014 change |
|||||||||||||||
| Corporate expense allocation |
$ | 79.5 | $ | 95.0 | $ | 88.2 | $ | (15.5 | ) | $ | 6.8 | |||||||||
2015 compared to 2014
Corporate expense allocations decreased $15.5 million in 2015 compared to 2014 primarily due to a $9.3 million decrease from a change in reporting of supply chain operations. Prior to 2015, supply chain operations were previously included within corporate allocation; however, in 2015 the reporting of these costs attributable to our operations were realigned in order to be directly reported by us within selling, general and administrative expense. Additional decreases were the result of cost savings as a result of restructuring programs.
2014 compared to 2013
Corporate expense allocations increased $6.8 million in 2014 compared to 2013 primarily due to increased incentive compensation expense.
| (In millions) |
2015 | 2014 | 2013 | 2015 change |
2014 change |
|||||||||||||||
| Equity and other income |
||||||||||||||||||||
| Equity income (loss) |
$ | (2.2 | ) | $ | 10.2 | $ | 12.8 | $ | (12.4 | ) | $ | (2.6 | ) | |||||||
| Other income |
10.5 | 19.9 | 11.5 | (9.4 | ) | 8.4 | ||||||||||||||
|
|
|
|
|
|
|
|
|
|
|
|||||||||||
| $ | 8.3 | $ | 30.1 | $ | 24.3 | $ | (21.8 | ) | $ | 5.8 | ||||||||||
|
|
|
|
|
|
|
|
|
|
|
|||||||||||
2015 compared to 2014
Equity income (loss) decreased by $12.4 million during 2015 compared to 2014, primarily due to the $14.3 million impairment of a joint venture equity investment within Venezuela in 2015. For additional information see Note C in the Notes to Combined Financial Statements. Other income decreased by $9.4 million primarily due to a favorable arbitration ruling on a commercial contract in 2014. For additional information see Note L in the Notes to Combined Financial Statements.
70
Table of Contents
2014 compared to 2013
Equity income decreased by $2.6 million during 2014 compared to 2013 primarily due to decreased equity income within India and Venezuela joint ventures. Other income increased by $8.4 million primarily due to the favorable arbitration ruling on a commercial contract in 2014.
| (In millions) |
2015 | 2014 | 2013 | 2015 change |
2014 change |
|||||||||||||||
| Net loss on divestiture |
||||||||||||||||||||
| Valvoline car care products |
$ | (26.3 | ) | $ | — | $ | — | $ | (26.3 | ) | $ | — | ||||||||
|
|
|
|
|
|
|
|
|
|
|
|||||||||||
| $ | (26.3 | ) | $ | — | $ | — | $ | (26.3 | ) | $ | — | |||||||||
|
|
|
|
|
|
|
|
|
|
|
|||||||||||
The loss on divestiture in 2015 represents the loss on the disposition of car care products. This loss was a result of the book value exceeding the sales price of the assets sold.
| (In millions) |
2015 | 2014 | 2013 | 2015 change |
2014 change |
|||||||||||||||
| Income tax expense |
$ | 100.7 | $ | 91.3 | $ | 134.5 | $ | 9.4 | $ | (43.2 | ) | |||||||||
| Effective tax rate |
34 | % | 34 | % | 35 | % | ||||||||||||||
The effective tax rates are generally in line with the U.S. statutory rate. For fiscal years 2015 through 2013, the effective tax rate was impacted favorably by the lower tax rate on foreign earnings and net favorable permanent items. These favorable items are offset by the unfavorable impact of state taxes. These adjustments net to an immaterial overall impact to the effective tax rate for each year.
RESULTS OF OPERATIONS – REPORTABLE SEGMENT REVIEW
Results of our reportable segments are presented based on our management structure and internal accounting practices. The structure and practices are specific to us; therefore, the financial results of our reportable segments are not necessarily comparable with similar information for other comparable companies. We allocate all costs to our reportable segments except for certain significant company-wide restructuring activities, such as certain restructuring plans described in Note D in the Notes to Combined Financial Statements for three years ended September 30, and other costs or adjustments that relate to former businesses that we no longer operate. The service cost component of pension and other postretirement benefits costs is allocated to each reportable segment on a ratable basis; while the remaining components of pension and other postretirement benefits costs are recorded to Unallocated and other. We refine our expense allocation methodologies to the reportable segments from time to time as internal accounting practices are improved, more refined information becomes available and the industry or market changes. Revisions to our methodologies that are deemed insignificant are applied on a prospective basis.
We provide EBITDA and Adjusted EBITDA for each of our reportable segments as a means to enhance the understanding of financial measurements that we have internally determined to be relevant measures of comparison for each reportable segment. Each of these non-GAAP measures is defined as follows: EBITDA (operating income plus depreciation and amortization), Adjusted EBITDA (EBITDA adjusted for key items, which may include pro forma effects for significant acquisitions or divestitures, as applicable), and Adjusted EBITDA margin (Adjusted EBITDA as a percentage of sales). We do not allocate items to each reportable segment below operating income, such as income taxes. As a result, reportable segment EBITDA and Adjusted EBITDA are reconciled directly to operating income since it is the most directly comparable Combined Statements of Operations and Comprehensive Income caption.
71
Table of Contents
The following table shows sales, operating income and statistical operating information by reportable segment for the six months ended March 31, 2016 and 2015 and each of the last three years ended September 30.
| For the six months ended March 31, |
For the year ended September 30, |
|||||||||||||||||||
| (In millions) |
2016 | 2015 | 2015 | 2014 | 2013 | |||||||||||||||
| Sales |
||||||||||||||||||||
| Core North America |
$ | 478.5 | $ | 534.1 | $ | 1,060.7 | $ | 1,114.0 | $ | 1,107.5 | ||||||||||
| Quick Lubes |
223.0 | 191.7 | 394.4 | 369.9 | 343.7 | |||||||||||||||
| International |
234.2 | 247.6 | 511.8 | 557.4 | 545.0 | |||||||||||||||
|
|
|
|
|
|
|
|
|
|
|
|||||||||||
| $ | 935.7 | $ | 973.4 | $ | 1,966.9 | $ | 2,041.3 | $ | 1,996.2 | |||||||||||
|
|
|
|
|
|
|
|
|
|
|
|||||||||||
| Operating income (loss) |
||||||||||||||||||||
| Core North America |
$ | 110.6 | $ | 101.7 | $ | 200.5 | $ | 165.0 | $ | 157.7 | ||||||||||
| Quick Lubes |
54.3 | 44.1 | 94.8 | 79.7 | 70.1 | |||||||||||||||
| International |
32.8 | 20.6 | 64.7 | 78.4 | 67.8 | |||||||||||||||
| Unallocated and other |
2.3 | 2.5 | (36.9 | ) | (58.4 | ) | 85.0 | |||||||||||||
|
|
|
|
|
|
|
|
|
|
|
|||||||||||
| $ | 200.0 | $ | 168.9 | $ | 323.1 | $ | 264.7 | $ | 380.6 | |||||||||||
|
|
|
|
|
|
|
|
|
|
|
|||||||||||
| Depreciation and amortization |
||||||||||||||||||||
| Core North America |
$ | 8.3 | $ | 8.3 | $ | 16.6 | $ | 16.1 | $ | 15.3 | ||||||||||
| Quick Lubes |
8.1 | 7.7 | 16.2 | 15.3 | 15.1 | |||||||||||||||
| International |
2.6 | 2.8 | 5.2 | 5.7 | 5.3 | |||||||||||||||
|
|
|
|
|
|
|
|
|
|
|
|||||||||||
| $ | 19.0 | $ | 18.8 | $ | 38.0 | $ | 37.1 | $ | 35.7 | |||||||||||
|
|
|
|
|
|
|
|
|
|
|
|||||||||||
| Operating information |
||||||||||||||||||||
| Core North America |
||||||||||||||||||||
| Lubricant sales gallons |
49.4 | 47.7 | 99.9 | 99.0 | 98.8 | |||||||||||||||
| Premium lubricants (percent of U.S. branded volumes) |
40.6 | % | 36.0 | % | 36.6 | % | 33.7 | % | 30.0 | % | ||||||||||
| Gross profit as a percent of sales (a) |
42.7 | % | 35.6 | % | 36.6 | % | 31.6 | % | 31.0 | % | ||||||||||
| Quick Lubes |
||||||||||||||||||||
| Lubricant sales gallons |
9.4 | 8.4 | 17.4 | 15.9 | 15.5 | |||||||||||||||
| Premium lubricants (percent of U.S. branded volumes) |
56.2 | % | 54.0 | % | 54.5 | % | 52.2 | % | 49.5 | % | ||||||||||
| Gross profit as a percent of sales (a) |
41.1 | % | 39.7 | % | 39.8 | % | 38.4 | % | 38.9 | % | ||||||||||
| International |
||||||||||||||||||||
| Lubricant sales gallons |
25.4 | 23.4 | 50.1 | 47.7 | 44.1 | |||||||||||||||
| Premium lubricants (percent of lubricant volumes) |
29.5 | % | 30.6 | % | 30.9 | % | 30.1 | % | 29.2 | % | ||||||||||
| Gross profit as a percent of sales (a) |
30.2 | % | 28.9 | % | 30.2 | % | 27.7 | % | 28.3 | % | ||||||||||
| (a) | Gross profit is defined as sales, less cost of sales. |
Core North America
Six months ended March 31, 2016 compared to six months ended March 31, 2015
Core North America sales decreased $55.6 million, or 10%, to $478.5 million during the current period. Lower product pricing and the disposition of car care products decreased sales by $42.8 million, or 8%, and $28.5 million, or 5%, respectively. Changes in product mix and higher volume levels increased sales by $15.4 million, or 3%, and $2.9 million, respectively. Unfavorable foreign currency exchange decreased sales by $2.6 million primarily due to the U.S. dollar strengthening compared to the Canadian dollar.
Gross profit increased $14.2 million during the current period compared to the prior year period. Increases in volumes and changes in product mix combined to increase gross profit by $11.6 million, while lower product
72
Table of Contents
costs, partially offset by lower product pricing, increased gross profit by $7.2 million. The divestiture of car care products and unfavorable foreign currency exchange decreased gross profit by $3.9 million and $0.7 million, respectively. Gross profit as a percent of sales (or gross profit margin) during the current period increased 7.1 percentage points to 42.7%.
Selling, general and administrative expense (which, for reportable segment purposes, includes corporate expense allocation costs) increased $5.6 million during the current period, primarily as a result of $4.2 million of increased advertising costs, $2.6 million of increased consulting and legal costs, $1.8 million of increased bad debt expense, and $1.1 million of increased incentive compensation costs. These increases were partially offset by cost savings from the divestiture of car care products of $4.3 million. Equity and other income increased $0.3 million compared to the prior year primarily as a result of higher other income.
Operating income totaled $110.6 million in the current period as compared to $101.7 million in the prior year period. EBITDA increased $8.9 million to $118.9 million in the current period. EBITDA margin increased 4.2 percentage points to 24.8% in the current period.
2015 compared to 2014
Core North America sales decreased $53.3 million, or 5%, to $1,060.7 million in 2015. Lower product pricing and the disposition of car care products decreased sales by $51.4 million, or 5%, and $14.0 million, or 1%, respectively. Higher volume levels and changes in product mix increased sales by $9.2 million and $8.3 million, respectively. Unfavorable foreign currency exchange decreased sales by $5.4 million due to the U.S. dollar strengthening compared to the Canadian dollar.
Gross profit increased $36.2 million during 2015 compared to 2014. Lower product costs, partially offset by lower product pricing, increased gross profit by $33.8 million. Increases in volumes and changes in product mix combined to increase gross profit by $6.5 million, while unfavorable foreign currency exchange decreased gross profit by $1.5 million. The divestiture of car care products also decreased gross profit by $2.6 million. Gross profit margin during 2015 increased 5.0 percentage points to 36.6%.
Selling, general and administrative expense increased $0.3 million during 2015 as compared to 2014, primarily as a result of $5.2 million of increased advertising costs, $1.5 million of increased Ashland allocated resource costs, a $1.4 million increase in salaries and benefits, and $1.0 million of increased incentive compensation costs. These increases were partially offset by restructuring savings related to salaries and advertising of $4.4 million and $3.5 million, respectively, and cost savings from the divestiture of car care products of $1.5 million. Equity and other income decreased $0.4 million compared to the prior year primarily as a result of lower other income.
Operating income totaled $200.5 million in 2015 as compared to $165.0 million in 2014. EBITDA increased $36.0 million to $217.1 million in 2015. EBITDA margin increased 4.2 percentage points to 20.5% in 2015.
2014 compared to 2013
Core North America sales increased $6.5 million to $1,114.0 million during 2014. Changes in product mix and higher volumes increased sales by $12.8 million and $5.7 million, respectively. These increases were nearly offset by lower pricing and unfavorable foreign currency exchange, which decreased sales by $9.1 million and $2.9 million, respectively.
Gross profit increased $8.1 million during 2014 compared to 2013. Lower product costs, partially offset by lower product pricing, increased gross profit by $8.1 million while increases in volume and changes in product mix combined to increase gross profit by $0.8 million. Unfavorable foreign currency exchange reduced gross profit by $0.8 million. Gross profit margin during 2014 increased 0.6 percentage points to 31.6%.
73
Table of Contents
Selling, general and administrative expense increased $1.4 million during 2014 as compared to 2013, primarily as a result of increased Ashland allocated resource costs of $4.1 million and increased salaries and benefits costs of $2.2 million. These increases were partially offset by decreased advertising and promotional expenses of $4.4 million and $0.5 million of favorable foreign currency exchange. Equity and other income increased by $0.6 million during 2014 compared to 2013, primarily due to an increase in equity income from a domestic joint venture.
Operating income totaled $165.0 million in 2014 as compared to $157.7 million in 2013. EBITDA increased $8.1 million to $181.1 million in 2014. EBITDA margin increased 0.7 percentage points to 16.3% in 2014.
EBITDA and Adjusted EBITDA reconciliation
The following EBITDA presentation is provided as a means to enhance the understanding of financial measurements that we have internally determined to be relevant measures of comparison for the results of Core North America. There were no unusual or key items that affected comparability for Adjusted EBITDA during the six months ended March 31, 2016 and 2015 and fiscal years 2015, 2014 and 2013.
| For the six months ended March 31, |
For the year ended September 30, | |||||||||||||||||||
| (In millions) |
2016 | 2015 | 2015 | 2014 | 2013 | |||||||||||||||
| Operating income |
$ | 110.6 | $ | 101.7 | $ | 200.5 | $ | 165.0 | $ | 157.7 | ||||||||||
| Depreciation and amortization |
8.3 | 8.3 | 16.6 | 16.1 | 15.3 | |||||||||||||||
|
|
|
|
|
|
|
|
|
|
|
|||||||||||
| EBITDA |
$ | 118.9 | $ | 110.0 | $ | 217.1 | $ | 181.1 | $ | 173.0 | ||||||||||
|
|
|
|
|
|
|
|
|
|
|
|||||||||||
Quick Lubes
Six months ended March 31, 2016 compared to six months ended March 31, 2015
Quick Lubes sales increased $31.3 million, or 16%, to $223.0 million during the current period. Volume increased sales by $25.0 million as lubricant sales gallons increased to 9.4 million during the current period. The acquisition of Oil Can Henry’s and changes in product mix increased sales $7.5 million and $0.8 million, respectively. Unfavorable product pricing decreased sales by $2.0 million.
Gross profit increased $15.6 million during the current period compared to the prior year period. Increases in volumes and changes in product mix combined to increase gross profit by $8.7 million. Lower raw material costs, partially offset by unfavorable product pricing, increased gross profit by $5.4 million, while the acquisition of Oil Can Henry’s increased gross profit by $1.5 million. Gross profit margin during the current period increased 1.4 percentage points to 41.1%.
Selling, general and administrative expense increased $5.5 million during the current period. The increase was primarily a result of $2.5 million of cost savings from allocated resource costs, a $1.0 million increase in operating costs as a result of the acquisition of Oil Can Henry’s, a $0.9 million increase in advertising and sales promotion costs and a $0.7 million increase in salaries and incentive compensation costs. Equity and other income increased $0.1 million compared to the prior year period due to a gain on the disposition of certain assets.
Operating income totaled $54.3 million in the current period as compared to $44.1 million in the prior year period. EBITDA increased $10.6 million to $62.4 million in the current period. EBITDA margin increased 1.0 percentage points to 28.0% in the current period.
74
Table of Contents
2015 compared to 2014
Quick Lubes sales increased $24.5 million, or 7%, to $394.4 million during 2015. Volume increased sales by $18.2 million as lubricant sales gallons increased to 17.4 million during 2015. Favorable pricing and changes in product mix increased sales by $4.6 million and $1.7 million, respectively.
Gross profit increased $14.8 million during 2015 compared to 2014. Lower raw material costs and favorable product pricing increased gross profit by $8.2 million. Increases in volumes and changes in product mix combined to increase gross profit by $6.6 million. Gross profit margin during 2015 increased 1.4 percentage points to 39.8%.
Selling, general and administrative expense decreased $0.2 million during 2015 as compared to 2014. The decrease was primarily a result of $4.7 million of cost savings from Ashland allocated resource costs. These costs were partially offset by a $1.5 million increase in salary and benefit costs and a $1.2 million increase in legal and consulting costs, as well as increased advertising costs and bad debt expense of $0.6 million and $0.4 million, respectively. Equity and other income increased $0.1 million compared to the prior year due to a gain on the disposition of certain assets.
Operating income totaled $94.8 million in 2015 as compared to $79.7 million in 2014. EBITDA increased $16.0 million to $111.0 million in 2015. EBITDA margin increased 2.4 percentage points to 28.1% in 2015.
2014 compared to 2013
Quick Lubes sales increased $26.2 million, or 8%, to $369.9 million during 2014 with higher pricing increasing sales by $14.7 million, or 4%. Changes in volume and product mix increased sales by $9.6 million, or 3%, and $1.9 million, respectively.
Gross profit increased $8.4 million during 2014 compared to 2013. Increases in volumes and changes in product mix combined to increase gross profit by $6.4 million, while price improvements, partially offset by higher raw materials costs, increased gross profit by $2.0 million. Gross profit margin during 2014 decreased 0.5 percentage points to 38.4%.
Selling, general and administrative expense decreased $1.1 million during 2014 as compared to 2013, primarily as a result of decreased advertising and promotional expenses of $1.5 million and insurance expense of $0.6 million, partially offset by increased Ashland allocated resource costs of $1.8 million. Equity and other income increased by $0.1 million during 2014 compared to 2013, primarily due to a gain on the disposition of certain assets.
Operating income totaled $79.7 million in 2014 as compared to $70.1 million in 2013. EBITDA increased $9.8 million to $95.0 million in 2014. EBITDA margin increased 0.9 percentage points to 25.7% in 2014.
75
Table of Contents
EBITDA and Adjusted EBITDA reconciliation
The following EBITDA presentation is provided as a means to enhance the understanding of financial measurements that we have internally determined to be relevant measures of comparison for the results of Quick Lubes. There were no unusual or key items that affected comparability for Adjusted EBITDA for all periods presented herein.
| For the six months ended March 31, |
For the year ended September 30, | |||||||||||||||||||
| (In millions) |
2016 | 2015 | 2015 | 2014 | 2013 | |||||||||||||||
| Operating income |
$ | 54.3 | $ | 44.1 | $ | 94.8 | $ | 79.7 | $ | 70.1 | ||||||||||
| Depreciation and amortization |
8.1 | 7.7 | 16.2 | 15.3 | 15.1 | |||||||||||||||
|
|
|
|
|
|
|
|
|
|
|
|||||||||||
| EBITDA |
$ | 62.4 | $ | 51.8 | $ | 111.0 | $ | 95.0 | $ | 85.2 | ||||||||||
|
|
|
|
|
|
|
|
|
|
|
|||||||||||
International
Summarized below are the sales by geographic region for the International reportable segment for the six months ended March 31, 2016 and 2015 and the last three fiscal years ended September 30.
| International |
||||||||||||||||||||
| For the six months ended March 31, |
For the year ended September 30, | |||||||||||||||||||
| Sales by Geography |
2016 | 2015 | 2015 | 2014 | 2013 | |||||||||||||||
| Europe, Middle East and Africa |
29 | % | 29 | % | 29 | % | 31 | % | 32 | % | ||||||||||
| Australia |
27 | % | 28 | % | 27 | % | 29 | % | 32 | % | ||||||||||
| Asia Pacific excluding Australia |
26 | % | 25 | % | 26 | % | 23 | % | 22 | % | ||||||||||
| Latin America |
18 | % | 18 | % | 18 | % | 17 | % | 14 | % | ||||||||||
|
|
|
|
|
|
|
|
|
|
|
|||||||||||
| 100 | % | 100 | % | 100 | % | 100 | % | 100 | % | |||||||||||
|
|
|
|
|
|
|
|
|
|
|
|||||||||||
Six months ended March 31, 2016 compared to six months ended March 31, 2015
International sales decreased $13.4 million, or 5%, to $234.2 million during the current period. Unfavorable foreign currency exchange, primarily with the Euro and Australian dollar, decreased sales by $23.7 million, or 10%. Higher volume levels and changes in product mix increased sales by $17.9 million, or 7%, and $0.8 million, respectively. Lower product pricing decreased sales by $8.4 million, or 3%.
Gross profit decreased $0.8 million during the current period compared to the prior year period. Unfavorable foreign currency exchange decreased gross profit by $6.1 million, while increases in volumes and changes in product mix combined to increase gross profit by $5.2 million. Lower product costs were essentially offset by lower product pricing increasing gross profit by $0.1 million. Gross profit margin during the current period increased 1.3 percentage points to 30.2%.
Selling, general and administrative expense decreased $0.8 million during the current period, primarily as a result of $0.7 million of bad debt expense. Equity and other income (loss) increased $12.2 million compared to the prior year period primarily as a result of the $14.3 million impairment of the Venezuelan equity method investment in the prior year period. For additional information see Note C in the Notes to Condensed Combined Financial Statements for the period ended March 31, 2016.
Operating income totaled $32.8 million in the current period as compared to $20.6 million in the prior year period. EBITDA increased $12.0 million in the current period to $35.4 million. Adjusted EBITDA decreased $2.3 million to $35.4 million and Adjusted EBITDA margin decreased 0.1 percentage points to 15.1% in the current period.
76
Table of Contents
2015 compared to 2014
International sales decreased $45.6 million, or 8%, to $511.8 million during 2015. Unfavorable currency exchange decreased sales by $65.0 million as a result of the U.S. dollar strengthening as compared to various foreign currencies, primarily the Euro and the Australian dollar. Volume increased sales $24.1 million, as lubricant gallons sold increased to 50.1 million during 2015, and changes in product mix increased sales by $1.2 million. Unfavorable product pricing decreased sales by $5.9 million.
Gross profit increased $0.4 million during 2015 compared to 2014. Unfavorable foreign currency exchange decreased gross profit by $16.9 million while lower raw material costs, partially offset by lower product pricing, increased gross profit by $11.1 million. Increases in volumes and changes in product mix combined to increase gross profit by $6.2 million. Gross profit margin during 2015 increased 2.5 percentage points to 30.2%.
Selling, general and administrative expense decreased $7.3 million, or 7%, during 2015 as compared to 2014, primarily as a result of declines from favorable foreign currency exchange of $8.5 million, which was partially offset by increased sales promotion costs of $1.1 million.
Equity and other income decreased by $21.4 million during 2015 compared to 2014, primarily due to the $14.3 million impairment of an equity method investment in Venezuela during 2015 and $7.7 million from a favorable arbitration ruling on a commercial contract during 2014. For additional information see Notes C and L in the Notes to Combined Financial Statements.
Operating income totaled $64.7 million in 2015 as compared to $78.4 million in 2014. EBITDA decreased $14.2 million to $69.9 million in 2015. Adjusted EBITDA increased $0.1 million to $84.2 million in 2015. Adjusted EBITDA margin increased 1.4 percentage points to 16.5% in 2015.
2014 compared to 2013
International sales increased $12.4 million, or 2%, to $557.4 million during 2014. Volume increased sales by $20.4 million, or 4%, as lubricant gallons sold increased to 47.7 million gallons during 2014. Changes in product mix also increased sales by $1.0 million. Unfavorable foreign currency exchange and lower pricing decreased sales by $7.7 million and $1.3 million, respectively.
Gross profit increased $0.3 million during 2014 compared to 2013. Increases in volumes and changes in product mix combined to increase gross profit by $8.4 million, while lower pricing and higher production costs combined to decrease gross profit by $5.6 million. Unfavorable foreign currency exchange reduced gross profit by $2.5 million. Gross profit margin during 2014 decreased 0.6 percentage points to 27.7%.
Selling, general and administrative expense decreased $5.1 million during 2014 as compared to 2013, primarily as a result of decreased advertising and promotional expenses of $6.6 million and favorable foreign currency exchange of $1.8 million. These decreases were partially offset by increased salaries and benefits costs of $2.9 million.
Equity and other income increased by $5.2 million during 2014 compared to 2013, as a result of an increase of $8.4 million in other income due to a favorable arbitration ruling on a commercial contract during 2014. This increase was partially offset by a decrease of $3.2 million in equity income primarily related to unfavorable performance in our India and Venezuela joint ventures.
Operating income totaled $78.4 million in 2014 as compared to $67.8 million in 2013. EBITDA increased $11.0 million to $84.1 million in 2014. EBITDA margin increased 1.7 percentage points to 15.1% in 2014. There were no unusual or key items that affected comparability for EBITDA during 2014 and 2013.
77
Table of Contents
EBITDA and Adjusted EBITDA reconciliation
The following EBITDA and Adjusted EBITDA presentation is provided as a means to enhance the understanding of financial measurements that we have internally determined to be relevant measures of comparison for the results of International. Adjusted EBITDA results have been prepared to illustrate the ongoing effects of our operations, which exclude certain key items. The $14.3 million adjustment in March 2015 is related to the impairment of an equity method investment within Venezuela.
| For the six months ended March 31, |
For the year ended September 30, | |||||||||||||||||||
| (In millions) |
2016 | 2015 | 2015 | 2014 | 2013 | |||||||||||||||
| Operating income |
$ | 32.8 | $ | 20.6 | $ | 64.7 | $ | 78.4 | $ | 67.8 | ||||||||||
| Depreciation and amortization |
2.6 | 2.8 | 5.2 | 5.7 | 5.3 | |||||||||||||||
|
|
|
|
|
|
|
|
|
|
|
|||||||||||
| EBITDA |
35.4 | 23.4 | 69.9 | 84.1 | 73.1 | |||||||||||||||
| Impairment of equity investment |
— | 14.3 | 14.3 | — | — | |||||||||||||||
|
|
|
|
|
|
|
|
|
|
|
|||||||||||
| Adjusted EBITDA |
$ | 35.4 | $ | 37.7 | $ | 84.2 | $ | 84.1 | $ | 73.1 | ||||||||||
|
|
|
|
|
|
|
|
|
|
|
|||||||||||
Unallocated and Other
Unallocated and other generally includes items such as components of pension and other postretirement benefit plan expenses (excluding service costs, which are allocated to the reportable segments), certain significant company-wide restructuring activities and legacy costs.
The following table summarizes the key components of the Unallocated and other segment’s operating income (expense) for the six months ended March 31, 2016 and 2015 and each of the last three years ended September 30.
| For the six months ended March 31, |
For the year ended September 30, | |||||||||||||||||||
| (In millions) |
2016 | 2015 | 2015 | 2014 | 2013 | |||||||||||||||
| Gain (losses) on pension and other postretirement plan remeasurement |
$ | (4.7 | ) | $ | (2.0 | ) | $ | (46.0 | ) | $ | (61.1 | ) | $ | 74.0 | ||||||
| Pension and other postretirement net periodic income (a) |
7.0 | 4.9 | 9.5 | 9.0 | 11.0 | |||||||||||||||
| Restructuring activities |
— | (0.4 | ) | (0.4 | ) | (6.3 | ) | — | ||||||||||||
|
|
|
|
|
|
|
|
|
|
|
|||||||||||
| Total income (expense) |
$ | 2.3 | $ | 2.5 | $ | (36.9 | ) | $ | (58.4 | ) | $ | 85.0 | ||||||||
|
|
|
|
|
|
|
|
|
|
|
|||||||||||
| (a) | Amounts exclude service costs of $4.3 million and $4.5 million for the six months ended March 31, 2016 and 2015, respectively, $8.8 million during 2015, $9.6 million during 2014 and $10.5 million during 2013, which are allocated to our reportable segments. |
Six months ended March 31, 2016 compared to six months ended March 31, 2015
Unallocated and other recorded income was $2.3 million and $2.5 million during the six months ended March 31, 2016 and 2015, respectively. Unallocated and other includes pension and other postretirement net periodic costs and income within operations that have not been allocated to reportable segments. These costs and income are reflective of standalone Valvoline pension plans as well as the shared pension and other postretirement plans accounted for under a multi-employer approach. These costs include interest cost, expected return on assets and amortization of prior service credit, which resulted in income of $7.0 million and $4.9 million during the current and prior year period, respectively. Unallocated and other also includes gains and losses on pension and other postretirement plan remeasurements, which resulted in a loss of $4.7 million and $2.0 million during the current and prior year period, respectively. Fluctuations in these amounts from year to
78
Table of Contents
year result primarily from changes in the discount rate but are also partially affected by differences between the expected and actual return on plan assets during each year as well as other changes in other actuarial assumptions such as changes in demographic data or mortality assumptions. The current period remeasurement losses include the allocation of the curtailment gains and actuarial losses resulting from the March 2016 announced plan amendments of certain shared pension and other postretirement plans. These plan amendments will freeze the pension benefits for the majority of Ashland’s U.S. pension plans as of September 30, 2016 and reduce the retiree life and medical benefits effective October 1, 2016 and January 1, 2017, respectively.
Fiscal years ended September 30, 2015, 2014 and 2013
Unallocated and other recorded expense was $36.9 million for 2015 and $58.4 million for 2014, and income of $85.0 million for 2013. Unallocated and other includes pension and other postretirement net periodic costs and income within operations that have not been allocated to reportable segments. These costs and income are reflective of standalone Valvoline pension plans as well as the shared pension and other postretirement plans accounted for under a multi-employer approach. These costs include interest cost, expected return on assets and amortization of prior service credit, which resulted in income of $9.5 million during 2015, $9.0 million during 2014, and $11.0 million during 2013. Unallocated and other also includes gains and losses on pension and other postretirement plan remeasurements, which resulted in a loss of $46.0 million in 2015, a loss of $61.1 million in 2014 and a gain of $74.0 million in 2013. Fluctuations in these amounts from year to year result primarily from changes in the discount rate but are also partially affected by differences between the expected and actual return on plan assets during each year as well as other changes in other actuarial assumptions such as changes in demographic data or mortality assumptions.
Unallocated and other also includes severance expense of $0.4 million and $6.3 million during 2015 and 2014, respectively, related to restructuring programs.
FINANCIAL POSITION, LIQUIDITY AND CAPITAL RESOURCES
Overview
Historically, the primary source of liquidity for our business was the cash flow provided by our operations, which was transferred to Ashland to support its overall cash management strategy. Transfers of cash to and from Ashland’s cash management system have been reflected in Ashland’s net investment in the historical combined balance sheets, statements of cash flows and statements of changes in invested equity. We have not reported cash or cash equivalents for the periods presented in the combined balance sheets.
Upon the completion of this offering, we will maintain separate cash management and financing functions for operations. Additionally, our capital structure, long-term commitments and sources of liquidity will change significantly from our historical capital structure, long-term commitments and sources of liquidity. The cash balance on the date of the completion of this offering is expected to be approximately $ million. However, that amount could fluctuate based on the outcome of several of our current assumptions.
Prior to the closing of this offering, we expect to incur new senior term loans (which may be secured or unsecured), new senior unsecured notes or a combination thereof in an aggregate principal amount of approximately $ million. We expect to transfer the proceeds of this indebtedness to Ashland through intercompany transfers. Upon closing this offering, we expect to apply $ million of net proceeds from this offering to repay this indebtedness. After giving effect to these transactions, following the closing of this offering, we expect to have new senior term loans (which may be secured or unsecured), new senior unsecured notes or a combination thereof in an aggregate principal amount of approximately $ million. We also plan to obtain an accounts receivable securitization facility with up to $ million of available funding from qualified receivables.
In addition to the senior term indebtedness described above, in the event that the net proceeds of this offering are expected to exceed $ million, we may incur certain short-term indebtedness immediately prior to the closing of this offering and transfer the net proceeds thereof to a subsidiary of Ashland Global. We plan to repay such short-term indebtedness in full from the net proceeds of this offering.
79
Table of Contents
Further, we expect that approximately $ million in net unfunded pension and other postretirement plan liabilities will be transferred to us by Ashland as part of the separation. As announced by Ashland in March 2016, these plans are frozen to new participants and, effective September 2016, the accrual of pension benefits for participants will be frozen. Certain postretirement benefits were also eliminated or curtailed. Plans transferred to us by Ashland will include a substantial portion of the largest U.S. qualified pension plan and non-qualified U.S. pension plans.
No U.S. qualified pension plan contributions are required in 2016 and approximately $15.0 million will be contributed to the U.S. non-qualified pension plans in 2016. During 2017, no contributions are expected to be required to be made to the U.S. qualified pension plans, while approximately $15.0 million of contributions are expected to be required to be made to the U.S. non-qualified pension plans. We expect to fund the costs of the non-qualified plans as the benefits are paid.
We believe that our available cash and cash flows expected to be generated from operations will be adequate to satisfy our current and planned operations for at least the next 12 months. Our future capital requirements will depend on many factors, including our rate of sales growth, the expansion of our sales and marketing activities, our expansion into other markets and our results of operations. To the extent that existing cash, cash from operations and credit facilities are insufficient to fund our future activities, we may need to raise additional funds through public equity or debt financing.
Operating activities
The cash generated during each period is primarily driven by net income results, adjusted for certain non-cash items such as depreciation and amortization and remeasurement adjustments to the pension plans, as well as changes in working capital, which are fluctuations within accounts receivable, inventory, trade and other payables, and accrued expenses and other liabilities. We continue to emphasize working capital management as a high priority and focus.
The following table sets forth the cash flows associated with our operating activities for the six months ended March 31, 2016 and 2015 and the fiscal years 2015, 2014 and 2013.
| For the six months ended March 31, |
For the year ended September 30, |
|||||||||||||||||||
| (In millions) |
2016 | 2015 | 2015 | 2014 | 2013 | |||||||||||||||
| Cash flows provided (used) by operating activities: |
||||||||||||||||||||
| Net Income |
$ | 133.0 | $ | 90.5 | $ | 196.1 | $ | 173.4 | $ | 246.1 | ||||||||||
| Adjustments to reconcile income to cash flows from operating activities |
||||||||||||||||||||
| Depreciation and amortization |
19.0 | 18.8 | 38.0 | 37.1 | 35.7 | |||||||||||||||
| Deferred income taxes |
— | — | (9.1 | ) | (16.0 | ) | 37.7 | |||||||||||||
| Equity income from affiliates |
(6.8 | ) | (6.5 | ) | (12.1 | ) | (10.2 | ) | (12.8 | ) | ||||||||||
| Distributions from equity affiliates |
8.1 | 8.1 | 17.9 | 7.5 | 7.7 | |||||||||||||||
| Net loss on acquisition and divestiture |
0.5 | 26.0 | 26.3 | — | — | |||||||||||||||
| Impairment of equity method investment |
— | 14.3 | 14.3 | — | — | |||||||||||||||
| Loss (gain) on pension and postretirement plan remeasurement |
— | — | 2.0 | 1.0 | (2.5 | ) | ||||||||||||||
| Change in operating assets and liabilities (a) |
(62.7 | ) | 9.4 | 56.4 | (22.2 | ) | (39.0 | ) | ||||||||||||
|
|
|
|
|
|
|
|
|
|
|
|||||||||||
| Total cash flows provided by operating activities |
$ | 91.1 | $ | 160.6 | $ | 329.8 | $ | 170.6 | $ | 272.9 | ||||||||||
|
|
|
|
|
|
|
|
|
|
|
|||||||||||
| (a) | Excludes changes resulting from operations acquired or sold. |
80
Table of Contents
The following table details certain changes in key operating assets and liabilities for the six months ended March 31, 2016 and 2015 and for the years ended September 30, 2015, 2014 and 2013.
| For the six months ended March 31, |
For the year ended September 30, | |||||||||||||||||||
| (In millions) |
2016 | 2015 | 2015 | 2014 | 2013 | |||||||||||||||
| Changes in assets and liabilities (a) |
||||||||||||||||||||
| Accounts receivable |
$ | (15.4 | ) | $ | 32.4 | $ | 53.4 | $ | (31.3 | ) | $ | (1.3 | ) | |||||||
| Inventories |
(17.2 | ) | 7.4 | (6.4 | ) | 8.2 | (18.9 | ) | ||||||||||||
| Trade and other payables |
(5.3 | ) | (20.1 | ) | (7.3 | ) | (7.8 | ) | 12.0 | |||||||||||
| Accrued expenses and other liabilities |
(4.5 | ) | (7.3 | ) | 9.3 | (11.3 | ) | 8.8 | ||||||||||||
| Other assets and liabilities |
(20.3 | ) | (3.0 | ) | 7.4 | 20.0 | (39.6 | ) | ||||||||||||
|
|
|
|
|
|
|
|
|
|
|
|||||||||||
| Change in operating assets and liabilities |
$ | (62.7 | ) | $ | 9.4 | $ | 56.4 | $ | (22.2 | ) | $ | (39.0 | ) | |||||||
|
|
|
|
|
|
|
|
|
|
|
|||||||||||
| (a) | Excludes changes resulting from operations acquired or sold. |
Six months ended March 31, 2016 compared to six months ended March 31, 2015
Changes in net working capital (accounts receivable, inventory, trade and other payables and accrued expense and other liabilities) accounted for an outflow of $42.4 million and an inflow of $12.4 million during the six months ended March 31, 2016 and 2015, respectively, and were driven by the following:
| • | Accounts receivable – The cash outflow during the six months ended March 31, 2016 of $15.4 million is a result of higher sales during February and March 2016 compared to August and September 2015 as well as changes in the balances of customer accounts receivable sold to a financial institution. The cash inflow of $32.4 million during the six months ended March 31, 2015 related to the inception of the program of selling certain customer accounts receivables to a financial institution at the beginning of fiscal 2015. See Note B in the Notes to Condensed Combined Financial Statements for further information on this program. |
| • | Inventory – Changes in inventory from year to year are primarily a result of sales activity and inventory management strategies, specifically the movement in lubricant gallons. |
| • | Trade and other payables and accrued expenses and other liabilities – Changes in trade and other payables and accrued expenses and other liabilities combined were cash outflows of $9.8 million and $27.4 million during the six months ended March 31, 2016 and 2015, respectively. Fluctuations within trade and other payables is primarily a result of timing of payments, inventory balances and currency movements. |
The remaining cash outflows for operating assets and liabilities during the six months ended March 31, 2016 and 2015 of $20.3 million and $3.0 million, respectively, were primarily due to adjustments to other long term assets and liabilities.
Operating cash flows for the six months ended March 31, 2016 included net income of $133.0 million and noncash adjustments of $19.0 million for depreciation and amortization.
Operating cash flows for the six months ended March 31, 2015 included net income of $90.5 million and noncash adjustments of $18.8 million for depreciation and amortization, the loss on the disposition of car care products of $26.0 million, and $14.3 million related to the impairment of the Venezuelan equity method investment.
81
Table of Contents
Fiscal years ended September 30, 2015, 2014 and 2013
Changes in net working capital (accounts receivable, inventory, trade and other payables and accrued expense and other liabilities) accounted for inflows of $49.0 million and $0.6 million in 2015 and 2013, respectively, and an outflow of $42.2 million in 2014, and were driven by the following:
| • | Accounts receivable – The cash inflow related to accounts receivable during 2015 compared to 2014 was primarily due to the sale of certain customer accounts receivable to a financial institution of $41.4 million as of September 30, 2015. See Note B in the Notes to Combined Financial Statements for further information on this activity. The cash outflow related to accounts receivable during 2014 compared to 2013 was due to increased sales compared to 2013 and also slower paced collections. |
| • | Inventory – Changes in inventory from year to year are primarily a result of sales activity and inventory management strategies. The cash outflows during 2015 and 2013 were primarily the result of increased lubricant gallon volumes compared to the preceding years’, while the cash inflow during 2014 was the result of a decrease in lubricant gallon volumes compared to 2013. |
| • | Trade and other payables and accrued expenses and other liabilities – Changes in trade and other payables and accrued expenses and other liabilities combined were cash inflows of $2.0 million in 2015, cash outflows of $19.1 million in 2014 and cash inflows of $20.8 million in 2013. Fluctuations within trade and other payables is primarily a result of timing of payments and inventory balances. The change during 2014 within accrued expenses and other liabilities was primarily due to the completion of certain costs associated with the construction of a manufacturing facility. The changes in 2015 and 2013 within accrued expenses and other liabilities were primarily due to increased incentive compensation accruals. |
The remaining cash inflows for operating assets and liabilities during 2015 and 2014 of $7.4 million and $20.0 million, respectively, and an outflow of $39.6 million during 2013 were primarily due to adjustments to other long term assets and liabilities.
Operating cash flows for 2015 included net income of $196.1 million, $2.0 million of losses on pension plan remeasurements for standalone Valvoline plans and noncash adjustments of $38.0 million for depreciation and amortization, the loss on the disposition of car care products of $26.3 million, and $14.3 million related to the impairment of the Venezuelan joint venture equity investment.
Operating cash flows for 2014 included net income of $173.4 million, $1.0 million of losses on pension plan remeasurements for standalone Valvoline plans and a noncash adjustment of $37.1 million for depreciation and amortization.
Operating cash flows for 2013 included net income of $246.1 million, a $2.5 million gain on pension plan remeasurement for standalone Valvoline plans and a noncash adjustment of $35.7 million for depreciation and amortization.
82
Table of Contents
Investing activities
The following table sets forth the cash flows associated with our investing activities for the six months ended March 31, 2016 and 2015 and the fiscal years 2015, 2014 and 2013.
| For the six months ended March 31, |
For the year ended September 30, | |||||||||||||||||||
| (In millions) |
2016 | 2015 | 2015 | 2014 | 2013 | |||||||||||||||
| Cash flows provided (used) by investing activities |
||||||||||||||||||||
| Additions to property, plant and equipment |
$ | (14.4 | ) | $ | (17.7 | ) | $ | (45.0 | ) | $ | (37.2 | ) | $ | (40.9 | ) | |||||
| Proceeds from disposal of property, plant and equipment |
0.2 | 0.4 | 0.9 | 0.8 | 0.5 | |||||||||||||||
| Purchase of operations - net of cash acquired |
(66.4 | ) | — | (4.7 | ) | (1.9 | ) | (0.2 | ) | |||||||||||
| Proceeds from sale of operations |
— | — | 22.8 | — | — | |||||||||||||||
|
|
|
|
|
|
|
|
|
|
|
|||||||||||
| Total cash flows used by investing activities |
$ | (80.6 | ) | $ | (17.3 | ) | $ | (26.0 | ) | $ | (38.3 | ) | $ | (40.6 | ) | |||||
|
|
|
|
|
|
|
|
|
|
|
|||||||||||
Six months ended March 31, 2016 compared to six months ended March 31, 2015
Cash used by investing activities was $80.6 million and $17.3 million during the six months ended March 31, 2016 and 2015, respectively. The purchase of operations of $66.4 million during the current period relates primarily to the acquisition of Oil Can Henry’s as well as other nominal Quick Lubes locations. Both periods include cash outflows for capital expenditures of $14.4 million and $17.7 million, respectively.
Fiscal years ended September 30, 2015, 2014 and 2013
Cash used by investing activities was $26.0 million in 2015 compared to $38.3 million and $40.6 million for 2014 and 2013, respectively. Fiscal 2015 included cash outflows of $45.0 million for capital expenditures and $4.7 million for a Quick Lube acquisition, as well as cash inflows of $22.8 million from the disposition of car care products and the Venezuelan equity method investment.
The significant cash investing activities for 2014 and 2013 included cash outflows for capital expenditures of $37.2 million and $40.9 million, respectively.
Financing activities
The following table sets forth the cash flows associated with our financing activities for the six months ended March 31, 2016 and 2015 and fiscal years 2015, 2014 and 2013.
| For the six months ended March 31, |
For the year ended September 30, |
|||||||||||||||||||
| (In millions) |
2016 | 2015 | 2015 | 2014 | 2013 | |||||||||||||||
| Cash flows provided (used) by financing activities |
||||||||||||||||||||
| Net transfers to Ashland |
$ | (10.5 | ) | $ | (143.3 | ) | $ | (303.8 | ) | $ | (132.3 | ) | $ | (232.3 | ) | |||||
|
|
|
|
|
|
|
|
|
|
|
|||||||||||
| Total cash flows used by financing activities |
$ | (10.5 | ) | $ | (143.3 | ) | $ | (303.8 | ) | $ | (132.3 | ) | $ | (232.3 | ) | |||||
|
|
|
|
|
|
|
|
|
|
|
|||||||||||
As Ashland managed our cash and financing arrangements, all excess cash generated through earnings were deemed remitted to Ashland and all sources of cash were deemed funded by Ashland. See Note B in the Notes to Combined Financial Statements for additional information.
83
Table of Contents
Six months ended March 31, 2016 compared to six months ended March 31, 2015
Cash used by financing activities was $10.5 million and $143.3 million for the six months ended March 31, 2016 and 2015, respectively. The current period net transfers to Ashland amount was driven by the acquisition of Oil Can Henry’s and changes in working capital.
Fiscal years ended September 30, 2015, 2014 and 2013
Cash used by financing activities was $303.8 million for 2015, $132.3 million for 2014, and $232.3 million for 2013. Cash provided by operations, which increased for the reasons discussed previously, and proceeds from the disposition of car care products drove the $171.5 million increase in cash transferred from us to Ashland during 2015 compared to 2014. The 2013 net transfers to Ashland were driven by earnings results.
Free cash flow and other liquidity information
The following table sets forth free cash flow for the disclosed periods and reconciles free cash flow to cash flows provided by operating activities. Free cash flow does not reflect adjustments for certain non-discretionary cash flows. See “Results of Operations—Combined Review—Non-GAAP Performance Metrics” for additional information.
| For the six months ended March 31, |
For the year ended September 30, | |||||||||||||||||||
| (In millions) |
2016 | 2015 | 2015 | 2014 | 2013 | |||||||||||||||
| Cash flows provided by operating activities |
$ | 91.1 | $ | 160.6 | $ | 329.8 | $ | 170.6 | $ | 272.9 | ||||||||||
| Less: |
||||||||||||||||||||
| Additions to property, plant and equipment |
(14.4 | ) | (17.7 | ) | (45.0 | ) | (37.2 | ) | (40.9 | ) | ||||||||||
|
|
|
|
|
|
|
|
|
|
|
|||||||||||
| Free cash flows |
$ | 76.7 | $ | 142.9 | $ | 284.8 | $ | 133.4 | $ | 232.0 | ||||||||||
|
|
|
|
|
|
|
|
|
|
|
|||||||||||
At March 31, 2016, working capital (current assets minus current liabilities) amounted to $213.8 million, compared to $178.7 million at the end of 2015. Working capital is affected by our use of the last-in, first-out (“LIFO”) method of inventory valuation that valued inventories below their replacement costs by $25.9 million at March 31, 2016 and $31.2 million at September 30, 2015. Accounts receivable amounted to 117% of current liabilities at March 31, 2016 and 112% at September 30, 2015.
Debt
Historically, the primary source of liquidity for our business was the cash flow provided by our operations, which was transferred to Ashland to support its overall cash management strategy. Transfers of cash to and from Ashland’s cash management system have been reflected in Ashland’s net investment in the historical combined balance sheets, statements of cash flows and statements of changes in invested equity. We have not reported cash or cash equivalents or debt for the periods presented in the combined balance sheets.
Prior to the closing of this offering, we expect to incur new senior term loans (which may be secured or unsecured), new senior unsecured notes or a combination thereof in an aggregate principal amount of approximately $ million. We expect to transfer the proceeds of this indebtedness to Ashland through intercompany transfers. Upon closing this offering, we expect to apply $ million of net proceeds from this offering to repay this indebtedness. After giving effect to these transactions, following the closing of this offering, we expect to have new senior term loans (which may be secured or unsecured), new senior unsecured notes or a combination thereof in an aggregate principal amount of approximately $ million. We also plan to obtain an accounts receivable securitization facility with up to $ million of available funding from qualified receivables.
84
Table of Contents
Capital expenditures
Capital expenditures were $14.4 million for the six months ended March 31, 2016 and $45.0 million for 2015. The annual average capital expenditure during the last three years was $41.0 million. Capital expenditures by reportable segment for the last three fiscal years are set forth in the table below.
| (in millions) |
2015 | 2014 | 2013 | |||||||||
| Core North America |
$ | 20.2 | $ | 15.2 | $ | 14.9 | ||||||
| Quick Lubes |
19.2 | 16.4 | 19.5 | |||||||||
| International |
5.6 | 5.6 | 6.5 | |||||||||
|
|
|
|
|
|
|
|||||||
| $ | 45.0 | $ | 37.2 | $ | 40.9 | |||||||
|
|
|
|
|
|
|
|||||||
Contractual obligations and other commitments
The following table sets forth our obligations and commitments to make future payments under existing contracts at September 30, 2015. Excluded from the table are contractual obligations for which the ultimate settlement of quantities or prices are not fixed and determinable or capital lease obligations.
| (In millions) |
Total | Less than 1 Year |
1-3 years |
3-5 years |
More than 5 years |
|||||||||||||||
| Contractual obligations |
||||||||||||||||||||
| Operating lease obligations (a) |
$ | 62.7 | $ | 12.6 | $ | 19.6 | $ | 11.8 | $ | 18.7 | ||||||||||
| Employee benefit obligations (b) |
5.0 | 3.2 | 0.3 | 0.3 | 1.2 | |||||||||||||||
| Unrecognized tax benefits (c) |
4.7 | — | — | — | 4.7 | |||||||||||||||
|
|
|
|
|
|
|
|
|
|
|
|||||||||||
| Total contractual obligations |
$ | 72.4 | $ | 15.8 | $ | 19.9 | $ | 12.1 | $ | 24.6 | ||||||||||
|
|
|
|
|
|
|
|
|
|
|
|||||||||||
| (a) | As a result of the acquisition of Oil Can Henry’s during the period ended March 31, 2016, future minimum operating lease obligations increased approximately $50.0 million over the term of the existing lease agreements. This increase is excluded from the figures reflected in the table above. |
| (b) | Includes estimated funding of Valvoline specific pension plans for 2016, as well as projected benefit payments through 2025 under our unfunded pension plans. Excludes the benefit payments from the pension plan trust funds. See Note K in the Notes to Combined Financial Statements. |
| (c) | Due to uncertainties in the timing of the effective settlement of tax positions with respect to taxing authorities, we are unable to determine the timing of payments related to noncurrent unrecognized tax benefits, including interest and penalties. Therefore, these amounts were included in the “More than 5 years” column. |
The foregoing table does not give effect to indebtedness, unfunded pension liabilities and certain other liabilities that we expect to incur or assume in connection with the separation transactions and the completion of this offering.
OFF-BALANCE SHEET ARRANGEMENTS
As part of our normal course of business, we are a party to various financial guarantees and other commitments. These arrangements involve elements of performance and credit risk that are not included in the combined balance sheets. The possibility that we would have to make actual cash expenditures in connection with these obligations is largely dependent on the performance of the party whose obligations we guarantee, or the occurrence of future events that we are unable to predict. We have reserved the approximate fair value of these guarantees in accordance with U.S. GAAP.
NEW ACCOUNTING PRONOUNCEMENTS
For a discussion and analysis of recently issued accounting pronouncements and its impact on us, see Note B in the Notes to Combined Financial Statements
85
Table of Contents
CRITICAL ACCOUNTING POLICIES
The preparation of our combined financial statements in conformity with U.S. GAAP requires management to make estimates and assumptions that affect the reported amounts of assets, liabilities, sales and expenses, and the disclosures of contingent assets and liabilities. Significant items that are subject to such estimates and assumptions include, but are not limited to, long-lived assets (including goodwill), sales deductions and income taxes. Although management bases its estimates on historical experience and various other assumptions that are believed to be reasonable under the circumstances, actual results could differ significantly from the estimates under different assumptions or conditions.
Long-lived Assets
Tangible assets
The cost of property, plant and equipment is depreciated by the straight-line method over the estimated useful lives of the assets. Buildings are depreciated principally over 5 to 35 years and machinery and equipment principally over 5 to 15 years. We review property, plant and equipment asset groups for impairment whenever events or changes in circumstances indicate the carrying amount of an asset may not be recoverable. We monitor these changes and events on at least a quarterly basis. Examples of events or changes in circumstances could include, but are not limited to, a prolonged economic downturn, current period operating or cash flow losses combined with a history of losses or a forecast of continuing losses associated with the use of an asset group, or a current expectation that an asset group will be sold or disposed of before the end of its previously estimated useful life. Recoverability is based upon projections of anticipated future undiscounted cash flows associated with the use and eventual disposal of the property, plant and equipment asset groups, as well as specific appraisals in certain instances. Reviews occur at the lowest level for which identifiable cash flows are largely independent of cash flows associated with other property, plant and equipment asset groups. If the future undiscounted cash flows result in a value that is less than the carrying value, then the long-lived asset is considered impaired and a loss is recognized based on the amount by which the carrying amount exceeds the estimated fair value. Various factors that we use in determining the impact of these assessments include the expected useful lives of long-lived assets and the ability to realize any undiscounted cash flows in excess of the carrying amounts of such asset groups, and are affected primarily by changes in the expected use of the assets, changes in technology or development of alternative assets, changes in economic conditions, changes in operating performance and changes in expected future cash flows. Because judgment is involved in determining the fair value of property, plant and equipment asset groups, there is risk that the carrying value of these assets may require adjustment in future periods.
Goodwill
We review goodwill for impairment annually or when events and circumstances indicate an impairment may have occurred. This annual assessment is performed as of July 1 and consists of us determining each reporting unit’s current fair value compared to its current carrying value. Our reporting units for the allocation of goodwill, and the associated goodwill balances, include the Core North America ($89.1 million as of September 30, 2015), Quick Lubes ($40.7 million as of September 30, 2015), and International ($39.6 million as of September 30, 2015) reportable segments.
In reviewing goodwill for impairment, we have the option to first perform a qualitative assessment to determine whether the existence of events or circumstances leads to a determination that it is more likely than not that the fair value of a reporting unit is less than its carrying amount. If we determine that it is not more likely than not that the fair value of a reporting unit is less than its carrying amount, we are not required to perform any additional tests in assessing goodwill for impairment. However, if we conclude otherwise or elect not to perform the qualitative assessment, then we are required to perform the first step of a two-step impairment review process.
86
Table of Contents
We performed the quantative assessment for each reporting unit during the applicable fiscal year periods within this standalone report and upon completion of this assessment noted no impairment for any fiscal year periods within the financial statements. During the fiscal 2015 annual impairment analysis, all of our reporting units’ fair value exceeded the book value by greater than 300%.
Our assessment of an impairment charge on goodwill could change in future periods if any or all of the following events were to occur with respect to a particular reporting unit: a significant change in projected business results, a divestiture decision, significant changes to certain discounted cash flow assumptions, economic deterioration that is more severe or of a longer duration than anticipated, or other significant economic events.
Sales Deductions
We recognize revenue in accordance with Staff Accounting Bulletin (“SAB”) No. 101, Revenue Recognition in Financial Statements, as amended by SAB No. 104, Revenue Recognition, when persuasive evidence of an arrangement exists, products are received or services are provided to customers, the sales price is fixed or determinable and collectability is reasonably assured. Provisions are made at the time of revenue recognition for sales rebates and discounts consisting primarily of promotion rebates and customer pricing discounts. These provisions are recorded as a reduction of revenue based on contract terms and our historical experience with similar programs and require management’s judgment with respect to estimating customer participation and performance levels. Differences between estimated expense and actual incentive costs are normally insignificant and are recognized in earnings in the period such differences are determined. The cost of these programs is recognized as incurred and recorded as a reduction of sales and totaled $344.8 million, $321.7 million and $300.4 million in the Combined Statements of Operations and Comprehensive Income for September 30, 2015, 2014 and 2013, respectively.
Income Taxes
The provision for income taxes includes current income taxes as well as deferred income taxes. Under U.S. GAAP, deferred tax assets and liabilities are determined based on differences between financial reporting and tax basis of assets and liabilities and are measured using enacted tax rates and laws that are expected to be in effect when the differences reverse. The effect of changes in tax rates on deferred taxes is recognized in the period in which the enactment date changes. Valuation allowances are established when necessary on a jurisdictional basis to reduce deferred tax assets to the amounts expected to be realized.
Our income taxes as presented are calculated on a separate return basis, although our operations have historically been included in Ashland’s U.S. federal and state tax returns or non-U.S. jurisdictions tax returns. As our operations in many jurisdictions are unincorporated commercial units of Ashland and its subsidiaries, standalone tax returns have not been filed for the operations in these jurisdictions. Accordingly, our tax results as presented are not necessarily reflective of the results that we would have generated on a standalone basis.
Our combined balance sheet reflects assumptions regarding the expected manner of separation of the Company that would result in Ashland retaining certain tax items in a number of jurisdictions. As a result, the tax items that Ashland would retain in these jurisdictions have been eliminated from our combined balance sheet. The income tax expense of these items has been reflected in the combined statements of operations and comprehensive income, with a corresponding offset to total invested equity.
87
Table of Contents
QUANTITATIVE AND QUALITATIVE DISCLOSURE ABOUT MARKET RISK
Foreign Exchange Risk
We are exposed primarily to market risks associated with foreign currency exchange rates. Our foreign currency risk is primarily limited to the Euro, Australian Dollar, Canadian Dollar and Chinese Yuan. We participate in Ashland’s centralized foreign currency derivatives program which mitigates risk associated with the foreign currency exposures. We believe our foreign currency risk is limited as 72% of our revenue during the year ended September 30, 2015 and 71% of our revenue in each of the years ended September 30, 2014 and 2013 was based in U.S. dollars, and 80% and 78% of our net assets was based in U.S. dollars. We do not have material exposures to market risk with respect to investments.
Inflation and Changing Prices
Our financial statements are prepared on the historical cost method of accounting in accordance with U.S. GAAP and, as a result, do not reflect changes in the purchasing power of the U.S. dollar. Monetary assets (such as cash, cash equivalents and accounts receivable) lose purchasing power as a result of inflation, while monetary liabilities (such as accounts payable and indebtedness) result in a gain, because they can be settled with dollars of diminished purchasing power. As of September 30, 2015, our monetary assets exceed our monetary liabilities, leaving us currently more exposed to the effects of future inflation. However, given the recent consistent stability of inflation in the United States in the past several years as well as forward economic outlooks, current inflationary pressures seem moderate.
Certain of the industries in which we operate are capital-intensive, and replacement costs for our plant and equipment generally would substantially exceed their historical costs. Accordingly, depreciation and amortization expense would be greater if it were based on current replacement costs. However, because replacement facilities would reflect technological improvements and changes in business strategies, such facilities would be expected to be more productive than existing facilities, mitigating at least part of the increased expense.
We use the LIFO method to value a portion of our inventories to provide a better matching of revenues with current costs. However, LIFO values such inventories below their replacement costs during inflationary periods.
88
Table of Contents
OUR COMPANY
We are one of the most recognized and respected premium consumer brands in the global automotive lubricant industry, known for our high quality products and superior levels of service. Established in 1866, our heritage spans 150 years, during which we have developed powerful name recognition across multiple product and service channels. We have significant positions in the United States in all of the key lubricant sales channels, and also have a strong international presence with our products sold in approximately 140 countries.
In the United States and Canada, our products are sold to consumers through over 30,000 retail outlets, to installer customers with over 12,000 locations, and to approximately 1,050 Valvoline branded franchised and company-owned stores. We serve our customer base through an extensive sales force and technical support organization, allowing us to leverage our technology portfolio and customer relationships globally, while meeting customer demands locally. This combination of scale and strong local presence is critical to our success.
We have a history of leading innovation with revolutionary products such as All Climate™, DuraBlend™, and MaxLife™. In addition to our iconic Valvoline-branded passenger car motor oils and other automotive lubricant products, we provide a wide array of lubricants used in heavy duty equipment, as well as automotive chemicals and fluids designed to improve engine performance and lifespan. Our premium branded product offerings enhance our high quality reputation and provide our customers with solutions that address a wide variety of needs.
We deliver products and services to our customers across three business segments:
| • | Core North America: We sell to consumers in the United States and Canada who perform their own automotive maintenance, referred to as “Do-It-Yourself” or “DIY” consumers, through retail outlets, including AutoZone, O’Reilly Auto Parts and Advance Auto Parts. We also sell to installer customers such as car dealers, general repair shops and third-party quick lube locations, including Goodyear, Monro, Express Oil Change, TBC Retail Group and Sears, directly and through distributors. Installers use our products to service vehicles owned by “Do-It-For-Me” or “DIFM” consumers. Our installer channel team also sells branded products and solutions to heavy duty customers, such as on-highway fleets and construction companies, and we have a strategic relationship with Cummins Inc. (“Cummins”), a leading heavy duty engine manufacturer, for co-branding products in the heavy duty business. |
| • | Quick Lubes: We operate the second-largest United States retail quick lube service chain by number of stores, Valvoline Instant Oil Change (“VIOC”), which provides fast, trusted service through approximately 720 franchised and 330 company-owned stores. Our VIOC company-owned stores have had nine years of consecutive same-store sales growth,* and consistently outperformed our competitors, delivering on average over 36% more daily oil changes during 2015 than competing quick lube service centers. Our franchisees have also enjoyed strong results, performing on average 22% more daily oil changes in 2015 than competitors. We also sell our products and provide Valvoline branded signage to independent quick lube operators through our Express Care program. In 2015, we estimate that VIOC and Express Care stores performed approximately 13% of the total oil changes in the quick lube market. |
| * | We have historically determined same-store sales growth on a fiscal year basis, with new stores excluded from the metric until the completion of their first full fiscal year in operation. |
89
Table of Contents
| • | International: Our products are sold in approximately 140 countries outside of the United States and Canada, where, like in Core North America, Valvoline is positioned as a high performance, high quality brand. International sales include both passenger car products and heavy duty products used in a wide variety of heavy duty equipment. We sell our passenger car products to installer customers primarily through distributors, and our heavy duty products directly to customers, as well as through distributors. |
Sales and Adjusted EBITDA contribution of each of our segments is as follows:
| Fiscal 2015 Sales Contribution |
Fiscal 2015 Adj. EBITDA Contribution | |
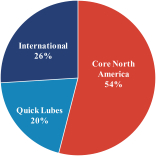
|
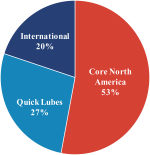
| |
| FY15 Sales: $2.0 Billion | FY15 Adjusted EBITDA: $422 Million |
In fiscal 2015, we generated approximately $2.0 billion in sales, $422 million in Adjusted EBITDA and $196 million in net income. During the same period, our Adjusted EBITDA margin, which we define as Adjusted EBITDA as a percentage of sales, was 21.5%. In addition, we generated free cash flow of $285 million and cash flows provided by operating activities of $330 million during fiscal 2015. Leveraging the strength of our brand, our superior product performance and multiple channels to market, we have generated strong margins and cash flow across each of our reportable segments. See “—Summary Historical and Pro Forma Combined Financial Data” for the definition of Adjusted EBITDA and free cash flow, each a non-GAAP measure, and a reconciliation of such measures to net income and cash flows provided by operating activities, as applicable.
Adjusted EBITDA and Adjusted EBITDA Margin ($ in Millions)
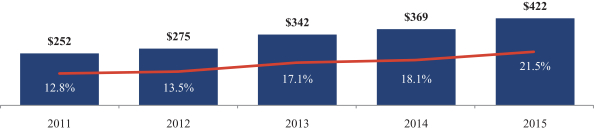
Key drivers to our strong financial performance:
| • | Premium Mix Shift: Our overall product mix has continued to shift toward premium-branded lubricant sales, with United States premium-branded lubricant sales volume increasing to approximately 40% of total sales volume in 2015, up from approximately 31% in 2011. |
| • | Annual Growth in VIOC Same-Store Sales: We have had nine consecutive years of same-store sales growth in our company-owned VIOC stores. Most recently, same-store sales grew 8% from 2014 to 2015. |
90
Table of Contents
| • | Consistent Volume and Profit Growth in International Markets: From 2009 to 2015, International sales volume grew at a 7% compound annual growth rate. International sales are diversified across key global regions, and our growth strategy focuses on three attractive markets: China, India and select countries in Latin America. We believe that partnering with leading original equipment manufacturers (“OEMs”), such as Cummins, has helped us drive growth and positions us well for continued international expansion. |
| • | Proactive Product Pricing and Raw Material Cost Management: We have been successful in maintaining our margins through changes in base oil costs. We closely monitor raw material market dynamics and have negotiated base oil supply contracts with terms that have reduced the impact of changes in base oil prices on our financial results. Additionally, we have revised our contracts with many of our customers to shorten the timing of adjustments to our selling prices in response to changes in raw material prices. |
Our Value Proposition and Business Model
Founded in 1866, the Valvoline brand stands for high quality and performance, allowing us to command premium pricing for our products. The strength of our business model is our ability to generate profitable sales across multiple channels to market, leveraging the Valvoline brand through effective marketing, innovative product technology and the capabilities of our team. We have delivered strong profits and return on capital, with balanced results across all of our sales channels. Today, Valvoline is a high margin, high free cash flow generating business, with significant growth opportunities across all of our business segments.
Our successful business model is further strengthened by our commitment to partnering with customers and channel partners to drive value-creating solutions. We drive growth by providing cutting edge innovations, high-quality products and dedicated customer service. Our “Hands on Expertise” customer service model, which pairs our deep automotive knowledge with a commitment to developing unparalleled customer solutions, is designed to help us outperform our competitors.
A Rich History of Innovation
|
|
We have a 150 year history of industry-leading innovation. The company’s history dates back to 1866, when Dr. John Ellis discovered the lubricating properties of crude oil. Valvoline was trademarked six years later, making it the first trademarked motor oil in U.S. history. By 1895 we began to cement our place in American racing culture, when a Valvoline lubricated race car won the first known automotive race in North American history. In the early 1900s, the Valvoline brand gained national prominence as one of the recommended motor oils for the iconic Ford Model T. |
During the 20th century, we furthered our tradition of innovation, pioneering one of the world’s first aircraft engine motor oils, developing All-Climate Motor Oil, which eliminated the need for seasonal oil changes, and introducing Valvoline Racing Motor Oil, which became, and is to this day, one of the best-selling racing motor oils of all time. In 1987, we expanded into the quick lube market with the acquisition of an 81 store chain. Two years later we franchised our first five VIOC stores. In 1998, we began a partnership with Cummins, a leading global designer, manufacturer and distributor of engines, filtration and power generation products, that includes the sale of Cummins-endorsed Valvoline lubricants such as Premium Blue™ heavy duty engine oil. We have been selling products outside the United States for over 90 years, and now sell products in approximately 140 countries.
91
Table of Contents
We continued to be a leader in the lubricants industry in product innovation with the introduction of DuraBlend™ in 1996, our first synthetic motor oil blend, and MaxLife™ in 2000, the first motor oil specifically engineered for cars with over 75,000 miles. We continue to invest significant resources in our research and development programs and in developing relationships with OEMs with a goal of creating new and innovative products to meet the current and future needs of our customers. It is this spirit of performance and innovation that has made us into a global business today and that we believe will continue to drive our growth in the future.
OUR BUSINESS SEGMENTS
We operate our business through three reportable operating segments: Core North America, Quick Lubes and International.
Core North America
In our Core North America business segment we sell Valvoline™ and other branded products in the United States and Canada to both consumers who perform their own automotive maintenance, referred to as “Do-It-Yourself” or “DIY” consumers, as well as to installer customers who use our products to service vehicles owned by “Do-It-For-Me” or “DIFM” consumers.
We sell to DIY consumers through over 30,000 retail outlets, such as AutoZone, Advance Auto Parts and O’Reilly Auto Parts, as well as leading mass merchandisers and independent auto parts stores. We have been successful in driving premium lubricants growth with DIY consumers by building strong retailer relationships, offering high quality products and using effective consumer marketing. We are a recognized innovator among branded lubricant companies, a distinction that enables us to build strong customer relationships. We frequently partner with retailers on distinct promotions to drive consumers to their stores to purchase Valvoline products. We work directly with top retailers on category management, assisting them with identification of category trends and optimizing their product assortment and shelf sets to improve profitability. We stress the importance of selling high margin products such as MaxLifeTM (designed for high mileage vehicles) and SynPowerTM (a synthetic lubricant).
We sell to DIFM consumers through installers who collectively operate over 12,000 locations in the United States and Canada. Installer customers include car dealers, general repair shops and third-party quick lube chains. We directly serve these customers with our own sales force and fulfillment capabilities, through retailers such as NAPA, and a network of approximately 140 distributors. Our key installer customers include large national accounts such as Goodyear, Monro, Express Oil Change, TBC Retail Group and Sears. Our installer channel team also sells branded products and solutions to heavy duty customers such as on-highway fleets and construction companies, and we have a strategic relationship with Cummins for co-branding products in the heavy duty business.
We believe we add significantly more value to our installer customers than our more cost-driven competitors by sharing our expertise in the areas of sales, marketing and supply chain management to help them grow their businesses through improvements in customer acquisition, retention and sales mix. We believe that our differentiated service approach allows us to charge premium prices.
Our Core North America business segment generated approximately $1.1 billion in sales and $217 million in Adjusted EBITDA in 2015, contributing 54% of our overall sales and 53% of our Adjusted EBITDA. We believe the success of our Core North America operations is driven by the strength of the Valvoline brand and our portfolio of high quality lubricants and strong relationships with our channel partners.
Quick Lubes
Our Quick Lubes business segment services the passenger car and light truck quick lube market through two platforms: our company-owned and franchised VIOC stores, which we believe comprise the industry’s best retail
92
Table of Contents
quick lube service chain; and Express Care, a quick lube customer platform developed for independent operators who purchase Valvoline motor oil and other products pursuant to contracts while displaying Valvoline branded signage.
VIOC stores offer consumers a quick, easy and trusted way to maintain their vehicles, utilizing well trained technicians who have access to a proprietary computer-based point-of-sale technology system along with SuperPro, our proprietary service process that sets forth rigorous protocols for both the steps that must be followed in the service of vehicles and for interactions with consumers. Our VIOC stores provide a broad range of preventive maintenance services, including full-service oil changes, OEM mileage-based services (transmission, radiator and gear box fluid exchange services), tire rotations, fuel system services and seasonal air conditioning coolant replacement services. The VIOC technology, tools and processes allow our team members to provide a preventive maintenance service recommendation for each vehicle and track services that have historically been performed. VIOC team members utilize these tools to confidently make service recommendations based primarily on the recommendations of vehicle manufacturers. Through the use of these tools and our highly talented teams, VIOC has been able to increase its oil changes per day to levels meaningfully above industry averages.
The VIOC network is growing through a combination of new company-owned stores, increased number of franchisees and opportunistic acquisitions, such as the recent acquisition of Oil Can Henry’s in February 2016. Today, VIOC operates approximately 330 company-owned stores and has 720 franchised stores across 44 states. Company-owned stores generally achieve high returns on investment due to their strong number of oil changes per day, penetration of premium branded products, higher margin extra services and vertical leverage achieved through the distribution of Valvoline products. In addition to strong returns, company-owned stores also provide us with critical knowledge and experience, which we then transfer to our franchise operators.
We have developed strong relationships with our franchisees, who leverage VIOC’s proven business model and tools, thereby supporting store performance. The VIOC franchise model includes the use of our proprietary technology platform and SuperPro service process, as well as access to innovative and proven digital and direct response marketing platforms. We provide franchisees with in-field support and training from our experienced operators. In addition, we support franchised store growth via acquisition leads, a ground up development platform and financial assistance. On a combined basis, our franchise platform provides a robust level of support to VIOC franchise owners. These relationships are mutually beneficial; franchisees receive our products and business management expertise and we receive franchise fees and product sales. Franchised stores require minimal capital investment and generate significant cash flow for us. We believe there is a significant opportunity to grow the number of both company-owned and franchised VIOC locations.
The Express Care platform has been designed to support smaller (typically single store) operators that do not fit our franchised model and typically offer other non-quick lube services such as auto repair and car washes. The Express Care model has generated consistent store growth, which we expect to continue. This program is flexible and can support both the core quick lube operator as well as an operator that has a broader automotive business model.
Our Quick Lubes business segment generated approximately $394 million in sales and $111 million in Adjusted EBITDA in 2015, contributing 20% of our overall sales and 27% of our Adjusted EBITDA. We believe the success of our Quick Lubes operations stems from an enhanced customer experience, our superior marketing and operations, our proactive cost management and our relentless focus on developing the best talent in the industry.
International
Our International business segment sells Valvoline™ and our other branded products in approximately 140 countries. Our key international markets include China, India, EMEA, Latin America and Australia Pacific. We
93
Table of Contents
have significant overall market share in India and Australia and a growing presence in a number of markets, with primary growth targets being China, India and select countries within Latin America. Our International business segment sells products for both consumer and commercial vehicles and equipment, and is served by company-owned manufacturing facilities in the United States, Australia and the Netherlands, a joint venture-owned facility in India and third-party warehouses and toll manufacturers in other regions.
Our heavy duty products are used in a wide variety of heavy duty equipment, including on-road trucks and buses, agricultural equipment, construction and mining equipment and power generation equipment. These products are sold either directly to key customers, or through distributors. We have leveraged our long-term relationships with leading OEMs, such as Cummins, to build a solid base in the commercial and industrial lubricants markets. In these markets, OEM endorsements provide credibility. We add value by helping to reduce the cost of operating equipment, extend drain intervals, improve fuel economy and enhance equipment durability. We also sell a variety of lubricants, coolants and automotive chemicals directly to OEMs, at both a regional and global level. This ability to sell value-added products and aftermarket programs globally is a competitive advantage.
Our passenger car, motorcycle and light duty truck products are sold internationally mostly through distributors in DIFM sales channels to installer customers, including independent garages, car and motorcycle dealers and small parts retailers. In these channels, Valvoline’s position as the oldest and one of the most successful motor oil brands in the United States provides credibility in most markets. We add further value by working with our installer customers to provide a range of value-added products, product and sales training and marketing assistance. Through these partnerships, our installer customers leverage our insights to improve their sales model, which solidifies our relationship with them.
We go to market in our International business in three ways: (1) through our own local sales, marketing and back office support teams, which we refer to as our “wholly owned affiliate markets”; (2) through joint ventures; and (3) through independent distributors. In our wholly owned affiliate markets, we have a direct presence and maintain the sales and marketing teams required to build effective channels. We have 50/50 joint ventures with Cummins in India and China. We also have smaller joint ventures in select countries in Latin America. In other countries, we go to market via independent distributors, which provide access to these geographies with limited capital investment.
We believe that our geographic position, growing international platform, value-added products and services, OEM alliances and strong brand equity provide the opportunity to build on our historic growth and increase penetration in key markets. We intend to evaluate future international growth and expansion opportunities, including continued investments in brand and channel development, supply chain development and bolt-on acquisitions.
Our International business segment generated approximately $512 million in sales and $84 million in Adjusted EBITDA in 2015, contributing 26% of our overall sales and 20% of our Adjusted EBITDA. The success of our International business has been based in part upon the strength of our brand, strong channel partners and distributors and our ability to customize a portfolio of products to meet varying market needs of different regions around the world.
94
Table of Contents
OUR PRODUCTS
We offer a wide variety of branded, co-branded and private label products to meet the needs of light-duty and heavy duty engine and automotive maintenance customers in approximately 140 countries around the world. Our portfolio is designed to deliver quality product solutions to meet the needs of our wide variety of customers with varying needs.
| Product Line |
% Sales* | Description |
Product Examples | |||||
| Lubricants | Passenger Car / Light Duty | Comprehensive assortment meeting the needs of passenger car, motorcycle and other light duty engines, including motor oil, transmission fluid, greases and gear oil |

| |||||
| Heavy Duty | 86% | Lubricating solutions for a wide range of heavy duty applications ranging from on-road (Class 4 – Class 8 vehicles) to off-road construction, mining and power generation equipment |

| |||||
| Antifreeze | Antifreeze / Coolants |
5% | Antifreeze/coolants for OEMs; full assortment of additive technologies and chemistries to meet virtually all light-duty and heavy duty engine applications and heat transfer requirements of batteries and fuel cells used to power today’s electric vehicles |

| ||||
| Chemicals
|
Maintenance Chemicals | 5%
|
Functional and maintenance chemicals ranging from brake fluids and power steering fluids to chemicals specifically designed to clean and maintain optimal performance of fuel, cooling and drive train systems |

| ||||
| Coatings | Specialty coatings designed to target rust prevention, sound absorption and release agents for automotive and industrial applications |

| ||||||
| Filters | Filters | 3% | Oil and air filters meeting the needs of light-duty vehicles |
| ||||
| Other | Other Complementary Products | 1% | Windshield wiper blades, light bulbs, serpentine belts and drain plugs |

| ||||

In addition to our branded offerings, we sell private-label products to OEMs, lubricant marketers and aftermarket retailers. Our private label products include lubricants, coolants and chemicals bearing the brand names of some of the world’s most recognized marketers.
| * | For the six months ended March 31, 2016 |
95
Table of Contents
OUR MARKET
We participate in the global finished lubricants market, which had demand of over 11.7 billion gallons, or $60 billion, in 2015. For the same period, demand for passenger car motor oil and motorcycle oil accounted for slightly over 24% of global lubricant demand, while the remaining 76% of demand was for commercial and industrial products. The United States has historically accounted for the largest amount of lubricant demand, followed by China and India. The lubricants market is impacted by the following key drivers and trends:
| • | Shift in Demand for High Performance Products: Global lubricants market demand is shifting towards higher performance finished lubricants, largely driven by advancements in vehicle/equipment design and OEM requirements for improved efficiency, reduced carbon footprints and optimized fuel consumption. This shift in customer demand requires high-end formulations from lubricant manufacturers and leads to ongoing investment in top tier base stocks (Group II/II+ and Group III/III+ base oils) to support synthetics growth in developed markets, like the United States. Establishing strong product lines of synthetic and bio-based lubricants have become key competitive aspects to attract OEMs focused on equipment efficiency and environmental sustainability. In many non-U.S. markets, older engine technologies remain more prevalent. We believe there will be an opportunity for increased sales of our high performance products as these engines are replaced by newer technology engines. |
| • | Environmental Health and Safety Regulations: There has been increasingly stringent regulation, particularly in North America and Europe aimed at reducing toxic emissions, which has led to a continuous drive for innovation given changing specifications for lubricants. Recent regulatory trends include: European Commission Regulations; Registration, Evaluation, Authorization, and Restriction of Chemicals (REACH); Euro Regulations; The Clean Air Act; and more stringent vehicle emission requirements. |
The Core North America, Quick Lubes and International markets in which we participate have experienced the following trends:
Core North America
The overall passenger car motor oil market is undergoing a shift in product mix to higher margin synthetics. Valvoline currently possesses a #3 position by volume in the U.S. DIY market and intends to drive profitability by increasing its premium mix and pursuing digital marketing initiatives and campaigns. Brand strength is important in both DIY and DIFM markets. Based on our research, brand matters to 90% of DIY consumers, with only 10% believing that motor oils are all the same. In addition, 82% of DIFM consumers claim using a “well-known” motor oil brand is important to them.
Between 2007 and 2012, the North American transport lubes market experienced average annual volume declines of 2.7% per annum, due in part to an increase in oil change intervals, which have resulted from changing OEM recommendations and advancements in engine technology. Our focus on premium markets, such as synthetics and high-mileage lubricants, which continue to experience significant growth, has helped us maintain profitability despite declines in overall volume. Over the past two years, market volume has increased, largely due to the increase in the number of cars on the road and miles driven. Going forward, we expect that our increasing sales of higher margin, premium products, coupled with the increase in miles driven and cars on the road, will help mitigate the impact of longer oil change intervals.
Quick Lubes
DIFM service providers collectively perform about 450 million oil changes in the United States annually. The quick lube industry performed approximately 22%, or 100 million, of those oil changes in 2015. There are currently over 9,000 known quick lube stores in the United States, with our VIOC company-owned and franchised stores comprising approximately 11% of those units. Of the approximately 100 million oil changes
96
Table of Contents
performed in the quick lube industry in 2015, about 13 million were part of our quick lube network, with approximately 11 million performed through our VIOC network and another 2 million performed through our Express Care network.
International
A surge in the number of cars on the road has led to rapid expansion of passenger vehicle lubricant sales in developing regions. For example, the number of passenger cars on the road in China grew from 59 million in 2010 to 121 million in 2014, representing a compound annual growth rate of 21%. Asia Pacific accounted for 44% of global lubricant demand in 2015, with China and India being the second and third largest markets in terms of lubricant volume consumed. South America accounted for 8% of demand in 2015, with Brazil being the sixth largest global country market.
In the heavy duty engine oil market, China accounted for the largest amount of heavy duty lubricant demand in 2015, comprising approximately 23% of global heavy duty demand, followed by North America at 17% and Asia Pacific at 21%. In 2015, total heavy duty lubricant volume was about 2.6 billion gallons, with a total market value of over $22 billion. Our market share in the heavy duty market is currently less than 1% in China, approximately 3% in North America, and just over 2% in Asia Pacific, leaving substantial room for growth. Our highest market share in the heavy duty market is in Australia, where we believe we account for 11% of the market.
OUR COMPETITIVE STRENGTHS
We believe the following strengths differentiate us from our competitors and are important to our success:
Iconic Brand with Premium Products
| Valvoline is a highly recognized and respected premium consumer brand. According to our research, we have a total awareness rate of 90% with consumers in the United States, and in many countries around the globe the Valvoline trademark is a symbol of high quality, which helps us to command premium prices. We are known for our high quality products, market leading technology and superior levels of service.
The consistent application of the Valvoline brand across all channels provides us with a significant marketing advantage. We use a variety of marketing techniques to build awareness of our brand, including social and |
|
digital media, search, direct marketing, radio and television. In addition, we selectively sponsor teams in high performance racing series, including a current sponsorship of Hendrick Motorsports, featuring drivers Dale Earnhardt Jr., Chase Elliott, Jimmie Johnson and Kasey Kahne. We believe our iconic brand and strong customer awareness support our ability to grow our retail base in existing and new markets.
Unique Multi-Channel Presence
We operate through multiple automotive maintenance outlets and are committed to delivering an outstanding customer experience against a diverse set of customer expectations, leveraging our strong channel partner and quick lube network. Whether the customer is a consumer driving in for a differentiated VIOC quick lube experience, an installer looking to improve the performance of its business, a heavy duty customer looking to effectively service on-road and off-road vehicles or a DIY consumer looking for high quality products to service their vehicles, we leverage our “Hands on Expertise” to provide a solution to their unique and individual needs.
97
Table of Contents
Within our DIY and DIFM sales channels, we have been successful in driving premium lubricants growth through effective consumer marketing and strong retailer relationships, resulting in Valvoline holding a #3 position by volume in the United States DIY market in 2015. Within our Quick Lubes business, our “Hands on Expertise” approach is a differentiating factor and has led to nine consecutive years of VIOC company-owned same-store sales growth and resulted in VIOC being the #2 quick lube chain by store count in 2015. Internationally, we sell our products in approximately 140 countries and our relationships with leading OEMs have provided us with the opportunity to leverage the Valvoline brand to increase global growth and awareness in key markets. In particular, we have a strong partnership with Cummins, a leading global designer, manufacturer and distributor of engines, filtration and power generation products, that includes joint ventures in India and China and global marketing and product co-branding arrangements.
Industry-Leading, Valvoline-Branded Quick Lube Business
With over 330 company-owned VIOC stores and another 720 franchised locations, we are the largest franchisor of quick lube stores that owns and operates its own oil change centers. VIOC is committed to providing our customers with a quick, easy and trusted oil change experience. We believe that our ability to deliver an outstanding customer experience is based on the quality of our teams and their focus on execution and customer satisfaction. Our proprietary point-of-sale system allows us to leverage data, understand our customers’ needs and customize service recommendations for each of our customers. SuperPro, our proprietary service process that sets forth rigorous protocols for both the steps that must be followed in the service of vehicles and for interactions with customers, is designed to deliver a consistently outstanding customer experience.
Operating our own stores allows us to continually improve all aspects of our business model, from store operations to marketing tactics, which enhances the profitability of our company-owned and franchised operations. In addition, our company-owned VIOC locations provide us with first-hand knowledge of the customer experience. We use this knowledge to improve the speed and quality of our services, resulting in performance improvements at our own stores, as well as the stores of our franchisees. Our focus on the total customer experience has resulted in consistently high customer satisfaction rates. We have had nine consecutive years of same-store sales growth, due in part to improved customer service experience and an increase in the number of oil changes per day. In addition, the visibility of approximately 1,050 VIOC and 340 Express Care stores across the United States further strengthens our brand in the markets in which our quick lube stores operate. As seen below, our company-owned VIOC stores have outperformed the competition in oil changes per day since 2009. Our franchisees have also enjoyed strong performance by executing the same business model.
Oil Changes Per Day, Per Store
Note: Represents fiscal years.
Source: National Oil and Lube News.
We believe our vertical integration through our Quick Lubes business is an additional competitive advantage. By selling our own, high-quality motor oil and family of products to our owned stores, our franchisees and other quick lube channel partners, we generate value for the overall enterprise, as well as an additional profit pool.
98
Table of Contents
Strong History of Innovation
We believe that innovation is central to the successful performance of our business. As a result, we invest significant resources in our research and development programs and in developing relationships with OEMs, with a goal of developing new and innovative products to meet the current and future needs of our customers. We have an established track record of pioneering new product categories, such as synthetic blends, high mileage motor oil and racing motor oil. The introduction of MaxLifeTM and Full Synthetic High Mileage has driven significant trade-up to our higher performing synthetic and other premium products, contributing to both retailer and installer profitability.
Innovations in our sales and marketing efforts have been a cornerstone of our success. We place a high priority on sales and marketing, with a focus on the following areas, which we believe yield the highest benefits:
| • | targeted innovative digital marketing, which has allowed us to more efficiently reach our consumers with relevant messaging; |
| • | consumer relationship marketing and social media platforms, which provide forums for ongoing dialogue with consumers to increase brand commitment; and |
| • | selective investment in national advertising and sponsorships, including our current sponsorship of Hendrick Motorsports, featuring drivers Dale Earnhardt Jr., Chase Elliott, Jimmie Johnson and Kasey Kahne, which builds on our brand’s strong equity with racing fans. |
Independent, Focused Organization
Under the leadership of our Chief Executive Officer, Samuel J. Mitchell, Jr., our management team has extensive experience in the consumer products and lubricants industry in the areas of commercial operations, sales, marketing and research and development. Our leadership team has instituted a strong, unified corporate culture focused on speed and “Hands On” customer service. Our efficient global network of businesses and technical, supply chain and product support groups allow us to bring solutions to the market quickly. Our entire business, unlike our largest competitors, is focused on lubricants and automotive maintenance, enabling us to stay customer focused.
Our separation from Ashland will provide us the flexibility to invest in Valvoline’s growth initiatives and to act quickly in making decisions for the benefit of the business, our channel partners, customers and shareholders. We will enhance our strategic focus by aligning corporate support functions, such as information technology, human resources and finance, to the distinct needs of our business, providing greater control over both strategy and execution. As a standalone public company, we will be able to more effectively pursue our distinct operating priorities and strategies and our management will be able to solely focus on our opportunities for long-term growth and profitability.
Strong Financial Performance and Free Cash Flow Generation
Our high margin business is able to generate significant free cash flow. Our premium mix improvements, VIOC same-store sales growth, international volume and profit growth and proactive approach to changes in the base oil market resulted in fiscal 2015 Adjusted EBITDA of $422 million and Adjusted EBITDA margin of 21.5%. Strong earnings combined with efficient working capital management have led to high free cash flow, which grew from $133 million in fiscal 2014 to $285 million in fiscal 2015. This strong free cash flow provides us with significant financial flexibility.
99
Table of Contents
OUR BUSINESS AND GROWTH STRATEGY
|
“We are building the world’s leading engine and automotive maintenance business
|
We intend to achieve sustainable growth and profitability by executing the following strategies:
Grow and Strengthen Quick Lube Network
We are committed to growing the footprint of our profitable quick lube network. We expect this growth to be driven by both organic store expansion and opportunistic, high-quality acquisitions in both core and new markets within the VIOC system, as well as strong sales efforts to partner with new Express Care operators. In addition, we plan to continue delivering same-store sales growth within our existing stores.
VIOC Geographic Footprint as of March 31, 2016

| • | Organic Store Expansion: We currently operate 330 company-owned and have an additional 720 franchised quick lube centers across 44 states. Given the strength of our brand and new unit economics, we believe we can continue growing our network in both new and existing company and franchise markets. Independently owned Express Care locations display Valvoline branding in exchange for a contractual obligation to purchase Valvoline motor oil and other products. We believe that continued |
100
Table of Contents
| expansion of our Express Care program will continue to provide wider exposure to our brand by penetrating channels, primarily smaller (typically single store) operators, which do not fit our franchised model and typically offer other non-quick lube services such as auto repair and car washes. |
| • | Opportunistic Acquisitions: There are over 9,000 known quick lube stores in the United States, the ownership of which, excluding the few largest networks of service centers, is largely fragmented. We believe that the large and fragmented nature of the North American quick lube market creates an opportunity for us to grow. Our distribution relationships in the DIFM installer space can be leveraged along with VIOC’s proprietary modeling tools to execute an acquisition strategy for both the larger, known systems, as well as smaller operators. VIOC’s acquisition of Oil Can Henry’s in February 2016 added 89 stores to our Quick Lube portfolio in the Pacific Northwest, Colorado, Arizona and southern California. We expect to continue to opportunistically look at acquisitions as a way of supplementing our organic store growth. |
| • | Continue to Drive Additional Growth and Profitability from Existing Stores: We have generated nine consecutive years of VIOC same-store sales growth. We plan to continue delivering growth through the following strategies: |
| ¡ | Attract New Customers and Increase Customer Satisfaction and Loyalty: We strive to attract new customers through our targeted digital marketing efforts, which allows us to be more efficient and effective in reaching our prospective new customers. Our existing VIOC customers value our proposition as a quick, easy and trusted operator. Our proprietary point-of-sale system allows us to better understand our customers’ needs and develop performance drivers that enhance the productivity of our company-owned and franchised operations. Following the introduction of our enhanced SuperPro 10 in 2006, we have been able to deliver quicker and more consistent service times, and have seen improvements in both our overall customer satisfaction scores and retention. Our “Hands on Expertise” culture and approach has been essential in unifying our 10,000 member team across our approximately 1,050 VIOC company-owned and franchised stores towards delivering a preferred customer experience. |
| ¡ | Increase Average Ticket Size: Between 2007 and 2015, average net ticket at our company-owned VIOC stores increased from $53.22 to $69.07. Given our focus on customer experience, our proprietary point-of-sale system, and our ability to pilot new concepts in our stores, we believe we can continue to strengthen average net ticket through improvements within our selling of premium oils, penetration of extra services, discount efficiency and pricing opportunities. |
Company-Owned Store Sales, 2007 – 2015
101
Table of Contents
Accelerate International Growth across Key Markets
| Our International business currently accounts for
The sales, marketing and distribution capabilities that we |
International Sales Volume (Millions of Gallons) | |
|
| ||
| that large integrated oil brands are more focused on their upstream business in many of our targeted international markets, while local competitors often are not competitive in premium | Note: Volume growth includes nonconsolidated joint ventures. Emerging Markets consist of all countries outside of the U.S., Canada, Australia and Europe. | |
| product categories. Operational expertise will allow us to benefit from these market dynamics at the same time that stricter regulations of emissions and fuel economy are increasing demand for more advanced lubricants. | ||
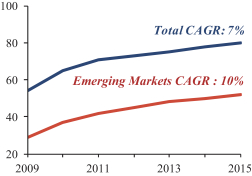
We also plan to expand our presence in the heavy duty lubricant space, which is an important channel in our targeted international markets, by developing products that will lower the total cost of ownership for fleet operators and users of other heavy duty equipment, leveraging our existing relationships with leading OEMs and building and strengthening other OEM relationships. These long-term relationships provide credibility to our International business, and we believe they will allow us to leverage the Valvoline brand to increase growth in key markets globally.
Leverage Innovation to Drive Market Share and Profitability in Core North America
Innovations in product development, packaging and marketing have driven improvements in our product mix, with United States premium-branded lubricant sales volume increasing to approximately 40% of total sales volume in 2015, up from approximately 31% in 2011.
We believe that our focus on innovation will continue to drive premium lubricant mix improvement in addition to increasing sales of our broader product portfolio, such as Valvoline Professional Series service chemicals, coolants, filters and other non-lubricant products. We plan to continue to grow higher margin synthetic sales, consistent with increased customer demand for these products due to OEM requirements.
We intend to leverage our expertise to continue to add significantly more value to our installer customers than our more cost-driven competitors. We do this by sharing our knowledge in sales, marketing and supply chain management to help them grow their businesses through improvements in customer acquisition, retention and sales volume. We believe that our differentiated service approach will allow us to continue to charge premium prices while growing our overall business.
We are also investing in e-commerce solutions with our existing business partners and a new digital infrastructure that will be used across our enterprise. We believe that this digital infrastructure will improve the speed, innovation and efficiency of our business, and also drive more effective customer engagement, acquisition and retention. Being able to interact with our customers when they need information will provide accurate real time access to training, marketing programs, product recommendations and order status and will differentiate us from our competition by building a more efficient customer-facing organization.
102
Table of Contents
SALES AND MARKETING
We place a high priority on sales and marketing and focus our marketing efforts on areas we believe will yield the highest rate of return. We have dedicated marketing resources in each of our business segments, which we believe are well qualified to reach their target customers. The majority of our large customers are supported by our own direct sales representatives with a number of key customers having dedicated Valvoline teams. Consistent with our firm belief and value that it “all starts with our people,” we also have a keen focus on sales force effectiveness, with a cross functional team regularly evaluating the recruiting, compensation, performance management and employee development of our sales teams.
We use a variety of marketing techniques to build awareness of, and create demand for, our products and services. We advertise through social and digital media, as well as traditional media outlets such as television, print and radio. In addition, we selectively sponsor teams in high performance racing series, including a current sponsorship of Hendrick Motorsports, featuring drivers Dale Earnhardt Jr., Chase Elliott, Jimmie Johnson and Kasey Kahne.
We have also embarked on a digital infrastructure initiative that will enable the use of technology across our entire enterprise. We believe our digital marketing infrastructure will drive more effective engagement to deliver growth, customer retention and acquisition as a strategic business partner.
Core North America
The sales organization within our Core North America business is structured around four channels: mid to large regional and national installers, DIY retail, distributors and company-operated direct markets. We place significant emphasis on our large customers. We have approximately 140 third-party distributors that represent our products.
In the installer sales channel, we assist our customers in leveraging our value proposition to help them improve their customer acquisition and retention and premium mix by giving them targeted marketing and promotional tools, which drive their customers to trade up to our higher performing synthetic and other premium products, and purchase additional products. These efforts help improve the return on investment for our installer customers, driving our own revenue and creating a sustainable growth model.
Our marketing campaigns are generally centered on building our brand and communicating the superior performance of our products. These marketing efforts target both consumers and influencers such as countermen, vocational and technical students and grass roots racers. Social media has allowed us to more efficiently reach and engage with our target demographics. For our installer and retail customers, we provide marketing tools that allow them to effectively market our higher margin products to consumers.
Quick Lubes
Our Quick Lubes business uses information stored in our proprietary point-of-sale system to market to VIOC customers, generally through direct marketing, such as mail, e-mail and text messages. We also utilize digital platforms such as Facebook as an overlay to these direct marketing programs. In addition, we conduct post-visit surveys and encourage customers to leave reviews on third-party sites, which boost consumer trust and loyalty. In the future, we expect to use mobile technologies to reach current and potential VIOC customers on a targeted basis at a lower cost.
In addition to marketing targeted at VIOC customers, which helps drive store profitability, the sales organization within our Quick Lubes business plays a critical role in expanding our network of company-owned and franchised VIOC stores and Express Care operators. The team uses proprietary modeling tools to identify organic and external growth opportunities with attractive attributes, working with our store development team to execute growth strategies.
103
Table of Contents
International
In our wholly owned affiliate and joint venture markets, we maintain the sales and marketing teams required to build effective channels in our target markets. For example, in India we have complete teams focused on the commercial and industrial, DIFM and OEM sales channels, with specialists in major sub-markets, such as power generation. This approach lets us build local expertise in local channels and drive for meaningful penetration in our targeted markets. In distributor markets, we rely extensively on the distributor’s local sales capabilities, and provide effective and efficient sales and marketing support, including training, promotions and brand building assistance. In both cases, our global platform, global account and product management organizations help us to leverage our global product knowledge and other capabilities.
MANUFACTURING, SUPPLY CHAIN AND FACILITIES
We have a large manufacturing and distribution footprint in the United States, with additional facilities in various other jurisdictions. In the United States, we have four lubricant blending and packaging plants, three bulk blending and distribution facilities and two distribution centers. We have additional lubricant blending and packaging plants in Australia and the Netherlands. We also have a bulk blending and distribution facility in Canada, a distribution center in the U.K. and leased distribution centers in Australia and the Netherlands. In addition to our owned and leased facilities, we also use numerous toll manufacturers and third-party warehouses.
The key raw materials used by our business are base oils, additives, packaging materials (high density polyethylene bottles and steel drums) and ethylene glycol. We continuously monitor global supply and cost trends of these key raw materials. We obtain these raw materials from a diversified network of large global suppliers and regional providers. Our sourcing strategy is to ensure supply through contracting a diversified supply base while leveraging market conditions to take advantage of spot opportunities whenever such conditions are available. We leverage our worldwide spend to obtain favorable contract terms from the global suppliers and use the regional providers to ensure market competitiveness and reliability in our supply chain. For materials that must be customized for us, we work with market leaders with global footprints and well developed business continuity plans. We also utilize our research and development resources to develop alternative product formulations, which provide flexibility in the event of supply interruptions. We closely monitor our supply chain and conduct annual supply risk assessments of our critical suppliers to reduce risk.
We own or lease approximately 40 facilities throughout the United States, Australia, Brazil, Canada, China, Croatia, India, Indonesia, the Netherlands, New Zealand, the Philippines, Russia, Singapore, the U.K. and Vietnam that comprise over 2,000,000 square feet of blending, packaging, distribution, warehouse and office space. In addition, we own or lease the property associated with approximately 330 quick lubes stores under the VIOC and Oil Can Henry’s brands throughout the United States. The properties leased by us have expiration dates ranging from less than one year to more than 25 years (including certain renewal options). We lease approximately 247,000 square feet for our corporate headquarters in Lexington, Kentucky pursuant to a lease that expires March 31, 2017. We have already entered into a long term lease for a new 162,500 square foot facility in Lexington, Kentucky, which is currently under construction, and we plan to relocate our corporate headquarters to that facility in conjunction with the expiration of our current lease.
104
Table of Contents
The following table provides a summary of our major facilities:
| Location |
Approx. Area (Sq. Ft.) |
Principal Use | |||||
| Leased Properties: |
|||||||
| Sydney, Australia |
60,000 | Blending & Packaging | |||||
| Lexington, Kentucky |
247,000 | Current Corporate Headquarters | |||||
| West Chester, Ohio |
320,000 | Warehouse & Distribution | |||||
| Leetsdale, Pennsylvania |
125,000 | Warehouse & Distribution | |||||
| Willow Springs, Illinois |
95,000 | Blending & Packaging | |||||
| Dordrecht, Netherlands |
150,000 | Blending, Packaging & Warehouse | |||||
| Owned Properties: |
|||||||
| Mississauga, Canada |
63,000 | Warehouse & Distribution | |||||
| Santa Fe Springs, California |
100,000 | Blending & Packaging | |||||
| St. Louis, Missouri |
78,000 | Blending & Packaging | |||||
| Cincinnati, Ohio |
140,000 | Blending, Packaging & Warehouse | |||||
| Freedom (Rochester), Pennsylvania |
88,000 | Blending & Packaging | |||||
| Deer Park, Texas |
87,000 | Blending & Packaging | |||||
In addition, throughout North America, we contract with third parties to provide blending and packaging and warehousing and distribution services. Lastly, we are part of a joint venture that operates a blending and packaging facility in Ambarnath, India and warehouses and distributes products throughout India via numerous facilities around the country.
RESEARCH AND DEVELOPMENT
We believe that innovation is central to the successful performance of our business. As a result, we continually focus on our research and development programs, which are focused on developing new and innovative products to meet the current and future needs of our customers. These products are developed through our “Hands on Expertise” innovation approach, which begins with the mathematical modeling of critical product design elements and extends through field testing. In addition, our technology centers, located in the Americas, Europe and Asia Pacific regions, develop solutions for existing and emerging on and off-road equipment. Our research and development team also leverages our strong relationships with customers and suppliers to incorporate their feedback into the research and development process. In addition to our own research and development initiatives, we also conduct limited testing for other entities, which builds our expertise and partially offsets our own research and development costs.
COMPETITION
We operate in highly competitive markets and face competition in each of our product categories and subcategories. In the United States and Canada, our principal competitors for retail customers are global integrated oil brands, such as Shell, which produces Pennzoil and Quaker State, BP, which produces Castrol, and Exxon Mobil, the producer of Mobil1, mid-tier brands, and private label producers. With respect to installer customers in the United States and Canada, we compete with these major integrated oil brands and regional private label companies.
105
Table of Contents
Our Quick Lubes business competes with other major franchised brands that offer a turn-key operations management system, such as Jiffy Lube (owned by Shell), Grease Monkey and Express Oil Change, as well as national branded companies that offer a professional signage program with limited business model support, similar to our Express Care network, and regional players such as Super-Lube and American Lube Fast that are not directly affiliated with a major brand. We also compete to some degree with automotive dealerships and service stations, which provide quick lube and other preventative maintenance services. We believe there are over 9,000 existing quick lube stores currently operating in the U.S. market. Jiffy Lube is currently the largest player, with just over 1,900 stores, all of which are owned and operated by franchisees.
The major competitors of our International business vary by region. We generally face strong competition from global integrated oil brands, as these companies have a particularly strong presence in Europe and Asia. In certain markets we also compete with regional brands, including brands produced by national oil companies, such as Sinopec in China and Indian Oil in India.
Competitive factors in all of these markets include price, product or service technology, brand awareness and loyalty, customer service, and sales and marketing. Our Core North America and International businesses also compete on the basis of shelf space and product packaging. We believe that we compete effectively with respect to each of these factors.
INTELLECTUAL PROPERTY
We are continually seeking to develop new technology and enhance our existing technology. As of May 2, 2016, we have been issued 33 U.S. and 59 international patents, and we have 11 U.S. and 37 international patent applications pending or published. We also hold approximately 2,450 trademarks in various countries around the world, which we believe are some of our most valuable assets, and we dedicate significant resources to protecting them. These trademarks include the Valvoline trademark and our famous “V” brand logo trademark, which are registered in over 150 countries. We also own over 700 domain names that we use to promote our products and services and provide information about our company.
EMPLOYEES
As of March 31, 2016, we employed approximately 5,600 people, with approximately 4,300 of those employees located in the United States. As of March 31, 2016, approximately 5% of our employees are unionized or have works council representation. We have had no labor-related work stoppages and believe the relationships with our employees to be good.
ENVIRONMENTAL, HEALTH AND SAFETY
We are subject to numerous foreign, federal, state and local EHS laws and regulations. These laws and regulations govern matters such as safe working conditions; product stewardship; air emissions; discharges to the land and surface waters; generation, handling, storage, transportation, treatment and disposal of hazardous substances and waste materials; and the registration and evaluation of chemicals. We maintain policies and procedures to control EHS risks and monitor compliance with applicable EHS laws and regulations. These laws and regulations also require us to obtain, and comply with, permits, registrations or other authorizations issued by governmental authorities. These authorities can modify or revoke our permits, registrations or other authorizations and can enforce compliance through fines and injunctions.
We expect to incur ongoing costs to comply with existing and future EHS requirements, including the cost of a dedicated EHS group that will be responsible for ensuring our business maintains compliance with applicable laws and regulations. This responsibility will be carried out through training; widespread communication of EHS policies; formulation of policies, procedures and work practices; design and implementation of EHS management systems; internal auditing by a separate auditing group; monitoring legislative and regulatory developments that may affect our operations; and incident response planning.
106
Table of Contents
LEGAL PROCEEDINGS
From time to time we are involved in claims and legal actions that arise in the ordinary course of business. We do not have any currently pending claims or litigation which we believe, individually or in the aggregate, will have a material adverse effect on our financial position, results of operations, liquidity or capital resources.
GOVERNMENT REGULATION
We are subject to regulation by various U.S. federal regulatory agencies and by the applicable regulatory authorities in countries in which our products are manufactured and sold. Such regulations principally relate to the ingredients, labeling, packaging, advertising and marketing of our products. In addition, as a result of our commercial operations overseas, we are subject to the Foreign Corrupt Practices Act and other countries’ anti-corruption and anti-bribery regimes, such as the U.K. Bribery Act.
107
Table of Contents
Executive Officers
The following table sets forth the ages, as of May 1, 2016, and names of the individuals who are expected to serve as our executive officers following the completion of this offering.
| Name |
Age | Position(s) | ||
| Samuel J. Mitchell, Jr. |
55 | Chief Executive Officer and Director | ||
| Thomas A. Gerrald II |
51 | |||
| Frances E. Lockwood |
65 | |||
| Heidi J. Matheys |
43 | |||
| Craig A. Moughler |
58 | |||
| Julie M. O’Daniel |
49 | General Counsel & Corporate Secretary | ||
| Anthony R. Puckett |
53 |
Samuel J. Mitchell, Jr. has served as Senior Vice President of Ashland since 2011 and President of Valvoline since 2002. In , 2016, Mr. Mitchell was appointed as a director and our Chief Executive Officer. As our Chief Executive Officer, Mr. Mitchell’s significant experience and knowledge in the areas of finance, accounting, business operations, management, manufacturing, safety, risk oversight and corporate governance, as well as his experience in the lubricants industry, provide him with the qualifications and skills to serve as a director on our board of directors.
Thomas A. Gerrald II has served as Senior Vice President, US Installer Channel, of Valvoline since June 2012. Prior to that, Mr. Gerrald served as Vice President, Supply Chain – Order-To-Cash, of Ashland from October 2010 to June 2012. In , 2016, Mr. Gerrald was appointed as our .
Frances E. Lockwood has served as Senior Vice President, Technology, of Valvoline since May 1994. In , 2016, Mr. Lockwood was appointed as our .
Heidi J. Matheys has served as Senior Vice President, Do-It-Yourself Channels, of Valvoline since August 2013. Ms. Matheys previously served as Vice President, Global Brands, of Valvoline from September 2012 to August 2013. From May 2012 to September 2012, Ms. Matheys was the owner of Empatico LLC, a marketing and consulting firm, and from March 2008 to June 2012, she served as Global Marketing Director at Novartis (Alcon & Cibavision). In , 2016, Ms. Matheys was appointed as our .
Craig A. Moughler has served as Senior Vice President and Managing Director, International, of Valvoline since October 2002. In , 2016, Mr. Moughler was appointed as our .
Julie M. O’Daniel has served as Lead Commercial Counsel of Valvoline since April 2014. Ms. O’Daniel previously served as Litigation Counsel of Valvoline from July 2007 to April 2014. In , 2016, Ms. O’Daniel was appointed as our General Counsel and Corporate Secretary.
Anthony R. Puckett has served as President of Valvoline Instant Oil Change since August 2007. In , 2016, Mr. Puckett was appointed as our .
108
Table of Contents
Board of Directors
The following table sets forth the ages, as of May 1, 2016, and names of the individuals who are expected to serve as our directors following the completion of this offering.
| Name |
Age | Position(s) | ||
| William A. Wulfsohn |
54 | Non-Executive Chairman and Director | ||
| Samuel J. Mitchell, Jr. |
55 | Chief Executive Officer and Director |
William A. Wulfsohn has served as a director and Non-Executive Chairman of Valvoline since , 2016. Mr. Wulfsohn has also served as Chairman and Chief Executive Officer of Ashland since January 1, 2015. Prior to joining Ashland, Mr. Wulfsohn served as President and Chief Executive Officer of Carpenter Technology Corp., a manufacturer of stainless steel, titanium, and other specialty metals and engineered products, from July 2010 to December 2014. Mr. Wulfsohn also served as a director for Carpenter Technology Corp. from April 2009 to December 2014.
As the Chairman and Chief Executive Officer of Ashland, Mr. Wulfsohn’s experience and knowledge in the areas of finance, accounting, business operations, management, manufacturing, safety, risk oversight and corporate governance provide him with the qualifications and skills to serve as a director on our board of directors. He also brings significant experience gained from service on the board of directors of other companies.
Composition of the Board of Directors
Our board of directors currently consists of members, of whom qualify as “independent” under NYSE rules, and of whom are affiliated with Ashland.
Our directors will be elected at each annual meeting of shareholders and will hold office until the next annual meeting of shareholders and until each of their successors has been duly elected and qualified. The vote required for any election of directors, other than in a contested election of directors, will be the affirmative vote of a majority of the votes cast with respect to a director nominee. In any contested election of directors, the persons receiving the greatest number of votes cast, up to the number of directors to be elected in such election, will be deemed elected. Our amended and restated by-laws will provide that the authorized number of directors may only be changed by a resolution adopted by a majority of our board of directors; provided, however, that a shareholder vote will be required to increase or decrease the number of directors by more than 30% from the number of directors last fixed by the shareholders.
Status as a “Controlled Company” under NYSE Listing Standards
We have applied to list our common stock on the NYSE. Because Ashland controls a majority of our outstanding voting power, we are a “controlled company” under the NYSE corporate governance rules. As a controlled company, we will be eligible for exemptions from some of the requirements of these rules, including:
| • | the requirement that a majority of our board of directors consist of independent directors; |
| • | the requirement that our governance and nominating committee be composed entirely of independent directors with a written charter addressing the committee’s purpose and responsibilities; |
| • | the requirement that our compensation committee be composed entirely of independent directors with a written charter addressing the committee’s purpose and responsibilities; and |
| • | the requirement for an annual performance evaluation of our nominating and governance and compensation committees. |
109
Table of Contents
Consistent with these exemptions, upon listing with the NYSE we do not intend to have (i) a majority of independent directors on our board of directors; (ii) a fully independent compensation committee; or (iii) a fully independent nominating and governance committee.
Committees of the Board of Directors
The standing committees of our board of directors are as described below.
Audit Committee
The Audit Committee will initially be composed of . The Audit Committee will perform the duties set forth in its written charter, which will be available at our website upon consummation of this offering. The primary responsibilities of the Audit Committee will include:
| • | overseeing management’s establishment and maintenance of adequate systems of internal accounting and financial controls; |
| • | reviewing the effectiveness of our legal and regulatory compliance programs; |
| • | overseeing our financial reporting process, including the filing of financial reports; and |
| • | selecting independent auditors, evaluating their independence and performance and approving audit fees and services performed by them. |
The Audit Committee will be comprised of directors, of whom will be “independent” under the listing standards of the NYSE, and meet the requirements of Rule 10A-3 under the Exchange Act. Within one year following completion of this offering, our audit committee will include at least three directors, each of whom will be independent under the NYSE corporate governance rules and Exchange Act Rule 10A-3. The Audit Committee will be comprised of at least one “financial expert” as prescribed under the Exchange Act. We intend to appoint these directors to serve on our board of directors and the Audit Committee as soon as practicable after completion of this offering.
Compensation Committee
The Compensation Committee will initially be composed of . The Compensation Committee will perform the duties set forth in its written charter, which will be available at our website upon consummation of this offering. The primary responsibilities of the Compensation Committee will include:
| • | ensuring our executive compensation programs are appropriately competitive, support organizational objectives and shareholder interests and emphasize pay for performance linkage; |
| • | evaluating and approving compensation and setting performance criteria for compensation programs for our chief executive officer and other executive officers; and |
| • | overseeing the implementation and administration of our compensation plans. |
As a “controlled company,” we will not be required to have a compensation committee comprised entirely of independent directors.
Governance and Nominating Committee
The Governance and Nominating Committee will initially be composed of . The Governance and Nominating Committee will perform the duties set forth in its written charter, which will be available at our website upon consummation of this offering. The primary responsibilities of the Governance and Nominating Committee will include:
| • | recommending nominees for our board of directors and its committees; |
| • | recommending the size and composition of our board of directors and its committees; |
110
Table of Contents
| • | reviewing our corporate governance guidelines, corporate charters and proposed amendments to our articles of incorporation and by-laws; and |
| • | reviewing and making recommendations to address shareholder proposals. |
As a “controlled company,” we will not be required to have a governance and nominating committee comprised entirely of independent directors.
Director Compensation
We are currently developing a compensation program for members of our board of directors other than those who are employed by Ashland or us.
111
Table of Contents
Background
We currently operate as a business unit of Ashland and not as an independent company, and our Compensation Committee is not expected to begin meeting until after this offering. As a result, Ashland has determined the compensation of those individuals who are expected to be designated as our executive officers, and will continue to do so until the completion of this offering. In compliance with SEC rules, the information included in this section is historical. We may implement changes to our executive compensation policies and programs in connection with or following this offering. For more information, see “—Compensation Program of Valvoline Following the Spin-Off.”
For purposes of this Compensation Discussion and Analysis and the tabular executive compensation disclosures that follow, the individuals listed below are collectively referred to as Valvoline’s “named executive officers.” They include Samuel J. Mitchell, Jr., Senior Vice President and President of Valvoline, who will serve as our Chief Executive Officer following this offering, and, of the other individuals who are expected to be designated as our executive officers, the three most highly compensated individuals (other than Mr. Mitchell), based on fiscal 2015 reported compensation from Ashland.
Samuel J. Mitchell, Jr., Senior Vice President of Ashland and President of Valvoline;
Craig A. Moughler, Senior Vice President & Managing Director International of Valvoline;
Frances E. Lockwood, Senior Vice President, Technology of Valvoline; and
Heidi J. Matheys, Senior Vice President, DIY Channels of Valvoline
Additional information regarding the other members of our management who are expected to be designated as executive officers is set forth in the section of this prospectus titled “Management—Executive Officers.”
As described above, this Compensation Discussion and Analysis generally discusses the historical compensation practices of Ashland. Since Mr. Mitchell is an executive officer of Ashland, his fiscal 2015 compensation was determined by the Personnel & Compensation Committee of Ashland’s board of directors (the “P&C Committee”). The fiscal 2015 compensation of Mr. Moughler and Mses. Lockwood and Matheys was generally determined by Mr. Mitchell with the review and approval of the Chief Executive Officer of Ashland, as discussed further in this Compensation Discussion and Analysis.
Executive Summary
Ashland’s executive compensation program is designed to attract, motivate and retain individuals with the skills required to formulate and drive Ashland’s strategic direction and achieve short-term and long-term performance goals necessary to create shareholder value. The program seeks to align executive compensation with shareholder value on an annual and long-term basis through a combination of the following types of compensation: base pay, short-term incentive compensation awards and long-term incentive equity compensation awards which are composed primarily of stock appreciation rights (“SARs”), restricted stock (“RS”), performance units (“Performance Units”) and, beginning in fiscal 2016, restricted stock units (“RSUs”) in lieu of RS.
Key Executive Compensation Objectives
Ashland aligns executive compensation and shareholder value by providing competitive incentives composed of time-based and performance-based incentives to achieve short-term and long-term performance goals. Indicative of this alignment is the mix of at-risk compensation (annual incentive, SARs, RS/RSUs and
112
Table of Contents
Performance Units) for Mr. Mitchell. Assuming target performance, 69% of Mr. Mitchell’s fiscal 2015 Total Direct Compensation (as defined in “—Pay Mix of Ashland Executive Compensation Program”) is at risk, allocated as follows: (i) 41% to long-term incentives (SARs, RS/RSUs and Performance Units), (ii) 28% to short-term incentives and (iii) 31% to base salary. Additional pay mix information is also shown below in “—Pay Mix of Ashland’s Executive Compensation Program.”
The metrics used in the short-term and long-term performance based incentives are as follows:
Annual Incentive Compensation Plan. The Annual Incentive Compensation Plan is composed of two financial components, Operating Income and Working Capital Efficiency (as each is defined in “—Annual Cash Compensation-Annual Incentive Compensation”), and a safety modifier. These performance measures are company-wide and/or specific to the business segment to which an executive is assigned. These financial performance measures are structured so that the cash compensation of most Ashland employees, including Valvoline named executive officers, is aligned with key Ashland objectives.
Long-Term Incentive Plan (“LTIP”). The LTIP, granted as Performance Units, has two financial performance measures, Return on Investment (“ROI”) and Total Shareholder Return (“TSR”) (as each is defined in “—Long-Term Equity Incentive Plan—2015-2017 LTIP Performance Units”). For eligible executives, these performance measures apply at the Ashland level, not at the business segment levels. This provides a strong alignment between long-term executive compensation and shareholder value.
Ashland also has several governance practices in place to align executive compensation with shareholder interests and mitigate risks in its plans. These practices include: stock ownership guidelines, limited perquisites, tally sheets, an anti-hedging policy, an anti-pledging policy and a clawback policy. Tally sheets have not been utilized with respect to the Valvoline named executive officers.
Compensation Decisions for Fiscal 2015
Base Pay. Ashland utilizes merit increase guidelines based on an individual’s performance and his or her position relative to the market competitive benchmarking to formulate merit increase recommendations. All employees, including the Valvoline named executive officers, are subject to the same merit increase guidelines.
Annual Incentive Compensation Plan. The fiscal 2015 target incentive opportunities for all Valvoline named executive officers remained the same as fiscal 2014. The P&C Committee established performance targets for two financial performance measures and the safety modifier at the beginning of the fiscal year. Based on Ashland’s performance in fiscal 2015 compared to the performance goals established at the beginning of the fiscal year, the P&C Committee approved incentive compensation payouts at 123.90%, 123.68%, 123.90% and 139.40% of the target incentive opportunity for Mr. Mitchell, Mr. Moughler, Ms. Lockwood and Ms. Matheys, respectively.
Long-Term Incentive Plan. The Performance Units paid under the LTIP for the performance period of fiscal 2013 through fiscal 2015 were approved by the P&C Committee in November 2015. This LTIP performance plan paid out at a weighted score of 97.8% of Performance Units granted, with the ROI portion scoring at 50.4% and the TSR portion scoring at 145.2%.
Long-Term Incentive Equity Grants. For fiscal 2015, the long-term incentive equity grant was composed of SARs, RS and Performance Units. The number of SARs granted was determined using a Black-Scholes methodology. The number of RS and Performance Units granted was determined by using the average closing stock price for the 20 business days ending on September 30 of the prior fiscal year. For Valvoline’s named executive officers, total long-term incentive equity grant target values have an allocation of 25% to SARs, 25% to RS and 50% to Performance Units. Beginning in fiscal 2016, Ashland began offering RSUs in lieu of RS grants.
In connection with being named to Ashland’s Executive Committee on May 1, 2015, Mr. Mitchell received an RS award of 8,000 shares ($957,600 approximate grant date fair value) on July 15, 2015.
113
Table of Contents
Principles and Objectives of Ashland’s Executive Compensation Program
The core principles of Ashland’s approach to executive compensation design and evaluation are as follows:
| • | Programs should create alignment between the interests of the executives and the shareholders by providing compensation opportunities for executives that are linked to building long-term shareholder value through the achievement of the financial and strategic objectives of Ashland. |
| • | Programs should provide competitive, market-driven compensation to attract and retain executive talent for the long term. |
| • | Compensation should generally be targeted at the median of the market when compared to the compensation of individuals in similar-sized organizations in the chemical industry as well as in the general industry. |
| • | The concept of opportunity is important. Individuals should have the opportunity to do well when Ashland does well and total compensation should vary in relation to Ashland’s performance. |
| • | There should be a balance between fixed and variable compensation, with variable compensation constituting a larger portion of an executive’s total compensation the more senior the executive. The targeted pay mix for an executive should also be aligned with market competitive practices. |
| • | Programs should promote ownership of Ashland stock to further align the interests of management and shareholders. |
| • | Incentive compensation should not promote unreasonable or excessive risk taking that could threaten the short- or long-term value of Ashland. |
The P&C Committee is responsible for the approval and administration of compensation programs for executive officers and certain other employees of Ashland. The P&C Committee frequently reviews Ashland’s compensation practices, and its decisions take into consideration, among other things, Ashland’s compensation philosophy, its financial and operating performance, individual performance, practices and compensation levels of peer companies and the voting guidelines of certain proxy advisory firms and shareholders. See “Management—Committees of the Board of Directors—Compensation Committee” for a discussion of our Compensation Committee’s role in the executive compensation process.
The Chief Executive Officer of Ashland (and, in certain instances, the other members of the Ashland Executive Committee), in consultation with the P&C Committee’s independent executive compensation consultant and Ashland’s Chief Human Resources and Communications Officer, develops compensation recommendations for the P&C Committee’s consideration, including:
| • | business performance targets and objectives that are tied to Ashland’s annual and long-term incentive plans; |
| • | plan design changes based on competitive analysis of executive pay practices; |
| • | individual performance evaluations; |
| • | recommendation of base salary and target bonus opportunities; |
| • | the mix of RS/RSUs, SARs and Performance Units grants; |
| • | recommendation of adjustments to the reported financial results for purposes of determining annual and long-term incentive payments; and |
| • | recommendation of adjustments to awards. |
The Chief Executive Officer of Ashland takes various factors into consideration when making individual compensation recommendations including: the relative importance of the executive’s position within the organization; the individual tenure and experience of the executive; and the executive’s individual performance and contributions to Ashland’s financial and operating results.
114
Table of Contents
Independent Executive Compensation Consultant’s Role
The P&C Committee directly engages Deloitte Consulting LLP (“Deloitte” or the “compensation consultant”) to serve as the outside advisor on executive compensation matters and to review Ashland’s executive compensation program. The assessment consists of reviews of:
| • | the competitiveness of compensation provided to Ashland’s key executives; |
| • | Ashland’s benchmark group for pay and performance comparisons; |
| • | Ashland’s executive stock ownership guidelines; |
| • | Ashland’s executive change in control agreements for key executives; |
| • | Ashland’s incentive compensation programs for risk; |
| • | the degree of difficulty of the performance targets under the incentive compensation plan; and |
| • | the alignment of pay for performance by analyzing the targets to actual compensation. |
Deloitte’s engagement includes the following ongoing work on behalf of the P&C Committee: review of competitive pay practices for outside board members; as needed, reviews of other components of Ashland’s compensation programs including: benefits, perquisites, deferred compensation plans, severance policies and change in control provisions; updates regarding trends in executive and outside board compensation practices; and updates regarding changes in regulatory and legislative developments. Deloitte’s aggregate fees for Ashland executive and director compensation services in fiscal 2015 were $319,676.
In addition to the compensation services provided by Deloitte to the P&C Committee, Deloitte affiliates provided certain services to Ashland at the request of management consisting of (i) tax services and other tax-related services, and (ii) auditing services. Ashland paid $6.5 million to Deloitte in fiscal 2015 for these other services. The P&C Committee believes that, given the nature and scope of these projects, these additional services did not raise a conflict of interest and did not impair Deloitte’s ability to provide independent advice to the P&C Committee concerning Ashland executive compensation matters. In making this determination, the P&C Committee considered, among other things, the following factors: (i) the types of non-compensation services provided by Deloitte, (ii) the amount of fees for such non-compensation services, noting in particular that such fees are negligible when considered in the context of Deloitte’s total revenues for the period, (iii) Deloitte’s policies and procedures concerning conflicts of interest, (iv) Deloitte representatives who advise the P&C Committee do not provide any non-compensation related services to Ashland, (v) there are no other business or personal relationships between Ashland management or members of the P&C Committee, on the one hand, and any Deloitte representatives who provide compensation services to Ashland, on the other hand, and (vi) neither Deloitte nor any of the Deloitte representatives who provide compensation services to Ashland own any common stock or other securities of Ashland.
On January 27, 2016, the P&C Committee approved the engagement of Deloitte compensation consultants to serve as an outside advisor on the design of compensation programs for Valvoline in connection with the separation of Ashland into two independent, publicly traded companies.
115
Table of Contents
Factors Considered in Determining Executive Compensation
Competitive Benchmarking
The P&C Committee annually reviews competitive compensation information in order to evaluate if executive pay levels are market competitive and consistent with Ashland’s stated compensation philosophy. Competitive compensation information is composed of both industry-specific and general industry company data because Ashland competes for executive talent among a broad array of companies, both within and outside of the chemical industry. The competitive data is size-adjusted based on revenues and a statistical regression analysis that is consistent with the corporate or business segment responsibilities for each executive. The general industry and industry specific data are weighted equally in developing the competitive market data for each position. The competitive pay data has been gathered from the Towers Watson 2014 CDB General Industry Executive Compensation Survey. The industry specific companies that participated in the survey, which had revenues ranging from $0.8 billion to $14.2 billion in calendar year 2014, are set forth below:
| • Air Products & Chemicals Inc. |
• Ecolab Inc. | |
| • Americas Styrenics LLC |
• EMD Millipore | |
| • Arkema Inc. |
• Huntsman Corporation | |
| • Axiall Corporation |
• International Flavors & Fragrances Inc. | |
| • Cabot Corporation |
• Platform Specialty Products Corporation | |
| • Celanese Corporation |
• PolyOne Corporation | |
| • CF Industries Holdings, Inc. |
• Praxair, Inc. | |
| • Chemtura Corporation |
• The Mosaic Company | |
| • Dow Corning Corporation |
• Westlake Chemical Corporation | |
| • Eastman Chemical Company |
• W.R. Grace and Company |
Given the differences between the expected revenues of Valvoline and Ashland, as well as other relevant factors that impact executive compensation, we expect that the group of peer companies selected by our Compensation Committee following completion of this offering may differ from Ashland’s peer group, although some of Ashland’s peer companies may continue to serve as peer companies for us.
Individual Performance Evaluations
At the beginning of each fiscal year, Mr. Mitchell jointly sets his annual, individual performance objectives with the Chief Executive Officer of Ashland. Mr. Mitchell’s performance against his objectives is reviewed throughout the year on a quarterly basis. At the end of each fiscal year, the Chief Executive Officer of Ashland conducts a final review with Mr. Mitchell and rates his performance using a scale that ranges between “Greatly Exceeds Expectations” and “Does Not Meet Expectations.” In January 2015, the Chief Executive Officer of Ashland submitted a performance assessment and compensation recommendation for Mr. Mitchell to the Ashland P&C Committee for review and approval. The performance evaluations were based on factors such as achievement of company and individual objectives, as well as contributions to the financial and EHS performance of Ashland. Individual performance of Mr. Mitchell is used by the Chief Executive Officer of Ashland in consideration of individual merit-based salary increases.
At the beginning of each fiscal year, the Valvoline named executives officers (other than Mr. Mitchell) jointly set their annual, individual performance objectives with Mr. Mitchell. Each Valvoline named executive officer’s performance against his or her objectives is reviewed throughout the year on a quarterly basis. At the end of each fiscal year, Mr. Mitchell conducts a final review with each Valvoline named executive officer and rates his or her performance using a scale that ranges between “Greatly Exceeds Expectations” and “Does Not Meet Expectations.” In March 2015, Mr. Mitchell submitted a performance assessment and compensation recommendation for each of the Valvoline named executive officers (other than himself) to the Chief Executive Officer of Ashland for review and approval. The performance evaluations were based on factors such as
116
Table of Contents
achievement of company and individual objectives, as well as contributions to the financial and EHS performance of Valvoline. Individual performance of the Valvoline named executive officers (other than his own) is used by Mr. Mitchell in consideration of individual merit-based salary increases.
Elements of Ashland’s Executive Compensation Program
Ashland’s executive compensation program includes the following elements:
| • | Annual Cash Compensation |
| ¡ | Base Salary |
| ¡ | Annual Incentive Compensation |
| • | Long-Term Incentive Equity Compensation |
| ¡ | Performance Units |
| ¡ | Stock Appreciation Rights |
| ¡ | Restricted Stock/Restricted Stock Units |
| • | Retirement Benefits |
| • | Health and Welfare Benefits |
| • | Executive Perquisites |
| • | Severance Pay Plan |
| • | Change in Control Agreements |
Pay Mix of Ashland’s Executive Compensation Program
For fiscal 2015, Total Direct Compensation* was generally targeted at the 50th percentile of similarly sized companies in the specialty chemical and general industries. For instance, base salary represented 31% of Mr. Mitchell’s target Total Direct Compensation. The following charts show the fiscal 2015 total direct compensation mix (based on targeted compensation) for Mr. Mitchell and the average mix for Valvoline’s other named executive officers.
Mr. Mitchell
Total Direct Compensation Mix
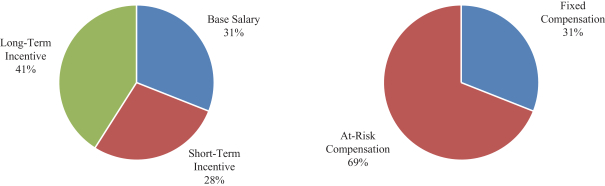
117
Table of Contents
Other Valvoline Named Executive Officers
Total Direct Compensation Mix
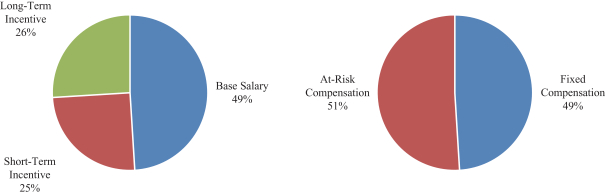
| * | Total Direct Compensation represents the sum of base salary, target annual incentive, and target long-term incentive. Base salary is the only fixed compensation component. |
Annual Cash Compensation
Annual cash compensation consists of market competitive base salary and short-term incentive compensation.
Base Salary
Base salaries are the foundation for the compensation programs provided to the Valvoline named executive officers, as short-term incentive payments, long-term incentive grants and most employee benefits are linked to base salary. Base salary is designed to compensate executives for services rendered during the fiscal year and for their sustained performance. Base salaries are targeted at the 50th percentile of salaries paid to individuals having similar jobs in similarly sized companies in the specialty chemical and general industries.
Ashland believes that base salary is within the range of competitive practice if it is 20% above or below the desired target.
Base salary increases are a reflection of an individual’s performance and pay relative to the base salary range midpoint for his or her position. The merit increase process (merit guideline) that is used for most employees, including the Valvoline named executive officers, provides for greater increases to the highest-performing employees, up to the salary range maximum. The merit guideline also provides for greater increases to employees who are below their base salary range midpoint and are meeting acceptable performance levels. For fiscal 2015, the merit guideline provided for increases between 0% and 6%, depending on an individual’s performance and their position relative to the base salary range midpoint for their job.
The Chief Executive Officer of Ashland used the merit guideline as the basis for his base salary increase recommendations for Mr. Mitchell. The Chief Executive Officer of Ashland has the discretion to adjust merit increase recommendations from the merit guideline suggested amount based upon such factors as internal equity and individual performance. The P&C Committee reviews the market data provided by the compensation consultant and the individual performance evaluations and merit increase recommendations submitted by the Chief Executive Officer of Ashland to approve base salary increases for the Ashland named executive officers and other corporate officers.
118
Table of Contents
The Chief Executive Officer of Ashland recommended a 3.5% base salary increase for Mr. Mitchell, effective April 2015. In accordance with the merit guidelines, Mr. Mitchell recommended base salary increases of 2.0%, 2.5% and 2.5%, respectively, for Mr. Moughler and Mses. Lockwood and Matheys, effective April 2015.
Annual Incentive Compensation
The annual cash incentive is designed to compensate executives, including the Valvoline named executive officers, for the achievement of annual, primarily short-term performance goals. The plan provides an opportunity for each participant to earn a targeted percentage of base salary based on achievement of company-wide or business unit performance targets. The table below reflects targeted annual incentive opportunity for fiscal 2015.
| Named Executive Officer |
Annual Incentive Target as a Percentage of Base Salary |
Target Annual Incentive |
||||||
| Mr. Mitchell |
90 | % | $ | 392,040 | ||||
| Mr. Moughler |
50 | % | $ | 141,835 | ||||
| Ms. Lockwood |
50 | % | $ | 131,330 | ||||
| Ms. Matheys |
50 | % | $ | 131,330 | ||||
In November 2014, the P&C Committee reviewed and approved measures and target performance levels for the fiscal 2015 Annual Incentive Compensation Plan. The approved performance measures were Operating Income and Working Capital Efficiency. The Operating Income measurement is an indication of the profitability of Ashland and each business unit. Operating Income may be adjusted by the P&C Committee for unplanned or one-time items, such as gains or losses on the disposition of assets, impairment or restructuring charges or gain on divestitures of major businesses. The Working Capital Efficiency measurement focused on three key cash flow drivers (accounts receivable, inventory and accounts payable) and was measured as a percentage of sales. This measurement was chosen because Working Capital Efficiency, like Operating Income, was viewed as an important measure of Ashland’s ability to optimize cash flow and value.
The P&C Committee believes the use of both of these measures helps balance management decision-making on both profit growth and working capital management. The P&C Committee also believes that these objectives represent measures that are important to Ashland’s shareholders. The weighting and business unit focus of the measures for Mr. Mitchell and Ms. Lockwood for fiscal 2015 was 20% weight on Ashland’s Operating Income Performance, 70% weight on Valvoline’s Operating Income Performance and 10% weight on Valvoline’s Working Capital Efficiency Performance. The weighting and business unit focus of the measures for Mr. Moughler for fiscal 2015 was 10% weight on Ashland’s Operating Income Performance, 40% weight on Valvoline’s Operating Income Performance, 40% weight on Valvoline’s International & OEM Operating Income Performance and 10% weight on Valvoline’s Working Capital Efficiency Performance. The weighting and business unit focus of the measures for Ms. Matheys for fiscal 2015 was 10% weight on Ashland’s Operating Income Performance, 40% weight on Valvoline’s Operating Income Performance, 40% weight on Valvoline’s Do-It Yourself Operating Income Performance and 10% weight on Valvoline’s Working Capital Efficiency Performance.
For each of the measures described above, the P&C Committee established a minimum (hurdle), target and maximum performance level. For fiscal 2015, the target annual incentive opportunity was positioned at approximately the 50th percentile in order to drive financial performance and align compensation with market competitive practices. To assess the rigors of the goals under the 2015 Annual Incentive Plan, the P&C Committee compared Ashland’s 2015 performance targets to actual fiscal 2014 results, to the fiscal 2015 operating plan and to EBITDA goals. The targets may be less than the prior year targets due to the sale of the Water Technologies business unit in fiscal 2014. Based on this review, the P&C Committee confirmed that Ashland’s targeted level of performance required high levels of performance in order to achieve target-level incentive award payouts.
119
Table of Contents
Consistent with past practice and based on a core set of principles and adjustment criteria established at the beginning of the performance period, the P&C Committee adjusted the results on which fiscal 2015 operating income incentives were determined to account for key items and management adjustments such as the effect of foreign exchange, pension actuarial gain, restructuring severance costs, integration expenses and the sale of the Elastomers division. These adjustments are consistent with established policy. The adjustments were structured so that award payments represent the underlying performance of the business and are not artificially inflated or deflated due to such items. Adjustments are reviewed thoroughly as soon as practical after they are identified. Working Capital Efficiency was adjusted for the effect of foreign currency fluctuations.
On an adjusted basis, Operating Income performance for fiscal 2015 relative to target was as follows:
Operating Income Performance and Incentive Compensation Scores
FY2015—Adjusted
($, Thousands)
| Operating Unit |
Hurdle (20% Payout) |
Target (100% Payout) |
Maximum (155.5% Payout)* |
Adjusted Operating Income |
Operating Income Component Percent of Target Award Earned |
|||||||||||||||
| Valvoline |
$ | 267,671 | $ | 356,894 | $ | 428,273 | $ | 380,832 | 118.6 | % | ||||||||||
| Ashland Inc. |
$ | 623,436 | $ | 815,082 | $ | 968,411 | $ | 827,610 | 104.5 | % | ||||||||||
| * | The maximum payout for Operating Income is 155.5% because the maximum payout for Working Capital Efficiency is 100% (see below). If Ashland or a business unit achieved maximum performance for both measures, the maximum payout would be 150%. |
For fiscal 2015, the Working Capital Efficiency measure was limited to a 100% payout. The 100% payout level is both the targeted performance level and maximum payout of the component. Working Capital Efficiency performance for fiscal 2015 relative to target was as follows:
Working Capital Efficiency (“WCE”) Performance and Incentive Compensation Scores
FY2015—Adjusted
| Operating Unit |
Hurdle (20% Payout) |
Target and Maximum (100% Payout) |
WCE | WCE Component Percent of Target Award Earned |
||||||||||||
| Valvoline |
15.50 | % | 14.90 | % | 13.60 | % | 100.0 | % | ||||||||
| Ashland Inc. |
19.34 | % | 18.60 | % | 19.08 | % | 48.4 | % | ||||||||
120
Table of Contents
To reflect the importance of safety matters within Ashland, a safety modifier may be added or deducted up to 10 percentage points based on a combination of the Operating Unit’s Total Recordable Rate (“TRR”) and safety activity based performance by the executive. The safety modifier may not increase the incentive paid above 150% of target. The safety modifier adjusted the incentive compensation earned by the Valvoline named executive officers as follows:
| Named Executive Officer |
Positive 10 Percentage Points added if TRR was less than |
No adjustment if TRR is between |
Negative 10 Percentage Points added if TRR was more than |
TRR Achieved |
Safety Modifier Percentage Points Earned |
|||||||||||||||
| Mr. Mitchell |
1.83 | 1.84-2.35 | 2.36 | 1.80 | 10pts | |||||||||||||||
| Mr. Moughler |
1.83 | 1.84-2.35 | 2.36 | 1.80 | 10pts | |||||||||||||||
| Ms. Lockwood |
1.83 | 1.84-2.35 | 2.36 | 1.80 | 10pts | |||||||||||||||
| Ms. Matheys |
1.83 | 1.84-2.35 | 2.36 | 1.80 | 10pts | |||||||||||||||
Based on these results, the annual incentives earned for fiscal 2015 performance under the 2015 Annual Incentive Plan were as follows:
| Named Executive |
Annual Incentive Target as a Percentage of Base Salary |
Target Annual Incentive |
Percent of Target Annual Incentive Earned* |
Actual Annual Incentive Paid |
||||||||||||
| Mr. Mitchell |
90 | % | $ | 392,040 | 123.90 | % | $ | 485,816 | ||||||||
| Mr. Moughler |
50 | % | $ | 141,835 | 123.68 | % | $ | 175,436 | ||||||||
| Ms. Lockwood |
50 | % | $ | 131,330 | 123.90 | % | $ | 162,745 | ||||||||
| Ms. Matheys |
50 | % | $ | 131,330 | 139.40 | % | $ | 183,088 | ||||||||
| * | Includes safety modifier for all named executive officers. |
The actual payout levels for the annual incentive compensation plan vary from year to year and have averaged 75% at the Ashland Inc. level for the last five years as shown in the chart below. The P&C Committee believes the variability in actual payouts demonstrates the degree of rigor built into the annual performance targets.
| Incentive Compensation (Fiscal Year) |
Weighted Score as a % of Target (100% Payout) at Ashland Level* |
|||
| 2015 |
98.9 | % | ||
| 2014 |
105.4 | % | ||
| 2013 |
7.2 | % | ||
| 2012 |
91.2 | % | ||
| 2011 |
72.1 | % | ||
| * | Weighted Score as a % of target includes the safety modifier discussed above, if earned. |
Long-Term Incentive Equity Compensation
Ashland’s long-term incentive equity compensation is designed to reward key employees for achieving and exceeding long-term goals and driving shareholder return. It is also designed to foster stock ownership among executives. The performance measures used in Ashland’s long-term program are different than those used in the annual incentive program. This is an intentional design element. The P&C Committee believes that shareholders’ interests are best served by balancing the focus of executives’ decisions between short-term and longer-term measures. Long-term incentive equity compensation is composed primarily of three elements: SARs, RS/RSUs and Performance Units. Additional RS/RSUs can also be granted on a selective basis, for example, in connection with recruitment, retention and promotions.
121
Table of Contents
An overall long-term incentive equity target opportunity is established based on competitive data, current base salaries and pay band or position. The total long-term incentive equity target guideline for Mr. Mitchell for fiscal 2015 was 135% of base salary. The target long-term incentive opportunity for each of Mr. Moughler and Mses. Lockwood and Matheys was $142,000. The total long-term incentive equity target is allocated 25% to SARs, 25% to RS/RSUs and 50% to Performance Units.
Performance Units - LTIP
The LTIP for certain Ashland key employees, including the Valvoline named executive officers, is a long-term equity incentive plan tied to Ashland’s overall financial and total shareholder return performance. It is designed to encourage and reward executives for achieving long-term performance that meets or exceeds absolute and/or relative financial and total shareholder return performance targets.
Grants under the LTIP are made annually, with each grant subject to a three-year performance cycle. The number of units granted is based on a fixed dollar amount or the greater of targeted percentage of the employee’s base salary and a market competitive benchmark and valued by the average of the closing prices of Ashland common stock for the last 20 business days of the prior fiscal year. Grants under the LTIP are not adjusted for, nor entitled to receive, cash dividends during the performance period.
2015-2017 LTIP Performance Units
The following calculation showing how Mr. Mitchell’s target fiscal 2015-2017 LTIP grant was determined is illustrative of the overall grant determination process:
| Mr. Mitchell’s market competitive benchmark determined as of November 12, 2014 |
$ | 426,294 | ||
| LTIP target as a percent of salary: |
67 | % | ||
|
|
|
|||
| Target fiscal 2015–2017 LTIP value: |
$ | 285,617 | ||
| Target fiscal 2015–2017 grant: $285,617/$107.10* = 2,700 Performance Units (rounded up to the next increment of 50) |
| * | Average of closing prices of Ashland common stock for the 20 business days ended September 30, 2014. The 20 business day average is used to reduce stock volatility and better represents Ashland’s stock price. |
Actual grants under the fiscal 2015-2017 LTIP to the Valvoline named executive officers were as follows:
| Named Executive Officer |
LTIP Target ($ or % of Salary) |
Number of LTIP Units Granted |
||||||
| Mr. Mitchell |
67.0 | % | 2,700 | |||||
| Mr. Moughler |
$ | 71,000 | 700 | |||||
| Ms. Lockwood |
$ | 71,000 | 700 | |||||
| Ms. Matheys |
$ | 71,000 | 700 | |||||
In November 2014, the P&C Committee reviewed and approved measures and target performance levels for the fiscal 2015-2017 LTIP. The performance period for this LTIP began on October 1, 2014 and ends on September 30, 2017. For all participants, including the Valvoline named executive officers, the performance measures are Ashland’s ROI and Ashland’s TSR performance. Each of the performance measures in the LTIP is weighted equally and evaluated separately. In choosing these measures, the P&C Committee considered the performance measures used in the other components of Ashland’s executive compensation programs. The P&C Committee believes that ROI and TSR represent an appropriate balance to the shorter-term operating income and working capital efficiency measures used in the annual incentive plan. By balancing the performance measures used, the overall program design encourages management to focus on the overall performance of Ashland and on value creation for Ashland’s shareholders.
122
Table of Contents
ROI is an absolute performance measurement of the effective use of capital, and it is generally determined by dividing net income over a specified performance period (excluding certain key items as disclosed in Ashland’s financial statements and management exceptions) by the average equity and debt outstanding over such period. Consistent with past practice and based on a core set of principles and adjustment criteria established at the beginning of the performance period, the P&C Committee adjusted the results on which fiscal 2014 and 2015 operating income incentives were determined to account for the effect of foreign exchange, pension actuarial gain, restructuring severance costs, integration expenses and the sale of the Elastomers division. These adjustments are consistent with established policy. The adjustments were intended to ensure that award payments represent the underlying performance of the business and are not artificially inflated or deflated due to such items. Adjustments are reviewed thoroughly as soon as practical after they are identified.
TSR is a measure of shareholder value creation, defined as the change in Ashland’s stock price plus aggregate dividend payments over a specified performance period divided by the stock price at the beginning of the performance period. Ashland’s TSR performance for the fiscal 2015-2017 LTIP grant is measured against the entire S&P MidCap 400 and the S&P 500 Materials Group (the “Performance Peer Group”). Ashland believes that the use of these indices better represents shareholder interests and reduces the volatility of the TSR calculation. Ashland must achieve median performance relative to the Performance Peer Group for eligible executives to earn a target award for the TSR portion of the award. Prior Performance Unit grants that have not yet vested continue to use their Performance Peer Groups established at the time of grant. No adjustments are made to TSR.
Each of the performance measures has a minimum performance hurdle that must be achieved to earn a payout under the stated objectives. For the fiscal 2015 – 2017 LTIP, the TSR hurdle was set at the 35th percentile. If Ashland’s performance is below the 35th percentile of the Performance Peer Group, no TSR award is earned. To earn the target award, Ashland’s TSR performance must be at the 50th percentile (median) relative to the Performance Peer Group. The performance maximum represents a level of performance that is at the 90th percentile or above, relative to the respective Performance Peer Group. The P&C Committee has established the same internal hurdle, target and maximum performance goals for the ROI portion of the LTIP awards. If the maximum performance is achieved for both ROI and TSR, the award earned is 200% of the award opportunity at target.
The following chart illustrates these award percentages based on performance levels:
| Performance Level |
Percent of Target Award Earned |
|||
| Hurdle |
25 | % | ||
| Target |
100 | % | ||
| Maximum |
200 | % | ||
In the event performance falls between hurdle and target or target and maximum, the Performance Units are calculated on a linear basis. The earned Performance Units under the LTIP are generally paid in Ashland common stock.
123
Table of Contents
2013-2015 LTIP Performance Unit Award Results and Payment
The fiscal 2013-2015 LTIP was paid in November 2015 for the performance period of October 1, 2012 to September 30, 2015. The following chart illustrates these award levels and the corresponding relative TSR and ROI performance required:
| Performance |
Percentile Performance Relative to Performance Peer Group (TSR) or Internal Target (ROI) |
Percent of Target Award Earned |
||||||
| Hurdle |
35th percentile | 25 | % | |||||
| Target |
50th percentile | 100 | % | |||||
| Maximum |
90th percentile | 200 | % | |||||
For this performance period, relative TSR performance was at the 68th percentile of the applicable performance peer group, which resulted in a payout of 145.2% for the TSR performance. ROI as measured against internal goals yielded a score of 50.4%. This results in a total weighted average of 97.8%. The chart below provides the actual 2013-2015 LTIP payout amounts:
| Named Executive |
Number of LTIP Units Granted |
LTIP Award as a % of Target |
Number of Shares Paid |
|||||||||
| Mr. Mitchell |
3,500 | 97.8 | % | 3,423 | ||||||||
| Mr. Moughler |
1,000 | 97.8 | % | 978 | ||||||||
| Ms. Lockwood |
1,000 | 97.8 | % | 978 | ||||||||
| Ms. Matheys |
500 | 97.8 | % | 489 | ||||||||
The LTIP is a performance-based plan. Actual payout levels have averaged 115.0% of target the last five years, which the P&C Committee believes reflect the rigor of the goals set during these performance periods and Ashland’s strong relative TSR. The chart below reflects the LTIP weighted scores for each of the last five years:
| LTIP Plan Year |
Date of Payment |
Weighted Score as a % of Target | ||
| 2013-2015 |
November, 2015 | 97.81% | ||
| 2012-2014 |
December, 2014 | 117.25% | ||
| 2011-2013 |
November, 2013 | 128.55% | ||
| 2010-2012 |
November, 2012 | 111.75% | ||
| 2009-2011 |
December, 2011 | 119.65% |
Stock Appreciation Rights
Ashland’s SARs program is a long-term equity incentive plan designed to link executive compensation with increased shareholder value over time. The grants of SARs typically occur annually in November. SARs are awarded using a variable approach based on a target value determined as a fixed dollar amount or the greater of a percentage of the employee’s base salary and a market competitive benchmark. The actual number of SARs granted is then determined by taking the target value for each participant and dividing by the Black-Scholes value for SARs using the average of the closing prices of Ashland common stock for the last twenty business days of the prior fiscal year.
124
Table of Contents
The following calculation showing how Mr. Mitchell’s target fiscal 2015 SAR grant was determined is illustrative of the overall grant determination process:
| Mr. Mitchell’s market competitive benchmark determined as of November 12, 2014 |
$ | 426,294 | ||||
| x |
Target SAR value as a percent of salary: | 34.0 | % | |||
|
|
|
|||||
| = |
Target fiscal 2015 SAR value: | $ | 144,940 | |||
| Target SAR grant: $144,940/$24.59* = 5,900 SARs (rounded up to the next increment of 50) |
||||||
| * | Black-Scholes value using the average of closing prices of Ashland common stock for the 20 business days ended September 30, 2014. The 20-day average is used to reduce stock volatility and better represents Ashland’s stock price. |
Actual SAR grants for fiscal 2015 to the Valvoline named executive officers were as follows:
| Named Executive Officer |
SARs Target ($ or % of Salary) |
Number of SARs Granted |
||||||
| Mr. Mitchell |
34.0 | % | 5,900 | |||||
| Mr. Moughler |
$ | 35,500 | 1,450 | |||||
| Ms. Lockwood |
$ | 35,500 | 1,450 | |||||
| Ms. Matheys |
$ | 35,500 | 1,450 | |||||
All SARs are based on an exercise price equal to the closing price of Ashland common stock on the NYSE on the date of grant and are not re-valued if the stock price declines below the exercise price. SARs expire on the tenth anniversary plus one month from the date of grant. SARs vest over a three-year period as follows: 50% vest on the first anniversary of the grant date; an additional 25% vest on the second anniversary of the grant date; and the final 25% vest on the third anniversary of the grant date.
Restricted Stock/Restricted Stock Units
Ashland’s RS program is a long-term equity incentive plan designed to link executive compensation with increased shareholder value over time. The grants of RS typically occur annually in November. Beginning in fiscal 2016, Ashland began issuing RSUs instead of RS for administrative convenience.
The number of shares awarded is based on a fixed dollar amount or the greater of a targeted percentage of the employee’s base salary and a market competitive benchmark. The actual number of RS granted is then determined by taking the target value for each participant and dividing by the average of the closing prices of Ashland common stock for the last 20 business days of the prior fiscal year. RS are adjusted for whole shares dividends. Fractional shares are cancelled.
The following calculation showing how Mr. Mitchell’s target fiscal 2015 RS grant was determined is illustrative of the overall grant determination process:
| Mr. Mitchell’s market competitive benchmark determined as of November 12, 2014 |
$ | 426,294 | ||||
| x |
Target RS value as a percent of salary: | 34.00 | % | |||
|
|
|
|||||
| = |
Target fiscal 2015 RS value: | $ | 144,940 | |||
| Target RS grant: $144,940/$107.10* = 1,400 RS (rounded up to the next increment of 50) |
||||||
| * | Average of closing prices of Ashland common stock for the 20 business days ended September 30, 2014. The 20 business day average is used to reduce stock volatility and better represents Ashland’s stock price. |
125
Table of Contents
Actual RS annual grants for fiscal 2015 to the Valvoline named executive officers were as follows:
| Named Executive Officer |
RS Target ($ or % of Salary) |
Number of RS Granted |
||||||
| Mr. Mitchell |
34.00 | % | 1,400 | |||||
| Mr. Moughler |
$ | 35,500 | 350 | |||||
| Ms. Lockwood |
$ | 35,500 | 350 | |||||
| Ms. Matheys |
$ | 35,500 | 350 | |||||
In connection with being named to Ashland’s Executive Committee on May 1, 2015, Mr. Mitchell received an RS award of 8,000 shares ($957,600 approximate grant date fair value) on July 15, 2015.
Stock Ownership Guidelines
Equity compensation encourages executives to have a long-term shareholder’s perspective in managing Ashland. Consistent with this philosophy, the P&C Committee has established stock ownership guidelines for Ashland’s executive officers and designated key employees, including the Valvoline named executive officers. Employees are subject to the stock ownership requirements if they are eligible to participate in Ashland’s LTIP. Under these guidelines, each employee has five years from the date he or she becomes subject to a particular guideline to reach the minimum levels of Ashland common stock ownership identified by the P&C Committee.
The current ownership guidelines are the lesser of the following two metrics:
| Named Executive Officer |
Dollar Value of Ashland Common Stock |
or | Number of Shares of Ashland Common Stock |
|||||||
| Mr. Mitchell |
3 x salary | 25,000 | ||||||||
| Mr. Moughler and Mses. Lockwood and Matheys |
1 x salary | 4,000 | ||||||||
| Range for other LTIP participants |
1 x salary | 3,500 | ||||||||
Ashland common stock ownership includes the following: shares held in Ashland’s 401(k) plan and LESOP; equivalent shares held in the non-qualified deferred compensation plan; unvested RS/RSUs that will vest within five years of the ownership guidelines date; and shares held by employees outside of Ashland plans.
The P&C Committee reviews progress toward achieving the ownership guidelines for the covered employees on an annual basis. If an executive officer has not reached his or her ownership requirement under the guidelines, the P&C Committee has discretion to reduce or to not make future award grants until ownership guidelines are reached. All of the Valvoline named executive officers have met their stock ownership requirements.
Risk Assessment of Ashland’s Executive Compensation Program
Ashland’s compensation program is designed to motivate and reward employees and executive officers for their performance during the fiscal year and over the long-term and for taking appropriate business risks. The P&C Committee asked its compensation consultant to conduct a risk assessment of Ashland’s incentive compensation plans in May 2015. Based on its review of the risk assessment, a review of Ashland’s internal controls and the risk mitigating components of Ashland’s compensation programs, the P&C Committee determined that Ashland’s compensation programs do not encourage executives or other employees to take inappropriate risks that are reasonably likely to have a material adverse effect on Ashland.
126
Table of Contents
Executive Compensation Recovery “Clawback” Policy of Ashland’s Executive Compensation Program
Ashland has an Executive Compensation Recovery Policy (“Clawback Policy”) effective for plan years beginning on or after October 1, 2009, for executive officers, including the Valvoline named executive officers. This policy further strengthens the risk mitigation program by defining the economic consequences that misconduct has on the executive officer’s incentive-related compensation. In the event of a financial restatement due to fraudulent activity or intentional misconduct as determined by the board of directors, the culpable executive officer is required to reimburse Ashland for incentive-related compensation paid to him or her. In addition, the board of directors has the discretion to determine whether any of the Valvoline named executive officers will be required to repay incentive-related compensation, whether or not such named executive officer was involved in the fraudulent activity or misconduct. Ashland has a period of three years after the payment or award is made to seek reimbursement.
Anti-Hedging Policy of Ashland’s Executive Compensation Program
Ashland’s insider trading policy prohibits any director or officer from purchasing any financial instruments (including prepaid variable forward contracts, equity swaps, collars and exchange funds) that are designed to hedge or offset any decrease in the market value of equity securities of Ashland: (i) granted to such person by Ashland as part of the person’s compensation or (ii) held, directly or indirectly, by such person.
Anti-Pledging Policy of Ashland’s Executive Compensation Program
Ashland prohibits all its directors and officers from directly or indirectly pledging equity securities of Ashland. Under the policy, the term “pledging” includes the intentional creation of any form of pledge, security interest, deposit, lien or other hypothecation, including the holding of shares in a margin account, that entitles a third party to foreclose against, or otherwise sell, any equity securities, whether with or without notice, consent, default or otherwise. The equity securities attributable to a director or officer for these purposes shall include equity securities attributable to the director or officer under applicable securities laws.
Retirement Benefits
The combination of tax-qualified and non-qualified retirement plans is designed to assist the Valvoline named executive officers in building savings for retirement over the term of their employment.
Ashland’s pension and 401(k) plans are tax-qualified vehicles to provide retirement benefits to the Valvoline named executive officers and their families. The benefits in these plans are available to most U.S.-based employees. The benefits are funded through trusts and are separate from the assets of Ashland and by law are protected from Ashland’s creditors.
The benefits that may be provided under the tax-qualified plans are limited by the Code. These plans, standing alone, do not provide sufficient retirement income to the Valvoline named executive officers when compared to their pay as an active employee. To make up for this gap in potential replacement income in retirement, Ashland offers the Valvoline named executive officers non-qualified retirement plans that complement each other and the tax-qualified plans. A detailed description of the non-qualified plans, and a description of recent amendments to such plans, for the applicable Valvoline named executive officers is included in the Pension Benefits section of this prospectus.
The 401(k) plan contributions are also limited by law, which means their potential matching contributions from Ashland are also limited. The Ashland match that could not be made to the 401(k) plan is paid to the Valvoline named executive officers (as well as any affected employee) as additional compensation.
Ashland also has employee deferral plans that allow the Valvoline named executive officers to annually make a separate deferral election so that the Valvoline named executive officers can save amounts from their own pay in addition to amounts they are allowed to save in the savings plans.
127
Table of Contents
Health and Welfare Benefits of Ashland’s Executive Compensation Program
The health of all employees is important to Ashland as is the need to provide for financial security to the families of employees who may become ill, disabled or die during active employment. To these ends, Ashland provides a wide variety of health and welfare benefit plans to a majority of its active U.S. workforce. These same plans are offered to the Valvoline named executive officers for the same reasons as they are offered to the majority of the rest of the active workforce. These plans include medical, dental, vision, life, accidental death and dismemberment, business travel and accident coverage and long-term care insurance. These benefits are targeted at median competitive levels.
Executive Perquisites of Ashland’s Executive Compensation Program
Ashland provides its named executive officers and other selected executives with financial planning services (including tax preparation). Messrs. Mitchell and Moughler and Ms. Matheys participated in the financial planning program.
The P&C Committee reviews the perquisites provided to executive officers as part of their overall review of executive compensation. The P&C Committee has determined the perquisites to be within the appropriate range of compensation practices.
Severance Pay Plan
The Valvoline named executive officers are covered by the Severance Pay Plan that provides benefits in the event of a covered termination in the absence of a change in control. A covered termination is the direct result of the permanent closing of a facility, job discontinuance or other termination action of Ashland’s initiative as determined by Ashland. The plan excludes certain terminations such as, but not limited to, termination for cause and voluntary resignation.
A detailed description of this plan is included in the “Potential Payments upon Termination or Change in Control for Fiscal 2015” section of this prospectus.
Change in Control Agreements of Ashland’s Executive Compensation Program
Mr. Mitchell has a change in control agreement that sets forth the economic consequences and entitlements for termination without cause or for good reason after a change in control. The primary purpose of these protections is to align executive and shareholder interests by enabling Mr. Mitchell to assess possible corporate transactions without regard to the effect such transactions could have on their employment.
A detailed description of Mr. Mitchell’s agreement is included in the “Potential Payments upon Termination or Change in Control for Fiscal 2015” section of this prospectus.
On October 5, 2015, the P&C Committee approved new executive change in control agreements for certain of the Ashland executive officers, including Mr. Mitchell. The new change in control agreements narrow the circumstances in which the executives will have “good reason” to resign and become entitled to receive severance following a change in control. Also, Mr. Mitchell’s change in control agreement entitled him to a tax “gross-up” for excise taxes payable on certain payments made to him in connection with a change in control of Ashland. The new change in control agreements exclude all excise tax “gross-up” provisions and instead provide for a “best-after-tax” cutback. Except for the modifications described above, the new change in control agreements are substantially the same as the prior change in control agreements.
None of the Valvoline named executive officers other than Mr. Mitchell have entered into a change in control agreement.
128
Table of Contents
Double-Trigger Award Agreements of Ashland’s Executive Compensation Program
On July 15, 2015, the P&C Committee approved an Amended and Restated 2015 Ashland Inc. Incentive Plan (the “2015 Incentive Plan”), which permits the P&C Committee to grant awards under the 2015 Incentive Plan with double-trigger change in control provisions set forth in an award agreement. The default under the 2015 Incentive Plan is a single-trigger change in control provision. In connection with this amendment, the P&C Committee also approved forms of the award agreements containing the double-trigger change in control provision (the “Double-Trigger Award Agreements”). All awards granted under the 2015 Incentive Plan since this amendment have used the Double-Trigger Award Agreements.
Deductibility of Compensation
Ashland attempts to maximize the tax deductibility of the compensation paid to its executives. However, tax rules may limit the tax deductibility of certain types of non-performance based compensation paid to the Valvoline named executive officers.
Ashland considers the tax deductibility of compensation awarded to the Valvoline named executive officers, and weighs the benefits of awarding compensation that may be nondeductible against contingencies required by the tax laws. The P&C Committee believes that in certain circumstances the benefits of awarding nondeductible compensation exceed the benefits of awarding deductible compensation that is subject to contingencies derived from the tax laws.
In addition, Ashland considers various other tax rules governing Valvoline named executive officer compensation including (but not limited to) tax rules relating to fringe benefits, qualified and non-qualified deferred compensation and compensation triggered by a change in control.
Executive Performance Incentive and Retention Program
In connection with the adoption of the new change in control agreements as described above, and in consideration of the previously announced intent to separate Ashland into two independent, publicly traded companies, on October 5, 2015, the P&C Committee approved the Executive Performance Incentive and Retention Program for certain Ashland executive officers and other key employees, including Mr. Mitchell.
The Executive Performance Incentive and Retention Program is designed to provide an additional incentive to remain employed by Ashland in the critical period up to the spin-off and by Valvoline following the spin-off, and to provide increased alignment between executives and shareholders by providing equity-based compensation that vests based on both relative TSR and the participant’s continued service.
On November 18, 2015, the P&C Committee approved a grant of 31,616 performance-based restricted shares to Mr. Mitchell at the “maximum” performance level. This grant represents two times his base salary and target incentive compensation (15,808 performance-based restricted shares) at the “target” performance level:
| Name |
Dollar Value of Performance- Based Restricted Stock at Target |
Number of Shares of Performance-Based Restricted Stock at Target |
Grant Amount: Number of Shares of Performance-Based Restricted Stock at Maximum |
|||||||
| Mr. Mitchell |
2x base salary and target incentive compensation |
15,808 | 31,616 | |||||||
In connection with the spin-off, a pro-rated portion of the performance-based restricted shares (such proration to be determined based on the period elapsed between October 1, 2015 and the closing of the spin-off, but in any event no less than two-thirds of the shares) will convert into a number of time-vesting restricted shares
129
Table of Contents
(“TVRS”) of Valvoline based on the combined weighted-average TSR of Ashland Global and Valvoline, relative to the TSR of a group of peer companies, over the period beginning October 1, 2015 and ending on the 120th day following the closing of the spin-off.
The performance-based restricted shares were granted at the “Maximum” performance level. “Maximum” performance is defined as 90th percentile or greater TSR performance relative to the peer group and will result in 100% of performance-based restricted shares subject to the performance goal converting into TVRS. “Target” performance is defined as 50th percentile TSR performance relative to the peer group and will result in 50% of the performance-based restricted shares subject to the performance goal converting into TVRS. “Threshold” performance is defined as 35th percentile TSR performance relative to the peer group and will result in 12.5% of the performance-based restricted shares subject to the performance goal converting into TVRS. TSR performance below the 35th percentile will result in 0% of the performance-based restricted shares that are subject to the performance goal converting into TVRS. Any performance-based restricted shares subject to the TSR performance goal that are not converted into TVRS will be forfeited.
As described above, the number of shares that are subject to the TSR performance goal will depend on the timing of the spin-off. The shares that are not subject to the TSR performance goal will convert into TVRS at “Target” level. In no event will more than one-sixth of the shares awarded convert into TVRS without being subject to the TSR performance goal.
The TVRS will generally cliff vest upon the third anniversary of the grant date, so long as the participant remains employed through the vesting date.
Compensation Program of Valvoline Following the Spin-off
We are currently in the process of determining the compensation programs we anticipate implementing for our senior executives, including our named executive officers, following the spin-off.
130
Table of Contents
Summary Compensation Table
The following table is a summary of compensation information for the last fiscal year, which ended September 30, 2015, for the Valvoline named executive officers.
| Name and Principal |
Year (b) |
Salary ($) (c) |
Bonus ($) (d) |
Stock Awards (1) ($) (e) |
Option Awards (2) ($) (f) |
Non-Equity Incentive Compensation (3) ($) (g) |
Change in Pension Value and Non-Qualified Deferred Compensation Earnings (4) ($) (h) |
All Other Compensation (5) ($) (i) |
Total ($) (j) |
|||||||||||||||||||||||||||
| Mr. Mitchell |
2015 | 427,652 | — | 1,444,723 | 181,071 | 485,816 | 578,176 | 53,845 | 3,171,283 | |||||||||||||||||||||||||||
| Sr Vice President of Ashland and President of Valvoline |
||||||||||||||||||||||||||||||||||||
| Mr. Moughler |
2015 | 286,019 | — | 124,828 | 44,501 | 175,436 | 118,295 | 21,446 | 770,524 | |||||||||||||||||||||||||||
| Sr VP & Managing Director International of Valvoline |
||||||||||||||||||||||||||||||||||||
| Ms. Lockwood |
2015 | 259,209 | — | 124,828 | 44,501 | 162,745 | 72,412 | 44,430 | 708,124 | |||||||||||||||||||||||||||
| Sr VP Technology of Valvoline |
||||||||||||||||||||||||||||||||||||
| Ms. Matheys |
2015 | 254,313 | — | 124,828 | 44,501 | 183,088 | — | 33,324 | 640,053 | |||||||||||||||||||||||||||
| Sr VP DIY Channels of Valvoline |
||||||||||||||||||||||||||||||||||||
| (1) | The values in column (e) represent the aggregate grant date fair value of fiscal 2015-2017 LTIP Performance Units and RS computed in Accordance with FASB ASC Topic 718. The assumptions made when calculating the amounts for column (e) and the grant date fair values can be found in the footnotes to the Grants of Plan-Based Awards table. For LTIP Performance Units awards assuming the maximum level of performance are as follows: Mr. Mitchell, $658,098; Mr. Moughler, $170,618; Ms. Lockwood, $170,618; and Ms. Matheys, $170,618. |
| (2) | The values in column (f) represent the aggregate grant date fair value of SARs computed in accordance with FASB ASC Topic 718. The assumptions made when calculating the amounts for column (f) and the grant date fair values can be found in the footnotes to the Grants of Plan-Based Awards table. |
| (3) | The values in column (g) represent the amounts earned with respect to annual incentive awards under the 2015 Annual Incentive Plan. |
| (4) | Ashland’s non-qualified deferred compensation arrangements do not provide above-market or preferential earnings; therefore, for 2015 the amounts in column (h) represent only the one-year change between September 30, 2014 and September 30, 2015 in the present value of accrued benefits under Ashland’s qualified and non-qualified defined benefit plans. These plans are more fully discussed in narrative to the Pension Benefits table in this prospectus. |
| (5) | Amounts reported in column (i) for fiscal 2015 are composed of the following items: |
| Mr. Mitchell | Mr. Moughler | Ms. Lockwood | Ms. Matheys | |||||||||||||
| Ashland 401(k) Plan Match (a) |
$ | 36,138 | $ | 17,484 | $ | 38,072 | $ | 18,370 | ||||||||
| Supplemental Ashland 401(k) Plan Match (b) |
$ | 3,817 | $ | 763 | $ | 2,760 | $ | 2,760 | ||||||||
| Ashland Contribution to Non-Qualified Defined Contribution Plan (c) |
$ | 0 | $ | 0 | $ | 0 | $ | 10,260 | ||||||||
| Life Insurance Premiums (d) |
$ | 1,344 | $ | 2,094 | $ | 3,599 | $ | 434 | ||||||||
| Other (e) |
$ | 12,546 | $ | 1,105 | $ | 0 | $ | 1,500 | ||||||||
| Total |
$ | 53,845 | $ | 21,446 | $ | 44,430 | $ | 33,324 | ||||||||
| (a) | The amounts in this row represent the contributions by Ashland to the accounts of each of the Valvoline named executive officers in the Ashland 401(k) plan. |
| (b) | The amounts in this row represent payments by Ashland to the Valvoline named executive officers that would have been made as matching contributions to the Ashland 401(k) plan, but for the limitations placed on such contributions under the Code. |
| (c) | The amounts in this row represent payments by Ashland to the Valvoline named executive officers pursuant to the Non-Qualified Defined Contribution Plan. |
| (d) | The amounts in this row represent the value of life insurance premiums paid on behalf of the Valvoline named executive officers. |
| (e) | In accordance with SEC rules, disclosure of perquisites and other personal benefits is omitted if the aggregate amount of such compensation for an executive officer is less than $10,000 for the given year. If the total amount exceeds $10,000, each perquisite or personal benefit must be identified by type, and if the amount of a perquisite or personal benefit exceeds the greater of $25,000 or 10% of total perquisites and personal benefits, its value must be disclosed. The amounts in this row represent the amount of aggregate incremental cost to Ashland with respect to any tax and financial planning services. |
131
Table of Contents
Grants of Plan-Based Awards for Fiscal 2015
The following table sets forth certain information regarding the annual and long-term incentive awards, SARs and RS granted during fiscal 2015 to each of the Valvoline named executive officers.
| Name |
Grant Date (b) |
Estimated Possible Payouts |
Estimated Future Payouts |
All Other Stock Awards: Number of Shares of Stock or Units (#) (3) (i) |
All Other Option Awards: Number of Securities Underlying Options (#) (4) (j) |
Exercise or Base Price of Option Awards ($/Sh) (k) |
Grant Date Fair Value of Stock And Option Awards ($) (5) (l) |
|||||||||||||||||||||||||||||||||||||
| Threshold ($) (c) |
Target ($) (d) |
Maximum ($) (e) |
Threshold (#) (f) |
Target (#) (g) |
Maximum (#) (h) |
|||||||||||||||||||||||||||||||||||||||
| Mr. Mitchell |
78,408 | 392,040 | 588,060 | |||||||||||||||||||||||||||||||||||||||||
| 11/12/14 | 675 | 2,700 | 5,400 | 329,049 | ||||||||||||||||||||||||||||||||||||||||
| 11/12/14 | 5,900 | $ | 112.91 | 181,071 | ||||||||||||||||||||||||||||||||||||||||
| 07/15/15 | 8,000 | 957,600 | ||||||||||||||||||||||||||||||||||||||||||
| 11/12/14 | 1,400 | 158,074 | ||||||||||||||||||||||||||||||||||||||||||
| Mr. Moughler |
28,367 | 141,835 | 212,753 | |||||||||||||||||||||||||||||||||||||||||
| 11/12/14 | 175 | 700 | 1,400 | 85,309 | ||||||||||||||||||||||||||||||||||||||||
| 11/12/14 | 1,450 | $ | 112.91 | 44,501 | ||||||||||||||||||||||||||||||||||||||||
| 11/12/14 | 350 | 39,519 | ||||||||||||||||||||||||||||||||||||||||||
| Ms. Lockwood |
26,266 | 131,330 | 196,995 | |||||||||||||||||||||||||||||||||||||||||
| 11/12/14 | 175 | 700 | 1,400 | 85,309 | ||||||||||||||||||||||||||||||||||||||||
| 11/12/14 | 1,450 | $ | 112.91 | 44,501 | ||||||||||||||||||||||||||||||||||||||||
| 11/12/14 | 350 | 39,519 | ||||||||||||||||||||||||||||||||||||||||||
| Ms. Matheys |
26,266 | 131,330 | 196,995 | |||||||||||||||||||||||||||||||||||||||||
| 11/12/14 | 175 | 700 | 1,400 | 85,309 | ||||||||||||||||||||||||||||||||||||||||
| 11/12/14 | 1,450 | $ | 112.91 | 44,501 | ||||||||||||||||||||||||||||||||||||||||
| 11/12/14 | 350 | 39,519 | ||||||||||||||||||||||||||||||||||||||||||
| (1) | The dollar amounts in these columns represent the potential annual incentive payouts under the 2015 Annual Incentive Plan for fiscal 2015. The actual dollar amounts earned were paid in December 2015 and are included in column (g) in the fiscal 2015 row of the Summary Compensation Table. |
| (2) | The amounts in these columns represent potential payments under LTIP Performance Units for fiscal 2015-2017 performance period under the 2011 Incentive Plan. |
| (3) | Grants made on November 12, 2014 were made in accordance with the 2015 Long-Term Equity Incentive Compensation program and vest one-third in each of the next three years. Mr. Mitchell received an RS grant of 8,000 shares pursuant to the 2015 Incentive Plan. The grant will vest in full on July 15, 2018. |
| (4) | The amounts in column (j) represent the number of shares of Ashland common stock that may be issued to Valvoline named executive officers upon exercise of SARs granted under the 2011 Incentive Plan in fiscal 2015. All SARs were granted at an exercise price of $112.91 per share, the closing price of Ashland Stock as reported on the NYSE on November 12, 2014, the date of grant. |
| (5) | The dollar amounts in column (l) are calculated in accordance with FASB ASC Topic 718 and assume (i) payment of Performance Units at target ($108.44 per unit for the ROI portion, based on the closing price of Ashland common stock on the date of grant, discounted for the dividends forgone during the vesting period of the three-year performance cycle, and $135.29 per unit for the TSR portion, based on a Monte Carlo simulation valuation using a risk-free interest rate of 0.1%-1.0%, an expected dividend yield of 1.4%, an expected volatility of 24.2% and an expected life of 3 years, for a weighted average price of $121.87 per unit); (ii) valuation of all SARs using the Black-Scholes valuation model ($30.69 per SAR granted on November 12, 2014, based on a risk-free interest rate of 1.7%, an expected dividend yield of 1.2%, expected volatility of 31.8% and an expected life of 5 years) and (iii) the grant date fair value of RS using the closing price of Ashland common stock of $112.91 on November 12, 2014, and $119.70 on July 15, 2015, all as reported on the NYSE. |
Narrative Summary
Annual Incentive Compensation
Incentive compensation for executives is primarily awarded annually, contingent upon meeting applicable targets. After the beginning of each fiscal year, performance hurdle, target and maximum objectives are established for the upcoming year. Awards for the Valvoline named executive officers are based upon overall Ashland performance as well as the performance of Valvoline.
132
Table of Contents
This “Executive Compensation” section discusses the fiscal 2015 performance goals as well as other aspects of this program.
Long-Term Equity Incentive Plan - Performance Units
Performance Units, granted under the LTIP, are available to certain key employees. These awards are long-term incentives tied to Ashland’s ROI and TSR over the performance period. Awards are granted annually, with each award covering a three-year performance period.
After the beginning of the performance period, performance hurdle, target and maximum objectives are established for the performance period. The initial number of Performance Units awarded is based on the employee’s salary or midpoint of salary band depending on salary band. This “Executive Compensation” section discusses fiscal 2015-2017 LTIP awards.
Stock Appreciation Rights
Ashland’s employee SARs program is a long-term equity incentive plan designed to link executive compensation with increased shareholder value over time. In determining the amount of SARs to be granted annually to key employees, a target number of shares for each employee band level is established. All SARs are granted with an exercise price equal to the fair market value of Ashland common stock on the date of grant. Vesting of SARs occurs over a period of three years, as more fully described in footnote (1) of the Outstanding Equity Awards at Fiscal Year-End table in this prospectus. For accelerated vesting events, see the “Potential Payments upon Termination or Change in Control for Fiscal 2015—SARs/Stock Options, Incentive Compensation, Restricted Stock/Restricted Stock Units and Performance Units” section in this prospectus. SARs are not re-valued if the stock price declines below the grant price. This “Executive Compensation” section discusses the aspects of this program.
Restricted Stock/Restricted Stock Units
Ashland’s RS program is a long-term incentive plan designed to link executive compensation with increased shareholder value over time. In determining the amount of RS to be granted annually to key employees, a target number of shares for each employee band level is established. All RS is granted with a price equal to the fair market value of Ashland’s common stock on the date of grant. Vesting of the annual grant of RS occurs over a period of three years, as more fully described in footnote (2) of the Outstanding Equity Awards at Fiscal Year-End table in this prospectus.
The P&C Committee may award restricted shares of Ashland common stock and/or restricted share units to plan participants. RS are intended to reward superior performance and encourage continued employment with Ashland. For vesting periods applicable to restricted Ashland common stock granted to the Valvoline named executive officers, see footnote (2) of the Outstanding Equity Awards at Fiscal Year-End table in this prospectus.
RS may not be sold, assigned, transferred or otherwise encumbered during the restricted period. Dividends are paid on the restricted shares with additional shares of RS which are subject to the same vesting requirements. For accelerated vesting events, see the “Potential Payments upon Termination or Change in Control for Fiscal 2015—SARs/Stock Options, Incentive Compensation, Restricted Stock/Restricted Stock Units and Performance Units” section in this prospectus. Beginning in fiscal 2016, Ashland began granting RSUs in lieu of RS. The terms of the RSUs are generally the same as RS, except RSUs will not have voting rights and will not be counted as outstanding shares.
133
Table of Contents
Outstanding Equity Awards at Fiscal 2015 Year-End
The following table sets forth certain information regarding SARs, Performance Units and RS held by each of the Valvoline named executive officers as of September 30, 2015.
| Option Awards | Stock Awards | |||||||||||||||||||||||||||||||||||
| Name |
Number of Securities Underlying Unexercised Options Exercisable (1) (#) (b) |
Number of Securities Underlying Unexercised Options Unexercisable (1) (#) (c) |
Equity Incentive Plan Awards: Number of Securities Underlying Unexercised Unearned Options (#) (d) |
Option Exercise Price ($) (e) |
Option Expiration Date (f) |
Number of Shares or Units of Stock That Have Not Vested (2) (#) (g) |
Market Value of Shares or Units of Stock That Have Not Vested (2) ($) (h) |
Equity Incentive Plan Awards: Number of Unearned Shares, Units or Other Rights That Have Not Vested (3) (#) (i) |
Equity Incentive Plan Awards: Market or Payout Value of Unearned Shares, Units or Other Rights That Have Not Vested (3) ($) (j) |
|||||||||||||||||||||||||||
| S.J. Mitchell |
0 | 5,900 | (4) | 0 | 112.91 | 12/12/2024 | ||||||||||||||||||||||||||||||
| 3,100 | 3,100 | (5) | 0 | 89.69 | 12/13/2023 | |||||||||||||||||||||||||||||||
| 8,625 | 2,875 | (6) | 0 | 70.37 | 12/14/2022 | |||||||||||||||||||||||||||||||
| 9,700 | 0 | 0 | 55.56 | 01/02/2022 | ||||||||||||||||||||||||||||||||
| 9,300 | 0 | 0 | 51.86 | 12/17/2020 | ||||||||||||||||||||||||||||||||
| 12,300 | 0 | 0 | 65.78 | 12/15/2016 | ||||||||||||||||||||||||||||||||
| 14,015 | 1,411,397 | 6,000 | 603,720 | |||||||||||||||||||||||||||||||||
| C.A. Moughler |
0 | 1,450 | (4) | 0 | 112.91 | 12/12/2024 | ||||||||||||||||||||||||||||||
| 750 | 750 | (5) | 0 | 89.69 | 12/13/2023 | |||||||||||||||||||||||||||||||
| 275 | 775 | (6) | 0 | 70.37 | 12/14/2022 | |||||||||||||||||||||||||||||||
| 1,200 | 0 | 0 | 55.56 | 01/02/2022 | ||||||||||||||||||||||||||||||||
| 5,500 | 0 | 0 | 10.72 | 12/20/2018 | ||||||||||||||||||||||||||||||||
| 1,602 | 161,193 | 1,500 | 150,930 | |||||||||||||||||||||||||||||||||
| F.E. Lockwood |
0 | 1,450 | (4) | 0 | 112.91 | 12/12/2024 | ||||||||||||||||||||||||||||||
| 750 | 750 | (5) | 0 | 89.69 | 12/13/2023 | |||||||||||||||||||||||||||||||
| 2,325 | 775 | (6) | 0 | 70.37 | 12/14/2022 | |||||||||||||||||||||||||||||||
| 2,700 | 0 | 0 | 55.56 | 01/02/2022 | ||||||||||||||||||||||||||||||||
| 5,673 | 570,817 | 1,500 | 150,930 | |||||||||||||||||||||||||||||||||
| H.J. Matheys |
0 | 1,450 | (4) | 0 | 112.91 | 12/12/2024 | ||||||||||||||||||||||||||||||
| 750 | 750 | (5) | 0 | 89.69 | 12/13/2023 | |||||||||||||||||||||||||||||||
| 0 | 400 | (6) | 0 | 70.37 | 12/14/2022 | |||||||||||||||||||||||||||||||
| 1,113 | 111,990 | 1,500 | 150,930 | |||||||||||||||||||||||||||||||||
| (1) | The numbers in columns (b) and (c) relate to SARs, 50% of which vest on the first anniversary of the grant date and 25% of which vest on each of the second and third anniversaries of the grant date. |
| (2) | The numbers in column (g) and the dollar values in column (h) represent the number of shares earned for the fiscal 2013-2015 LTIP performance period (which is payable in stock or cash) and/or unvested RS. The number of shares of Ashland common stock earned for the fiscal 2013-2015 LTIP awards was determined by the P&C Committee in November 2015 and became vested when paid in November 2015. For Messrs. Mitchell and Moughler and Mses. Lockwood and Matheys, the amount reported in columns (g) and (h) represent 3,423; 978; 978; and 489 shares of Ashland common stock, respectively. |
The following paragraphs list the unvested RS as of September 30, 2015 for each named executive officer. Unless otherwise noted, the RS vests 33.3% at the end of year one, 33.3% at the end of year two and 33.4% at the end of year three.
For Mr. Mitchell, the amounts reported in columns (g) and (h) include the following: (a) 1,133 RS remaining from a grant of 1,700 RS granted November 13, 2013, and 30 RS earned from dividends; (b) 1,400 RS granted on November 12, 2014 and 12 RS earned from dividends; and (c) 8,000 RS granted on July 15, 2015, that will vest 100% on July 15, 2018, and 29 RS earned from dividends.
For Mr. Moughler, the amounts reported in columns (g) and (h) include the following: (a) 267 RS remaining from a grant of 400 RS granted November 13, 2013, and 5 RS earned from dividends; and (b) 350 RS granted on November 12, 2014 and 2 RS earned from dividends.
134
Table of Contents
For Ms. Lockwood, the amounts reported in columns (g) and (h) include the following: (a) 267 RS remaining from a grant of 400 RS granted November 13, 2013, and 5 RS earned from dividends; (b) 4,000 RS granted on April 1, 2014, that will vest 50% on April 1, 2016 and 50% on April 1, 2017, and 71 RS earned from dividends; and (c) 350 RS granted on November 12, 2014 and 2 RS earned from dividends.
For Ms. Matheys, the amounts reported in columns (g) and (h) include the following: (a) 267 RS remaining from a grant of 400 RS granted November 13, 2013, and 5 RS earned from dividends; and (b) 350 RS granted on November 12, 2014 and 2 RS earned from dividends.
| (3) | The numbers in column (i) represent the estimated units granted through September 30, 2015, under the LTIP for the fiscal 2014-2016 and the fiscal 2015-2017 performance periods. The estimated number is computed assuming that the target performance goals are achieved. The dollar amounts in column (j) correspond to the units identified in column (i). The dollar value is computed by converting the units to shares of Ashland common stock on a one-for-one basis. The number of shares is then multiplied by the closing price of Ashland common stock of $100.62 as reported on the NYSE on September 30, 2015. Payment, if any, under the LTIP will generally be made in Ashland common stock for the fiscal 2014-2016 and the fiscal 2015-2017 performance periods. |
| (4) | These numbers relate to SARs granted on November 12, 2014 that vest over the three-year period referenced in footnote (1) above. |
| (5) | These numbers relate to SARs granted on November 13, 2013 that vest over the three-year period referenced in footnote (1) above. |
| (6) | These numbers relate to SARs granted on November 14, 2012 that vest over the three-year period referenced in footnote (1) above. |
Option Exercises and Stock Vested for Fiscal 2015
The following table sets forth certain information regarding the value realized by each Valvoline named executive officer during fiscal 2015 upon the exercise of SARs and Performance Units and the vesting of RS.
| Option Awards | Stock Awards | |||||||||||||||
| Name |
Number of Shares Acquired on Exercise (1) (#) (b) |
Value Realized on Exercise (1) ($) (c) |
Number of Shares Acquired on Vesting (2)(3) (#) (d) |
Value Realized on Vesting (2)(3) ($) (e) |
||||||||||||
| S.J. Mitchell |
0 | 0 | 6,669 | 776,314 | ||||||||||||
| C.A. Moughler |
1,500 | 112,625 | 1,775 | 206,696 | ||||||||||||
| F.E. Lockwood |
2,500 | 187,050 | 1,775 | 206,696 | ||||||||||||
| H.J. Matheys |
1,200 | 59,736 | 3,760 | 409,699 | ||||||||||||
| (1) | The amounts in column (b) represent the gross number of shares acquired on exercise of SARs. The amounts in column (c) represent the value realized on exercise. |
| (2) | For Messrs. Mitchell and Moughler and Ms. Lockwood, the amounts in column (d) represent the shares of Ashland common stock received in settlement of the fiscal 2012-2014 LTIP. The dollar amounts in column (e) represent the value of the fiscal 2012-2014 LTIP (computed by multiplying the number of shares awarded by $116.74, the closing price of Ashland common stock as reported on December 2, 2014, the date the P&C Committee approved the payment). The weighted score for the 2012-2014 LTIP was 117.3%. |
| (3) | The amounts in column (d) also include the following RS vestings: (i) Mr. Mitchell received 572 shares, with the value included in column (e) using the Ashland common stock closing price of $112.85 on November 13, 2014; (ii) Mr. Moughler received 133 shares, with the value included in column (e) using the Ashland common stock closing price of $112.85 on November 13, 2014; (iii) Ms. Lockwood received 133 shares, with the value included in column (e) using the Ashland common stock closing price of $112.85 on November 13, 2014; and (iv) Ms. Matheys received 133 shares, with the value included in column (e) using the Ashland common stock closing price of $112.85 on November 13, 2014 and she received 3,627 shares, with the value included in column (e) using the Ashland common stock closing price of $108.82 on September 24, 2015. |
135
Table of Contents
Pension Benefits for Fiscal 2015
The following table shows the actuarial present value of the Valvoline named executive officers’ (other than Ms. Matheys) accumulated benefits under each of Ashland’s qualified and non-qualified pension plans, calculated as of September 30, 2015. Ms. Matheys is not eligible to participate in the Pension Plan, the Excess Plans or the SERP.
| Name |
Plan Name
(1) |
Number Years Service (2) |
Present Value of Accumulated Benefit ($) (d) |
Payments During Last Fiscal Year ($) (e) |
||||||||
| S.J. Mitchell |
Ashland Hercules Pension Plan | 17 years 5 months |
217,612 | 0 | ||||||||
| Ashland Inc. Excess Benefit Pension Plan | 17 years 5 months |
83,009 | 0 | |||||||||
| Ashland Inc. Supplemental Early Retirement Plan for Certain Employees | 18 years 5 months |
3,404,221 | 0 | |||||||||
| C.A. Moughler |
Ashland Hercules Pension Plan | 26 years 6 months |
1,184,254 | 0 | ||||||||
| Ashland Inc. Excess Benefit Pension Plan | 26 years 6 months | 131,220 | 0 | |||||||||
| Ashland Inc. Supplemental Early Retirement Plan for Certain Employees | 20 years | 872,047 | 0 | |||||||||
| F.E. Lockwood |
Ashland Hercules Pension Plan | 20 years 5 months | 482,632 | 0 | ||||||||
| Ashland Inc. Excess Benefit Pension Plan | 20 years 5 months | 1,567 | 0 | |||||||||
| Ashland Inc. Supplemental Early Retirement Plan for Certain Employees | 20 years | 788,472 | 0 | |||||||||
| (1) | The Ashland Hercules Pension Plan (the “Pension Plan”) is a tax-qualified plan under Section 401(a) of the Code. The Ashland Inc. Excess Benefit Pension Plan (the “Ashland Excess Plan”) is a non-qualified plan that is coordinated with the tax-qualified plan. The Ashland Inc. Supplemental Early Retirement Plan for Certain Employees (the “SERP”) is a non-qualified plan. The material terms of each of these plans are described in the narrative below. |
| (2) | The maximum number of years of credited service under the SERP is 20 years. The number of years of service for the SERP is measured from the date of hire. The number of years of service under the Pension Plan and the Excess Plans is measured from the date the named executive officer began participating in the Pension Plan. |
Assumptions
The present values of the accumulated benefits were calculated as of September 30, 2015, based on the earliest age a participant could receive an unreduced benefit under the qualified Pension Plan and the non-qualified Ashland Excess Plan because his or her qualified Pension Plan benefits are calculated under the cash balance pension formula.
The SERP provides an umbrella (or gross) benefit that is subject to certain reductions. The amount in the Pension Benefits table for the SERP benefit for applicable Valvoline named executive officers is the net benefit under the SERP, after applicable reductions. The reductions referred to in this paragraph are described in the “Ashland Inc. Supplemental Early Retirement Plan for Certain Employees (SERP)” section below.
136
Table of Contents
Under the SERP, the earliest age a Valvoline named executive officer could receive a benefit is the earlier of age 55 or when the sum of the officer’s age and service equals at least 80, provided that the officer has at least 20 years of service under the plan.
The following material assumptions were used to quantify the present value of the named executive officers’ accumulated benefits: (i) for the Pension Plan, a 4.31% discount rate and the RP-2014 mortality table, adjusted to include the MP2015 mortality improvement projection scale; (ii) for the Ashland Excess Plan, an 8.00% lump sum rate, a 4.19% discount rate and the mortality assumptions prescribed under the Pension Protection Act of 2006; (iii) for the Pension Plan offset to the SERP, an 8.00% lump sum rate, a 4.29% discount rate and the GATT mortality table and (iv) for the Ashland Excess Plan offset to the SERP, an 8.00% lump sum rate, a 4.29% discount rate and the mortality assumptions prescribed under the Pension Protection Act of 2006.
Ashland Hercules Pension Plan (Pension Plan)
The Pension Plan is a tax-qualified defined benefit pension plan under Code Section 401(a). The Pension Plan provides retirement income for eligible participants. Beginning in January 2011, the Pension Plan was closed to new participants and to additional credits in the retirement growth account.
The Pension Plan has two benefit formulas—a traditional formula, referred to as the annuity benefit, and a cash balance formula, referred to as the retirement growth account. The traditional formula produces an annuity benefit at retirement based on a percentage of final average compensation multiplied by years of plan service (see the description in the “—Traditional Benefit/Annuity Formula” section below). The cash balance formula produces a hypothetical account balance based on the sum of contribution credits and interest on those contribution credits (see the description in the “—Retirement Growth Account Benefit/Cash Balance Formula” section below). In general, participants who were actively employed by Ashland on June 30, 2003, with at least 10 years of service remained in the annuity benefit formula. All other participants moved to the retirement growth account formula. The formula under which a participant’s benefit is computed is a matter of plan design and not participant election.
If a participant has a benefit payable from the LESOP, then the participant’s LESOP offset account reduces the amount payable to the participant, regardless of the formula under which the participant’s benefit is paid. At termination from employment, the participant may elect to transfer the LESOP offset account to the Pension Plan and receive an unreduced Pension Plan benefit.
Years of service in addition to what is actually incurred under the Pension Plan cannot be granted. However, in the case of an acquisition, prior service with the acquired business is often counted for purposes of vesting and eligibility, but not for purposes of benefit accrual under the annuity benefit formula. These same rules apply equally to the Excess Plans.
Traditional Benefit/Annuity Formula
Under this formula, for certain highly compensated employees, compensation only includes base compensation, up to the maximum allowed under Code Section 401(a)(17). For all other participants, compensation includes bonus amounts. This applies to both the annuity formula and the cash balance formula.
The final average compensation formula is the average for a 48 consecutive month period producing the highest average for the last 120 months of credited service. For participants who were employees of Hercules prior to the acquisition, the final average compensation is the average for the 60 consecutive month period producing the highest average for the last 120 months of credited service.
The annual annuity benefit formula is:
(1.08% x final average compensation up to $10,700) + (1.5% x final average compensation exceeding $10,700)
x
(years of credited service, which means years as a participant in the plan up to a maximum of 35 years)
137
Table of Contents
For participants who were employees of Hercules prior to the acquisition, the annual annuity benefit formula is:
(1.2% x final average compensation up to $53,400) + (1.6% x final average compensation exceeding $53,400)
x
(years of credited service)
The normal form of benefit payment under the annuity benefit is a single life annuity. However, as required by federal law, the normal form of benefit for a married participant is a joint and survivor annuity, unless the spouse consents to a different benefit distribution. A participant may also elect a non-spousal joint and survivor annuity or a 10-year term certain annuity. All payment forms are actuarially equivalent.
The normal retirement age is 65, but an unreduced benefit is paid for retirement at age 62. A participant may retire early once the participant is either at least age 55 or when the sum of the participant’s age and service equals at least 80.
Retirement Growth Account Benefit/Cash Balance Formula
Under this formula, contribution credits are accumulated in a notional account. Interest credits are allocated to each participant’s account monthly. The interest rate is from a minimum of 4.0% to a maximum of 7.0% and is set at the beginning of each plan year. The interest rate for fiscal 2015 was 4.0%.
The accrued benefit under this formula is the balance in the retirement growth account. The benefit is payable in the same forms that apply to the annuity benefit formula or may be paid as a single lump sum.
The normal retirement age under the retirement growth account formula is also age 65. The earliest that a participant can receive an unreduced benefit is at age 55 with at least five years of service.
Non-Qualified Excess Defined Benefit Pension Plans (Excess Plans) and Non-Qualified Supplemental Defined Contribution Plan (NQDC Plan)
The Excess Plans are unfunded, non-qualified plans providing a benefit payable, based on the applicable named executive officer’s pension plan eligibility, equal to the difference between the benefit under the Pension Plan in the absence of the Code limits (the gross benefit) and the actual benefit that would be payable under the Pension Plan.
The Excess Plans cover employees (i) who are eligible for the Pension Plan and whose benefit under the Pension Plan is limited because of either Code Section 401(a)(17) or Section 415(b) and (ii) who are not terminated for cause as defined in the Excess Plans. For purposes of computing the Excess Plans’ benefits, a participant’s compensation is defined the same as it is for the Pension Plan. However, the limits on the compensation under the Pension Plan that are imposed by the Code do not apply under the Excess Plans.
The benefit under the Excess Plans is payable in a lump sum and may be transferred to the Employees’ Deferral Plan. A benefit payable to certain highly compensated participants cannot be paid for six months following separation from service. Messrs. Mitchell and Moughler and Ms. Lockwood participate in an Excess Plan.
The Non-Qualified Supplemental Defined Contribution Plan (the “NQDC Plan”) is an unfunded, non-qualified plan that provides a contribution equivalent to Ashland match and supplemental company contributions on annual incentive compensation paid and eligible earnings in excess of limits established under Code Section 401(a)(17) not permitted in the qualified 401(k) plan. The account balance may be invested in the mutual funds available in the Employees’ Deferral Plan (see “—Ashland Inc. Employees’ Deferral Plan”). The benefit
138
Table of Contents
payable under the NQDC Plan will be made in installments or as a lump sum based on distribution elections. Named executive officers and certain other highly compensated participants cannot begin to receive distributions for six months following separation from service. Ms. Matheys participates in the NQDC Plan. The NQDC Plan was amended on May 13, 2015 to fix the Substitute Contribution at four percent of Participant’s Incentive Compensation, Excess Base Compensation and Excess Base Compensation Deferrals for the Plan Year (each as defined in the NQDC Plan). In addition, the one-year service requirement was removed from the NQDC Plan allowing immediate participation in the NQDC Plan upon hire.
Ashland Inc. Supplemental Early Retirement Plan for Certain Employees (SERP)
The SERP is an unfunded, non-qualified plan allowing designated employees to retire prior to their sixty-fifth birthday without an immediate substantial loss of income. The SERP is a supplemental retirement arrangement for a select group of management participating in the SERP as of December 31, 2010. Beginning January 1, 2011, the eligibility for this program was restricted to employees participating in the Ashland Hercules Pension Plan who were subsequently promoted into an executive level position, on or after January 1, 2011. Employees not eligible for the Ashland Hercules Pension Plan who would have otherwise been eligible to participate in the SERP will now participate only in the NQDC Plan.
The SERP benefit formula covering the applicable named executive officers and certain other designated executive level participants provides a benefit of 25% of final average compensation multiplied by the participant’s years of service up to 20 years. For this purpose, the final average compensation formula is total compensation (base plus incentive compensation) for the 36 months out of the 84 months before retirement that produces the highest average.
The applicable named executive officers may retire on the earlier of age 55 with three years of service or when the sum of the executive’s age and service equals at least 80. The benefit produced by the above described formula is subject to proportionate reduction for each year of service credited to the participant that is less than 20 years of service. Additionally, the benefit is reduced by the sum of the following:
| • | the participant’s qualified Pension Plan benefit (assuming the LESOP offset account is transferred to the Pension Plan); |
| • | the participant’s Excess Plans benefit; and |
| • | 50% of any shares of Ashland common stock that could not be allocated to the participant’s account in the LESOP due to Code limits. |
SERP benefits become vested upon attaining three years of service. Messrs. Mitchell and Moughler and Ms. Lockwood are vested in the SERP. Ms. Matheys is not eligible to participate in the SERP.
The SERP benefit is payable in a lump sum and may be transferred to the Employees’ Deferral Plan. Distributions to certain highly compensated participants cannot begin until six months after separation from service.
The SERP contains a non-compete provision. Any executive who, within a period of five years after his or her termination of employment, accepts a consulting or employment engagement that is in direct and substantial conflict with the business of Ashland will be deemed to have breached the SERP provisions. A breach in the SERP provisions requires the executive to reimburse Ashland for any distributed benefits and to forfeit benefits that have not yet been paid under the plan.
Ordinarily, years of service in addition to what is actually incurred are not granted. However, in the case of an acquisition, prior service with the acquired business is counted for purposes of vesting but not for calculating benefits under the SERP.
139
Table of Contents
The SERP was amended on July 15, 2015 to stipulate designated employees participating in the SERP as of December 30, 2010 shall continue to have their benefit calculated on 36 months out of the 84 months before retirement that produces the highest average. Designated employees entering the SERP on or after January 1, 2011 shall have their benefit calculated on 60 months out of 120 months before retirement that produces the highest average. On November 18, 2015, the P&C Committee took action to close the SERP to those participating in the Ashland Hercules Pension Plan who receive an executive level promotion. The SERP is now closed to all new participants.
Non-Qualified Deferred Compensation for Fiscal 2015
The following table sets forth certain information for each of the Valvoline named executive officers regarding non-qualified deferred compensation for fiscal 2015.
| Name |
Executive Contributions in Last FY (1) ($) (b) |
Registrant Contributions in Last FY (2) ($) (c) |
Aggregate Earnings/ (Investment Change) in Last FY (3) ($) (d) |
Aggregate Withdrawals/ Distributions in Last FY ($) (e) |
Aggregate Balance at September 30, 2015 ($) (f) |
|||||||||||||||
| S.J. Mitchell |
85,530 | 0 | (130,597 | ) | 0 | 6,364,231 | ||||||||||||||
| C.A. Moughler |
0 | 0 | (8,697 | ) | (3,816 | ) | 528,563 | |||||||||||||
| F.E. Lockwood |
0 | 0 | 6,240 | 0 | 725,584 | |||||||||||||||
| H.J. Matheys |
0 | 9,462 | (33 | ) | 0 | 14,848 | ||||||||||||||
| (1) | The value for Mr. Mitchell included in column (b) relates to the deferral of a portion of his salary in fiscal 2015 and is included in column (c) of the Summary Compensation Table in this prospectus. |
| (2) | The value in column (c) for Ms. Matheys relates to a contribution equivalent to the company match and supplemental company contributions on annual incentive compensation and base pay in excess of limits established under Code Section 401(a)(17) and not permitted in the qualified 401(k) plan. This amount is reported in column (i) of the Summary Compensation Table (inclusive of taxes) in this prospectus. |
| (3) | Aggregate earnings are composed of interest, dividends, capital gains and appreciation/depreciation of investment results. These earnings are not included in the Summary Compensation Table in this prospectus. |
Ashland Inc. Employees’ Deferral Plan
The Employees’ Deferral Plan is an unfunded, non-qualified deferred compensation plan for a select group of highly compensated employees. Participants may elect to have up to 50% of base pay and up to 100% of their incentive compensation and/or Performance Units contributed to the plan. Elections to defer compensation must be made in the calendar year prior to the calendar year in which payment is received.
Participants elect how to invest their account balances from among a diverse set of mutual fund offerings and a hypothetical Ashland common stock fund. No guaranteed interest or earnings are available and there are no above market rates of return on investments in the plan. Beginning October 1, 2000, investments in Ashland common stock units must remain so invested and must be distributed as Ashland common stock. Beginning with January 2016, LTIP deferrals paid in stock must be invested in Ashland common stock and must remain unchanged. In all other events, participants may freely elect to change their investments. Withdrawals are allowed for an unforeseeable emergency (single sum payment sufficient to meet the emergency), disability (lump sum payment), upon separation from employment (payable as lump sum or installments per election) and at a specified time (paid as single sum). In addition, for pre-2005 contributions, participants may elect to have withdrawals paid in a lump sum (subject to a penalty of up to 10%).
A description of the NQDC Plan is included in the narrative to the Pension Benefits table in this prospectus.
140
Table of Contents
Potential Payments upon Termination or Change in Control for Fiscal 2015
The following table summarizes the estimated amounts payable to each Valvoline named executive officer in the event of a termination from employment or change in control as of September 30, 2015. A narrative description follows the table. Different termination events are identified in columns (b)-(g). Column (a) enumerates the types of potential payments for each Valvoline named executive officer. As applicable, each payment or benefit is estimated across the table under the appropriate column or columns.
These estimates are based on the assumption that the various triggering events occur on September 30, 2015, the last day of the 2015 fiscal year. The equity incentive-based components are based on the closing price of Ashland’s common stock as of September 30, 2015 ($100.62). Other material assumptions used in calculating the estimated compensation and benefits under each triggering event are noted below. The actual amounts that would be paid to a Valvoline named executive officer upon certain terminations of employment or upon a change in control can only be determined at the time an actual triggering event occurs.
| Name/Kinds of Payments |
Termination prior to a Change in Control of Company without Cause ($) (b) |
Disability (6) ($) (c) |
Voluntary Resignation or Involuntary Termination for Cause (7) ($) (d) |
Retirement (8) ($) (e) |
Change in Control without Termination (9) ($) (f) |
Termination after Change in Control of Company without Cause or by Executive for Good Reason (10) ($) (g) |
||||||||||||||||||
| S. J. Mitchell |
||||||||||||||||||||||||
| Cash severance |
705,337 | 0 | 0 | 0 | 0 | 1,707,217 | ||||||||||||||||||
| Accelerated SARs (1)(12) |
120,852 | 0 | 0 | 0 | 120,852 | 0 | ||||||||||||||||||
| Restricted stock (11)(12) |
211,403 | 0 | 0 | 0 | 262,014 | 804,960 | ||||||||||||||||||
| LTIP (2) |
656,347 | 656,347 | 0 | 656,347 | 948,142 | 7,748 | ||||||||||||||||||
| Incentive compensation (3) |
485,816 | 485,816 | 0 | 485,816 | 485,816 | 0 | ||||||||||||||||||
| Welfare benefit |
10,403 | 0 | 0 | 0 | 0 | 32,284 | ||||||||||||||||||
| Outplacement |
7,000 | 0 | 0 | 0 | 0 | 7,000 | ||||||||||||||||||
| Financial planning |
5,000 | 0 | 0 | 0 | 0 | 5,000 | ||||||||||||||||||
| 280G excise tax gross-up (4) |
0 | 0 | 0 | 0 | 0 | 0 | ||||||||||||||||||
| Present value of retirement benefits (5) |
0 | 0 | 0 | 0 | 0 | 418,254 | ||||||||||||||||||
| Total |
2,202,158 | 1,142,163 | 0 | 1,142,163 | 1,816,824 | 2,982,463 | ||||||||||||||||||
| C.A. Moughler |
||||||||||||||||||||||||
| Cash severance |
319,947 | 0 | 0 | 0 | 0 | 319,947 | ||||||||||||||||||
| Accelerated SARs (1)(12) |
27,543 | 0 | 0 | 0 | 31,641 | 0 | ||||||||||||||||||
| Restricted stock (11)(12) |
25,457 | 0 | 0 | 0 | 62,787 | 0 | ||||||||||||||||||
| LTIP (2) |
175,548 | 175,548 | 0 | 175,548 | 249,336 | 0 | ||||||||||||||||||
| Incentive compensation (3) |
175,436 | 175,436 | 0 | 175,436 | 175,436 | 0 | ||||||||||||||||||
| Welfare benefit |
12,028 | 0 | 0 | 0 | 0 | 12,028 | ||||||||||||||||||
| Outplacement |
7,000 | 0 | 0 | 0 | 0 | 7,000 | ||||||||||||||||||
| Financial planning |
1,500 | 0 | 0 | 0 | 0 | 1,500 | ||||||||||||||||||
| 280G excise tax gross-up (4) |
0 | 0 | 0 | 0 | 0 | 0 | ||||||||||||||||||
| Present value of retirement benefits (5) |
0 | 0 | 0 | 0 | 0 | 0 | ||||||||||||||||||
| Total |
744,459 | 350,984 | 0 | 350,984 | 519,200 | 340,475 | ||||||||||||||||||
| F.E. Lockwood |
||||||||||||||||||||||||
| Cash severance |
298,776 | 0 | 0 | 0 | 0 | 298,776 | ||||||||||||||||||
| Accelerated SARs (1)(12) |
27,543 | 0 | 0 | 0 | 31,641 | 0 | ||||||||||||||||||
| Restricted stock (11)(12) |
230,219 | 0 | 0 | 0 | 472,411 | 0 | ||||||||||||||||||
| LTIP (2) |
175,548 | 175,548 | 0 | 175,548 | 249,336 | 0 | ||||||||||||||||||
| Incentive compensation (3) |
162,745 | 162,745 | 0 | 162,745 | 162,745 | 0 | ||||||||||||||||||
| Welfare benefit |
10,693 | 0 | 0 | 0 | 0 | 10,693 | ||||||||||||||||||
| Outplacement |
7,000 | 0 | 0 | 0 | 0 | 7,000 | ||||||||||||||||||
| Financial planning |
1,500 | 0 | 0 | 0 | 0 | 1,500 | ||||||||||||||||||
| 280G excise tax gross-up (4) |
0 | 0 | 0 | 0 | 0 | 0 | ||||||||||||||||||
| Present value of retirement benefits (5) |
0 | 0 | 0 | 0 | 0 | 0 | ||||||||||||||||||
| Total |
914,023 | 338,293 | 0 | 338,293 | 916,134 | 317,969 | ||||||||||||||||||
141
Table of Contents
| Name/Kinds of Payments |
Termination prior to a Change in Control of Company without Cause ($) (b) |
Disability (6) ($) (c) |
Voluntary Resignation or Involuntary Termination for Cause (7) ($) (d) |
Retirement (8) ($) (e) |
Change in Control without Termination (9) ($) (f) |
Termination after Change in Control of Company without Cause or by Executive for Good Reason (10) ($) (g) |
||||||||||||||||||
| H.J. Matheys |
||||||||||||||||||||||||
| Cash severance |
291,199 | 0 | 0 | 0 | 0 | 291,199 | ||||||||||||||||||
| Accelerated SARs (1) |
0 | 0 | 0 | 0 | 20,298 | 0 | ||||||||||||||||||
| Restricted stock (11) |
0 | 0 | 0 | 0 | 62,787 | 0 | ||||||||||||||||||
| LTIP (2) |
126,345 | 126,345 | 0 | 126,345 | 200,133 | 0 | ||||||||||||||||||
| Incentive compensation (3) |
183,088 | 183,088 | 0 | 183,088 | 183,088 | 0 | ||||||||||||||||||
| Welfare benefit |
1,945 | 0 | 0 | 0 | 0 | 1,945 | ||||||||||||||||||
| Outplacement |
7,000 | 0 | 0 | 0 | 0 | 7,000 | ||||||||||||||||||
| Financial planning |
1,500 | 0 | 0 | 0 | 0 | 1,500 | ||||||||||||||||||
| 280G excise tax gross-up (4) |
0 | 0 | 0 | 0 | 0 | 0 | ||||||||||||||||||
| Present value of retirement benefits (5) |
0 | 0 | 0 | 0 | 0 | 0 | ||||||||||||||||||
| Total |
611,077 | 309,433 | 309,433 | 466,306 | 301,644 | |||||||||||||||||||
| (1) | A change in control without termination results in unvested SARs becoming immediately vested for SARs granted under the 2011 Incentive Plan. See the Outstanding Equity Awards at Fiscal Year-End table in this prospectus for the number of SARs outstanding for each named executive officer. As discussed below and in footnote 11, grants of SARs for fiscal 2016 under the 2015 Incentive Plan after the July 15, 2015 amendment have been made using the Double-Trigger Award Agreements. |
| (2) | The LTIP amounts identified in all of the columns except for columns (f) and (g) are based on the actual results for the fiscal 2013-2015 performance period and pro-rata payments under the LTIP for the fiscal 2014-2016 and fiscal 2015-2017 performance periods at their respective targets (to the extent the named executive officer received a grant). If one of the events represented by columns (b), (c) or (e) occurred, the pro-rata payments would be based on actual results, rather than target. |
Pursuant to the 2011 Incentive Plan and the related award agreements, in the event of a change in control without termination as of September 30, 2015, as reported in column (f), the calculation would be based on the actual results for the fiscal 2013-2015 performance period. The fiscal 2014-2016 and fiscal 2015-2017 performance periods would be accelerated and payment would be made based on actual results up to the date of the change in control. For purposes of this table, column (f) is calculated based on achievement of target for the fiscal 2014-2016 and fiscal 2015-2017 performance periods.
Pursuant to the executive change in control agreements, the amount identified in column (g) of this table for Mr. Mitchell represents the LTIP Performance Units that are outstanding being paid at target, reduced by the amount the executive would receive as a result of a change in control identified in column (f).
As discussed below and in footnote 11, grants of performance units in fiscal 2016 to named executive officers were made pursuant to Double-Trigger Award Agreements under the 2015 Incentive Plan.
| (3) | The amounts identified in the Incentive Compensation row of columns (b), (c) and (e) represent a payment of the fiscal 2015 annual incentive compensation based on actual results for the entire performance period. Upon a change in control, the performance period relating to any incentive award will be accelerated and payment will be made based upon achievement of the performance goals up to the date of the change in control. The amounts identified in the Incentive Compensation row of column (f) reflect this payment, based on actual results for the fiscal year. |
| (4) | Section 280G of the Code applies if there is a change in control of Ashland, compensation is paid to a named executive officer as a result of the change in control (“parachute payments”), and the present value of the parachute payments is 300% or more of the executive’s “base amount,” which equals the average W-2 income for the five-calendar-year period immediately preceding the change in control. If Section 280G applies, then the named executive officer is subject to an excise tax, under Section 4999(a) of the Code, equal to 20% of the amount of the parachute payments in excess of the base amount (the “excess parachute payments”), in addition to income and employment taxes. Moreover, Ashland is denied a federal income tax deduction for the excess parachute payments. The amounts in the 280G Excise Tax Gross-Up row of columns (f) and (g) reflect a tax gross-up, if any, for the excise and related taxes, as required under the terms of the executive change in control agreements described below, which was effective on September 30, 2015. The calculations are based on the following assumptions: (i) an excise tax rate of 20% and a combined federal, state and local income and employment tax rate of 51%, (ii) a discount rate of 0.43%, and (iii) no amounts were allocated to the non-solicitation of non-competition covenants contained in the executive change in control agreements. See below for a discussion of the 2015 change in control agreements, which eliminate all legacy gross-up provisions in Ashland’s change in control agreements. |
| (5) | The present value of each applicable named executive officer’s retirement benefits as of September 30, 2015 (absent a change in control), is in the Pension Benefits table to this prospectus. The account balances for each named executive officer as of September 30, 2015 in the Employees’ Deferral Plan are identified in the Non-Qualified Deferred Compensation table to this prospectus. |
A change in control results in an additional three years each of age and service being credited to the calculation of Mr. Mitchell’s benefit under the SERP. The present value of this incremental additional benefit is identified in the Present Value of Retirement Benefits row of
142
Table of Contents
this table in column (f) for the applicable named executive officers. Mr. Mitchell gains a benefit from the additional age and service because he has less than the 20 years necessary for a full SERP benefit, therefore, the additional service credit brings him closer to a full SERP benefit.
| (6) | For purposes of column (c), it is assumed that the named executive officer incurred a disabling event and termination on September 30, 2015. No pre-retirement mortality assumption applies and the interest rate used is 8.01%. Subject to coordination with other income received while disabled, the Long Term Disability Plan provides a benefit equal to 60% of base compensation. The compensation covered by the plan is limited in 2015 to $10,000 per month. If the named executive officer died, his beneficiaries would receive the same accelerated vesting of the Performance Unit as the named executive officer would in the event of disability. The named executive officers also participate in a group variable universal life plan (“GVUL”) that is available to certain highly compensated employees. In the event of death, the executive receives the same benefits as identified with regard to disability in addition to the face amount of the policy plus their own invested amounts. For Messrs. Mitchell and Moughler and Mses. Matheys and Lockwood, the death benefits as of September 30, 2015 would be: $500,124, $1,077,187, $500,018, and $564,048, respectively. |
| (7) | Ashland does not maintain any plans or arrangements that would provide additional or enhanced benefits to the named executive officers solely as a result of a voluntary termination. |
| (8) | The requirements for retirement and receiving benefits under the retirement plans are described under the Pension Benefits table to this prospectus. |
| (9) | Under the Employees’ Deferral Plan, in an event of a change in control, the named executive officers will receive an automatic lump sum distribution of the benefit for deferrals made before January 1, 2005. Deferrals made on or after January 1, 2005 will not be automatically distributed upon a change in control, but rather will be distributed pursuant to each employee’s election and valued at the time of the distribution. To the extent that an executive’s account is invested in hypothetical shares of Ashland common stock, those shares would be valued at the highest price for which Ashland common stock closed during the 30 days preceding the change in control. |
| (10) | A termination after a change in control assumes a termination at September 30, 2015 and the change in control occurring at an earlier time. Therefore, column (f) would have already been received by the named executive officer. |
| (11) | As described below, the P&C Committee approved Double-Trigger Award Agreements that can be used under the 2015 Incentive Plan and provide benefits upon a change in control and qualifying termination. |
| (12) | Because Messrs. Mitchell and Moughler and Ms. Lockwood are retirement eligible, under the Severance Pay Plan they would be eligible for payroll continuation. As such, during the payroll continuation period, their SARs would continue to vest and any RS that would have vested during that time would be accelerated pursuant to authorization of the P&C Committee. |
Severance Pay Plan
The Valvoline named executive officers are covered by the Severance Pay Plan that provides benefits in the event of a covered termination from employment in the absence of a change in control. A termination for which benefits under the plan will be considered include those directly resulting from the permanent closing of a facility, job discontinuance, or other termination at Ashland’s initiative for which Ashland elects to provide benefits. Certain terminations are excluded from coverage by the Severance Pay Plan (for example, refusal to sign a severance agreement and release; discharge for less than effective performance, absenteeism or misconduct; or voluntary resignation).
In order for any executive to receive benefits and compensation payable under the Severance Pay Plan, the executive must agree to a general release of liability which relates to the period of employment and the termination. In addition, the executive must agree to refrain from engaging in competitive activity against Ashland and refrain from soliciting persons working for Ashland, soliciting customers of Ashland or otherwise interfering with Ashland’s business for a stated period of time following the termination. The executive must also agree not to disclose Ashland’s confidential information.
The benefit payable under the Severance Pay Plan to the Valvoline named executive officers is 52 weeks of base pay. Payments will be made as payroll continuation in bi-weekly increments if the executive is retirement eligible (or would be at the end of the payroll continuation period). If the executive is not retirement eligible or paying the benefit as payroll continuation will not make the executive retirement eligible, the benefit is paid as a lump sum. Payment of such amounts may be subject to a six-month deferral in order to comply with Section 409A of the Code.
Any executive who receives payroll continuation may also remain in the medical, dental, vision, group life and pension plans for the executive’s benefit continuation period. The benefit continuation period in that case is two weeks for each completed year of service, with a maximum of 52 weeks. Any executive who receives a lump sum severance benefit will be eligible to elect COBRA continuation of coverage at active employee rates for a period of three months and at full cost thereafter.
143
Table of Contents
Executive Change in Control Agreements
Mr. Mitchell has a change in control agreement with Ashland. This agreement describes the payments and benefits to which an executive is entitled if terminated after a change in control. The agreements in effect as of September 30, 2015 are described below.
If within two years after a Change in Control (as defined in the “Definitions” section below) Mr. Mitchell’s employment is terminated without Cause or the executive terminates employment for Good Reason (each as defined in the “Definitions” section below), he will be entitled to the following:
| • | payment of two times the sum of his highest annual base compensation and highest target percentage annual incentive compensation in respect of the prior three fiscal years preceding the fiscal year in which the termination occurs in a lump sum paid in the seventh month following termination; |
| • | continued participation in Ashland’s medical, dental and group life plans through December 31 of the second calendar year following the calendar year in which he was terminated; |
| • | full payment at target in cash of any Performance Units granted under LTIP outstanding as of his termination (less any amounts already paid under the LTIP because of the change in control); |
| • | payment in cash of all prior existing incentive compensation not already paid and pro-rata payment of any incentive compensation for the fiscal year in which he terminates at target level; |
| • | outplacement services and financial planning services for one year after termination; |
| • | payment of all unused, earned and accrued vacation in a lump sum in the seventh month following termination; and |
| • | immediate vesting of all outstanding RS/RSUs, SARs and stock options. |
As a condition to receiving the benefits and compensation payable under the agreement, Mr. Mitchell has agreed for a period of 24 months following the termination, absent prior written consent of Ashland’s General Counsel, to refrain from engaging in competitive activity against Ashland; and to refrain from soliciting persons working for Ashland, soliciting customers of Ashland or otherwise interfering with Ashland’s business relationships. Pursuant to the agreement, Mr. Mitchell has also agreed not to disclose confidential information. If Mr. Mitchell breaches the agreement, Ashland has the right to recover benefits that have been paid to him. Finally, Mr. Mitchell may recover legal fees and expenses incurred as a result of Ashland’s unsuccessful legal challenge to the agreement or Mr. Mitchell’s interpretation of the agreement.
Definitions
“Cause” is any of the following:
| • | willfully failing to substantially perform duties after a written demand for such performance (except in the case of disability); |
| • | willfully engaging in gross misconduct demonstrably injurious to Ashland after a written request to cease such misconduct; or |
| • | conviction or plea of nolo contendere for a felony involving moral turpitude. |
| • | To be terminated for cause, the board of directors must pass a resolution by three quarters vote finding that the termination is for cause. |
“Good reason” includes any of the following that occurs after a change in control:
| • | adverse change in position, duties or responsibilities; |
| • | reduction to base salary; |
144
Table of Contents
| • | relocation exceeding 50 miles; |
| • | failure to continue incentive plans, whether cash or equity, or any other plan or arrangement to receive Ashland securities; or |
| • | material breach of the executive change in control agreement or a failure to assume such agreement. |
“Change in control” is a complex definition, but may be summarized to include any of the following:
| • | the consolidation or merger of Ashland into an unrelated entity in which the former Ashland shareholders own less than 50% of the outstanding shares of the new entity, except for a merger under which the shareholders before the merger have substantially the same proportionate ownership of shares in the entity immediately after the merger; |
| • | the sale, lease, exchange or other transfer of 80% or more of Ashland’s assets; |
| • | a shareholder approved liquidation or dissolution; |
| • | the acquisition of 25% or more of the outstanding shares of Ashland by an unrelated person without approval of the board of directors; or |
| • | changes to the Ashland board of directors during two consecutive years that result in a majority of the Ashland board of directors changing from its membership at the start of such two consecutive year period, unless two-thirds of the remaining directors at the start of such two consecutive year period voted to approve such changes. |
On October 5, 2015, the P&C Committee approved new executive change in control agreements for certain Ashland named executive officers, including Mr. Mitchell. The new change in control agreements narrow the circumstances in which the executive will have “good reason” to resign and become entitled to receive severance following a change in control. Also, Mr. Mitchell’s change in control agreement entitled him to a tax “gross-up” for excise taxes payable on certain payments made to him in connection with a change in control of Ashland. The new change in control agreements exclude all excise tax “gross-up” provisions and instead provide for a “best-after-tax” cutback. Except for the modifications described above, the new change in control agreements are substantially the same as the prior change in control agreements.
145
Table of Contents
SARs/Stock Options, Incentive Compensation, Restricted Stock/Restricted Stock Units and Performance Units
The following table summarizes what may happen to SARs, stock options, incentive compensation, RS/RSUs and Performance Units granted under LTIP upon termination from employment; death; disability or retirement; or in the event of a change in control under the 2011 Incentive Plan and the 2015 Incentive Plan, absent Double-Trigger Award Agreements.
| Termination from |
Death, Disability or |
Change in Control | ||||
| SARs/Stock Options |
Termination within one year of grant results in forfeiture; otherwise lesser of 30 days or the exercise period within which to exercise the vested SARs/stock options | May exercise vested SARs/stock options during the remainder of the exercise period | Immediately vest | |||
| Incentive Compensation |
In general, termination before payment results in forfeiture. Pro-rata payment based on actual achievement for entire performance period if terminated prior to a change in control without “cause” | Pro-rata payment based on actual achievement for entire performance period | Accelerate the performance period and pay based on actual achievement through the date of the change in control | |||
| Restricted Stock/Restricted Stock Units |
Termination before vesting results in forfeiture | Occurrence of event before payment results in forfeiture | Immediately vest | |||
| Performance Units |
In general, termination before payment results in forfeiture. Pro-rata payment based on actual achievement for entire performance period if terminated prior to a change in control without “cause” | Pro-rata payment based on actual achievement for entire performance period | Accelerate the performance period and pay based on actual achievement for the period through the date of the change in control | |||
| * | P&C Committee has discretion to accelerate vesting of these benefits. |
For purposes of the above table, the term “change in control” is defined in the applicable plan and has substantially the same meaning as it does in the executive change in control agreements. In addition, the award agreements and incentive plans provide for forfeiture and clawbacks in the event the participant breaches certain non-compete, non-solicitation and confidentiality (subject to whistleblower protections) covenants.
146
Table of Contents
Double-Trigger Award Agreements under the 2015 Incentive Plan
On July 15, 2015, the P&C Committee approved an Amended and Restated 2015 Ashland Inc. Incentive Plan, which provides for the P&C Committee to have the option to grant awards under the 2015 Incentive Plan with double-trigger change in control provisions set forth in an award agreement. The default under the 2015 Incentive Plan is a single-trigger change in control provision. In connection with this amendment, the P&C Committee also approved forms of the award agreements containing the double-trigger change in control provision. All awards granted to the named executive officers under the 2015 Incentive Plan since this amendment have used the Double-Trigger Award Agreements.
In November 2015, the P&C Committee approved new form of award agreements that also exclude the plan to separate Ashland into two independent, publicly traded companies from the definition of “Change in Control.” Other than these changes, the Double-Trigger Agreements are substantially similar to the prior award agreements discussed above.
SERP, Excess Plans, Qualified Pension Plan and Employees’ Deferral Plan
For payments and benefits under the SERP, the Excess Plans and the qualified Pension Plan, except in the event of a change in control, see the Pension Benefits table and the narrative thereunder in this prospectus. For payments and benefits under the Employees’ Deferral Plan, except in the event of a change in control, see the Non-Qualified Deferred Compensation table and the narrative thereunder in this prospectus.
The SERP contains a non-compete provision. Any executive who, within a period of five years after his or her termination of employment, accepts a consulting or employment engagement that is in direct and substantial conflict with the business of Ashland will be deemed to have breached the SERP provisions. A breach of the SERP provisions requires the executive to reimburse Ashland for any distributed benefits and to forfeit benefits that have not yet been paid under the plan.
After a Change in Control
The term “change in control” is defined in the applicable plan and has substantially the same meaning as it does in the executive change in control agreements.
The occurrence of a change in control under the SERP for the applicable named executive officers has the following consequences:
| • | accelerates vesting; |
| • | nullifies the non-compete; |
| • | distributes benefits upon a participant’s termination from employment without cause or resignation for good reason; and |
| • | adds three years each to age and service computation. |
For the qualified Pension Plan and the Excess Plans, no enhanced benefit results from a change in control. Under the Employees’ Deferral Plan, a change in control results in an automatic lump sum distribution of the benefit for deferrals made before January 1, 2005. Deferrals made on and after January 1, 2005, will not be automatically distributed upon a change in control, but rather will be distributed pursuant to each employee’s election and valued at the time of the distribution.
147
Table of Contents
CERTAIN RELATIONSHIPS AND RELATED PARTY TRANSACTIONS
Prior to this offering, we have operated as a business segment of Ashland. Immediately following this offering, Ashland will continue to own approximately % of our common stock. If the underwriters exercise their overallotment option in full, immediately following this offering, Ashland will own approximately % of our common stock. Ashland will continue to have the power acting alone to approve any action requiring the affirmative vote of a majority of the votes entitled to be cast and to elect all our directors.
Prior to completion of this offering, we intend to enter into certain agreements with Ashland relating to this offering and our relationship with Ashland after this offering. The material terms of such agreements with Ashland relating to our historical relationship, this offering and our relationship with Ashland after this offering are described below. We do not currently expect to enter into any additional agreements or other transactions with Ashland, outside the ordinary course, or any of our directors, officers or other affiliates other than those specified below. Any transactions with directors, officers or other affiliates will be subject to requirements of Sarbanes-Oxley and SEC rules and regulations.
Relationship with Ashland
Historical Relationship with Ashland
We have operated as a business segment of Ashland since 1950. As a result, Ashland provides certain corporate services to us, and costs associated with these functions have been allocated to us. These allocations include costs related to corporate services, such as executive management, supply chain, information technology, legal, finance and accounting, investor relations, human resources, risk management, tax, treasury and other services, as well as stock-based compensation expense attributable to our employees and an allocation of stock-based compensation attributable to employees of Ashland. The costs of such services have been allocated to us based on the most relevant allocation method to the service provided, primarily based on relative percentage of total sales, relative percentage of headcount or specific identification. The total amount of these allocations from Ashland was approximately $41.1 million in the six months ended March 31, 2016 and approximately $79.5 million in the year ended September 30, 2015. These cost allocations are primarily reflected within corporate expense allocation in the combined statements of operations and comprehensive income. Management believes the basis on which the expenses have been allocated to be a reasonable reflection of the utilization of services provided to or the benefit received by us during the periods presented. Following the completion of this offering, we expect Ashland to continue to provide some services related to these functions on a transitional basis for a fee. These services will be provided under the transitional services agreement described below. Upon completion of this offering, we will assume responsibility for all our standalone public company costs, including the costs of corporate services currently provided by Ashland.
Ashland as Our Controlling Shareholder
Ashland currently owns 100% of our common stock. Upon completion of this offering, Ashland will hold approximately % of our outstanding common stock (or approximately % if the underwriters exercise their overallotment option in full). For as long as Ashland continues to control more than 50% of our common stock, Ashland or its successor-in-interest will be able to direct the election of all the members of our board of directors and exercise control over our business and affairs, including any determinations with respect to mergers or other business combinations involving us, the acquisition or disposition of assets, the incurrence of indebtedness, the issuance of any additional common stock or other equity securities and the payment of dividends with respect to our common stock. Similarly, Ashland will have the power to determine matters submitted to a vote of our shareholders without the consent of our other shareholders, will have the power to prevent a change in control of us and will have the power to take other actions that might be favorable to Ashland.
Ashland has agreed not to sell or otherwise dispose of any of our common stock for a period of 180 days from the date of this prospectus without the prior written consent of Merrill Lynch, Pierce, Fenner & Smith
148
Table of Contents
Incorporated, Citigroup Global Markets Inc. and Morgan Stanley & Co. LLC. See “Underwriting.” However, there can be no assurance concerning the period of time during which Ashland will maintain its ownership of our common stock following this offering.
Beneficial ownership of at least 80% of the total voting power and value of our outstanding stock is required in order for Ashland to continue to include us in its consolidated group for U.S. federal income tax purposes, and beneficial ownership of at least 80% of the total voting power of our classes of voting stock and 80% of each class of our non-voting stock is required in order for Ashland to effect the spin-off of us or certain other tax-free transactions. Ashland announced on April 13, 2016 that it plans to distribute its shares of our common stock approximately six months after the closing of this offering. It is intended that we will be included in Ashland’s consolidated group for U.S. federal income tax purposes immediately following this offering until the spin-off. Ashland may abandon or change the structure of the spin-off if it determines, in its sole discretion, that the spin-off is not in the best interest of Ashland or its shareholders.
Separation Steps
No later than the completion of this offering, Ashland will transfer to us substantially all of the assets and liabilities related to our business. Except for the nominal assets that we currently hold, Ashland holds all of the historical assets and liabilities related to the business that we will acquire pursuant to such contribution. We and Ashland will enter into the Separation Agreement, which provides for the separation of our business from Ashland to take effect no later than the completion of this offering. In addition, we and Ashland will enter into transition services agreements governing Ashland’s provision of various services to us, and our provision of various services to Ashland, on a transitional basis and several ancillary agreements in connection with the separation. The material agreements we expect to enter into with Ashland are summarized below.
The Separation Agreement will take effect no later than the effectiveness of this offering and will contain the key provisions related to our separation from Ashland, this offering and the spin-off or other disposition. The other agreements that will be referenced in the Separation Agreement govern various interim and ongoing relationships between Ashland and us following the completion of this offering. These agreements, each of which is summarized below, include the:
| • | transition services agreement; |
| • | reverse transition services agreement; |
| • | Tax Matters Agreement; |
| • | registration rights agreement; |
| • | employee matters agreement; and |
| • | shared environmental liabilities agreement. |
Separation Agreement
We intend to enter into the Separation Agreement with Ashland before the completion of this offering. The Separation Agreement will set forth our agreements with Ashland regarding the principal actions to be taken in connection with the separation. It will also set forth other agreements that govern aspects of our relationship with Ashland following the separation and the completion of this offering.
Transfer of Assets and Assumption of Liabilities
The Separation Agreement will identify certain transfers of assets and assumptions of liabilities that are necessary in advance of our separation from Ashland so that we and Ashland retain the assets of, and the liabilities associated with, our respective businesses. However, certain liabilities that are not associated with our
149
Table of Contents
respective businesses will be allocated regardless of which business they are associated with (if any). For example, Ashland will retain, or assume from us, substantially all liabilities arising from or relating to the exposure of any person to asbestos from the manufacture, production, sale, distribution, conveyance or placement in the stream of commerce on or prior to the date of the separation of any product or other item, as well as from repair, use, abatement or disposal on or prior to the date of the separation of any building material or equipment containing asbestos, regardless of whether related to Ashland’s business or our business. In addition, Ashland will retain, or assume from us, all environmental liabilities, known or unknown, arising from or relating to the Ashland business or any other historical business of Ashland, other than our business, arising or relating to events, conduct or conditions occurring prior to, or after, the date of the separation.
The Separation Agreement will also provide for the settlement or extinguishment of certain liabilities and other obligations between us and Ashland.
Internal Transactions
The Separation Agreement will provide for certain internal transactions related to our separation from Ashland that will occur prior to the separation.
Intercompany Arrangements
All agreements, arrangements, commitments and understandings, including most intercompany accounts payable or accounts receivable, between us, on the one hand, and Ashland, on the other hand, will terminate effective as of the separation, except specified agreements and arrangements that are intended to survive the separation.
Shared Liabilities
The Tax Matters Agreement, employee matters agreement and shared environmental liabilities agreement will describe certain liabilities that will be shared between us and Ashland following the separation. These agreements will respectively specify the portion of the economic costs of such liabilities between us and Ashland and will establish a process for managing, defending and resolving, as well as sharing the costs related to, such liabilities between us and Ashland.
Credit Support
We will agree to use reasonable best efforts to arrange, prior to the separation, for the replacement of all guarantees, covenants, indemnities, surety bonds, letters of credit or similar assurances of credit support currently provided by or through Ashland or any of its affiliates for the benefit of our business.
Representations and Warranties
In general, neither we nor Ashland will make any representations or warranties regarding any assets or liabilities transferred or assumed, any consents or approvals that may be required in connection with these transfers or assumptions, the value or freedom from any lien or other security interest of any assets transferred, the absence of any defenses relating to any claim of either party or the legal sufficiency of any conveyance documents. Except as expressly set forth in the Separation Agreement, all assets will be transferred on an “as is,” “where is” basis.
Further Assurances
The parties will use reasonable best efforts to affect any transfers contemplated by the Separation Agreement that have not been consummated prior to the separation as promptly as practicable following the closing of this offering. In addition, the parties will use reasonable best efforts to affect any transfer or re-transfer of any asset or liability that was improperly transferred or retained as promptly as practicable following the separation.
150
Table of Contents
The Initial Public Offering
The Separation Agreement will govern our and Ashland’s respective rights and obligations regarding this offering. Prior to the completion of this offering, we will take all actions reasonably requested by Ashland in connection with this offering. Ashland will have the sole and absolute discretion to determine the terms of, and whether to proceed with, this offering and any subsequent spin-off or other disposition of our stock by Ashland.
Conditions
The Separation Agreement will also provide that several conditions must be satisfied or waived by Ashland in its sole and absolute discretion before the separation can occur. Ashland has the right not to complete the separation if, at any time, the Ashland board of directors determines, in its sole and absolute discretion, that the separation is not in the best interests of Ashland or its shareholders or is otherwise not advisable.
Exchange of Information
We and Ashland will agree to provide each other with information reasonably necessary to comply with reporting, disclosure, filing or other requirements of any national securities exchange or governmental authority, for use in judicial, regulatory, administrative and other proceedings and to satisfy audit, accounting, regulatory, litigation and other similar requests. We and Ashland will also agree to use reasonable best efforts to retain such information in accordance with Ashland’s record retention policies as in effect on the date of the Separation Agreement. Each party will also agree to use its reasonable best efforts to assist the other with its financial reporting and audit obligation for an agreed period of time.
Termination
The Ashland board of directors, in its sole and absolute discretion, may terminate the Separation Agreement at any time prior to the separation.
Release of Claims
We and Ashland will each agree to release the other and its affiliates, successors and assigns, and all persons that prior to the separation have been the other’s shareholders, directors, officers, agents and employees, and their respective heirs, executors, administrators, successors and assigns, from any claims against any of them that arise out of or relate to events, circumstances or actions occurring or failing to occur or any conditions existing at or prior to the time of the separation. These releases will be subject to exceptions set forth in the Separation Agreement.
Indemnification
We and Ashland will each agree to indemnify the other and each of the other’s current and former directors, officers and employees, and each of the heirs, executors, successors and assigns of any of them, against certain liabilities incurred in connection with the separation and our and Ashland’s respective businesses. The amount of either Ashland’s or our indemnification obligations will be reduced by any insurance proceeds the party being indemnified receives. The Separation Agreement will also specify procedures regarding claims subject to indemnification.
Transition Services Agreement
We intend to enter into a transition services agreement pursuant to which Ashland will provide us with specified services for a limited time to help ensure an orderly transition following the separation. The transition services agreement will specify the calculation of our costs for these services. The cost of these services will be negotiated between us and Ashland and may not necessarily be reflective of prices that we could have obtained for similar services from an independent third party.
151
Table of Contents
In general, the services will begin on the date of the closing of this offering and will cover a period generally not expected to exceed 24 months following the separation.
Reverse Transition Services Agreement
We intend to enter into a reverse transition services agreement pursuant to which we will provide Ashland with specified services for a limited time to help ensure an orderly transition following the separation. The reverse transition services agreement will specify the calculation of our prices for these services. The prices of these services will be negotiated between us and Ashland and may not necessarily be reflective of prices that we could have obtained for providing similar services to an independent third party.
In general, the services will begin on the date of the closing of this offering and will cover a period generally not expected to exceed 24 months following the separation.
Tax Matters Agreement
We and Ashland will enter into a Tax Matters Agreement that will govern the respective rights, responsibilities and obligations of Ashland and us after the closing of this offering with respect to all tax matters (including tax liabilities, tax attributes, tax returns and tax contests).
Registration Rights Agreement
Prior to the completion of this offering, we will enter into a registration rights agreement with Ashland with customary representations, warranties and covenants, pursuant to which we will grant Ashland and its affiliates certain registration rights with respect to our common stock owned by them.
Employee Matters Agreement
We intend to enter into an employee matters agreement with Ashland that will address employment, compensation and benefits matters, including the allocation and treatment of assets and liabilities relating to employees and compensation and benefit plans and programs in which our employees participate prior to the spin-off, as well as other human resources, employment and employee benefit matters.
Other Arrangements
Related Party Transactions
William A. Wulfsohn and , who will be members of our board of directors, also serve on Ashland’s board of directors. The fact that Mr. Wulfsohn or these directors hold positions with both Ashland and us could create, or appear to create, potential conflicts of interest for Mr. Wulfsohn or these directors when they face decisions that may affect both Ashland and us. These members of our board of directors may be required to recuse themselves from deliberations relating to arrangements between us and Ashland. Mr. Wulfsohn may also face conflicts of interest with regard to the allocation of his time between Ashland and us.
152
Table of Contents
The following table sets forth information regarding the beneficial ownership of our common stock as of , 2016, after giving effect to the separation and contribution transactions (in the case of the “Percentage Prior to this Offering” column, other than the sale of the shares of our common stock in this offering and the receipt and application of the proceeds in connection therewith) and assuming the underwriters do not exercise their overallotment option, by:
| • | each of our directors; |
| • | each of our named executive officers; |
| • | all of our directors and executive officers as a group; and |
| • | each person, or group of affiliated persons, who is known by us to beneficially own more than 5% of our common stock. |
Beneficial ownership for the purposes of the following table is determined in accordance with the rules and regulations of the SEC. These rules generally provide that a person is the beneficial owner of securities if they have or share the power to vote or direct the voting thereof, or to dispose or direct the disposition thereof or have the right to acquire such powers within 60 days. Accordingly, the following table does not include options to purchase our common stock that are not exercisable within the next 60 days. This table does not reflect any shares of common stock that our directors and executive officers may purchase in this offering. Unless otherwise indicated, the address of each beneficial owner listed in the table below is c/o Ashland, 50 E. RiverCenter Boulevard, P.O. Box 391, Covington, KY 41012.
| Name and Address of |
Beneficial Ownership of our Common Stock |
Percentage Prior to this Offering |
Percentage After this Offering |
|||||||
| 5% Shareholders |
||||||||||
| Ashland(1) |
100 | % | % | |||||||
| Directors and Named Executive Officers |
||||||||||
| Thomas A. Gerrald |
% | % | ||||||||
| Frances E. Lockwood |
% | % | ||||||||
| Heidi J. Matheys |
% | % | ||||||||
| Samuel J. Mitchell, Jr. |
% | % | ||||||||
| Craig A. Moughler |
% | % | ||||||||
| Julie M. O’Daniel |
% | % | ||||||||
| Anthony R. Puckett |
% | % | ||||||||
| William A. Wulfsohn |
% | % | ||||||||
| All directors and executive officers as a group ( persons) |
% | % | ||||||||
| * | Less than 1% |
| (1) | The address of Ashland is 50 E. RiverCenter Boulevard, P.O. Box 391, Covington, KY 41012. |
153
Table of Contents
Following the closing of this offering, we expect to have the following indebtedness:
| • | new senior term loans (which may be secured or unsecured), new senior unsecured notes or a combination thereof in an aggregate principal amount of approximately $ million; |
| • | a new senior revolving credit facility (which may be secured or unsecured) providing for aggregate borrowings of up to $ million; and |
| • | an accounts receivable securitization facility with up to $ million of available funding from qualified receivables. |
Prior to the closing of this offering, we expect to incur new senior term loans (which may be secured or unsecured), new senior unsecured notes or a combination thereof in an aggregate principal amount of approximately $ million. We expect to transfer the proceeds of this indebtedness to Ashland through intercompany transfers. Upon closing this offering, we expect to apply $ million of net proceeds from this offering to repay this indebtedness. After giving effect to these transactions, following the closing of this offering, we expect to have new senior term loans (which may be secured or unsecured), new senior unsecured notes or a combination thereof in an aggregate principal amount of approximately $ million. We also plan to obtain an accounts receivable securitization facility with up to $ million of available funding from qualified receivables.
In addition to the senior term indebtedness described above, in the event that the net proceeds of this offering are expected to exceed $ million, we may incur certain short-term indebtedness immediately prior to the closing of this offering and transfer the net proceeds thereof to a subsidiary of Ashland Global. We plan to repay such short-term indebtedness in full from the net proceeds of this offering.
This summary of certain financing arrangements does not purport to be complete and is subject to, and qualified in its entirety by reference to, the underlying agreements which are filed as exhibits to the registration statement of which this prospectus is a part.
154
Table of Contents
The following description summarizes the most important terms of our capital stock, as they are expected to be in effect upon the consummation of this offering. We expect to adopt amended and restated articles of incorporation and amended and restated by-laws in connection with this offering, and this description summarizes the provisions that are expected to be included in such documents. This description is not complete and is qualified by reference to the full text of our amended and restated articles of incorporation and amended and restated by-laws, the forms of which will be filed as exhibits to the registration statement of which this prospectus is a part, as well as the applicable provisions of Kentucky law. Our amended and restated articles of incorporation and our amended and restated by-laws will contain provisions intended to enhance the likelihood of continuity and stability in the composition of our board of directors and that could make it more difficult to acquire control of us by means of a tender offer, open market purchases, a proxy contest or otherwise. For additional information, see “Risk Factors—Anti-takeover provisions in our charter documents and under Kentucky law could discourage, delay or prevent a change in control of our company and may result in an entrenchment of management and diminish the value of our common stock” and “Risk Factors—Our board of directors will have the ability to issue blank check preferred stock, which may discourage or impede acquisition attempts or other transactions.”
General
Upon completion of this offering, our authorized capital stock will consist of:
| • | shares of common stock, par value $0.01; and |
| • | shares of preferred stock, no par value, in one or more series. |
Upon completion of this offering, there will be outstanding shares of common stock ( shares if the underwriters exercise their overallotment option in full) and no outstanding shares of preferred stock.
Common Stock
Voting Rights
Each share of common stock will entitle its holder to one vote in the election of directors and other matters properly submitted to a vote of the holders of our common stock; provided, however, that, except where required by law, holders of our common stock will not be entitled to vote on any amendment relating to the creation of any series of blank check preferred stock.
Dividend Rights
Subject to the rights of the holders of any preferred stock that may be outstanding, holders of common stock will be entitled to receive, on a pro rata basis, such dividends and distributions, if any, as may be lawfully declared from time to time by our board of directors. Declaration and payment of dividends are subject to the discretion of our board of directors, and the holders of outstanding shares of our common stock will be entitled to receive dividends only when declared by our board of directors. If declared, dividends may be paid in cash, in property or, in certain instances, in shares of our capital stock.
Liquidation Rights
In the event of our liquidation, dissolution or winding up, either voluntary or involuntary, subject to the rights of the holders of any preferred stock that may be outstanding, the holders of our common stock will be entitled to share, ratably according to the number of shares of common stock held by them, in our assets legally available for distribution to our shareholders after payment of all of our prior obligations.
155
Table of Contents
Other
The holders of our common stock will not have preemptive or other subscription rights. All of the outstanding shares of our common stock are, and the shares of our common stock to be sold in this offering when issued and paid for will be, fully paid and nonassessable. There are no redemption or sinking fund provisions applicable to our common stock.
Preferred Stock
Our board of directors may, by a majority vote and without shareholder approval, designate and issue, out of our unissued authorized shares of preferred stock, shares of preferred stock from time to time in one or more series. Each such series will have such distinctive designation as shall be stated and expressed in the resolution or resolutions adopted by our board of directors providing for the initial issuance of shares of such series. Our board of directors may fix and determine the preferences, limitations and relative rights of each series of preferred stock, including voting rights (if any).
It is not possible to state the actual effect of the issuance of any shares of our preferred stock on the rights of holders of our common stock until our board of directors determines the specific rights attached to that preferred stock. The effects of issuing preferred stock could include, among other things, restricting dividends on our common stock, diluting the voting power of our common stock or providing that holders of preferred stock have the right to vote on matters as a class, impairing the liquidation rights of our common stock, or delaying or discouraging a change in control of us or the removal of our existing management. There are no present plans to issue any shares of preferred stock.
Board of Directors
Size of the Board of Directors
Under the Kentucky Business Corporation Act (the “KBCA”), the board of directors must have at least one director, with the number specified in or fixed in accordance with the articles of incorporation or bylaws. Under our amended and restated articles of incorporation, the number of directors initially shall be and will be fixed from time to time by resolution of our board of directors. Our amended and restated articles of incorporation will also provide that the authorized number of directors may only be changed by a resolution adopted by a majority of our board of directors; provided, however, that a shareholder vote will be required to increase or decrease the number of directors by more than 30% from the number of directors last approved by the shareholders.
Election of Directors
Our directors will be elected at each annual meeting of shareholders and will hold office until the next annual meeting of shareholders and until each of their successors has been duly elected and qualified. The vote required for any election of directors by shareholders, other than in a contested election of directors, will be the affirmative vote of a majority of the votes cast with respect to a director nominee. In any contested election of directors, the nominees receiving the greatest number of votes cast for their election, up to the number of directors to be elected in such election, will be deemed elected.
Vacancies
Our amended and restated articles of incorporation will provide that, subject to the rights of any preferred stock then outstanding, any newly created directorships resulting from any increase in the number of directors may be filled by our board of directors, and any vacancy occurring on our board of directors resulting from death, resignation, removal or other cause can be filled only by the affirmative vote of a majority of the directors then in office, whether or not a quorum, or by a sole remaining director. A director appointed to fill such a vacancy will hold office for the remainder of the full term of our board of directors and until the director’s successor is elected and qualified.
156
Table of Contents
Removal
Under the KBCA, a director may be removed with or without cause, unless the articles of incorporation provide that directors may be removed only with cause, if the number of votes cast to remove the director exceeds the number of votes cast not to remove the director. Under the KBCA, a director may be removed by the shareholders only at a meeting called for that purpose. The meeting notice must state that removal is the purpose, or one of the purposes, of the meeting.
Our amended and restated articles of incorporation will provide for the removal of directors without cause, but will require the affirmative vote of the holders of shares representing at least 80% of our then outstanding voting power, voting together as a single class. The provisions of our amended and restated articles of incorporation will narrowly define “cause” as the willful and continuous failure of a director to substantially perform such director’s duties to the Company (other than any failure resulting from incapacity due to physical or mental illness) or the willful engagement by a director in gross misconduct materially and demonstrably injurious to the Company.
No Cumulative Voting
Under the KBCA, the right to vote cumulatively in director elections does not exist unless a corporation’s articles of incorporation specifically authorize cumulative voting. Our amended and restated articles of incorporation will not grant shareholders the right to vote cumulatively.
Ability to Call Special Meetings of Shareholders
In accordance with the KBCA, special meetings of our shareholders may only be called by a majority vote of our board of directors or by our secretary upon a proper written request of holders of at least 33 1/3% of all shares entitled to vote at such meeting.
Shareholder Action by Written Consent
Under the KBCA, any action required or permitted to be taken at a meeting of shareholders may be taken without a meeting, and without prior notice (except as noted below), if one or more written consents describing the action taken is signed by all of the shareholders entitled to vote on the action. If the KBCA requires that notice of the proposed action be given to nonvoting shareholders and the action is to be taken by consent of voting shareholders, the corporation must give its nonvoting shareholders written notice of the proposed action at least 10 days before the action is taken.
Our amended and restated articles of incorporation will provide that any action required or permitted to be taken by our shareholders may be effected by the unanimous written consent of our shareholders.
Notice of Shareholders’ Meetings
Our amended and restated by-laws require notice to shareholders of the place, date, and time of each annual and special shareholders’ meeting at least 10 days, but no more than 60 days, before the meeting date. Notice of a special meeting must also state the purpose for which the meeting is being called. Under our amended and restated by-laws, notice of adjournment of a meeting of the shareholders need not be given if the place, date and hour to which the meeting is adjourned are announced at such meeting, unless, as required by the KBCA, a new record date is fixed for the adjourned meeting. Under the KBCA, our board of directors must fix a new record date if the meeting is adjourned to a date more than 120 days after the date fixed for the original meeting.
Advance Notice Requirements for Shareholder Nominations and Proposals
Our amended and restated by-laws will contain advance notice procedures for shareholders seeking to nominate persons for election as directors at an annual or special meeting of shareholders or to bring other
157
Table of Contents
business before an annual or special meeting. These procedures will require shareholders to provide timely notice, in proper written form, to our corporate secretary. To be timely in the case of an annual meeting, a shareholder’s notice generally must be received between and days prior to the first anniversary of the date of the immediately preceding annual meeting; provided, however, if the annual meeting of shareholders is more than days earlier or more than days later than such anniversary date, notice by the shareholder must be received not earlier than the day prior to such annual meeting and not later than the close of business on the day following the day on which public announcement of such meeting is first made. To be timely in the case of a special meeting, a shareholder’s notice must be received no later than the close of business on the day following the date on which public announcement of such meeting is first made.
Such notice must be in proper written form and must set forth certain information described in our by-laws related to the shareholder giving the notice, any other beneficial owner of our capital stock owned by such shareholder and certain affiliates of the foregoing.
Dividends
The KBCA permits a corporation to declare and pay dividends and make other distributions to shareholders, unless after giving effect to the distribution:
| • | the corporation would be unable to pay its debts as they became due in the usual course of business; or |
| • | the corporation’s total assets would be less than the sum of its total liabilities plus, unless the articles of incorporation permit otherwise, the amount that would be needed, if the corporation were to be dissolved at the time of the distribution, to satisfy the preferential rights upon dissolution of shareholders whose preferential rights are superior to those receiving the distribution. |
Our amended and restated articles of incorporation will provide that, subject to applicable law and any preference of any outstanding series of preferred stock, dividends may be declared and paid on the common stock at such times and in such amounts as our board of directors in its discretion shall determine.
Amendment to Our Articles of Incorporation
The KBCA provides that, unless a corporation’s articles of incorporation require a greater vote, amendments to the corporation’s articles of incorporation generally require the board of directors to adopt a resolution recommending to the shareholders the approval of the proposed amendment, which must then be approved by shareholders representing a majority of the voting power of each voting group entitled to vote on the amendment.
In addition to any vote required by law, our amended and restated articles of incorporation will require the affirmative vote of holders of at least 80% of our then outstanding voting power, voting together as a single class, to amend, alter, change or repeal any provision of, or to adopt any provision inconsistent with, the provisions of our amended and restated articles of incorporation regarding (i) the board size or the vacancies, terms of office, removal, election or nomination of directors; (ii) the adoption, amendment or repeal of our by-laws; (iii) shareholder action by unanimous written consent; or (iv) the 80% vote required to amend the provisions described in clauses (i), (ii) and (iii).
Our amended and restated articles of incorporation will also provide that, except as otherwise required by law, holders of common stock, as such, shall not be entitled to vote on any amendment to our articles of incorporation relating to the creation of any series of blank check preferred stock.
Amendment to Our By-laws
Under the KBCA, a corporation’s board of directors may adopt, amend or repeal by-laws, except to the extent that the articles of incorporation or the KBCA reserve the power exclusively to the shareholders or the shareholders, in amending or repealing a particular by-law, provide expressly that the board of directors may not amend or repeal that bylaw. Under the KBCA, a by-law provision originally adopted by the shareholders that fixes a greater quorum or voting requirement for the board of directors may only be amended or repealed by the shareholders.
158
Table of Contents
Our amended and restated articles of incorporation will expressly authorize our board of directors to adopt, repeal, alter or amend our by-laws by the vote of a majority of the entire board of directors or such greater vote as shall be specified in our by-laws.
Our amended and restated articles of incorporation will expressly provide that for shareholders to adopt, alter, amend or repeal by-laws, the affirmative vote of the holders of at least 80% of our then outstanding voting power, voting as a single class, is required.
Mergers, Consolidations or Certain Dispositions
Under the KBCA, specified actions such as mergers, share exchanges and sales or any other disposition of all or substantially all of a corporation’s assets not in the ordinary course of business, must be generally proposed and recommended by the board of directors and, unless the KBCA, the corporation’s articles of incorporation or the board of directors requires a greater vote, approved by each voting group entitled to vote separately on the transaction by a majority of the votes entitled to be cast on the transaction by that voting group.
However, the KBCA generally does not require that a merger be approved by the shareholders of the corporation surviving the merger if (i) the articles of incorporation of the surviving corporation will not differ from its articles before the merger; (ii) each shareholder of the surviving corporation will hold the same number of shares after the merger as before; and (iii) the number of voting and participating shares outstanding immediately after the merger, plus the number of shares issuable as a result of the merger will not exceed by more than 20% the total number of voting and participating shares of the surviving corporation outstanding immediately prior to the merger.
Appraisal Rights
Under the KBCA, a shareholder is entitled to dissent from, and obtain payment of the fair value of his or her shares in the event of consummation of a plan of merger that requires shareholder approval, plan of share exchange where the corporation’s shares are being acquired, a sale of all or substantially all of the corporation’s assets, a plan of conversion, an amendment to the articles of incorporation that materially and adversely affects certain rights of the shareholder, certain business combinations, or any action which results in the entitlement to dissenter’s rights pursuant to the articles of incorporation, by-laws or board resolution.
A shareholder entitled to dissent and obtain payment for his, her or its shares under the KBCA shall not challenge the corporate action creating his, her or its entitlement, except by an application for injunctive relief prior to the consummation of the corporate action. If a proposed corporate action creating dissenters’ rights is submitted to a vote at a meeting of shareholders, the meeting notice must state that shareholders are or may be entitled to assert dissenters’ rights and the corporation must undertake to provide a copy of the statutes governing the shareholder’s dissenter rights to any shareholder entitled to vote at the meeting of shareholders upon request of that shareholder. Before the vote is taken, a shareholder who wishes to assert dissenters’ rights must deliver to the corporation a written notice of intent to demand payment for his or her shares if the action is effectuated and the shareholder must not vote the shareholder’s shares in favor of the proposed action.
If corporate action creating dissenters’ rights is taken without a vote of shareholders, the corporation must notify in writing all shareholders entitled to assert dissenters’ rights that the action was taken and send them the dissenters’ notice no later than 10 days after the proposed action was authorized.
The shareholder then has a duty to demand payment within the requisite time stated in the dissenters’ notice. The shares of a shareholder who perfects his, her or its dissenters’ rights by demanding payment and depositing his, her or its share certificates within the requisite times shall retain all rights, other than restrictions on transfer of uncertificated shares that the corporation may place on uncertified shares, from the date the demand for payment is received until these rights are cancelled or modified by the taking of the proposed corporate action, and, as soon as
159
Table of Contents
the proposed corporate action is taken, or upon receipt of the payment demand, we will be entitled to pay such shareholders the amount that we estimate to be the fair value of the shares, plus accrued interest. If such dissenting shareholder is unsatisfied with our estimate or we fail to make payment within 60 days after the date we set for demanding payment, the shareholder may object not later than 30 days after we made or offered payment for the shareholder’s shares, and if the shareholder and we cannot settle on an estimate within 60 days of us receiving such objection, we must commence a proceeding and petition a court in Kentucky to determine the fair value of the shares and accrued interest. If we fail to commence the proceeding within the 60 day time period after we receive such objection, we are required to pay the dissenting shareholder the amount demanded by the dissenting shareholder.
Anti-Takeover Effects under Certain Kentucky Laws
Section 271B.12 of the KBCA generally prohibits a corporation from engaging in a business combination with an interested shareholder (generally defined as a beneficial owner of 10% or more of the voting power of the corporation’s outstanding voting stock) for a period of five years following the date such interested shareholder became an interested shareholder unless the business combination is approved by a majority of the independent members of the board of directors of such corporation prior to the date on which such shareholder became an interested shareholder. In this context, “business combination” generally includes certain mergers, asset or stock sales, liquidations or distributions and other transactions resulting in a financial benefit to an interested shareholder. In addition, absent an exemption and in addition to any vote otherwise required by law or a corporation’s articles of incorporation, a business combination by a corporation with an interested shareholder shall be rendered void unless approved by (i) a majority of the independent, continuing members of the corporation’s board of directors or (ii) the affirmative vote of at least (a) 80% of the votes entitled to be cast by the corporation’s outstanding voting stock and (b) 66 2/3% of the votes entitled to be cast by holders of the corporation’s outstanding voting stock other than voting stock beneficially owned by the interested shareholder or by affiliates or associates of such interested shareholder, in each case, voting together as a single class. The voting requirements of Section 271B.12 do not apply, however, to business combinations that satisfy certain conditions relating to the consideration that will be received by shareholders, the corporation’s dividend practices and policies and the interested shareholder’s beneficial ownership of the stock of the corporation.
As a Kentucky corporation, we will be subject to these KBCA provisions regarding business combinations.
These provisions of the KBCA may delay or discourage a change in control by allowing a minority of our shareholders to prevent a transaction favored by the majority of our shareholders.
Duties of Directors
The KBCA requires a director to discharge such director’s duties as a director, including such director’s duties as a member of a committee, in good faith, on an informed basis and in a manner in which the director honestly believes is in the best interests of the corporation. A director is considered to discharge his or her duties on an informed basis if he or she makes, with the care an ordinarily prudent person in a like position would exercise under similar circumstances, inquiry into the business and affairs of the corporation, or into a particular action to be taken or decision to be made.
In performing the director’s duties, unless a director has knowledge concerning the matter in question that makes reliance unwarranted, a director is entitled to rely on information, opinions, reports or statements, including financial statements and other financial data, if prepared or presented by:
| • | one or more officers or employees of the corporation whom the director honestly believes to be reliable and competent in the matters presented; |
| • | legal counsel, public accountants or other persons as to matters that the director believes are within the professional or expert competence of that person; or |
| • | a committee of the board of which the director is not a member, which committee the director honestly believes to merit confidence. |
160
Table of Contents
Limitations on Directors’ Liability
Our amended and restated articles of incorporation will include a provision limiting the liability of our directors to the fullest extent permitted by Kentucky law. Under Section 271B.2-020 of the KBCA, such a provision does not eliminate or limit the liability of our directors for (i) transactions in which the director’s personal financial interest is in conflict with the financial interests of us or our shareholders, (ii) acts or omissions which are not taken in good faith, involve intentional misconduct or are known to the director to be a violation of law, (iii) any vote for or assent to certain unlawful distributions to shareholders; or (iv) any transaction from which the director derived an improper personal benefit.
Indemnification
The KBCA permits a corporation to indemnify an individual who is made a party to a proceeding because the individual is or was a director or officer of the corporation as long as the individual conducted himself or herself in good faith, reasonably believed, in the case of conduct in his or her official capacity with the corporation, that the conduct was in the best interest of the corporation or, in all other cases, was at least not opposed to its best interest, and in a criminal proceeding, had no reasonable cause to believe that the conduct was unlawful.
The KBCA does not, however, permit indemnification in connection with a proceeding by or in the right of the corporation in which the director is held liable to the corporation or in connection with any other proceeding where the director or officer is adjudged to have received an improper personal benefit, in each case, unless the applicable court determines that indemnification is appropriate.
A determination that indemnification is permitted by the terms of the KBCA must first be made before a director or officer can be indemnified.
The KBCA provides that, unless limited by the articles of incorporation, a corporation shall indemnify any director or officer who is wholly successful in the defense of any proceeding to which the individual was a party because he or she is or was a director or officer of the corporation against reasonable expenses incurred in connection with the proceeding.
Our amended and restated articles of incorporation will permit, and our amended and restated by-laws will generally require, that we indemnify our directors and officers, to the fullest extent permitted under Kentucky or other applicable law. The right to be indemnified will, unless determined by us not to be in our best interests, include the right of a director or officer to be paid expenses, including attorneys’ fees, in advance of the final disposition of any proceeding; provided that, if required by law or by us in our discretion, we receive an undertaking to repay such amount if it is ultimately determined that he or she is not entitled to be indemnified.
We also expect to maintain directors’ and officers’ insurance.
Exclusive Forum
Our amended and restated certificate of incorporation will provide that, unless we consent in writing to the selection of an alternative forum, the Circuit Court for the county within the Commonwealth of Kentucky in which we maintain our principal office or, if none, the Circuit Court in which our registered agent is located, shall be the exclusive forum for any derivative action or proceeding brought on our behalf or any action to compel our production of books and records.
Stock Exchange Listing Symbol
We have applied to list our common stock on the NYSE under the symbol “VVV.”
Transfer Agent and Registrar
The transfer agent and registrar for our common stock is Wells Fargo Shareowner Services.
161
Table of Contents
SHARES ELIGIBLE FOR FUTURE SALE
We cannot predict with certainty the effect, if any, that market sales of shares of our common stock or the availability of shares of our common stock for sale will have on the market price prevailing from time to time. We also cannot predict with certainty whether or when the spin-off or other disposition will occur or if Ashland will otherwise sell its remaining shares of our common stock. The sale of substantial amounts of our common stock in the public market or the perception that such sales could occur could adversely affect the prevailing market price of our common stock and our ability to raise equity capital in the future.
Upon completion of this offering, we will have outstanding shares of our common stock ( shares of our common stock if the underwriters exercise their overallotment option in full). This includes shares of common stock ( shares of our common stock if the underwriters exercise their overallotment option in full) that we are selling in this offering, which shares may be resold in the public market immediately following this offering unless purchased by our affiliates.
The shares of common stock that are not offered in this offering, as well as shares reserved for future issuance under our stock plans, will be “restricted securities,” as that term is defined in Rule 144 under the Securities Act. These restricted securities are eligible for public sale only if they are registered under the Securities Act or if they qualify for an exemption from registration under the Securities Act, and these restricted securities will not be available for sale in the public market until 181 days after the date of this prospectus.
Rule 144
In general, under Rule 144 as currently in effect, once we have been subject to public company reporting requirements for at least 90 days, a person who is not deemed to have been one of our affiliates for purposes of the Securities Act at any time during the 90 days preceding a sale and who has beneficially owned the shares proposed to be sold for at least six months, including the holding period of any prior owner other than our affiliates, is entitled to sell those shares without complying with the manner of sale, volume limitation or notice provisions of Rule 144, subject to compliance with the public information requirements of Rule 144. If such a person has beneficially owned the shares proposed to be sold for at least one year, including the holding period of any prior owner other than our affiliates, then that person is entitled to sell those shares without complying with any of the requirements of Rule 144.
In general, under Rule 144, as currently in effect, each of our affiliates or persons selling shares on behalf of each of our affiliates are entitled to sell upon the expiration of the lock-up agreements described below, within any three-month period beginning 90 days after the date of this prospectus, a number of shares that does not exceed the greater of:
| • | 1% of the number of shares of common stock then outstanding, which will equal approximately shares immediately after our initial public offering, or |
| • | the average weekly trading volume of the common stock during the four calendar weeks preceding the filing of a notice on Form 144 with respect to such sale. |
Sales under Rule 144 by our affiliates or persons selling shares on behalf of our affiliates are also subject to certain manner of sale provisions and notice requirements and to the availability of current public information about us.
Lock-Up Agreements
We, our officers, directors and Ashland have agreed with the underwriters not to dispose of any of our common stock or securities convertible into or exchangeable for shares of our common stock for 180 days after the date of this prospectus, except with the prior written consent of Merrill Lynch, Pierce, Fenner & Smith
162
Table of Contents
Incorporated, Citigroup Global Markets Inc. and Morgan Stanley & Co. LLC, except for sales of common stock to our parent company, Ashland, to the extent necessary to enable it to maintain ownership of at least 81.00% of our outstanding common stock until the occurrence of the spin-off. See “Certain Relationships and Related Party Transactions—Relationship with Ashland.” Any such shares acquired by Ashland would be subject to Ashland’s lock-up agreement described above. Merrill Lynch, Pierce, Fenner & Smith Incorporated, Citigroup Global Markets Inc. and Morgan Stanley & Co. LLC, on behalf of the underwriters may, at any time, waive these restrictions.
See “Underwriting” for a more detailed description of the lock-up agreements that we and our directors, executive officers, and Ashland have entered into with the underwriters.
Registration Rights
Upon the closing of this offering, Ashland will be entitled to rights with respect to the registration of the sale of our common stock under the Securities Act. Registration of the sale of these shares under the Securities Act would result in these shares becoming fully tradable without restriction under the Securities Act immediately upon the effectiveness of the registration, except for shares purchased by affiliates. See “Certain Relationships and Related Party Transactions—Relationship with Ashland—Registration Rights Agreement.”
Registration Statement
We intend to file a registration statement on Form S-8 under the Securities Act covering all of the shares of our common stock reserved for future issuance under our stock plans. We expect to file this registration statement as soon as practicable after this offering. However, none of the shares registered on Form S-8 will be eligible for resale until the expiration of the lock-up agreements to which they are subject.
The Spin-off
Following this offering, Ashland will own shares of our common stock, representing approximately % of the total outstanding shares of our common stock (or % if the underwriters exercise their overallotment option in full). Ashland announced on April 13, 2016 that it intends to effect a tax-free spin-off of its remaining ownership interest in us to its shareholders approximately six months after the closing of this offering. Ashland has no obligation to effect the tax-free spin-off and it may retain its ownership interest in us indefinitely or dispose of all or a portion of its ownership interest in us in a sale or other disposition. Any such spin-off or other disposition by Ashland would be subject to various conditions, including receipt of an opinion of counsel, receipt of any necessary regulatory or other approvals and the existence of satisfactory market conditions. The conditions to a spin-off or other disposition by Ashland may not be satisfied. Ashland has no obligation to pursue or consummate any further disposition of its ownership interest in us by any specified date or at all, whether or not these conditions are satisfied.
163
Table of Contents
MATERIAL U.S. FEDERAL INCOME TAX CONSEQUENCES
FOR NON-U.S. HOLDERS OF OUR COMMON STOCK
The following is a discussion of the material U.S. federal income and estate tax consequences of the ownership and disposition of our common stock by a beneficial owner that is a “non-U.S. holder,” other than a non-U.S. holder that owns, or has owned, actually or constructively, more than 5% of our common stock. A “non-U.S. holder” is a person or entity that, for U.S. federal income tax purposes, is:
| • | a non-resident alien individual, other than certain former citizens and residents of the United States subject to tax as expatriates; |
| • | a corporation, or other entity treated as a corporation for U.S. federal income tax purposes, created or organized in or under the laws of a jurisdiction other than the United States or any state or political subdivision thereof or the District of Columbia; or |
| • | an estate or trust, other than an estate or trust the income of which is subject to U.S. federal income taxation regardless of its source. |
A “non-U.S. holder” does not include an individual who is present in the United States for 183 days or more in the taxable year of the disposition of such individual’s common stock and is not otherwise a resident of the United States for U.S. federal income tax purposes. Such an individual is urged to consult his or her own tax advisor regarding the U.S. federal income tax consequences of the disposition of our common stock.
This discussion is based on the Code and administrative pronouncements, judicial decisions and final, temporary and proposed Treasury regulations, changes to any of which subsequent to the date of this prospectus may affect the tax consequences described herein, potentially retroactively. This discussion does not address all aspects of U.S. federal income taxation that may be relevant to non-U.S. holders in light of their particular circumstances, and it does not address any tax consequences arising under the laws of any state, local or foreign jurisdiction.
If an entity or arrangement treated as a partnership for U.S. federal income tax purposes holds our common stock, the tax treatment of a partner will generally depend upon the status of the partner and the activities of the partnership. If you are such an entity or arrangement holding our common stock, or a partner in such an entity or arrangement, you should consult your tax advisors regarding the ownership and disposition of our common stock.
Prospective holders are urged to consult their tax advisors with respect to the particular tax consequences to them of owning and disposing of our common stock, including the consequences under the laws of any state, local or foreign jurisdiction.
Dividends
As described under “Dividend Policy,” we intend to pay quarterly cash dividends to holders of our common stock. If we make any distributions of cash or other property (other than certain pro rata distributions of our common stock or rights to acquire our common stock) with respect to shares of our common stock, such distributions generally will constitute dividends for U.S. federal income tax purposes to the extent paid out of our current or accumulated earnings and profits, as determined under U.S. federal income tax principles. If a distribution exceeds our current and accumulated earnings and profits, as determined under U.S. federal income tax principles, the excess will be treated first as a tax-free return of the non-U.S. holder’s adjusted tax basis in our common stock and thereafter as capital gain, subject to the tax treatment described below in “—Gain on Taxable Disposition of Our Common Stock.” Dividends paid to a non-U.S. holder of our common stock generally will be subject to U.S. federal withholding tax at a 30% rate or a reduced rate specified by an applicable income tax treaty. In order to obtain a reduced rate of withholding, a non-U.S. holder will be required to provide documentation (generally IRS Form W-8BEN or W-8BEN-E) certifying its entitlement to benefits under an applicable income tax treaty. Additional certification requirements apply if a non-U.S. holder holds our common stock through a foreign partnership or a foreign intermediary.
164
Table of Contents
The withholding tax does not apply to dividends paid to a non-U.S. holder who provides an IRS Form W-8ECI, certifying that the dividends are effectively connected with the non-U.S. holder’s conduct of a trade or business within the United States (and, if required by an applicable income tax treaty, attributable to a permanent establishment maintained by the non-U.S. holder in the United States). Instead, the effectively connected dividends will be subject to U.S. federal income tax in substantially the same manner as if the non-U.S. holder were a U.S. person. A non-U.S. holder treated as a corporation for U.S. federal income tax purposes receiving effectively connected dividends may also be subject to an additional “branch profits tax” imposed at a rate of 30% (or a lower treaty rate) with respect to its effectively connected earnings and profits attributable to such dividends.
If you are a non-U.S. holder, you may obtain a refund of any excess amounts withheld by timely filing an appropriate claim for a refund with the IRS. Non-U.S. holders should consult their tax advisors regarding their entitlement to benefits under an applicable income tax treaty and the specific manner of claiming the benefits of the treaty.
The foregoing discussion is subject to the discussion below under “—FATCA Withholding” and “—Information Reporting and Backup Withholding.”
Gain on Taxable Disposition of Our Common Stock
A non-U.S. holder generally will not be subject to U.S. federal income tax on gain realized on a sale or other taxable disposition of our common stock unless:
| • | such gain is effectively connected with a trade or business of the non-U.S. holder in the United States (and, if required by an applicable income tax treaty, attributable to a permanent establishment maintained by the non-U.S. holder in the United States), in which event such non-U.S. holder generally will be subject to U.S. federal income tax on such gain in substantially the same manner as a U.S. person and, if such non-U.S. holder is treated as a corporation for U.S. federal income tax purposes, may also be subject to a branch profits tax at a rate of 30% (or a lower rate if it is provided by an applicable income tax treaty); or |
| • | we are or have been a U.S. real property holding corporation, as defined in the Code, at any time within the five-year period preceding the disposition or the non-U.S. holder’s holding period, whichever period is shorter, and our common stock has ceased to be traded on an established securities market prior to the beginning of the calendar year in which the sale or disposition occurs. |
Generally, a corporation is a U.S. real property holding corporation if the fair market value of its U.S. real property interests equals or exceeds 50% of the sum of the fair market value of its worldwide real property interests and its other assets used or held for use in a trade or business (all as determined for U.S. federal income tax purposes). We believe that we are not, and we do not anticipate becoming, a U.S. real property holding corporation.
The foregoing discussion is subject to the discussion below under “—FATCA Withholding” and “—Information Reporting and Backup Withholding.”
FATCA Withholding
Under the provisions of the Code and related U.S. Treasury guidance commonly referred to as the Foreign Account Tax Compliance Act, or FATCA, a withholding tax of 30% will be imposed in certain circumstances on payments of (i) dividends on our common stock and (ii) beginning after December 31, 2018, gross proceeds from the sale or other disposition of our common stock. In the case of payments made to a “foreign financial institution” (such as a bank, a broker or an investment fund), as a beneficial owner or as an intermediary, this tax generally will be imposed, subject to certain exceptions, unless such institution (i) has agreed to (and does) comply with the requirements of an agreement with the United States, or an FFI Agreement, or (ii) is required by (and does comply with) applicable foreign law enacted in connection with an intergovernmental agreement
165
Table of Contents
between the United States and a foreign jurisdiction, or an IGA, in either case to, among other things, collect and provide to the U.S. tax authorities or other relevant tax authorities certain information regarding U.S. account holders of such institution. In the case of payments made to a foreign entity that is not a financial institution, the tax generally will be imposed, subject to certain exceptions, unless such entity provides the withholding agent with a certification that it does not have any “substantial” U.S. owner (generally, any specified U.S. person that directly or indirectly owns more than a specified percentage of such entity) or that identifies its substantial U.S. owners. If our common stock is held through a foreign financial institution that has agreed to comply with the requirements of an FFI Agreement, such foreign financial institution (or, in certain cases, a person paying amounts to such foreign financial institution) generally will be required, subject to certain exceptions, to withhold tax on payments of dividends and proceeds described above made to (i) a person (including an individual) that fails to comply with certain information requests or (ii) a foreign financial institution that has not agreed to comply with the requirements of an FFI Agreement, unless such foreign financial institution is required by (and does comply with) applicable foreign law enacted in connection with an IGA. Each non-U.S. holder should consult its own tax advisor regarding the application of FATCA to the ownership and disposition of our common stock.
Information Reporting and Backup Withholding
Amounts treated as payments of dividends on our common stock paid to a non-U.S. holder and the amount of any U.S. federal tax withheld from such payments generally must be reported annually to the IRS and to such non-U.S. holder by the applicable withholding agent.
The additional information reporting and backup withholding rules that apply to payments of dividends to certain U.S. persons generally will not apply to payments of dividends on our common stock to a non-U.S. holder if such non-U.S. holder certifies under penalties of perjury that it is not a U.S. person (generally by providing an IRS Form W-8BEN or W-8BEN-E to the applicable withholding agent) or otherwise establishes an exemption.
Proceeds from the sale, exchange or other disposition of our common stock by a non-U.S. holder effected outside the United States through a non-U.S. office of a non-U.S. broker generally will not be subject to the information reporting and backup withholding rules that apply to payments to certain U.S. persons provided that the proceeds are paid to the non-U.S. holder outside the United States. However, proceeds from the sale, exchange or other disposition of our common stock by a non-U.S. holder effected through a non-U.S. office of a non-U.S. broker with certain specified U.S. connections or a U.S. broker generally will be subject to these information reporting rules (but generally not to these backup withholding rules), even if the proceeds are paid to such non-U.S. holder outside the United States, unless such non-U.S. holder certifies under penalties of perjury that it is not a U.S. person (for instance, by providing an IRS Form W-8BEN or W-8BEN-E to the applicable withholding agent) or otherwise establishes an exemption. Proceeds from the sale, exchange or other disposition of our common stock by a non-U.S. holder effected through a U.S. office of a broker generally will be subject to these information reporting and backup withholding rules unless such non-U.S. holder certifies under penalties of perjury that it is not a U.S. person (for instance, by providing an IRS Form W-8BEN or W-8BEN-E to the applicable withholding agent) or otherwise establishes an exemption.
Backup withholding is not an additional tax. The amount of any backup withholding from a payment to a non-U.S. holder will be allowed as a credit against such holder’s U.S. federal income tax liability, if any, and may entitle such holder to a refund, provided that the required information is timely furnished to the IRS.
Federal Estate Tax
Individual non-U.S. holders and entities the property of which is potentially includible in such an individual’s gross estate for U.S. federal estate tax purposes (for example, a trust funded by such an individual and with respect to which the individual has retained certain interests or powers) should note that, absent an applicable treaty benefit, our common stock generally will be treated as U.S. situs property subject to U.S. federal estate tax.
166
Table of Contents
Merrill Lynch, Pierce, Fenner & Smith Incorporated, Citigroup Global Markets Inc. and Morgan Stanley & Co. LLC are acting as representatives of each of the underwriters named below. Subject to the terms and conditions set forth in an underwriting agreement among us and the underwriters, we have agreed to sell to the underwriters, and each of the underwriters has agreed, severally and not jointly, to purchase from us, the number of shares of common stock set forth opposite its name below.
| Underwriter |
Number of Shares | |
| Merrill Lynch, Pierce, Fenner & Smith Incorporated |
||
| Citigroup Global Markets Inc. |
||
| Morgan Stanley & Co. LLC |
||
|
| ||
| Total |
||
|
|
Subject to the terms and conditions set forth in the underwriting agreement, the underwriters have agreed, severally and not jointly, to purchase all of the shares sold under the underwriting agreement if any of these shares are purchased. If an underwriter defaults, the underwriting agreement provides that the purchase commitments of the nondefaulting underwriters may be increased or the underwriting agreement may be terminated.
We have agreed to indemnify the underwriters against certain liabilities, including liabilities under the Securities Act, or to contribute to payments the underwriters may be required to make in respect of those liabilities.
The underwriters are offering the shares, subject to prior sale, when, as and if issued to and accepted by them, subject to approval of legal matters by their counsel, including the validity of the shares, and other conditions contained in the underwriting agreement, such as the receipt by the underwriters of officer’s certificates and legal opinions. The underwriters reserve the right to withdraw, cancel or modify offers to the public and to reject orders in whole or in part.
Commissions and Discounts
The representatives have advised us that the underwriters propose initially to offer the shares to the public at the public offering price set forth on the cover page of this prospectus and to dealers at that price less a concession not in excess of $ per share. After the initial offering, the public offering price, concession or any other term of the offering may be changed.
The following table shows the public offering price, underwriting discount and proceeds before expenses to us. The information assumes either no exercise or full exercise by the underwriters of their overallotment option.
| Per Share | Without Option |
With Option | ||||||||||
| Public offering price |
$ | $ | $ | |||||||||
| Underwriting discount |
$ | $ | $ | |||||||||
| Proceeds, before expenses, to Valvoline Inc. |
$ | $ | $ | |||||||||
The expenses of the offering, not including the underwriting discount, are estimated at $ and are payable by us. We have also agreed to reimburse the underwriters for certain of their expenses, in an amount of up to $ , as set forth in the underwriting agreement.
167
Table of Contents
Overallotment Option
We have granted an option to the underwriters, exercisable for 30 days after the date of this prospectus, to purchase up to additional shares at the public offering price, less the underwriting discount, solely to cover over allotments. If the underwriters exercise this option, each will be obligated, subject to conditions contained in the underwriting agreement, to purchase a number of additional shares proportionate to that underwriter’s initial amount reflected in the above table.
No Sales of Similar Securities
We, our executive officers and directors and Ashland have agreed not to sell or transfer any common stock or securities convertible into, exchangeable for, exercisable for, or repayable with common stock, for 180 days after the date of this prospectus without first obtaining the written consent of Merrill Lynch, Pierce, Fenner & Smith Incorporated, Citigroup Global Markets Inc. and Morgan Stanley & Co. LLC. Specifically, we and these other persons have agreed, with certain limited exceptions, not to directly or indirectly:
| • | offer, pledge, sell or contract to sell any common stock; |
| • | sell any option or contract to purchase any common stock; |
| • | purchase any option or contract to sell any common stock; |
| • | grant any option, right or warrant for the sale of any common stock; |
| • | lend or otherwise dispose of or transfer any common stock; |
| • | request or demand that we file a registration statement related to the common stock; or |
| • | enter into any swap or other agreement that transfers, in whole or in part, the economic consequence of ownership of any common stock whether any such swap or transaction is to be settled by delivery of shares or other securities, in cash or otherwise. |
This lock-up provision applies to common stock and to securities convertible into or exchangeable or exercisable for or repayable with common stock.
New York Stock Exchange Listing
We expect the shares to be approved for listing on the NYSE under the symbol “VVV.” In order to meet the requirements for listing on that exchange, the underwriters have undertaken to sell a minimum number of shares to a minimum number of beneficial owners as required by that exchange.
Before this offering, there has been no public market for our common stock. The initial public offering price will be determined through negotiations between us and the representatives. In addition to prevailing market conditions, the factors to be considered in determining the initial public offering price are
| • | the valuation multiples of publicly traded companies that the representatives believe to be comparable to us; |
| • | our financial information; |
| • | the history of, and the prospects for, our company and the industry in which we compete; |
| • | an assessment of our management, its past and present operations, and the prospects for, and timing of, our future revenues; |
| • | the present state of our development; and |
| • | the above factors in relation to market values and various valuation measures of other companies engaged in activities similar to ours. |
168
Table of Contents
An active trading market for the shares may not develop. It is also possible that after the offering the shares will not trade in the public market at or above the initial public offering price.
The underwriters do not expect to sell more than 5% of the shares in the aggregate to accounts over which they exercise discretionary authority.
Price Stabilization, Short Positions and Penalty Bids
Until the distribution of the shares is completed, SEC rules may limit underwriters and selling group members from bidding for and purchasing our common stock. However, the representatives may engage in transactions that stabilize the price of the common stock, such as bids or purchases to peg, fix or maintain that price.
In connection with the offering, the underwriters may purchase and sell our common stock in the open market. These transactions may include short sales, purchases on the open market to cover positions created by short sales and stabilizing transactions. Short sales involve the sale by the underwriters of a greater number of shares than they are required to purchase in the offering. “Covered” short sales are sales made in an amount not greater than the underwriters’ overallotment option described above. The underwriters may close out any covered short position by either exercising their overallotment option or purchasing shares in the open market. In determining the source of shares to close out the covered short position, the underwriters will consider, among other things, the price of shares available for purchase in the open market as compared to the price at which they may purchase shares through the overallotment option granted to them. “Naked” short sales are sales in excess of such overallotment option. The underwriters must close out any naked short position by purchasing shares in the open market. A naked short position is more likely to be created if the underwriters are concerned that there may be downward pressure on the price of our common stock in the open market after pricing that could adversely affect investors who purchase in the offering. Stabilizing transactions consist of various bids for or purchases of shares of common stock made by the underwriters in the open market prior to the completion of the offering.
The underwriters may also impose a penalty bid. This occurs when a particular underwriter repays to the underwriters a portion of the underwriting discount received by it because the representatives have repurchased shares sold by or for the account of such underwriter in stabilizing or short covering transactions.
Similar to other purchase transactions, the underwriters’ purchases to cover the syndicate short sales may have the effect of raising or maintaining the market price of our common stock or preventing or retarding a decline in the market price of our common stock. As a result, the price of our common stock may be higher than the price that might otherwise exist in the open market. The underwriters may conduct these transactions on the NYSE, in the over-the-counter market or otherwise.
Neither we nor any of the underwriters make any representation or prediction as to the direction or magnitude of any effect that the transactions described above may have on the price of our common stock. In addition, neither we nor any of the underwriters make any representation that the representatives will engage in these transactions or that these transactions, once commenced, will not be discontinued without notice.
Electronic Distribution
In connection with the offering, certain of the underwriters or securities dealers may distribute prospectuses by electronic means, such as e-mail.
Other Relationships
Some of the underwriters and their affiliates have engaged in, and may in the future engage in, investment banking and other commercial dealings in the ordinary course of business with us or our affiliates. They have received, or may in the future receive, customary fees and commissions for these transactions.
169
Table of Contents
In addition, in the ordinary course of their business activities, the underwriters and their affiliates may make or hold a broad array of investments and actively trade debt and equity securities (or related derivative securities) and financial instruments (including bank loans) for their own account and for the accounts of their customers. Such investments and securities activities may involve securities and/or instruments of ours or our affiliates. The underwriters and their affiliates may also make investment recommendations and/or publish or express independent research views in respect of such securities or financial instruments and may hold, or recommend to clients that they acquire, long and/or short positions in such securities and instruments.
European Economic Area
In relation to each member state of the European Economic Area, no offer of ordinary shares which are the subject of the offering has been, or will be made to the public in that Member State, other than under the following exemptions under the Prospectus Directive:
| (a) | to any legal entity which is a qualified investor as defined in the Prospectus Directive; |
| (b) | to fewer than 150 natural or legal persons (other than qualified investors as defined in the Prospectus Directive), subject to obtaining the prior consent of the Representatives for any such offer; or |
| (c) | in any other circumstances falling within Article 3(2) of the Prospectus Directive, |
provided that no such offer of ordinary shares referred to in (a) to (c) above shall result in a requirement for the Company or any Representative to publish a prospectus pursuant to Article 3 of the Prospectus Directive, or supplement a prospectus pursuant to Article 16 of the Prospectus Directive.
Each person located in a Member State to whom any offer of ordinary shares is made or who receives any communication in respect of an offer of ordinary shares, or who initially acquires any ordinary shares will be deemed to have represented, warranted, acknowledged and agreed to and with each Representative and the Company that (1) it is a “qualified investor” within the meaning of the law in that Member State implementing Article 2(1)(e) of the Prospectus Directive; and (2) in the case of any ordinary shares acquired by it as a financial intermediary as that term is used in Article 3(2) of the Prospectus Directive, the ordinary shares acquired by it in the offer have not been acquired on behalf of, nor have they been acquired with a view to their offer or resale to, persons in any Member State other than qualified investors, as that term is defined in the Prospectus Directive, or in circumstances in which the prior consent of the Representatives has been given to the offer or resale; or where ordinary shares have been acquired by it on behalf of persons in any Member State other than qualified investors, the offer of those ordinary shares to it is not treated under the Prospectus Directive as having been made to such persons.
The Company, the Representatives and their respective affiliates will rely upon the truth and accuracy of the foregoing representations, acknowledgments and agreements.
This prospectus has been prepared on the basis that any offer of shares in any Member State will be made pursuant to an exemption under the Prospectus Directive from the requirement to publish a prospectus for offers of shares. Accordingly any person making or intending to make an offer in that Member State of shares which are the subject of the offering contemplated in this prospectus may only do so in circumstances in which no obligation arises for the Company or any of the Representatives to publish a prospectus pursuant to Article 3 of the Prospectus Directive in relation to such offer. Neither the Company nor the Representatives have authorized, nor do they authorize, the making of any offer of shares in circumstances in which an obligation arises for the Company or the Representatives to publish a prospectus for such offer.
For the purposes of this provision, the expression an “offer of ordinary shares to the public” in relation to any ordinary shares in any Member State means the communication in any form and by any means of sufficient information on the terms of the offer and the ordinary shares to be offered so as to enable an investor to decide to
170
Table of Contents
purchase or subscribe the ordinary shares, as the same may be varied in that Member State by any measure implementing the Prospectus Directive in that Member State, the expression “Prospectus Directive” means Directive 2003/71/EC (as amended) and includes any relevant implementing measure in each Member State.
The above selling restriction is in addition to any other selling restrictions set out below.
Notice to Prospective Investors in the United Kingdom
In addition, in the United Kingdom, this document is being distributed only to, and is directed only at, and any offer subsequently made may only be directed at persons who are “qualified investors” (as defined in the Prospectus Directive) (i) who have professional experience in matters relating to investments falling within Article 19 (5) of the Financial Services and Markets Act 2000 (Financial Promotion) Order 2005, as amended (the “Order”) and/or (ii) who are high net worth companies (or persons to whom it may otherwise be lawfully communicated) falling within Article 49(2)(a) to (d) of the Order (all such persons together being referred to as “relevant persons”). This document must not be acted on or relied on in the United Kingdom by persons who are not relevant persons. In the United Kingdom, any investment or investment activity to which this document relates is only available to, and will be engaged in with, relevant persons.
Notice to Prospective Investors in France
Neither this prospectus nor any other offering material relating to the shares described in this prospectus has been submitted to the clearance procedures of the Autorité des Marchés Financiers or of the competent authority of another member state of the European Economic Area and notified to the Autorité des Marchés Financiers. The shares have not been offered or sold and will not be offered or sold, directly or indirectly, to the public in France. Neither this prospectus nor any other offering material relating to the shares has been or will be:
| • | released, issued, distributed or caused to be released, issued or distributed to the public in France; or |
| • | used in connection with any offer for subscription or sale of the shares to the public in France. |
Such offers, sales and distributions will be made in France only:
| • | to qualified investors (investisseurs qualifiés) and/or to a restricted circle of investors (cercle restreint d’investisseurs), in each case investing for their own account, all as defined in, and in accordance with articles L.411-2, D.411-1, D.411-2, D.734-1, D.744-1, D.754-1 and D.764-1 of the French Code monétaire et financier; |
| • | to investment services providers authorized to engage in portfolio management on behalf of third parties; or |
| • | in a transaction that, in accordance with article L.411-2-II-1°-or-2°-or 3° of the French Code monétaire et financier and article 211-2 of the General Regulations (Règlement Général) of the Autorité des Marchés Financiers, does not constitute a public offer (appel public à l’épargne). |
The shares may be resold directly or indirectly, only in compliance with articles L.411-1, L.411-2, L.412-1 and L.621-8 through L.621-8-3 of the French Code monétaire et financier.
Notice to Prospective Investors in Switzerland
The shares may not be publicly offered in Switzerland and will not be listed on the SIX Swiss Exchange (“SIX”) or on any other stock exchange or regulated trading facility in Switzerland. This document has been prepared without regard to the disclosure standards for issuance prospectuses under art. 652a or art. 1156 of the Swiss Code of Obligations or the disclosure standards for listing prospectuses under art. 27 ff. of the SIX Listing Rules or the listing rules of any other stock exchange or regulated trading facility in Switzerland. Neither this document nor any other offering or marketing material relating to the shares or the offering may be publicly distributed or otherwise made publicly available in Switzerland.
171
Table of Contents
Neither this document nor any other offering or marketing material relating to the offering, the Company, the shares have been or will be filed with or approved by any Swiss regulatory authority. In particular, this document will not be filed with, and the offer of shares will not be supervised by, the Swiss Financial Market Supervisory Authority FINMA (“FINMA”), and the offer of shares has not been and will not be authorized under the Swiss Federal Act on Collective Investment Schemes (“CISA”). The investor protection afforded to acquirers of interests in collective investment schemes under the CISA does not extend to acquirers of shares.
Notice to Prospective Investors in the Dubai International Financial Centre
This prospectus relates to an Exempt Offer in accordance with the Offered Securities Rules of the Dubai Financial Services Authority (“DFSA”). This prospectus is intended for distribution only to persons of a type specified in the Offered Securities Rules of the DFSA. It must not be delivered to, or relied on by, any other person. The DFSA has no responsibility for reviewing or verifying any documents in connection with Exempt Offers. The DFSA has not approved this prospectus nor taken steps to verify the information set forth herein and has no responsibility for the prospectus. The shares to which this prospectus relates may be illiquid and/or subject to restrictions on their resale. Prospective purchasers of the shares offered should conduct their own due diligence on the shares. If you do not understand the contents of this prospectus you should consult an authorized financial advisor.
Notice to Prospective Investors in Australia
No placement document, prospectus, product disclosure statement or other disclosure document has been lodged with the Australian Securities and Investments Commission (“ASIC”), in relation to the offering. This prospectus does not constitute a prospectus, product disclosure statement or other disclosure document under the Corporations Act 2001 (the “Corporations Act”), and does not purport to include the information required for a prospectus, product disclosure statement or other disclosure document under the Corporations Act.
Any offer in Australia of the shares may only be made to persons (the “Exempt Investors”) who are “sophisticated investors” (within the meaning of section 708(8) of the Corporations Act), “professional investors” (within the meaning of section 708(11) of the Corporations Act) or otherwise pursuant to one or more exemptions contained in section 708 of the Corporations Act so that it is lawful to offer the shares without disclosure to investors under Chapter 6D of the Corporations Act.
The shares applied for by Exempt Investors in Australia must not be offered for sale in Australia in the period of 12 months after the date of allotment under the offering, except in circumstances where disclosure to investors under Chapter 6D of the Corporations Act would not be required pursuant to an exemption under section 708 of the Corporations Act or otherwise or where the offer is pursuant to a disclosure document which complies with Chapter 6D of the Corporations Act. Any person acquiring shares must observe such Australian on-sale restrictions.
This prospectus contains general information only and does not take account of the investment objectives, financial situation or particular needs of any particular person. It does not contain any securities recommendations or financial product advice. Before making an investment decision, investors need to consider whether the information in this prospectus is appropriate to their needs, objectives and circumstances, and, if necessary, seek expert advice on those matters.
Notice to Prospective Investors in Hong Kong
The shares have not been offered or sold and will not be offered or sold in Hong Kong, by means of any document, other than (a) to “professional investors” as defined in the Securities and Futures Ordinance (Cap. 571) of Hong Kong and any rules made under that Ordinance; or (b) in other circumstances which do not result in the document being a “prospectus” as defined in the Companies Ordinance (Cap. 32) of Hong Kong or which
172
Table of Contents
do not constitute an offer to the public within the meaning of that Ordinance. No advertisement, invitation or document relating to the shares has been or may be issued or has been or may be in the possession of any person for the purposes of issue, whether in Hong Kong or elsewhere, which is directed at, or the contents of which are likely to be accessed or read by, the public of Hong Kong (except if permitted to do so under the securities laws of Hong Kong) other than with respect to shares which are or are intended to be disposed of only to persons outside Hong Kong or only to “professional investors” as defined in the Securities and Futures Ordinance and any rules made under that Ordinance.
Notice to Prospective Investors in Japan
The shares have not been and will not be registered under the Financial Instruments and Exchange Law of Japan (Law No. 25 of 1948, as amended) and, accordingly, will not be offered or sold, directly or indirectly, in Japan, or for the benefit of any Japanese Person or to others for re-offering or resale, directly or indirectly, in Japan or to any Japanese Person, except in compliance with all applicable laws, regulations and ministerial guidelines promulgated by relevant Japanese governmental or regulatory authorities in effect at the relevant time. For the purposes of this paragraph, “Japanese Person” shall mean any person resident in Japan, including any corporation or other entity organized under the laws of Japan.
Notice to Prospective Investors in Singapore
This prospectus has not been registered as a prospectus with the Monetary Authority of Singapore. Accordingly, this prospectus and any other document or material in connection with the offer or sale, or invitation for subscription or purchase, of shares may not be circulated or distributed, nor may the shares be offered or sold, or be made the subject of an invitation for subscription or purchase, whether directly or indirectly, to persons in Singapore other than (i) to an institutional investor under Section 274 of the Securities and Futures Act, Chapter 289 of Singapore (the “SFA”), (ii) to a relevant person pursuant to Section 275(1), or any person pursuant to Section 275(1A), and in accordance with the conditions specified in Section 275, of the SFA, or (iii) otherwise pursuant to, and in accordance with the conditions of, any other applicable provision of the SFA.
Where the shares are subscribed or purchased under Section 275 of the SFA by a relevant person which is:
| (a) | a corporation (which is not an accredited investor (as defined in Section 4A of the SFA)) the sole business of which is to hold investments and the entire share capital of which is owned by one or more individuals, each of whom is an accredited investor; or |
| (b) | a trust (where the trustee is not an accredited investor) whose sole purpose is to hold investments and each beneficiary of the trust is an individual who is an accredited investor, |
securities (as defined in Section 239(1) of the SFA) of that corporation or the beneficiaries’ rights and interest (howsoever described) in that trust shall not be transferred within six months after that corporation or that trust has acquired the shares pursuant to an offer made under Section 275 of the SFA except:
| (a) | to an institutional investor or to a relevant person defined in Section 275(2) of the SFA, or to any person arising from an offer referred to in Section 275(1A) or Section 276(4)(i)(B) of the SFA; |
| (b) | where no consideration is or will be given for the transfer; |
| (c) | where the transfer is by operation of law; |
| (d) | as specified in Section 276(7) of the SFA; or |
| (e) | as specified in Regulation 32 of the Securities and Futures (Offers of Investments) (Shares and Debentures) Regulations 2005 of Singapore. |
173
Table of Contents
Notice to Prospective Investors in Canada
The shares may be sold only to purchasers purchasing, or deemed to be purchasing, as principal that are accredited investors, as defined in National Instrument 45-106 Prospectus Exemptions or subsection 73.3(1) of the Securities Act (Ontario), and are permitted clients, as defined in National Instrument 31-103 Registration Requirements, Exemptions and Ongoing Registrant Obligations. Any resale of the shares must be made in accordance with an exemption from, or in a transaction not subject to, the prospectus requirements of applicable securities laws.
Securities legislation in certain provinces or territories of Canada may provide a purchaser with remedies for rescission or damages if this prospectus (including any amendment thereto) contains a misrepresentation, provided that the remedies for rescission or damages are exercised by the purchaser within the time limit prescribed by the securities legislation of the purchaser’s province or territory. The purchaser should refer to any applicable provisions of the securities legislation of the purchaser’s province or territory for particulars of these rights or consult with a legal advisor.
Pursuant to section 3A.3 (or, in the case of securities issued or guaranteed by the government of a non-Canadian jurisdiction, section 3A.4) of National Instrument 33-105 Underwriting Conflicts (NI 33-105), the underwriters are not required to comply with the disclosure requirements of NI 33-105 regarding underwriter conflicts of interest in connection with this offering.
174
Table of Contents
The validity of the common stock offered hereby will be passed upon for us by Dinsmore & Shohl LLP, Lexington, Kentucky and certain legal matters will be passed on for us by Cravath, Swaine & Moore LLP, New York, New York. Certain legal matters will be passed on for the underwriters by Shearman & Sterling LLP, New York, New York.
The combined financial statements of Valvoline, an unincorporated commercial unit of Ashland Inc., as of September 30, 2014 and for each of the two years in the period ended September 30, 2014 included in this registration statement have been so included in reliance on the report of PricewaterhouseCoopers LLP, an independent registered public accounting firm, given on the authority of said firm as experts in auditing and accounting.
Ernst & Young LLP, independent registered public accounting firm, has audited the combined financial statements of Valvoline, an unincorporated commercial unit of Ashland Inc., at September 30, 2015, and for the year then ended, as set forth in their report. We have included these financial statements in the prospectus and elsewhere in the registration statement in reliance on Ernst & Young LLP’s report, given on their authority as experts in accounting and auditing.
Ernst & Young LLP, independent registered public accounting firm, has audited the balance sheet of Valvoline Inc. at May 13, 2016 (date of formation), as set forth in their report. We have included this financial statement in the prospectus and elsewhere in the registration statement in reliance on Ernst & Young LLP’s report, given on their authority as experts in accounting and auditing.
WHERE YOU CAN FIND MORE INFORMATION
We have filed a Registration Statement on Form S-1 with the SEC regarding this offering. This prospectus, which is part of the registration statement, does not contain all of the information included in the registration statement, and you should refer to the registration statement and its exhibits to read that information. References in this prospectus to any of our contracts or other documents are not necessarily complete, and you should refer to the exhibits attached to the registration statement for copies of the actual contract or document. Following the completion of this offering, we will be subject to the information reporting requirements of the Exchange Act and we will file reports, proxy statements and other information with the SEC.
You may read and copy the registration statement and the related exhibits, and the reports, proxy statements and other information we will file with the SEC, at the SEC’s public reference room maintained at 100 F Street N.E., Room 1580, Washington, D.C. 20549. You can also request copies of those documents, upon payment of a duplicating fee, by writing to the SEC. Please call the SEC at 1-800-SEC-0330 for further information on the operation of the public reference room. The SEC also maintains an Internet site that contains reports, proxy and information statements and other information regarding issuers that file with the SEC. The site’s Internet address is www.sec.gov.
175
Table of Contents
| Audited Financial Statements of Valvoline Inc. | ||||
| Page | ||||
| F-2 | ||||
| F-3 | ||||
| F-4 | ||||
| Audited Combined Financial Statements of Valvoline | ||||
| Page | ||||
| F-5 | ||||
| F-7 | ||||
| F-8 | ||||
| Combined Statements of Invested Equity for the years ended September 30, 2015, 2014, and 2013 |
F-9 | |||
| Combined Statements of Cash Flows for the years ended September 30, 2015, 2014, and 2013 |
F-10 | |||
| F-11 | ||||
| F-40 | ||||
| Unaudited Interim Condensed Combined Financial Statements of Valvoline | ||||
| Page | ||||
| Unaudited Interim Condensed Combined Financial Statements of Valvoline: |
||||
| F-42 | ||||
| Condensed Combined Balance Sheets at March 31, 2016 and September 30, 2015 |
F-43 | |||
| Combined Statements of Invested Equity for the six months ended March 31, 2016 and 2015 |
F-44 | |||
| Condensed Combined Statements of Cash Flows for the six months ended March 31, 2016 and 2015 |
F-45 | |||
| F-46 | ||||
F-1
Table of Contents
REPORT OF INDEPENDENT REGISTERED PUBLIC ACCOUNTING FIRM
To the Board of Directors
Ashland Inc.
We have audited the accompanying balance sheet of Valvoline Inc. as of May 13, 2016 (date of formation). This financial statement is the responsibility of the Company’s management. Our responsibility is to express an opinion on this financial statement based on our audit.
We conducted our audit in accordance with the standards of the Public Company Accounting Oversight Board (United States). Those standards require that we plan and perform the audit to obtain reasonable assurance about whether the financial statement is free of material misstatement. We were not engaged to perform an audit of the Company’s internal control over financial reporting. Our audit included consideration of internal control over financial reporting as a basis for designing audit procedures that are appropriate in the circumstances, but not for the purpose of expressing an opinion on the effectiveness of the Company’s internal control over financial reporting. Accordingly, we express no such opinion. An audit also includes examining, on a test basis, evidence supporting the amounts and disclosures in the financial statement, assessing the accounting principles used and significant estimates made by management, and evaluating the overall financial statement presentation. We believe that our audit provides a reasonable basis for our opinion.
In our opinion, the financial statement referred to above presents fairly, in all material respects, the financial position of Valvoline Inc. as of May 13, 2016 (date of formation), in conformity with U.S. generally accepted accounting principles.
/s/ Ernst & Young LLP
Cincinnati, Ohio
May 31, 2016
F-2
Table of Contents
Valvoline Inc.
| May 13, 2016 |
||||
| Assets |
||||
| Cash |
$ | 10 | ||
|
|
|
|||
| Total assets |
$ | 10 | ||
|
|
|
|||
| Liabilities and stockholder’s equity |
||||
| Total liabilities |
$ | — | ||
| Stockholder’s equity |
||||
| Common stock ($.01 par value per share, 1,000 shares authorized, 1,000 shares issued and outstanding) |
10 | |||
|
|
|
|||
| Total stockholder’s equity |
10 | |||
|
|
|
|||
| Total liabilities and stockholder’s equity |
$ | 10 | ||
|
|
|
|||
F-3
Table of Contents
Valvoline Inc.
Note to the Financial Statement
NOTE A – DESCRIPTION OF BUSINESS AND BASIS OF PRESENTATION
Valvoline Inc. (the “Company”), a Kentucky corporation, was formed on May 13, 2016. The Company has nominal assets, no liabilities and has conducted no operations. At May 13, 2016, the Company is a wholly owned subsidiary of Ashland Inc. Ashland Inc. intends to enter into agreements and take certain actions to transfer to the Company substantially all of the assets and liabilities related to Valvoline, an unincorporated commercial unit of Ashland Inc.
The accompanying financial statement of the Company is prepared in conformity with accounting principles generally accepted in the United States of America (“U.S. GAAP”) and U.S. Securities and Exchange Commission regulations.
The Company has authorized 1,000 shares of $0.01 par value per share common stock. All of these shares are issued and outstanding as of May 13, 2016.
Cash includes cash on hand, including any deposits in transit, and highly liquid investments maturing within three months after purchase.
F-4
Table of Contents
REPORT OF INDEPENDENT REGISTERED PUBLIC ACCOUNTING FIRM
To the Board of Directors
Ashland Inc.
We have audited the accompanying combined balance sheet of Valvoline, an unincorporated commercial unit of Ashland Inc., as of September 30, 2015, and the related combined statements of operations and comprehensive income, invested equity and cash flows for the year then ended. These financial statements are the responsibility of the Company’s management. Our responsibility is to express an opinion on these financial statements based on our audit.
We conducted our audit in accordance with the standards of the Public Company Accounting Oversight Board (United States). Those standards require that we plan and perform the audit to obtain reasonable assurance about whether the financial statements are free of material misstatement. Our audit included consideration of internal control over financial reporting as a basis for designing audit procedures that are appropriate in the circumstances, but not for the purpose of expressing an opinion on the effectiveness of the Company’s internal control over financial reporting. Accordingly, we express no such opinion. An audit also includes examining, on a test basis, evidence supporting the amounts and disclosures in the financial statements, assessing the accounting principles used and significant estimates made by management, and evaluating the overall financial statement presentation. We believe that our audit provides a reasonable basis for our opinion.
In our opinion, the financial statements referred to above present fairly, in all material respects, the combined financial position of Valvoline, an unincorporated commercial unit of Ashland Inc., as of September 30, 2015, and the combined results of its operations and its cash flows for the year then ended, in conformity with U.S. generally accepted accounting principles.
/s/ Ernst & Young LLP
Cincinnati, Ohio
May 31, 2016
F-5
Table of Contents
REPORT OF INDEPENDENT REGISTERED PUBLIC ACCOUNTING FIRM
To the Board of Directors of Ashland Inc.:
In our opinion, the combined balance sheet as of September 30, 2014 and the related combined statements of operations and comprehensive income, of invested equity and of cash flows for each of the two years in the period ended September 30, 2014 present fairly, in all material respects, the financial position of Valvoline, an unincorporated commercial unit of Ashland Inc., at September 30, 2014 and the results of its operations and its cash flows for each of the two years in the period ended September 30, 2014, in conformity with accounting principles generally accepted in the United States of America. These financial statements are the responsibility of the Company’s management. Our responsibility is to express an opinion on these financial statements based on our audits. We conducted our audits of these statements in accordance with the standards of the Public Company Accounting Oversight Board (United States). Those standards require that we plan and perform the audit to obtain reasonable assurance about whether the financial statements are free of material misstatement. An audit includes examining, on a test basis, evidence supporting the amounts and disclosures in the financial statements, assessing the accounting principles used and significant estimates made by management, and evaluating the overall financial statement presentation. We believe that our audits provide a reasonable basis for our opinion.
/s/ PricewaterhouseCoopers LLP
Cincinnati, OH
May 31, 2016
F-6
Table of Contents
Combined Statements of Operations and Comprehensive Income
Years Ended September 30
| (In millions) |
2015 | 2014 | 2013 | |||||||||
| Sales |
$ | 1,966.9 | $ | 2,041.3 | $ | 1,996.2 | ||||||
| Cost of sales |
1,281.8 | 1,408.9 | 1,338.3 | |||||||||
|
|
|
|
|
|
|
|||||||
| Gross profit |
685.1 | 632.4 | 657.9 | |||||||||
| Selling, general and administrative expense |
290.8 | 302.8 | 213.4 | |||||||||
| Corporate expense allocation – Note N |
79.5 | 95.0 | 88.2 | |||||||||
| Equity and other income – Note E |
8.3 | 30.1 | 24.3 | |||||||||
|
|
|
|
|
|
|
|||||||
| Operating income |
323.1 | 264.7 | 380.6 | |||||||||
| Net loss on divestiture – Note C |
(26.3 | ) | — | — | ||||||||
|
|
|
|
|
|
|
|||||||
| Income before income taxes |
296.8 | 264.7 | 380.6 | |||||||||
| Income tax expense – Note J |
100.7 | 91.3 | 134.5 | |||||||||
|
|
|
|
|
|
|
|||||||
| Net income |
$ | 196.1 | $ | 173.4 | $ | 246.1 | ||||||
|
|
|
|
|
|
|
|||||||
| COMPREHENSIVE INCOME (LOSS) |
||||||||||||
| Net income |
$ | 196.1 | $ | 173.4 | $ | 246.1 | ||||||
| Other comprehensive income (loss), net of tax |
||||||||||||
| Unrealized translation loss |
(34.1 | ) | (12.0 | ) | (10.9 | ) | ||||||
| Pension obligation adjustment |
0.1 | 0.4 | 0.2 | |||||||||
|
|
|
|
|
|
|
|||||||
| Other comprehensive loss |
(34.0 | ) | (11.6 | ) | (10.7 | ) | ||||||
|
|
|
|
|
|
|
|||||||
| Comprehensive income |
$ | 162.1 | $ | 161.8 | $ | 235.4 | ||||||
|
|
|
|
|
|
|
|||||||
See Notes to Combined Financial Statements.
F-7
Table of Contents
Combined Balance Sheets
At September 30
| (In millions) |
2015 | 2014 | ||||||
| Assets |
||||||||
| Current assets |
||||||||
| Accounts receivable (a) |
$ | 334.6 | $ | 388.0 | ||||
| Inventories – Note B |
125.6 | 133.0 | ||||||
| Other assets |
17.1 | 23.7 | ||||||
|
|
|
|
|
|||||
| Total current assets |
477.3 | 544.7 | ||||||
| Noncurrent assets |
||||||||
| Property, plant and equipment – Note F |
||||||||
| Cost |
627.8 | 663.0 | ||||||
| Accumulated depreciation |
374.3 | 390.6 | ||||||
|
|
|
|
|
|||||
| Net property, plant and equipment |
253.5 | 272.4 | ||||||
| Goodwill – Note G |
169.4 | 167.9 | ||||||
| Intangibles – Note G |
1.6 | 6.4 | ||||||
| Equity method investments – Note E |
28.9 | 44.0 | ||||||
| Other assets – Note H |
47.2 | 47.1 | ||||||
|
|
|
|
|
|||||
| Total noncurrent assets |
500.6 | 537.8 | ||||||
|
|
|
|
|
|||||
| Total assets |
$ | 977.9 | $ | 1,082.5 | ||||
|
|
|
|
|
|||||
| Liabilities and Invested Equity |
||||||||
| Current liabilities |
||||||||
| Trade and other payables |
$ | 173.3 | $ | 177.5 | ||||
| Accrued expenses and other liabilities – Note H |
125.3 | 116.0 | ||||||
|
|
|
|
|
|||||
| Total current liabilities |
298.6 | 293.5 | ||||||
| Noncurrent liabilities |
||||||||
| Employee benefit obligations – Note K |
13.0 | 14.8 | ||||||
| Deferred income taxes – Note J |
23.8 | 18.2 | ||||||
| Other liabilities – Note H |
25.4 | 31.2 | ||||||
|
|
|
|
|
|||||
| Total noncurrent liabilities |
62.2 | 64.2 | ||||||
| Commitments and contingencies – Notes I and L |
||||||||
| Invested equity – Notes M and N |
||||||||
| Ashland’s net investment in Valvoline |
677.7 | 751.4 | ||||||
| Accumulated other comprehensive loss |
(60.6 | ) | (26.6 | ) | ||||
|
|
|
|
|
|||||
| Total invested equity |
617.1 | 724.8 | ||||||
|
|
|
|
|
|||||
| Total liabilities and invested equity |
$ | 977.9 | $ | 1,082.5 | ||||
|
|
|
|
|
|||||
| (a) | Accounts receivable includes an allowance for doubtful accounts of $3.8 million in 2015 and $4.8 million in 2014. |
See Notes to Combined Financial Statements.
F-8
Table of Contents
Combined Statements of Invested Equity
| (In millions) |
Ashland’s Net Investment in Valvoline |
Accumulated Other Comprehensive Loss (a) |
Total | |||||||||
| Balance at September 30, 2012 |
$ | 674.2 | $ | (4.3 | ) | $ | 669.9 | |||||
| Total comprehensive income (loss) |
246.1 | (10.7 | ) | 235.4 | ||||||||
| Equity returned to Ashland, net |
(221.6 | ) | — | (221.6 | ) | |||||||
|
|
|
|
|
|
|
|||||||
| Balance at September 30, 2013 |
698.7 | (15.0 | ) | 683.7 | ||||||||
| Total comprehensive income (loss) |
173.4 | (11.6 | ) | 161.8 | ||||||||
| Equity returned to Ashland, net |
(120.7 | ) | — | (120.7 | ) | |||||||
|
|
|
|
|
|
|
|||||||
| Balance at September 30, 2014 |
751.4 | (26.6 | ) | 724.8 | ||||||||
| Total comprehensive income (loss) |
196.1 | (34.0 | ) | 162.1 | ||||||||
| Equity returned to Ashland, net |
(269.8 | ) | — | (269.8 | ) | |||||||
|
|
|
|
|
|
|
|||||||
| Balance at September 30, 2015 |
$ | 677.7 | $ | (60.6 | ) | $ | 617.1 | |||||
|
|
|
|
|
|
|
|||||||
| (a) | At September 30, 2015 and 2014, the accumulated other comprehensive loss of $60.6 million and $26.6 million, respectively, was comprised of unrecognized prior service costs as a result of certain employee benefit plan amendments of $0.3 million and $0.4 million, respectively, and net unrealized translation losses of $60.3 million and $26.2 million, respectively. |
See Notes to Combined Financial Statements.
F-9
Table of Contents
Combined Statements of Cash Flows
Years Ended September 30
| (In millions) |
2015 | 2014 | 2013 | |||||||||
| Cash flows provided (used) by operating activities |
||||||||||||
| Net income |
$ | 196.1 | $ | 173.4 | $ | 246.1 | ||||||
| Adjustments to reconcile income to cash flows from operating activities |
||||||||||||
| Depreciation and amortization |
38.0 | 37.1 | 35.7 | |||||||||
| Deferred income taxes |
(9.1 | ) | (16.0 | ) | 37.7 | |||||||
| Equity income from affiliates |
(12.1 | ) | (10.2 | ) | (12.8 | ) | ||||||
| Distributions from equity affiliates |
17.9 | 7.5 | 7.7 | |||||||||
| Net loss on divestiture – Note C |
26.3 | — | — | |||||||||
| Impairment of equity method investment – Note C |
14.3 | — | — | |||||||||
| Loss (gain) on Valvoline stand-alone pension plan remeasurements |
2.0 | 1.0 | (2.5 | ) | ||||||||
| Change in assets and liabilities (a) |
||||||||||||
| Accounts receivable |
53.4 | (31.3 | ) | (1.3 | ) | |||||||
| Inventories |
(6.4 | ) | 8.2 | (18.9 | ) | |||||||
| Trade and other payables |
(7.3 | ) | (7.8 | ) | 12.0 | |||||||
| Accrued expenses and other liabilities |
9.3 | (11.3 | ) | 8.8 | ||||||||
| Other assets and liabilities |
7.4 | 20.0 | (39.6 | ) | ||||||||
|
|
|
|
|
|
|
|||||||
| Total cash flows provided by operating activities |
329.8 | 170.6 | 272.9 | |||||||||
| Cash flows provided (used) by investing activities |
||||||||||||
| Additions to property, plant and equipment |
(45.0 | ) | (37.2 | ) | (40.9 | ) | ||||||
| Proceeds from disposal of property, plant and equipment |
0.9 | 0.8 | 0.5 | |||||||||
| Purchase of operations – net of cash acquired |
(4.7 | ) | (1.9 | ) | (0.2 | ) | ||||||
| Proceeds from sale of operations |
22.8 | — | — | |||||||||
|
|
|
|
|
|
|
|||||||
| Total cash flows used by investing activities |
(26.0 | ) | (38.3 | ) | (40.6 | ) | ||||||
| Cash flows provided (used) by financing activities |
||||||||||||
| Net transfers to Ashland |
(303.8 | ) | (132.3 | ) | (232.3 | ) | ||||||
|
|
|
|
|
|
|
|||||||
| Total cash flows used by financing activities |
(303.8 | ) | (132.3 | ) | (232.3 | ) | ||||||
|
|
|
|
|
|
|
|||||||
| Change in cash and cash equivalents – Notes A and B |
— | — | — | |||||||||
| Cash and cash equivalents – beginning of year |
— | — | — | |||||||||
|
|
|
|
|
|
|
|||||||
| Cash and cash equivalents – end of year |
$ | — | $ | — | $ | — | ||||||
|
|
|
|
|
|
|
|||||||
| (a) | Excludes changes resulting from operations acquired or sold. |
See Notes to Combined Financial Statements.
F-10
Table of Contents
Notes to Combined Financial Statements
NOTE A – DESCRIPTION OF BUSINESS AND BASIS OF PRESENTATION
The Proposed Distribution
On September 22, 2015, Ashland Inc. (Ashland) announced that its Board of Directors approved proceeding with a plan to separate Ashland into two independent, publicly traded companies comprised of Ashland Global Holdings Inc. (Ashland Global), consisting of its specialty chemicals businesses, and Valvoline. Valvoline will focus on building the world’s leading engine and automotive maintenance business by providing “Hands on Expertise” to customers in each of its primary market channels. Immediately prior to the closing of Valvoline’s initial public offering, Ashland and Valvoline will become subsidiaries of Ashland Global. Ashland intends for the spin-off, which is subject to final board approval prior to completion, to be tax free for Ashland shareholders. Immediately following the spin-off, Ashland shareholders will own shares of both Ashland Global and Valvoline. The spin-off is expected to be completed approximately six months after the completion of the initial public offering of Valvoline.
The internal reorganization and, in turn, the distribution, are subject to the satisfaction or waiver by Ashland of a number of conditions. Additionally, Ashland may determine not to complete the internal reorganization or the distribution if, at any time, the Board of Directors of Ashland determines, in its sole and absolute discretion, that the distribution is not in the best interest of Ashland or its stockholders or is otherwise not advisable.
Valvoline is a premium consumer brand in the global automotive lubricant industry. In the United States, Valvoline operates in all of the key lubricant sales channels, and also has an international presence with products sold in approximately 140 countries. Valvoline provides a wide array of lubricants used in commercial and industrial equipment and machinery, and automotive chemicals designed to help engines run better and longer. Valvoline also operates a retail quick lube service chain through Valvoline Instant Oil Change (VIOC), which provides service through over 1,000 franchised and company-owned stores.
Basis of presentation
The accompanying Combined Financial Statements were prepared on a stand-alone basis derived from the consolidated financial statements and accounting records of Ashland. For the periods presented, Valvoline was an unincorporated commercial unit of Ashland Inc. These Combined Financial Statements reflect the historical results of operations, financial position and cash flows of Valvoline as it was historically managed and adjusted to conform with accounting principles generally accepted in the United States of America (U.S. GAAP). These Combined Financial Statements are presented as if Valvoline had operated on a stand-alone basis for all periods presented. For the years ended September 30, 2015, 2014 and 2013, Valvoline is comprised of a combination of unincorporated commercial units of Ashland and its various subsidiary companies and, in certain jurisdictions, separate legal entities.
All significant intercompany transactions within Valvoline have been eliminated. The assets and liabilities in the stand-alone financial statements are wholly owned by Ashland and are being transferred to Valvoline at carry-over (historical cost) basis. As a result, the Combined Financial Statements included herein may not necessarily be indicative of Valvoline’s financial position, results of operations, or cash flows had it operated as a stand-alone entity during the periods presented. All significant transactions between Valvoline and Ashland have been included in the Combined Financial Statements and are considered to be effectively settled for cash at the time the transaction is recorded. The total net effect of the settlement of these intercompany transactions is reflected in the Combined Statement of Cash Flows as a financing activity and in the Combined Balance Sheets as Ashland’s net investment in Valvoline in lieu of stockholder’s equity. In the Combined Statements of Invested Equity, the Invested Equity returned to Ashland is the net of a variety of intercompany transactions including collection of trade receivables, payment of trade payables and accrued liabilities, settlement of charges for
F-11
Table of Contents
NOTE A – DESCRIPTION OF BUSINESS AND BASIS OF PRESENTATION (continued)
allocated corporate costs, and payment of taxes by Ashland on Valvoline’s behalf. The Combined Financial Statements reflect the assets, liabilities and operations of the Valvoline business. Investments in joint ventures where Valvoline has the ability to exert significant influence are accounted for under the equity method.
The Combined Financial Statements also include the recognition of certain assets and liabilities that have historically been recorded at the Ashland corporate level but which are specifically identifiable or otherwise attributable to Valvoline. Valvoline utilizes centralized functions of Ashland to support its operations, and in return, Ashland allocates certain of its expenses to Valvoline. Such expenses represent costs related, but not limited to, treasury, legal, accounting, insurance, information technology, payroll administration, human resources, stock incentive plans and other services. These costs, together with an allocation of Ashland overhead costs, are included within the Corporate expense allocation caption in the Combined Statements of Operations and Comprehensive Income. Where it is possible to specifically attribute such expenses to activities of Valvoline, these amounts have been charged or credited directly to Valvoline without allocation or apportionment. Allocation of all other such expenses is based on a reasonable reflection of the utilization of service provided or benefits received by Valvoline during the periods presented on a consistent basis, such as headcount, square footage, tangible assets or sales.
Management believes the assumptions underlying the stand-alone financial statements, including the assumptions regarding allocated expenses, reasonably reflect the utilization of services provided to or the benefit received by Valvoline during the periods presented. However, these shared expenses may not represent the amounts that would have been incurred had Valvoline operated autonomously or independently from Ashland. Actual costs that would have been incurred if Valvoline had been a stand-alone company would depend on multiple factors, including organizational structure and strategic decisions in various areas, including information technology and infrastructure. For an additional discussion of expense allocations see Note N of the Notes to Combined Financial Statements.
Ashland uses a centralized approach to cash management. Accordingly, cash and cash equivalents are held by Ashland at the corporate level and were not attributed to Valvoline for any of the periods presented. Transfers of cash, both to and from Ashland’s centralized cash management system, are reflected as a component of Ashland’s net investment in Valvoline on the Combined Balance Sheets and as a financing activity within the accompanying Combined Statement of Cash Flows. Debt obligations of Ashland have not been included in the Combined Financial Statements of Valvoline, because Valvoline is not a party to the obligation between Ashland and the debt holders.
The income tax provision in the Combined Statements of Operations and Comprehensive Income has been calculated as if Valvoline was operating on a stand-alone basis and filed separate tax returns in the jurisdiction in which it operates. Valvoline’s operations have historically been included in the Ashland U.S. federal and state tax returns or non-U.S. jurisdictions tax returns. Ashland’s global tax model has been developed based on its entire portfolio of businesses. Therefore cash tax payments and items of current and deferred taxes may not be reflective of Valvoline’s actual tax balances prior to or subsequent to Valvoline operating as a stand-alone company.
NOTE B – SIGNIFICANT ACCOUNTING POLICIES
Valvoline’s significant accounting policies, which conform to U. S. GAAP and are applied on a consistent basis in all years presented, except as indicated, are described below.
Use of estimates, risks and uncertainties
The preparation of Valvoline’s Combined Financial Statements in conformity with U.S. GAAP requires management to make estimates and assumptions that affect the reported amounts of assets, liabilities, revenues
F-12
Table of Contents
NOTE B – SIGNIFICANT ACCOUNTING POLICIES (continued)
and expenses, and the disclosures of contingent assets and liabilities. Significant items that are subject to such estimates and assumptions include, but are not limited to, long-lived assets (including goodwill), sales deductions, and income taxes. Although management bases its estimates on historical experience and various other assumptions that are believed to be reasonable under the circumstances, actual results could differ significantly from the estimates under different assumptions or conditions.
Valvoline’s results are affected by domestic and international economic, political, legislative, regulatory and legal actions. Economic conditions, such as recessionary trends, inflation, monetary exchange rates, government fiscal policies and changes in the prices of certain key raw materials, can have a significant effect on operations. Political actions may include changes in the policies of the Organization of Petroleum Exporting Countries or other developments involving or affecting oil-producing countries, including military conflicts, embargoes, internal instability or actions or reactions of the U.S. government in anticipation of, or in response to, such actions. While Valvoline maintains reserves for anticipated liabilities and, through Ashland, carries various levels of insurance, Valvoline could be affected by civil, criminal, regulatory or administrative actions, claims or proceedings relating to asbestos, environmental remediation or other matters.
Cash and cash equivalents
Valvoline participates in Ashland’s centralized cash management and financing programs. As such, no cash is reported in the Combined Balance Sheets for any period presented.
Accounts receivable and allowance for doubtful accounts
A progression of activity in the allowance for doubtful accounts is presented in the following table.
| (In millions) |
2015 | 2014 | 2013 | |||||||||
| Allowance for doubtful accounts – beginning of year |
$ | 4.8 | $ | 4.9 | $ | 7.9 | ||||||
| Adjustments to provision |
(0.3 | ) | 0.2 | (2.7 | ) | |||||||
| Reserves utilized |
(0.7 | ) | (0.3 | ) | (0.3 | ) | ||||||
|
|
|
|
|
|
|
|||||||
| Allowance for doubtful accounts – end of year |
$ | 3.8 | $ | 4.8 | $ | 4.9 | ||||||
|
|
|
|
|
|
|
|||||||
Valvoline records an allowance for doubtful accounts as a best estimate of the amount of probable credit losses for accounts receivable. Each month, Valvoline reviews this allowance and considers factors such as customer credit, past transaction history with the customer and changes in customer payment terms when determining whether the collection of a receivable is reasonably assured. Past due balances over 90 days and over a specified amount are reviewed individually for collectability. The allowance for doubtful accounts is adjusted when it becomes probable a receivable will not be recovered.
As part of the centralized cash management program with Ashland, Valvoline began participating in an accounts receivable securitization facility in 2012 that allowed Ashland to sell, on an ongoing basis, certain of its qualifying accounts receivable, certain related assets and the right to the collections on those accounts receivable to CVG Capital III, LLC (CVG), a wholly-owned special purpose subsidiary of Ashland. Valvoline’s participation is a result of Ashland’s centralized approach to cash management, and transfers under the facility are recorded as secured borrowings by Ashland with the receivables sold pursuant to the facility included in the Combined Balance Sheets as accounts receivable. At September 30, 2015 and 2014 the outstanding amount of accounts receivable sold by Ashland to CVG for Valvoline’s participating receivables in the facility was $234.7 million and $284.9 million, respectively. These amounts are included in the accounts receivable caption of the Combined Balance Sheets.
F-13
Table of Contents
NOTE B – SIGNIFICANT ACCOUNTING POLICIES (continued)
During 2014, Ashland entered into an agreement to sell accounts receivable for a Valvoline customer in the form of drafts or bills of exchange to a financial institution. Each draft constitutes an order to pay for obligations of the customer to Ashland arising from the sale of goods by Ashland to the customer. As the intention of the arrangement is to decrease the amount of time accounts receivable is outstanding and increase cash flows for Ashland through its centralized cash management function. At September 30, 2015 the outstanding amount of drafts sold by Ashland to the financial institution was $41.4 million. No receivables were sold as of September 30, 2014.
Inventories
Inventories are carried at the lower of cost or market value. Inventories are primarily stated at cost using the weighted-average cost method. In addition, certain lubricants with a replacement cost of $63.2 million at September 30, 2015 and $63.3 million at September 30, 2014 are valued at cost using the last-in, first-out (LIFO) method.
The following summarizes Valvoline’s inventories as of the Combined Balance Sheet dates.
| (In millions) |
2015 | 2014 | ||||||
| Finished products |
$ | 134.3 | $ | 149.7 | ||||
| Raw materials, supplies and work in process |
22.5 | 26.1 | ||||||
| LIFO reserves |
(31.2 | ) | (42.8 | ) | ||||
|
|
|
|
|
|||||
| $ | 125.6 | $ | 133.0 | |||||
|
|
|
|
|
|||||
A progression of activity in the inventory reserves, which reduce or increase the amounts of finished products and raw materials, supplies and work in process reported, is presented in the following table.
| (In millions) |
2015 | 2014 | 2013 | |||||||||
| Inventory reserves – beginning of year |
$ | 5.7 | $ | 6.0 | $ | 4.7 | ||||||
| Adjustments to provision |
(0.3 | ) | (1.2 | ) | (0.2 | ) | ||||||
| Reserves utilized |
(0.6 | ) | 0.9 | 1.5 | ||||||||
|
|
|
|
|
|
|
|||||||
| Inventory reserves – end of year |
$ | 4.8 | $ | 5.7 | $ | 6.0 | ||||||
|
|
|
|
|
|
|
|||||||
Property, plant and equipment
The cost of property, plant and equipment is depreciated by the straight-line method over the estimated useful lives of the assets. Buildings are depreciated principally over 5 to 35 years and machinery and equipment principally over 5 to 15 years. Such costs are periodically reviewed for recoverability when impairment indicators are present and are conducted at the lowest identifiable level of cash flows. Such indicators could include, among other factors, operating losses, unused capacity, market value declines and technological obsolescence. Recorded values of asset groups of property, plant and equipment, that are not expected to be recovered through undiscounted future net cash flows, are written down to current fair value, which generally is determined from estimated discounted future net cash flows (assets held for use) or net realizable value (assets held for sale).
Goodwill and other intangibles
Valvoline tests goodwill for impairment annually as of July 1 or when events and circumstances indicate an impairment may have occurred. This annual assessment consists of Valvoline determining each reporting unit’s current fair value compared to its current carrying value. Valvoline’s reporting units for the allocation of goodwill include the Core North America, Quick Lubes, and International operating segments.
F-14
Table of Contents
NOTE B – SIGNIFICANT ACCOUNTING POLICIES (continued)
With respect to goodwill, Valvoline performs either a qualitative or quantitative evaluation for each of its reporting units. Factors considered in the qualitative test include reporting unit specific operating results as well as new events and circumstances impacting the operations of the reporting units. For the quantitative test, the Company assesses goodwill for impairment by comparing the carrying value of its reporting units to their respective fair values and reviewing the Company’s market value of invested capital. The Company determines the fair value of its reporting units under the income-based approach and incorporates assumptions it believes marketplace participants would utilize.
Valvoline’s assessment of an impairment charge on goodwill could change in future periods if any or all of the following events were to occur with respect to a particular reporting unit: a significant change in projected business results, a divestiture decision, increase in Valvoline’s weighted-average cost of capital rates, decrease in growth rates or other assumptions, economic deterioration that is more severe or of a longer duration than anticipated, or another significant economic event.
Finite-lived intangible assets principally consist of certain trademarks and trade names, intellectual property, and customer lists. These intangible assets are amortized on a straight-line basis over their estimated useful lives. The cost of trademarks and trade names is amortized principally over 15 to 25 years, intellectual property over 10 years and customer relationships over 10 to 20 years. Valvoline reviews finite-lived intangible assets for impairment whenever events or changes in circumstances indicate the carrying amount of an asset may not be recoverable. Valvoline monitors these changes and events on at least a quarterly basis. For further information on goodwill and other intangible assets, see Note G.
Equity method investments
Investments in joint ventures where Valvoline has the ability to exert significant influence are accounted for under the equity method of accounting. As of September 30, 2015 and 2014 Valvoline’s investments in these assets were $28.9 million and $44.0 million, respectively.
Revenue recognition
Sales generally are recognized when persuasive evidence of an arrangement exists, products are received or services are provided to customers, the sales price is fixed or determinable and collectability is reasonably assured. Valvoline reports all sales net of tax assessed by qualifying governmental authorities. Certain shipping and handling costs paid by the customer are recorded in sales, while those costs paid by Valvoline are recorded in cost of sales. Franchise revenue is also included within sales and was $22.2 million, $19.8 million, and $17.8 million during 2015, 2014, and 2013, respectively.
Sales rebates and discounts, consisting primarily of promotional rebates and customer pricing discounts, are offered through various programs to customers. Sales are recorded net of these rebates and discounts totaling $344.8 million, $321.7 million and $300.4 million in the Combined Statements of Operations and Comprehensive Income for September 30, 2015, 2014 and 2013, respectively. Sales rebates and discounts are recognized as incurred, generally at the time of the sale, or over the term of the sales contract. Valvoline bases its estimates on historical rates of customer discounts and rebates as well as the specific identification of discounts and rebates that have not been received.
Expense recognition
Cost of sales include material and production costs, as well as the costs of inbound and outbound freight, purchasing and receiving, inspection, warehousing, internal transfers and all other distribution network costs. Selling, general and administrative expense includes sales and marketing costs, advertising, customer support, environmental remediation, and administrative costs, other than allocated corporate charges from Ashland, which
F-15
Table of Contents
NOTE B – SIGNIFICANT ACCOUNTING POLICIES (continued)
have been separately identified in the corporate overhead allocation within the Combined Statements of Operations and Comprehensive Income. Advertising costs ($55.6 million in 2015, $56.2 million in 2014 and $61.0 million in 2013) and research and development costs ($11.4 million in both 2015 and 2014 and $11.3 million in 2013) are expensed as incurred.
Income taxes
The provision for income taxes includes current income taxes as well as deferred income taxes. Deferred tax assets and liabilities are determined based on differences between financial reporting and tax basis of assets and liabilities and are measured using enacted tax rates and laws that are expected to be in effect when the differences reverse. The effect of changes in tax rates on deferred taxes is recognized in the period in which the enactment date changes. Valuation allowances are established when necessary on a jurisdictional basis to reduce deferred tax assets to the amounts expected to be realized.
Valvoline income taxes as presented are calculated on a separate return basis, although Valvoline’s operations have historically been included in Ashland’s U.S. federal and state tax returns or non-U.S. jurisdictions tax returns. As Valvoline operations in many jurisdictions are unincorporated commercial units of Ashland and its subsidiaries, stand-alone tax returns have not been filed for the operations in these jurisdictions. Accordingly, Valvoline’s tax results as presented are not necessarily reflective of the results that Valvoline would have generated on a stand-alone basis.
Valvoline’s Combined Balance Sheets reflect assumptions regarding the expected manner of the spin-off of the company that would result in Ashland retaining certain tax attributes in a number of jurisdictions. As a result, the tax attributes that Ashland would retain in these jurisdictions have been eliminated from the Valvoline Combined Balance Sheets. The income tax expense of these items has been reflected in the Combined Statements of Operations and Comprehensive Income, with a corresponding offset to Total Invested Equity. For additional information on income taxes, see Note J.
A progression of activity in the tax valuation allowances is presented in the following table.
| (In millions) |
2015 | 2014 | 2013 | |||||||||
| Tax Valuation Allowance – beginning of year |
$ | 0.2 | $ | 0.2 | $ | 0.4 | ||||||
| Dispositions and other changes |
0.2 | — | (0.2 | ) | ||||||||
|
|
|
|
|
|
|
|||||||
| Tax Valuation Allowance – end of year |
$ | 0.4 | $ | 0.2 | $ | 0.2 | ||||||
|
|
|
|
|
|
|
|||||||
Retirement Plans and Other Postretirement Benefits
Qualifying employees participate in specific Valvoline or Ashland sponsored defined-benefit pension plans, which typically provide pension payments based on an employee’s length of service and compensation during the years immediately preceding retirement or have a cash balance design. The majority of U.S. pension plans have been closed to new participants since January 1, 2011. In addition, most foreign pension plans are closed to new participants while those that remain open relate to areas where local laws require plans to operate within the applicable country. Pension obligations for applicable employees of non-U.S. consolidated subsidiaries are provided for in accordance with local practices and regulations of the respective countries.
Valvoline recognizes the change in the fair value of plan assets and net actuarial gains and losses annually in the fourth quarter of each fiscal year and whenever a plan is determined to qualify for a remeasurement. The remaining components of pension and other postretirement benefits expense are recorded ratably on a quarterly basis. Pension and other postretirement benefits adjustments charged directly to cost of sales that are applicable to inactive participants are excluded from inventoriable costs. The service cost component of pension and other
F-16
Table of Contents
NOTE B – SIGNIFICANT ACCOUNTING POLICIES (continued)
postretirement benefits costs has been allocated to Valvoline on a ratable basis; while the remaining components of pension and other postretirement benefits costs are historically held at the Ashland corporate level. For purposes of the stand-alone financial statements of Valvoline, Valvoline’s portion of these costs has been reflected in the Combined Statements of Operations and Comprehensive Income within cost of sales or selling, general and administrative expenses.
Valvoline Stand-alone Defined Benefit Pension Plans
Valvoline has certain defined benefit pension plans that are specifically designated only for Valvoline employees. The net funded status of these Valvoline defined benefit pension plans is recognized in the Combined Balance Sheets. The funded status is measured as the difference between the fair value of plan assets and the benefit obligation at September 30, the measurement date. For defined benefit pension plans, the benefit obligation is the projected benefit obligation (PBO). The PBO represents the actuarial present value of benefits expected to be paid upon retirement based on estimated future compensation levels. The measurement of the benefit obligation is based on estimates and actuarial valuations. These valuations reflect the terms of the plans and use participant-specific information such as compensation, age and years of service, as well as certain key assumptions that require significant judgment, including, but not limited to, estimates of discount rates, expected return on plan assets, rate of compensation increases, interest rates and mortality rates.
Valvoline Participation in Ashland Sponsored Plans
Valvoline also has employees that are eligible to participate in certain defined contribution or defined benefit and postretirement benefit plans, that are sponsored by Ashland or its subsidiary companies. These plans are accounted for by Valvoline as multi-employer plans, in accordance with U.S. GAAP, which provides that an employer that participates in a multi-employer defined benefit plan is required to recognize its expense associated with the plan and is not required to report a liability beyond the contributions currently due and unpaid to the plan. Therefore, no assets or liabilities relative to these retirement plans have been included in the Combined Balance Sheets. Amounts recognized in the Combined Statements of Operations and Comprehensive Income for multi-employer defined benefit and postretirement benefit plans include an allocation to Valvoline on a ratable basis of the net actuarial gains and losses on an annual basis or whenever a plan is determined to qualify for a remeasurement.
For further information on expense, assets and liabilities related to these plans, see Note K.
Commitments, Contingencies and Environmental Costs
Liabilities for loss contingencies arising from claims, assessments, litigation, fines, penalties and other sources are recorded when it is probable that a liability has been incurred and the amount of the assessment and/or remediation can be reasonably estimated.
Valvoline partially insures its workers compensation claims and other general business insurance needs through Ashland. Ashland charges for the applicable portion of costs of third-party insurance and the costs of self-insured claims are recorded in the Combined Statements of Operations and Comprehensive Income.
Fair Value Measurements
As required by U.S. GAAP, Valvoline uses applicable guidance for defining fair value, the initial recording and periodic remeasurement of certain assets and liabilities measured at fair value and related disclosures for instruments measured at fair value. Fair value accounting guidance establishes a fair value hierarchy, which prioritizes the inputs to valuation techniques used to measure fair value into three broad levels. The fair value hierarchy gives the highest priority to quoted prices in active markets for identical assets or liabilities (Level 1)
F-17
Table of Contents
NOTE B – SIGNIFICANT ACCOUNTING POLICIES (continued)
and the lowest priority to unobservable inputs (Level 3). An instrument’s categorization within the fair value hierarchy is based upon the lowest level of input that is significant to the instrument’s fair value measurement. Valvoline measures assets and liabilities using inputs from the following three levels of fair value hierarchy:
Level 1 – Observable inputs such as unadjusted quoted prices in active markets for identical assets or liabilities.
Level 2 – Inputs other than quoted prices included within Level 1 that are observable for the asset or liability, either directly or indirectly. These include quoted prices for similar assets or liabilities in active markets and quoted prices for identical or similar assets or liabilities in markets that are not active.
Level 3 – Unobservable inputs for the asset or liability for which there is little, if any, market activity at the measurement date. Unobservable inputs reflect Valvoline’s own assumptions about what market participants would use to price the asset or liability. The inputs are developed based on the best information available in the circumstances, which might include Valvoline’s own financial data such as internally developed pricing models, discounted cash flow methodologies, as well as instruments for which the fair value determination requires significant management judgment.
For assets that are measured using quoted prices in active markets (Level 1), the total fair value is the published market price per unit multiplied by the number of units held without consideration of transaction costs. Assets and liabilities that are measured using significant other observable inputs (Level 2) are primarily valued by reference to quoted prices of similar assets or liabilities in active markets, adjusted for any terms specific to that asset or liability. For all other assets and liabilities for which unobservable inputs are used (Level 3), fair value is derived through the use of fair value models, such as a discounted cash flow model or other standard pricing models that Valvoline deems reasonable.
Foreign currency translation
Operations outside the United States are measured primarily using the local currency as the functional currency. Upon consolidation, the results of operations of the subsidiaries and affiliates whose functional currency is other than the U.S. dollar are translated into U.S. dollars at the average exchange rates for the year while assets and liabilities are translated at year-end exchange rates. Adjustments to translate assets and liabilities into U.S. dollars are recorded in the invested equity section of the Combined Balance Sheets as a component of accumulated other comprehensive loss and are included in net earnings only upon sale or substantial liquidation of the underlying foreign subsidiary or affiliated company. The Combined Balance Sheets do not reflect derivative instruments entered into by Ashland to hedge variations in foreign currency for Valvoline results. This is due to the centralized treasury function utilized by Ashland on behalf of its subsidiaries.
New accounting pronouncements
In February 2016, the Financial Accounting Standards Board (FASB) issued new accounting guidance related to lease transactions. The main objective of this guidance is to increase transparency and comparability among organizations by requiring lessees to recognize assets and liabilities on the balance sheet for the rights and obligations created by leases and to disclose key information about leasing arrangements. The presentation of the Combined Statements of Operations and Comprehensive Income and the Combined Statement of Cash Flows is largely unchanged under this guidance. This guidance retains a distinction between finance leases and operating leases, and the classification criteria for distinguishing between finance leases and operating leases are substantially similar to the classification criteria for distinguishing between capital leases and operating leases in the current accounting literature. The guidance will become effective for Valvoline on October 1, 2019. Valvoline is currently evaluating the impact this guidance will have on Valvoline’s Combined Financial Statements.
F-18
Table of Contents
NOTE B – SIGNIFICANT ACCOUNTING POLICIES (continued)
In November 2015, the FASB issued accounting guidance requiring all deferred tax assets and liabilities to be classified as noncurrent on the balance sheet instead of separating deferred taxes into current and noncurrent amounts. The guidance will become effective for Valvoline on October 1, 2017, with early adoption permitted. Valvoline adopted this accounting standard on a retrospective basis and the impact of this new guidance is reflected within Valvoline’s Combined Financial Statements.
In July 2015, the FASB issued accounting guidance to simplify the subsequent measurement of certain inventories by replacing the current lower of cost or market test with a lower of cost and net realizable value test. The guidance applies only to inventories for which cost is determined by methods other than last-in first-out and the retail inventory method. This guidance will become effective prospectively for Valvoline on October 1, 2017, with early adoption permitted. Valvoline is currently evaluating the new accounting standard and the impact this new guidance will have on Valvoline’s Combined Financial Statements.
In May 2014, the FASB issued accounting guidance outlining a single comprehensive five step model for entities to use in accounting for revenue arising from contracts with customers (ASC 606 Revenue from Contracts with Customers). The new guidance supersedes most current revenue recognition guidance, in an effort to converge the revenue recognition principles within U.S. GAAP. This new guidance also requires entities to disclose certain quantitative and qualitative information regarding the nature, amount, timing and uncertainty of qualifying revenue and cash flows arising from contracts with customers. Entities have the option of using a full retrospective or a modified retrospective approach to adopt the new guidance. During 2015, the FASB delayed the effective date of this standard by one year. As a result, this guidance now becomes effective for Valvoline on October 1, 2018. Valvoline is currently evaluating the new accounting standard and the available implementation options the standard allows as well as the impact this new guidance will have on Valvoline’s Combined Financial Statements.
In April 2014, the FASB issued accounting guidance amending the requirements for reporting discontinued operations (ASC 205 Presentation of Financial Statements and ASC 360 Property, Plant and Equipment). This guidance limits the requirement for discontinued operations treatment to the disposal of a component of an entity, or a group of components of an entity, that represents a strategic shift that has (or will have) a major effect on an entity’s operations and financial results. Additionally, this new guidance no longer precludes discontinued operations presentation based on continuing involvement or cash flows following the disposal. Valvoline adopted this guidance on October 1, 2014, which is applicable only to divestitures subsequent to the adoption date, and has evaluated each divestiture subsequent thereto under this new guidance.
NOTE C – ACQUISITIONS AND DIVESTITURES
Morgan Acres
During 2015, Valvoline acquired three locations within the Quick Lubes reportable segment. The purchase price of $4.7 million was allocated primarily to property, plant and equipment and goodwill.
Car Care Products
During 2015, Ashland entered into a definitive sale agreement to sell Valvoline’s car care product assets within the Core North America reportable segment for $24.0 million, which included Car Brite™ and Eagle One™ automotive appearance products. Prior to the sale, Valvoline recognized a loss of $26.3 million before tax in 2015 to recognize the assets at fair value less cost to sell, using Level 2 nonrecurring fair value measurements. The loss is reported within the net loss on divestiture caption within the Combined Statements of Operations and Comprehensive Income. The transaction closed on June 30, 2015 and Valvoline received net proceeds of $19.3 million after adjusting for certain customary closing costs and final working capital amounts.
F-19
Table of Contents
NOTE C – ACQUISITIONS AND DIVESTITURES (continued)
The sale of Valvoline’s car care product assets did not qualify for discontinued operations treatment since it did not represent a strategic shift that had or will have a major effect on Valvoline’s operations and financial results.
Venezuela Equity Method Investment
During 2015, Valvoline sold the equity method investment in Venezuela within the International reportable segment. Prior to the sale, Valvoline recognized a $14.3 million impairment in 2015, for which there was no tax effect, using Level 2 nonrecurring fair value measurements within the equity and other income caption of the Combined Statements of Operations and Comprehensive Income.
Valvoline’s decision to sell the equity investment and the resulting charge recorded during 2015 is reflective of the continued devaluation of the Venezuelan currency (bolivar) based on changes to the Venezuelan currency exchange rate mechanisms during the fiscal year. In addition, the continued lack of exchangeability between the Venezuelan bolivar and U.S. dollar had restricted the equity method investee’s ability to pay dividends and obligations denominated in U.S. dollars. These exchange regulations and cash flow limitations, combined with other recent Venezuelan regulations and the impact of declining oil prices on the Venezuelan economy, had significantly restricted Valvoline’s ability to conduct normal business operations through the joint venture arrangement. Valvoline determined this divestiture does not represent a strategic shift that had or will have a major effect on Valvoline’s operations and financial results, and thus it does not qualify for discontinued operations treatment.
NOTE D – RESTRUCTURING ACTIVITIES
Ashland periodically implements company-wide restructuring programs related to acquisitions, divestitures and other cost reduction programs in order to enhance profitability through streamlined operations and an improved overall cost structure for each business.
During 2014, Ashland announced a global restructuring program to streamline the resources used across the organization. As part of this global restructuring program, Ashland announced a voluntary severance offer (VSO) to certain U.S. employees. During 2014, an involuntary program for employees was also initiated as part of the global restructuring program. Substantially all payments related to the VSO and involuntary programs were paid by the end of fiscal year 2015.
The VSO and involuntary programs, included within the Unallocated and other segment, resulted in expense relating to Valvoline of $0.4 million and $6.3 million being recognized during 2015 and 2014, respectively, and recorded within the selling, general and administrative expense caption of the Combined Statements of Operations and Comprehensive Income. As of September 30, 2015 and 2014, the remaining restructuring reserve for the global restructuring program was zero and $1.0 million, respectively.
| (In millions) |
Severance | |||
| Balance as of September 30, 2013 |
$ | — | ||
| Restructuring reserves |
6.3 | |||
| Utilization (cash paid) |
(5.3 | ) | ||
|
|
|
|||
| Balance as of September 30, 2014 |
1.0 | |||
| Restructuring adjustments |
0.4 | |||
| Utilization (cash paid) |
(1.4 | ) | ||
|
|
|
|||
| Balance as of September 30, 2015 |
$ | — | ||
|
|
|
|||
F-20
Table of Contents
NOTE E – EQUITY METHOD INVESTMENTS
Summarized financial information for companies accounted for on the equity method is presented in the following table, along with a summary of the amounts recorded in the Combined Financial Statements. The results of operations and amounts recorded by Valvoline as of and for the years ended September 30, 2015, 2014 and 2013 only include results for the Valvoline equity method investment within Venezuela prior to its divestiture in 2015. See Note C for further information on this divestiture in 2015.
At September 30, 2015 and 2014, Valvoline’s retained earnings included $30.0 million and $49.5 million, respectively, of undistributed earnings from affiliates accounted for on the equity method. The summarized financial information for all companies accounted for on the equity method by Valvoline is as of and for the years ended September 30, 2015, 2014 and 2013, respectively.
| (In millions) |
2015 | 2014 | 2013 | |||||||||
| Financial position |
||||||||||||
| Current assets |
$ | 80.2 | $ | 138.3 | ||||||||
| Current liabilities |
(48.4 | ) | (86.2 | ) | ||||||||
|
|
|
|
|
|||||||||
| Working capital |
31.8 | 52.1 | ||||||||||
| Noncurrent assets |
25.3 | 28.0 | ||||||||||
| Noncurrent liabilities |
(1.1 | ) | (1.4 | ) | ||||||||
|
|
|
|
|
|||||||||
| Stockholders’ equity |
$ | 56.0 | $ | 78.7 | ||||||||
|
|
|
|
|
|||||||||
| Results of operations |
||||||||||||
| Sales |
$ | 275.0 | $ | 299.9 | $ | 324.8 | ||||||
| Income from operations |
48.2 | 40.4 | 48.1 | |||||||||
| Net income |
24.1 | 21.7 | 27.3 | |||||||||
| Amounts recorded by Valvoline |
||||||||||||
| Investments and advances |
$ | 28.9 | $ | 44.0 | $ | 40.3 | ||||||
| Equity income (loss) (a) |
(2.2 | ) | 10.2 | 12.8 | ||||||||
| Distributions received |
17.9 | 7.5 | 7.7 | |||||||||
| (a) | 2015 includes a $14.3 million impairment of the equity method investment in Venezuela as further discussed in Note C. |
NOTE F – PROPERTY, PLANT AND EQUIPMENT
The following table describes the various components of property, plant and equipment within the Combined Balance Sheets.
| (In millions) |
2015 | 2014 | ||||||
| Land |
$ | 47.0 | $ | 42.0 | ||||
| Buildings (a) |
199.9 | 211.2 | ||||||
| Machinery and equipment |
362.0 | 392.5 | ||||||
| Construction in progress |
18.9 | 17.3 | ||||||
|
|
|
|
|
|||||
| Total property, plant and equipment (gross) |
627.8 | 663.0 | ||||||
|
|
|
|
|
|||||
| Accumulated depreciation (b) |
(374.3 | ) | (390.6 | ) | ||||
|
|
|
|
|
|||||
| Total property, plant and equipment (net) |
$ | 253.5 | $ | 272.4 | ||||
|
|
|
|
|
|||||
| (a) | Includes $5.1 million of capitalized leases as of September 30, 2015 and September 30, 2014. |
| (b) | Includes $1.6 million and $1.3 million for capitalized leases as of September 30, 2015 and September 30, 2014, respectively. |
F-21
Table of Contents
NOTE F – PROPERTY, PLANT AND EQUIPMENT (continued)
The following table summarizes various property, plant and equipment charges included within the Combined Statements of Operations and Comprehensive Income.
| (In millions) |
2015 | 2014 | 2013 | |||||||||
| Depreciation (includes capital leases) |
$ | 37.6 | $ | 36.5 | $ | 35.1 | ||||||
NOTE G – GOODWILL AND OTHER INTANGIBLES
Goodwill
The performance of the annual impairment analysis did not result in any impairments of goodwill during 2015, 2014, and 2013. The estimated fair value of each reporting unit with a significant goodwill balance was substantially in excess of its carrying value.
The following is a progression of goodwill by reportable segment for the years ended September 30, 2015 and 2014.
| (In millions) |
Core North America |
Quick Lubes | International | Total | ||||||||||||
| Balance at September 30, 2013 |
$ | 90.4 | $ | 36.7 | $ | 40.1 | $ | 167.2 | ||||||||
| Acquisitions (a) |
— | 0.8 | — | 0.8 | ||||||||||||
| Currency translation |
— | — | (0.1 | ) | (0.1 | ) | ||||||||||
|
|
|
|
|
|
|
|
|
|||||||||
| Balance at September 30, 2014 |
90.4 | 37.5 | 40.0 | 167.9 | ||||||||||||
| Acquisitions (a) |
— | 3.2 | — | 3.2 | ||||||||||||
| Divestitures (b) |
(1.3 | ) | — | — | (1.3 | ) | ||||||||||
| Currency translation |
— | — | (0.4 | ) | (0.4 | ) | ||||||||||
|
|
|
|
|
|
|
|
|
|||||||||
| Balance at September 30, 2015 |
$ | 89.1 | $ | 40.7 | $ | 39.6 | $ | 169.4 | ||||||||
|
|
|
|
|
|
|
|
|
|||||||||
| (a) | Relates to the Morgan Acres acquisition in 2015 (see Note C for additional information) and other smaller Quick Lubes acquisitions in 2014. |
| (b) | Divestiture caption represents the amount of goodwill related to car care products. See Note C for additional information. |
Other intangible assets
Intangible assets principally consist of trademarks and trade names, intellectual property and customer relationships. Intangible assets classified as finite are amortized on a straight-line basis over their estimated useful lives. The cost of trademarks and trade names is amortized principally over 15 to 25 years, intellectual property over 10 years and customer relationships over 10 to 20 years.
F-22
Table of Contents
NOTE G – GOODWILL AND OTHER INTANGIBLES (continued)
| (In millions) |
2015 | 2014 | ||||||||||||||||||||||
| Gross carrying amount |
Accumulated amortization |
Net carrying amount |
Gross carrying amount |
Accumulated amortization |
Net carrying amount |
|||||||||||||||||||
| Definite-lived intangible assets |
||||||||||||||||||||||||
| Trademarks and trade names (a) |
$ | 0.1 | $ | (0.1 | ) | $ | — | $ | 6.8 | $ | (2.6 | ) | $ | 4.2 | ||||||||||
| Intellectual property (b) |
— | — | — | 0.6 | (0.5 | ) | 0.1 | |||||||||||||||||
| Customer relationships (c) |
3.1 | (1.5 | ) | 1.6 | 4.2 | (2.1 | ) | 2.1 | ||||||||||||||||
|
|
|
|
|
|
|
|
|
|
|
|
|
|||||||||||||
| Total definite-lived intangible assets |
$ | 3.2 | $ | (1.6 | ) | $ | 1.6 | $ | 11.6 | $ | (5.2 | ) | $ | 6.4 | ||||||||||
|
|
|
|
|
|
|
|
|
|
|
|
|
|||||||||||||
| (a) | Divested trademarks and trade names during 2015 had gross carrying amounts of $6.7 million and accumulated amortization of $2.6 million for Valvoline car care products. |
| (b) | Divested intellectual property during 2015 had gross carrying amounts and accumulated amortization of $0.6 million each for Valvoline car care products. |
| (c) | Divested customer relationships during 2015 had gross carrying amounts of $1.1 million and accumulated amortization of $0.8 million for Valvoline car care products. |
Amortization expense recognized on intangible assets was $0.4 million for 2015, $0.6 million for 2014 and 2013, and is primarily included in the selling, general and administrative expense caption of the Combined Statements of Operations and Comprehensive Income. As of September 30, 2015, all of Valvoline’s intangible assets that had a carrying value were being amortized. Estimated amortization expense for future periods is $0.2 million in 2016, 2017, 2018, 2019 and 2020. The amortization expense for future periods is an estimate. Actual amounts may change from such estimated amounts due to fluctuations in foreign currency exchange rates, additional intangible asset acquisitions and divestitures, potential impairment, accelerated amortization, or other events.
NOTE H – OTHER NONCURRENT ASSETS AND CURRENT AND NONCURRENT LIABILITIES
The following table provides the components of other noncurrent assets in the Combined Balance Sheets as of September 30.
| (In millions) |
2015 | 2014 | ||||||
| Customer incentive programs |
$ | 19.0 | $ | 20.3 | ||||
| Notes receivable from customers |
16.6 | 13.1 | ||||||
| Deferred income taxes |
7.8 | 8.1 | ||||||
| Other |
3.8 | 5.6 | ||||||
|
|
|
|
|
|||||
| $ | 47.2 | $ | 47.1 | |||||
|
|
|
|
|
|||||
The following table provides the components of accrued expenses and other liabilities in the Combined Balance Sheets as of September 30.
| (In millions) |
2015 | 2014 | ||||||
| Sales deductions |
$ | 44.1 | $ | 39.3 | ||||
| Incentive compensation |
20.2 | 16.2 | ||||||
| Accrued taxes (excluding income taxes) |
15.6 | 18.6 | ||||||
| Accrued vacation |
14.9 | 14.1 | ||||||
| Current income taxes payable |
10.4 | 5.5 | ||||||
| Other |
20.1 | 22.3 | ||||||
|
|
|
|
|
|||||
| $ | 125.3 | $ | 116.0 | |||||
|
|
|
|
|
|||||
F-23
Table of Contents
NOTE H – OTHER NONCURRENT ASSETS AND CURRENT AND NONCURRENT LIABILITIES (continued)
The following table provides the components of other noncurrent liabilities in the Combined Balance Sheets as of September 30.
| (In millions) |
2015 | 2014 | ||||||
| Reserves related to workers compensation and general liability |
$ | 14.0 | $ | 19.7 | ||||
| Accrued tax liabilities |
4.7 | 3.8 | ||||||
| Capitalized lease obligations |
4.2 | 4.4 | ||||||
| Other |
2.5 | 3.3 | ||||||
|
|
|
|
|
|||||
| $ | 25.4 | $ | 31.2 | |||||
|
|
|
|
|
|||||
NOTE I – LEASE COMMITMENTS
Valvoline and its subsidiaries are lessees of office buildings, retail outlets, transportation equipment, warehouses and storage facilities, other equipment, facilities and properties under leasing agreements that expire at various dates. Capitalized lease obligations are primarily included in other noncurrent liabilities while capital lease assets are included in property, plant and equipment. Future minimum rental payments for operating leases at September 30, 2015 were $12.6 million in 2016, $10.7 million in 2017, $8.9 million in 2018, $6.6 million in 2019, $5.2 million in 2020 and $18.7 million in 2021 and later years. Rental expense under operating leases for operations was as follows:
| (In millions) |
2015 | 2014 | 2013 | |||||||||
| Minimum rentals (including rentals under short-term leases) |
$ | 12.4 | $ | 13.5 | $ | 13.7 | ||||||
| Contingent rentals |
2.4 | 2.9 | 2.9 | |||||||||
| Sublease rental income |
(1.3 | ) | (1.1 | ) | (1.1 | ) | ||||||
|
|
|
|
|
|
|
|||||||
| $ | 13.5 | $ | 15.3 | $ | 15.5 | |||||||
|
|
|
|
|
|
|
|||||||
NOTE J – INCOME TAXES
A summary of the provision for income taxes related to operations follows.
| (In millions) |
2015 | 2014 | 2013 | |||||||||
| Current |
||||||||||||
| Federal |
$ | 80.9 | $ | 82.3 | $ | 71.3 | ||||||
| State |
15.6 | 15.2 | 13.0 | |||||||||
| Foreign |
13.3 | 9.8 | 12.5 | |||||||||
|
|
|
|
|
|
|
|||||||
| 109.8 | 107.3 | 96.8 | ||||||||||
| Deferred |
(9.1 | ) | (16.0 | ) | 37.7 | |||||||
|
|
|
|
|
|
|
|||||||
| Income tax expense |
$ | 100.7 | $ | 91.3 | $ | 134.5 | ||||||
|
|
|
|
|
|
|
|||||||
Deferred income taxes are provided for income and expense items recognized in different years for tax and financial reporting purposes. As of September 30, 2015, management intends to indefinitely reinvest approximately $26.2 million of foreign earnings. Because these earnings are considered indefinitely reinvested, no U.S. tax provision has been accrued related to the repatriation of these earnings, and it is not practicable to estimate the amount of U.S. tax that might be payable if these earnings were ever to be remitted.
F-24
Table of Contents
NOTE J – INCOME TAXES (continued)
Temporary differences that give rise to significant deferred tax assets and liabilities as of September 30 are presented in the following table.
| (In millions) |
2015 | 2014 | ||||||
| Deferred tax assets |
||||||||
| Foreign net operating loss carryforwards (a) |
$ | 0.9 | $ | 0.2 | ||||
| Employee benefit obligations |
4.5 | 4.4 | ||||||
| Compensation accruals |
8.4 | 6.4 | ||||||
| Other items |
4.9 | 13.3 | ||||||
| Valuation allowances (b) |
(0.4 | ) | (0.2 | ) | ||||
|
|
|
|
|
|||||
| Total deferred tax assets |
18.3 | 24.1 | ||||||
|
|
|
|
|
|||||
| Deferred tax liabilities |
||||||||
| Goodwill and other intangibles (c) |
9.8 | 7.3 | ||||||
| Property, plant and equipment |
22.5 | 24.8 | ||||||
| Unremitted earnings |
2.0 | 2.1 | ||||||
|
|
|
|
|
|||||
| Total deferred tax liabilities |
34.3 | 34.2 | ||||||
|
|
|
|
|
|||||
| Net deferred tax liability |
$ | (16.0 | ) | $ | (10.1 | ) | ||
|
|
|
|
|
|||||
| (a) | Gross net operating loss carryforwards will expire in future years beyond 2017. |
| (b) | Valuation allowances primarily relate to certain foreign net operating loss carryforwards. |
| (c) | The total gross amount of goodwill as of September 30, 2015 expected to be deductible for tax purposes is $3.4 million. |
The U.S. and foreign components of income before income taxes and a reconciliation of the statutory federal income tax with the provision for income taxes follow.
| (In millions) |
2015 | 2014 | 2013 | |||||||||
| Income before income taxes |
||||||||||||
| United States (a) |
$ | 244.7 | $ | 230.4 | $ | 340.2 | ||||||
| Foreign |
52.1 | 34.3 | 40.4 | |||||||||
|
|
|
|
|
|
|
|||||||
| Total income before income taxes |
$ | 296.8 | $ | 264.7 | $ | 380.6 | ||||||
|
|
|
|
|
|
|
|||||||
| Income taxes computed at U.S. statutory rate (35%) |
$ | 103.9 | $ | 92.7 | $ | 133.2 | ||||||
| Increase (decrease) in amount computed resulting from |
||||||||||||
| Uncertain tax positions |
0.9 | 2.1 | 1.5 | |||||||||
| State taxes |
9.2 | 8.1 | 12.3 | |||||||||
| International rate differential |
(7.8 | ) | (2.8 | ) | (1.8 | ) | ||||||
| Permanent items (b) |
(5.2 | ) | (9.2 | ) | (10.6 | ) | ||||||
| Other items |
(0.3 | ) | 0.4 | (0.1 | ) | |||||||
|
|
|
|
|
|
|
|||||||
| Income tax expense |
$ | 100.7 | $ | 91.3 | $ | 134.5 | ||||||
|
|
|
|
|
|
|
|||||||
| (a) | A significant component of the fluctuations within this caption relates to the annual remeasurements of the U.S. pension and other postretirement plans. |
| (b) | Permanent items in each year relate primarily to the domestic manufacturing deduction and income from equity affiliates. Further, 2015 includes adjustments related to the sale of the Venezuela joint venture of $5.5 million. |
Unrecognized tax benefits
U.S. GAAP prescribes a recognition threshold and measurement attribute for the accounting and financial statement disclosure of tax positions taken or expected to be taken in a tax return. The evaluation of a tax position is a two-step process. The first step requires Valvoline to determine whether it is more likely than not
F-25
Table of Contents
NOTE J – INCOME TAXES (continued)
that a tax position will be sustained upon examination based on the technical merits of the position. The second step requires Valvoline to recognize in the financial statements each tax position that meets the more likely than not criteria, measured at the amount of benefit that has a greater than 50% likelihood of being realized. Valvoline had $4.7 million and $3.8 million of unrecognized tax benefits at September 30, 2015 and 2014, respectively. As of September 30, 2015, the total amount of unrecognized tax benefits that, if recognized, would affect the tax rate was $4.7 million. The remaining unrecognized tax benefits relate to tax positions for which ultimate deductibility is highly certain but for which there is uncertainty as to the timing of such deductibility. Recognition of these tax benefits would not have an impact on the effective tax rate.
Valvoline recognizes interest and penalties related to uncertain tax positions as a component of income tax expense in the Combined Statements of Operations and Comprehensive Income. Such interest and penalties totaled expense of $0.1 million in both 2015 and 2014 and none in 2013. Valvoline had $0.2 million and $0.1 million in interest and penalties related to unrecognized tax benefits accrued as of September 30, 2015 and 2014, respectively.
During the year ended September 30, 2015 and 2014, respectively, changes in unrecognized tax benefits were as follows:
| (In millions) |
||||
| Balance at September 30, 2013 |
$ | 1.8 | ||
| Increases related to positions taken on items from prior years |
0.9 | |||
| Decreases related to positions taken on items from prior years |
(0.2 | ) | ||
| Increases related to positions taken in the current year |
1.3 | |||
|
|
|
|||
| Balance at September 30, 2014 |
3.8 | |||
|
|
|
|||
| Increases related to positions taken on items from prior years |
1.0 | |||
| Settlement of uncertain tax positions with tax authorities |
(0.1 | ) | ||
|
|
|
|||
| Balance at September 30, 2015 |
$ | 4.7 | ||
|
|
|
|||
From a combination of statute expirations and audit settlements in the next twelve months, Valvoline expects no decrease in the amount of accrual for uncertain tax positions. For the remaining balance as of September 30, 2015, it is reasonably possible that there could be changes to the amount of uncertain tax positions due to activities of the taxing authorities, settlement of audit issues, reassessment of existing uncertain tax positions, or the expiration of applicable statute of limitations; however, Valvoline is not able to estimate the impact of these items at this time.
Valvoline or one of its subsidiaries files income tax returns in the U.S. federal jurisdiction and various state and foreign jurisdictions, or it is included in a consolidated return in these jurisdictions. Foreign taxing jurisdictions significant to Valvoline include Australia, Canada, Brazil, Mexico, China, Singapore, India and the Netherlands. Valvoline is subject to U.S. federal income tax examinations, either directly or as part of a consolidated return, by tax authorities for periods after September 30, 2009 and U.S. state income tax examinations by tax authorities for periods after September 30, 2009. With respect to countries outside of the United States, with certain exceptions, Valvoline’s foreign subsidiaries are subject to income tax audits for years after 2004.
NOTE K – EMPLOYEE BENEFIT PLANS
Pension plans and other postretirement benefit plans
Qualifying employees participate in specific Valvoline or Ashland sponsored defined-benefit pension plans, which typically provide pension payments based on an employee’s length of service and compensation during the
F-26
Table of Contents
NOTE K – EMPLOYEE BENEFIT PLANS (continued)
years immediately preceding retirement or have a cash balance design. The majority of U.S. pension plans have been closed to new participants since January 1, 2011. In addition, most foreign pension plans are closed to new participants while those that remain open relate to areas where local laws require plans to operate within the applicable country. Pension obligations for applicable employees of non-U.S. consolidated subsidiaries are provided for in accordance with local practices and regulations of the respective countries.
During March 2016, Ashland announced that the majority of its defined benefit pension plans, accounted for as multi-employer plans for the Valvoline stand-alone financial statements, will freeze the accrual of benefits effective as of September 30, 2016. Additionally, during March 2016, Ashland announced that it will reduce retiree life and medical benefits effective October 1, 2016 and January 1, 2017, respectively.
Valvoline has certain defined benefit pension plans that are specifically designated only for Valvoline employees that are included within the Combined Balance Sheets. The majority of qualifying employees participate in Ashland-sponsored pension plans that are accounted for by Valvoline as multi-employer plans, which in accordance with U.S. GAAP, are not included within the Combined Balance Sheets.
The total cost of both types of plans is recognized within the Combined Statements of Operations and Comprehensive Income and is determined by actuarial valuations. Valvoline receives an allocation of the service cost component of these plans from Ashland based upon payroll costs. All other pension plan cost components are historically recorded at the Ashland Unallocated and other segment. For purposes of these combined financial statements, costs for multi-employer plans were allocated based on Valvoline employees’ participation in the plan. The amount of net pension cost allocated to Valvoline related to these multi-employer plans was expense of $42.8 million and $58.2 million during 2015 and 2014, respectively, and income of $69.7 million during 2013. For Valvoline’s specific stand-alone pension plans, all costs associated with these plans were included within the Combined Statements of Operations and Comprehensive Income. The amount of net pension costs for Valvoline specific stand-alone pension plans was expense of $3.3 million, $2.9 million and zero during 2015, 2014 and 2013, respectively.
Certain of Valvoline’s U.S. and Canada retired or disabled employees participate in health care and life insurance plans sponsored by Ashland. There are no Valvoline specific postretirement benefit plans. The majority of qualifying employees participate in Ashland-sponsored postretirement plans that are accounted for by Valvoline as multi-employer plans, which in accordance with U.S. GAAP, are not included within the Combined Balance Sheets. The total cost of the plans, determined by actuarial valuations, was income of $0.8 million and $4.7 million during 2015 and 2013, respectively, and expense of $0.7 million during 2014, which was recognized within the Combined Statements of Operations and Comprehensive Income.
Components of net periodic benefit costs (income)
For segment reporting purposes, service cost for operations is proportionately allocated to each reportable segment, excluding the Unallocated and other segment, while all other costs for operations are recorded within the Unallocated and other segment.
F-27
Table of Contents
NOTE K – EMPLOYEE BENEFIT PLANS (continued)
The following table summarizes the components of pension benefit costs for operations and the assumptions used to determine net periodic benefit costs (income) for the plans included within the Combined Balance Sheets.
| (In millions) |
Pension Benefits | |||||||||||
| 2015 | 2014 | 2013 | ||||||||||
| Net periodic benefit costs (income) |
||||||||||||
| Service cost |
$ | 1.3 | $ | 1.8 | $ | 2.0 | ||||||
| Interest cost |
2.5 | 2.9 | 3.0 | |||||||||
| Curtailment |
— | (0.3 | ) | — | ||||||||
| Expected return on plan assets |
(2.6 | ) | (3.0 | ) | (2.7 | ) | ||||||
| Amortization of prior service cost |
0.1 | 0.2 | 0.2 | |||||||||
| Actuarial loss (gain) |
2.0 | 1.3 | (2.5 | ) | ||||||||
|
|
|
|
|
|
|
|||||||
| $ | 3.3 | $ | 2.9 | $ | — | |||||||
|
|
|
|
|
|
|
|||||||
| Weighted-average plan assumptions |
||||||||||||
| Discount rate |
4.08 | % | 4.61 | % | 4.48 | % | ||||||
| Rate of compensation increase |
3.15 | % | 3.52 | % | 3.54 | % | ||||||
| Expected long-term rate of return on plan assets |
5.34 | % | 5.97 | % | 5.52 | % | ||||||
The following table shows the amortization of prior service cost recognized in accumulated other comprehensive loss.
| Pension Benefits | ||||||||
| (In millions) |
2015 | 2014 | ||||||
| Curtailment |
$ | — | $ | (0.4 | ) | |||
| Amortization of prior service cost |
(0.1 | ) | (0.2 | ) | ||||
|
|
|
|
|
|||||
| Total |
$ | (0.1 | ) | $ | (0.6 | ) | ||
|
|
|
|
|
|||||
| Total recognized in net periodic benefit cost (income) and accumulated other comprehensive loss |
$ | 3.2 | $ | 2.3 | ||||
The following table shows the amount of prior service cost in accumulated other comprehensive loss at September 30, 2015 that is expected to be recognized as a component of net periodic benefit cost (income) during the next fiscal year.
| (In millions) |
Pension Benefits |
|||
| Prior service cost |
$ | (0.1 | ) | |
As of September 30, 2015 and 2014, the amounts recognized within accumulated other comprehensive income are shown in the following table.
| Pension Benefits | ||||||||
| (In millions) |
2015 | 2014 | ||||||
| Prior service cost |
$ | 0.5 | $ | 0.6 | ||||
Obligations and funded status
Actuarial valuations are performed for the pension benefit plans to determine Valvoline’s obligation for each plan specific to Valvoline. In accordance with U.S. GAAP, Valvoline recognizes the unfunded status of
F-28
Table of Contents
NOTE K – EMPLOYEE BENEFIT PLANS (continued)
these plans as a liability in the Combined Balance Sheets. Summaries of the change in benefit obligations, plan assets, funded status of the plans, amounts recognized in the balance sheet, and assumptions used to determine the benefit obligations for 2015 and 2014 follow for the plans included within the Combined Balance Sheets.
| Pension Benefits |
||||||||
| (In millions) |
2015 | 2014 | ||||||
| Change in benefit obligations |
||||||||
| Benefit obligations at October 1 |
$ | 67.9 | $ | 67.7 | ||||
| Service cost |
1.3 | 1.8 | ||||||
| Interest cost |
2.5 | 2.9 | ||||||
| Participant contributions |
0.1 | 0.1 | ||||||
| Benefits paid |
(2.9 | ) | (3.5 | ) | ||||
| Actuarial loss |
2.2 | 5.3 | ||||||
| Foreign currency exchange rate changes |
(11.7 | ) | (5.1 | ) | ||||
| Other |
(0.2 | ) | (0.6 | ) | ||||
| Curtailment |
— | (0.7 | ) | |||||
|
|
|
|
|
|||||
| Benefit obligations at September 30 |
$ | 59.2 | $ | 67.9 | ||||
|
|
|
|
|
|||||
| Change in plan assets |
||||||||
| Value of plan assets at October 1 |
$ | 53.0 | $ | 50.5 | ||||
| Actual return on plan assets |
2.8 | 7.0 | ||||||
| Employer contributions |
3.0 | 3.4 | ||||||
| Participant contributions |
0.1 | 0.1 | ||||||
| Benefits paid |
(2.9 | ) | (3.5 | ) | ||||
| Foreign currency exchange rate changes |
(9.6 | ) | (3.9 | ) | ||||
| Other |
(0.2 | ) | (0.6 | ) | ||||
|
|
|
|
|
|||||
| Value of plan assets at September 30 |
$ | 46.2 | $ | 53.0 | ||||
|
|
|
|
|
|||||
| Unfunded status of the plans |
$ | (13.0 | ) | $ | (14.9 | ) | ||
|
|
|
|
|
|||||
| Amounts recognized in the balance sheet |
||||||||
| Current benefit liabilities |
$ | — | $ | (0.1 | ) | |||
| Noncurrent benefit liabilities |
(13.0 | ) | (14.8 | ) | ||||
|
|
|
|
|
|||||
| Net amount recognized |
$ | (13.0 | ) | $ | (14.9 | ) | ||
|
|
|
|
|
|||||
| Weighted-average plan assumptions |
||||||||
| Discount rate |
3.84 | % | 4.08 | % | ||||
| Rate of compensation increase |
3.14 | % | 3.15 | % | ||||
The accumulated benefit obligation for all pension plans was $55.7 million at September 30, 2015 and $64.2 million at September 30, 2014. Information for pension plans with an accumulated benefit obligation in excess of plan assets follows for the plans included within the Combined Balance Sheets:
| 2015 | 2014 | |||||||||||||||||||||||
| (In millions) |
Qualified plans |
Non-qualified plans |
Total | Qualified plans |
Non-qualified plans |
Total | ||||||||||||||||||
| Projected benefit obligation |
$ | 43.5 | $ | 7.4 | $ | 50.9 | $ | 50.6 | $ | 7.4 | $ | 58.0 | ||||||||||||
| Accumulated benefit obligation |
42.2 | 6.4 | 48.6 | 49.2 | 6.5 | 55.7 | ||||||||||||||||||
| Fair value of plan assets |
38.7 | — | 38.7 | 44.5 | — | 44.5 | ||||||||||||||||||
F-29
Table of Contents
NOTE K – EMPLOYEE BENEFIT PLANS (continued)
Plan assets
The weighted average expected long-term rate of return on pension plan assets was 5.34% and 5.97% for 2015 and 2014, respectively. The basis for determining the expected long-term rate of return is a combination of future return assumptions for various asset classes in Ashland’s investment portfolio, historical analysis of previous returns, market indices and a projection of inflation.
The following table for the plans included in the Combined Balance Sheets summarizes the various investment categories that the pension plan assets are invested in and the applicable fair value hierarchy that the financial instruments are classified as, within these investment categories as of September 30, 2015. For additional information and a detailed description of each level within the fair value hierarchy, see Note B.
| (In millions) |
Total fair value |
Quoted prices in active markets for identical assets Level 1 |
Significant other observable inputs Level 2 |
Significant unobservable inputs Level 3 |
||||||||||||
| Cash and cash equivalents |
$ | 2.8 | $ | 2.8 | $ | — | $ | — | ||||||||
| Other government securities |
25.9 | — | 25.9 | — | ||||||||||||
| Corporate stocks |
16.8 | — | 16.8 | — | ||||||||||||
| Private equity and hedge funds |
0.7 | — | — | 0.7 | ||||||||||||
|
|
|
|
|
|
|
|
|
|||||||||
| Total assets at fair value |
$ | 46.2 | $ | 2.8 | $ | 42.7 | $ | 0.7 | ||||||||
|
|
|
|
|
|
|
|
|
|||||||||
The following table summarizes the various investment categories that the pension plan assets are invested in and the applicable fair value hierarchy that the financial instruments are classified within these investment categories as of September 30, 2014.
| (In millions) |
Total fair value |
Quoted prices in active markets for identical assets Level 1 |
Significant other observable inputs Level 2 |
Significant unobservable inputs Level 3 |
||||||||||||
| Cash and cash equivalents |
$ | 2.9 | $ | 2.9 | $ | — | $ | — | ||||||||
| Other government securities |
25.2 | — | 25.2 | — | ||||||||||||
| Corporate stocks |
24.1 | — | 24.1 | — | ||||||||||||
| Private equity and hedge funds |
0.8 | — | — | 0.8 | ||||||||||||
|
|
|
|
|
|
|
|
|
|||||||||
| Total assets at fair value |
$ | 53.0 | $ | 2.9 | $ | 49.3 | $ | 0.8 | ||||||||
|
|
|
|
|
|
|
|
|
|||||||||
Valvoline stand-alone pensions plans hold a variety of investments designed to diversify risk. Assets are diversified across asset classes and among investment manager strategies. Investments classified as a Level 1 fair value measure represent marketable securities priced in active markets and would include publically traded equities and cash or cash equivalents. Investments classified as a Level 2 fair value measure principally represent fixed income securities invested in government, agency, investment grade corporates, other debt obligations or funds consisting of a variety of either bonds or equities.
F-30
Table of Contents
NOTE K – EMPLOYEE BENEFIT PLANS (continued)
Valvoline stand-alone pension plans also hold Level 3 investments within hedge funds and private equity funds with hedge funds accounting for all of the Level 3 investments. Investments in these funds are primarily valued using the net asset value per share of underlying investments as determined by the respective individual fund administrators on a daily, weekly or monthly basis, depending on the fund. Such valuations are reviewed by the portfolio managers who determine the estimated value of the collective funds based on these inputs. The following table provides a reconciliation of the beginning and ending balances for these Level 3 assets.
| (In millions) |
Total Level 3 assets |
Private equity and hedge funds |
||||||
| Balance as of September 30, 2013 |
$ | 0.7 | $ | 0.7 | ||||
| Purchases |
0.1 | 0.1 | ||||||
| Sales |
— | — | ||||||
|
|
|
|
|
|||||
| Balance as of September 30, 2014 |
0.8 | 0.8 | ||||||
| Purchases |
0.1 | 0.1 | ||||||
| Sales |
(0.1 | ) | (0.1 | ) | ||||
| Actual return on plan assets |
(0.1 | ) | (0.1 | ) | ||||
|
|
|
|
|
|||||
| Balance as of September 30, 2015 |
$ | 0.7 | $ | 0.7 | ||||
|
|
|
|
|
|||||
Investments and Strategy
In developing an investment strategy for its defined benefit plans, the following factors were considered: the nature of the plans’ liabilities, the allocation of liabilities between active, deferred and retired members, the funded status of the plans, the applicable investment horizon, the respective size of the plans and historical and expected investment returns. Valvoline’s pension plan assets are managed by outside investment managers, which are monitored against investment return benchmarks and Valvoline’s established investment strategy. Investment managers are selected based on an analysis of, among other things, their investment process, historical investment results, frequency of management turnover, cost structure and assets under management. Assets are periodically reallocated between investment managers to maintain an appropriate asset mix and diversification of investments and to optimize returns.
Fixed income securities primarily include long duration high grade corporate debt obligations. Risk assets include both traditional equity as well as a mix of non-traditional assets such as hedge funds and private equity. Investment managers may employ a limited use of derivatives to gain efficient exposure to markets. Lastly, certain Valvoline stand-alone pension plans’ assets are dictated by applicable regulations within the respective country.
The weighted-average asset allocations for Valvoline’s plans at September 30, 2015 and 2014 by asset category follow.
| (In millions) |
Target | Actual at September 30, | ||||||||||
| 2015 | 2014 | |||||||||||
| Plan assets allocation |
||||||||||||
| Equity securities |
15-60 | % | 36 | % | 45 | % | ||||||
| Debt securities |
40-85 | % | 62 | % | 53 | % | ||||||
| Other |
0-20 | % | 2 | % | 2 | % | ||||||
|
|
|
|
|
|||||||||
| 100 | % | 100 | % | |||||||||
|
|
|
|
|
|||||||||
F-31
Table of Contents
NOTE K – EMPLOYEE BENEFIT PLANS (continued)
Cash flows
Expected contributions to the stand-alone Valvoline pension plans are approximately $3.2 million during 2016. These contributions will be paid by Ashland and accounted for through Ashland’s net investment in Valvoline.
The following benefit payments for only the plans included within the Combined Balance Sheets, which reflect future service expectations, are projected to be paid in each of the next five years and in aggregate for five years thereafter.
| (In millions) |
Pension Benefits |
|||
| 2016 |
$ | 2.6 | ||
| 2017 |
3.0 | |||
| 2018 |
3.0 | |||
| 2019 |
3.3 | |||
| 2020 |
3.2 | |||
| 2021 – 2025 |
18.8 | |||
Other plans
Qualifying Valvoline employees are eligible to participate in Ashland’s qualified savings plan that assists employees in providing for retirement or other future needs, Valvoline’s allocated expense related to these defined contributions was $11.2 million in 2015, $6.8 million in 2014 and $9.5 million in 2013.
NOTE L – LITIGATION, CLAIMS AND CONTINGENCIES
There are various claims, lawsuits and administrative proceedings pending or threatened against Valvoline as a commercial unit of Ashland and its various subsidiary companies and, in certain jurisdictions, separate legal entities which are deemed insignificant. Such actions are with respect to commercial matters, product liability, toxic tort liability, and other environmental matters, which seek remedies or damages, some of which are for substantial amounts. While Valvoline cannot predict with certainty the outcome of such actions, it believes that adequate reserves have been recorded and losses already recognized with respect to such actions were immaterial as of September 30, 2015 and 2014. There is a reasonable possibility that a loss exceeding amounts already recognized may be incurred related to these actions; however, Valvoline believes that such potential losses were immaterial as of September 30, 2015 and 2014.
Commercial contract
During 2014, Valvoline received a favorable arbitration ruling on a commercial contract related to the International reportable segment. Collections from the settlement for $1.8 million and $9.5 million during 2015 and 2014, respectively, were recognized within the equity and other income caption of the Combined Statements of Operations and Comprehensive Income.
F-32
Table of Contents
NOTE M – ACCUMULATED OTHER COMPREHENSIVE LOSS
Accumulated other comprehensive income (loss)
Components of other comprehensive loss recorded in the Combined Statements of Operations and Comprehensive Income are presented in the following table, before tax and net of tax effects.
| (In millions) |
Before tax | Tax expense | Net of tax | |||||||||
| Year ended September 30, 2015 |
||||||||||||
| Other comprehensive income (loss) |
||||||||||||
| Unrealized translation loss |
$ | (33.1 | ) | $ | (1.0 | ) | $ | (34.1 | ) | |||
| Pension obligation adjustment: |
||||||||||||
| Amortization of unrecognized prior service costs |
0.1 | — | 0.1 | |||||||||
|
|
|
|
|
|
|
|||||||
| Total other comprehensive loss |
$ | (33.0 | ) | $ | (1.0 | ) | $ | (34.0 | ) | |||
|
|
|
|
|
|
|
|||||||
| Year ended September 30, 2014 |
||||||||||||
| Other comprehensive income (loss) |
||||||||||||
| Unrealized translation loss |
$ | (11.7 | ) | $ | (0.3 | ) | (12.0 | ) | ||||
| Pension obligation adjustment: |
||||||||||||
| Amortization of unrecognized prior service costs |
0.6 | (0.2 | ) | 0.4 | ||||||||
|
|
|
|
|
|
|
|||||||
| Total other comprehensive loss |
$ | (11.1 | ) | $ | (0.5 | ) | $ | (11.6 | ) | |||
|
|
|
|
|
|
|
|||||||
| Year ended September 30, 2013 |
||||||||||||
| Other comprehensive income (loss) |
||||||||||||
| Unrealized translation loss |
$ | (10.1 | ) | $ | (0.8 | ) | $ | (10.9 | ) | |||
| Pension obligation adjustment: |
||||||||||||
| Amortization of unrecognized prior service costs |
0.2 | — | 0.2 | |||||||||
|
|
|
|
|
|
|
|||||||
| Total other comprehensive loss |
$ | (9.9 | ) | $ | (0.8 | ) | $ | (10.7 | ) | |||
|
|
|
|
|
|
|
|||||||
| (a) | Amortization of unrecognized prior service costs are included in the calculation of net periodic benefit costs (income) for pension plans. For specific financial statement captions impacted by the amortization see the table below. |
In accordance with U.S. GAAP, as disclosed in the table above, certain pension costs are amortized from accumulated other comprehensive loss and recognized in net income. The captions in the Combined Statements of Operations and Comprehensive Income impacted by the amortization of unrecognized prior service costs for pension plans are disclosed below. See Note K for more information.
| (In millions) |
2015 | 2014 | 2013 | |||||||||
| Cost of sales |
$ | — | $ | 0.2 | $ | 0.1 | ||||||
| Selling, general and administrative expense |
0.1 | 0.4 | 0.1 | |||||||||
|
|
|
|
|
|
|
|||||||
| Total amortization of unrecognized prior service costs |
$ | 0.1 | $ | 0.6 | $ | 0.2 | ||||||
|
|
|
|
|
|
|
|||||||
NOTE N – RELATED PARTY TRANSACTIONS AND ASHLAND NET INVESTMENT
Related party transactions
All significant intercompany transactions between Valvoline and Ashland have been included in the Combined Financial Statements and are considered to be effectively settled for cash in the Combined Financial Statements at the time the transaction is recorded. The total net effect of the settlement of these transactions between Valvoline and Ashland is reflected in the Combined Statements of Cash Flows as a financing activity
F-33
Table of Contents
NOTE N – RELATED PARTY TRANSACTIONS AND ASHLAND NET INVESTMENT (continued)
and in the Combined Balance Sheets as Ashland’s net investment in Valvoline in lieu of stockholders’ equity. In the Combined Statements of Invested Equity, the invested equity returned to Ashland is the net of a variety of intercompany transactions including, but not limited to, collection of trade receivables, payment of trade payables and accrued liabilities, settlement of charges for allocated corporate costs and payment of taxes by Ashland on Valvoline’s behalf.
Cash management and financing
Ashland uses a centralized approach to cash management. Accordingly, the cash and cash equivalents are held by Ashland at the corporate level and were not attributed to Valvoline for any of the periods presented. Transfers of cash, both to and from Ashland’s centralized cash management system, are reflected as a component of Ashland’s net investment in Valvoline on the Combined Balance Sheets and as a financing activity within the accompanying Combined Statement of Cash Flows. Debt obligations of Ashland have not been included in the Combined Financial Statements of Valvoline, because Valvoline is not a party to the obligation between Ashland and the debt holders.
Derivative instruments
Ashland regularly uses derivative instruments to manage its exposure to fluctuations in foreign currencies. Gains and losses related to a hedge are either recognized in income immediately, to offset the gain or loss on the hedged item, or deferred and recorded in the equity section of Ashland’s Consolidated Balance Sheets as a component of accumulated other comprehensive loss and subsequently recognized in Ashland’s Consolidated Statements of Operations and Comprehensive Income when the hedged item affects net income. The ineffective portion of the change in fair value of a hedge is recognized in income immediately.
Valvoline participates in Ashland’s centralized programs. As a result, no gains or losses on hedges reported as a component of the cumulative translation adjustment within accumulated other comprehensive loss are reported in the Combined Balance Sheets for any year presented.
Changes in the fair value of all derivatives are recognized immediately in income unless the derivative qualifies as a hedge of future cash flows or a hedge of a net investment in foreign operations. Expenses recognized in income have been allocated to Valvoline as part of the Corporate expense allocations.
Stock incentive plans
Valvoline has historically participated in Ashland’s stock incentive plans for key employees and directors, primarily in the form of stock appreciation rights (SARs), restricted stock, performance shares and other non-vested stock awards. Equity-based compensation expense has been either directly reported by or allocated to Valvoline based on the awards and terms previously granted to Ashland’s employees. Stock based compensation expense recorded by Valvoline during the fiscal years ended September 30, 2015, 2014 and 2013 were $9.0 million, $7.6 million, and $6.6 million, respectively. These costs were primarily included within the Corporate expense allocation caption of the Combined Statements of Operations and Comprehensive Income. Compensation expense for stock incentive plans is generally based on the grant-date fair value over the appropriate vesting period. Ashland utilizes several industry accepted valuation models to determine the fair value. Until the separation occurs, Valvoline will continue to participate in Ashland’s equity-based compensation plans and record equity-based compensation expense based on the historical allocation of cost.
Corporate allocations and Ashland’s net investment
Corporate allocations
Valvoline utilizes centralized functions of Ashland to support its operations, and in return, Ashland allocates certain of its expenses to Valvoline. Such expenses represent costs related, but not limited to, treasury, legal,
F-34
Table of Contents
NOTE N – RELATED PARTY TRANSACTIONS AND ASHLAND NET INVESTMENT (continued)
accounting, insurance, information technology, payroll administration, human resources, stock incentive plans and other services. These costs, together with an allocation of Ashland overhead costs, are included within the Corporate expense allocation caption of the Combined Statements of Operations and Comprehensive Income. Where it is possible to specifically attribute such expenses to activities of Valvoline, these amounts have been charged or credited directly to Valvoline without allocation or apportionment. Allocation of all other such expenses is based on a reasonable reflection of the utilization of service provided or benefits received by Valvoline during the periods presented on a consistent basis, such as headcount, square footage, tangible assets or sales. Valvoline’s management supports the methods used in allocating expenses and believes these methods to be reasonable estimates.
Nevertheless, the Combined Financial Statements may not include all of the actual expenses that would have been incurred and may not reflect Valvoline’s combined results of operations, financial position and cash flows had it been a stand-alone company during the periods presented. It is not practicable to estimate actual costs that would have been incurred had Valvoline been a stand-alone company during the periods presented. Actual costs that would have been incurred if Valvoline had been a stand-alone company would depend on multiple factors, including organizational structure and strategic decisions made in various areas, including information technology and infrastructure. General corporate expenses allocated to Valvoline during the fiscal years ended September 30, 2015, 2014 and 2013 were $79.5 million, $95.0 million, and $88.2 million, respectively.
The following table summarizes the centralized and administrative support costs of Ashland that have been allocated to Valvoline.
| (In millions) |
2015 | 2014 | 2013 | |||||||||
| Information technology |
$ | 16.9 | $ | 17.1 | $ | 16.4 | ||||||
| Financial and accounting |
13.1 | 12.2 | 12.1 | |||||||||
| Building services |
10.5 | 10.2 | 10.6 | |||||||||
| Legal and environmental |
6.9 | 6.7 | 5.4 | |||||||||
| Human resources |
4.4 | 4.8 | 4.4 | |||||||||
| Shared services |
2.1 | — | — | |||||||||
| Other general and administrative |
25.6 | 44.0 | 39.3 | |||||||||
|
|
|
|
|
|
|
|||||||
| Total |
$ | 79.5 | $ | 95.0 | $ | 88.2 | ||||||
|
|
|
|
|
|
|
|||||||
Ashland net investment
Disclosure of share capital or retained earnings for Valvoline has been determined to not be meaningful as the net assets are represented by Ashland’s net investment in Valvoline after eliminating investments and transactions between Valvoline, Ashland or its subsidiaries.
NOTE O – REPORTABLE SEGMENT INFORMATION
Valvoline determines its reportable segments based on how operations will be managed internally for the products and services sold to customers, including how the results will be reviewed by the chief operating decision maker, which includes determining resource allocation methodologies used for reportable segments. Valvoline’s operating segments are identical to its reportable segments. Operating income is the primary measure reviewed by the chief operating decision maker in assessing each reportable segment’s financial performance. Valvoline’s businesses are managed within three reportable segments: Core North America, Quick Lubes, and International.
F-35
Table of Contents
NOTE O – REPORTABLE SEGMENT INFORMATION (continued)
Reportable segment business descriptions
The Core North America business segment sells Valvoline™ and other branded products in the United States and Canada to both consumers who perform their own automotive maintenance, referred to as “Do-It-Yourself” or “DIY” consumers, as well as to installer customers who use Valvoline products to service vehicles owned by “Do-It-For-Me” or “DIFM” consumers. Valvoline sells to its DIY consumers through national retail auto parts stores, leading mass merchandisers and independent auto part stores. Valvoline sells to its DIFM consumers through installers in the United States and Canada. Installer customers include car dealers, general repair shops, and third-party quick lube chains. Valvoline directly serves these customers through a network of distributors. Valvoline’s installer channel also sells branded products and solutions to heavy duty customers such as on-highway fleets and construction companies.
Through its Quick Lubes business segment, Valvoline operates Valvoline Instant Oil Change (VIOC), a quick-lube service chain involving both Company-owned and franchised stores. Valvoline also sells products and provides Valvoline branded signage to independent quick lube operators through its Express Care program.
The International business segment sells Valvoline™ and Valvoline’s other branded products in approximately 140 countries outside of the United States and Canada. Valvoline’s key international markets include China, India, EMEA, Latin America and Australia Pacific. The International business segment sells products for both consumer and commercial vehicles and equipment, and is served by company-owned plants in the United States, Australia and the Netherlands, a joint venture-owned plant in India and third-party warehouses and toll manufacturers in other regions. In most of the countries where Valvoline’s products are sold, Valvoline goes to market via independent distributors.
Unallocated and other generally includes items such as components of pension and other postretirement benefit plan expenses (excluding service costs, which are allocated to the reportable segments), certain significant company-wide restructuring activities and legacy costs or adjustments that relate to divested businesses, including the $26.3 million loss from the sale of car care products during 2015.
Valvoline had a single customer that represented 10% of combined net sales in 2013. Sales to this customer in 2013 were $201.5 million and were primarily included in the Core North America reportable segment.
International data
Information about Valvoline’s domestic and international operations follows. Valvoline’s foreign operations are primarily captured within the International reportable segment and Valvoline has no material operations in any individual international country.
| Sales from external customers | Net assets | Property, plant and equipment – net |
||||||||||||||||||||||||||
| (In millions) |
2015 | 2014 | 2013 | 2015 | 2014 | 2015 | 2014 | |||||||||||||||||||||
| United States |
$ | 1,412.8 | $ | 1,440.4 | $ | 1,414.2 | $ | 491.9 | $ | 568.5 | $ | 218.8 | $ | 231.5 | ||||||||||||||
| International |
554.1 | 600.9 | 582.0 | 125.2 | 156.3 | 34.7 | 40.9 | |||||||||||||||||||||
|
|
|
|
|
|
|
|
|
|
|
|
|
|
|
|||||||||||||||
| $ | 1,966.9 | $ | 2,041.3 | $ | 1,996.2 | $ | 617.1 | $ | 724.8 | $ | 253.5 | $ | 272.4 | |||||||||||||||
|
|
|
|
|
|
|
|
|
|
|
|
|
|
|
|||||||||||||||
F-36
Table of Contents
NOTE O – REPORTABLE SEGMENT INFORMATION (continued)
Reportable segment results
The following tables present various financial information for each reportable segment for the years ended September 30, 2015, 2014 and 2013 and as of September 30, 2015, 2014 and 2013. Results of Valvoline’s reportable segments are presented based on how operations will be managed internally for the products and services sold to customers, including how the results will be reviewed by the chief operating decision maker, which includes determining resource allocation methodologies used for reportable segments. The structure and practices are specific to Valvoline; therefore, the financial results of Valvoline’s reportable segments are not necessarily comparable with similar information for other comparable companies. Valvoline allocates all costs to its reportable segments except for certain significant company-wide restructuring activities, such as the restructuring plans described in Note D, and/or other costs or adjustments that relate to former businesses that Valvoline no longer operates. The service cost component of pension and other postretirement benefits costs is allocated to each reportable segment on a ratable basis; while the remaining components of pension and other postretirement benefits costs are recorded to Unallocated and other. Valvoline refines its expense allocation methodologies to the reportable segments from time to time as internal accounting practices are improved, more refined information becomes available and the industry or market changes. Revisions to Valvoline’s methodologies that are deemed insignificant are applied on a prospective basis.
Valvoline determined that disclosing sales by specific product was impracticable due to the highly customized and extensive portfolio of products offered to customers and since no one product could be aggregated together to represent a majority of revenue within a reportable segment. As such, the following table provides a summary of 2015 sales by product category for each reportable segment:
|
Sales by product category for 2015 |
||||||||||||||||
| Core North America |
Quick Lubes |
International |
||||||||||||||
| Lubricants |
83 | % | Lubricants | 94 | % | Lubricants | 86 | % | ||||||||
| Chemicals |
8 | % | Chemicals | 1 | % | Chemicals | 9 | % | ||||||||
| Antifreeze |
7 | % | Filters | 5 | % | Antifreeze | 4 | % | ||||||||
| Filters |
2 | % | 100 | % | Filters | 1 | % | |||||||||
|
|
|
|
|
|
|
|||||||||||
| 100 | % | 100 | % | |||||||||||||
|
|
|
|
|
|||||||||||||
F-37
Table of Contents
NOTE O – REPORTABLE SEGMENT INFORMATION (continued)
The following table presents various financial information for each reportable segment. The operating results of divested assets during 2015 that did not qualify for discontinued operations accounting treatment are included in the financial information until the date of sale.
Valvoline
Reportable Segment Information
Years Ended September 30
| (In millions) |
2015 | 2014 | 2013 | |||||||||
| Sales |
||||||||||||
| Core North America |
$ | 1,060.7 | $ | 1,114.0 | $ | 1,107.5 | ||||||
| Quick Lubes |
394.4 | 369.9 | 343.7 | |||||||||
| International |
511.8 | 557.4 | 545.0 | |||||||||
|
|
|
|
|
|
|
|||||||
| $ | 1,966.9 | $ | 2,041.3 | $ | 1,996.2 | |||||||
|
|
|
|
|
|
|
|||||||
| Equity income (loss) |
||||||||||||
| Core North America |
$ | — | $ | (0.1 | ) | $ | (0.3 | ) | ||||
| Quick Lubes |
— | — | — | |||||||||
| International |
(2.2 | ) | 10.3 | 13.1 | ||||||||
|
|
|
|
|
|
|
|||||||
| (2.2 | ) | 10.2 | 12.8 | |||||||||
| Other income |
||||||||||||
| Core North America |
1.3 | 1.8 | 1.5 | |||||||||
| Quick Lubes |
2.1 | 2.0 | 1.9 | |||||||||
| International |
7.1 | 16.1 | 8.1 | |||||||||
|
|
|
|
|
|
|
|||||||
| 10.5 | 19.9 | 11.5 | ||||||||||
|
|
|
|
|
|
|
|||||||
| $ | 8.3 | $ | 30.1 | $ | 24.3 | |||||||
|
|
|
|
|
|
|
|||||||
| Operating income (loss) |
||||||||||||
| Core North America |
$ | 200.5 | $ | 165.0 | $ | 157.7 | ||||||
| Quick Lubes |
94.8 | 79.7 | 70.1 | |||||||||
| International |
64.7 | 78.4 | 67.8 | |||||||||
| Unallocated and other (a) |
(36.9 | ) | (58.4 | ) | 85.0 | |||||||
|
|
|
|
|
|
|
|||||||
| $ | 323.1 | $ | 264.7 | $ | 380.6 | |||||||
|
|
|
|
|
|
|
|||||||
| Assets |
||||||||||||
| Core North America |
$ | 475.6 | $ | 552.8 | $ | 529.6 | ||||||
| Quick Lubes |
237.1 | 223.9 | 217.4 | |||||||||
| International |
262.9 | 296.4 | 303.8 | |||||||||
| Unallocated and other |
2.3 | 9.4 | 11.2 | |||||||||
|
|
|
|
|
|
|
|||||||
| $ | 977.9 | $ | 1,082.5 | $ | 1,062.0 | |||||||
|
|
|
|
|
|
|
|||||||
| (a) | During 2015, 2014, and 2013, Unallocated and other also includes a loss of $46.0 million, a loss of $61.1 million, and a gain of $74.0 million, respectively, related to the actuarial remeasurements of pension and other postretirement benefit plans. |
F-38
Table of Contents
NOTE O – REPORTABLE SEGMENT INFORMATION (continued)
Valvoline
Reportable Segment Information (continued)
Years Ended September 30
| (In millions) |
2015 | 2014 | 2013 | |||||||||
| Equity method investments |
||||||||||||
| Core North America |
$ | — | $ | — | $ | — | ||||||
| Quick Lubes |
— | — | — | |||||||||
| International |
28.9 | 44.0 | 40.3 | |||||||||
| Unallocated and other |
— | — | — | |||||||||
|
|
|
|
|
|
|
|||||||
| $ | 28.9 | $ | 44.0 | $ | 40.3 | |||||||
|
|
|
|
|
|
|
|||||||
| Depreciation and amortization |
||||||||||||
| Core North America |
$ | 16.6 | $ | 16.1 | $ | 15.3 | ||||||
| Quick Lubes |
16.2 | 15.3 | 15.1 | |||||||||
| International |
5.2 | 5.7 | 5.3 | |||||||||
|
|
|
|
|
|
|
|||||||
| $ | 38.0 | $ | 37.1 | $ | 35.7 | |||||||
|
|
|
|
|
|
|
|||||||
| Property, plant and equipment – net |
||||||||||||
| Core North America |
$ | 86.6 | $ | 103.0 | $ | 104.0 | ||||||
| Quick Lubes |
127.3 | 124.2 | 121.1 | |||||||||
| International |
39.6 | 45.2 | 45.1 | |||||||||
|
|
|
|
|
|
|
|||||||
| $ | 253.5 | $ | 272.4 | $ | 270.2 | |||||||
|
|
|
|
|
|
|
|||||||
| Additions to property, plant and equipment |
||||||||||||
| Core North America |
$ | 20.2 | $ | 15.2 | $ | 14.9 | ||||||
| Quick Lubes |
19.2 | 16.4 | 19.5 | |||||||||
| International |
5.6 | 5.6 | 6.5 | |||||||||
|
|
|
|
|
|
|
|||||||
| $ | 45.0 | $ | 37.2 | $ | 40.9 | |||||||
|
|
|
|
|
|
|
|||||||
NOTE P – SUBSEQUENT EVENT
Oil Can Henry’s
On December 11, 2015, Ashland announced that it signed a definitive agreement to acquire OCH International, Inc. (Oil Can Henry’s), which was the 13th largest quick-lube network in the United States, servicing approximately 1 million vehicles annually with 89 quick-lube stores, consisting of 47 company-owned stores and 42 franchise locations, in Oregon, Washington, California, Arizona, Idaho and Colorado. On February 1, 2016, Ashland completed the acquisition.
The acquisition of Oil Can Henry’s within the Quick Lubes reportable segment was valued at $72.0 million, which included acquired indebtedness of $10.5 million, working capital payments of $0.6 million and cash received of $2.4 million, for a total all-cash purchase price of $63.3 million.
F-39
Table of Contents
Five-Year Selected Financial Information (a)
Years Ended September 30
| (In millions) |
2015 | 2014 | 2013 | 2012 | 2011 | |||||||||||||||
| Summary of operations |
||||||||||||||||||||
| Sales |
$ | 1,966.9 | $ | 2,041.3 | $ | 1,996.2 | $ | 2,034.0 | $ | 1,971.1 | ||||||||||
| Operating income |
323.1 | 264.7 | 380.6 | 171.5 | 162.3 | |||||||||||||||
| Net income |
196.1 | 173.4 | 246.1 | 113.8 | 109.9 | |||||||||||||||
| Balance sheet information (as of September 30) |
||||||||||||||||||||
| Total assets |
$ | 977.9 | $ | 1,082.5 | $ | 1,062.0 | $ | 1,023.9 | $ | 993.1 | ||||||||||
| (a) | During the periods presented, Valvoline experienced changes to its businesses affecting the comparability of financial information between years. These changes include, but are not limited to, the impact of immediately recognizing actuarial gain and loss remeasurements for defined benefit pension and other postretirement benefit plans. During the five years ended September 30 presented above, Valvoline recognized a loss of $46.0 million in 2015, a loss of $61.1 million in 2014, a gain of $74.0 million in 2013, a loss of $67.8 million in 2012 and a loss of $51.7 million in 2011 |
F-40
Table of Contents
This page intentionally left blank
F-41
Table of Contents
Combined Statements of Operations and Comprehensive Income
| Six months ended March 31 |
||||||||
| (In millions – unaudited) |
2016 | 2015 | ||||||
| Sales |
$ | 935.7 | $ | 973.4 | ||||
| Cost of sales |
567.9 | 634.9 | ||||||
|
|
|
|
|
|||||
| Gross profit |
367.8 | 338.5 | ||||||
| Selling, general and administrative expense |
137.4 | 128.4 | ||||||
| Corporate expense allocation – Note J |
41.1 | 39.2 | ||||||
| Equity and other income (loss) |
10.7 | (2.0 | ) | |||||
|
|
|
|
|
|||||
| Operating income |
200.0 | 168.9 | ||||||
| Net loss on acquisition and divestiture – Note C |
(0.5 | ) | (26.0 | ) | ||||
|
|
|
|
|
|||||
| Income before income taxes |
199.5 | 142.9 | ||||||
| Income tax expense – Note F |
66.5 | 52.4 | ||||||
|
|
|
|
|
|||||
| Net income |
$ | 133.0 | $ | 90.5 | ||||
|
|
|
|
|
|||||
| COMPREHENSIVE INCOME (LOSS) |
||||||||
| Net income |
$ | 133.0 | $ | 90.5 | ||||
| Other comprehensive income (loss), net of tax |
||||||||
| Unrealized translation income (loss) |
4.7 | (30.1 | ) | |||||
|
|
|
|
|
|||||
| Other comprehensive income (loss) |
4.7 | (30.1 | ) | |||||
|
|
|
|
|
|||||
| Comprehensive income |
$ | 137.7 | $ | 60.4 | ||||
|
|
|
|
|
|||||
See Notes to Condensed Combined Financial Statements.
F-42
Table of Contents
Condensed Combined Balance Sheets
| (In millions – unaudited) |
March 31 2016 |
September 30 2015 |
||||||
| Assets |
||||||||
| Current assets |
||||||||
| Accounts receivable (a) |
$ | 350.4 | $ | 334.6 | ||||
| Inventories – Note D |
142.8 | 125.6 | ||||||
| Other assets |
21.2 | 17.1 | ||||||
|
|
|
|
|
|||||
| Total current assets |
514.4 | 477.3 | ||||||
| Noncurrent assets |
||||||||
| Property, plant and equipment |
||||||||
| Cost |
659.4 | 627.8 | ||||||
| Accumulated depreciation |
392.9 | 374.3 | ||||||
|
|
|
|
|
|||||
| Net property, plant and equipment |
266.5 | 253.5 | ||||||
| Goodwill – Note E |
253.0 | 169.4 | ||||||
| Intangibles – Note E |
3.5 | 1.6 | ||||||
| Equity method investments |
28.2 | 28.9 | ||||||
| Other assets |
51.8 | 47.2 | ||||||
|
|
|
|
|
|||||
| Total noncurrent assets |
603.0 | 500.6 | ||||||
|
|
|
|
|
|||||
| Total assets |
$ | 1,117.4 | $ | 977.9 | ||||
|
|
|
|
|
|||||
| Liabilities and Invested Equity |
||||||||
| Current liabilities |
||||||||
| Trade and other payables |
$ | 168.0 | $ | 173.3 | ||||
| Accrued expenses and other liabilities |
132.6 | 125.3 | ||||||
|
|
|
|
|
|||||
| Total current liabilities |
300.6 | 298.6 | ||||||
| Noncurrent liabilities |
||||||||
| Employee benefit obligations – Note G |
12.1 | 13.0 | ||||||
| Deferred income taxes – Note F |
23.8 | 23.8 | ||||||
| Other liabilities |
41.3 | 25.4 | ||||||
|
|
|
|
|
|||||
| Total noncurrent liabilities |
77.2 | 62.2 | ||||||
| Commitments and contingencies – Note H |
||||||||
| Invested equity – Notes I and J |
739.6 | 617.1 | ||||||
|
|
|
|
|
|||||
| Total liabilities and invested equity |
$ | 1,117.4 | $ | 977.9 | ||||
|
|
|
|
|
|||||
| (a) | Accounts receivable includes an allowance for doubtful accounts of $4.2 million at March 31, 2016 and $3.8 million at September 30, 2015. |
See Notes to Condensed Combined Financial Statements
F-43
Table of Contents
Combined Statements of Invested Equity
| (In millions – unaudited) |
Ashland’s Net Investment in Valvoline |
Accumulated Other Comprehensive Income (Loss) (a) |
Total | |||||||||
| Balance at September 30, 2014 |
$ | 751.4 | $ | (26.6 | ) | $ | 724.8 | |||||
| Total comprehensive income (loss) |
90.5 | (30.1 | ) | 60.4 | ||||||||
| Equity returned to Ashland, net |
(113.2 | ) | — | (113.2 | ) | |||||||
|
|
|
|
|
|
|
|||||||
| Balance at March 31, 2015 |
$ | 728.7 | $ | (56.7 | ) | $ | 672.0 | |||||
| Balance at September 30, 2015 |
$ | 677.7 | $ | (60.6 | ) | $ | 617.1 | |||||
| Total comprehensive income |
133.0 | 4.7 | 137.7 | |||||||||
| Equity returned to Ashland, net |
(15.2 | ) | — | (15.2 | ) | |||||||
|
|
|
|
|
|
|
|||||||
| Balance at March 31, 2016 |
$ | 795.5 | $ | (55.9 | ) | $ | 739.6 | |||||
|
|
|
|
|
|
|
|||||||
| (a) | At March 31, 2016 and September 30, 2015, the accumulated other comprehensive loss of $55.9 million and $60.6 million, respectively, was comprised of unrecognized prior service costs as a result of certain employee benefit plan amendments of $0.3 million during each period and net unrealized translation losses of $55.6 million and $60.3 million, respectively. |
See Notes to Condensed Combined Financial Statements.
F-44
Table of Contents
Condensed Combined Statements of Cash Flows
| Six months ended March 31 |
||||||||
| (In millions – unaudited) |
2016 | 2015 | ||||||
| Cash flows provided (used) by operating activities |
||||||||
| Net income |
$ | 133.0 | $ | 90.5 | ||||
| Adjustments to reconcile income to cash flows from operating activities |
||||||||
| Depreciation and amortization |
19.0 | 18.8 | ||||||
| Equity income from affiliates |
(6.8 | ) | (6.5 | ) | ||||
| Distributions from equity affiliates |
8.1 | 8.1 | ||||||
| Net loss on acquisition and divestiture – Note C |
0.5 | 26.0 | ||||||
| Impairment of equity method investment |
— | 14.3 | ||||||
| Change in operating assets and liabilities (a) |
(62.7 | ) | 9.4 | |||||
|
|
|
|
|
|||||
| Total cash flows provided by operating activities |
91.1 | 160.6 | ||||||
| Cash flows provided (used) by investing activities |
||||||||
| Additions to property, plant and equipment |
(14.4 | ) | (17.7 | ) | ||||
| Proceeds from disposal of property, plant and equipment |
0.2 | 0.4 | ||||||
| Purchase of operations – net of cash acquired |
(66.4 | ) | — | |||||
|
|
|
|
|
|||||
| Total cash flows used by investing activities |
(80.6 | ) | (17.3 | ) | ||||
| Cash flows provided (used) by financing activities |
||||||||
| Net transfers to Ashland |
(10.5 | ) | (143.3 | ) | ||||
|
|
|
|
|
|||||
| Total cash flows used by financing activities |
(10.5 | ) | (143.3 | ) | ||||
|
|
|
|
|
|||||
| Change in cash and cash equivalents |
— | — | ||||||
| Cash and cash equivalents – beginning of period |
— | — | ||||||
|
|
|
|
|
|||||
| Cash and cash equivalents – end of period |
$ | — | $ | — | ||||
|
|
|
|
|
|||||
| (a) | Excludes changes resulting from operations acquired or sold. |
See Notes to Condensed Combined Financial Statements.
F-45
Table of Contents
Notes to Condensed Combined Financial Statements
NOTE A – DESCRIPTION OF BUSINESS AND BASIS OF PRESENTATION
The Proposed Distribution
On September 22, 2015, Ashland, Inc. (Ashland) announced that its Board of Directors approved proceeding with a plan to separate Ashland into two independent, publicly traded companies comprised of Ashland Global Holdings Inc. (Ashland Global), consisting of its specialty chemicals businesses, and Valvoline. Valvoline will focus on building the world’s leading engine and automotive maintenance business by providing “Hands on Expertise” to customers in each of its primary market channels. Immediately prior to the closing of Valvoline’s initial public offering, Ashland and Valvoline will become subsidiaries of Ashland Global. Ashland intends for the spin-off, which is subject to final board approval prior to completion, to be tax free for Ashland shareholders. Immediately following the spin-off, Ashland shareholders will own shares of both Ashland Global and Valvoline. The spin-off is expected to be completed approximately six months after the completion of the initial public offering of Valvoline.
The internal reorganization and, in turn, the distribution, are subject to the satisfaction or waiver by Ashland of a number of conditions. Additionally, Ashland may determine not to complete the internal reorganization or the distribution if, at any time, the Board of Directors of Ashland determines, in its sole and absolute discretion, that the distribution is not in the best interest of Ashland or its stockholders or is otherwise not advisable.
Valvoline is a premium consumer brand in the global automotive lubricant industry. In the United States, Valvoline operates in all of the key lubricant sales channels, and also has an international presence with products sold in approximately 140 countries. Valvoline provides a wide array of lubricants used in commercial and industrial equipment and machinery, and automotive chemicals designed to help engines run better and longer. Valvoline also operates a retail quick lube service chain through Valvoline Instant Oil Change (VIOC), which provides service through over 1,000 franchised and company-owned stores.
Basis of presentation
The accompanying unaudited Condensed Combined Financial Statements were prepared on a stand-alone basis derived from the consolidated financial statements and accounting records of Ashland. For the periods presented, Valvoline was an unincorporated commercial unit of Ashland Inc. These unaudited Condensed Combined Financial Statements reflect the historical results of operations, financial position and cash flows of Valvoline as it was historically managed and adjusted to conform with accounting principles generally accepted in the United States of America (U.S. GAAP) for interim financial reporting and Securities and Exchange Commission regulations. These unaudited Condensed Combined Financial Statements are presented as if Valvoline had operated on a stand-alone basis for all periods presented. Valvoline is comprised of a combination of unincorporated commercial units of Ashland and its various subsidiary companies and, in certain jurisdictions, separate legal entities.
In the opinion of the management, all adjustments considered necessary for a fair presentation have been included. These statements omit certain information and footnote disclosures required for complete annual financial statements and, therefore, should be read in conjunction within the Combined Financial Statements and accompanying notes for the fiscal years ended September 30, 2015, 2014 and 2013 included elsewhere in this prospectus. Results of operations for the period ended March 31, 2016 are not necessarily indicative of the expected results for the remaining periods in the fiscal year.
All significant intercompany transactions within Valvoline have been eliminated. The assets and liabilities in the stand-alone financial statements are wholly owned by Ashland and are being transferred to Valvoline at carry-over (historical cost) basis. As a result, the Condensed Combined Financial Statements included herein
F-46
Table of Contents
NOTE A – DESCRIPTION OF BUSINESS AND BASIS OF PRESENTATION (continued)
may not necessarily be indicative of Valvoline’s financial position, results of operations, or cash flows had it operated as a stand-alone entity during the periods presented. All significant transactions between Valvoline and Ashland have been included in the Condensed Combined Financial Statements and are considered to be effectively settled for cash at the time the transaction is recorded. The total net effect of the settlement of these intercompany transactions is reflected in the Condensed Combined Statement of Cash Flows as a financing activity and in the Condensed Combined Balance Sheets as Ashland’s net investment in Valvoline in lieu of stockholder’s equity. In the Combined Statements of Invested Equity, the Invested Equity returned to Ashland is the net of a variety of intercompany transactions including collection of trade receivables, payment of trade payables and accrued liabilities, settlement of charges for allocated corporate costs, and payment of taxes by Ashland on Valvoline’s behalf. The Condensed Combined Financial Statements reflect the assets, liabilities and operations of the Valvoline business. Investments in joint ventures where Valvoline has the ability to exert significant influence are accounted for under the equity method.
The Condensed Combined Financial Statements also include the recognition of certain assets and liabilities that have historically been recorded at the Ashland corporate level but which are specifically identifiable or otherwise attributable to Valvoline. Valvoline utilizes centralized functions of Ashland to support its operations, and in return, Ashland allocates certain of its expenses to Valvoline. Such expenses represent costs related, but not limited to, treasury, legal, accounting, insurance, information technology, payroll administration, human resources, stock incentive plans and other services. These costs, together with an allocation of Ashland overhead costs, are included within the Corporate expense allocation caption in the Combined Statements of Operations and Comprehensive Income. Where it is possible to specifically attribute such expenses to activities of Valvoline, these amounts have been charged or credited directly to Valvoline without allocation or apportionment. Allocation of all other such expenses is based on a reasonable reflection of the utilization of service provided or benefits received by Valvoline during the periods presented on a consistent basis, such as headcount, square footage, tangible assets or sales.
Management believes the assumptions underlying the stand-alone financial statements, including the assumptions regarding allocated expenses, reasonably reflect the utilization of services provided to or the benefit received by Valvoline during the periods presented. However, these shared expenses may not represent the amounts that would have been incurred had Valvoline operated autonomously or independently from Ashland. Actual costs that would have been incurred if Valvoline had been a stand-alone company would depend on multiple factors, including organizational structure and strategic decisions in various areas, including information technology and infrastructure. For an additional discussion of expense allocations see Note J of the Notes to the Condensed Combined Financial Statements.
Ashland uses a centralized approach to cash management. Accordingly, the cash and cash equivalents are held by Ashland at the corporate level and were not attributed to Valvoline for any of the periods presented. Transfers of cash, both to and from Ashland’s centralized cash management system, are reflected as a component of Ashland’s net investment in Valvoline on the Condensed Combined Balance Sheets and as a financing activity within the accompanying Condensed Combined Statement of Cash Flows. Debt obligations of Ashland have not been included in the Condensed Combined Financial Statements of Valvoline, because Valvoline is not a party to the obligation between Ashland and the debt holders.
The income tax provision in the Combined Statements of Operations and Comprehensive Income has been calculated as if Valvoline was operating on a stand-alone basis and filed separate tax returns in the jurisdiction in which it operates. Valvoline’s operations have historically been included in the Ashland U.S. federal and state tax returns or non-U.S. jurisdictions tax returns. Ashland’s global tax model has been developed based on its entire portfolio of businesses. Therefore cash tax payments and items of current and deferred taxes may not be reflective of Valvoline’s actual tax balances prior to or subsequent to Valvoline operating as a stand-alone company.
F-47
Table of Contents
NOTE B – SIGNIFICANT ACCOUNTING POLICIES
Valvoline’s significant accounting policies, which conform to U. S. GAAP and are applied on a consistent basis in all periods presented. These statements should be read in conjunction within the Combined Financial Statements and accompanying notes for the fiscal years ended September 30, 2015, 2014 and 2013 included elsewhere in this prospectus.
Use of estimates, risks and uncertainties
The preparation of Valvoline’s unaudited Condensed Combined Financial Statements in conformity with U.S. GAAP requires management to make estimates and assumptions that affect the reported amounts of assets, liabilities, revenues and expenses, and the disclosures of contingent assets and liabilities. Significant items that are subject to such estimates and assumptions include, but are not limited to, long-lived assets (including goodwill), sales deductions, and income taxes. Although management bases its estimates on historical experience and various other assumptions that are believed to be reasonable under the circumstances, actual results could differ significantly from the estimates under different assumptions or conditions.
Valvoline’s results are affected by domestic and international economic, political, legislative, regulatory and legal actions. Economic conditions, such as recessionary trends, inflation, monetary exchange rates, government fiscal policies and changes in the prices of certain key raw materials, can have a significant effect on operations. Political actions may include changes in the policies of the Organization of Petroleum Exporting Countries or other developments involving or affecting oil-producing countries, including military conflicts, embargoes, internal instability or actions or reactions of the U.S. government in anticipation of, or in response to, such actions. While Valvoline maintains reserves for anticipated liabilities and, through Ashland, carries various levels of insurance, Valvoline could be affected by civil, criminal, regulatory or administrative actions, claims or proceedings relating to asbestos, environmental remediation or other matters.
Accounts receivable
During 2014, Ashland entered into an agreement to sell accounts receivable for a Valvoline customer in the form of drafts or bills of exchange to a financial institution. Each draft constitutes an order to pay for obligations of the customer to Ashland arising from the sale of goods by Ashland to the customer. As the intention of the arrangement is to decrease the amount of time accounts receivable is outstanding and increase cash flows for Ashland through its centralized cash management function. At March 31, 2016 and September 30, 2015 the outstanding amount of drafts sold by Ashland to the financial institution was $28.5 million and $41.4 million, respectively.
New accounting pronouncements
A description of new U.S. GAAP accounting standards issued and adopted during the current year is required in interim financial reporting. A detailed listing of all new accounting standards relevant to Valvoline is included in the Combined Financial Statements and accompanying notes for the fiscal years ended September 30, 2015, 2014 and 2013 included elsewhere in this prospectus. The following standards relevant to Valvoline were either issued or adopted in the current period, or will become effective in a subsequent period.
In February 2016, the Financial Accounting Standards Board (FASB) issued new accounting guidance related to lease transactions. The main objective of this guidance is to increase transparency and comparability among organizations by requiring lessees to recognize assets and liabilities on the balance sheet for the rights and obligations created by leases and to disclose key information about leasing arrangements. The presentation of the Combined Statements of Operations and Comprehensive Income and the Combined Statement of Cash Flows is largely unchanged under this guidance. This guidance retains a distinction between finance leases and operating leases, and the classification criteria for distinguishing between finance leases and operating leases are substantially similar to the classification criteria for distinguishing between capital leases and operating leases in
F-48
Table of Contents
NOTE B – SIGNIFICANT ACCOUNTING POLICIES (continued)
the current accounting literature. The guidance will become effective for Valvoline on October 1, 2019. Valvoline is currently evaluating the impact this guidance will have on Valvoline’s Combined Financial Statements.
In November 2015, the FASB issued accounting guidance requiring all deferred tax assets and liabilities to be classified as noncurrent on the balance sheet instead of separating deferred taxes into current and noncurrent amounts. Valvoline adopted this accounting standard on a retrospective basis and the impact of this new guidance is reflected within Valvoline’s Combined Financial Statements.
NOTE C – ACQUISITIONS AND DIVESTITURES
Oil Can Henry’s
On December 11, 2015, Ashland announced that it signed a definitive agreement to acquire OCH International, Inc. (Oil Can Henry’s), which was the 13th largest quick-lube network in the United States, servicing approximately 1 million vehicles annually with 89 quick-lube stores, 47 company-owned stores and 42 franchise locations, in Oregon, Washington, California, Arizona, Idaho and Colorado. On February 1, 2016, Ashland completed the acquisition.
The acquisition of Oil Can Henry’s within the Quick Lubes reportable segment was valued at $72.0 million, which included acquired indebtedness of $10.5 million, working capital payments of $0.6 million and cash received of $2.4 million, for a total all-cash purchase price of $63.3 million. The net cash outlay during the March 2016 period was $60.4 million. The following table summarizes the values of the assets acquired and liabilities assumed at the date of acquisition.
| Purchase price allocation (in millions) |
At February 1, 2016 |
|||
| Assets: |
||||
| Cash |
$ | 2.4 | ||
| Accounts receivable |
0.4 | |||
| Inventory |
1.2 | |||
| Other current assets |
0.2 | |||
| Property, plant and equipment |
4.0 | |||
| Goodwill |
81.6 | |||
| Intangible assets |
2.1 | |||
| Other noncurrent assets |
2.0 | |||
| Liabilities: |
||||
| Trade and other payables |
(1.1 | ) | ||
| Accrued expenses and other liabilities |
(10.1 | ) | ||
| Debt |
(10.5 | ) | ||
| Other noncurrent liabilities |
(8.9 | ) | ||
|
|
|
|||
| Total purchase price |
$ | 63.3 | ||
|
|
|
|||
As of March 31, 2016, the purchase price allocation for the acquisition was preliminary and subject to completion. Adjustments to the current fair value estimates in the above table may occur as the process conducted for various valuations and assessments is finalized. Goodwill is calculated as the excess of the consideration transferred over the net assets recognized and represents the estimated future economic benefits arising from other assets acquired that could not be individually identified and separately recognized. The factors contributing to the recognition of goodwill were based on strategic benefits that are expected to be realized from the acquisition of Oil Can Henry’s. None of the goodwill is expected to be deductible for income tax purposes.
F-49
Table of Contents
NOTE C – ACQUISITIONS AND DIVESTITURES (continued)
Morgan Acres
During June 2015, Valvoline acquired three locations within the Quick Lubes reportable segment. The purchase price of $4.7 million was allocated primarily to property, plant and equipment and goodwill.
Car Care Products
During March 2015, Ashland entered into a definitive sale agreement to sell Valvoline’s car care product assets within the Core North America reportable segment for $24.0 million, which included Car Brite™ and Eagle One™ automotive appearance products. Prior to the sale, Valvoline recognized a loss of $26.0 million before tax in March 2015 to recognize the assets at fair value less cost to sell, using Level 2 nonrecurring fair value measurements. The loss is reported within the net loss on divestiture caption within the Combined Statements of Operations and Comprehensive Income during the six months ended March 31, 2015. The transaction closed on June 30, 2015 and Valvoline received net proceeds of $19.3 million after adjusting for certain customary closing costs and final working capital amounts during the June 2015 quarter.
The sale of Valvoline’s car care product assets did not qualify for discontinued operations treatment since it did not represent a strategic shift that had or will have a major effect on Valvoline’s operations and financial results.
Venezuela Equity Method Investment
During April 2015, Valvoline sold the equity method investment in Venezuela within the International reportable segment. Prior to the sale, Valvoline recognized a $14.3 million impairment during the six months ended March 31, 2015, for which there was no tax effect, using Level 2 nonrecurring fair value measurements within the equity and other income (loss) caption of the Combined Statements of Operations and Comprehensive Income.
Valvoline’s decision to sell the equity investment and the resulting charge recorded during the six months ended March 31, 2015 was reflective of the continued devaluation of the Venezuelan currency (bolivar) based on changes to the Venezuelan currency exchange rate mechanisms during the period. In addition, the continued lack of exchangeability between the Venezuelan bolivar and U.S. dollar had restricted the equity method investee’s ability to pay dividends and obligations denominated in U.S. dollars. These exchange regulations and cash flow limitations, combined with other recent Venezuelan regulations and the impact of declining oil prices on the Venezuelan economy, had significantly restricted Valvoline’s ability to conduct normal business operations through the joint venture arrangement. Valvoline determined this divestiture did not represent a strategic shift that had or will have a major effect on Valvoline’s operations and financial results, and thus it did not qualify for discontinued operations treatment.
NOTE D – INVENTORIES
Inventories are carried at the lower of cost or market value. Inventories are primarily stated at cost using the weighted-average cost method. In addition, certain lubricants are valued at cost using the last-in, first-out (LIFO) method.
F-50
Table of Contents
NOTE D – INVENTORIES (continued)
The following summarizes Valvoline’s inventories as of the Condensed Combined Balance Sheet dates.
| (In millions) |
March 31 2016 |
September 30 2015 |
||||||
| Finished products |
$ | 145.5 | $ | 134.3 | ||||
| Raw materials, supplies and work in process |
23.2 | 22.5 | ||||||
| LIFO reserves |
(25.9 | ) | (31.2 | ) | ||||
|
|
|
|
|
|||||
| $ | 142.8 | $ | 125.6 | |||||
|
|
|
|
|
|||||
NOTE E – GOODWILL AND OTHER INTANGIBLES
Goodwill
Valvoline reviews goodwill for impairment annually or when events and circumstances indicate an impairment may have occurred. This annual assessment consists of Valvoline determining each reporting unit’s current fair value compared to its current carrying value. Valvoline’s reporting units are identical to its operating and reportable segments: Core North America, Quick Lubes, and International. The performance of the annual impairment analysis during 2015 did not result in any impairment of goodwill, and no events or circumstances that would indicate an impairment may have occurred were noted during the six months ended March 31, 2016. The estimated fair value of each reporting unit with a significant goodwill balance was substantially in excess of its carrying value.
The following is a progression of goodwill by reportable segment for the six months ended March 31, 2016.
| (In millions) |
Core North America |
Quick Lubes | International | Total | ||||||||||||
| Balance at September 30, 2015 |
$ | 89.1 | $ | 40.7 | $ | 39.6 | $ | 169.4 | ||||||||
| Acquisitions (a) |
— | 83.6 | — | 83.6 | ||||||||||||
|
|
|
|
|
|
|
|
|
|||||||||
| Balance at March 31, 2016 |
$ | 89.1 | $ | 124.3 | $ | 39.6 | $ | 253.0 | ||||||||
|
|
|
|
|
|
|
|
|
|||||||||
| (a) | Relates to $81.6 million for the acquisition of Oil Can Henry’s and $2.0 million for Valvoline Instant Oil ChangeSM center acquisitions during the six months ended March 31, 2016. See Note C for more information on the acquisition of Oil Can Henry’s. |
Other intangible assets
Intangible assets principally consist of trademarks and trade names and customer relationships. Intangible assets classified as finite are amortized on a straight-line basis over their estimated useful lives. The cost of trademarks and trade names is amortized principally over 3 to 15 years and customer relationships over 10 to 20 years.
| (In millions) |
March 31, 2016 | |||||||||||
| Gross carrying amount |
Accumulated amortization |
Net carrying amount |
||||||||||
| Definite-lived intangible assets |
||||||||||||
| Trademarks and trade names (a) |
$ | 2.1 | $ | — | $ | 2.1 | ||||||
| Customer relationships |
3.1 | (1.7 | ) | 1.4 | ||||||||
|
|
|
|
|
|
|
|||||||
| Total definite-lived intangible assets |
$ | 5.2 | $ | (1.7 | ) | $ | 3.5 | |||||
|
|
|
|
|
|
|
|||||||
| (a) | Relates to $1.4 million for trademarks and trade names and $0.7 million for favorable leasehold interests during the six months ended March 31, 2016 related to Oil Can Henry’s. See Note C for more information on the acquisition of Oil Can Henry’s. |
F-51
Table of Contents
NOTE E – GOODWILL AND OTHER INTANGIBLES (continued)
| (In millions) |
September 30, 2015 | |||||||||||
| Gross carrying amount |
Accumulated amortization |
Net carrying amount |
||||||||||
| Definite-lived intangible assets |
||||||||||||
| Trademarks and trade names |
$ | 0.1 | $ | (0.1 | ) | $ | — | |||||
| Customer relationships |
3.1 | (1.5 | ) | 1.6 | ||||||||
|
|
|
|
|
|
|
|||||||
| Total definite-lived intangible assets |
$ | 3.2 | $ | (1.6 | ) | $ | 1.6 | |||||
|
|
|
|
|
|
|
|||||||
Amortization expense recognized on intangible assets was $0.1 million and $0.3 million for the six months ended March 31, 2016 and 2015, respectively, and is primarily included in the selling, general and administrative expense caption of the Combined Statements of Operations and Comprehensive Income. As of March 31, 2016, all of Valvoline’s intangible assets that had a carrying value were being amortized. Estimated amortization expense for future periods is $0.5 million in 2016 (includes six months actual and six months estimated), $0.7 million in 2017, $0.7 million in 2018, $0.5 million in 2019 and $0.2 million in 2020. The amortization expense for future periods is an estimate. Actual amounts may change from such estimated amounts due to fluctuations in foreign currency exchange rates, additional intangible asset acquisitions and divestitures, potential impairment, accelerated amortization, or other events.
NOTE F – INCOME TAXES
Current Fiscal year
Valvoline’s estimated annual effective income tax rate used to determine income tax expense in interim financial reporting for the year ending September 30, 2016 is 34%. The effective tax rate in any interim period is subject to adjustments related to discrete items. The overall effective tax rate was 33% for the six months ended March 31, 2016 and was impacted by net favorable discrete items primarily related to the tax law change from the reinstatement of research and development credit.
Prior Fiscal year
Valvoline’s annual effective income tax rate used to determine income tax expense in interim financial reporting for the year ended September 30, 2015 was 34%. The overall effective tax rate was 37% for the six months ended March 31, 2015. The prior tax rate for the period was unfavorably impacted by the loss on the sale of Valvoline car care product and the impairment of the Venezuela equity method investment.
Unrecognized tax benefits
Changes in unrecognized tax benefits were as follows for the six months ended March 31, 2016:
| (In millions) |
||||
| Balance at October 1, 2015 |
$ | 4.7 | ||
| Increases related to positions taken on items from prior years |
0.1 | |||
| Increases related to positions taken in the current year |
0.4 | |||
|
|
|
|||
| Balance at March 31, 2016 |
$ | 5.2 | ||
|
|
|
|||
From a combination of statute expirations and audit settlements in the next twelve months, Valvoline expects no decrease in the amount of accrual for uncertain tax positions. For the remaining balance as of March 31, 2016, it is reasonably possible that there could be material changes to the amount of uncertain tax
F-52
Table of Contents
NOTE F – INCOME TAXES (continued)
positions due to activities of the taxing authorities, settlement of audit issues, reassessment of existing uncertain tax positions, or the expiration of applicable statute of limitations; however, Valvoline is not able to estimate the impact of these items at this time.
NOTE G – EMPLOYEE BENEFIT PLANS
Pension plans and other postretirement benefit plans
Qualifying employees participate in specific Valvoline or Ashland sponsored defined-benefit pension plans, which typically provide pension payments based on an employee’s length of service and compensation during the years immediately preceding retirement or have a cash balance design. The majority of U.S. pension plans have been closed to new participants since January 1, 2011. In addition, most foreign pension plans are closed to new participants while those that remain open relate to areas where local laws require plans to operate within the applicable country. Pension obligations for applicable employees of non-U.S. consolidated subsidiaries are provided for in accordance with local practices and regulations of the respective countries.
During March 2016, Ashland announced that the majority of its defined benefit pension plans, accounted for as multi-employer plans for the Valvoline stand-alone financial statements, will freeze the accrual of benefits effective as of September 30, 2016. Additionally, during March 2016, Ashland announced that it will reduce retiree life and medical benefits effective October 1, 2016 and January 1, 2017, respectively.
Valvoline has certain defined benefit pension plans that are specifically designated only for Valvoline employees that are included within the Condensed Combined Balance Sheets. The majority of qualifying employees participate in Ashland sponsored pension plans that are accounted for by Valvoline as multi-employer plans, which in accordance with U.S. GAAP, are not included within the Condensed Combined Balance Sheets.
The total cost of both types of plans is recognized within the Combined Statements of Operations and Comprehensive Income and is determined by actuarial valuations. Valvoline receives an allocation of the service cost component of these plans from Ashland based upon payroll costs. All other pension plan cost components are historically recorded at the Ashland Unallocated and other segment. For purposes of these financial statements, costs for multi-employer plans were allocated based on Valvoline employees’ participation in the plan. The amount of net pension cost allocated to Valvoline related to these multi-employer plans was expense of $7.2 million and $1.5 million for the six months ended March 31, 2016 and 2015, respectively. For Valvoline’s specific stand-alone pension plans, all costs associated with these plans were included within the Combined Statements of Operations and Comprehensive Income. The amount of net pension costs for Valvoline specific stand-alone pension plans was expense of $0.5 million and $0.7 million during the six months ended March 31, 2016 and 2015, respectively.
Contributions to the stand-alone Valvoline pension plans were approximately $1.6 million during the six months ended March 31, 2016. Expected contributions to the stand-alone Valvoline pension plans for the remainder of 2016 are approximately $1.6 million, which will be paid by Ashland and accounted for through Ashland’s net investment in Valvoline.
Certain of Valvoline’s U.S. and Canada retired or disabled employees participate in health care and life insurance plans sponsored by Ashland. There are no Valvoline specific postretirement benefit plans. The majority of qualifying employees participate in Ashland sponsored postretirement plans that are accounted for by Valvoline as multi-employer plans, which in accordance with U.S. GAAP, are not included within the Condensed Combined Balance Sheets. The total cost of the plans, determined by actuarial valuations, was income of $5.7 million and $0.5 million for the six months ended March 31, 2016 and 2015, respectively, and is recognized within the Combined Statements of Operations and Comprehensive Income.
F-53
Table of Contents
NOTE G – EMPLOYEE BENEFIT PLANS (continued)
Components of net periodic benefit costs (income)
For segment reporting purposes, service cost for operations is proportionately allocated to each reportable segment, excluding the Unallocated and other segment, while all other costs for operations are recorded within the Unallocated and other segment.
The following table summarizes the components of pension benefit costs for operations and the assumptions used to determine net periodic benefit costs (income) for the plans included within the Condensed Combined Balance Sheets.
| (In millions) |
Pension Benefits |
|||||||
| 2016 | 2015 | |||||||
| Six Months ended March 31 |
||||||||
| Service cost |
$ | 0.6 | $ | 0.7 | ||||
| Interest cost |
0.9 | 1.5 | ||||||
| Expected return on plan assets |
(1.0 | ) | (1.6 | ) | ||||
| Amortization of prior service cost |
— | 0.1 | ||||||
|
|
|
|
|
|||||
| $ | 0.5 | $ | 0.7 | |||||
|
|
|
|
|
|||||
Change in Applying Discount Rate to Measure Benefit Costs
During 2015, Ashland changed the method used to estimate the service and interest cost components of net periodic benefit pension costs. This change compared to the previous method resulted in a decrease in the service and interest cost components for pension costs during the six months ended March 31, 2016. Historically, Ashland estimated these service and interest cost components utilizing a single weighted-average discount rate derived from the yield curve used to measure the benefit obligation at the beginning of the period. Ashland has elected to utilize a full yield curve approach in the estimation of these components by applying the specific spot rates along the yield curve used in the determination of the benefit obligation to the relevant projected cash flows. Ashland has made this change to provide a more precise measurement of service and interest costs by improving the correlation between projected benefit cash flows to the corresponding spot yield curve rates. This change does not affect the measurement of Ashland’s total benefit obligations or annual net periodic benefit costs as the change in the service and interest costs will be offset in the actuarial gain or loss reported, which typically occurs during the fourth fiscal quarter. Ashland has accounted for this change as a change in accounting estimate that is inseparable from a change in accounting principle and accordingly has accounted for it respectively.
For defined benefit pension plans specific to Valvoline, the impact of this discount rate change compared to the previous method will decrease estimated pension service and interest cost by approximately $0.4 million for the full year 2016. The decrease is approximately $0.2 million for the six months ended March 31, 2016, with substantially all of the decrease attributable to interest cost. Based on plan demographics, the majority of the incremental decrease will be reported in selling, general, and administrative expense on a full year and quarterly basis, within the Combined Statements of Operations and Comprehensive Income in the Unallocated and other segment. Service and interest cost, as well as the other components of net periodic benefit costs, are subject to change for such reasons as an event requiring a remeasurement. Valvoline’s total projected benefit obligations related to these specific pension plans will not be impacted by these reductions in service and interest costs as the decrease will be substantially offset within the actuarial gain or loss caption when the plans are remeasured during the fiscal year.
For multi-employer plans the impact of this discount rate change compared to the previous method will decrease estimated pension and other postretirement benefits service and interest cost by approximately $5.7 million for the full year 2016. The decrease is approximately $2.9 million for the six months ended March 31, 2016, with
F-54
Table of Contents
NOTE G – EMPLOYEE BENEFIT PLANS (continued)
substantially all of the decrease attributable to interest cost. The impact on service cost is primarily due to the nature of Ashland’s largest U.S. pension plan, which is closed to new entrants and has curtailed other benefits. Based on plan demographics, approximately $2.3 million of this incremental decrease will be reported in cost of sales and approximately $3.4 million will be reported in selling, general, and administrative expense on a full year basis, or approximately $1.2 million and $1.7 million for the six months ended March 31, 2016, respectively, within the Combined Statements of Operations and Comprehensive Income in the Unallocated and other segment.
NOTE H – LITIGATION, CLAIMS AND CONTINGENCIES
There are various claims, lawsuits and administrative proceedings pending or threatened against Valvoline as a commercial unit of Ashland and its various subsidiary companies and, in certain jurisdictions, separate legal entities which are deemed insignificant. Such actions are with respect to commercial matters, product liability, toxic tort liability, and other environmental matters, which seek remedies or damages, some of which are for substantial amounts. While Valvoline cannot predict with certainty the outcome of such actions, it believes that adequate reserves have been recorded and losses already recognized with respect to such actions were immaterial as of March 31, 2016 and September 30, 2015. There is a reasonable possibility that a loss exceeding amounts already recognized may be incurred related to these actions; however, Valvoline believes that such potential losses were immaterial as of March 31, 2016.
NOTE I – ACCUMULATED OTHER COMPREHENSIVE INCOME (LOSS)
Accumulated other comprehensive income (loss)
Components of other comprehensive income (loss) recorded in the Combined Statements of Operations and Comprehensive Income are presented in the following table, before tax and net of tax effects.
| 2016 | 2015 | |||||||||||||||||||||||
| (In millions) |
Before tax |
Tax expense |
Net of tax |
Before tax |
Tax expense |
Net of tax |
||||||||||||||||||
| Six months ended March 31 |
||||||||||||||||||||||||
| Other comprehensive income (loss) |
||||||||||||||||||||||||
| Unrealized translation gain (loss) |
$ | 4.7 | $ | — | $ | 4.7 | $ | (30.1 | ) | $ | — | $ | (30.1 | ) | ||||||||||
| Pension obligation adjustment: |
||||||||||||||||||||||||
| Amortization of unrecognized prior service costs included in net income (a) |
— | — | — | 0.1 | (0.1 | ) | — | |||||||||||||||||
|
|
|
|
|
|
|
|
|
|
|
|
|
|||||||||||||
| Total other comprehensive income (loss) |
$ | 4.7 | $ | — | $ | 4.7 | $ | (30.0 | ) | $ | (0.1 | ) | $ | (30.1 | ) | |||||||||
|
|
|
|
|
|
|
|
|
|
|
|
|
|||||||||||||
| (a) | Amortization of unrecognized prior service costs are included in the calculation of net periodic benefit costs (income) for pension plans. For specific financial statement captions impacted by the amortization see the table below. |
In accordance with U.S. GAAP, as disclosed in the table above, certain pension costs are amortized from accumulated other comprehensive loss and recognized in net income. The captions in the Combined Statements of Operations and Comprehensive Income impacted by the amortization of unrecognized prior service costs for pension plans are disclosed below. See Note G for more information.
| Six months ended March 31 |
||||||||
| (In millions) |
2016 | 2015 | ||||||
| Cost of sales |
$ | — | $ | — | ||||
| Selling, general and administrative expense |
— | 0.1 | ||||||
|
|
|
|
|
|||||
| Total amortization of unrecognized prior service costs |
$ | — | $ | 0.1 | ||||
|
|
|
|
|
|||||
F-55
Table of Contents
NOTE J – RELATED PARTY TRANSACTIONS AND ASHLAND NET INVESTMENT
Related party transactions
All significant intercompany transactions between Valvoline and Ashland have been included in the Condensed Combined Financial Statements and are considered to be effectively settled for cash in the Condensed Combined Financial Statements at the time the transaction is recorded. The total net effect of the settlement of these transactions between Valvoline and Ashland is reflected in the Condensed Combined Statements of Cash Flows as a financing activity and in the Condensed Combined Balance Sheets as Ashland’s net investment in Valvoline in lieu of stockholders’ equity. In the Combined Statements of Invested Equity, the invested equity returned to Ashland is the net of a variety of intercompany transactions including but not limited to, collection of trade receivables, payment of trade payables and accrued liabilities, settlement of charges for allocated corporate costs and payment of taxes by Ashland on Valvoline’s behalf.
Cash management and financing
Ashland uses a centralized approach to cash management. Accordingly, the cash and cash equivalents are held by Ashland at the corporate level and were not attributed to Valvoline for any of the periods presented. Transfers of cash, both to and from Ashland’s centralized cash management system, are reflected as a component of Ashland’s net investment in Valvoline on the Condensed Combined Balance Sheets and as a financing activity within the accompanying Condensed Combined Statement of Cash Flows. Debt obligations of Ashland have not been included in the Condensed Combined Financial Statements of Valvoline, because Valvoline is not a party to the obligation between Ashland and the debt holders.
Derivative instruments
Ashland regularly uses derivative instruments to manage its exposure to fluctuations in foreign currencies. Gains and losses related to a hedge are either recognized in income immediately, to offset the gain or loss on the hedged item, or deferred and recorded in the equity section of Ashland’s Consolidated Balance Sheets as a component of accumulated other comprehensive loss and subsequently recognized in Ashland’s Consolidated Statements of Operations and Comprehensive Income when the hedged item affects net income. The ineffective portion of the change in fair value of a hedge is recognized in income immediately.
Valvoline participates in Ashland’s centralized programs. As a result, no gains or losses on hedges reported as a component of the cumulative translation adjustment within accumulated other comprehensive loss are reported in the Condensed Combined Balance Sheets for any year presented.
Changes in the fair value of all derivatives are recognized immediately in income unless the derivative qualifies as a hedge of future cash flows or a hedge of a net investment in foreign operations. Expenses recognized in income have been allocated to Valvoline as part of the Corporate expense allocations.
Stock incentive plans
Valvoline has historically participated in Ashland’s stock incentive plans for key employees and directors, primarily in the form of stock appreciation rights (SARs), restricted stock, performance shares and other non-vested stock awards. Equity-based compensation expense has been either directly reported by or allocated to Valvoline based on the awards and terms previously granted to Ashland’s employees. Stock based compensation expense recorded by Valvoline during the six months ended March 31, 2016 and 2015 were $5.3 million and $4.5 million, respectively. These costs were primarily included within the Corporate expense allocation caption of the Combined Statements of Operations and Comprehensive Income. Compensation expense for stock incentive plans is generally based on the grant-date fair value over the appropriate vesting period. Ashland utilizes several industry accepted valuation models to determine the fair value. Until the separation occurs, Valvoline will continue to participate in Ashland’s equity-based compensation plans and record equity-based compensation expense based on the historical allocation of cost.
F-56
Table of Contents
NOTE J – RELATED PARTY TRANSACTIONS AND ASHLAND NET INVESTMENT (continued)
Corporate allocations and Ashland’s net investment
Corporate allocations
Valvoline utilizes centralized functions of Ashland to support its operations, and in return, Ashland allocates certain of its expenses to Valvoline. Such expenses represent costs related, but not limited to, treasury, legal, accounting, insurance, information technology, payroll administration, human resources, stock incentive plans and other services. These costs, together with an allocation of Ashland overhead costs, are included within the Corporate expense allocation caption of the Combined Statements of Operations and Comprehensive Income. Where it is possible to specifically attribute such expenses to activities of Valvoline, these amounts have been charged or credited directly to Valvoline without allocation or apportionment. Allocation of all other such expenses is based on a reasonable reflection of the utilization of service provided or benefits received by Valvoline during the periods presented on a consistent basis, such as headcount, square footage, tangible assets or sales. Valvoline’s management supports the methods used in allocating expenses and believes these methods to be reasonable estimates.
Nevertheless, the Condensed Combined Financial Statements may not include all of the actual expenses that would have been incurred and may not reflect Valvoline’s combined results of operations, financial position and cash flows had it been a stand-alone company during the periods presented. It is not practicable to estimate actual costs that would have been incurred had Valvoline been a stand-alone company during the periods presented. Actual costs that would have been incurred if Valvoline had been a stand-alone company would depend on multiple factors, including organizational structure and strategic decisions made in various areas, including information technology and infrastructure. General corporate expenses allocated to Valvoline during the six months ended March 31, 2016 and 2015 were $41.1 million and $39.2 million, respectively.
The following table summarizes the centralized and administrative support costs of Ashland that have been allocated to Valvoline.
| (In millions) |
2016 | 2015 | ||||||
| Six months ended March 31 |
||||||||
| Information technology |
$ | 10.2 | $ | 8.1 | ||||
| Financial and accounting |
6.2 | 6.5 | ||||||
| Building services |
5.6 | 5.3 | ||||||
| Legal and environmental |
3.0 | 3.4 | ||||||
| Human resources |
2.4 | 2.1 | ||||||
| Shared services |
1.2 | 0.9 | ||||||
| Other general and administrative |
12.5 | 12.9 | ||||||
|
|
|
|
|
|||||
| Total |
$ | 41.1 | $ | 39.2 | ||||
|
|
|
|
|
|||||
Ashland net investment
Disclosure of share capital or retained earnings for Valvoline has been determined to not be meaningful as the net assets are represented by Ashland’s net investment in Valvoline after eliminating investments and transactions between Valvoline, Ashland or its subsidiaries.
NOTE K – REPORTABLE SEGMENT INFORMATION
Valvoline determines its reportable segments based on how operations will be managed internally for the products and services sold to customers, including how the results will be reviewed by the chief operating decision maker, which includes determining resource allocation methodologies used for reportable segments. Valvoline’s operating segments are identical to its reportable segments. Operating income is the primary measure
F-57
Table of Contents
NOTE K – REPORTABLE SEGMENT INFORMATION (continued)
reviewed by the chief operating decision maker in assessing each reportable segment’s financial performance. Valvoline’s businesses are managed within three reportable segments: Core North America, Quick Lubes, and International.
Reportable segment business descriptions
The Core North America business segment sells Valvoline™ and other branded products in the United States and Canada to both consumers who perform their own automotive maintenance, referred to as “Do-It-Yourself” or “DIY” consumers, as well as to installer customers who use Valvoline products to service vehicles owned by “Do-It-For-Me” or “DIFM” consumers. Valvoline sells to its DIY consumers through national retail auto parts stores, leading mass merchandisers and independent auto part stores. Valvoline sells to its DIFM consumers through installers in the United States and Canada. Installer customers include car dealers, general repair shops, and third-party quick lube chains. Valvoline directly serves these customers through a network of distributors. Valvoline’s installer channel also sells branded products and solutions to heavy duty customers such as on-highway fleets and construction companies.
Through its Quick Lubes business segment, Valvoline operates Valvoline Instant Oil Change (VIOC), a quick-lube service chain involving both Company-owned and franchised stores. Valvoline also sells products and provides Valvoline branded signage to independent quick lube operators through its Express Care program.
The International business segment sells Valvoline™ and Valvoline’s other branded products in approximately 140 countries outside of the United States and Canada. Valvoline’s key international markets include China, India, EMEA, Latin America and Australia Pacific. The International business segment sells products for both consumer and commercial vehicles and equipment, and is served by company-owned plants in the United States, Australia and the Netherlands, a joint venture-owned plant in India and third-party warehouses and toll manufacturers in other regions. In most of the countries where Valvoline’s products are sold, Valvoline goes to market via independent distributors.
Unallocated and other generally includes items such as components of pension and other postretirement benefit plan expenses (excluding service costs, which are allocated to the reportable segments), certain significant company-wide restructuring activities and legacy costs or adjustments that relate to divested businesses, including the $26.0 million impairment of car care products during the six months ended March 31, 2015.
Reportable segment results
The following tables present various financial information for each reportable segment for the six months ended March 31, 2016 and 2015. Results of Valvoline’s reportable segments are presented based on how operations will be managed internally for the products and services sold to customers, including how the results will be reviewed by the chief operating decision maker, which includes determining resource allocation methodologies used for reportable segments. The structure and practices are specific to Valvoline; therefore, the financial results of Valvoline’s reportable segments are not necessarily comparable with similar information for other comparable companies. Valvoline allocates all costs to its reportable segments except for certain significant company-wide restructuring activities, such as the restructuring plans and/or other costs or adjustments that relate to former businesses that Valvoline no longer operates. The service cost component of pension and other postretirement benefits costs is allocated to each reportable segment on a ratable basis; while the remaining components of pension and other postretirement benefits costs are recorded to Unallocated and other. Valvoline refines its expense allocation methodologies to the reportable segments from time to time as internal accounting practices are improved, more refined information becomes available and the industry or market changes. Revisions to Valvoline’s methodologies that are deemed insignificant are applied on a prospective basis.
F-58
Table of Contents
NOTE K – REPORTABLE SEGMENT INFORMATION (continued)
The following table presents various financial information for each reportable segment.
| (In millions) |
For the six months ended March 31 |
|||||||
| 2016 | 2015 | |||||||
| Sales |
||||||||
| Core North America |
$ | 478.5 | $ | 534.1 | ||||
| Quick Lubes |
223.0 | 191.7 | ||||||
| International |
234.2 | 247.6 | ||||||
|
|
|
|
|
|||||
| $ | 935.7 | $ | 973.4 | |||||
|
|
|
|
|
|||||
| Operating Income |
||||||||
| Core North America |
$ | 110.6 | $ | 101.7 | ||||
| Quick Lubes |
54.3 | 44.1 | ||||||
| International |
32.8 | 20.6 | ||||||
| Unallocated and other (a) |
2.3 | 2.5 | ||||||
|
|
|
|
|
|||||
| $ | 200.0 | $ | 168.9 | |||||
|
|
|
|
|
|||||
| (a) | During the six months ended March 31, 2016 and 2015, Unallocated and other also includes a loss of $4.7 million and a loss of $2.0 million respectively, related to the actuarial remeasurements of pension and other postretirement benefit plans. |
F-59
Table of Contents
Through and including , 2016, (the 25th day after the date of this prospectus), all dealers effecting transactions in the common stock, whether or not participating in this offering, may be required to deliver a prospectus. This delivery requirement is in addition to a dealer’s obligation to deliver a prospectus when acting as an underwriter and with respect to an unsold allotment or subscription.
Shares
Valvoline Inc.
Common Stock
PROSPECTUS
| BofA Merrill Lynch | Citigroup | Morgan Stanley |
, 2016
Table of Contents
PART II
INFORMATION NOT REQUIRED IN PROSPECTUS
| Item 13. | Other Expenses of Issuance. |
The following table sets forth the various expenses, other than underwriting discounts and commissions, payable in connection with the offering contemplated by this registration statement. All of the fees set forth below are estimates except for the SEC registration fee, the FINRA fee and the stock exchange listing fee.
| Payable by the registrant |
||||
| SEC registration fee |
$ | 10,070 | ||
| FINRA fee |
15,500 | |||
| Stock exchange listing fee |
||||
| Blue Sky fees and expenses |
||||
| Printing Expenses |
||||
| Legal fees and expenses |
||||
| Accounting fees and expenses |
||||
| Transfer agent and registrar fees |
||||
| Miscellaneous fees and expenses |
||||
|
|
|
|||
| Total |
$ | |||
|
|
|
|||
| Item 14. | Indemnification of Directors and Officers. |
Section 271B.2-020 of the KBCA permits a corporation to eliminate or limit the personal liability of its directors for monetary damages for breach of fiduciary duty as a director; provided that such a provision does not eliminate or limit the liability of directors for (i) transactions in which the director’s personal financial interest is in conflict with the financial interests of the corporation or its shareholders; (ii) acts or omissions that are not taken in good faith, that involve intentional misconduct or that are known to the director to be a violation of law; (iii) a vote for or assent to certain unlawful distributions to shareholders; or (iv) any transaction from which the director derived an improper personal benefit. Our amended and restated articles of incorporation will include a provision limiting the liability of our directors to the fullest extent permitted by Kentucky law.
Section 271B.8-510 of the KBCA generally permits a corporation to indemnify an individual who is made a party to a proceeding because the individual is or was a director or officer of the corporation as long as the individual (i) conducted himself or herself in good faith; (ii) reasonably believed, in the case of conduct in his or her official capacity with the corporation, that the conduct was in the best interest of the corporation or, in all other cases, was at least not opposed to its best interest; and (iii) in a criminal proceeding, had no reasonable cause to believe that the conduct was unlawful. Indemnification may be made against the obligation to pay a judgment, settlement, penalty, fine or reasonable expenses (including counsel fees) incurred with respect to a proceeding, except that if the proceeding was by or in the right of the corporation, indemnification may only be made against reasonable expenses. A determination that indemnification is permitted by the terms of the KBCA must first be made before a director or officer can be indemnified. Section 271B.8-510 of the KBCA specifically prohibits indemnification (i) in connection with a proceeding by or in the right of the corporation in which the director or officer is held liable to the corporation or (ii) in connection with any other proceeding where the director or officer is adjudged to have received an improper personal benefit, in each case, unless the applicable court determines that indemnification is appropriate.
In addition, Section 271B.8-520 of the KBCA provides that, unless limited by the articles of incorporation, a corporation shall indemnify any director or officer who is wholly successful in the defense of any proceeding to which the individual was a party because he or she is or was a director or officer of the corporation against reasonable expenses incurred in connection with the proceeding.
II-1
Table of Contents
Our amended and restated articles of incorporation will permit, and our amended and restated by-laws will generally require, that we indemnify our directors and officers to the fullest extent permitted under Kentucky or other applicable law. The right to be indemnified will, unless determined by us not to be in our best interests, include the right of a director or officer to be paid expenses, including attorneys’ fees, in advance of the final disposition of any proceeding; provided that, if required by law or by us in our discretion, we receive an undertaking to repay such amount if it is ultimately determined that he or she is not entitled to be indemnified.
We also expect to maintain directors’ and officers’ insurance, and we intend to enter into indemnification agreements with each of our directors and executive employment contracts with certain of our executive officers that require indemnification, subject to certain exceptions and limitations.
The above summary of the KBCA, our amended and restated articles of incorporation and our amended and restated by-laws is not intended to be exhaustive and is qualified by reference to the full text of our amended and restated articles of incorporation and amended and restated by-laws, the forms of which will be filed as exhibits to this registration statement, as well as the applicable provisions of Kentucky law.
| Item 15. | Recent Sales of Unregistered Securities. |
In the three years preceding the filing of this registration statement, the registrant has issued the following securities that were not registered under the Securities Act:
None.
| Item 16. | Exhibits and Financial Statement Schedules. |
| A. | Exhibits: |
| Exhibit |
Exhibit Description | |
| 1.1 | Form of Underwriting Agreement* | |
| 3.1 | Form of Amended and Restated Certificate of Incorporation of the Registrant* | |
| 3.2 | Form of Amended and Restated By-laws of the Registrant* | |
| 4.1 | Specimen Common Stock Certificate* | |
| 5.1 | Opinion of Dinsmore & Shohl LLP * | |
| 10.1 | Form of Separation Agreement* | |
| 10.2 | Form of Transition Services Agreement* | |
| 10.3 | Form of Reverse Transition Services Agreement* | |
| 10.4 | Form of Tax Matters Agreement* | |
| 10.5 | Form of Employee Matters Agreement* | |
| 10.6 | Registration Rights Agreement* | |
| 21.1 | List of subsidiaries of the Registrant* | |
| 23.1 | Consent of Ernst & Young LLP | |
| 23.2 | Consent of Ernst & Young LLP | |
| 23.3 | Consent of Pricewaterhouse Coopers LLP | |
| 23.4 | Consent of Dinsmore & Shohl LLP (included in Exhibit 5.1)* | |
| * | To be filed by amendment. |
II-2
Table of Contents
| B. | Financial Statement Schedules: |
None.
| Item 17. | Undertakings. |
The undersigned hereby undertakes as follows:
(a) to provide to the underwriters at the closing specified in the underwriting agreement certificates in such denominations and registered in such names as required by the underwriters to permit prompt delivery to each purchaser.
(b) Insofar as indemnification for liabilities arising under the Securities Act of 1933 may be permitted to directors, officers and controlling persons of the registrant pursuant to the foregoing provisions or otherwise, the registrant has been advised that in the opinion of the Securities and Exchange Commission such indemnification is against public policy as expressed in the Act and is, therefore, unenforceable. In the event that a claim for indemnification against such liabilities (other than the payment by the registrant of expenses incurred or paid by a director, officer or controlling person of the registrant in the successful defense of any action, suit or proceeding) is asserted by such director, officer or controlling person in connection with the securities being registered, the registrant will, unless in the opinion of its counsel the matter has been settled by controlling precedent, submit to a court of appropriate jurisdiction the question of whether such indemnification by it is against public policy as expressed in the Act, and will be governed by the final adjudication of such issue.
(c)(1) For purposes of determining any liability under the Securities Act of 1933, the information omitted from the form of prospectus filed as part of this registration statement in reliance upon Rule 430A and contained in a form of prospectus filed by us pursuant to Rule 424(b)(1) or (4) or 497(h) under the Securities Act shall be deemed to be part of this registration statement as of the time it was declared effective.
(2) For the purpose of determining any liability under the Securities Act of 1933, each post-effective amendment that contains a form of prospectus shall be deemed to be a new registration statement relating to the securities offered therein and the offering of such securities at that time shall be deemed to be the initial bona fide offering thereof.
II-3
Table of Contents
SIGNATURES
Pursuant to the requirements of the Securities Act, the registrant has duly caused this registration statement to be signed on its behalf by the undersigned, thereunto duly authorized, in the City of Lexington, Commonwealth of Kentucky, on May 31, 2016.
| VALVOLINE INC. | ||
| By: | /s/ Julie M. O’Daniel | |
| Name: | Julie M. O’Daniel | |
| Title: | President | |
Pursuant to the requirements of the Securities Act, this registration statement has been signed by the following persons in the capacities indicated.
| Signature | Title | Date | ||
| /s/ Julie M. O’Daniel Julie M. O’Daniel |
President (Principal Executive Officer) | May 31, 2016 | ||
| /s/ Jason L. Thompson Jason L. Thompson |
Treasurer (Principal Financial Officer and Principal Accounting Officer)
|
May 31, 2016 | ||
| /s/ Samuel J. Mitchell, Jr. Samuel J. Mitchell, Jr. |
Director | May 31, 2016 | ||
| /s/ William A. Wulfsohn William A. Wulfsohn |
Director | May 31, 2016 | ||
| /s/ Peter J. Ganz Peter J. Ganz |
Director | May 31, 2016 | ||
| /s/ J. Kevin Willis J. Kevin Willis |
Director | May 31, 2016 | ||
II-4
Table of Contents
EXHIBIT INDEX
| Exhibit |
Exhibit Description | |
| 1.1 | Form of Underwriting Agreement* | |
| 3.1 | Form of Amended and Restated Certificate of Incorporation of the Registrant* | |
| 3.2 | Form of Amended and Restated By-laws of the Registrant* | |
| 4.1 | Specimen Common Stock Certificate* | |
| 5.1 | Opinion of Dinsmore & Shohl LLP* | |
| 10.1 | Form of Separation Agreement* | |
| 10.2 | Form of Transition Services Agreement* | |
| 10.3 | Form of Reverse Transition Services Agreement* | |
| 10.4 | Form of Tax Matters Agreement* | |
| 10.5 | Form of Employee Matters Agreement* | |
| 10.6 | Registration Rights Agreement* | |
| 21.1 | List of subsidiaries of the Registrant* | |
| 23.1 | Consent of Ernst & Young LLP | |
| 23.2 | Consent of Ernst & Young LLP | |
| 23.3 | Consent of Pricewaterhouse Coopers LLP | |
| 23.4 | Consent of Dinsmore & Shohl LLP (contained in its opinion filed as Exhibit 5.1 hereto)* | |
| * | To be filed by amendment. |
II-5