Attached files
| file | filename |
|---|---|
| EX-3.2 - EXHIBIT 3.2 - SURREY BANCORP | ex3_2.htm |
| EX-3.1 - EXHIBIT 3.1 - SURREY BANCORP | ex3_1.htm |
| 8-K - SURREY BANCORP 8-K 5-27-2016 - SURREY BANCORP | form8k.htm |
Exhibit 99.1

2016AnnualStockholders’ Meeting

2 Total Assets (millions)(Annual Increase of $4.6 million or 1.81%)
2

3 Total Loans (millions)(Annual Increase of $8.4 million or 4.36%)
3

4 Loan Mix – December 31, 2015 Approximately $62,562,000, or 31.07%, of the total loans are government guaranteed loans. The Bank’s exposure ranges from 10% to 49% of the outstanding government guaranteed loan balance at December 31, 2015, or approximately $12,833,000.
4

5 Total Deposits (millions) (Annual Increase of $6.0 million or 2.91%)
5

6 Deposit Mix – 2015(percent of total)
6

7 Loans to Deposits(millions)(0.95:1)
7

8 Risk Based Capital Ratio
8

9 Risk Based Capital Requirements(thousands)
9

Non-Performing Assets to Total Assets 10 Non-performing assets include nonaccrual loans, loans past due 90 days or more and still accruing interest, troubled debt restructured loans and foreclosed assets.
10
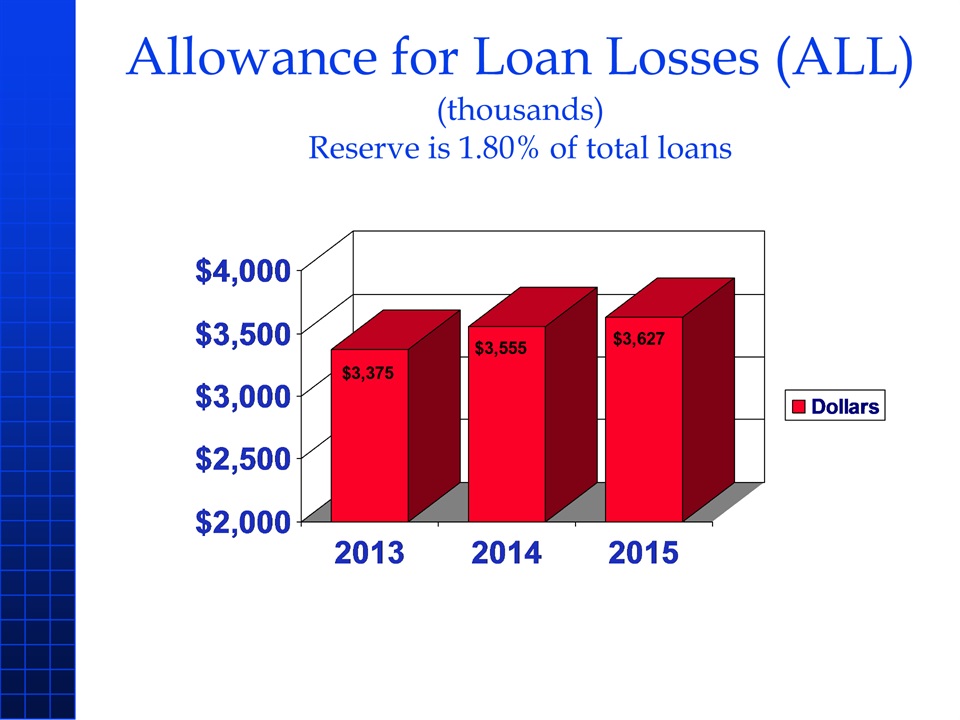
11 Allowance for Loan Losses (ALL) (thousands)Reserve is 1.80% of total loans
11

12 Net Interest Income After ALL (thousands) (Annual Increase of $472 thousand or 5.10%)
12

13 Net Yield on Interest-Earning Assets The net yield on interest-earning assets is computed as the yield on average interest-earning assets less the cost of average interest-bearing liabilities.
13

14 Non-interest Income (thousands)(Annual Decrease of $537 thousand or 16.50%)
14

15 Sources of Non-interest Income (Percent of total)
15

16 Non-interest Expense (thousands)(Annual Increase of $343 thousand or 4.69%)
16

17 Surrey Bank & Trust Net Income (thousands)Annual Decrease of $316 thousand or 9.74%
17

18 SIS Net Income (thousands)Annual Decrease of $7.8 thousand or 16.93%
18
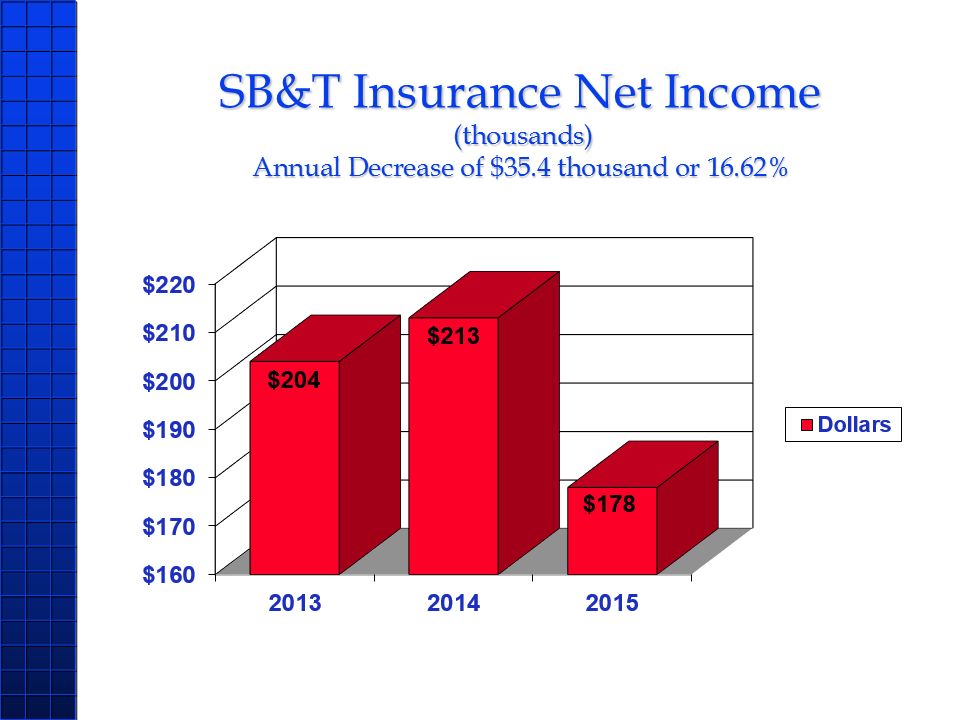
19 SB&T Insurance Net Income (thousands)Annual Decrease of $35.4 thousand or 16.62%
19

20 Freedom Finance, LLC Net Income (thousands)Annual Decrease of $31.4 thousand or 123.85%
20

21 Consolidated Net Income (thousands)(Annual Decrease of $382 thousand or 11.11%)
21

22 Fully Diluted Earnings Per Common Share
22

23 Book Value Per Common Share$9.80 per share at December 31, 2015
23

24 Return on Average Assets (ROAA)
24

25 Return on Average Equity (ROAE)
25