Attached files
| file | filename |
|---|---|
| EX-32.1 - EXHIBIT 32.1 - EnerSys | exhibit321_4qxfy16.htm |
| EX-31.2 - EXHIBIT 31.2 - EnerSys | exhibit312_4qxfy16.htm |
| EX-31.1 - EXHIBIT 31.1 - EnerSys | exhibit311_4qxfy16.htm |
| EX-23.1 - EXHIBIT 23.1 - EnerSys | exhibit231_4qxfy16.htm |
| EX-21.1 - EXHIBIT 21.1 - EnerSys | exhibit211_4qxfy16.htm |
| EX-12.1 - EXHIBIT 12.1 - EnerSys | exhibit121_4qxfy16.htm |
| EX-10.49 - EXHIBIT 10.49 - EnerSys | exhibit1049_4qxfy16.htm |
| EX-10.48 - EXHIBIT 10.48 - EnerSys | exhibit1048_4qxfy16.htm |
| EX-10.47 - EXHIBIT 10.47 - EnerSys | exhibit1047_4qxfy16.htm |
| EX-10.46 - EXHIBIT 10.46 - EnerSys | exhibit1046_4qxfy16.htm |
UNITED STATES
SECURITIES AND EXCHANGE COMMISSION
WASHINGTON, D.C. 20549
FORM 10-K
ý | Annual report pursuant to Section 13 or 15(d) of the Securities Exchange Act of 1934 for the fiscal year ended March 31, 2016 or |
¨ | Transition report pursuant to Section 13 or 15(d) of the Securities Exchange Act of 1934 for the transition period from to |
Commission file number: 001-32253
ENERSYS
(Exact name of registrant as specified in its charter)
Delaware | 23-3058564 | |
(State or other jurisdiction of incorporation or organization) | (I.R.S. Employer Identification No.) | |
2366 Bernville Road
Reading, Pennsylvania 19605
(Address of principal executive offices) (Zip Code)
Registrant’s telephone number, including area code: 610-208-1991
Securities registered pursuant to Section 12(b) of the Act:
Title of each class | Name of each exchange on which registered | |
Common Stock, $0.01 par value per share | New York Stock Exchange | |
Securities registered pursuant to Section 12(g) of the Act: None
Indicate by check mark if the registrant is a well-known seasoned issuer, as defined in Rule 405 of the Securities Act. ý YES ¨ NO
Indicate by check mark if the registrant is not required to file reports pursuant to Section 13 or Section 15(d) of the Act. ¨ YES ý NO
Indicate by check mark whether the registrant (1) has filed all reports required to be filed by Section 13 or 15(d) of the Securities Exchange Act of 1934 during the preceding 12 months (or for such shorter period that the registrant was required to file such reports), and (2) has been subject to such filing requirements for the past 90 days. ý YES ¨ NO
Indicate by check mark whether the registrant has submitted electronically and posted on its corporate Web site, if any, every Interactive Data File required to be submitted and posted pursuant to Rule 405 of Regulation S-T (Section 232.405 of this chapter) during the preceding 12 months (or for such shorter period that the registrant was required to submit and post such files). YES ý NO ¨
Indicate by check mark if disclosure of delinquent filers pursuant to Item 405 of Regulation S-K (Section 229.405 of this chapter) is not contained herein, and will not be contained, to the best of registrant’s knowledge, in definitive proxy or information statements incorporated by reference in Part III of this Form 10-K or any amendment to this Form 10-K. ¨
Indicate by check mark whether the registrant is a large accelerated filer, an accelerated filer, a non-accelerated filer, or a smaller reporting company. See definitions of “large accelerated filer,” “accelerated filer” and “smaller reporting company” in Rule 12b-2 of the Exchange Act.
1
Large accelerated filer x | Accelerated filer ¨ | |
Non-accelerated filer ¨ | Smaller reporting company ¨ | |
(Do not check if a smaller reporting company) | ||
Indicate by check mark whether the registrant is a shell company (as defined in Rule 12b-2 of the Act). ¨ YES ý NO
State the aggregate market value of the voting and non-voting common equity held by non-affiliates at September 27, 2015: $2,273,628,924 (1) (based upon its closing transaction price on the New York Stock Exchange on September 25, 2015).
(1) | For this purpose only, “non-affiliates” excludes directors and executive officers. |
Common stock outstanding at May 27, 2016: 43,260,603 Shares of Common Stock
DOCUMENTS INCORPORATED BY REFERENCE
Portions of the registrant’s definitive Proxy Statement for its Annual Meeting of Stockholders to be held on July 28, 2016 are incorporated by reference in Part III of this Annual Report.
2
CAUTIONARY NOTE REGARDING FORWARD-LOOKING STATEMENTS
The Private Securities Litigation Reform Act of 1995 (the “Reform Act”) provides a safe harbor for forward-looking statements made by or on behalf of EnerSys. EnerSys and its representatives may, from time to time, make written or verbal forward-looking statements, including statements contained in EnerSys' filings with the Securities and Exchange Commission ("SEC") and its reports to stockholders. Generally, the inclusion of the words “anticipates,” “believe,” “expect,” “future,” “intend,” “estimate,” “anticipate,” “will,” “plans,” or the negative of such terms and similar expressions identify statements that constitute “forward-looking statements” within the meaning of Section 27A of the Securities Act of 1933 and Section 21E of the Securities Exchange Act of 1934 and that are intended to come within the safe harbor protection provided by those sections. All statements addressing operating performance, events, or developments that EnerSys expects or anticipates will occur in the future, including statements relating to sales growth, earnings or earnings per share growth, and market share, as well as statements expressing optimism or pessimism about future operating results, are forward-looking statements within the meaning of the Reform Act. The forward-looking statements are and will be based on management’s then-current beliefs and assumptions regarding future events and operating performance and on information currently available to management, and are applicable only as of the dates of such statements.
Forward-looking statements involve risks, uncertainties and assumptions. Although we do not make forward-looking statements unless we believe we have a reasonable basis for doing so, we cannot guarantee their accuracy. Actual results may differ materially from those expressed in these forward-looking statements due to a number of uncertainties and risks, including the risks described in this Annual Report on Form 10-K and other unforeseen risks. You should not put undue reliance on any forward-looking statements. These statements speak only as of the date of this Annual Report on Form 10-K, even if subsequently made available by us on our website or otherwise, and we undertake no obligation to update or revise these statements to reflect events or circumstances occurring after the date of this Annual Report on Form 10-K.
Our actual results may differ materially from those contemplated by the forward-looking statements for a number of reasons, including the following factors:
• | general cyclical patterns of the industries in which our customers operate; |
• | the extent to which we cannot control our fixed and variable costs; |
• | the raw materials in our products may experience significant fluctuations in market price and availability; |
• | certain raw materials constitute hazardous materials that may give rise to costly environmental and safety claims; |
• | legislation regarding the restriction of the use of certain hazardous substances in our products; |
• | risks involved in our operations such as disruption of markets, changes in import and export laws, environmental regulations, currency restrictions and local currency exchange rate fluctuations; |
• | our ability to raise our selling prices to our customers when our product costs increase; |
• | the extent to which we are able to efficiently utilize our global manufacturing facilities and optimize our capacity; |
• | general economic conditions in the markets in which we operate; |
• | competitiveness of the battery markets and other energy solutions for industrial applications throughout the world; |
• | our timely development of competitive new products and product enhancements in a changing environment and the acceptance of such products and product enhancements by customers; |
• | our ability to adequately protect our proprietary intellectual property, technology and brand names; |
• | litigation and regulatory proceedings to which we might be subject; |
• | our expectations concerning indemnification obligations; |
• | changes in our market share in the geographic business segments where we operate; |
• | our ability to implement our cost reduction initiatives successfully and improve our profitability; |
• | quality problems associated with our products; |
• | our ability to implement business strategies, including our acquisition strategy, manufacturing expansion and restructuring plans; |
• | our acquisition strategy may not be successful in locating advantageous targets; |
• | our ability to successfully integrate any assets, liabilities, customers, systems and management personnel we acquire into our operations and our ability to realize related revenue synergies and cost savings within expected time frames; |
• | potential goodwill impairment charges, future impairment charges and fluctuations in the fair values of reporting units or of assets in the event projected financial results are not achieved within expected time frames; |
• | our debt and debt service requirements which may restrict our operational and financial flexibility, as well as imposing unfavorable interest and financing costs; |
• | our ability to maintain our existing credit facilities or obtain satisfactory new credit facilities; |
• | adverse changes in our short- and long-term debt levels under our credit facilities; |
• | our exposure to fluctuations in interest rates on our variable-rate debt; |
• | our ability to attract and retain qualified management and personnel; |
3
• | our ability to maintain good relations with labor unions; |
• | credit risk associated with our customers, including risk of insolvency and bankruptcy; |
• | our ability to successfully recover in the event of a disaster affecting our infrastructure; |
• | terrorist acts or acts of war, could cause damage or disruption to our operations, our suppliers, channels to market or customers, or could cause costs to increase, or create political or economic instability; and |
• | the operation, capacity and security of our information systems and infrastructure. |
This list of factors that may affect future performance is illustrative, but by no means exhaustive. Accordingly, all forward-looking statements should be evaluated with the understanding of their inherent uncertainty.
4
EnerSys
Annual Report on Form 10-K
For the Fiscal Year Ended March 31, 2016
Index
Page | ||
Item 1. | ||
Item 1A. | ||
Item 1B. | ||
Item 2. | ||
Item 3. | ||
Item 4. | ||
Item 5. | ||
Item 6. | ||
Item 7. | ||
Item 7A. | ||
Item 8. | ||
Item 9. | ||
Item 9A. | ||
Item 9B. | ||
Item 10. | ||
Item 11. | ||
Item 12. | ||
Item 13. | ||
Item 14. | ||
Item 15. | ||
5
PART I
ITEM 1. | BUSINESS |
Overview
EnerSys (the “Company,” “we,” or “us”) is the world’s largest manufacturer, marketer and distributor of industrial batteries. We also manufacture, market and distribute related products such as chargers, power equipment, outdoor cabinet enclosures and battery accessories, and we provide related after-market and customer-support services for industrial batteries. We market and sell our products globally to over 10,000 customers in more than 100 countries through a network of distributors, independent representatives and our internal sales force.
We operate and manage our business in three geographic regions of the world—Americas, EMEA and Asia, as described below. Our business is highly decentralized with manufacturing locations throughout the world. More than half of our manufacturing capacity is located outside of the United States, and approximately 50% of our net sales were generated outside of the United States. The Company has three reportable segments based on geographic regions, defined as follows:
• | Americas, which includes North and South America, with our segment headquarters in Reading, Pennsylvania, USA; |
• | EMEA, which includes Europe, the Middle East and Africa, with our segment headquarters in Zug, Switzerland; and |
• | Asia, which includes Asia, Australia and Oceania, with our segment headquarters in Singapore. |
We have two primary product lines: reserve power and motive power products. Net sales classifications by product line are as follows:
• | Reserve power products are used for backup power for the continuous operation of critical applications in telecommunications systems, uninterruptible power systems, or “UPS” applications for computer and computer-controlled systems, and other specialty power applications, including security systems, premium starting, lighting and ignition applications, in switchgear, electrical control systems used in electric utilities, large-scale energy storage, energy pipelines, in commercial aircraft, satellites, military aircraft, submarines, ships and tactical vehicles. Reserve power products also include thermally managed cabinets and enclosures for electronic equipment and batteries. |
• | Motive power products are used to provide power for electric industrial forklifts used in manufacturing, warehousing and other material handling applications as well as mining equipment, diesel locomotive starting and other rail equipment. |
Additionally, see Note 22 to the Consolidated Financial Statements for information on segment reporting.
Fiscal Year Reporting
In this Annual Report on Form 10-K, when we refer to our fiscal years, we state “fiscal” and the year, as in “fiscal 2016”, which refers to our fiscal year ended March 31, 2016. The Company reports interim financial information for 13-week periods, except for the first quarter, which always begins on April 1, and the fourth quarter, which always ends on March 31. The four quarters in fiscal 2016 ended on June 28, 2015, September 27, 2015, December 27, 2015, and March 31, 2016, respectively. The four quarters in fiscal 2015 ended on June 29, 2014, September 28, 2014, December 28, 2014, and March 31, 2015, respectively.
History
EnerSys and its predecessor companies have been manufacturers of industrial batteries for over 125 years. Morgan Stanley Capital Partners teamed with the management of Yuasa, Inc. in late 2000 to acquire from Yuasa Corporation (Japan) its reserve power and motive power battery businesses in North and South America. We were incorporated in October 2000 for the purpose of completing the Yuasa, Inc. acquisition. On January 1, 2001, we changed our name from Yuasa, Inc. to EnerSys to reflect our focus on the energy systems nature of our businesses.
In 2004, EnerSys completed its initial public offering (the “IPO”) and the Company’s common stock commenced trading on the New York Stock Exchange, under the trading symbol “ENS”.
6
Key Developments
There have been several key stages in the development of our business, which explain to a significant degree our results of operations over the past several years.
In March 2002, we acquired the reserve power and motive power business of the Energy Storage Group of Invensys plc. (“ESG”). Our successful integration of ESG provided global scale in both the reserve and motive power markets. The ESG acquisition also provided us with a further opportunity to reduce costs and improve operating efficiency that, among other initiatives, led to closing underutilized manufacturing plants, distribution facilities, sales offices and eliminating other redundant costs, including staff.
During fiscal years 2003 through 2015, we made twenty-five acquisitions around the globe. In fiscal 2016, we completed the acquisition of ICS Industries Pty. Ltd. (ICS), headquartered in Melbourne, Australia. ICS is a leading full line shelter designer and manufacturer with installation and maintenance services serving the telecommunications, utilities, datacenter, natural resources and transport industries operating in Australia and serving customers in the Asia Pacific region.
Our Customers
We serve over 10,000 customers in over 100 countries, on a direct basis or through our distributors. We are not overly dependent on any particular end market. Our customer base is highly diverse and no single customer accounts for more than 5% of our revenues.
Our reserve power customers consist of both global and regional customers. These customers are in diverse markets including telecom, UPS, electric utilities, security systems, emergency lighting, premium starting, lighting and ignition applications and space satellites. In addition, we sell our aerospace and defense products in numerous countries, including the governments of the U.S., Germany and the U.K. and to major defense and aviation original equipment manufacturers (“OEMs”).
Our motive power products are sold to a large, diversified customer base. These customers include material handling equipment dealers, OEMs and end users of such equipment. End users include manufacturers, distributors, warehouse operators, retailers, airports, mine operators and railroads.
Distribution and Services
We distribute, sell and service reserve and motive power products throughout the world, principally through company-owned sales and service facilities, as well as through independent manufacturers’ representatives. Our company-owned network allows us to offer high-quality service, including preventative maintenance programs and customer support. Our warehouses and service locations enable us to respond quickly to customers in the markets we serve. We believe that the extensive industry experience of our sales organization results in strong long-term customer relationships.
Manufacturing and Raw Materials
We manufacture and assemble our products at manufacturing facilities located in the Americas, EMEA and Asia. With a view toward projected demand, we strive to optimize and balance capacity at our battery manufacturing facilities globally, while simultaneously minimizing our product cost. By taking a global view of our manufacturing requirements and capacity, we believe we are better able to anticipate potential capacity bottlenecks and equipment and capital funding needs.
The primary raw materials used to manufacture our products include lead, plastics, steel and copper. We purchase lead from a number of leading suppliers throughout the world. Because lead is traded on the world’s commodity markets and its price fluctuates daily, we periodically enter into hedging arrangements for a portion of our projected requirements to reduce the volatility of our costs.
Competition
The industrial battery market is highly competitive both among competitors who manufacture and sell industrial batteries and among customers who purchase industrial batteries. Our competitors range from development stage companies to large domestic and international corporations. Certain of our competitors produce energy storage products utilizing technologies that we do not possess at this time. We compete primarily on the basis of reputation, product quality, reliability of service, delivery and price. We believe that our products and services are competitively priced.
7
Americas
We believe that we have the largest market share in the Americas industrial battery market. We compete principally with East Penn Manufacturing, Exide Technologies and New Power in both the reserve and motive products markets; and also C&D Technologies Inc., EaglePicher (OM Group), NorthStar Battery, SAFT as well as Chinese producers in the reserve products market.
EMEA
We believe that we have the largest market share in the European industrial battery market. Our primary competitors are Exide Technologies, FIAMM, Hoppecke, SAFT as well as Chinese producers in the reserve products market; and Eternity, Exide Technologies, Hoppecke, Midac and TAB in the motive products market.
Asia
We have a small share of the fragmented Asian industrial battery market. We compete principally with GS-Yuasa, Shin-Kobe and Zibo Torch in the motive products market; and Amara Raja, China Shoto, Coslight, Exide Industries, Leoch and Narada, in the reserve products market.
Warranties
Warranties for our products vary geographically and by product type and are competitive with other suppliers of these types of products. Generally, our reserve power product warranties range from one to twenty years and our motive power product warranties range from one to seven years. The length of our warranties is varied to reflect regional characteristics and competitive influences. In some cases, our warranty period may include a pro rata period, which is typically based around the design life of the product and the application served. Our warranties generally cover defects in workmanship and materials and are limited to specific usage parameters.
Intellectual Property
We have numerous patents and patent licenses in the United States and other jurisdictions but do not consider any one patent to be material to our business. From time to time, we apply for patents on new inventions and designs, but we believe that the growth of our business will depend primarily upon the quality of our products and our relationships with our customers, rather than the extent of our patent protection.
We believe we are leaders in thin plate pure lead technology ("TPPL"). Some aspects of this technology may be patented in the future. We believe that a significant capital investment would be required by any party desiring to produce products using TPPL technology for our markets.
We own or possess exclusive and non-exclusive licenses and other rights to use a number of trademarks in various jurisdictions. We have obtained registrations for many of these trademarks in the United States and other jurisdictions. Our various trademark registrations currently have durations of approximately 10 to 20 years, varying by mark and jurisdiction of registration and may be renewable. We endeavor to keep all of our material registrations current. We believe that many such rights and licenses are important to our business by helping to develop strong brand-name recognition in the marketplace.
Seasonality
Our business generally does not experience significant quarterly fluctuations in net sales as a result of weather or other trends that can be directly linked to seasonality patterns, but historically our fourth quarter is our best quarter with higher revenues and generally more working days and our second quarter is the weakest due to the summer holiday season in Western Europe and Americas.
Product and Process Development
Our product and process development efforts are focused on the creation and optimization of new battery products using existing technologies, which, in certain cases, differentiate our stored energy solutions from that of our competition. We allocate our resources to the following key areas:
• | the design and development of new products; |
8
• | optimizing and expanding our existing product offering; |
• | waste and scrap reduction; |
• | production efficiency and utilization; |
• | capacity expansion without additional facilities; and |
• | quality attribute maximization. |
Employees
At March 31, 2016, we had approximately 9,400 employees. Of these employees, approximately 29% were covered by collective bargaining agreements. Employees covered by collective bargaining agreements that did not exceed twelve months were approximately 7% of the total workforce. The average term of these agreements is two years, with the longest term being three years. We consider our employee relations to be good. We did not experience any significant labor unrest or disruption of production during fiscal 2016.
Environmental Matters
In the manufacture of our products throughout the world, we process, store, dispose of and otherwise use large amounts of hazardous materials, especially lead and acid. As a result, we are subject to extensive and evolving environmental, health and safety laws and regulations governing, among other things: the generation, handling, storage, use, transportation and disposal of hazardous materials; emissions or discharges of hazardous materials into the ground, air or water; and the health and safety of our employees. In addition, we are required to comply with the regulation issued from the European Union called Registration, Evaluation, Authorization and Restriction of Chemicals or “REACH,” that came into force on June 1, 2007. Under the regulation, companies which manufacture or import more than one ton of a covered chemical substance per year are required to register it in a central database administered by the European Chemicals Agency. REACH requires a registration over a period of 11 years. Compliance with these laws and regulations results in ongoing costs. Failure to comply with these laws and regulations, or to obtain or comply with required environmental permits, could result in fines, criminal charges or other sanctions by regulators. From time to time, we have had instances of alleged or actual noncompliance that have resulted in the imposition of fines, penalties and required corrective actions. Our ongoing compliance with environmental, health and safety laws, regulations and permits could require us to incur significant expenses, limit our ability to modify or expand our facilities or continue production and require us to install additional pollution control equipment and make other capital improvements. In addition, private parties, including current or former employees, can bring personal injury or other claims against us due to the presence of, or their exposure to, hazardous substances used, stored, transported or disposed of by us or contained in our products.
Sumter, South Carolina
We currently are responsible for certain environmental obligations at our former battery facility in Sumter, South Carolina, that predate our ownership of this facility. This battery facility was closed in 2001 and is separate from our current metal fabrication facility in Sumter. We have a reserve for this facility that totaled $1.1 million as of March 31, 2016. Based on current information, we believe this reserve is adequate to satisfy our environmental liabilities at this facility.
Environmental and safety certifications
Sixteen of our facilities in the Americas, EMEA and Asia are certified to ISO 14001 standards. ISO 14001 is a globally recognized, voluntary program that focuses on the implementation, maintenance and continual improvement of an environmental management system and the improvement of environmental performance. Seven facilities in Europe and one in Africa are certified to OHSAS 18001 standards. OHSAS 18001 is a globally recognized occupational health and safety management systems standard.
Quality Systems
We utilize a global strategy for quality management systems, policies and procedures, the basis of which is the ISO 9001:2008 standard, which is a worldwide recognized quality standard. We believe in the principles of this standard and reinforce this by requiring mandatory compliance for all manufacturing, sales and service locations globally that are registered to the ISO 9001 standard. This strategy enables us to provide consistent quality products and services to meet our customers’ needs.
9
Available Information
We file annual, quarterly and current reports, proxy statements and other information with the SEC. These filings are available to the public on the Internet at the SEC’s website at http://www.sec.gov. You may also read and copy any document we file with the SEC at the SEC’s public reference room, located at 100 F Street, N.E., Room 1580, Washington, D.C. 20549. Please call the SEC at 1-800-SEC-0330 for further information on the public reference room.
Our Internet address is http://www.enersys.com. We make available free of charge on http://www.enersys.com our annual, quarterly and current reports, and amendments to those reports, as soon as reasonably practical after we electronically file such material with, or furnish it to, the SEC.
ITEM 1A. | RISK FACTORS |
The following risks and uncertainties, as well as others described in this Annual Report on Form 10-K, could materially and adversely affect our business, our results of operations and financial conditions and could cause actual results to differ materially from our expectations and projections. Stockholders are cautioned that these and other factors, including those beyond our control, may affect future performance and cause actual results to differ from those which may, from time to time, be anticipated. There may be additional risks that are not presently material or known. See “Cautionary Note Regarding Forward-Looking Statements.” All forward-looking statements made by us or on our behalf are qualified by the risks described below.
We operate in an extremely competitive industry and are subject to pricing pressures.
We compete with a number of major international manufacturers and distributors, as well as a large number of smaller, regional competitors. Due to excess capacity in some sectors of our industry and consolidation among industrial battery purchasers, we have been subjected to significant pricing pressures. We anticipate continued competitive pricing pressure as foreign producers are able to employ labor at significantly lower costs than producers in the U.S. and Western Europe, expand their export capacity and increase their marketing presence in our major Americas and European markets. Several of our competitors have strong technical, marketing, sales, manufacturing, distribution and other resources, as well as significant name recognition, established positions in the market and long-standing relationships with OEMs and other customers. In addition, certain of our competitors own lead smelting facilities which, during periods of lead cost increases or price volatility, may provide a competitive pricing advantage and reduce their exposure to volatile raw material costs. Our ability to maintain and improve our operating margins has depended, and continues to depend, on our ability to control and reduce our costs. We cannot assure you that we will be able to continue to control our operating expenses, to raise or maintain our prices or increase our unit volume, in order to maintain or improve our operating results.
The uncertainty in global economic conditions could negatively affect the Company’s operating results.
Our operating results are directly affected by the general global economic conditions of the industries in which our major customer groups operate. Our business segments are highly dependent on the economic and market conditions in each of the geographic areas in which we operate. Our products are heavily dependent on the end markets that we serve and our operating results will vary by geographic segment, depending on the economic environment in these markets. Sales of our motive power products, for example, depend significantly on demand for new electric industrial forklift trucks, which in turn depends on end-user demand for additional motive capacity in their distribution and manufacturing facilities. The uncertainty in global economic conditions varies by geographic segment, and can result in substantial volatility in global credit markets, particularly in the United States, where we service the vast majority of our debt. These conditions affect our business by reducing prices that our customers may be able or willing to pay for our products or by reducing the demand for our products, which could in turn negatively impact our sales and earnings generation and result in a material adverse effect on our business, cash flow, results of operations and financial position.
10
Government reviews, inquiries, investigations, and actions could harm our business or reputation.
As we operate in various locations around the world, our operations in certain countries are subject to significant governmental scrutiny and may be adversely impacted by the results of such scrutiny. The regulatory environment with regard to our business is evolving, and officials often exercise broad discretion in deciding how to interpret and apply applicable regulations. From time to time, we receive formal and informal inquiries from various government regulatory authorities, as well as self-regulatory organizations, about our business and compliance with local laws, regulations or standards. For example, certain of the Company’s European subsidiaries have received subpoenas and requests for documents and, in some cases, interviews from, and have had on-site inspections conducted by the competition authorities of Belgium, Germany and the Netherlands relating to conduct and anticompetitive practices of certain industrial battery participants. The Company is responding to inquiries related to these matters. The Company settled the Belgian regulatory proceeding in February 2016 by acknowledging certain anticompetitive practices and conduct and agreeing to pay a fine of $2.0 million. (See Note 18 to the Consolidated Financial Statements for additional details.) Any determination that our operations or activities, or the activities of our employees, are not in compliance with existing laws, regulations or standards could result in the imposition of substantial fines, interruptions of business, loss of supplier, vendor or other third-party relationships, termination of necessary licenses and permits, or similar results, all of which could potentially harm our business and/or reputation. Even if an inquiry does not result in these types of determinations, regulatory authorities could cause us to incur substantial costs or require us to change our business practices in a manner materially adverse to our business, and it potentially could create negative publicity which could harm our business and/or reputation.
Reliance on third party relationships and derivative agreements could adversely affect the Company’s business.
We depend on third parties, including suppliers, distributors, lead toll operators, freight forwarders, insurance brokers, commodity brokers, major financial institutions and other third party service providers, for key aspects of our business, including the provision of derivative contracts to manage risks of (a) lead cost volatility, (b) foreign currency exposures and (c) interest rate volatility. Failure of these third parties to meet their contractual, regulatory and other obligations to the Company, or the development of factors that materially disrupt our relationships with these third parties, could expose us to the risks of business disruption, higher lead costs, unfavorable foreign currency rates and higher expenses, which could have a material adverse effect on our business.
Our operating results could be adversely affected by changes in the cost and availability of raw materials.
Lead is our most significant raw material and is used along with significant amounts of plastics, steel, copper and other materials in our manufacturing processes. We estimate that raw material costs account for over half of our cost of goods sold. The costs of these raw materials, particularly lead, are volatile and beyond our control. Additionally, availability of the raw materials used to manufacture our products may be limited at times resulting in higher prices and/or the need to find alternative suppliers. Furthermore, the cost of raw materials may also be influenced by transportation costs. Volatile raw material costs can significantly affect our operating results and make period-to-period comparisons extremely difficult. We cannot assure you that we will be able to either hedge the costs or secure the availability of our raw material requirements at a reasonable level or, even with respect to our agreements that adjust pricing to a market-based index for lead, pass on to our customers the increased costs of our raw materials without affecting demand or that limited availability of materials will not impact our production capabilities. Our inability to raise the price of our products in response to increases in prices of raw materials or to maintain a proper supply of raw materials could have an adverse effect on our revenue, operating profit and net income.
Our operations expose us to litigation, tax, environmental and other legal compliance risks.
We are subject to a variety of litigation, tax, environmental, health and safety and other legal compliance risks. These risks include, among other things, possible liability relating to product liability matters, personal injuries, intellectual property rights, contract-related claims, government contracts, taxes, health and safety liabilities, environmental matters and compliance with U.S. and foreign laws, competition laws and laws governing improper business practices. We or one of our business units could be charged with wrongdoing as a result of such matters. If convicted or found liable, we could be subject to significant fines, penalties, repayments or other damages (in certain cases, treble damages). As a global business, we are subject to complex laws and regulations in the U.S. and other countries in which we operate. Those laws and regulations may be interpreted in different ways. They may also change from time to time, as may related interpretations and other guidance. Changes in laws or regulations could result in higher expenses and payments, and uncertainty relating to laws or regulations may also affect how we conduct our operations and structure our investments and could limit our ability to enforce our rights.
In the area of taxes, changes in tax laws and regulations, as well as changes in related interpretations and other tax guidance could materially impact our tax receivables and liabilities and our deferred tax assets and tax liabilities. Additionally, in the
11
ordinary course of business, we are subject to examinations by various authorities, including tax authorities. In addition to ongoing investigations, there could be additional investigations launched in the future by governmental authorities in various jurisdictions and existing investigations could be expanded. The global and diverse nature of our operations means that these risks will continue to exist and additional legal proceedings and contingencies will arise from time to time. Our results may be affected by the outcome of legal proceedings and other contingencies that cannot be predicted with certainty.
In the manufacture of our products throughout the world, we process, store, dispose of and otherwise use large amounts of hazardous materials, especially lead and acid. As a result, we are subject to extensive and changing environmental, health and safety laws and regulations governing, among other things: the generation, handling, storage, use, transportation and disposal of hazardous materials; remediation of polluted ground or water; emissions or discharges of hazardous materials into the ground, air or water; and the health and safety of our employees. Compliance with these laws and regulations results in ongoing costs. Failure to comply with these laws or regulations, or to obtain or comply with required environmental permits, could result in fines, criminal charges or other sanctions by regulators. From time to time we have had instances of alleged or actual noncompliance that have resulted in the imposition of fines, penalties and required corrective actions. Our ongoing compliance with environmental, health and safety laws, regulations and permits could require us to incur significant expenses, limit our ability to modify or expand our facilities or continue production and require us to install additional pollution control equipment and make other capital improvements. In addition, private parties, including current or former employees, could bring personal injury or other claims against us due to the presence of, or exposure to, hazardous substances used, stored or disposed of by us or contained in our products.
Certain environmental laws assess liability on owners or operators of real property for the cost of investigation, removal or remediation of hazardous substances at their current or former properties or at properties at which they have disposed of hazardous substances. These laws may also assess costs to repair damage to natural resources. We may be responsible for remediating damage to our properties that was caused by former owners. Soil and groundwater contamination has occurred at some of our current and former properties and may occur or be discovered at other properties in the future. We are currently investigating and monitoring soil and groundwater contamination at several of our properties, in most cases as required by regulatory permitting processes. We may be required to conduct these operations at other properties in the future. In addition, we have been and in the future may be liable to contribute to the cleanup of locations owned or operated by other persons to which we or our predecessor companies have sent wastes for disposal, pursuant to federal and other environmental laws. Under these laws, the owner or operator of contaminated properties and companies that generated, disposed of or arranged for the disposal of wastes sent to a contaminated disposal facility can be held jointly and severally liable for the investigation and cleanup of such properties, regardless of fault. Additionally, our products may become subject to fees and taxes in order to fund cleanup of such properties, including those operated or used by other lead-battery industry participants.
Changes in environmental and climate laws or regulations, could lead to new or additional investment in production designs and could increase environmental compliance expenditures. Changes in climate change concerns, or in the regulation of such concerns, including greenhouse gas emissions, could subject us to additional costs and restrictions, including increased energy and raw materials costs. Additionally, we cannot assure you that we have been or at all times will be in compliance with environmental laws and regulations or that we will not be required to expend significant funds to comply with, or discharge liabilities arising under, environmental laws, regulations and permits, or that we will not be exposed to material environmental, health or safety litigation.
Also, the U.S. Foreign Corrupt Practices Act (“FCPA”) and similar worldwide anti-bribery laws in non-U.S. jurisdictions generally prohibit companies and their intermediaries from making improper payments to non-U.S. officials for the purpose of obtaining or retaining business. The FCPA applies to companies, individual directors, officers, employees and agents. Under the FCPA, U.S. companies may be held liable for actions taken by strategic or local partners or representatives. The FCPA also imposes accounting standards and requirements on publicly traded U.S. corporations and their foreign affiliates, which are intended to prevent the diversion of corporate funds to the payment of bribes and other improper payments. Certain of our customer relationships outside of the U.S. are with governmental entities and are therefore subject to such anti-bribery laws. Our policies mandate compliance with these anti-bribery laws. Despite meaningful measures that we undertake to facilitate lawful conduct, which include training and internal control policies, these measures may not always prevent reckless or criminal acts by our employees or agents. As a result, we could be subject to criminal and civil penalties, disgorgement, further changes or enhancements to our procedures, policies and controls, personnel changes or other remedial actions. Violations of these laws, or allegations of such violations, could disrupt our operations, involve significant management distraction and result in a material adverse effect on our competitive position, results of operations, cash flows or financial condition.
There is also a regulation to improve the transparency and accountability concerning the supply of minerals coming from the conflict zones in and around the Democratic Republic of Congo. New U.S. legislation includes disclosure requirements regarding the use of conflict minerals mined from the Democratic Republic of Congo and adjoining countries and procedures
12
regarding a manufacturer’s efforts to prevent the sourcing of such conflict minerals. The implementation of these requirements could affect the sourcing and availability of minerals used in the manufacture of our products. As a result, there may only be a limited pool of suppliers who provide conflict-free metals, and we cannot assure you that we will be able to obtain products in sufficient quantities or at competitive prices. Future regulations may become more stringent or costly and our compliance costs and potential liabilities could increase, which may harm our business.
We are exposed to exchange rate risks, and our net earnings and financial condition may suffer due to currency translations.
We invoice our foreign sales and service transactions in local and foreign currencies and translate net sales using actual exchange rates during the period. We translate our non-U.S. assets and liabilities into U.S. dollars using current exchange rates as of the balance sheet dates. Because a significant portion of our revenues and expenses are denominated in foreign currencies, changes in exchange rates between the U.S. dollar and foreign currencies, primarily the euro, British pound, Polish zloty, Chinese renminbi, Mexican peso and Swiss franc may adversely affect our revenue, cost of goods sold and operating margins. For example, foreign currency depreciation against the U.S. dollar will reduce the value of our foreign revenues and operating earnings as well as reduce our net investment in foreign subsidiaries. Approximately 50% of net sales were generated outside of the United States for the last three fiscal years.
Most of the risk of fluctuating foreign currencies is in our EMEA segment, which comprised approximately 40% of our net sales during the last three fiscal years. The euro is the dominant currency in our EMEA operations. In the event that one or more European countries were to replace the euro with another currency, our sales into such countries, or into Europe generally, would likely be adversely affected until stable exchange rates are established.
The translation impact from currency fluctuations on net sales and operating earnings in our Americas and Asia segments are not as significant as our EMEA segment, as a substantial majority of these net sales and operating earnings are in U.S. dollars or foreign currencies that have been closely correlated to the U.S. dollar.
If foreign currencies depreciate against the U.S. dollar, it would make it more expensive for our non-U.S. subsidiaries to purchase certain of our raw material commodities that are priced globally in U.S. dollars, while the related revenue will decrease when translated to U.S. dollars. Significant movements in foreign exchange rates can have a material impact on our results of operations and financial condition. We periodically engage in hedging of our foreign currency exposures, but cannot assure you that we can successfully hedge all of our foreign currency exposures or do so at a reasonable cost.
We quantify and monitor our global foreign currency exposures. Our largest foreign currency exposure is from the purchase and conversion of U.S. dollar based lead costs into local currencies in Europe. Additionally, we have currency exposures from intercompany financing and intercompany and third party trade transactions. On a selective basis, we enter into foreign currency forward contracts and purchase option contracts to reduce the impact from the volatility of currency movements; however, we cannot be certain that foreign currency fluctuations will not impact our operations in the future.
If we are unable to effectively hedge against currency fluctuations, our operating costs and revenues in our non-U.S. operations may be adversely affected, which would have an adverse effect on our operating profit and net income.
We may experience difficulties implementing our new global enterprise resource planning system.
We are engaged in a multi-year implementation of a new global enterprise resource planning system (“ERP”). The ERP is designed to efficiently maintain our books and records and provide information important to the operation of our business to our management team. The ERP will continue to require significant investment of human and financial resources. In implementing the ERP, we may experience significant delays, increased costs and other difficulties. Any significant disruption or deficiency in the design and implementation of the ERP could adversely affect our ability to process orders, ship product, send invoices and track payments, fulfill contractual obligations or otherwise operate our business. While we have invested significant resources in planning, project management and training, additional and significant implementation issues may arise. In addition, our efforts to centralize various business processes and functions within our organization in connection with our ERP implementation may disrupt our operations and negatively impact our business, results of operations and financial condition.
13
Our international operations may be adversely affected by actions taken by foreign governments or other forces or events over which we may have no control.
We currently have significant manufacturing and/or distribution facilities outside of the United States, in Argentina, Australia, Belgium, Brazil, Bulgaria, Canada, the Czech Republic, France, Germany, India, Italy, Malaysia, Mexico, PRC, Poland, South Africa, Spain, Switzerland, Tunisia and the United Kingdom. We may face political instability, economic uncertainty, and/or difficult labor relations in our foreign operations. We also may face barriers in the form of long-standing relationships between potential customers and their existing suppliers, national policies favoring domestic manufacturers and protective regulations including exchange controls, restrictions on foreign investment or the repatriation of profits or invested capital, changes in export or import restrictions and changes in the tax system or rate of taxation in countries where we do business. We cannot assure you that we will be able to successfully develop and expand our international operations and sales or that we will be able to overcome the significant obstacles and risks of our international operations. This may impair our ability to compete with battery manufacturers who are based in such foreign countries or who have long established manufacturing or distribution facilities or networks in such countries.
Our failure to introduce new products and product enhancements and broad market acceptance of new technologies introduced by our competitors could adversely affect our business.
Many new energy storage technologies have been introduced over the past several years. For certain important and growing markets, such as aerospace and defense, lithium-based battery technologies have a large and growing market share. Our ability to achieve significant and sustained penetration of key developing markets, including aerospace and defense, will depend upon our success in developing or acquiring these and other technologies, either independently, through joint ventures or through acquisitions. If we fail to develop or acquire, and manufacture and sell, products that satisfy our customers’ demands, or we fail to respond effectively to new product announcements by our competitors by quickly introducing competitive products, then market acceptance of our products could be reduced and our business could be adversely affected. We cannot assure you that our lead-acid products will remain competitive with products based on new technologies.
We may not be able to adequately protect our proprietary intellectual property and technology.
We rely on a combination of copyright, trademark, patent and trade secret laws, non-disclosure agreements and other confidentiality procedures and contractual provisions to establish, protect and maintain our proprietary intellectual property and technology and other confidential information. Certain of these technologies, especially TPPL technology, are important to our business and are not protected by patents. Despite our efforts to protect our proprietary intellectual property and technology and other confidential information, unauthorized parties may attempt to copy or otherwise obtain and use our intellectual property and proprietary technologies. If we are unable to protect our intellectual property and technology, we may lose any technological advantage we currently enjoy and may be required to take an impairment charge with respect to the carrying value of such intellectual property or goodwill established in connection with the acquisition thereof. In either case, our operating results and net income may be adversely affected.
Relocation of our customers’ operations could adversely affect our business.
The trend by a number of our North American and Western European customers to move manufacturing operations and expand their businesses in faster growing and low labor-cost markets may have an adverse impact on our business. As our customers in traditional manufacturing-based industries seek to move their manufacturing operations to these locations, there is a risk that these customers will source their energy storage products from competitors located in those territories and will cease or reduce the purchase of products from our manufacturing plants. We cannot assure you that we will be able to compete effectively with manufacturing operations of energy storage products in those territories, whether by establishing or expanding our manufacturing operations in those lower-cost territories or acquiring existing manufacturers.
We may fail to implement our cost reduction initiatives successfully and improve our profitability.
We must continue to implement cost reduction initiatives to achieve additional cost savings in future periods. We cannot assure you that we will be able to achieve all of the cost savings that we expect to realize from current or future initiatives. In particular, we may be unable to implement one or more of our initiatives successfully or we may experience unexpected cost increases that offset the savings that we achieve. Given the continued competitive pricing pressures experienced in our industry, our failure to realize cost savings would adversely affect our results of operations.
14
Quality problems with our products could harm our reputation and erode our competitive position.
The success of our business will depend upon the quality of our products and our relationships with customers. In the event that our products fail to meet our customers’ standards, our reputation could be harmed, which would adversely affect our marketing and sales efforts. We cannot assure you that our customers will not experience quality problems with our products.
We offer our products under a variety of brand names, the protection of which is important to our reputation for quality in the consumer marketplace.
We rely upon a combination of trademark, licensing and contractual covenants to establish and protect the brand names of our products. We have registered many of our trademarks in the U.S. Patent and Trademark Office and in other countries. In many market segments, our reputation is closely related to our brand names. Monitoring unauthorized use of our brand names is difficult, and we cannot be certain that the steps we have taken will prevent their unauthorized use, particularly in foreign countries where the laws may not protect our proprietary rights as fully as in the U.S. We cannot assure you that our brand names will not be misappropriated or utilized without our consent or that such actions will not have a material adverse effect on our reputation and on our results of operations.
We may fail to implement our plans to make acquisitions or successfully integrate them into our operations.
As part of our business strategy, we have grown, and plan to continue growing, by acquiring other product lines, technologies or facilities that complement or expand our existing business. There is significant competition for acquisition targets in the industrial battery industry. We may not be able to identify suitable acquisition candidates or negotiate attractive terms. In addition, we may have difficulty obtaining the financing necessary to complete transactions we pursue. In that regard, our credit facilities restrict the amount of additional indebtedness that we may incur to finance acquisitions and place other restrictions on our ability to make acquisitions. Exceeding any of these restrictions would require the consent of our lenders. We may be unable to successfully integrate any assets, liabilities, customers, systems and management personnel we acquire into our operations and we may not be able to realize related revenue synergies and cost savings within expected time frames. Our failure to execute our acquisition strategy could have a material adverse effect on our business. We cannot assure you that our acquisition strategy will be successful or that we will be able to successfully integrate acquisitions we do make.
Any acquisitions that we complete may dilute stockholder ownership interests in EnerSys, may have adverse effects on our financial condition and results of operations and may cause unanticipated liabilities.
Future acquisitions may involve the issuance of our equity securities as payment, in part or in full, for the businesses or assets acquired. Any future issuances of equity securities would dilute stockholder ownership interests. In addition, future acquisitions might not increase, and may even decrease our earnings or earnings per share and the benefits derived by us from an acquisition might not outweigh or might not exceed the dilutive effect of the acquisition. We also may incur additional debt or suffer adverse tax and accounting consequences in connection with any future acquisitions.
The failure or security breach of critical computer systems could seriously affect our sales and operations.
We operate a number of critical computer systems throughout our business that can fail for a variety of reasons. If such a failure were to occur, we may not be able to sufficiently recover from the failure in time to avoid the loss of data or any adverse impact on certain of our operations that are dependent on such systems. This could result in lost sales and the inefficient operation of our facilities for the duration of such a failure.
In addition, our computer systems are essential for the exchange of information both within the company and in communicating with third parties. Despite our efforts to protect the integrity of our systems and network as well as sensitive, confidential or personal data or information, our facilities and systems and those of our third-party service providers may be vulnerable to security breaches, theft, misplaced or lost data, programming and/or human errors that could potentially lead to the compromising of sensitive, confidential or personal data or information, improper use of our systems, software solutions or networks, unauthorized access, use, disclosure, modification or destruction of information, defective products, production downtimes and operational disruptions, which in turn could adversely affect our reputation, competitiveness, and results of operations.
Our ability to maintain adequate credit facilities.
Our ability to continue our ongoing business operations and fund future growth depends on our ability to maintain adequate credit facilities and to comply with the financial and other covenants in such credit facilities or to secure alternative sources of
15
financing. However, such credit facilities or alternate financing may not be available or, if available, may not be on terms favorable to us. If we do not have adequate access to credit, we may be unable to refinance our existing borrowings and credit facilities when they mature and to fund future acquisitions, and this may reduce our flexibility in responding to changing industry conditions.
Our indebtedness could adversely affect our financial condition and results of operations.
As of March 31, 2016, we had $628.6 million of total consolidated debt (including capital lease obligations). This level of debt could:
• | increase our vulnerability to adverse general economic and industry conditions, including interest rate fluctuations, because a portion of our borrowings bear, and will continue to bear, interest at floating rates; |
• | require us to dedicate a substantial portion of our cash flow from operations to debt service payments, which would reduce the availability of our cash to fund working capital, capital expenditures or other general corporate purposes, including acquisitions; |
• | limit our flexibility in planning for, or reacting to, changes in our business and industry; |
• | restrict our ability to introduce new products or new technologies or exploit business opportunities; |
• | place us at a disadvantage compared with competitors that have proportionately less debt; |
• | limit our ability to borrow additional funds in the future, if we need them, due to financial and restrictive covenants in our debt agreements; and |
• | have a material adverse effect on us if we fail to comply with the financial and restrictive covenants in our debt agreements. |
There can be no assurance that we will continue to declare cash dividends at all or in any particular amounts.
During fiscal 2016, we announced the declaration of a quarterly cash dividend of $0.175 per share of common stock for quarters ended June 28, 2015, September 27, 2015, December 27, 2015 and March 31, 2016. On May 5, 2016, we announced a fiscal 2017 first quarter cash dividend of $0.175 per share of common stock. Future payment of a regular quarterly cash dividend on our common shares will be subject to, among other things, our results of operations, cash balances and future cash requirements, financial condition, statutory requirements of Delaware law, compliance with the terms of existing and future indebtedness and credit facilities, and other factors that the Board of Directors may deem relevant. Our dividend payments may change from time to time, and we cannot provide assurance that we will continue to declare dividends at all or in any particular amounts. A reduction in or elimination of our dividend payments could have a negative effect on our share price.
We depend on our senior management team and other key employees, and significant attrition within our management team or unsuccessful succession planning could adversely affect our business.
Our success depends in part on our ability to attract, retain and motivate senior management and other key employees. Achieving this objective may be difficult due to many factors, including fluctuations in global economic and industry conditions, competitors’ hiring practices, cost reduction activities, and the effectiveness of our compensation programs. Competition for qualified personnel can be very intense. We must continue to recruit, retain and motivate senior management and other key employees sufficient to maintain our current business and support our future projects. We are vulnerable to attrition among our current senior management team and other key employees. A loss of any such personnel, or the inability to recruit and retain qualified personnel in the future, could have an adverse effect on our business, financial condition and results of operations. In addition, if we are unsuccessful in our succession planning efforts, the continuity of our business and results of operations could be adversely affected.
ITEM 1B. | UNRESOLVED STAFF COMMENTS |
None.
16
ITEM 2. | PROPERTIES |
The Company’s worldwide headquarters is located in Reading, Pennsylvania. Geographic headquarters for our Americas, EMEA and Asia segments are located in Reading, Pennsylvania, Zug, Switzerland and Singapore, respectively. The Company owns approximately 80% of its manufacturing facilities and distribution centers worldwide. The following sets forth the Company’s principal owned or leased facilities by business segment:
Americas: Sylmar, California; Longmont, Colorado; Hays, Kansas; Richmond, Kentucky; Warrensburg, Missouri; Cleveland, Ohio; Horsham, Pennsylvania; Sumter, South Carolina; Ooltewah, Tennessee and Spokane, Washington in the United States; Monterrey and Tijuana in Mexico; Buenos Aires, Argentina and Sao Paulo, in Brazil.
EMEA: Targovishte, Bulgaria; Hostomice, Czech Republic; Arras, France; Hagen and Zwickau in Germany; Bielsko-Biala, Poland; Newport and Culham in the United Kingdom; Port Elizabeth, South Africa; and Tunis, Tunisia.
Asia: Jiangsu, Chongqing and Yangzhou in the PRC and Andhra Pradesh in India.
We consider our plants and facilities, whether owned or leased, to be in satisfactory condition and adequate to meet the needs of our current businesses and projected growth. Information as to material lease commitments is included in Note 9 - Leases to the Consolidated Financial Statements.
ITEM 3. | LEGAL PROCEEDINGS |
From time to time, we are involved in litigation incidental to the conduct of our business. See Litigation and Other Legal Matters in Note 18 - Commitments, Contingencies and Litigation to the Consolidated Financial Statements, which is incorporated herein by reference.
ITEM 4. | MINE SAFETY DISCLOSURES |
Not applicable.
17
PART II
ITEM 5. | MARKET FOR REGISTRANT’S COMMON EQUITY, RELATED STOCKHOLDER MATTERS AND ISSUER PURCHASES OF EQUITY SECURITIES |
Market Information
The Company’s common stock has been listed on the New York Stock Exchange under the symbol “ENS” since it began trading on July 30, 2004. Prior to that time, there had been no public market for our common stock. The following table sets forth, on a per share basis for the periods presented, the range of high, low and closing prices of the Company’s common stock.
Quarter Ended | High Price | Low Price | Closing Price | Dividends Declared | ||||||||||||
March 31, 2016 | $ | 58.89 | $ | 42.60 | $ | 55.72 | $ | 0.175 | ||||||||
December 27, 2015 | 66.95 | 51.02 | 57.18 | 0.175 | ||||||||||||
September 27, 2015 | 71.85 | 49.21 | 51.66 | 0.175 | ||||||||||||
June 28, 2015 | 73.27 | 63.63 | 71.58 | 0.175 | ||||||||||||
March 31, 2015 | $ | 66.89 | $ | 57.47 | $ | 64.24 | $ | 0.175 | ||||||||
December 28, 2014 | 63.39 | 50.63 | 61.78 | 0.175 | ||||||||||||
September 28, 2014 | 70.00 | 57.88 | 60.07 | 0.175 | ||||||||||||
June 29, 2014 | 71.94 | 62.72 | 68.91 | 0.175 | ||||||||||||
Holders of Record
As of May 27, 2016, there were approximately 370 record holders of common stock of the Company. Because many of these shares are held by brokers and other institutions on behalf of stockholders, the Company is unable to estimate the total number of stockholders represented by these record holders.
Recent Sales of Unregistered Securities
During the fourth quarter of fiscal 2016, we did not issue any unregistered securities.
Purchases of Equity Securities by the Issuer and Affiliated Purchasers
The following table summarizes the number of shares of common stock we purchased from participants in our equity incentive plans as well as repurchases of common stock authorized by the Board of Directors. As provided by the Company’s equity incentive plans, (a) vested options outstanding may be exercised through surrender to the Company of option shares or vested options outstanding under the Company’s equity incentive plans to satisfy the applicable aggregate exercise price (and any withholding tax) required to be paid upon such exercise and (b) the withholding tax requirements related to the vesting and settlement of restricted stock units and market share units may be satisfied by the surrender of shares of the Company’s common stock.
18
Purchases of Equity Securities
Period | (a) Total number of shares (or units) purchased | (b) Average price paid per share (or unit) | (c) Total number of shares (or units) purchased as part of publicly announced plans or programs | (d) Maximum number (or approximate dollar value) of shares (or units) that may be purchased under the plans or programs(1)(2) | ||||||||||
December 28, 2015 - January 24, 2016 | 961,444 | $ | 60.63 | 961,444 | $ | 38,600,000 | ||||||||
January 25, 2016 - February 21, 2016 | 131,962 | 44.38 | 131,962 | 32,743,463 | ||||||||||
February 22, 2016 - March 31, 2016 | 113,352 | 47.27 | 113,352 | 27,385,432 | ||||||||||
Total | 1,206,758 | $ | 57.60 | 1,206,758 | ||||||||||
(1) | The Company's Board of Directors has authorized the Company to repurchase up to such number of shares as shall equal the dilutive effects of any equity-based award granted during such fiscal year under the Second Amended and Restated 2010 Equity Incentive Plan and the number of shares exercised through stock option awards during such fiscal year. This repurchase program was exhausted for fiscal 2016. |
(2) | The Company's Board of Directors has authorized the Company to repurchase up to a $180 million of its common stock. On August 13, 2015, the Company prepaid $180 million, pursuant to an accelerated share repurchase (“ASR”) with a major financial institution, and received an initial delivery of 2,000,000 shares. On January 13, 2016, the ASR was settled and the Company received an additional 961,444 shares and $13.6 million in cash for the remaining amount not settled in shares. The Company repurchased a total of 2,961,444 shares under the ASR for a total cash investment of $166.4 million at an average price of $56.19. The Company also purchased an additional 245,314 shares during the fourth quarter through open market transactions for a total cash investment of $11.2 million at an average price of $45.72. |
19
STOCK PERFORMANCE GRAPH
The following graph compares the changes in cumulative total returns on EnerSys’ common stock with the changes in cumulative total returns of the New York Stock Exchange Composite Index, a broad equity market index, and the total return on a selected peer group index. The peer group selected is based on the standard industrial classification codes (“SIC Codes”) established by the U.S. government. The index chosen was “Miscellaneous Electrical Equipment and Suppliers” and comprises all publicly traded companies having the same three-digit SIC Code (369) as EnerSys.
The graph was prepared assuming that $100 was invested in EnerSys’ common stock, the New York Stock Exchange Composite Index and the peer group (duly updated for changes) on March 31, 2011.
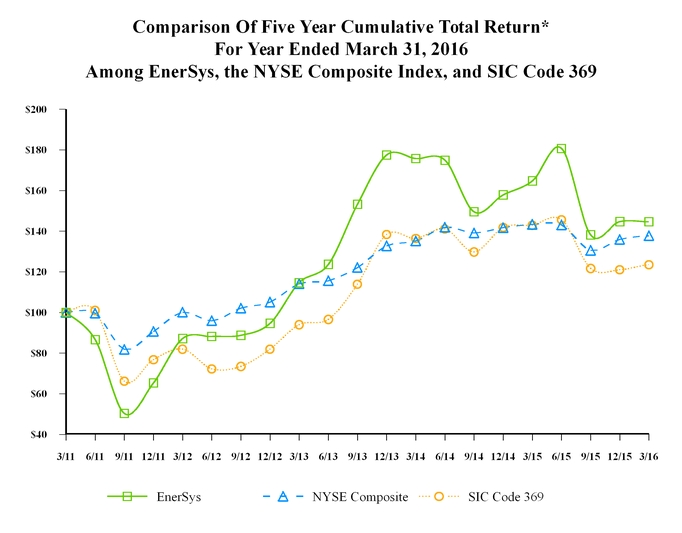
*$100 invested on March 31, 2011 in stock or index, including reinvestment of dividends.
20
ITEM 6. | SELECTED FINANCIAL DATA |
Fiscal Year Ended March 31, | ||||||||||||||||||||
2016 | 2015 | 2014 | 2013 | 2012 | ||||||||||||||||
(In thousands, except share and per share data) | ||||||||||||||||||||
Consolidated Statements of Income: | ||||||||||||||||||||
Net sales | $ | 2,316,249 | $ | 2,505,512 | $ | 2,474,433 | $ | 2,277,559 | $ | 2,283,369 | ||||||||||
Cost of goods sold | 1,704,472 | 1,864,601 | 1,844,813 | 1,708,203 | 1,770,664 | |||||||||||||||
Gross profit | 611,777 | 640,911 | 629,620 | 569,356 | 512,705 | |||||||||||||||
Operating expenses | 352,767 | 358,381 | 344,421 | 312,324 | 297,806 | |||||||||||||||
Restructuring and other exit charges | 12,978 | 11,436 | 27,326 | 7,164 | 4,988 | |||||||||||||||
Impairment of goodwill, indefinite-lived intangibles and fixed assets | 36,252 | 23,946 | 5,179 | — | — | |||||||||||||||
Legal proceedings charge / (reversal of legal accrual, net of fees) | 3,201 | (16,233 | ) | 58,184 | — | (900 | ) | |||||||||||||
Gain on sale of facility | (3,420 | ) | — | — | — | — | ||||||||||||||
Operating earnings | 209,999 | 263,381 | 194,510 | 249,868 | 210,811 | |||||||||||||||
Interest expense | 22,343 | 19,644 | 17,105 | 18,719 | 16,484 | |||||||||||||||
Other (income) expense, net | 5,719 | (5,602 | ) | 13,658 | 916 | 3,068 | ||||||||||||||
Earnings before income taxes | 181,937 | 249,339 | 163,747 | 230,233 | 191,259 | |||||||||||||||
Income tax expense | 50,113 | 67,814 | 16,980 | 65,275 | 47,292 | |||||||||||||||
Net earnings | 131,824 | 181,525 | 146,767 | 164,958 | 143,967 | |||||||||||||||
Net (losses) earnings attributable to noncontrolling interests | (4,326 | ) | 337 | (3,561 | ) | (1,550 | ) | (36 | ) | |||||||||||
Net earnings attributable to EnerSys stockholders | $ | 136,150 | $ | 181,188 | $ | 150,328 | $ | 166,508 | $ | 144,003 | ||||||||||
Net earnings per common share attributable to EnerSys stockholders: | ||||||||||||||||||||
Basic | $ | 3.08 | $ | 3.97 | $ | 3.17 | $ | 3.47 | $ | 2.95 | ||||||||||
Diluted | $ | 2.99 | $ | 3.77 | $ | 3.02 | $ | 3.42 | $ | 2.93 | ||||||||||
Weighted-average number of common shares outstanding: | ||||||||||||||||||||
Basic | 44,276,713 | 45,606,317 | 47,473,690 | 48,022,005 | 48,748,205 | |||||||||||||||
Diluted | 45,474,130 | 48,052,729 | 49,788,155 | 48,635,449 | 49,216,035 | |||||||||||||||
Fiscal Year Ended March 31, | ||||||||||||||||||||
2016 | 2015 | 2014 | 2013 | 2012 | ||||||||||||||||
(In thousands) | ||||||||||||||||||||
Consolidated cash flow data: | ||||||||||||||||||||
Net cash provided by operating activities | $ | 307,571 | $ | 194,471 | $ | 193,621 | $ | 244,400 | $ | 204,196 | ||||||||||
Net cash used in investing activities | (80,923 | ) | (59,616 | ) | (232,005 | ) | (55,092 | ) | (72,420 | ) | ||||||||||
Net cash (used in) provided by financing activities | (105,729 | ) | (59,313 | ) | 21,562 | (95,962 | ) | (79,382 | ) | |||||||||||
Other operating data: | ||||||||||||||||||||
Capital expenditures | 55,880 | 63,625 | 61,995 | 55,286 | 48,943 | |||||||||||||||
As of March 31, | ||||||||||||||||||||
2016 | 2015 | 2014 | 2013 | 2012 | ||||||||||||||||
(In thousands) | ||||||||||||||||||||
Consolidated balance sheet data: | ||||||||||||||||||||
Cash and cash equivalents | $ | 397,307 | $ | 268,921 | $ | 240,103 | $ | 249,348 | $ | 160,490 | ||||||||||
Working capital | 845,068 | 769,881 | 719,297 | 685,403 | 611,372 | |||||||||||||||
Total assets (1) | 2,214,488 | 2,136,555 | 2,318,959 | 1,984,512 | 1,920,321 | |||||||||||||||
Total debt, including capital leases, excluding discount on the Convertible Notes (1)(2) | 628,631 | 513,213 | 319,401 | 175,134 | 251,467 | |||||||||||||||
Total EnerSys stockholders’ equity | 1,013,131 | 1,038,900 | 1,246,402 | 1,169,401 | 1,032,195 | |||||||||||||||
(1) Net of debt issuance costs
(2) Convertible Notes as defined under Liquidity and Capital Resources in Item 7. Management's Discussion and Analysis of Financial Condition and Results of Operations
21
ITEM 7. | MANAGEMENT’S DISCUSSION AND ANALYSIS OF FINANCIAL CONDITION AND RESULTS OF OPERATIONS |
The following discussion and analysis of our results of operations and financial condition for the fiscal years ended March 31, 2016, 2015 and 2014, should be read in conjunction with our audited consolidated financial statements and the notes to those statements included in Item 8. Financial Statements and Supplementary Data, of this Annual Report on Form 10-K. Our discussion contains forward-looking statements based upon current expectations that involve risks and uncertainties, such as our plans, objectives, opinions, expectations, anticipations and intentions and beliefs. Actual results and the timing of events could differ materially from those anticipated in those forward-looking statements as a result of a number of factors. See “Cautionary Note Regarding Forward-Looking Statements,” “Business” and “Risk Factors,” sections elsewhere in this Annual Report on Form 10-K. In the following discussion and analysis of results of operations and financial condition, certain financial measures may be considered “non-GAAP financial measures” under the SEC rules. These rules require supplemental explanation and reconciliation, which is provided in this Annual Report on Form 10-K.
EnerSys’ management uses the non-GAAP measures, EBITDA and Adjusted EBITDA, in its computation of compliance with loan covenants. These measures, as used by EnerSys, adjust net earnings determined in accordance with GAAP for interest, taxes, depreciation and amortization, and certain charges or credits as permitted by our credit agreements, that were recorded during the periods presented.
EnerSys’ management uses the non-GAAP measures,"primary working capital" and "primary working capital percentage" (see definition in “Overview” below) along with capital expenditures, in its evaluation of business segment cash flow and financial position performance.
These non-GAAP disclosures have limitations as analytical tools, should not be viewed as a substitute for cash flow or operating earnings determined in accordance with GAAP, and should not be considered in isolation or as a substitute for analysis of the Company’s results as reported under GAAP, nor are they necessarily comparable to non-GAAP performance measures that may be presented by other companies. This supplemental presentation should not be construed as an inference that the Company’s future results will be unaffected by similar adjustments to operating earnings determined in accordance with GAAP.
Overview
EnerSys (the “Company,” “we,” or “us”) is the world’s largest manufacturer, marketer and distributor of industrial batteries. We also manufacture, market and distribute products such as battery chargers, power equipment, battery accessories, and outdoor equipment enclosure solutions. Additionally, we provide related aftermarket and customer-support services for our products. We market our products globally to over 10,000 customers in more than 100 countries through a network of distributors, independent representatives and our internal sales force.
We operate and manage our business in three geographic regions of the world—Americas, EMEA and Asia, as described below. Our business is highly decentralized with manufacturing locations throughout the world. More than half of our manufacturing capacity is located outside the United States, and approximately 50% of our net sales were generated outside the United States. The Company has three reportable business segments based on geographic regions, defined as follows:
• | Americas, which includes North and South America, with our segment headquarters in Reading, Pennsylvania, USA; |
• | EMEA, which includes Europe, the Middle East and Africa, with our segment headquarters in Zug, Switzerland; and |
• | Asia, which includes Asia, Australia and Oceania, with our segment headquarters in Singapore. |
We evaluate business segment performance based primarily upon operating earnings exclusive of highlighted items. Highlighted items are those that the Company deems are not indicative of ongoing operating results, including those charges that the Company incurs as a result of restructuring activities and those charges and credits that are not directly related to ongoing business segment performance. All corporate and centrally incurred costs are allocated to the business segments based principally on net sales. We evaluate business segment cash flow and financial position performance based primarily upon capital expenditures and primary working capital levels (see definition of primary working capital in “Liquidity and Capital Resources” below). Although we monitor the three elements of primary working capital (receivables, inventory and payables), our primary focus is on the total amount due to the significant impact it has on our cash flow.
22
Our management structure, financial reporting systems, and associated internal controls and procedures, are all consistent with our three geographic business segments. We report on a March 31 fiscal year-end. Our financial results are largely driven by the following factors:
• | global economic conditions and general cyclical patterns of the industries in which our customers operate; |
• | changes in our selling prices and, in periods when our product costs increase, our ability to raise our selling prices to pass such cost increases through to our customers; |
• | the extent to which we are able to efficiently utilize our global manufacturing facilities and optimize our capacity; |
• | the extent to which we can control our fixed and variable costs, including those for our raw materials, manufacturing, distribution and operating activities; |
• | changes in our level of debt and changes in the variable interest rates under our credit facilities; and |
• | the size and number of acquisitions and our ability to achieve their intended benefits. |
We have two primary product lines: reserve power products and motive power products. Net sales classifications by product line are as follows:
• | Reserve power products are used for backup power for the continuous operation of critical applications in telecommunications systems, UPS applications for computer and computer-controlled systems, and other specialty power applications, including security systems, premium starting, lighting and ignition applications, in switchgear, electrical control systems used in electric utilities, large-scale energy storage, energy pipelines, in commercial aircraft, satellites, military aircraft, submarines, ships and tactical vehicles. Reserve power products also include thermally managed cabinets and enclosures for electronic equipment and batteries. |
• | Motive power products are used to provide power for electric industrial forklifts used in manufacturing, warehousing and other material handling applications as well as mining equipment, diesel locomotive starting and other rail equipment. |
Current Market Conditions
Economic Climate
Recent indicators continue to suggest a mixed trend in economic activity among the different geographical regions. Economic activity remains good in North America while EMEA is experiencing limited growth. Our Asia region continues to experience the fastest growth of any region in which we do business.
Volatility of Commodities and Foreign Currencies
Our most significant commodity and foreign currency exposures are related to lead and the euro, respectively. Historically, volatility of commodity costs and foreign currency exchange rates have caused large swings in our production costs. As the global economic climate changes, we anticipate that our commodity costs and foreign currency exposures may continue to fluctuate as they have in the past several years. During the past year, on a consolidated basis, we have experienced lower commodity costs. However, our EMEA region’s commodity costs are down only slightly due to unfavorable movements in foreign exchange rates. In addition, these unfavorable movements in foreign exchange rates have led to lower revenues.
Customer Pricing
Our selling prices fluctuated during the last several years to offset the volatile cost of commodities. Approximately 30% of our revenue is currently subject to agreements that adjust pricing to a market-based index for lead. During fiscal 2016, our selling prices remained relatively flat, compared to the comparable prior year period.
Liquidity and Capital Resources
We believe that our financial position is strong, and we have substantial liquidity with $397 million of available cash and cash equivalents and undrawn committed and uncommitted credit lines of approximately $472 million at March 31, 2016 to cover short-term liquidity requirements and anticipated growth in the foreseeable future. Our $350 million senior secured revolving credit facility (as amended, the "2011 Credit Facility"), which we entered into in March 2011 was expanded in July 2014 by increasing the revolver by an additional $150 million and by adding a $150 million senior secured incremental term loan (the "Term Loan"). The 2011 Credit Facility is committed through September 2018 as long as we continue to comply with its covenants and conditions.
23
Current market conditions related to our liquidity and capital resources are favorable. We believe current conditions remain favorable for the Company to have continued positive cash flow from operations that, along with available cash and cash equivalents and our undrawn lines of credit, will be sufficient to fund our capital expenditures, acquisitions and other investments for growth.
In April 2015, we issued $300 million of 5.00% Senior Notes due 2023 (the “Notes”), with the net proceeds used primarily to fund the payment of principal and accreted interest outstanding on the senior 3.375% convertible notes due 2038 (the “Convertible Notes”) that were settled in July 2015. See Note 8 to the Consolidated Financial Statements for additional details.
Subsequent to the extinguishment of the Convertible Notes, other than the Notes and the 2011 Credit Facility, we have no other significant amount of long-term debt maturing in the near future.
In fiscal 2016, we repurchased $178 million of treasury stock through open market purchases and through an ASR with a major financial institution. Share repurchases had a modest positive impact on earnings per diluted share.
Our leverage increased in fiscal 2016 mainly to fund our share repurchase program. We believe that our strong capital structure and liquidity affords us access to capital for future acquisitions and additional stock repurchase opportunities and continued dividend payments.
A substantial majority of the Company’s cash and investments are held by foreign subsidiaries and are considered to be indefinitely reinvested and expected to be utilized to fund local operating activities, capital expenditure requirements and acquisitions. The Company believes that it has sufficient sources of domestic and foreign liquidity.
Cost Savings Initiatives-Restructuring
Cost savings programs remain a continuous element of our business strategy and are directed primarily at further reductions in plant manufacturing (labor and overhead), raw material costs and our operating expenses (primarily selling, general and administrative). In order to realize cost savings benefits for a majority of these initiatives, costs are incurred either in the form of capital expenditures, funding the cash obligations of previously recorded restructuring expenses or current period expenses.
During fiscal 2012, we announced restructuring programs related to our operations in EMEA, primarily consisting of the transfer of manufacturing of select products between certain of our manufacturing operations and restructuring of our selling, general and administrative operations. These actions were completed during fiscal 2014 and resulted in the reduction of approximately 85 employees with an estimated annual savings of $6.0 million.
During fiscal 2013, we announced further restructuring related to improving the efficiency of our manufacturing operations in EMEA, primarily consisting of cash expenses for employee severance-related payments and non-cash expenses associated with the write-off of certain fixed assets and inventory. These actions were substantially completed in fiscal 2015 and resulted in the reduction of approximately 140 employees. Our fiscal 2015 operating results reflect the full benefit of the estimated $7.0 million of favorable annualized pre-tax earnings impact of the fiscal 2013 programs. There are no further costs to be incurred under these programs.
During fiscal 2014, we announced additional restructuring programs to improve the efficiency of our manufacturing, sales and engineering operations in EMEA including the restructuring of its manufacturing operations in Bulgaria. The restructuring of the Bulgaria operations was announced during the third quarter of fiscal 2014 and consists of the transfer of motive power and a portion of reserve power battery manufacturing to our facilities in Western Europe. These actions resulted in the reduction of approximately 500 employees upon completion during fiscal 2016. Our fiscal 2015 operating results reflect substantially all of the approximately $19.0 million of expected favorable annualized pre-tax earnings impact of the fiscal 2014 programs.
During fiscal 2016 we announced restructuring programs related to improving operational efficiencies in EMEA and the Americas. These actions when completed in fiscal 2017 are expected to result in the reduction of approximately 240 employees and the closure of our Cleveland, Ohio manufacturing facility. Approximately $3.0 million pre-tax in savings have been reflected in the fiscal 2016 results.
24
Critical Accounting Policies and Estimates
Our significant accounting policies are described in Notes to Consolidated Financial Statements in Item 8. In preparing our financial statements, management is required to make estimates and assumptions that, among other things, affect the reported amounts in the Consolidated Financial Statements and accompanying notes. These estimates and assumptions are most significant where they involve levels of subjectivity and judgment necessary to account for highly uncertain matters or matters susceptible to change, and where they can have a material impact on our financial condition and operating performance. We discuss below the more significant estimates and related assumptions used in the preparation of our consolidated financial statements. If actual results were to differ materially from the estimates made, the reported results could be materially affected.
Revenue Recognition
We recognize revenue when the earnings process is complete. This occurs when risk and title transfers, collectibility is reasonably assured and pricing is fixed or determinable. Shipment terms to our battery product customers are either shipping point or destination and do not differ significantly between our business segments. Accordingly, revenue is recognized when risk and title is transferred to the customer. Amounts invoiced to customers for shipping and handling are classified as revenue. Taxes on revenue producing transactions are not included in net sales.
We recognize revenue from the service of reserve power and motive power products when the respective services are performed.
Management believes that the accounting estimates related to revenue recognition are critical accounting estimates because they require reasonable assurance of collection of revenue proceeds and completion of all performance obligations. Also, revenues are recorded net of provisions for sales discounts and returns, which are established at the time of sale. These estimates are based on our past experience.
Asset Impairment Determinations
We test for the impairment of our goodwill and indefinite-lived trademarks at least annually and whenever events or circumstances occur indicating that a possible impairment has been incurred.
We perform our annual goodwill impairment test on the first day of our fourth quarter for each of our reporting units based on the income approach, also known as the discounted cash flow (“DCF”) method, which utilizes the present value of future cash flows to estimate fair value. We also use the market approach, which utilizes market price data of companies engaged in the same or a similar line of business as that of our company, to estimate fair value. A reconciliation of the two methods is performed to assess the reasonableness of fair value of each of the reporting units.
The future cash flows used under the DCF method are derived from estimates of future revenues, operating income, working capital requirements and capital expenditures, which in turn reflect specific global, industry and market conditions. The discount rate developed for each of the reporting units is based on data and factors relevant to the economies in which the business operates and other risks associated with those cash flows, including the potential variability in the amount and timing of the cash flows. A terminal growth rate is applied to the final year of the projected period and reflects our estimate of stable growth to perpetuity. We then calculate the present value of the respective cash flows for each reporting unit to arrive at the fair value using the income approach and then determine the appropriate weighting between the fair value estimated using the income approach and the fair value estimated using the market approach. Finally, we compare the estimated fair value of each reporting unit to its respective carrying value in order to determine if the goodwill assigned to each reporting unit is potentially impaired. If the carrying amount of a reporting unit exceeds its fair value, we are required to perform a second step of the goodwill impairment test to measure the amount of impairment loss, if any. Step two of the goodwill impairment analysis measures the impairment charge by allocating the reporting unit's fair value to all of the assets and liabilities of the reporting unit in a hypothetical analysis that calculates the implied fair value of goodwill in the same manner as if the reporting unit was being acquired in a business combination. This allocation process is performed only for the purpose of measuring the goodwill impairment, and not to adjust the carrying values of the recognized tangible assets and liabilities. Any excess of the carrying value of the reporting unit's goodwill over the implied fair value of the reporting unit's goodwill is recorded as an impairment loss.
Significant assumptions used include management’s estimates of future growth rates, the amount and timing of future operating cash flows, capital expenditures, discount rates as well as market and industry conditions and relevant comparable company multiples for the market approach. Assumptions utilized are highly judgmental, especially given the role technology plays in driving the demand for products in the telecommunications and aerospace markets.
25
The indefinite-lived trademarks are tested for impairment by comparing the carrying value to the fair value based on current revenue projections of the related operations, under the relief from royalty method. Any excess carrying value over the amount of fair value is recognized as impairment. Any impairment would be recognized in full in the reporting period in which it has been identified.
With respect to our other long-lived assets other than goodwill and indefinite-lived trademarks, we test for impairment when indicators of impairment are present. An asset is considered impaired when the undiscounted estimated net cash flows expected to be generated by the asset are less than its carrying amount. The impairment recognized is the amount by which the carrying amount exceeds the fair value of the impaired asset.
Our annual goodwill impairment test, which we performed during the fourth quarter of fiscal 2016, resulted in an impairment charge for goodwill and trademarks in our Purcell and Quallion/ABSL US reporting units, which are both part of the Americas operating segment, and a charge for goodwill and fixed assets in our South Africa joint venture, which is a part of the EMEA operating segment, as discussed in Note 5 to the Consolidated Financial Statements. The excess of fair value over carrying value for each of our other reporting units as of December 28, 2015, the annual testing date, ranged from approximately 8% to approximately 118% of carrying value. The ABSL UK and Asia reporting units have the lowest excess of fair value over carrying value at 8% and 21%, respectively. The aggregate carrying value as of March 31, 2016, of goodwill and indefinite-lived intangibles of ABSL UK and Asia were $9.5 million and $58.3 million, respectively.
In order to evaluate the sensitivity of the fair value calculations on the goodwill impairment test, we applied a hypothetical 10% decrease to the fair values of each reporting unit. This hypothetical 10% decrease would result in the ABSL UK reporting unit having a fair value below its carrying value of 3%. For the remaining reporting units, such hypothetical decrease would result in excess fair values over carrying values range from approximately 9% to approximately 96% of the carrying values. We will continue to evaluate goodwill on an annual basis as of the beginning of our fourth fiscal quarter and whenever events or changes in circumstances, such as significant adverse changes in business climate or operating results, changes in management's business strategy or loss of a major customer, indicate that there may be a potential indicator of impairment.
Litigation and Claims
From time to time, the Company has been or may be a party to various legal actions and investigations including, among others, employment matters, compliance with government regulations, federal and state employment laws, including wage and hour laws, contractual disputes and other matters, including matters arising in the ordinary course of business. These claims may be brought by, among others, governments, customers, suppliers and employees. Management considers the measurement of litigation reserves as a critical accounting estimate because of the significant uncertainty in some cases relating to the outcome of potential claims or litigation and the difficulty of predicting the likelihood and range of potential liability involved, coupled with the material impact on our results of operations that could result from litigation or other claims.
In determining legal reserves, management considers, among other inputs:
• | interpretation of contractual rights and obligations; |
• | the status of government regulatory initiatives, interpretations and investigations; |
• | the status of settlement negotiations; |
• | prior experience with similar types of claims; |
• | whether there is available insurance coverage; and |
• | advice of outside counsel. |
Environmental Loss Contingencies
Accruals for environmental loss contingencies (i.e., environmental reserves) are recorded when it is probable that a liability has been incurred and the amount can reasonably be estimated. Management views the measurement of environmental reserves as a critical accounting estimate because of the considerable uncertainty surrounding estimation, including the need to forecast well into the future. From time to time, we may be involved in legal proceedings under federal, state and local, as well as international environmental laws in connection with our operations and companies that we have acquired. The estimation of environmental reserves is based on the evaluation of currently available information, prior experience in the remediation of contaminated sites and assumptions with respect to government regulations and enforcement activity, changes in remediation technology and practices, and financial obligations and creditworthiness of other responsible parties and insurers.
Warranty
26
We record a warranty reserve for possible claims against our product warranties, which generally run for a period ranging from one to twenty years for our reserve power batteries and for a period ranging from one to seven years for our motive power batteries. The assessment of the adequacy of the reserve includes a review of open claims and historical experience.
Management believes that the accounting estimate related to the warranty reserve is a critical accounting estimate because the underlying assumptions used for the reserve can change from time to time and warranty claims could potentially have a material impact on our results of operations.
Allowance for Doubtful Accounts
We encounter risks associated with sales and the collection of the associated accounts receivable. We record a provision for accounts receivable that are considered to be uncollectible. In order to calculate the appropriate provision, management analyzes the creditworthiness of specific customers and the aging of customer balances. Management also considers general and specific industry economic conditions, industry concentration and contractual rights and obligations.
Management believes that the accounting estimate related to the allowance for doubtful accounts is a critical accounting estimate because the underlying assumptions used for the allowance can change from time to time and uncollectible accounts could potentially have a material impact on our results of operations.
Retirement Plans
We use certain economic and demographic assumptions in the calculation of the actuarial valuation of liabilities associated with our defined benefit plans. These assumptions include the discount rate, expected long-term rates of return on assets and rates of increase in compensation levels. Changes in these assumptions can result in changes to the pension expense and recorded liabilities. Management reviews these assumptions at least annually. We use independent actuaries to assist us in formulating assumptions and making estimates. These assumptions are updated periodically to reflect the actual experience and expectations on a plan-specific basis, as appropriate. During fiscal 2016, we revised our mortality assumptions to incorporate the new set of improvement tables issued by the Society of Actuaries for purposes of measuring U.S. pension and other post-retirement obligations at year-end.
For benefit plans which are funded, we establish strategic asset allocation percentage targets and appropriate benchmarks for significant asset classes with the aim of achieving a prudent balance between return and risk. We set the expected long-term rate of return based on the expected long-term average rates of return to be achieved by the underlying investment portfolios. In establishing this rate, we consider historical and expected returns for the asset classes in which the plans are invested, advice from pension consultants and investment advisors, and current economic and capital market conditions. The expected return on plan assets is incorporated into the computation of pension expense. The difference between this expected return and the actual return on plan assets is deferred and will affect future net periodic pension costs through subsequent amortization.
We believe that the current assumptions used to estimate plan obligations and annual expense are appropriate in the current economic environment. However, if economic conditions change materially, we may change our assumptions, and the resulting change could have a material impact on the consolidated statements of income and on the consolidated balance sheets.
Equity-Based Compensation
We recognize compensation cost relating to equity-based payment transactions by using a fair-value measurement method whereby all equity-based payments to employees, including grants of restricted stock units, stock options and market condition-based awards are recognized as compensation expense based on fair value at grant date over the requisite service period of the awards. We determine the fair value of restricted stock units based on the quoted market price of our common stock on the date of grant. The fair value of stock options is determined using the Black-Scholes option-pricing model, which uses both historical and current market data to estimate the fair value. The fair value of market condition-based awards is estimated at the date of grant using a binomial lattice model or Monte Carlo Simulation. All models incorporate various assumptions such as the risk-free interest rate, expected volatility, expected dividend yield and expected life of the awards. When estimating the requisite service period of the awards, we consider many related factors including types of awards, employee class, and historical experience. Actual results, and future changes in estimates of the requisite service period may differ substantially from our current estimates.
Income Taxes
27
Our effective tax rate is based on pretax income, statutory tax rates and tax planning opportunities available in the various jurisdictions in which we operate. We account for income taxes in accordance with applicable guidance on accounting for income taxes, which requires that deferred tax assets and liabilities be recognized using enacted tax rates for the effect of temporary differences between book and tax bases on recorded assets and liabilities. Accounting guidance also requires that deferred tax assets be reduced by a valuation allowance, when it is more likely than not that a tax benefit will not be realized.
The recognition and measurement of a tax position is based on management’s best judgment given the facts, circumstances and information available at the reporting date. We evaluate tax positions to determine whether the benefits of tax positions are more likely than not of being sustained upon audit based on the technical merits of the tax position. For tax positions that are more likely than not of being sustained upon audit, we recognize the largest amount of the benefit that is greater than 50% likely of being realized upon ultimate settlement in the financial statements. For tax positions that are not more likely than not of being sustained upon audit, we do not recognize any portion of the benefit in the financial statements. If the more likely than not threshold is not met in the period for which a tax position is taken, we may subsequently recognize the benefit of that tax position if the tax matter is effectively settled, the statute of limitations expires, or if the more likely than not threshold is met in a subsequent period.
We evaluate, on a quarterly basis, our ability to realize deferred tax assets by assessing our valuation allowance and by adjusting the amount of such allowance, if necessary. The factors used to assess the likelihood of realization are our forecast of future taxable income and available tax planning strategies that could be implemented to realize the net deferred tax assets.
To the extent we prevail in matters for which reserves have been established, or are required to pay amounts in excess of our reserves, our effective tax rate in a given financial statement period could be materially affected.
Results of Operations—Fiscal 2016 Compared to Fiscal 2015
The following table presents summary consolidated statement of income data for fiscal year ended March 31, 2016, compared to fiscal year ended March 31, 2015:
Fiscal 2016 | Fiscal 2015 | Increase (Decrease) | |||||||||||||||||||
In Millions | As % Net Sales | In Millions | As % Net Sales | In Millions | % | ||||||||||||||||
Net sales | $ | 2,316.2 | 100.0 | % | $ | 2,505.5 | 100.0 | % | $ | (189.3 | ) | (7.6 | )% | ||||||||
Cost of goods sold | 1,704.5 | 73.6 | 1,864.6 | 74.4 | (160.1 | ) | (8.6 | ) | |||||||||||||
Gross profit | 611.7 | 26.4 | 640.9 | 25.6 | (29.2 | ) | (4.6 | ) | |||||||||||||
Operating expenses | 352.7 | 15.2 | 358.4 | 14.3 | (5.7 | ) | (1.6 | ) | |||||||||||||
Restructuring and other exit charges | 12.9 | 0.5 | 11.4 | 0.5 | 1.5 | 13.5 | |||||||||||||||
Impairment of goodwill, indefinite-lived intangibles and fixed assets | 36.3 | 1.6 | 23.9 | 1.0 | 12.4 | 51.4 | |||||||||||||||
Legal proceedings charge / (reversal of legal accrual, net of fees) | 3.2 | 0.1 | (16.2 | ) | (0.7 | ) | 19.4 | NM | |||||||||||||
Gain on sale of facility | (3.4 | ) | (0.1 | ) | — | — | (3.4 | ) | NM | ||||||||||||
Operating earnings | 210.0 | 9.1 | 263.4 | 10.5 | (53.4 | ) | (20.3 | ) | |||||||||||||
Interest expense | 22.3 | 1.0 | 19.7 | 0.8 | 2.6 | 13.7 | |||||||||||||||
Other (income) expense, net | 5.7 | 0.2 | (5.6 | ) | (0.2 | ) | 11.3 | NM | |||||||||||||
Earnings before income taxes | 182.0 | 7.9 | 249.3 | 9.9 | (67.3 | ) | (27.0 | ) | |||||||||||||
Income tax expense | 50.1 | 2.2 | 67.8 | 2.7 | (17.7 | ) | (26.1 | ) | |||||||||||||
Net earnings | 131.9 | 5.7 | 181.5 | 7.2 | (49.6 | ) | (27.4 | ) | |||||||||||||
Net (losses) earnings attributable to noncontrolling interests | (4.3 | ) | (0.2 | ) | 0.3 | — | (4.6 | ) | NM | ||||||||||||
Net earnings attributable to EnerSys stockholders | $ | 136.2 | 5.9 | % | $ | 181.2 | 7.2 | % | $ | (45.0 | ) | (24.9 | )% | ||||||||
NM = not meaningful
Overview
Our sales in fiscal 2016 were $2.3 billion, an 8% decrease from prior year's sales. This was the result of a 7% decrease due to foreign currency translation impact and a 2% decrease in organic volume, partially offset by a 1% increase from acquisitions.
28
Gross margin percentage in fiscal 2016 increased by 80 basis points to 26.4% compared to fiscal 2015, mainly due to lower commodity costs and favorable product mix combined with the benefits of restructuring programs in EMEA, despite a small decline in organic volume and an increase in warranty costs.
A discussion of specific fiscal 2016 versus fiscal 2015 operating results follows, including an analysis and discussion of the results of our reportable segments.
Net Sales
Net sales by reportable segment were as follows:
Fiscal 2016 | Fiscal 2015 | Increase (Decrease) | |||||||||||||||||||
In Millions | % Net Sales | In Millions | % Net Sales | In Millions | % | ||||||||||||||||
Americas | $ | 1,276.0 | 55.1 | % | $ | 1,322.4 | 52.8 | % | $ | (46.4 | ) | (3.5 | )% | ||||||||
EMEA | 787.4 | 34.0 | 948.8 | 37.9 | (161.4 | ) | (17.0 | ) | |||||||||||||
Asia | 252.8 | 10.9 | 234.3 | 9.3 | 18.5 | 7.9 | |||||||||||||||
Total net sales | $ | 2,316.2 | 100.0 | % | $ | 2,505.5 | 100.0 | % | $ | (189.3 | ) | (7.6 | )% | ||||||||
The Americas segment’s revenue decreased by $46.4 million or 3.5% in fiscal 2016, as compared to fiscal 2015, primarily due a decrease in currency translation impact and organic volume of approximately 2%, each.
The EMEA segment’s revenue decreased by $161.4 million or 17.0% in fiscal 2016, as compared to fiscal 2015, primarily due to a decrease in currency translation impact and organic volume of approximately 12% and 6%, respectively, partially offset by a 1% increase in pricing.
The Asia segment’s revenue increased by $18.5 million or 7.9% in fiscal 2016, as compared to fiscal 2015, primarily due to an increase from acquisitions and organic volume of approximately 13% and 6%, respectively, partially offset by a 10% decrease in currency translation impact and a 1% decrease due to pricing.
Net sales by product line were as follows:
Fiscal 2016 | Fiscal 2015 | Increase (Decrease) | |||||||||||||||||||
In Millions | As % Net Sales | In Millions | As % Net Sales | In Millions | % | ||||||||||||||||
Reserve power | $ | 1,109.2 | 47.9 | % | $ | 1,252.7 | 50.0 | % | $ | (143.5 | ) | (11.5 | )% | ||||||||
Motive power | 1,207.0 | 52.1 | 1,252.8 | 50.0 | (45.8 | ) | (3.7 | ) | |||||||||||||
Total net sales | $ | 2,316.2 | 100.0 | % | $ | 2,505.5 | 100.0 | % | $ | (189.3 | ) | (7.6 | )% | ||||||||
Sales in our reserve power product line decreased in fiscal 2016 by $143.5 million or 11.5% compared to the prior year primarily due to currency translation impact and lower organic volume of approximately 7% each, partially offset by a 2% increase from acquisitions.
Sales in our motive power product line decreased in fiscal 2016 by $45.8 million or 3.7% compared to the prior year primarily due to currency translation impact of 7%, partially offset by approximately 2% increase in organic volume and 1% increase in pricing.
Gross Profit
Fiscal 2016 | Fiscal 2015 | Increase (Decrease) | |||||||||||||||||||
In Millions | As % Net Sales | In Millions | As % Net Sales | In Millions | % | ||||||||||||||||
Gross profit | $ | 611.7 | 26.4 | % | $ | 640.9 | 25.6 | % | $ | (29.2 | ) | (4.6 | )% | ||||||||
29
Gross profit decreased $29.2 million or 4.6% in fiscal 2016 compared to fiscal 2015. Gross profit, excluding the effect of foreign currency translation, decreased $0.9 million or 0.1% in fiscal 2016 compared to fiscal 2015. The 80 basis point improvement in the gross profit margin is primarily due to lower commodity costs and favorable product mix combined with the benefits of restructuring programs in EMEA, despite a small decline in organic volume and an increase in warranty costs.
Operating Items
Fiscal 2016 | Fiscal 2015 | Increase (Decrease) | |||||||||||||||||||
In Millions | As % Net Sales | In Millions | As % Net Sales | In Millions | % | ||||||||||||||||
Operating expenses | $ | 352.7 | 15.2 | % | $ | 358.4 | 14.3 | % | $ | (5.7 | ) | (1.6 | )% | ||||||||
Restructuring and other exit charges | 12.9 | 0.5 | 11.4 | 0.5 | 1.5 | 13.5 | |||||||||||||||
Impairment of goodwill, indefinite-lived intangibles and fixed assets | 36.3 | 1.6 | 23.9 | 1.0 | 12.4 | 51.4 | |||||||||||||||
Legal proceedings charge / (reversal of legal accrual, net of fees) | 3.2 | 0.1 | (16.2 | ) | (0.7 | ) | 19.4 | NM | |||||||||||||
Gain on sale of facility | (3.4 | ) | (0.1 | ) | — | — | (3.4 | ) | NM | ||||||||||||
NM = not meaningful
Operating Expenses
Operating expenses decreased $5.7 million or 1.6% in fiscal 2016 from fiscal 2015. Operating expenses, excluding the effect of foreign currency translation, increased $16.1 million or 4.6% in fiscal 2016 compared to fiscal 2015. As a percentage of sales, operating expenses increased from 14.3% in fiscal 2015 to 15.2% in fiscal 2016 primarily due to lower sales coupled with higher implementation costs for a new ERP system in the Americas, higher bad debt, professional services, employee incentive and stock compensation and other payroll related expenses.
Restructuring and other exit charges
Included in fiscal 2016 operating results are restructuring and other exit charges in EMEA of $9.4 million and restructuring charges of $2.1 million and $1.4 million in Americas and Asia, respectively.
Included in fiscal 2015 operating results are restructuring and other exit charges in EMEA of $7.5 million and restructuring charges of $3.9 million in Asia.
Impairment of goodwill, indefinite-lived intangibles and fixed assets
In the fourth quarter of fiscal 2016, we conducted step one of our annual goodwill impairment test which indicated that the fair values of three of our reporting units - Purcell and Quallion/ABSL US in the Americas operating segment and our South Africa joint venture in the EMEA operating segment, were less than their respective carrying value, requiring us to perform step two of the goodwill impairment analysis.
Based on our analysis, the implied fair value of goodwill was lower than the carrying value of the goodwill for the Purcell and Quallion/ABSL US reporting units in the Americas operating segment and our joint venture in South Africa in the EMEA operating segment. We recorded a non-cash charge of $31.5 million related to goodwill impairment in the Americas and the EMEA operating segments. In addition, we recorded non-cash charges of $3.4 million related to impairment of indefinite-lived trademarks in the Americas and $1.4 million related to fixed assets in the EMEA operating segment. The combined charges resulted in a tax benefit of $4.2 million, for a net charge of $32.1 million.
The key factors contributing to the impairments in both fiscal years were that the reporting units in the Americas were recent acquisitions that have not performed to management's expectations. In the case of Purcell, the impairment was the result of lower estimated projected revenue and profitability in the near term caused by reduced level of capital spending by major customers in the telecommunications industry. In the case of Quallion/ABSL US, the impairment was the result of lower estimated projected revenue and profitability in the near term caused by delays, both in introducing new products and in programs serving the aerospace and defense markets. In the case of the South Africa joint venture, declining business conditions in South Africa resulted in negative cash flows.
Legal proceedings charge / (reversal of legal accrual, net of fees)
30
Certain of our European subsidiaries have received subpoenas and requests for documents and, in some cases, interviews from, and have had on-site inspections conducted by the competition authorities of Belgium, Germany and the Netherlands relating to conduct and anticompetitive practices of certain industrial battery participants. We are responding to inquiries related to these matters. We settled the Belgian regulatory proceeding in February 2016 by acknowledging certain anticompetitive practices and conduct and agreeing to pay a fine of $2.0 million, which we paid in March 2016 and as of March 31, 2016, we had a reserve balance of $2.0 million in connection with these remaining investigations and other related legal charges. For the Dutch and German regulatory proceedings, we do not believe that such an estimate can be made at this time given the early stages of these proceedings. The foregoing estimate of losses is based upon currently available information for these proceedings. However, the precise scope, timing and time period at issue, as well as the final outcome of the investigations, remains uncertain. Accordingly, our estimate may change from time to time, and actual losses could vary.
Included in our fiscal 2016 results is the reversal of a $0.8 million legal accrual in Americas, relating to legal fees, subsequent to the final settlement of the Altergy matter.
Operating Earnings
Operating earnings by segment were as follows:
Fiscal 2016 | Fiscal 2015 | Increase (Decrease) | |||||||||||||||||||
In Millions | As % Net Sales(1) | In Millions | As % Net Sales(1) | In Millions | % | ||||||||||||||||
Americas | $ | 182.7 | 14.3 | % | $ | 162.8 | 12.3 | % | $ | 19.9 | 12.3 | % | |||||||||
EMEA | 75.6 | 9.6 | 109.8 | 11.6 | (34.2 | ) | (31.1 | ) | |||||||||||||
Asia | 0.7 | 0.2 | 9.9 | 4.2 | (9.2 | ) | (94.3 | ) | |||||||||||||
Subtotal | 259.0 | 11.2 | 282.5 | 11.3 | (23.5 | ) | (8.3 | ) | |||||||||||||
Restructuring charges - Americas | (2.1 | ) | (0.2 | ) | — | — | (2.1 | ) | NM | ||||||||||||
Restructuring and other exit charges - EMEA | (9.4 | ) | (1.2 | ) | (7.5 | ) | (0.8 | ) | (1.9 | ) | 25.6 | ||||||||||
Restructuring charges - Asia | (1.4 | ) | (0.6 | ) | (3.9 | ) | (1.7 | ) | 2.5 | (63.3 | ) | ||||||||||
Impairment of goodwill and indefinite-lived intangibles - Americas | (33.0 | ) | (2.6 | ) | (23.1 | ) | (1.8 | ) | (9.9 | ) | 42.3 | ||||||||||
Impairment of goodwill and fixed assets - EMEA | (3.3 | ) | (0.4 | ) | (0.8 | ) | (0.1 | ) | (2.5 | ) | NM | ||||||||||
Reversal of legal accrual, net of fees - Americas | 0.8 | 0.1 | 16.2 | 1.2 | (15.4 | ) | (95.1 | ) | |||||||||||||
Legal proceedings charge - EMEA | (4.0 | ) | (0.5 | ) | — | — | (4.0 | ) | NM | ||||||||||||
Gain on sale of facility - Asia | 3.4 | 1.4 | — | — | 3.4 | NM | |||||||||||||||
Total | $ | 210.0 | 9.1 | % | $ | 263.4 | 10.5 | % | $ | (53.4 | ) | (20.3 | )% | ||||||||
NM = not meaningful
(1) | The percentages shown for the segments are computed as a percentage of the applicable segment’s net sales. |
Fiscal 2016 operating earnings of $210.0 million were $53.4 million lower than in fiscal 2015 and were 9.1% of sales. Fiscal 2016 operating earnings included $49.0 million in restructuring, impairment charges and legal proceedings accrual, net of reversals and a gain on sale of facility, compared to $19.1 million in fiscal 2015. Without these net charges, operating earnings were $259.0 million or 11.2% of sales in fiscal 2016 compared to $282.5 million or 11.3% of sales in fiscal 2015, which reflects a relatively stable environment for revenues, pricing and commodity costs between the two fiscal years.
The Americas segment’s operating earnings, excluding the highlighted items discussed above, increased $19.9 million or 12.3% in fiscal 2016 compared to fiscal 2015, with the operating margin increasing 200 basis points to 14.3%. This increase of operating margin in our Americas segment is primarily due to improved product mix and pricing, lower commodity costs, partially offset by higher implementation costs relating to a new ERP system.
31
The EMEA segment’s operating earnings, excluding the highlighted items discussed above, decreased $34.2 million or 31.1% in fiscal 2016 compared to fiscal 2015, with the operating margin decreasing 200 basis points to 9.6%. This decrease primarily reflects foreign currency headwinds and lower reserve power product sales, particularly in the emerging markets.
Operating earnings in Asia, excluding the highlighted items discussed above, decreased $9.2 million or 94.3% in fiscal 2016 compared to fiscal 2015, with the operating margin decreasing by 400 basis points to 0.2% primarily due to lower operating results of our subsidiary in India, foreign currency headwinds and reduced telecom sales.
Interest Expense
Fiscal 2016 | Fiscal 2015 | Increase (Decrease) | |||||||||||||||||||
In Millions | As % Net Sales | In Millions | As % Net Sales | In Millions | % | ||||||||||||||||
Interest expense | $ | 22.3 | 1.0 | % | $ | 19.7 | 0.8 | % | $ | 2.6 | 13.7 | % | |||||||||
Interest expense of $22.3 million in fiscal 2016 (net of interest income of $1.9 million) was $2.6 million higher than the $19.7 million in fiscal 2015 (net of interest income of $1.3 million). The increase in interest expense in fiscal 2016 compared to fiscal 2015 was primarily due to higher average debt outstanding, partially offset by lower accreted interest on the Convertible Notes in fiscal 2016 compared to fiscal 2015.
Our average debt outstanding (including the average amount of the Convertible Notes discount of $0.2 million) was $626.8 million in fiscal 2016, compared to our average debt outstanding (including the average amount of the Convertible Notes discount of $5.6 million) of $422.5 million in fiscal 2015. Our average cash interest rate incurred in fiscal 2016 was 3.1% compared to 2.3% in fiscal 2015. This higher average debt outstanding is the result of our stock buy back program under which $178 million of our shares were purchased during fiscal 2016.
Included in interest expense was non-cash, accreted interest on the Convertible Notes of $1.3 million in fiscal 2016 and $8.3 million in fiscal 2015. Also included in interest expense were non-cash charges related to amortization of deferred financing fees of $1.5 million in fiscal 2016 and $1.3 million in fiscal 2015.
Other (Income) Expense, Net
Fiscal 2016 | Fiscal 2015 | Increase (Decrease) | ||||||||||||||||||
In Millions | As % Net Sales | In Millions | As % Net Sales | In Millions | % | |||||||||||||||
Other (income) expense, net | $ | 5.7 | 0.2 | % | $ | (5.6 | ) | (0.2 | )% | $ | 11.3 | NM | ||||||||
NM = not meaningful
Other (income) expense, net was expense of $5.7 million in fiscal 2016 compared to income of $5.6 million in fiscal 2015. The unfavorable impact in fiscal 2016 is mainly attributable to foreign currency losses of $5.4 million in fiscal 2016 compared to foreign currency gains in fiscal 2015 of $5.0 million.
Earnings Before Income Taxes
Fiscal 2016 | Fiscal 2015 | Increase (Decrease) | |||||||||||||||||||
In Millions | As % Net Sales | In Millions | As % Net Sales | In Millions | % | ||||||||||||||||
Earnings before income taxes | $ | 182.0 | 7.9 | % | $ | 249.3 | 9.9 | % | $ | (67.3 | ) | (27.0 | )% | ||||||||
As a result of the factors discussed above, fiscal 2016 earnings before income taxes were $182.0 million, a decrease of $67.3 million or 27.0% compared to fiscal 2015.
32
Income Tax Expense
Fiscal 2016 | Fiscal 2015 | Increase (Decrease) | |||||||||||||||||||
In Millions | As % Net Sales | In Millions | As % Net Sales | In Millions | % | ||||||||||||||||
Income tax expense | $ | 50.1 | 2.2 | % | $ | 67.8 | 2.7 | % | $ | (17.7 | ) | (26.1 | )% | ||||||||
Effective tax rate | 27.5 | % | 27.2 | % | 0.3 | % | |||||||||||||||
Our effective income tax rate with respect to any period may be volatile based on the mix of income in the tax jurisdictions in which we operate and the amount of our consolidated income before taxes.
The Company’s income tax provisions consist of federal, state and foreign income taxes. The effective income tax rate was 27.5% in fiscal 2016 compared to the fiscal 2015 effective income tax rate of 27.2%. The rate increase in fiscal 2016 as compared to fiscal 2015 is primarily due to changes in the mix of earnings among tax jurisdictions. The fiscal 2016 effective income tax rate also includes an increase due to a larger non-deductible goodwill impairment charges as compared to fiscal 2015.
The fiscal 2016 foreign effective income tax rate on foreign pre-tax income of $117.7 million was 16.9% compared to foreign pre-tax income of $173.0 million and effective income tax rate of 14.8% in fiscal 2015. For both fiscal 2016 and fiscal 2015 the difference in the foreign effective tax rate versus the U.S. statutory rate of 35% is primarily attributable to lower tax rates in the foreign countries in which we operate.
Income from our Swiss subsidiary comprised a substantial portion of our overall foreign mix of income for both fiscal 2016 and fiscal 2015 and is taxed at approximately 7%.
Results of Operations—Fiscal 2015 Compared to Fiscal 2014
The following table presents summary consolidated statement of income data for fiscal year ended March 31, 2015, compared to fiscal year ended March 31, 2014:
Fiscal 2015 | Fiscal 2014 | Increase (Decrease) | |||||||||||||||||||
In Millions | As % Net Sales | In Millions | As % Net Sales | In Millions | % | ||||||||||||||||
Net sales | $ | 2,505.5 | 100.0 | % | $ | 2,474.4 | 100.0 | % | $ | 31.1 | 1.3 | % | |||||||||
Cost of goods sold | 1,864.6 | 74.4 | 1,844.8 | 74.6 | 19.8 | 1.1 | |||||||||||||||
Gross profit | 640.9 | 25.6 | 629.6 | 25.4 | 11.3 | 1.8 | |||||||||||||||
Operating expenses | 358.4 | 14.3 | 344.4 | 13.9 | 14.0 | 4.1 | |||||||||||||||
Restructuring and other exit charges | 11.4 | 0.5 | 27.4 | 1.1 | (16.0 | ) | (58.2 | ) | |||||||||||||
Impairment of goodwill and indefinite-lived intangibles | 23.9 | 1.0 | 5.2 | 0.2 | 18.7 | NM | |||||||||||||||
Legal proceedings charge (reversal of legal accrual, net of fees) | (16.2 | ) | (0.7 | ) | 58.2 | 2.3 | (74.4 | ) | NM | ||||||||||||
Operating earnings | 263.4 | 10.5 | 194.4 | 7.9 | 69.0 | 35.4 | |||||||||||||||
Interest expense | 19.7 | 0.8 | 17.1 | 0.7 | 2.6 | 14.8 | |||||||||||||||
Other (income) expense, net | (5.6 | ) | (0.2 | ) | 13.6 | 0.6 | (19.2 | ) | NM | ||||||||||||
Earnings before income taxes | 249.3 | 9.9 | 163.7 | 6.6 | 85.6 | 52.3 | |||||||||||||||
Income tax expense | 67.8 | 2.7 | 17.0 | 0.7 | 50.8 | NM | |||||||||||||||
Net earnings | 181.5 | 7.2 | 146.7 | 5.9 | 34.8 | 23.7 | |||||||||||||||
Net earnings (losses) attributable to noncontrolling interests | 0.3 | — | (3.6 | ) | (0.1 | ) | 3.9 | NM | |||||||||||||
Net earnings attributable to EnerSys stockholders | $ | 181.2 | 7.2 | % | $ | 150.3 | 6.0 | % | $ | 30.9 | 20.5 | % | |||||||||
33
Overview
Our sales in fiscal 2015 were $2.5 billion, a 1.3% increase from prior year's sales. This was the result of a 2% increase in organic volume and a 3% increase from acquisitions partially offset by a 4% decrease due to foreign currency translation impact.
Gross margin percentage in fiscal 2015 increased by 20 basis points to 25.6% compared to fiscal 2014, mainly due to higher organic volume and favorable product mix combined with the benefits of restructuring programs in EMEA.
A discussion of specific fiscal 2015 versus fiscal 2014 operating results follows, including an analysis and discussion of the results of our reportable segments.
Net Sales
Net sales by reportable segment were as follows:
Fiscal 2015 | Fiscal 2014 | Increase (Decrease) | |||||||||||||||||||
In Millions | % Net Sales | In Millions | % Net Sales | In Millions | % | ||||||||||||||||
Americas | $ | 1,322.4 | 52.8 | % | $ | 1,267.6 | 51.2 | % | $ | 54.8 | 4.3 | % | |||||||||
EMEA | 948.8 | 37.9 | 966.1 | 39.1 | (17.3 | ) | (1.8 | ) | |||||||||||||
Asia | 234.3 | 9.3 | 240.7 | 9.7 | (6.4 | ) | (2.6 | ) | |||||||||||||
Total net sales | $ | 2,505.5 | 100.0 | % | $ | 2,474.4 | 100.0 | % | $ | 31.1 | 1.3 | % | |||||||||
The Americas segment’s revenue increased by $54.8 million or 4.3% in fiscal 2015, as compared to fiscal 2014, primarily due to an increase in acquisitions and organic volume of approximately 4% and 2%, respectively, partially offset by a negative currency translation impact of approximately 2%.
The EMEA segment’s revenue decreased by $17.3 million or 1.8% in fiscal 2015, as compared to fiscal 2014, primarily due to an 8% decrease due to currency translation impact, partially offset by an increase of 5% in organic volume and a 1% increase in pricing.
The Asia segment’s revenue decreased by $6.4 million or 2.6% in fiscal 2015, as compared to fiscal 2014, primarily due to a 14% decrease in organic volume and a 3% decrease in currency translation impact, partially offset by a 14% increase in acquisitions. The decrease in Asia's organic volume was primarily due to lower sales to a major Chinese telecommunication company under a new tender program pursuant to which we participated at a lower volume.
Net sales by product line were as follows:
Fiscal 2015 | Fiscal 2014 | Increase (Decrease) | |||||||||||||||||||
In Millions | As % Net Sales | In Millions | As % Net Sales | In Millions | % | ||||||||||||||||
Reserve power | $ | 1,252.7 | 50.0 | % | $ | 1,234.5 | 49.9 | % | $ | 18.2 | 1.5 | % | |||||||||
Motive power | 1,252.8 | 50.0 | 1,239.9 | 50.1 | 12.9 | 1.1 | |||||||||||||||
Total net sales | $ | 2,505.5 | 100.0 | % | $ | 2,474.4 | 100.0 | % | $ | 31.1 | 1.3 | % | |||||||||
Sales in our reserve power product line increased in fiscal 2015 by $18.2 million or 1.5% compared to the prior year primarily due to acquisitions and higher organic volume which contributed approximately 5% and 1%, respectively, offset by negative currency translation impact of 4%.
Sales in our motive power product line increased in fiscal 2015 by $12.9 million or 1.1% compared to the prior year primarily due to higher organic volume and acquisitions of 2% each, pricing of approximately 1%, offset partially by negative currency translation impact of 4%.
Gross Profit
34
Fiscal 2015 | Fiscal 2014 | Increase (Decrease) | |||||||||||||||||||
In Millions | As % Net Sales | In Millions | As % Net Sales | In Millions | % | ||||||||||||||||
Gross profit | $ | 640.9 | 25.6 | % | $ | 629.6 | 25.4 | % | $ | 11.3 | 1.8 | % | |||||||||
Gross profit increased $11.3 million or 1.8% in fiscal 2015 compared to fiscal 2014. Gross profit, excluding the effect of foreign currency translation, increased $30.0 million or 4.7% in fiscal 2015 compared to fiscal 2014. This increase was primarily attributed to higher organic volume and favorable mix combined with the benefits of restructuring programs in EMEA.
Operating Items
Fiscal 2015 | Fiscal 2014 | Increase (Decrease) | |||||||||||||||||||
In Millions | As % Net Sales | In Millions | As % Net Sales | In Millions | % | ||||||||||||||||
Operating expenses | $ | 358.4 | 14.3 | % | $ | 344.4 | 13.9 | % | $ | 14.0 | 4.1 | % | |||||||||
Restructuring and other exit charges | 11.4 | 0.5 | 27.4 | 1.1 | (16.0 | ) | (58.2 | ) | |||||||||||||
Impairment of goodwill and indefinite-lived intangibles | 23.9 | 1.0 | 5.2 | 0.2 | 18.7 | NM | |||||||||||||||
Legal proceedings charge / (reversal of legal accrual, net of fees) | (16.2 | ) | (0.7 | ) | 58.2 | 2.3 | (74.4 | ) | NM | ||||||||||||
NM = not meaningful
Operating Expenses
Operating expenses increased $14.0 million or 4.1% in fiscal 2015 from fiscal 2014. Operating expenses, excluding the effect of foreign currency translation, increased $8.0 million or 2.3% in fiscal 2015 compared to fiscal 2014. As a percentage of sales, operating expenses increased from 13.9% in fiscal 2014 to 14.3% in fiscal 2015 primarily due to acquisitions, stock-based compensation, implementation costs for a new ERP system in the Americas, and payroll related expenses.
Restructuring and other exit charges
Included in fiscal 2015 operating results were restructuring and other exit charges in EMEA of $7.5 million and restructuring charges of $3.9 million in Asia.
In fiscal 2014, we recorded $27.4 million of restructuring charges, primarily for staff reductions and write-off of fixed assets and inventory in EMEA including relocating our motive power and a portion of our reserve power manufacturing from Bulgaria to our facilities in Western Europe. Included in these charges were exit charges of $5.6 million related to certain operations in Europe.
Impairment of goodwill and indefinite-lived intangibles
We perform our annual goodwill impairment test on the first day of our fourth quarter or whenever an event occurs that would more likely than not reduce the fair value of a reporting unit below its carrying amount. We use the income approach, also known as the discounted cash flow (“DCF”) method, which utilizes the present value of future cash flows to estimate fair value for each of our reporting units. We also use the market approach, which utilizes market price data of companies engaged in the same or a similar line of business as that of our company, to estimate fair value. A reconciliation of the two methods is performed to assess the reasonableness of fair value of each of the reporting units. The impairment test for goodwill is a two-step process. Step one consists of a comparison of the fair value of a reporting unit against its carrying amount, including the goodwill allocated to each reporting unit. If the carrying amount of the reporting unit is in excess of its fair value, step two requires the comparison of the implied fair value of the reporting unit’s goodwill against the carrying amount of the reporting unit’s goodwill. Any excess of the carrying value of the reporting unit’s goodwill over the implied fair value of the reporting unit’s goodwill is recorded as an impairment loss.
In the fourth quarter of fiscal 2015, we conducted step one of our annual goodwill impairment test which indicated that the fair values of two of our reporting units - Purcell and Quallion/ABSL US - in the Americas operating segment were less than their respective carrying value, and we proceeded to perform step two of the goodwill impairment analysis.
35
Step two of the goodwill impairment analysis measures the impairment charge by allocating the reporting unit's fair value to all of the assets and liabilities of the reporting unit in a hypothetical analysis that calculates the implied fair value of goodwill in the same manner as if the reporting unit was being acquired in a business combination. This allocation process was performed only for the purpose of measuring the goodwill impairment, and not to adjust the carrying values of the recognized tangible assets and liabilities. Any excess of the carrying value of the reporting unit's goodwill over the implied fair value of the reporting unit's goodwill is recorded as an impairment loss. Based on our analysis, the implied fair value of goodwill was lower than the carrying value of the goodwill for the Purcell and Quallion/ABSL US reporting units in the Americas operating segment. We recorded a non-cash charge of $20.3 million related to goodwill impairment in the Americas and EMEA operating segments and $3.6 million related to impairment of indefinite-lived trademarks in the Americas. The combined charges resulted in a tax benefit of $3.2 million, for a net charge of $20.7 million.
The key factors contributing to the impairments were that both reporting units were recent acquisitions that have not performed to our expectations. In the case of Purcell, sales were negatively impacted by the slowdown in the enclosure business resulting from lower capital spending by a major customer in the telecommunications market. In the case of Quallion/ABSL US, the cancellation of certain programs with a major contractor serving the aerospace and defense markets resulted in poor performance. The sales levels began to decline in our second quarter of fiscal 2015, and despite our initial expectation that the declines were temporary, their downward trend continued through fiscal 2015.
Legal proceedings charge / (reversal of legal accrual, net of fees)
In the fourth quarter of fiscal 2014, the Company recorded a $58.2 million legal proceedings charge in connection with an adverse arbitration result involving disputes between the Company's wholly-owned subsidiary, EnerSys Delaware Inc. (“EDI”), and Altergy Systems (“Altergy”). EDI and Altergy were parties to a Supply and Distribution Agreement (the “SDA”) pursuant to which EDI was, among other things, granted the exclusive right to distribute and sell certain fuel cell products manufactured by Altergy for various applications throughout the United States. Commencing in 2011, various disputes arose and, because of the mandatory arbitration provision in the SDA, the parties moved forward with arbitration in August 2013.
After discovery, a hearing and post-hearing submissions by each party, on May 13, 2014, the arbitration panel issued an award in favor of Altergy. As a result, the arbitration panel concluded that Altergy should recover $58.2 million in net money damages from EDI.
On August 12, 2014, EDI, on behalf of itself and its affiliates, entered into a binding term sheet with Altergy that resolved the outstanding legal challenges related to this award. In accordance with the term sheet, in September 2014, EDI and Altergy entered into (a) a settlement agreement and release of claims pursuant to which EDI paid Altergy $40.0 million in settlement of this award, a separate proceeding related to certain rights of EDI as a shareholder of Altergy and related litigations and the parties granted the other a release and (b) a stock purchase agreement pursuant to which Altergy paid EDI $2.0 million to purchase EDI’s entire equity interest in Altergy. On September 16, 2014, courts in the respective jurisdictions had issued orders ending all of the ongoing litigation between EDI and Altergy. Since the full amount of the initial award of $58.2 million was recorded in the fourth quarter of fiscal 2014, the Company reversed approximately $16.2 million, net of professional fees, from this previously recorded legal proceedings charge during the second quarter of fiscal 2015. The Company also included the $2.0 million received in exchange for its equity interest in Altergy in the Consolidated Statements of Income in Other (income) expense, net during the second quarter of fiscal 2015. The Company had previously written off the carrying value of the investment of $5.0 million in the third quarter of fiscal 2014.
36
Operating Earnings
Operating earnings by segment were as follows:
Fiscal 2015 | Fiscal 2014 | Increase (Decrease) | |||||||||||||||||||
In Millions | As % Net Sales(1) | In Millions | As % Net Sales(1) | In Millions | % | ||||||||||||||||
Americas | $ | 162.8 | 12.3 | % | $ | 179.1 | 14.1 | % | $ | (16.3 | ) | (9.1 | )% | ||||||||
EMEA | 109.8 | 11.6 | 84.9 | 8.8 | 24.9 | 29.4 | |||||||||||||||
Asia | 9.9 | 4.2 | 21.2 | 8.8 | (11.3 | ) | (53.2 | ) | |||||||||||||
Subtotal | 282.5 | 11.3 | 285.2 | 11.5 | (2.7 | ) | (0.9 | ) | |||||||||||||
Restructuring and other exit charges-EMEA | (7.5 | ) | (0.8 | ) | (27.1 | ) | (2.8 | ) | 19.6 | (72.1 | ) | ||||||||||
Restructuring charges-Asia | (3.9 | ) | (1.7 | ) | (0.3 | ) | (0.1 | ) | (3.6 | ) | NM | ||||||||||
Impairment of goodwill and indefinite-lived intangibles-Americas | (23.1 | ) | (1.8 | ) | — | — | (23.1 | ) | NM | ||||||||||||
Goodwill impairment charge-EMEA | (0.8 | ) | (0.1 | ) | — | — | (0.8 | ) | NM | ||||||||||||
Goodwill impairment charge-Asia | — | — | (5.2 | ) | (2.2 | ) | 5.2 | NM | |||||||||||||
Legal proceedings (charge) reversal of legal accrual, net of fees-Americas | 16.2 | 1.2 | (58.2 | ) | (4.6 | ) | 74.4 | NM | |||||||||||||
Total | $ | 263.4 | 10.5 | % | $ | 194.4 | 7.9 | % | $ | 69.0 | 35.4 | % | |||||||||
NM = not meaningful
(1) | The percentages shown for the segments are computed as a percentage of the applicable segment’s net sales. |
Fiscal 2015 operating earnings of $263.4 million were $69.0 million higher than in fiscal 2014 and were 10.5% of sales. Fiscal 2015 operating earnings included $19.1 million in net restructuring, impairment charges and reversal of legal proceedings accrual compared to $90.8 million in fiscal 2014. Without these charges, operating earnings were $282.5 million or 11.3% of sales in fiscal 2015 compared to $285.2 million or 11.5% of sales in fiscal 2014, which reflects a relatively stable environment for revenues, pricing and commodity costs between the two fiscal years.
The Americas segment’s operating earnings, excluding the highlighted items discussed above, decreased $16.3 million or 9.1% in fiscal 2015 compared to fiscal 2014, with the operating margin decreasing 180 basis points to 12.3%. This decrease of operating margin in our Americas segment was primarily due to lower pricing for a single customer, our recent acquisition of Purcell, which had not delivered the accretion we had expected, due primarily to the delay in capital spending in their enclosure programs by a large telecommunications customer, stock-based compensation and implementation costs relating to an ERP system.
The EMEA segment’s operating earnings, excluding the highlighted items discussed above, increased $24.9 million or 29.4% in fiscal 2015 compared to fiscal 2014, with the operating margin increasing 280 basis points to 11.6%. Benefits of the restructuring programs on both production and operating expenses and better pricing and customer mix drove the improvements. This improvement in EMEA earnings primarily reflected improved market segment mix across the business, 4G expansion, and strong reserve power demand in emerging markets and shifts to our premium TPPL solutions, further amplified by the execution of our restructuring programs.
Operating earnings in Asia, excluding the highlighted items discussed above, decreased $11.3 million or 53.2% in fiscal 2015 compared to fiscal 2014, with the operating margin decreasing by 460 basis points to 4.2% primarily due to costs associated
37
with a temporary shutdown at one of our plants in the PRC, transition to our new plant in the PRC, reduction in telecom sales in the PRC and adverse impact of currency translation in Australia and Japan.
Interest Expense
Fiscal 2015 | Fiscal 2014 | Increase (Decrease) | |||||||||||||||||||
In Millions | As % Net Sales | In Millions | As % Net Sales | In Millions | % | ||||||||||||||||
Interest expense | $ | 19.7 | 0.8 | % | $ | 17.1 | 0.7 | % | $ | 2.6 | 14.8 | % | |||||||||
Interest expense of $19.7 million in fiscal 2015 (net of interest income of $1.3 million) was $2.6 million higher than the $17.1 million in fiscal 2014 (net of interest income of $1.0 million). The increase in interest expense in fiscal 2015 compared to fiscal 2014 was primarily due to higher average debt outstanding and increased accreted interest on the Convertible Notes partially offset by lower average interest rates.
Our average debt outstanding (including the average amount of the Convertible Notes discount of $5.6 million) was $422.5 million in fiscal 2015, compared to our average debt outstanding (including the average amount of the Convertible Notes discount of $13.5 million) of $236.9 million in fiscal 2014. Our average cash interest rate incurred in fiscal 2015 was 2.3% compared to 3.5% in fiscal 2014. This higher average debt outstanding was the result of our stock buy back program under which over $205 million of our shares were purchased during fiscal 2015.
Included in interest expense was non-cash, accreted interest on the Convertible Notes of $8.3 million in fiscal 2015 and $7.6 million in fiscal 2014. Also included in interest expense were non-cash charges related to amortization of deferred financing fees of $1.3 million in fiscal 2015 and $1.1 million in fiscal 2014.
Other (Income) Expense, Net
Fiscal 2015 | Fiscal 2014 | Increase (Decrease) | ||||||||||||||||||
In Millions | As % Net Sales | In Millions | As % Net Sales | In Millions | % | |||||||||||||||
Other (income) expense, net | $ | (5.6 | ) | (0.2 | )% | $ | 13.6 | 0.6 | % | $ | (19.2 | ) | NM | |||||||
NM = not meaningful
Other (income) expense, net was income of $5.6 million in fiscal 2015 compared to expense of $13.6 million in fiscal 2014. The favorable impact in fiscal 2015 was mainly attributable to foreign currency gains of $5.0 million in fiscal 2015 compared to foreign currency losses in fiscal 2014 of $5.8 million due mainly to the impact of a strong U.S. dollar and a weak euro on our foreign exchange exposures. Also contributing to the favorable impact in fiscal 2015 was the receipt of $2.0 million in exchange for our equity interest in Altergy pursuant to the final legal settlement with Altergy compared to the write-off of $5.0 million relating to the carrying value of our investment in Altergy and $1.5 million relating to other charges in fiscal 2014.
Earnings Before Income Taxes
Fiscal 2015 | Fiscal 2014 | Increase (Decrease) | |||||||||||||||||||
In Millions | As % Net Sales | In Millions | As % Net Sales | In Millions | % | ||||||||||||||||
Earnings before income taxes | $ | 249.3 | 9.9 | % | $ | 163.7 | 6.6 | % | $ | 85.6 | 52.3 | % | |||||||||
As a result of the factors discussed above, fiscal 2015 earnings before income taxes were $249.3 million, an increase of $85.6 million or 52.3% compared to fiscal 2014.
38
Income Tax Expense
Fiscal 2015 | Fiscal 2014 | Increase (Decrease) | ||||||||||||||||||
In Millions | As % Net Sales | In Millions | As % Net Sales | In Millions | % | |||||||||||||||
Income tax expense | $ | 67.8 | 2.7 | % | $ | 17.0 | 0.7 | % | $ | 50.8 | NM | |||||||||
Effective tax rate | 27.2 | % | 10.4 | % | 16.8 | % | ||||||||||||||
NM = not meaningful
Our effective income tax rate with respect to any period may be volatile based on the mix of income in the tax jurisdictions in which we operate and the amount of our consolidated income before taxes.
The Company’s income tax provisions consist of federal, state and foreign income taxes. The effective income tax rate was 27.2% in fiscal 2015 compared to the fiscal 2014 effective income tax rate of 10.4%. The rate increase in fiscal 2015 as compared to fiscal 2014 was primarily due to the reversal of a previously recognized deferred tax valuation allowance related to one of our foreign subsidiaries of $24.9 million in fiscal 2014 and changes in the mix of earnings among tax jurisdictions, which were significantly impacted by a legal proceedings charge recorded in fiscal 2014. The fiscal 2015 effective income tax rate also includes an increase due to non-deductible goodwill impairment charges.
The fiscal 2015 foreign effective income tax rate on foreign pre-tax income of $173.0 million was 14.8%. The difference in the foreign effective tax rate versus the U.S. statutory rate of 35% was primarily attributable to lower tax rates in the foreign countries in which we operate. The fiscal 2014 foreign effective income tax rate on foreign pre-tax income of $116.0 million was a net benefit of 4.0%. The difference in the foreign effective tax rate versus the U.S. statutory rate of 35% was primarily due to a release of a valuation allowance in a European subsidiary combined with lower statutory tax rates in foreign countries. The foreign effective income tax rate of fiscal 2014 without the valuation allowance release was 17.5%, and was higher than the fiscal 2015 foreign effective income tax rate of 14.8% due to a change in mix of earnings between foreign jurisdictions.
Income from our Swiss subsidiary comprised a substantial portion of our overall foreign mix of income for both fiscal 2015 and fiscal 2014 and was taxed at approximately 7%.
Liquidity and Capital Resources
Cash Flow and Financing Activities
Cash and cash equivalents at March 31, 2016, 2015 and 2014, were $397.3 million, $268.9 million and $240.1 million, respectively.
Cash provided by operating activities for fiscal 2016, 2015 and 2014, was $307.6 million, $194.5 million and $193.6 million, respectively.
During fiscal 2016, cash from operating activities was provided primarily from net earnings of $131.8 million, depreciation and amortization of $56.0 million, non-cash charges relating to write-off of goodwill and other assets of $36.3 million, stock-based compensation of $19.6 million, provision of doubtful accounts of $4.7 million, restructuring of $3.8 million and non-cash interest of $2.8 million and were partially offset by a gain of $4.3 million on sale of our facility in the PRC. Also contributing to our cash provided from operating activities was the decrease in primary working capital of $55.0 million, net of currency translation changes.
During fiscal 2015, cash from operating activities was provided primarily from net earnings of $181.5 million, depreciation and amortization of $57.0 million, non-cash charges relating to write-off of goodwill and other assets of $23.9 million, deferred taxes of $31.9 million, stock-based compensation of $25.3 million, non-cash interest and restructuring charges of $9.5 million and $3.3 million, respectively, and were partially offset by a non-cash gain of $2.0 million on disposition of our equity interest in Altergy and non-cash credits relating to the reversal of the remaining legal accrual of $16.2 million. Also partially offsetting our cash provided from operating activities was the increase in Primary Working Capital of $49.9 million, net of currency translation changes and our payment of $40.0 million towards the Altergy award, pursuant to the final legal settlement of the Altergy matter and accrued income tax expense of $15.5 million.
39
During fiscal 2014, cash from operating activities was provided primarily from net earnings of $146.7 million, depreciation and amortization of $54.0 million, non-cash charges relating to write-off of goodwill and other assets of $10.2 million, restructuring charges of $11.5 million, a net source of $25.6 million from non-cash interest expense and stock compensation, $90.3 million from other accrued, including the legal proceedings charge of $58.2 million, and was partially offset by cash used for the increase in Primary Working Capital of $77.0 million and deferred taxes of $49.7 million, net of currency translation changes.
As explained in the discussion of our use of “non-GAAP financial measures,” we monitor the level and percentage of Primary Working Capital to sales. Primary Working Capital for this purpose is trade accounts receivable, plus inventories, minus trade accounts payable and the resulting net amount is divided by the trailing three-month net sales (annualized) to derive a primary working capital percentage. Primary Working Capital was $593.4 million (yielding a Primary Working Capital percentage of 24.3%) at March 31, 2016 and $636.6 million (yielding a Primary Working Capital percentage of 25.3%) at March 31, 2015.
Primary Working Capital and Primary Working Capital percentages at March 31, 2016, 2015 and 2014 are computed as follows:
At March 31, | Trade Receivables | Inventory | Accounts Payable | Primary Working Capital | Quarter Revenue Annualized | Primary Working Capital (%) | |||||||||||||||||
(in millions) | |||||||||||||||||||||||
2016 | $ | 490.8 | $ | 331.0 | $ | (228.4 | ) | $ | 593.4 | $ | 2,445.9 | 24.3 | % | ||||||||||
2015 | 518.2 | 337.0 | (218.6 | ) | 636.6 | 2,519.6 | 25.3 | ||||||||||||||||
2014 | 564.6 | 361.8 | (259.5 | ) | 666.9 | 2,661.0 | 25.1 | ||||||||||||||||
Cash used in investing activities for fiscal 2016, 2015 and 2014 was $80.9 million, $59.6 million and $232.0 million, respectively. Capital expenditures were $55.9 million, $63.6 million and $62.0 million in fiscal 2016, 2015 and 2014, respectively. Our current year’s capital spending focused primarily on continuous improvement to our equipment and facilities world-wide, the continuation of a new ERP system implementation for our Americas and Asia businesses and an office building expansion to our Reading, Pennsylvania offices.
During fiscal 2016, we acquired ICS Industries Pty. Ltd. (ICS), headquartered in Melbourne Australia for $34.5 million. There were no acquisitions in fiscal 2015. In fiscal 2014, our purchases of and investments in businesses were $171.5 million with three significant acquisitions comprising Purcell Systems Inc., a designer, manufacturer and marketer of thermally managed electronic equipment and battery cabinet enclosures, Quallion, LLC, a manufacturer of lithium ion cells and batteries for medical devices, defense, aviation and space, and UTS Holdings Sdn. Bhd. and its subsidiaries, a distributor of motive and reserve power battery products and services.
During fiscal 2016 financing activities used cash of $105.7 million primarily due to revolver repayments of $360.8 million, purchase of treasury stock for $178.2 million, principal payment of $172.3 million to the Convertible Notes holders, payment of cash dividends to our stockholders of $30.9 million, repayment on Term Loan of $7.5 million and debt issuance costs of $5.0 million relating to the Notes. This was partially offset by revolver borrowings of $355.8 million and the issuance of $300.0 million of the Notes. Taxes paid related to net share settlement of equity awards, net of option proceeds and related tax benefits also resulted in a net outflow of $10.9 million. Net borrowings on short-term debt were $4.2 million.
During fiscal 2015, financing activities used cash of $59.3 million primarily due to revolver borrowings and repayments of $372.7 million and $322.7 million, respectively, and $150.0 million incremental term loan borrowing under the 2011 Credit Facility, purchase of treasury stock for $205.4 million and payment of cash dividends to our stockholders of $31.7 million. Taxes paid related to net share settlement of equity awards, net of option proceeds and related tax benefits resulted in a net outflow of $8.6 million. Net repayments on short-term debt were $11.9 million.
During fiscal 2014, we borrowed $251.9 million on our revolver and repaid $126.9 million. Borrowings on short-term debt were $8.5 million. During fiscal 2014, we repurchased $69.9 million of our common stock and paid cash dividends to our stockholders of $23.7 million. We also acquired the share of noncontrolling interests in one of our foreign subsidiaries for $6.0 million and paid deferred consideration of $4.8 million in connection with an acquisition made in fiscal 2012. Taxes paid related to net share settlement of equity awards, net of option proceeds and related tax benefits resulted in a net outflow of $6.3 million in fiscal 2014.
40
As a result of the above, cash and cash equivalents increased $128.4 million from $268.9 million at March 31, 2015 to $397.3 million at March 31, 2016.
We currently are in compliance with all covenants and conditions under our credit agreements.
In addition to cash flows from operating activities, we had available committed and uncommitted credit lines of approximately $472 million at March 31, 2016 to cover short-term liquidity requirements. Our 2011 Credit Facility is committed through September 2018, as long as we continue to comply with the covenants and conditions of the credit facility agreement. Included in our available credit lines at March 31, 2016 is $328 million under our 2011 Credit Facility.
We believe that our cash flow from operations, available cash and cash equivalents and available borrowing capacity under our credit facilities will be sufficient to meet our liquidity needs, including normal levels of capital expenditures, for the foreseeable future; however, there can be no assurance that this will be the case.
Off-Balance Sheet Arrangements
The Company did not have any off-balance sheet arrangements during any of the periods covered by this report.
Contractual Obligations and Commercial Commitments
At March 31, 2016, we had certain cash obligations, which are due as follows:
Total | Less than 1 year | 2 to 3 years | 4 to 5 years | After 5 years | ||||||||||||||||
(in millions) | ||||||||||||||||||||
Debt obligations | $ | 612.5 | $ | 15.0 | $ | 297.5 | $ | — | $ | 300.0 | ||||||||||
Short-term debt | 22.1 | 22.1 | — | — | — | |||||||||||||||
Interest on debt | 121.4 | 21.5 | 38.6 | 30.0 | 31.3 | |||||||||||||||
Operating leases | 69.0 | 20.3 | 27.2 | 15.1 | 6.4 | |||||||||||||||
Pension benefit payments and profit sharing | 35.7 | 2.7 | 5.2 | 6.7 | 21.1 | |||||||||||||||
Restructuring | 3.0 | 3.0 | — | — | — | |||||||||||||||
Lead and foreign currency forward contracts | 1.5 | 1.5 | — | — | — | |||||||||||||||
Purchase commitments | 15.2 | 15.2 | — | — | — | |||||||||||||||
Capital lease obligations, including interest | 0.2 | 0.1 | 0.1 | — | — | |||||||||||||||
Total | $ | 880.6 | $ | 101.4 | $ | 368.6 | $ | 51.8 | $ | 358.8 | ||||||||||
Due to the uncertainty of future cash outflows, uncertain tax positions have been excluded from the above table.
Under our 2011 Credit Facility and other credit arrangements, we had outstanding standby letters of credit of $2.7 million as of March 31, 2016.
Credit Facilities and Leverage
Our focus on working capital management and cash flow from operations is measured by our ability to reduce debt and reduce our leverage ratios. Shown below are the leverage ratios at March 31, 2016 and 2015, in connection with our 2011 Credit Facility.
The total net debt as defined under our 2011 Credit Facility is $491.9 million for fiscal 2016 and is 1.5 times adjusted EBITDA (non-GAAP) as described below.
41
The following table provides a reconciliation of net earnings to EBITDA (non-GAAP) and adjusted EBITDA (non-GAAP) as per our 2011 Credit Facility:
Fiscal 2016 | Fiscal 2015 | |||||||
(in millions, except ratios) | ||||||||
Net earnings as reported | $ | 131.9 | $ | 181.5 | ||||
Add back: | ||||||||
Depreciation and amortization | 56.0 | 57.0 | ||||||
Interest expense | 22.3 | 19.7 | ||||||
Income tax expense | 50.1 | 67.8 | ||||||
EBITDA (non GAAP)(1) | $ | 260.3 | $ | 326.0 | ||||
Adjustments per credit agreement definitions(2) | 60.5 | 52.6 | ||||||
Adjusted EBITDA (non-GAAP) per credit agreement | $ | 320.8 | $ | 378.6 | ||||
Total net debt(3) | $ | 491.9 | $ | 392.3 | ||||
Leverage ratios: | ||||||||
Total net debt/adjusted EBITDA ratio(4) | 1.5 X | 1.0 X | ||||||
Maximum ratio permitted | 3.25 X | 3.25 X | ||||||
Consolidated interest coverage ratio(5) | 16.4 X | 37.5 X | ||||||
Minimum ratio required | 4.5 X | 4.5 X | ||||||
(1) | We have included EBITDA (non-GAAP) and adjusted EBITDA (non-GAAP) because our lenders use it as a key measure of our performance. EBITDA is defined as earnings before interest expense, income tax expense, depreciation and amortization. EBITDA is not a measure of financial performance under GAAP and should not be considered an alternative to net earnings or any other measure of performance under GAAP or to cash flows from operating, investing or financing activities as an indicator of cash flows or as a measure of liquidity. Our calculation of EBITDA may be different from the calculations used by other companies, and therefore comparability may be limited. Certain financial covenants in our 2011 Credit Facility are based on EBITDA, subject to adjustments, which are shown above. Continued availability of credit under our 2011 Credit Facility is critical to our ability to meet our business plans. We believe that an understanding of the key terms of our credit agreement is important to an investor’s understanding of our financial condition and liquidity risks. Failure to comply with our financial covenants, unless waived by our lenders, would mean we could not borrow any further amounts under our revolving credit facility and would give our lenders the right to demand immediate repayment of all outstanding revolving credit loans. We would be unable to continue our operations at current levels if we lost the liquidity provided under our credit agreements. Depreciation and amortization in this table excludes the amortization of deferred financing fees, which is included in interest expense. |
(2) | The $60.5 million adjustment to EBITDA in fiscal 2016 primarily related to $19.6 million of non-cash stock compensation, $3.8 million of non-cash restructuring and other exit charges and $36.3 million of impairment of goodwill, indefinite-lived intangibles and fixed assets and $0.7 million of acquisition expenses. The $52.6 million adjustment to EBITDA in fiscal 2015 primarily related to $25.3 million of non-cash stock compensation, $3.3 million of non-cash restructuring and other exit charges and $23.9 million of impairment of goodwill and indefinite-lived intangibles. |
(3) | Debt includes capital lease obligations and letters of credit and is net of U.S. cash and cash equivalents and a portion of European cash investments, as defined in the 2011 Credit Facility. In fiscal 2016, the amounts deducted in the calculation of net debt were U.S. cash and cash equivalents and foreign cash investments of $148 million, respectively, and in fiscal 2015, $128 million, respectively. |
(4) | These ratios are included to show compliance with the leverage ratios set forth in our credit facilities. We show both our current ratios and the maximum ratio permitted or minimum ratio required under our 2011 Credit Facility. |
(5) | As defined in the 2011 Credit Facility, for fiscal 2016 interest expense used in the consolidated interest coverage ratio excludes non-cash interest of $2.8 million. For fiscal 2015, interest expense used in the consolidated interest coverage ratio excludes non-cash interest of $9.5 million. |
RECENTLY ADOPTED ACCOUNTING PRONOUNCEMENTS
See Note 1 to the Consolidated Financial Statements - Summary of Significant Accounting Policies for a description of certain recently issued accounting standards that were adopted or are pending adoption that could have a significant impact on our Consolidated Financial Statements or the Notes to the Consolidated Financial Statements.
42
Related Party Transactions
None.
Sequential Quarterly Information
Fiscal 2016 and 2015 quarterly operating results, and the associated quarterly trends within each of those two fiscal years, are affected by the same economic and business conditions as described in the fiscal 2016 versus fiscal 2015 analysis previously discussed.
Fiscal 2016 | Fiscal 2015 | |||||||||||||||||||||||||||||||
June 28, 2015 1st Qtr. | Sep. 27, 2015 2nd Qtr. | Dec. 27, 2015 3rd Qtr. | March 31, 2016 4th Qtr. | June 29, 2014 1st Qtr. | Sep. 28, 2014 2nd Qtr. | Dec. 28, 2014 3rd Qtr. | March 31, 2015 4th Qtr. | |||||||||||||||||||||||||
(in millions, except share and per share amounts) | ||||||||||||||||||||||||||||||||
Net sales | $ | 562.1 | $ | 569.1 | $ | 573.6 | $ | 611.4 | $ | 634.1 | $ | 629.9 | $ | 611.6 | $ | 629.9 | ||||||||||||||||
Cost of goods sold | 411.7 | 414.1 | 427.8 | 450.9 | 471.5 | 467.4 | 454.3 | 471.4 | ||||||||||||||||||||||||
Gross profit | 150.4 | 155.0 | 145.8 | 160.5 | 162.6 | 162.5 | 157.3 | 158.5 | ||||||||||||||||||||||||
Operating expenses | 84.5 | 89.6 | 87.1 | 91.5 | 89.1 | 96.9 | 86.2 | 86.2 | ||||||||||||||||||||||||
Restructuring and other exit charges | 1.2 | 2.6 | 3.2 | 5.9 | 1.8 | 1.8 | 2.4 | 5.4 | ||||||||||||||||||||||||
Impairment of goodwill, indefinite-lived intangibles and fixed assets | — | — | — | 36.3 | — | — | — | 23.9 | ||||||||||||||||||||||||
Legal proceedings charge / (reversal of legal accrual, net of fees) | — | 3.2 | — | — | — | (16.2 | ) | — | — | |||||||||||||||||||||||
(Gain) loss on sale of facility | (4.3 | ) | — | — | 0.9 | — | — | — | — | |||||||||||||||||||||||
Operating earnings | 69.0 | 59.6 | 55.5 | 25.9 | 71.7 | 80.0 | 68.7 | 43.0 | ||||||||||||||||||||||||
Interest expense | 6.3 | 5.1 | 5.3 | 5.6 | 4.9 | 4.3 | 5.0 | 5.5 | ||||||||||||||||||||||||
Other (income) expense, net | 0.7 | 0.7 | 1.2 | 3.1 | 1.0 | (3.4 | ) | (0.9 | ) | (2.3 | ) | |||||||||||||||||||||
Earnings before income taxes | 62.0 | 53.8 | 49.0 | 17.2 | 65.8 | 79.1 | 64.6 | 39.8 | ||||||||||||||||||||||||
Income tax expense | 14.1 | 14.0 | 10.8 | 11.2 | 16.7 | 22.5 | 15.3 | 13.3 | ||||||||||||||||||||||||
Net earnings | 47.9 | 39.8 | 38.2 | 6.0 | 49.1 | 56.6 | 49.3 | 26.5 | ||||||||||||||||||||||||
Net (losses) earnings attributable to noncontrolling interests | (0.5 | ) | (0.2 | ) | (0.3 | ) | (3.3 | ) | (0.1 | ) | 0.3 | 0.1 | — | |||||||||||||||||||
Net earnings attributable to EnerSys stockholders | $ | 48.4 | $ | 40.0 | $ | 38.5 | $ | 9.3 | $ | 49.2 | $ | 56.3 | $ | 49.2 | $ | 26.5 | ||||||||||||||||
Net earnings per common share attributable to EnerSys stockholders: | ||||||||||||||||||||||||||||||||
Basic | $ | 1.09 | $ | 0.89 | $ | 0.87 | $ | 0.21 | $ | 1.05 | $ | 1.22 | $ | 1.09 | $ | 0.60 | ||||||||||||||||
Diluted | $ | 1.03 | $ | 0.87 | $ | 0.86 | $ | 0.21 | $ | 0.99 | $ | 1.16 | $ | 1.04 | $ | 0.57 | ||||||||||||||||
Weighted-average number of common shares outstanding: | ||||||||||||||||||||||||||||||||
Basic | 44,233,915 | 44,944,027 | 44,394,925 | 43,533,985 | 46,899,303 | 46,133,637 | 45,188,942 | 44,203,385 | ||||||||||||||||||||||||
Diluted | 46,756,376 | 46,005,399 | 44,976,204 | 44,158,541 | 49,726,238 | 48,537,276 | 47,368,173 | 46,579,230 | ||||||||||||||||||||||||
43
Net Sales
Quarterly net sales by segment were as follows:
Fiscal 2016 | Fiscal 2015 | |||||||||||||||||||||||||||||||
1st Qtr. | 2nd Qtr. | 3rd Qtr. | 4th Qtr. | 1st Qtr. | 2nd Qtr. | 3rd Qtr. | 4th Qtr. | |||||||||||||||||||||||||
(in millions) | ||||||||||||||||||||||||||||||||
Net sales by segment: | ||||||||||||||||||||||||||||||||
Americas | $ | 317.0 | $ | 322.5 | $ | 306.3 | $ | 330.2 | $ | 330.9 | $ | 333.2 | $ | 314.3 | $ | 344.0 | ||||||||||||||||
EMEA | 196.7 | 189.4 | 196.8 | 204.5 | 242.0 | 233.3 | 242.3 | 231.2 | ||||||||||||||||||||||||
Asia | 48.4 | 57.2 | 70.5 | 76.7 | 61.2 | 63.4 | 55.0 | 54.7 | ||||||||||||||||||||||||
Total | $ | 562.1 | $ | 569.1 | $ | 573.6 | $ | 611.4 | $ | 634.1 | $ | 629.9 | $ | 611.6 | $ | 629.9 | ||||||||||||||||
Segment net sales as % of total: | ||||||||||||||||||||||||||||||||
Americas | 56.4 | % | 56.7 | % | 53.4 | % | 54.0 | % | 52.2 | % | 52.9 | % | 51.4 | % | 54.6 | % | ||||||||||||||||
EMEA | 35.0 | 33.3 | 34.3 | 33.4 | 38.1 | 37.0 | 39.6 | 36.7 | ||||||||||||||||||||||||
Asia | 8.6 | 10.0 | 12.3 | 12.6 | 9.7 | 10.1 | 9.0 | 8.7 | ||||||||||||||||||||||||
Total | 100.0 | % | 100.0 | % | 100.0 | % | 100.0 | % | 100.0 | % | 100.0 | % | 100.0 | % | 100.0 | % | ||||||||||||||||
Quarterly net sales by product line were as follows:
Fiscal 2016 | Fiscal 2015 | |||||||||||||||||||||||||||||||
1st Qtr. | 2nd Qtr. | 3rd Qtr. | 4th Qtr. | 1st Qtr. | 2nd Qtr. | 3rd Qtr. | 4th Qtr. | |||||||||||||||||||||||||
(in millions) | ||||||||||||||||||||||||||||||||
Net sales by product line: | ||||||||||||||||||||||||||||||||
Reserve power | $ | 264.3 | $ | 274.2 | $ | 272.0 | $ | 298.7 | $ | 311.4 | $ | 315.5 | $ | 307.0 | $ | 318.8 | ||||||||||||||||
Motive power | 297.8 | 294.9 | 301.6 | 312.7 | 322.7 | 314.4 | 304.6 | 311.1 | ||||||||||||||||||||||||
Total | $ | 562.1 | $ | 569.1 | $ | 573.6 | $ | 611.4 | $ | 634.1 | $ | 629.9 | $ | 611.6 | $ | 629.9 | ||||||||||||||||
Product line net sales as % of total: | ||||||||||||||||||||||||||||||||
Reserve power | 47.0 | % | 48.2 | % | 47.4 | % | 48.9 | % | 49.1 | % | 50.1 | % | 50.2 | % | 50.6 | % | ||||||||||||||||
Motive power | 53.0 | 51.8 | 52.6 | 51.1 | 50.9 | 49.9 | 49.8 | 49.4 | ||||||||||||||||||||||||
Total | 100.0 | % | 100.0 | % | 100.0 | % | 100.0 | % | 100.0 | % | 100.0 | % | 100.0 | % | 100.0 | % | ||||||||||||||||
ITEM 7A. | QUANTITATIVE AND QUALITATIVE DISCLOSURES ABOUT MARKET RISK |
Market Risks
Our cash flows and earnings are subject to fluctuations resulting from changes in interest rates, foreign currency exchange rates and raw material costs. We manage our exposure to these market risks through internally established policies and procedures and, when deemed appropriate, through the use of derivative financial instruments. Our policy does not allow speculation in derivative instruments for profit or execution of derivative instrument contracts for which there are no underlying exposures. We do not use financial instruments for trading purposes and are not a party to any leveraged derivatives. We monitor our underlying market risk exposures on an ongoing basis and believe that we can modify or adapt our hedging strategies as needed.
Counterparty Risks
We have entered into lead forward purchase contracts and foreign exchange forward and purchased option contracts to manage the risk associated with our exposures to fluctuations resulting from changes in raw material costs and foreign currency
44
exchange rates. The Company’s agreements are with creditworthy financial institutions. Those contracts that result in a liability position at March 31, 2016 are $1.8 million (pre-tax). Those contracts that result in an asset position at March 31, 2016 are $0.3 million (pre-tax) and the vast majority of these will settle within one year. The impact on the Company due to nonperformance by the counterparties has been evaluated and not deemed material.
Interest Rate Risks
We are exposed to changes in variable U.S. interest rates on borrowings under our credit agreements as well as short term borrowings in our foreign subsidiaries.
A 100 basis point increase in interest rates would have increased annual interest expense by approximately $3.3 million on the variable rate portions of our debt.
Commodity Cost Risks—Lead Contracts
We have a significant risk in our exposure to certain raw materials. Our largest single raw material cost is for lead, for which the cost remains volatile. In order to hedge against increases in our lead cost, we have entered into forward contracts with financial institutions to fix the price of lead. A vast majority of such contracts are for a period not extending beyond one year. We had the following contracts outstanding at the dates shown below:
Date | $’s Under Contract | # Pounds Purchased | Average Cost/Pound | Approximate % of Lead Requirements (1) | ||||
(in millions) | (in millions) | |||||||
March 31, 2016 | $21.6 | 27.4 | $0.79 | 6% | ||||
March 31, 2015 | 76.1 | 91.6 | 0.83 | 19 | ||||
March 31, 2014 | 86.5 | 89.9 | 0.96 | 19 | ||||
(1) | Based on the fiscal year lead requirements for the period then ended. |
We estimate that a 10% increase in our cost of lead would have increased our annual cost of goods sold by approximately $54 million for the fiscal year ended March 31, 2016.
Foreign Currency Exchange Rate Risks
We manufacture and assemble our products globally in the Americas, EMEA and Asia. Approximately 50% of our sales and expenses are transacted in foreign currencies. Our sales revenue, production costs, profit margins and competitive position are affected by the strength of the currencies in countries where we manufacture or purchase goods relative to the strength of the currencies in countries where our products are sold. Additionally, as we report our financial statements in U.S. dollars, our financial results are affected by the strength of the currencies in countries where we have operations relative to the strength of the U.S. dollar. The principal foreign currencies in which we conduct business are the Euro, Swiss franc, British pound, Polish zloty, Chinese renminbi and Mexican peso.
We quantify and monitor our global foreign currency exposures. Our largest foreign currency exposure is from the purchase and conversion of U.S. dollar based lead costs into local currencies in Europe. Additionally, we have currency exposures from intercompany financing and intercompany and third party trade transactions. On a selective basis, we enter into foreign currency forward contracts and purchase option contracts to reduce the impact from the volatility of currency movements; however, we cannot be certain that foreign currency fluctuations will not impact our operations in the future.
45
To hedge these exposures, we have entered into forward contracts and options with financial institutions to fix the value at which we will buy or sell certain currencies. The vast majority of such contracts are for a period not extending beyond one year. Forward contracts outstanding as of March 31, 2016 were $29.4 million. The details of contracts outstanding as of March 31, 2016 were as follows:
Transactions Hedged | $US Equivalent (in millions) | Average Rate Hedged | Approximate % of Annual Requirements (1) | |||||||||
Sell Euros for U.S. dollars | $ | 11.4 | $/€ | 1.11 | 5 | % | ||||||
Sell Euros for Polish zloty | 5.7 | PLN/€ | 4.30 | 8 | ||||||||
Sell Euros for British pounds | 5.2 | £/€ | 0.76 | 13 | ||||||||
Sell Malaysian Ringgit for Euros | 2.8 | MYR/€ | 4.17 | 92 | ||||||||
Sell Australian dollars for U.S. dollars | 1.7 | $/AUD | 0.72 | 19 | ||||||||
Sell Japanese Yen for U.S. dollars | 1.7 | ¥/$ | 120.45 | 69 | ||||||||
Sell Australian dollars for British Pounds | 0.9 | AUD/£ | 1.94 | 10 | ||||||||
Total | $ | 29.4 | ||||||||||
(1) | Based on the fiscal year currency requirements for the year ended March 31, 2016. |
Foreign exchange translation adjustments are recorded as a separate component of accumulated other comprehensive income in EnerSys’ stockholders’ equity and noncontrolling interests.
Based on changes in the timing and amount of interest rate and foreign currency exchange rate movements and our actual exposures and hedges, actual gains and losses in the future may differ from our historical results.
46
ITEM 8. | FINANCIAL STATEMENTS AND SUPPLEMENTARY DATA |
Contents
EnerSys
INDEX TO CONSOLIDATED FINANCIAL STATEMENTS
Page | |
Audited Consolidated Financial Statements | |
47
Report of Independent Registered Public Accounting Firm
The Board of Directors and Stockholders of EnerSys
We have audited the accompanying consolidated balance sheets of EnerSys as of March 31, 2016 and 2015, and the related consolidated statements of income, comprehensive income, changes in equity and cash flows for each of the three years in the period ended March 31, 2016. Our audits also included the financial statement schedule listed in the Index at Item 15(a). These financial statements and schedule are the responsibility of the Company's management. Our responsibility is to express an opinion on these financial statements and schedule based on our audits.
We conducted our audits in accordance with the standards of the Public Company Accounting Oversight Board (United States). Those standards require that we plan and perform the audit to obtain reasonable assurance about whether the financial statements are free of material misstatement. An audit includes examining, on a test basis, evidence supporting the amounts and disclosures in the financial statements. An audit also includes assessing the accounting principles used and significant estimates made by management, as well as evaluating the overall financial statement presentation. We believe that our audits provide a reasonable basis for our opinion.
In our opinion, the financial statements referred to above present fairly, in all material respects, the consolidated financial position of EnerSys at March 31, 2016 and 2015, and the consolidated results of its operations and its cash flows for each of the three years in the period ended March 31, 2016, in conformity with U.S. generally accepted accounting principles. Also, in our opinion, the related financial statement schedule, when considered in relation to the basic financial statements taken as a whole, presents fairly in all material respects the information set forth therein.
As discussed in Note 1 to the consolidated financial statements, EnerSys changed the classification of deferred tax assets and liabilities as a result of the adoption of the amendments to the FASB Accounting Standards Codification resulting from Accounting Standards Update 2015-17, Income Taxes: Balance Sheet Classification of Deferred Taxes, effective March 31, 2016.
We also have audited, in accordance with the standards of the Public Company Accounting Oversight Board (United States), EnerSys’ internal control over financial reporting as of March 31, 2016, based on criteria established in Internal Control-Integrated Framework issued by the Committee of Sponsoring Organizations of the Treadway Commission (2013 framework) and our report dated May 31, 2016 expressed an unqualified opinion thereon.
/s/ Ernst & Young LLP
Philadelphia, Pennsylvania
May 31, 2016
48
Report of Independent Registered Public Accounting Firm
The Board of Directors and Stockholders of EnerSys
We have audited EnerSys’ internal control over financial reporting as of March 31, 2016, based on criteria established in Internal Control-Integrated Framework issued by the Committee of Sponsoring Organizations of the Treadway Commission (2013 framework) (the COSO criteria). EnerSys’ management is responsible for maintaining effective internal control over financial reporting, and for its assessment of the effectiveness of internal control over financial reporting included in the accompanying Management Report on Internal Control over Financial Reporting. Our responsibility is to express an opinion on the company’s internal control over financial reporting based on our audit.
We conducted our audit in accordance with the standards of the Public Company Accounting Oversight Board (United States). Those standards require that we plan and perform the audit to obtain reasonable assurance about whether effective internal control over financial reporting was maintained in all material respects. Our audit included obtaining an understanding of internal control over financial reporting, assessing the risk that a material weakness exists, testing and evaluating the design and operating effectiveness of internal control based on the assessed risk, and performing such other procedures as we considered necessary in the circumstances. We believe that our audit provides a reasonable basis for our opinion.
A company’s internal control over financial reporting is a process designed to provide reasonable assurance regarding the reliability of financial reporting and the preparation of financial statements for external purposes in accordance with generally accepted accounting principles. A company’s internal control over financial reporting includes those policies and procedures that (1) pertain to the maintenance of records that, in reasonable detail, accurately and fairly reflect the transactions and dispositions of the assets of the company; (2) provide reasonable assurance that transactions are recorded as necessary to permit preparation of financial statements in accordance with generally accepted accounting principles, and that receipts and expenditures of the company are being made only in accordance with authorizations of management and directors of the company; and (3) provide reasonable assurance regarding prevention or timely detection of unauthorized acquisition, use, or disposition of the company’s assets that could have a material effect on the financial statements.
Because of its inherent limitations, internal control over financial reporting may not prevent or detect misstatements. Also, projections of any evaluation of effectiveness to future periods are subject to the risk that controls may become inadequate because of changes in conditions, or that the degree of compliance with the policies or procedures may deteriorate.
In our opinion, EnerSys maintained, in all material respects, effective internal control over financial reporting as of March 31, 2016, based on the COSO criteria.
We also have audited, in accordance with the standards of the Public Company Accounting Oversight Board (United States), the consolidated balance sheets of EnerSys as of March 31, 2016 and 2015, and the related consolidated statements of income, comprehensive income, changes in equity and cash flows for each of the three years in the period ended March 31, 2016 of EnerSys and our report dated May 31, 2016 expressed an unqualified opinion thereon.
/s/ Ernst & Young LLP
Philadelphia, Pennsylvania
May 31, 2016
49
EnerSys
Consolidated Balance Sheets
(In Thousands, Except Share and Per Share Data)
March 31, | ||||||||
2016 | 2015 | |||||||
Assets | ||||||||
Current assets: | ||||||||
Cash and cash equivalents | $ | 397,307 | $ | 268,921 | ||||
Accounts receivable, net of allowance for doubtful accounts (2016–11,393; 2015–$7,562) | 490,799 | 518,165 | ||||||
Inventories, net | 331,081 | 337,011 | ||||||
Prepaid and other current assets | 77,052 | 77,572 | ||||||
Total current assets | 1,296,239 | 1,201,669 | ||||||
Property, plant, and equipment, net | 357,409 | 356,854 | ||||||
Goodwill | 353,547 | 369,730 | ||||||
Other intangible assets, net | 159,658 | 158,160 | ||||||
Deferred taxes | 33,530 | 36,516 | ||||||
Other assets | 14,105 | 13,626 | ||||||
Total assets | $ | 2,214,488 | $ | 2,136,555 | ||||
Liabilities and Equity | ||||||||
Current liabilities: | ||||||||
Short-term debt | $ | 22,144 | $ | 19,715 | ||||
Current portion of capital lease obligations | 89 | 237 | ||||||
Accounts payable | 228,442 | 218,574 | ||||||
Accrued expenses | 200,496 | 193,262 | ||||||
Total current liabilities | 451,171 | 431,788 | ||||||
Long-term debt | 606,221 | 493,224 | ||||||
Capital lease obligations | 177 | 37 | ||||||
Deferred taxes | 46,008 | 77,201 | ||||||
Other liabilities | 86,479 | 81,579 | ||||||
Total liabilities | 1,190,056 | 1,083,829 | ||||||
Commitments and contingencies | ||||||||
Redeemable noncontrolling interests | 5,997 | 6,956 | ||||||
Redeemable equity component of Convertible Notes | — | 1,330 | ||||||
Equity: | ||||||||
Preferred Stock, $0.01 par value, 1,000,000 shares authorized, no shares issued or outstanding at March 31, 2016 and at March 31, 2015 | — | — | ||||||
Common Stock, $0.01 par value, 135,000,000 shares authorized, 54,112,776 shares issued and 43,189,502 shares outstanding at March 31, 2016; 53,664,639 shares issued and 44,068,588 shares outstanding at March 31, 2015 | 541 | 537 | ||||||
Additional paid-in capital | 452,097 | 525,967 | ||||||
Treasury stock at cost, 10,923,274 shares held as of March 31, 2016 and 9,596,051 shares held as of March 31, 2015 | (439,800 | ) | (376,005 | ) | ||||
Retained earnings | 1,097,642 | 997,376 | ||||||
Accumulated other comprehensive loss | (97,349 | ) | (108,975 | ) | ||||
Total EnerSys stockholders’ equity | 1,013,131 | 1,038,900 | ||||||
Nonredeemable noncontrolling interests | 5,304 | 5,540 | ||||||
Total equity | 1,018,435 | 1,044,440 | ||||||
Total liabilities and equity | $ | 2,214,488 | $ | 2,136,555 | ||||
See accompanying notes.
50
EnerSys
Consolidated Statements of Income
(In Thousands, Except Share and Per Share Data)
Fiscal year ended March 31, | ||||||||||||
2016 | 2015 | 2014 | ||||||||||
Net sales | $ | 2,316,249 | $ | 2,505,512 | $ | 2,474,433 | ||||||
Cost of goods sold | 1,704,472 | 1,864,601 | 1,844,813 | |||||||||
Gross profit | 611,777 | 640,911 | 629,620 | |||||||||
Operating expenses | 352,767 | 358,381 | 344,421 | |||||||||
Restructuring and other exit charges | 12,978 | 11,436 | 27,326 | |||||||||
Impairment of goodwill, indefinite-lived intangibles and fixed assets | 36,252 | 23,946 | 5,179 | |||||||||
Legal proceedings charge / (reversal of legal accrual, net of fees) | 3,201 | (16,233 | ) | 58,184 | ||||||||
Gain on sale of facility | (3,420 | ) | — | — | ||||||||
Operating earnings | 209,999 | 263,381 | 194,510 | |||||||||
Interest expense | 22,343 | 19,644 | 17,105 | |||||||||
Other (income) expense, net | 5,719 | (5,602 | ) | 13,658 | ||||||||
Earnings before income taxes | 181,937 | 249,339 | 163,747 | |||||||||
Income tax expense | 50,113 | 67,814 | 16,980 | |||||||||
Net earnings | 131,824 | 181,525 | 146,767 | |||||||||
Net (losses) earnings attributable to noncontrolling interests | (4,326 | ) | 337 | (3,561 | ) | |||||||
Net earnings attributable to EnerSys stockholders | $ | 136,150 | $ | 181,188 | $ | 150,328 | ||||||
Net earnings per common share attributable to EnerSys stockholders: | ||||||||||||
Basic | $ | 3.08 | $ | 3.97 | $ | 3.17 | ||||||
Diluted | $ | 2.99 | $ | 3.77 | $ | 3.02 | ||||||
Dividends per common share | $ | 0.70 | $ | 0.70 | $ | 0.50 | ||||||
Weighted-average number of common shares outstanding: | ||||||||||||
Basic | 44,276,713 | 45,606,317 | 47,473,690 | |||||||||
Diluted | 45,474,130 | 48,052,729 | 49,788,155 | |||||||||
See accompanying notes.
51
EnerSys
Consolidated Statements of Comprehensive Income
(In Thousands)
Fiscal year ended March 31, | ||||||||||||
2016 | 2015 | 2014 | ||||||||||
Net earnings | $ | 131,824 | $ | 181,525 | $ | 146,767 | ||||||
Other comprehensive income (loss): | ||||||||||||
Net unrealized gain (loss) on derivative instruments, net of tax | 483 | 2,158 | (1,421 | ) | ||||||||
Pension funded status adjustment, net of tax | 1,858 | (8,512 | ) | (2,038 | ) | |||||||
Foreign currency translation adjustment | 8,035 | (171,830 | ) | 29,339 | ||||||||
Total other comprehensive income (loss), net of tax | 10,376 | (178,184 | ) | 25,880 | ||||||||
Total comprehensive income | 142,200 | 3,341 | 172,647 | |||||||||
Comprehensive loss attributable to noncontrolling interests | (5,576 | ) | (1,027 | ) | (4,871 | ) | ||||||
Comprehensive income attributable to EnerSys stockholders | $ | 147,776 | $ | 4,368 | $ | 177,518 | ||||||
See accompanying notes.
52
EnerSys
Consolidated Statements of Changes in Equity
(In Thousands) | Preferred Stock | Common Stock | Paid-in Capital | Treasury Stock | Retained Earnings | Accumulated Other Comprehensive Income (Loss) | Total EnerSys Stockholders’ Equity | Non- redeemable Non- Controlling Interests | Total Equity | |||||||||||||||||||||||||||
Balance at March 31, 2013 | $ | — | $ | 529 | $ | 501,646 | $ | (100,776 | ) | $ | 727,347 | $ | 40,655 | $ | 1,169,401 | $ | 5,882 | $ | 1,175,283 | |||||||||||||||||
Stock-based compensation | — | — | 16,742 | — | — | — | 16,742 | — | 16,742 | |||||||||||||||||||||||||||
Exercise of stock options (taxes paid related to net share settlement of equity awards), net | — | 3 | (7,873 | ) | — | — | — | (7,870 | ) | — | (7,870 | ) | ||||||||||||||||||||||||
Tax benefit from stock options | — | — | 1,612 | — | — | — | 1,612 | — | 1,612 | |||||||||||||||||||||||||||
Purchase of common stock | — | — | — | (69,867 | ) | — | — | (69,867 | ) | — | (69,867 | ) | ||||||||||||||||||||||||
Purchase of noncontrolling interests | — | — | (2,866 | ) | — | — | — | (2,866 | ) | — | (2,866 | ) | ||||||||||||||||||||||||
Debt conversion feature | — | — | (9,613 | ) | — | — | — | (9,613 | ) | — | (9,613 | ) | ||||||||||||||||||||||||
Net earnings (excluding $3,536 of losses attributable to redeemable noncontrolling interests) | — | — | — | — | 150,328 | — | 150,328 | (25 | ) | 150,303 | ||||||||||||||||||||||||||
Dividends ($0.50 per common share) | — | — | 606 | — | (24,287 | ) | — | (23,681 | ) | — | (23,681 | ) | ||||||||||||||||||||||||
Redemption value adjustment attributable to redeemable noncontrolling interests | — | — | — | — | (4,974 | ) | — | (4,974 | ) | — | (4,974 | ) | ||||||||||||||||||||||||
Other comprehensive income: | ||||||||||||||||||||||||||||||||||||
Pension funded status adjustment (net of tax benefit of $26) | — | — | — | — | — | (2,038 | ) | (2,038 | ) | — | (2,038 | ) | ||||||||||||||||||||||||
Net unrealized gain (loss) on derivative instruments (net of tax benefit of $834) | — | — | — | — | — | (1,421 | ) | (1,421 | ) | — | (1,421 | ) | ||||||||||||||||||||||||
Foreign currency translation adjustment (excludes ($1,340) related to redeemable noncontrolling interests) | — | — | — | — | — | 30,649 | 30,649 | 30 | 30,679 | |||||||||||||||||||||||||||
Balance at March 31, 2014 | $ | — | $ | 532 | $ | 500,254 | $ | (170,643 | ) | $ | 848,414 | $ | 67,845 | $ | 1,246,402 | $ | 5,887 | $ | 1,252,289 | |||||||||||||||||
Stock-based compensation | — | — | 25,259 | — | — | — | 25,259 | — | 25,259 | |||||||||||||||||||||||||||
Exercise of stock options (taxes paid related to net share settlement of equity awards), net | — | 5 | (12,676 | ) | — | — | — | (12,671 | ) | — | (12,671 | ) | ||||||||||||||||||||||||
Tax benefit from stock options | — | — | 4,071 | — | — | — | 4,071 | — | 4,071 | |||||||||||||||||||||||||||
Purchase of common stock | — | — | — | (205,362 | ) | — | — | (205,362 | ) | — | (205,362 | ) | ||||||||||||||||||||||||
Purchase of noncontrolling interests | — | — | — | — | — | — | — | (119 | ) | (119 | ) | |||||||||||||||||||||||||
Debt conversion feature | — | — | 8,283 | — | — | — | 8,283 | — | 8,283 | |||||||||||||||||||||||||||
Other | — | — | (3 | ) | — | — | — | (3 | ) | — | (3 | ) | ||||||||||||||||||||||||
Net earnings (excluding $191 of earnings attributable to redeemable noncontrolling interests) | — | — | — | — | 181,188 | — | 181,188 | 146 | 181,334 | |||||||||||||||||||||||||||
Dividends ($0.70 per common share) | — | — | 779 | — | (32,518 | ) | — | (31,739 | ) | — | (31,739 | ) | ||||||||||||||||||||||||
Redemption value adjustment attributable to redeemable noncontrolling interests | — | — | — | — | 292 | — | 292 | — | 292 | |||||||||||||||||||||||||||
Other comprehensive income: | ||||||||||||||||||||||||||||||||||||
Pension funded status adjustment (net of tax benefit of $3,250) | — | — | — | — | — | (8,512 | ) | (8,512 | ) | — | (8,512 | ) | ||||||||||||||||||||||||
Net unrealized gain (loss) on derivative instruments (net of tax expense of $1,266) | — | — | — | — | — | 2,158 | 2,158 | — | 2,158 | |||||||||||||||||||||||||||
Foreign currency translation adjustment (excludes ($990) related to redeemable noncontrolling interests) | — | — | — | — | — | (170,466 | ) | (170,466 | ) | (374 | ) | (170,840 | ) | |||||||||||||||||||||||
Balance at March 31, 2015 | $ | — | $ | 537 | $ | 525,967 | $ | (376,005 | ) | $ | 997,376 | $ | (108,975 | ) | $ | 1,038,900 | $ | 5,540 | $ | 1,044,440 | ||||||||||||||||
Stock-based compensation | — | — | 19,603 | — | — | — | 19,603 | — | 19,603 | |||||||||||||||||||||||||||
Exercise of stock options (taxes paid related to net share settlement of equity awards), net | — | 4 | (15,209 | ) | — | — | — | (15,205 | ) | — | (15,205 | ) | ||||||||||||||||||||||||
Tax benefit from stock options | — | — | 4,291 | — | — | — | 4,291 | — | 4,291 | |||||||||||||||||||||||||||
Purchase of common stock | — | — | — | (178,244 | ) | — | — | (178,244 | ) | — | (178,244 | ) | ||||||||||||||||||||||||
Reissuance of treasury stock to Convertible Notes holders | — | — | — | 114,449 | — | — | 114,449 | — | 114,449 | |||||||||||||||||||||||||||
Adjustment to equity on debt extinguishment | — | — | (84,140 | ) | — | — | — | (84,140 | ) | — | (84,140 | ) | ||||||||||||||||||||||||
Debt conversion feature | — | — | 1,330 | — | — | — | 1,330 | — | 1,330 | |||||||||||||||||||||||||||
Other | — | — | (477 | ) | — | — | — | (477 | ) | — | (477 | ) | ||||||||||||||||||||||||
Net earnings (excluding $4,272 of losses attributable to redeemable noncontrolling interests) | — | — | — | — | 136,150 | — | 136,150 | (54 | ) | 136,096 | ||||||||||||||||||||||||||
Dividends ($0.70 per common share) | — | — | 732 | — | (31,612 | ) | — | (30,880 | ) | — | (30,880 | ) | ||||||||||||||||||||||||
Redemption value adjustment attributable to redeemable noncontrolling interests | — | — | — | — | (4,272 | ) | — | (4,272 | ) | — | (4,272 | ) | ||||||||||||||||||||||||
Other comprehensive income: | ||||||||||||||||||||||||||||||||||||
Pension funded status adjustment (net of tax expense of $587) | — | — | — | — | — | 1,858 | 1,858 | — | 1,858 | |||||||||||||||||||||||||||
Net unrealized gain (loss) on derivative instruments (net of tax expense of $277) | — | — | — | — | — | 483 | 483 | — | 483 | |||||||||||||||||||||||||||
Foreign currency translation adjustment (excludes ($1,068) related to redeemable noncontrolling interests) | — | — | — | — | — | 9,285 | 9,285 | (182 | ) | 9,103 | ||||||||||||||||||||||||||
Balance at March 31, 2016 | $ | — | $ | 541 | $ | 452,097 | $ | (439,800 | ) | $ | 1,097,642 | $ | (97,349 | ) | $ | 1,013,131 | $ | 5,304 | $ | 1,018,435 | ||||||||||||||||
See accompanying notes.
53
EnerSys
Consolidated Statements of Cash Flows
(In Thousands)
Fiscal year ended March 31, | ||||||||||||
2016 | 2015 | 2014 | ||||||||||
Cash flows from operating activities | ||||||||||||
Net earnings | $ | 131,824 | $ | 181,525 | $ | 146,767 | ||||||
Adjustments to reconcile net earnings to net cash provided by operating activities: | ||||||||||||
Depreciation and amortization | 55,994 | 57,040 | 53,972 | |||||||||
Non-cash restructuring charges | 3,800 | 3,349 | 11,497 | |||||||||
(Gain) on disposition of equity interest in Altergy / write - off of investment in Altergy | — | (2,000 | ) | 5,000 | ||||||||
Impairment of goodwill, indefinite-lived intangibles and fixed assets | 36,252 | 23,946 | 5,179 | |||||||||
Derivatives not designated in hedging relationships: | ||||||||||||
Net losses (gains) | 409 | (972 | ) | 188 | ||||||||
Cash proceeds (settlements) | 648 | 654 | (703 | ) | ||||||||
Provision for doubtful accounts | 4,749 | 1,125 | 907 | |||||||||
Deferred income taxes | (753 | ) | 31,886 | (49,748 | ) | |||||||
Reversal of legal accrual, net of fees - See Note 18 | (799 | ) | (16,233 | ) | — | |||||||
Non-cash interest expense | 2,794 | 9,546 | 8,826 | |||||||||
Stock-based compensation | 19,603 | 25,259 | 16,742 | |||||||||
Gain on sale of facility | (4,348 | ) | — | — | ||||||||
(Gain) loss on disposal of fixed assets | (114 | ) | 8 | (100 | ) | |||||||
Changes in assets and liabilities, net of effects of acquisitions: | ||||||||||||
Accounts receivable | 31,142 | (13,250 | ) | (70,134 | ) | |||||||
Inventory | 11,667 | (10,153 | ) | 8,144 | ||||||||
Prepaid and other current assets | 4,751 | (18,998 | ) | (7,669 | ) | |||||||
Other assets | (331 | ) | 701 | (1,347 | ) | |||||||
Accounts payable | 12,178 | (26,500 | ) | (14,979 | ) | |||||||
Accrued expenses | (4,739 | ) | (64,147 | ) | 90,339 | |||||||
Other liabilities | 2,844 | 11,685 | (9,260 | ) | ||||||||
Net cash provided by operating activities | 307,571 | 194,471 | 193,621 | |||||||||
Cash flows from investing activities | ||||||||||||
Capital expenditures | (55,880 | ) | (63,625 | ) | (61,995 | ) | ||||||
Purchase of businesses, net of cash acquired | (35,439 | ) | — | (171,528 | ) | |||||||
Proceeds from sale of facility | 9,179 | — | — | |||||||||
Proceeds from disposition of equity interest in Altergy | — | 2,000 | — | |||||||||
Proceeds from disposal of property, plant, and equipment and other assets | 1,217 | 2,009 | 1,518 | |||||||||
Net cash used in investing activities | (80,923 | ) | (59,616 | ) | (232,005 | ) | ||||||
Cash flows from financing activities | ||||||||||||
Net increase (decrease) in short-term debt | 4,233 | (11,923 | ) | 8,458 | ||||||||
Proceeds from revolving credit borrowings | 355,800 | 372,700 | 251,900 | |||||||||
Repayments of revolving credit borrowings | (360,800 | ) | (322,700 | ) | (126,900 | ) | ||||||
Proceeds from long-term debt | 300,000 | 150,000 | — | |||||||||
Payments of long-term debt | (7,500 | ) | — | — | ||||||||
Repurchase of Convertible Notes | (172,266 | ) | (234 | ) | — | |||||||
Deferred financing fees | (5,031 | ) | (1,076 | ) | (853 | ) | ||||||
Capital lease obligations and other | (127 | ) | (260 | ) | (404 | ) | ||||||
Option proceeds (taxes paid related to net share settlement of equity awards), net | (15,205 | ) | (12,671 | ) | (7,871 | ) | ||||||
Excess tax benefits from exercise of stock options and vesting of equity awards | 4,291 | 4,071 | 1,612 | |||||||||
Purchase of treasury stock | (178,244 | ) | (205,362 | ) | (69,867 | ) | ||||||
Dividends paid to stockholders | (30,880 | ) | (31,739 | ) | (23,681 | ) | ||||||
Payment of deferred purchase consideration | — | — | (4,820 | ) | ||||||||
Purchase of noncontrolling interests | — | (119 | ) | (6,012 | ) | |||||||
Net cash (used in) provided by financing activities | (105,729 | ) | (59,313 | ) | 21,562 | |||||||
Effect of exchange rate changes on cash and cash equivalents | 7,467 | (46,724 | ) | 7,577 | ||||||||
Net increase (decrease) in cash and cash equivalents | 128,386 | 28,818 | (9,245 | ) | ||||||||
Cash and cash equivalents at beginning of year | 268,921 | 240,103 | 249,348 | |||||||||
Cash and cash equivalents at end of year | $ | 397,307 | $ | 268,921 | $ | 240,103 | ||||||
See accompanying notes.
54
Notes to Consolidated Financial Statements
March 31, 2016
(In Thousands, Except Share and Per Share Data)
1. Summary of Significant Accounting Policies
Description of Business
EnerSys (the “Company”) and its predecessor companies have been manufacturers of industrial batteries for over 125 years. EnerSys is a global leader in stored energy solutions for industrial applications. The Company manufactures, markets and distributes industrial batteries and related products such as chargers, outdoor cabinet enclosures, power equipment and battery accessories, and provides related after-market and customer-support services for industrial batteries.
Principles of Consolidation
The consolidated financial statements include the accounts of the Company and its wholly owned subsidiaries and any partially owned subsidiaries that the Company has the ability to control. Control generally equates to ownership percentage, whereby investments that are more than 50% owned are generally consolidated, investments in affiliates of 50% or less but greater than 20% are generally accounted for using the equity method, and investments in affiliates of 20% or less are accounted for using the cost method. All intercompany transactions and balances have been eliminated in consolidation.
The Company also consolidates certain subsidiaries in which the noncontrolling interest party has within its control the right to require the Company to redeem all or a portion of its interest in the subsidiary. The redeemable noncontrolling interests are reported at their estimated redemption value, and the amount presented in temporary equity is not less than the initial amount reported in temporary equity. Any adjustment to the redemption value impacts retained earnings but does not impact net income or comprehensive income. Noncontrolling interests which are redeemable only upon future events, the occurrence of which is not currently probable, are recorded at carrying value.
Foreign Currency Translation
Results of foreign operations of subsidiaries, whose functional currency is the local currency, are translated into U.S. dollars using average exchange rates during the periods. The assets and liabilities are translated into U.S. dollars using exchange rates as of the balance sheet dates. Gains or losses resulting from translating the foreign currency financial statements are accumulated as a separate component of accumulated other comprehensive income (“AOCI”) in EnerSys’ stockholders’ equity and noncontrolling interests.
Transaction gains and losses resulting from exchange rate changes on transactions denominated in currencies other than the functional currency of the applicable subsidiary are included in the Consolidated Statements of Income, within “Other (income) expense, net”, in the year in which the change occurs.
Revenue Recognition
The Company recognizes revenue when the earnings process is complete. This occurs when risk and title transfers, collectibility is reasonably assured and pricing is fixed or determinable. Shipment terms are either shipping point or destination and do not differ significantly between the Company’s business segments. Accordingly, revenue is recognized when risk and title are transferred to the customer. Amounts invoiced to customers for shipping and handling are classified as revenue. Taxes on revenue producing transactions are not included in net sales.
The Company recognizes revenue from the service of its products when the respective services are performed.
Accruals are made at the time of sale for sales returns and other allowances based on the Company’s historical experience.
Freight Expense
Amounts billed to customers for outbound freight costs are classified as sales in the Consolidated Statements of Income. Costs incurred by the Company for outbound freight costs to customers, inbound and transfer freight are classified in cost of goods
sold.
55
Warranties
The Company’s products are warranted for a period ranging from one to twenty years for reserve power batteries and for a period ranging from one to seven years for motive power batteries. The Company provides for estimated product warranty expenses when the related products are sold. The assessment of the adequacy of the reserve includes a review of open claims and historical experience.
Cash and Cash Equivalents
Cash and cash equivalents include all highly liquid investments with an original maturity of three months or less when purchased.
Concentration of Credit Risk
Financial instruments that subject the Company to potential concentration of credit risk consist principally of short-term cash investments and trade accounts receivable. The Company invests its cash with various financial institutions and in various investment instruments limiting the amount of credit exposure to any one financial institution or entity. The Company has bank deposits that exceed federally insured limits. In addition, certain cash investments may be made in U.S. and foreign government bonds, or other highly rated investments guaranteed by the U.S. or foreign governments. Concentration of credit risk with respect to trade receivables is limited by a large, diversified customer base and its geographic dispersion. The Company performs ongoing credit evaluations of its customers’ financial condition and requires collateral, such as letters of credit, in certain circumstances.
Accounts Receivable
The Company maintains allowances for doubtful accounts for estimated losses resulting from the inability of customers to make required payments. The allowance is based on management’s estimate of uncollectible accounts, analysis of historical data and trends, as well as reviews of all relevant factors concerning the financial capability of its customers. Accounts receivable are considered to be past due based on how payments are received compared to the customer’s credit terms. Accounts are written off when management determines the account is uncollectible.
Inventories
Inventories are stated at the lower of cost or market. Cost is determined using the first-in, first-out (FIFO) method. The cost of inventory consists of material, labor, and associated overhead.
Property, Plant, and Equipment
Property, plant, and equipment are recorded at cost and include expenditures that substantially increase the useful lives of the assets. Depreciation is provided using the straight-line method over the estimated useful lives of the assets as follows: 10 to 33 years for buildings and improvements and 3 to 15 years for machinery and equipment.
Maintenance and repairs are expensed as incurred. Interest on capital projects is capitalized during the construction period.
Business Combinations
The purchase price of an acquired company is allocated between tangible and intangible assets acquired and liabilities assumed from the acquired business based on their estimated fair values, with the residual of the purchase price recorded as goodwill. The results of operations of the acquired business are included in the Company’s operating results from the date of acquisition.
Goodwill and Other Intangible Assets
Goodwill and indefinite-lived trademarks are tested for impairment at least annually and whenever events or circumstances occur indicating that a possible impairment may have been incurred. Goodwill is tested for impairment by determining the fair value of the Company’s reporting units. These estimated fair values are based on financial projections, certain cash flow measures, and market capitalization.
The goodwill impairment test involves a two-step process. In the first step, the Company compares the fair value of each reporting unit to its carrying value. If the fair value of the reporting unit exceeds its carrying value, goodwill is not impaired
56
and no further testing is required. If the fair value of the reporting unit is less than the carrying value, the Company must perform the second step of the impairment test to measure the amount of impairment loss, if any. In the second step, the reporting unit's fair value is allocated to all of the assets and liabilities of the reporting unit, including any unrecognized intangible assets, in a hypothetical analysis that calculates the implied fair value of goodwill in the same manner as if the reporting unit was being acquired in a business combination. If the implied fair value of the reporting unit's goodwill is less than the carrying value, the difference is recorded as an impairment loss.
The indefinite-lived trademarks are tested for impairment by comparing the carrying value to the fair value based on current revenue projections of the related operations, under the relief from royalty method. Any excess carrying value over the amount of fair value is recognized as impairment. Any impairment would be recognized in full in the reporting period in which it has been identified.
The Company estimates the fair value of its reporting units using a weighting of fair values derived from both the income approach and the market approach. Under the income approach, the Company calculates the fair value of a reporting unit based on the present value of estimated future cash flows. Cash flow projections are based on management's estimates of revenue growth rates and operating margins, taking into consideration industry and market conditions. The discount rate used is based on the weighted-average cost of capital adjusted for the relevant risk associated with business-specific characteristics and the uncertainty related to the business's ability to execute on the projected cash flows. The market approach estimates fair value based on market multiples of revenue and earnings derived from comparable publicly-traded companies with similar operating and investment characteristics as the reporting unit. The weighting of the fair value derived from the market approach ranges from 0% to 50% depending on the level of comparability of these publicly-traded companies to the reporting unit.
In order to assess the reasonableness of the calculated fair values of its reporting units, the Company also compares the sum of the reporting units' fair values to its market capitalization and calculates an implied control premium (the excess of the sum of the reporting units' fair values over the market capitalization). The Company evaluates the control premium by comparing it to control premiums of recent comparable market transactions.
Finite-lived assets such as customer relationships, patents, and non-compete agreements are amortized over their estimated useful lives, generally over periods ranging from 3 to 20 years. The Company reviews the carrying values of these assets for possible impairment whenever events or changes in circumstances indicate that the carrying value of an asset may not be recoverable based on undiscounted estimated cash flows expected to result from its use and eventual disposition. The Company continually evaluates the reasonableness of the useful lives of these assets.
Impairment of Long-Lived Assets
The Company reviews the carrying values of its long-lived assets to be held and used for possible impairment whenever events or changes in circumstances indicate that the carrying value may not be recoverable, based on undiscounted estimated cash flows expected to result from its use and eventual disposition. The factors considered by the Company in performing this assessment include current operating results, trends and other economic factors. In assessing the recoverability of the carrying value of a long-lived asset, the Company must make assumptions regarding future cash flows and other factors. If these estimates or the related assumptions change in the future, the Company may be required to record an impairment loss for these assets.
Environmental Expenditures
The Company records a loss and establishes a reserve for environmental remediation liabilities when it is probable that an asset has been impaired or a liability exists and the amount of the liability can be reasonably estimated. Reasonable estimates involve judgments made by management after considering a broad range of information including notifications, demands or settlements that have been received from a regulatory authority or private party, estimates performed by independent engineering companies and outside counsel, available facts existing and proposed technology, the identification of other potentially responsible parties, their ability to contribute and prior experience. These judgments are reviewed quarterly as more information is received and the amounts reserved are updated as necessary. However, the reserves may materially differ from ultimate actual liabilities if the loss contingency is difficult to estimate or if management’s judgments turn out to be inaccurate. If management believes no best estimate exists, the minimum probable loss is accrued.
Derivative Financial Instruments
The Company utilizes derivative instruments to mitigate volatility related to interest rates, lead prices and foreign currency exposures. The Company does not hold or issue derivative financial instruments for trading or speculative purposes. The
57
Company recognizes derivatives as either assets or liabilities in the accompanying Consolidated Balance Sheets and measures those instruments at fair value. Changes in the fair value of those instruments are reported in AOCI if they qualify for hedge accounting or in earnings if they do not qualify for hedge accounting. Derivatives qualify for hedge accounting if they are designated as hedge instruments and if the hedge is highly effective in achieving offsetting changes in the fair value or cash flows of the asset or liability hedged. Effectiveness is measured on a regular basis using statistical analysis and by comparing the overall changes in the expected cash flows on the lead and foreign currency forward contracts with the changes in the expected all-in cash outflow required for the lead and foreign currency purchases. This analysis is performed on the initial purchases quarterly that cover the quantities hedged. Accordingly, gains and losses from changes in derivative fair value of effective hedges are deferred and reported in AOCI until the underlying transaction affects earnings.
The Company has commodity, foreign exchange and interest rate hedging authorization from the Board of Directors and has established a hedging and risk management program that includes the management of market and counterparty risk. Key risk control activities designed to ensure compliance with the risk management program include, but are not limited to, credit review and approval, validation of transactions and market prices, verification of risk and transaction limits, portfolio stress tests, sensitivity analyses and frequent portfolio reporting, including open positions, determinations of fair value and other risk management metrics.
Market risk is the potential loss the Company and its subsidiaries may incur as a result of price changes associated with a particular financial or commodity instrument. The Company utilizes forward contracts, options, and swaps as part of its risk management strategies, to minimize unanticipated fluctuations in earnings caused by changes in commodity prices, interest rates and/or foreign currency exchange rates. All derivatives are recognized on the balance sheet at their fair value, unless they qualify for the Normal Purchase Normal Sale exemption.
Credit risk is the potential loss the Company may incur due to the counterparty’s non-performance. The Company is exposed to credit risk from interest rate, foreign currency and commodity derivatives with financial institutions. The Company has credit policies to manage their credit risk, including the use of an established credit approval process, monitoring of the counterparty positions and the use of master netting agreements.
The Company has elected to offset net derivative positions under master netting arrangements. The Company does not have any positions involving cash collateral (payables or receivables) under a master netting arrangement as of March 31, 2016 and 2015.
The Company does not have any credit-related contingent features associated with its derivative instruments.
Fair Value of Financial Instruments
The Company uses the following valuation techniques to measure fair value for its financial assets and financial liabilities:
Level 1 | Inputs are unadjusted quoted prices in active markets for identical assets or liabilities. | |
Level 2 | Inputs are quoted prices for similar assets or liabilities in an active market, quoted prices for identical or similar assets or liabilities in markets that are not active, inputs other than quoted prices that are observable and market-corroborated inputs which are derived principally from or corroborated by observable market data. | |
Level 3 | Inputs are derived from valuation techniques in which one or more significant inputs or value drivers are unobservable. | |
Fair value is the price that would be received to sell an asset or paid to transfer a liability in an orderly transaction between market participants at the measurement date (an exit price). The Company and its subsidiaries use, as appropriate, a market approach (generally, data from market transactions), an income approach (generally, present value techniques and option-pricing models), and/or a cost approach (generally, replacement cost) to measure the fair value of an asset or liability. These valuation approaches incorporate inputs such as observable, independent market data and/or unobservable data that management believes are predicated on the assumptions market participants would use to price an asset or liability. These inputs may incorporate, as applicable, certain risks such as nonperformance risk, which includes credit risk.
Lead contracts, foreign currency contracts and interest rate contracts generally use an income approach to measure the fair value of these contracts, utilizing readily observable inputs, such as forward interest rates (e.g., London Interbank Offered Rate
58
—“LIBOR”) and forward foreign currency exchange rates (e.g., GBP and euro) and commodity prices (e.g., London Metals Exchange), as well as inputs that may not be observable, such as credit valuation adjustments. When observable inputs are used to measure all or most of the value of a contract, the contract is classified as Level 2. Over-the-counter (OTC) contracts are valued using quotes obtained from an exchange, binding and non-binding broker quotes. Furthermore, the Company obtains independent quotes from the market to validate the forward price curves. OTC contracts include forwards, swaps and options. To the extent possible, fair value measurements utilize various inputs that include quoted prices for similar contracts or market-corroborated inputs.
When unobservable inputs are significant to the fair value measurement, the asset or liability is classified as Level 3. Additionally, Level 2 fair value measurements include adjustments for credit risk based on the Company’s own creditworthiness (for net liabilities) and its counterparties’ creditworthiness (for net assets). The Company assumes that observable market prices include sufficient adjustments for liquidity and modeling risks. The Company did not have any contracts that transferred between Level 2 and Level 3 as well as Level 1 and Level 2.
Income Taxes
The Company accounts for income taxes using the asset and liability approach, which requires deferred tax assets and liabilities be recognized using enacted tax rates to measure the effect of temporary differences between book and tax bases on recorded assets and liabilities. Valuation allowances are recorded to reduce deferred tax assets, if it is more likely than not some portion or all of the deferred tax assets will not be recognized. The need to establish valuation allowances against deferred tax assets is assessed quarterly. The primary factors used to assess the likelihood of realization are forecasts of future taxable income and available tax planning strategies that could be implemented to realize the net deferred tax assets.
The Company has not recorded United States income or foreign withholding taxes related to undistributed earnings of foreign subsidiaries because the Company currently plans to keep these amounts indefinitely invested overseas.
The Company recognizes tax related interest and penalties in income tax expense in its Consolidated Statement of Income.
With respect to accounting for uncertainty in income taxes, the Company evaluates tax positions to determine whether the benefits of tax positions are more likely than not of being sustained upon audit based on the technical merits of the tax position. For tax positions that are more likely than not of being sustained upon audit, the Company recognizes the largest amount of the benefit that is greater than 50% likely of being realized upon ultimate settlement. For tax positions that are not more likely than not of being sustained upon audit, the Company does not recognize any portion of the benefit. If the more likely than not threshold is not met in the period for which a tax position is taken, the Company may subsequently recognize the benefit of that tax position if the tax matter is effectively settled, the statute of limitations expires, or if the more likely than not threshold is met in a subsequent period.
Deferred Financing Fees
Debt issuance costs that are incurred by the Company in connection with the issuance of debt are deferred and amortized to interest expense over the life of the underlying indebtedness, adjusted to reflect any early repayments.
Stock-Based Compensation Plans
The Company measures the cost of employee services received in exchange for the award of an equity instrument based on the grant-date fair value of the award, with such cost recognized over the applicable vesting period.
Market condition-based awards
The Company grants two types of market condition-based awards - market share units and performance market share units.
The fair value of the market share units is estimated at the date of grant using a binomial lattice model with the following assumptions: a risk-free interest rate, dividend yield, time to maturity and expected volatility. These units vest and are settled in common stock on the third anniversary of the date of grant. Market share units are converted into between zero and two shares of common stock for each unit granted at the end of a three-year performance cycle. The conversion ratio is calculated by dividing the average closing share price of the Company’s common stock during the ninety calendar days immediately preceding the vesting date by the average closing share price of the Company’s common stock during the ninety calendar days immediately preceding the grant date, with the resulting quotient capped at two. This quotient is then multiplied by the number of market share units granted to yield the number of shares of common stock to be delivered on the vesting date.
59
The fair value of the performance market share units is estimated at the date of grant using a Monte Carlo Simulation. A participant may earn based on the total shareholder return (the "TSR") of the Company's common stock over a three-year period ranging from 0% to 200% of the number of performance market share units granted. The awards will cliff vest on the third anniversary of the grant date. The TSR is calculated by dividing the sixty or ninety calendar day average price at end of the period (as applicable) and the reinvested dividends thereon by such sixty or ninety calendar day average price at start of the period. The maximum number of awards earned is capped at 200% of the target award. Additionally, no payout will be awarded in the event that the TSR at the vesting date reflects less than a 25% return from the average price at the grant date. Performance market share units are similar to the market share units except that the targets are more difficult to achieve and may be tied to TSR as compared to a peer group.
The Company recognizes compensation expense using the straight-line method over the life of the market share units and performance market share units except for those issued to certain retirement-eligible participants, which are expensed on an accelerated basis.
Restricted Stock Units
The fair value of restricted stock units is based on the closing market price of the Company’s common stock on the date of grant. These awards generally vest, and are settled in common stock, at 25% per year, over a four-year period from the date of grant. The Company recognizes compensation expense using the straight-line method over the life of the restricted stock units.
Stock Options
The fair value of the options granted is estimated at the date of grant using the Black-Scholes option-pricing model utilizing assumptions based on historical data and current market data. The assumptions include expected term of the options, risk-free interest rate, expected volatility, and dividend yield. The expected term represents the expected amount of time that options granted are expected to be outstanding, based on historical and forecasted exercise behavior. The risk-free rate is based on the rate at the grant date of zero-coupon U.S. Treasury Notes with a term equal to the expected term of the option. Expected volatility is estimated using historical volatility rates based on historical weekly price changes over a term equal to the expected term of the options. The Company’s dividend yield is based on historical data. The Company recognizes compensation expense using the straight-line method over the vesting period of the options except for those issued to certain retirement-eligible participants, which are expensed on an accelerated basis.
Earnings Per Share
Basic earnings per common share (“EPS”) are computed by dividing net earnings attributable to EnerSys stockholders by the weighted-average number of common shares outstanding for the period. Diluted EPS reflects the potential dilution that would occur if securities or other contracts to issue common stock were exercised or converted into common stock. At March 31, 2016, 2015 and 2014, the Company had outstanding stock options, restricted stock units, market share units and performance market share units, which could potentially dilute basic earnings per share in the future. The Convertible Notes, prior to their extinguishment on July 17, 2015, had a dilutive impact on the EPS for the fiscal years of 2016, 2015 and 2014.
Segment Reporting
A segment for reporting purposes is based on the financial performance measures that are regularly reviewed by the chief operating decision maker to assess segment performance and to make decisions about a public entity’s allocation of resources. Based on this guidance, the Company reports its segment results based upon the three geographical regions of operations.
• | Americas, which includes North and South America, with segment headquarters in Reading, Pennsylvania, USA, |
• | EMEA, which includes Europe, the Middle East and Africa, with segment headquarters in Zug, Switzerland, and |
• | Asia, which includes Asia, Australia and Oceania, with segment headquarters in Singapore. |
New Accounting Pronouncements
In May 2014, the Financial Accounting Standards Board ("FASB") issued ASU No. 2014-09, “Revenue from Contracts with Customers (Topic 606)” providing guidance on revenue from contracts with customers that will supersede most current revenue recognition guidance, including industry-specific guidance. The underlying principle is that an entity will recognize revenue to depict the transfer of goods or services to customers at an amount that the entity expects to be entitled to in exchange for those goods or services. In July 2015, the FASB voted to delay the effective date for interim and annual reporting periods beginning after December 15, 2017, with early adoption permissible one year earlier. The standard permits the use of either the
60
retrospective or cumulative effect transition method upon adoption. The Company has not yet selected a transition method and is currently evaluating the impact, if any, of the adoption of this newly issued guidance on its consolidated financial statements.
In April 2015, the FASB issued ASU 2015-03, “Interest - Imputation of Interest (Subtopic 835-30): Simplifying the Presentation of Debt Issuance Costs.” The update simplifies the presentation of debt issuance costs by requiring that debt issuance costs be presented in the balance sheet as a direct deduction from the carrying amount of debt liability, consistent with debt discounts or premiums. The recognition and measurement guidance for debt issuance costs are not affected by the amendments in this update and amortization of the costs will continue to be reported as interest expense. For public companies, this update is effective for fiscal years beginning after December 15, 2015, and interim periods within those fiscal years, and is to be applied retrospectively. Early adoption of this revised guidance is permitted for financial statements that have not been previously issued. The Company has elected to early adopt the revised guidance and as such debt issuance costs are now presented as a direct reduction of long-term debt on the Company’s Consolidated Balance Sheets, as further reflected in Note 8.
In July 2015, the FASB issued ASU 2015-011, “Simplifying the Measurement of Inventory (Topic 330).” This update requires inventory to be measured at the lower of cost or net realizable value. Net realizable value is the estimated selling prices in the ordinary course of business, less reasonably predictable costs of completion, disposal and transportation. Subsequent measurement is unchanged for inventory measured using LIFO or the retail inventory method. This update will be effective for the Company for all annual and interim periods beginning after December 15, 2016. The amendments in this update should be applied prospectively with earlier application permitted as of the beginning of an interim or annual reporting period. This update will not have a material impact on the Company's consolidated financial statements.
In September 2015, the FASB issued ASU 2015-16, “Simplifying the Accounting for Measurement-Period Adjustments (Topic 805).” The amendments in this update require that an acquirer recognize adjustments to provisional amounts that are identified during the measurement period in the reporting period in which the adjustment amounts are determined. The amendments in this update require that the acquirer record, in the same period’s financial statements, the effect on earnings of changes in depreciation, amortization, or other income effects, if any, as a result of the change to the provisional amounts, calculated as if the accounting had been completed at the acquisition date. The amendments in this update are effective for fiscal years beginning after December 15, 2015, and interim periods within those fiscal years. The Company is currently evaluating the impact, if any, of the adoption of this newly issued guidance on its consolidated financial statements.
In November 2015, the FASB issued ASU 2015-17, “Balance Sheet Classification of Deferred Taxes (Topic 740).”
This update simplifies the presentation of deferred income taxes, by requiring that deferred tax liabilities and assets be classified as non-current in a classified statement of financial position. The current requirement that deferred tax liabilities and assets of a tax-paying component of an entity be offset and presented as a single amount is not affected by the amendments in this update. The amendments in this update are effective for fiscal years beginning after December 15, 2016, and interim periods within those fiscal years. The amendments may be applied prospectively or retrospectively. The Company early adopted ASU 2015-17 on a retrospective basis, and deferred taxes previously classified as components of current assets and current liabilities were reclassified to non-current assets and non-current liabilities, respectively, as of March 31, 2015 (see Note 13).
In February 2016, the FASB issued ASU 2016-02, “Leases (Topic 842)”, which sets out the principles for the recognition, measurement, presentation and disclosure of leases for both parties to a contract (i.e. lessees and lessors). This update requires lessees to apply a dual approach, classifying leases as either finance or operating leases based on the principle of whether or not the lease is effectively a financed purchase of the leased asset by the lessee. This classification will determine whether the lease expense is recognized based on an effective interest method or on a straight-line basis over the term of the lease. A lessee is also required to record a right-of-use asset and a lease liability for all leases with a term of greater than 12 months regardless of their classification. The new standard requires lessors to account for leases using an approach that is substantially equivalent to existing guidance for sales-type leases, direct financing leases and operating leases. This update is effective for reporting periods beginning after December 15, 2018, using a modified retrospective approach, with early adoption permitted. The Company is currently assessing the potential impact that the adoption will have on its consolidated financial statements.
In March 2016, the FASB issued ASU 2016-09, “Improvements to Employee Share-Based Payment Accounting(Topic 718)”. This update simplifies several aspects related to how share-based payments are accounted for and presented in the financial statements, including the accounting for forfeitures and tax-effects related to share-based payments at settlement, and the classification of excess tax benefits and shares surrendered for tax withholdings in the statement of cash flows. This update is effective for fiscal years beginning after December 15, 2016, and interim periods within those fiscal years, with early adoption permitted. The Company is currently assessing the potential impact that the adoption will have on its consolidated financial statements.
61
Use of Estimates
The preparation of financial statements in conformity with accounting principles generally accepted in the United States requires management to make estimates and assumptions that affect the amounts reported in the financial statements and accompanying notes. Actual results could differ from those estimates.
2. Acquisitions
On July 23, 2015, the Company completed the acquisition of ICS Industries Pty. Ltd. (ICS), headquartered in Melbourne, Australia, for $34,496, net of cash acquired. ICS is a leading full line shelter designer and manufacturer with installation and maintenance services serving the telecommunications, utilities, datacenter, natural resources and transport industries operating in Australia and serving customers in the Asia Pacific region. The Company acquired tangible and intangible assets, in connection with the acquisition, including trademarks, technology, customer relationships, non-competition agreements and goodwill. Based on the final valuation, trademarks were valued at $1,322, technology at $1,399, customer relationships at $10,211, non-competition agreements at $142 and goodwill was recorded at $13,898. The useful lives of technology were estimated at 10 years, customer relationships were estimated at 11 years and non-competition agreements ranged from 2-5 years. Trademarks were considered to be indefinite-lived assets.
There was no tax deductible goodwill associated with this acquisition.
There were no acquisitions in fiscal 2015.
On January 27, 2014, the Company completed the acquisition of UTS Holdings Sdn. Bhd. and its subsidiaries, a distributor of motive and reserve power battery products and services, headquartered in Kuala Lumpur, Malaysia, for $25,332, net of cash acquired. The Company acquired tangible and intangible assets, including trademarks, customer relationships and goodwill. Based on the final valuation, trademarks were valued at $1,410, non-compete at $160, customer relationships at $3,200 and goodwill was recorded at $10,796. The useful life of customer relationships was estimated at 8 years and trademarks were considered to be indefinite-lived assets.
On October 8, 2013, the Company completed the acquisition of Purcell Systems, Inc., a designer, manufacturer and marketer of thermally managed electronic equipment and battery cabinet enclosures, headquartered in Spokane, Washington, for $119,540, net of cash acquired. The Company acquired tangible and intangible assets, including trademarks, technology, customer relationships and goodwill. Based on the final valuation, trademarks were valued at $16,800, technology at $7,900, customer relationships at $35,700, and goodwill was recorded at $50,889. The useful lives of technology and customer lists were estimated at 10 and 9 years, respectively. Trademarks were considered to be indefinite-lived assets.
On October 28, 2013, the Company completed the acquisition of Quallion, LLC, a manufacturer of lithium ion cells and batteries for medical devices, defense, aviation and space, headquartered in Sylmar, California, for $25,800, net of cash acquired. The Company acquired tangible and intangible assets, in connection with the acquisition, including trademarks, technology, customer relationships and goodwill. Based on the final valuation, trademarks were valued at $500, technology at $4,400, customer relationships at $3,400, and goodwill was recorded at $13,502. The useful lives of technology and customer relationships were estimated at 20 and 14 years, respectively. Trademarks were considered to be indefinite-lived assets.
The results of these acquisitions have been included in the Company’s results of operations from the dates of their respective acquisitions. Pro forma earnings and earnings per share computations have not been presented as these acquisitions are not considered material. Net sales and Net earnings attributable to EnerSys stockholders, related to the fiscal 2014 acquisitions were $68,231 and $2,126, respectively, during fiscal 2014.
62
3. Inventories
Inventories, net consist of:
March 31, | ||||||||
2016 | 2015 | |||||||
Raw materials | $ | 84,198 | $ | 82,954 | ||||
Work-in-process | 104,085 | 106,196 | ||||||
Finished goods | 142,798 | 147,861 | ||||||
Total | $ | 331,081 | $ | 337,011 | ||||
Inventory reserves for obsolescence and other estimated losses, mainly relating to finished goods, were $23,570 and $20,242 at March 31, 2016 and 2015, respectively, and have been included in the net amounts shown above.
4. Property, Plant, and Equipment
Property, plant, and equipment consist of:
March 31, | ||||||||
2016 | 2015 | |||||||
Land, buildings, and improvements | $ | 249,112 | $ | 224,617 | ||||
Machinery and equipment | 570,394 | 546,513 | ||||||
Construction in progress | 35,450 | 48,889 | ||||||
854,956 | 820,019 | |||||||
Less accumulated depreciation | (497,547 | ) | (463,165 | ) | ||||
Total | $ | 357,409 | $ | 356,854 | ||||
Depreciation expense for the fiscal years ended March 31, 2016, 2015 and 2014 totaled $47,686, $49,261, and $49,463, respectively. Interest capitalized in connection with major capital expenditures amounted to $1,526, $1,989, and $1,046 for the fiscal years ended March 31, 2016, 2015 and 2014, respectively.
5. Goodwill and Other Intangible Assets
Other Intangible Assets
Information regarding the Company’s other intangible assets are as follows:
March 31, | ||||||||||||||||||||||||
2016 | 2015 | |||||||||||||||||||||||
Gross Amount | Accumulated Amortization | Net Amount | Gross Amount | Accumulated Amortization | Net Amount | |||||||||||||||||||
Indefinite-lived intangible assets: | ||||||||||||||||||||||||
Trademarks | $ | 98,245 | $ | (953 | ) | $ | 97,292 | $ | 100,546 | $ | (953 | ) | $ | 99,593 | ||||||||||
Finite-lived intangible assets: | ||||||||||||||||||||||||
Customer relationships | 65,963 | (18,485 | ) | 47,478 | 55,482 | (12,377 | ) | 43,105 | ||||||||||||||||
Non-compete | 2,856 | (2,457 | ) | 399 | 2,680 | (2,155 | ) | 525 | ||||||||||||||||
Technology | 18,494 | (5,423 | ) | 13,071 | 17,049 | (3,642 | ) | 13,407 | ||||||||||||||||
Trademarks | 2,004 | (983 | ) | 1,021 | 2,004 | (898 | ) | 1,106 | ||||||||||||||||
Licenses | 1,487 | (1,090 | ) | 397 | 1,482 | (1,058 | ) | 424 | ||||||||||||||||
Total | $ | 189,049 | $ | (29,391 | ) | $ | 159,658 | $ | 179,243 | $ | (21,083 | ) | $ | 158,160 | ||||||||||
63
The Company’s amortization expense related to finite-lived intangible assets was $8,308, $7,779, and $4,279, for the years ended March 31, 2016, 2015 and 2014, respectively. The expected amortization expense based on the finite-lived intangible assets as of March 31, 2016, is $8,253 in 2017, $8,000 in 2018, $7,953 in 2019, $7,803 in 2020 and $7,563 in 2021.
Goodwill
The changes in the carrying amount of goodwill by reportable segment are as follows:
Fiscal year ended March 31, 2016 | ||||||||||||||||
Americas | EMEA | Asia | Total | |||||||||||||
Balance at beginning of year | $ | 190,321 | $ | 146,962 | $ | 32,447 | $ | 369,730 | ||||||||
Goodwill acquired during the year | 497 | — | 13,898 | 14,395 | ||||||||||||
Goodwill impairment charge | (29,578 | ) | (1,833 | ) | — | (31,411 | ) | |||||||||
Reclassification of reporting unit | 6,712 | (6,712 | ) | — | — | |||||||||||
Foreign currency translation adjustment | (1,755 | ) | 2,975 | (387 | ) | 833 | ||||||||||
Balance at end of year | $ | 166,197 | $ | 141,392 | $ | 45,958 | $ | 353,547 | ||||||||
Fiscal year ended March 31, 2015 | ||||||||||||||||
Americas | EMEA | Asia | Total | |||||||||||||
Balance at beginning of year | $ | 215,630 | $ | 177,586 | $ | 32,840 | $ | 426,056 | ||||||||
Adjustments related to the finalization of purchase accounting for fiscal 2014 acquisitions | (3,256 | ) | — | 1,542 | (1,714 | ) | ||||||||||
Goodwill impairment charge | (19,621 | ) | (750 | ) | — | (20,371 | ) | |||||||||
Foreign currency translation adjustment | (2,432 | ) | (29,874 | ) | (1,935 | ) | (34,241 | ) | ||||||||
Balance at end of year | $ | 190,321 | $ | 146,962 | $ | 32,447 | $ | 369,730 | ||||||||
A reconciliation of goodwill and accumulated goodwill impairment losses, by reportable segment, is as follows:
March 31, 2016 | ||||||||||||||||
Americas | EMEA | Asia | Total | |||||||||||||
Gross carrying value | $ | 215,396 | $ | 143,975 | $ | 51,137 | $ | 410,508 | ||||||||
Accumulated goodwill impairment charges | (49,199 | ) | (2,583 | ) | (5,179 | ) | (56,961 | ) | ||||||||
Net book value | $ | 166,197 | $ | 141,392 | $ | 45,958 | $ | 353,547 | ||||||||
March 31, 2015 | ||||||||||||||||
Americas | EMEA | Asia | Total | |||||||||||||
Gross carrying value | $ | 209,942 | $ | 147,712 | $ | 37,626 | $ | 395,280 | ||||||||
Accumulated goodwill impairment charges | (19,621 | ) | (750 | ) | (5,179 | ) | (25,550 | ) | ||||||||
Net book value | $ | 190,321 | $ | 146,962 | $ | 32,447 | $ | 369,730 | ||||||||
Impairment of goodwill, indefinite-lived intangibles and fixed assets
Goodwill is tested annually for impairment during the fourth quarter or earlier upon the occurrence of certain events or substantive changes in circumstances that indicate goodwill is more likely than not impaired.
In the fourth quarter of fiscal 2016, the Company conducted step one of the annual goodwill impairment test which indicated that the fair values of three of its reporting units - Purcell and Quallion/ABSL US in the Americas and it's South Africa joint venture in the EMEA operating segment - were less than their respective carrying values, requiring the Company to perform step two of the goodwill impairment analysis.
64
Based on the aforementioned analysis, the implied fair value of goodwill was lower than the carrying value of the goodwill for the Purcell and Quallion/ABSL US reporting units in the Americas operating segment and the South Africa joint venture in the EMEA operating segment.
The Company recorded a non-cash charge of $31,411 related to goodwill impairment in the Americas and EMEA operating segment, $3,420 related to impairment of indefinite-lived trademarks in the Americas and $1,421 related to impairment of fixed assets in the EMEA operating segment for an aggregate charge of $36,252 under the caption "Impairment of goodwill, indefinite-lived intangibles and fixed assets" in the Consolidated Statements of Income.
The key factors contributing to the impairments in both fiscal years were that the reporting units in the Americas were recent acquisitions that have not performed to management's expectations. In the case of Purcell, the impairment was the result of lower estimated projected revenue and profitability in the near term caused by reduced levels of capital spending by major customers in the telecommunications industry. In the case of Quallion/ABSL US, the impairment was the result of lower estimated projected revenue and profitability in the near term caused by delays, both in introducing new products and in programs serving the aerospace and defense markets. In the case of the South Africa joint venture, declining business conditions in South Africa resulted in negative cash flows.
In fiscal 2015, as a result of failing step one of the annual goodwill impairment test, the Company performed step two of the goodwill impairment analysis and thereby recorded a non-cash charge of $20,371 related to goodwill impairment in the Americas and EMEA operating segments and $3,575 related to impairment of indefinite-lived trademarks in the Americas.
In fiscal 2014, the Company determined that the fair value of its subsidiary in India, which was acquired in fiscal 2012, was less than its carrying amount based on the Company's analysis of the estimated future expected cash flows the Company anticipated from the operations of this subsidiary. Accordingly, the Company recorded a non-cash charge of $5,179 for goodwill impairment relating to this subsidiary.
The Company estimated tax-deductible goodwill to be approximately $20,766 and $24,446 as of March 31, 2016 and 2015, respectively.
6. Prepaid and Other Current Assets
Prepaid and other current assets consist of the following:
March 31, | ||||||||
2016 | 2015 | |||||||
Prepaid non-income taxes | $ | 19,289 | $ | 19,231 | ||||
Prepaid income taxes | 35,294 | 30,577 | ||||||
Non-trade receivables | 2,876 | 4,050 | ||||||
Other | 19,593 | 23,714 | ||||||
Total | $ | 77,052 | $ | 77,572 | ||||
65
7. Accrued Expenses
Accrued expenses consist of the following:
March 31, | ||||||||
2016 | 2015 | |||||||
Payroll and benefits | $ | 48,470 | $ | 47,323 | ||||
Accrued selling expenses | 32,759 | 31,269 | ||||||
Income taxes payable | 17,345 | 17,721 | ||||||
Warranty | 20,198 | 18,285 | ||||||
Freight | 13,791 | 14,315 | ||||||
VAT and other non-income taxes | 4,302 | 8,657 | ||||||
Deferred income | 9,840 | 12,188 | ||||||
Restructuring | 2,989 | 3,820 | ||||||
Interest | 6,297 | 1,970 | ||||||
Pension | 1,321 | 1,226 | ||||||
Other | 43,184 | 36,488 | ||||||
Total | $ | 200,496 | $ | 193,262 | ||||
8. Debt
Summary of Long-Term Debt
The following summarizes the Company’s long-term debt:
As of March 31, | ||||||||||||||||
2016 | 2015 | |||||||||||||||
Principal | Unamortized Issuance Costs | Principal | Unamortized Issuance Costs | |||||||||||||
5.00% Senior Notes due 2023 | $ | 300,000 | $ | 4,370 | $ | — | $ | — | ||||||||
2011 Credit Facility, due 2018 | 312,500 | 1,909 | 325,000 | 2,615 | ||||||||||||
3.375% Convertible Notes, net of discount, due 2038 | — | — | 170,936 | 97 | ||||||||||||
$ | 612,500 | $ | 6,279 | $ | 495,936 | $ | 2,712 | |||||||||
Less: Unamortized issuance costs | 6,279 | 2,712 | ||||||||||||||
Less: Current portion | — | — | ||||||||||||||
Long-term debt, net of unamortized issuance costs | $ | 606,221 | $ | 493,224 | ||||||||||||
As discussed in Note 1, the Company elected to early adopt accounting guidance issued in April 2015 to simplify the presentation of debt issuance costs. This change in accounting principle was implemented retrospectively as of March 31, 2015. Debt issuance costs that are incurred by the Company in connection with the issuance of debt are deferred and amortized to interest expense using the effective interest method over the contractual term of the underlying indebtedness. The Company has reclassified debt issuance costs as a direct reduction to the related debt obligation on the balance sheet as of March 31, 2015.
5.00% Senior Notes
On April 23, 2015, the Company issued $300,000 in aggregate principal amount of 5.00% Senior Notes due 2023 (the “Notes”). The Notes bear interest at a rate of 5.00% per annum accruing from April 23, 2015. Interest is payable semiannually in arrears on April 30 and October 30 of each year, commencing on October 30, 2015. The Notes will mature on April 30, 2023, unless earlier redeemed or repurchased in full. The Notes are unsecured and unsubordinated obligations of the Company. The Notes are fully and unconditionally guaranteed (the “Guarantees”), jointly and severally, by each of its subsidiaries that are guarantors under the 2011 Credit Facility (the "Guarantors"). The Guarantees are unsecured and unsubordinated obligations of the Guarantors. The net proceeds from the sale of the Notes were used primarily to repay and retire in full the principal amount
66
of the Company’s senior 3.375% convertible notes (the “Convertible Notes”), as discussed below, as well as, fund the accelerated share repurchase program discussed in Note 15.
2011 Senior Secured Credit Facility
The Company is party to a $350,000 senior secured revolving credit facility (as amended, the "2011 Credit Facility"), as well as, an Incremental Commitment Agreement pursuant to which certain banks agreed to provide incremental term loan commitments of $150,000 and incremental revolving commitments of $150,000. Pursuant to these changes, the 2011 Credit Facility is now comprised of a $500,000 senior secured revolving credit facility and a $150,000 senior secured incremental term loan (the "Term Loan") that matures on September 30, 2018. The Term Loan is payable in quarterly installments of $1,875 beginning June 30, 2015 and $3,750 beginning June 30, 2016 with a final payment of $108,750 on September 30, 2018. The 2011 Credit Facility may be increased by an aggregate amount of $300,000 in revolving commitments and/or one or more new tranches of term loans, under certain conditions. Both revolving loans and the Term Loan under the 2011 Credit Facility will bear interest, at the Company's option, at a rate per annum equal to either (i) the London Interbank Offered Rate (“LIBOR”) plus between 1.25% and 1.75% (currently 1.25% and based on the Company's consolidated net leverage ratio) or (ii) the Base Rate (which is the highest of (a) the Bank of America prime rate, and (b) the Federal Funds Effective Rate) plus between 0.25% and 0.75% (based on the Company’s consolidated net leverage ratio). Obligations under the 2011 Credit Facility are secured by substantially all of the Company’s existing and future acquired assets, including substantially all of the capital stock of the Company’s United States subsidiaries that are guarantors under the credit facility, and 65% of the capital stock of certain of the Company’s foreign subsidiaries that are owned by the Company’s United States companies.
There are no prepayment penalties on loans under the 2011 Credit Facility. The Company had $170,000 revolver borrowings and $142,500 Term Loan borrowings outstanding under its 2011 Credit Facility as of March 31, 2016.
The current portion of the Term Loan of $15,000 is classified as long-term debt as the Company expects to refinance the quarterly payments with revolver borrowings under its 2011 Credit Facility.
Senior Unsecured 3.375% Convertible Notes
The Company's 3.375% Convertible Notes, with an original face value of $172,500, were issued when the Company’s stock price was trading at $30.19 per share. On March 31, 2015, the Company’s stock price closed at $64.24 per share. On May 7, 2015, the Company filed a notice of redemption for all of the Convertible Notes with a redemption date of June 8, 2015 at a price equal to $1,000.66 per $1,000 original principal amount of Convertible Notes, which is equal to 100% of the accreted principal amount of the Convertible Notes being repurchased plus accrued and unpaid interest. Holders were permitted to convert their Convertible Notes at their option on or before June 5, 2015.
Ninety-nine percent of the Convertible Notes holders exercised their conversion rights on or before June 5, 2015, pursuant to which, on July 17, 2015, the Company paid $172,388, in aggregate, towards the principal balance including accreted interest, cash equivalent of fractional shares issued towards conversion premium and settled the conversion premium by issuing, in the aggregate, 1,889,431 shares of the Company's common stock from its treasury shares, thereby resulting in the extinguishment of all of the Convertible Notes as of that date. There was no impact to the income statement from the extinguishment as the fair value of the total settlement consideration transferred and allocated to the liability component approximated the carrying value of the Convertible Notes. The remaining consideration allocated to the equity component resulted in an adjustment to equity of $84,140.
The following represents the principal amount of the liability component, the unamortized discount, and the net carrying amount of our Convertible Notes as of March 31, 2016 and 2015, respectively:
March 31, | ||||||||
2016 | 2015 | |||||||
Principal | $ | — | $ | 172,266 | ||||
Unamortized discount | — | (1,330 | ) | |||||
Net carrying amount | $ | — | $ | 170,936 | ||||
The amount of interest cost recognized for the amortization of the discount on the liability component of the Convertible Notes was $1,330, $8,283 and $7,614, respectively, for the fiscal years ended March 31, 2016, 2015 and 2014.
67
The Company paid $15,176, $10,088 and $8,490, net of interest received, for interest during the fiscal years ended March 31, 2016, 2015 and 2014, respectively.
The Company’s financing agreements contain various covenants, which, absent prepayment in full of the indebtedness and other obligations, or the receipt of waivers, would limit the Company’s ability to conduct certain specified business transactions including incurring debt, mergers, consolidations or similar transactions, buying or selling assets out of the ordinary course of business, engaging in sale and leaseback transactions, paying dividends and certain other actions. The Company is in compliance with all such covenants.
Short-Term Debt
As of March 31, 2016 and 2015, the Company had $22,144 and $19,715, respectively, of short-term borrowings from banks. The weighted-average interest rates on these borrowings were approximately 8% and 10% for fiscal years ended March 31, 2016 and 2015, respectively.
Letters of Credit
As of March 31, 2016 and 2015, the Company had $2,693 and $3,862, respectively, of standby letters of credit.
Deferred Financing Fees
In connection with the issuance of the Notes, the Company incurred $5,031 in debt issuance costs. Amortization expense, relating to debt issuance costs, included in interest expense was $1,464, $1,263, and $1,141 for the fiscal years ended March 31, 2016, 2015 and 2014, respectively. Debt issuance costs, net of accumulated amortization, totaled $6,279 and $2,712 as of March 31, 2016 and 2015, respectively.
Available Lines of Credit
As of March 31, 2016 and 2015, the Company had available and undrawn, under all its lines of credit, $472,187 and $464,733, respectively, including $144,112 and $141,533, respectively, of uncommitted lines of credit as of March 31, 2016 and March 31, 2015.
9. Leases
The Company’s future minimum lease payments under operating leases that have noncancelable terms in excess of one year as of March 31, 2016 are as follows:
Operating Leases | ||||
2017 | $ | 20,291 | ||
2018 | 16,014 | |||
2019 | 11,160 | |||
2020 | 8,750 | |||
2021 | 6,387 | |||
Thereafter | 6,447 | |||
Total minimum lease payments | $ | 69,049 | ||
Rental expense was $34,590, $35,974, and $34,923 for the fiscal years ended March 31, 2016, 2015 and 2014, respectively. Certain operating lease agreements contain renewal or purchase options and/or escalation clauses.
68
10. Other Liabilities
Other liabilities consist of the following:
March 31, | ||||||||
2016 | 2015 | |||||||
Pension | $ | 41,309 | $ | 42,144 | ||||
Warranty | 28,224 | 21,525 | ||||||
Deferred income | 6,007 | 6,564 | ||||||
Liability for uncertain tax benefits | 2,176 | 3,796 | ||||||
Other | 8,763 | 7,550 | ||||||
Total | $ | 86,479 | $ | 81,579 | ||||
11. Fair Value of Financial Instruments
Recurring Fair Value Measurements
The following tables represent the financial assets and (liabilities) measured at fair value on a recurring basis as of March 31, 2016 and March 31, 2015 and the basis for that measurement:
Total Fair Value Measurement March 31, 2016 | Quoted Price in Active Markets for Identical Assets (Level 1) | Significant Other Observable Inputs (Level 2) | Significant Unobservable Inputs (Level 3) | |||||||||||||
Lead forward contracts | $ | (499 | ) | $ | — | $ | (499 | ) | $ | — | ||||||
Foreign currency forward contracts | (988 | ) | — | (988 | ) | — | ||||||||||
Total derivatives | $ | (1,487 | ) | $ | — | $ | (1,487 | ) | $ | — | ||||||
Total Fair Value Measurement March 31, 2015 | Quoted Price in Active Markets for Identical Assets (Level 1) | Significant Other Observable Inputs (Level 2) | Significant Unobservable Inputs (Level 3) | |||||||||||||
Lead forward contracts | $ | (341 | ) | $ | — | $ | (341 | ) | $ | — | ||||||
Foreign currency forward contracts | 4,155 | — | 4,155 | — | ||||||||||||
Total derivatives | $ | 3,814 | $ | — | $ | 3,814 | $ | — | ||||||||
The fair values of lead forward contracts are calculated using observable prices for lead as quoted on the London Metal Exchange (“LME”) and, therefore, were classified as Level 2 as described in Note 1, Summary of Significant Accounting Policies.
The fair values for foreign currency forward contracts are based upon current quoted market prices and are classified as Level 2 based on the nature of the underlying market in which these derivatives are traded.
Financial Instruments
The fair values of the Company’s cash and cash equivalents, accounts receivable and accounts payable approximate carrying value due to their short maturities.
The fair value of the Company’s short-term debt and borrowings under the 2011 Credit Facility (as defined in Note 8), approximate their respective carrying value, as they are variable rate debt and the terms are comparable to market terms as of the balance sheet dates and are classified as Level 2.
The Company's 5.00% Senior Notes due 2023, with an original face value of $300,000, were issued in April 2015. The fair values of these Notes represent the trading values based upon quoted market prices and are classified as Level 2. The Notes were trading at approximately 96% of face value on March 31, 2016.
69
The Company's 3.375% Convertible Notes, with an original face value of $172,500, were issued when the Company’s stock price was trading at $30.19 per share. On March 31, 2015, the Company’s stock price closed at $64.24 per share. On July 17, 2015, the Company paid $172,388, in aggregate, towards the principal balance including accreted interest, cash equivalent of fractional shares issued towards conversion premium and settled the conversion premium by issuing, in the aggregate, 1,889,431 shares of the Company's common stock from its treasury shares, thereby resulting in the extinguishment of all of the Convertible Notes as of that date. The fair value of the Convertible Notes as of March 31, 2015, which were trading at 161% as of that date, represented the trading values based upon quoted market prices at and were classified as Level 2.
The carrying amounts and estimated fair values of the Company’s derivatives, the Notes and Convertible Notes (as defined in Note 8) at March 31, 2016 and 2015 were as follows:
March 31, 2016 | March 31, 2015 | |||||||||||||||||||||||
Carrying Amount | Fair Value | Carrying Amount | Fair Value | |||||||||||||||||||||
Financial assets: | ||||||||||||||||||||||||
Derivatives(1) | $ | — | $ | — | $ | 4,155 | $ | 4,155 | ||||||||||||||||
Financial liabilities: | ||||||||||||||||||||||||
Notes (2) | 300,000 | 288,000 | — | — | ||||||||||||||||||||
Convertible Notes (2) (3) | — | — | 170,936 | 277,348 | ||||||||||||||||||||
Derivatives(1) | $ | 1,487 | $ | 1,487 | $ | 341 | $ | 341 | ||||||||||||||||
(1) | Represents lead and foreign currency forward contracts (see Note 12 for asset and liability positions of the lead and foreign currency forward contracts at March 31, 2016 and March 31, 2015). |
(2) | The fair value amount of the Notes at March 31, 2016 and the Convertible Notes at March 31, 2015 represents the trading value of the instruments. |
(3) | The carrying amount of the Convertible Notes at March 31, 2015 represents the $172,266 principal balance, less the unamortized debt discount (see Note 8 for further details). |
Non-recurring fair value measurements
The valuation of goodwill and other intangible assets is based on information and assumptions available to the Company at the time of acquisition, using income and market approaches to determine fair value. The Company tests goodwill and other intangible assets annually for impairment, or when indications of potential impairment exist (see Note 1).
Goodwill is tested for impairment by determining the fair value of the Company’s reporting units. The unobservable inputs used to measure the fair value of the reporting units include projected growth rates, profitability, and the risk factor premium added to the discount rate. The remeasurement of goodwill is classified as a Level 3 fair value assessment due to the significance of unobservable inputs developed using company-specific information.
The inputs used to measure the fair value of other intangible assets were largely unobservable and accordingly were also classified as Level 3. The fair value of trademarks, is based on the royalties saved that would have been paid to a third party had the Company not owned the trademark. For fiscal 2016, the Company used royalty rates ranging between 0.5%-2.5% based on comparable market rates, and used discount rates ranging between 16.0%-24.0%. For fiscal 2015, the Company used royalty rates ranging between 1.0%-2.5% based on comparable market rates, and used discount rates ranging between 19.0%-23.5%.
The fair value of other indefinite-lived intangibles was estimated using the income approach, based on cash flow projections of revenue growth rates, taking into consideration industry and market conditions.
In connection with the annual impairment testing conducted as of December 28, 2015 for fiscal 2016, indefinite-lived trademarks associated with Purcell and Quallion/ABSL US were recorded at fair value on a nonrecurring basis at $10,000 and $990, respectively, and the remeasurement resulted in an aggregate impairment charge of $3,420.
In connection with the annual impairment testing conducted as of December 29, 2014 for fiscal 2015, indefinite-lived trademarks associated with Purcell and Quallion/ABSL US were recorded at fair value on a nonrecurring basis at $13,300 and $1,070, respectively, and the remeasurement resulted in an aggregate impairment charge of $3,575.
These charges are included under the caption "Impairment of goodwill, indefinite-lived intangibles and fixed assets" in the Consolidated Statements of Income.
70
12. Derivative Financial Instruments
The Company utilizes derivative instruments to reduce its exposure to fluctuations in commodity prices and foreign exchange rates, under established procedures and controls. The Company does not enter into derivative contracts for speculative purposes. The Company’s agreements are with creditworthy financial institutions and the Company anticipates performance by counterparties to these contracts and therefore no material loss is expected.
Derivatives in Cash Flow Hedging Relationships
Lead Forward Contracts
The Company enters into lead forward contracts to fix the price for a portion of its lead purchases. Management considers the lead forward contracts to be effective against changes in the cash flows of the underlying lead purchases. The vast majority of such contracts are for a period not extending beyond one year and the notional amounts at March 31, 2016 and 2015 were 27.4 million pounds and 91.6 million pounds, respectively.
Foreign Currency Forward Contracts
The Company uses foreign currency forward contracts and options to hedge a portion of the Company’s foreign currency exposures for lead as well as other foreign currency exposures so that gains and losses on these contracts offset changes in the underlying foreign currency denominated exposures. The vast majority of such contracts are for a period not extending beyond one year. As of March 31, 2016 and 2015, the Company had entered into a total of $18,206 and $75,878, respectively, of such contracts.
In the coming twelve months, the Company anticipates that $601 of net pretax gain relating to lead and foreign currency forward contracts will be reclassified from AOCI as part of cost of goods sold. This amount represents the current net unrealized impact of hedging lead and foreign exchange rates, which will change as market rates change in the future, and will ultimately be realized in the Consolidated Statement of Income as an offset to the corresponding actual changes in lead costs to be realized in connection with the variable lead cost and foreign exchange rates being hedged.
Derivatives not Designated in Hedging Relationships
Foreign Currency Forward Contracts
The Company also enters into foreign currency forward contracts to economically hedge foreign currency fluctuations on intercompany loans and foreign currency denominated receivables and payables. These are not designated as hedging instruments and changes in fair value of these instruments are recorded directly in the Consolidated Statements of Income. As of March 31, 2016 and 2015, the notional amount of these contracts was $11,156 and $26,246, respectively.
71
Presented below in tabular form is information on the location and amounts of derivative fair values in the Consolidated Balance Sheets and derivative gains and losses in the Consolidated Statements of Income:
Fair Value of Derivative Instruments
March 31, 2016 and 2015
Derivatives and Hedging Activities Designated as Cash Flow Hedges | Derivatives and Hedging Activities Not Designated as Hedging Instruments | |||||||||||||||
March 31, 2016 | March 31, 2015 | March 31, 2016 | March 31, 2015 | |||||||||||||
Prepaid and other current assets | ||||||||||||||||
Foreign currency forward contracts | $ | — | $ | 3,735 | $ | — | $ | 420 | ||||||||
Total assets | $ | — | $ | 3,735 | $ | — | $ | 420 | ||||||||
Accrued expenses | ||||||||||||||||
Lead hedge forward contracts | $ | 499 | $ | 341 | $ | — | $ | — | ||||||||
Foreign currency forward contracts | 350 | — | 638 | — | ||||||||||||
Total liabilities | $ | 849 | $ | 341 | $ | 638 | $ | — | ||||||||
The Effect of Derivative Instruments on the Consolidated Statements of Income
For the fiscal year ended March 31, 2016
Derivatives Designated as Cash Flow Hedges | Pretax Gain (Loss) Recognized in AOCI on Derivative (Effective Portion) | Location of Gain (Loss) Reclassified from AOCI into Income (Effective Portion) | Pretax Gain (Loss) Reclassified from AOCI into Income (Effective Portion) | |||||||
Lead hedge forward contracts | $ | (3,361 | ) | Cost of goods sold | $ | (11,085 | ) | |||
Foreign currency forward contracts | (3,023 | ) | Cost of goods sold | 3,941 | ||||||
Total | $ | (6,384 | ) | $ | (7,144 | ) | ||||
Derivatives Not Designated as Hedging Instruments | Location of Gain (Loss) Recognized in Income on Derivative | Pretax Gain (Loss) | ||
Foreign currency forward contracts | Other (income) expense, net | $ | (409 | ) |
Total | $ | (409 | ) | |
The Effect of Derivative Instruments on the Consolidated Statements of Income
For the fiscal year ended March 31, 2015
Derivatives Designated as Cash Flow Hedges | Pretax Gain (Loss) Recognized in AOCI on Derivative (Effective Portion) | Location of Gain (Loss) Reclassified from AOCI into Income (Effective Portion) | Pretax Gain (Loss) Reclassified from AOCI into Income (Effective Portion) | |||||||
Lead hedge forward contracts | $ | (7,743 | ) | Cost of goods sold | $ | (4,347 | ) | |||
Foreign currency forward contracts | 8,206 | Cost of goods sold | 1,386 | |||||||
Total | $ | 463 | $ | (2,961 | ) | |||||
Derivatives Not Designated as Hedging Instruments | Location of Gain (Loss) Recognized in Income on Derivative | Pretax Gain (Loss) | ||
Foreign currency forward contracts | Other (income) expense, net | $ | 972 | |
Total | $ | 972 | ||
72
The Effect of Derivative Instruments on the Consolidated Statements of Income
For the fiscal year ended March 31, 2014
Derivatives Designated as Cash Flow Hedges | Pretax Gain (Loss) Recognized in AOCI on Derivative (Effective Portion) | Location of Gain (Loss) Reclassified from AOCI into Income (Effective Portion) | Pretax Gain (Loss) Reclassified from AOCI into Income (Effective Portion) | |||||||
Lead hedge forward contracts | $ | (1,562 | ) | Cost of goods sold | $ | 718 | ||||
Foreign currency forward contracts | (682 | ) | Cost of goods sold | (707 | ) | |||||
Total | $ | (2,244 | ) | $ | 11 | |||||
Derivatives Not Designated as Hedging Instruments | Location of Gain (Loss) Recognized in Income on Derivative | Pretax Gain (Loss) | ||
Foreign currency forward contracts | Other (income) expense, net | $ | (188 | ) |
Total | $ | (188 | ) | |
13. Income Taxes
Income tax expense is composed of the following:
Fiscal year ended March 31, | ||||||||||||
2016 | 2015 | 2014 | ||||||||||
Current: | ||||||||||||
Federal | $ | 29,082 | $ | 12,299 | $ | 41,256 | ||||||
State | 4,750 | 3,044 | 2,845 | |||||||||
Foreign | 17,034 | 20,585 | 22,627 | |||||||||
Total current | 50,866 | 35,928 | 66,728 | |||||||||
Deferred: | ||||||||||||
Federal | (3,706 | ) | 25,113 | (18,410 | ) | |||||||
State | 124 | 1,771 | (4,088 | ) | ||||||||
Foreign | 2,829 | 5,002 | (27,250 | ) | ||||||||
Total deferred | (753 | ) | 31,886 | (49,748 | ) | |||||||
Income tax expense | $ | 50,113 | $ | 67,814 | $ | 16,980 | ||||||
Earnings before income taxes consists of the following:
Fiscal year ended March 31, | ||||||||||||
2016 | 2015 | 2014 | ||||||||||
United States | $ | 64,235 | $ | 76,327 | $ | 47,753 | ||||||
Foreign | 117,702 | 173,012 | 115,994 | |||||||||
Earnings before income taxes | $ | 181,937 | $ | 249,339 | $ | 163,747 | ||||||
Income taxes paid by the Company for the fiscal years ended March 31, 2016, 2015 and 2014 were $44,625, $42,404 and $76,644, respectively.
73
The following table sets forth the tax effects of temporary differences that give rise to significant portions of the deferred tax assets and liabilities:
March 31, | ||||||||
2016 | 2015 | |||||||
Deferred tax assets: | ||||||||
Accounts receivable | $ | 1,450 | $ | 907 | ||||
Inventories | 6,596 | 5,855 | ||||||
Net operating loss carryforwards | 50,094 | 46,069 | ||||||
Accrued expenses | 25,436 | 28,830 | ||||||
Other assets | 22,551 | 21,279 | ||||||
Gross deferred tax assets | 106,127 | 102,940 | ||||||
Less valuation allowance | (25,416 | ) | (20,063 | ) | ||||
Total deferred tax assets | 80,711 | 82,877 | ||||||
Deferred tax liabilities: | ||||||||
Property, plant and equipment | 25,302 | 23,851 | ||||||
Other intangible assets | 65,879 | 65,432 | ||||||
Convertible Notes | — | 30,012 | ||||||
Other liabilities | 2,008 | 4,267 | ||||||
Total deferred tax liabilities | 93,189 | 123,562 | ||||||
Net deferred tax liabilities | $ | (12,478 | ) | $ | (40,685 | ) | ||
As described in Note 1, the Company early adopted ASU 2015-17 on a retrospective basis effective March 31, 2016. As a result, the Company reclassified $31,749 and $1,583 of deferred tax assets and liabilities, respectively, from current deferred taxes resulting in non-current net deferred tax assets and liabilities of $36,516 and $77,201, respectively in the Consolidated Balance Sheet as of March 31, 2015.
The Company has approximately $1,977 in United States federal net operating loss carryforwards, all of which are limited by Section 382 of the Internal Revenue Code, with expirations between 2023 and 2027. The Company has approximately $159,088 of foreign net operating loss carryforwards, of which $120,353 may be carried forward indefinitely and $38,735 expire between 2019 and 2024. In addition, the Company also had approximately $38,142 of state net operating loss carryforwards with expirations between 2017 and 2036.
As of March 31, 2016 and 2015, the federal valuation allowance was $1,050. As of March 31, 2016 and 2015, the valuation allowance associated with the state tax jurisdictions was $656 and $608, respectively. As of March 31, 2016 and 2015, the valuation allowance associated with certain foreign tax jurisdictions was $23,710 and $18,404, respectively. The change includes an increase of $6,262 to tax expense primarily related to net operating loss carryforwards generated in the current year that the Company believes are not more likely than not to be realized, and a decrease of $956 primarily related to currency fluctuations.
74
A reconciliation of income taxes at the statutory rate to the income tax provision is as follows:
Fiscal year ended March 31, | ||||||||||||
2016 | 2015 | 2014 | ||||||||||
United States statutory income tax expense (at 35%) | $ | 63,678 | $ | 87,269 | $ | 57,311 | ||||||
Increase (decrease) resulting from: | ||||||||||||
State income taxes, net of federal effect | 3,282 | 3,206 | (647 | ) | ||||||||
Nondeductible expenses, domestic manufacturing deduction and other | (3,796 | ) | 8,666 | 5,124 | ||||||||
Goodwill impairment | 6,475 | 5,194 | 1,760 | |||||||||
Effect of foreign operations | (25,788 | ) | (38,313 | ) | (26,037 | ) | ||||||
Valuation allowance | 6,262 | 1,792 | (20,531 | ) | ||||||||
Income tax expense | $ | 50,113 | $ | 67,814 | $ | 16,980 | ||||||
The effective income tax rates for the fiscal years ended March 31, 2016, 2015 and 2014 were 27.5%, 27.2% and 10.4%, respectively. The effective income tax rate with respect to any period may be volatile based on the mix of income in the tax jurisdictions in which we operate and the amount of our consolidated income before taxes.
The fiscal 2016 foreign effective income tax rate on foreign pre-tax income of $117,702 was 16.9%. The fiscal 2015 foreign effective income tax rate on foreign pre-tax income of $173,012 was 14.8%. The fiscal 2014 foreign effective income tax rate on foreign pre-tax income of $115,994 was (4.0)%.
Income from the Company's Swiss subsidiary comprised a substantial portion of our overall foreign mix of income for the fiscal years ended March 31, 2016, 2015 and 2014 and is taxed at approximately 7%.
At March 31, 2016, the Company has not recorded United States income or foreign withholding taxes on approximately $878,225 of undistributed earnings of foreign subsidiaries that could be subject to taxation if remitted to the United States because the Company currently plans to keep these amounts indefinitely invested overseas. It is not practical to calculate the income tax expense that would result upon repatriation of these earnings.
A reconciliation of the beginning and ending amount of unrecognized tax benefits is as follows:
March 31, 2013 | $ | 16,485 | |
Increases related to current year tax positions | 207 | ||
Increases related to prior year tax positions | 2,877 | ||
Decreases related to prior tax positions due to foreign currency translation | (68 | ) | |
Decreases related to prior year tax positions | (14,835 | ) | |
Lapse of statute of limitations | (923 | ) | |
March 31, 2014 | 3,743 | ||
Increases related to current year tax positions | 3,241 | ||
Increases related to prior year tax positions | 9 | ||
Decreases related to prior tax positions due to foreign currency translation | (85 | ) | |
Decreases related to prior year tax positions settled | (2,695 | ) | |
Lapse of statute of limitations | (101 | ) | |
March 31, 2015 | 4,112 | ||
Increases related to current year tax positions | 422 | ||
Increases related to prior year tax positions | 470 | ||
Decreases related to prior tax positions due to foreign currency translation | — | ||
Decreases related to prior year tax positions | (2,315 | ) | |
Lapse of statute of limitations | (314 | ) | |
March 31, 2016 | $ | 2,375 | |
75
All of the balance of unrecognized tax benefits at March 31, 2016, if recognized, would be included in the Company’s Consolidated Statements of Income and have a favorable impact on both the Company’s net earnings and effective tax rate.
The Company and its subsidiaries file income tax returns in the U.S. federal jurisdiction, and various states and foreign jurisdictions. With few exceptions, the Company is no longer subject to U.S. federal, state and local, or non-U.S. income tax examinations by tax authorities for years before 2013.
While the net effect on total unrecognized tax benefits cannot be reasonably estimated, approximately $178 is expected to reverse in fiscal 2017 due to expiration of various statute of limitations.
The Company recognizes tax related interest and penalties in income tax expense in its Consolidated Statements of Income. As of March 31, 2016 and 2015, the Company had an accrual of $310 and $170, respectively, for interest and penalties.
14. Retirement Plans
Defined Benefit Plans
The Company provides retirement benefits to substantially all eligible salaried and hourly employees. The Company uses a measurement date of March 31 for its pension plans.
Net periodic pension cost for fiscal 2016, 2015 and 2014, includes the following components:
United States Plans | International Plans | |||||||||||||||||||||||
Fiscal year ended March 31, | Fiscal year ended March 31, | |||||||||||||||||||||||
2016 | 2015 | 2014 | 2016 | 2015 | 2014 | |||||||||||||||||||
Service cost | $ | 482 | $ | 400 | $ | 348 | $ | 820 | $ | 767 | $ | 829 | ||||||||||||
Interest cost | 682 | 673 | 619 | 1,904 | 2,546 | 2,412 | ||||||||||||||||||
Expected return on plan assets | (855 | ) | (889 | ) | (796 | ) | (2,247 | ) | (2,248 | ) | (2,134 | ) | ||||||||||||
Amortization and deferral | 481 | 319 | 479 | 1,249 | 688 | 56 | ||||||||||||||||||
Curtailment loss | 313 | — | — | — | — | — | ||||||||||||||||||
Net periodic benefit cost | $ | 1,103 | $ | 503 | $ | 650 | $ | 1,726 | $ | 1,753 | $ | 1,163 | ||||||||||||
76
The following table sets forth a reconciliation of the related benefit obligation, plan assets, and accrued benefit costs related to the pension benefits provided by the Company for those employees covered by defined benefit plans:
United States Plans | International Plans | |||||||||||||||
March 31, | March 31, | |||||||||||||||
2016 | 2015 | 2016 | 2015 | |||||||||||||
Change in projected benefit obligation | ||||||||||||||||
Benefit obligation at the beginning of the period | $ | 18,059 | $ | 15,290 | $ | 72,091 | $ | 69,227 | ||||||||
Service cost | 482 | 400 | 820 | 767 | ||||||||||||
Interest cost | 682 | 673 | 1,904 | 2,546 | ||||||||||||
Plan amendments | — | — | — | — | ||||||||||||
Benefits paid, inclusive of plan expenses | (912 | ) | (770 | ) | (1,944 | ) | (1,904 | ) | ||||||||
Plan curtailments and settlements | (120 | ) | — | — | (54 | ) | ||||||||||
Actuarial (gains) losses | (542 | ) | 2,466 | (4,144 | ) | 14,198 | ||||||||||
Foreign currency translation adjustment | — | — | 407 | (12,689 | ) | |||||||||||
Benefit obligation at the end of the period | $ | 17,649 | $ | 18,059 | $ | 69,134 | $ | 72,091 | ||||||||
Change in plan assets | ||||||||||||||||
Fair value of plan assets at the beginning of the period | $ | 12,379 | $ | 11,309 | $ | 34,401 | $ | 33,706 | ||||||||
Actual return on plan assets | (124 | ) | 1,051 | (591 | ) | 4,918 | ||||||||||
Employer contributions | 496 | 789 | 1,504 | 1,890 | ||||||||||||
Benefits paid, inclusive of plan expenses | (912 | ) | (770 | ) | (1,944 | ) | (1,904 | ) | ||||||||
Plan curtailments and settlements | — | — | — | (54 | ) | |||||||||||
Foreign currency translation adjustment | — | — | (1,056 | ) | (4,155 | ) | ||||||||||
Fair value of plan assets at the end of the period | $ | 11,839 | $ | 12,379 | $ | 32,314 | $ | 34,401 | ||||||||
Funded status deficit | $ | (5,810 | ) | $ | (5,680 | ) | $ | (36,820 | ) | $ | (37,690 | ) | ||||
March 31, | ||||||||
2016 | 2015 | |||||||
Amounts recognized in the Consolidated Balance Sheets consist of: | ||||||||
Accrued expenses | $ | (1,321 | ) | $ | (1,226 | ) | ||
Other liabilities | (41,309 | ) | (42,144 | ) | ||||
$ | (42,630 | ) | $ | (43,370 | ) | |||
77
The following table represents pension components (before tax) and related changes (before tax) recognized in AOCI for the Company’s pension plans for the years ended March 31, 2016, 2015 and 2014:
Fiscal year ended March 31, | ||||||||||||
2016 | 2015 | 2014 | ||||||||||
Amounts recorded in AOCI before taxes: | ||||||||||||
Prior service cost | $ | (445 | ) | $ | (800 | ) | $ | (1,036 | ) | |||
Net loss | (26,628 | ) | (28,734 | ) | (19,239 | ) | ||||||
Net amount recognized | $ | (27,073 | ) | $ | (29,534 | ) | $ | (20,275 | ) | |||
Fiscal year ended March 31, | ||||||||||||
2016 | 2015 | 2014 | ||||||||||
Changes in plan assets and benefit obligations: | ||||||||||||
New prior service cost | $ | — | $ | — | $ | 255 | ||||||
Net loss arising during the year | (988 | ) | 13,831 | 2,262 | ||||||||
Effect of exchange rates on amounts included in AOCI | 142 | (3,565 | ) | 920 | ||||||||
Amounts recognized as a component of net periodic benefit costs: | ||||||||||||
Amortization of prior service cost | (382 | ) | (101 | ) | (81 | ) | ||||||
Amortization or settlement recognition of net loss | (1,661 | ) | (906 | ) | (694 | ) | ||||||
Total recognized in other comprehensive income | $ | (2,889 | ) | $ | 9,259 | $ | 2,662 | |||||
The amounts included in AOCI as of March 31, 2016 that are expected to be recognized as components of net periodic pension cost during the next twelve months are as follows:
Prior service cost | $ | (44 | ) |
Net loss | (1,560 | ) | |
Net amount expected to be recognized | $ | (1,604 | ) |
The accumulated benefit obligation related to all defined benefit pension plans and information related to unfunded and underfunded defined benefit pension plans at the end of each year are as follows:
United States Plans | International Plans | |||||||||||||||
March 31, | March 31, | |||||||||||||||
2016 | 2015 | 2016 | 2015 | |||||||||||||
All defined benefit plans: | ||||||||||||||||
Accumulated benefit obligation | $ | 17,649 | $ | 18,059 | $ | 65,732 | $ | 68,272 | ||||||||
Unfunded defined benefit plans: | ||||||||||||||||
Projected benefit obligation | $ | — | $ | — | $ | 30,272 | $ | 28,984 | ||||||||
Accumulated benefit obligation | — | — | 28,875 | 27,768 | ||||||||||||
Defined benefit plans with a projected benefit obligation in excess of the fair value of plan assets: | ||||||||||||||||
Projected benefit obligation | $ | 17,649 | $ | 18,059 | $ | 69,134 | $ | 72,091 | ||||||||
Fair value of plan assets | 11,839 | 12,379 | 32,314 | 34,401 | ||||||||||||
Defined benefit plans with an accumulated benefit obligation in excess of the fair value of plan assets: | ||||||||||||||||
Projected benefit obligation | $ | 17,649 | $ | 18,059 | $ | 69,134 | $ | 72,091 | ||||||||
Accumulated benefit obligation | 17,649 | 18,059 | 65,732 | 68,272 | ||||||||||||
Fair value of plan assets | 11,839 | 12,379 | 32,314 | 34,401 | ||||||||||||
78
Assumptions
Significant assumptions used to determine the net periodic benefit cost for the U.S. and International plans were as follows:
United States Plans | International Plans | ||||||||||||||
Fiscal year ended March 31, | Fiscal year ended March 31, | ||||||||||||||
2016 | 2015 | 2014 | 2016 | 2015 | 2014 | ||||||||||
Discount rate | 3.8 | % | 4.5 | % | 4.0 | % | 1.25-3.4% | 3.0-4.6% | 2.5-4.4% | ||||||
Expected return on plan assets | 7.0 | 7.8 | 7.8 | 3.2-6.5 | 4.4-7.0 | 4.0-7.0 | |||||||||
Rate of compensation increase | N/A | N/A | N/A | 1.5-3.75 | 2.0-4.0 | 2.0-4.0 | |||||||||
Significant assumptions used to determine the projected benefit obligations for the U.S. and International plans were as follows:
United States Plans | International Plans | |||||||||
March 31, | March 31, | |||||||||
2016 | 2015 | 2016 | 2015 | |||||||
Discount rate | 3.9 | % | 3.8 | % | 1.8-3.7% | 1.25-3.4% | ||||
Expected return on plan assets | 7.0 | 7.0 | 3.3-6.5 | 3.2-6.5 | ||||||
Rate of compensation increase | N/A | N/A | 1.5-4.0 | 1.5-3.75 | ||||||
N/A = not applicable
The United States plans do not include compensation in the formula for determining the pension benefit as it is based solely on years of service.
The expected long-term rate of return for the Company’s pension plan assets is based upon the target asset allocation and is determined using forward looking assumptions in the context of historical returns and volatilities for each asset class, as well as, correlations among asset classes. The Company evaluates the rate of return assumptions for each of its plans on an annual basis.
Pension Plan Investment Strategy
The Company’s investment policy emphasizes a balanced approach to investing in securities of high quality and ready marketability. Investment flexibility is encouraged so as not to exclude opportunities available through a diversified investment strategy.
Equity investments are maintained within a target range of 40%-75% of the total portfolio market value for the U.S. plans and with a target of approximately 65% for international plans. Investments in debt securities include issues of various maturities, and the average quality rating of bonds should be investment grade with a minimum quality rating of “B” at the time of purchase.
The Company periodically reviews the asset allocation of its portfolio. The proportion committed to equities, debt securities and cash and cash equivalents is a function of the values available in each category and risk considerations. The plan’s overall return will be compared to and expected to meet or exceed established benchmark funds and returns over a three to five year period.
The objectives of the Company’s investment strategies are: (a) the achievement of a reasonable long-term rate of total return consistent with an emphasis on preservation of capital and purchasing power, (b) stability of annual returns through a portfolio risk level, which is appropriate to conservative accounts, and (c) reflective of the Company’s willingness to forgo significantly above-average rewards in order to minimize above-average risks. These objectives may not be met each year but should be attained over a reasonable period of time.
79
The following table represents our pension plan investments measured at fair value as of March 31, 2016 and 2015 and the basis for that measurement:
March 31, 2016 | ||||||||||||||||||||||||||||||||
United States Plans | International Plans | |||||||||||||||||||||||||||||||
Total Fair Value Measurement | Quoted Price In Active Markets for Identical Assets (Level 1) | Significant Other Observable Inputs (Level 2) | Significant Unobservable Inputs (Level 3) | Total Fair Value Measurement | Quoted Price In Active Markets for Identical Assets (Level 1) | Significant Other Observable Inputs (Level 2) | Significant Unobservable Inputs (Level 3) | |||||||||||||||||||||||||
Asset category: | ||||||||||||||||||||||||||||||||
Cash and cash equivalents | $ | 928 | $ | 928 | $ | — | $ | — | $ | — | $ | — | $ | — | $ | — | ||||||||||||||||
Equity securities | ||||||||||||||||||||||||||||||||
US(a) | 7,324 | 7,324 | — | — | — | — | — | — | ||||||||||||||||||||||||
International(b) | 1,015 | 1,015 | — | — | 21,439 | — | 21,439 | — | ||||||||||||||||||||||||
Fixed income(c) | 2,572 | 2,572 | — | — | 10,875 | — | 10,875 | — | ||||||||||||||||||||||||
Total | $ | 11,839 | $ | 11,839 | $ | — | $ | — | $ | 32,314 | $ | — | $ | 32,314 | $ | — | ||||||||||||||||
March 31, 2015 | ||||||||||||||||||||||||||||||||
United States Plans | International Plans | |||||||||||||||||||||||||||||||
Total Fair Value Measurement | Quoted Price In Active Markets for Identical Assets (Level 1) | Significant Other Observable Inputs (Level 2) | Significant Unobservable Inputs (Level 3) | Total Fair Value Measurement | Quoted Price In Active Markets for Identical Assets (Level 1) | Significant Other Observable Inputs (Level 2) | Significant Unobservable Inputs (Level 3) | |||||||||||||||||||||||||
Asset category: | ||||||||||||||||||||||||||||||||
Cash and cash equivalents | $ | 1,248 | $ | 1,248 | $ | — | $ | — | $ | — | $ | — | $ | — | $ | — | ||||||||||||||||
Equity securities | ||||||||||||||||||||||||||||||||
US(a) | 7,282 | 7,282 | — | — | 3,431 | 3,431 | — | — | ||||||||||||||||||||||||
International(b) | 1,075 | 1,075 | — | — | 18,646 | 18,646 | — | — | ||||||||||||||||||||||||
Fixed income(c) | 2,774 | 2,774 | — | — | 12,324 | 12,324 | — | — | ||||||||||||||||||||||||
Total | $ | 12,379 | $ | 12,379 | $ | — | $ | — | $ | 34,401 | $ | 34,401 | $ | — | $ | — | ||||||||||||||||
The fair values presented above were determined based on valuation techniques to measure fair value as discussed in Note 1.
(a) | US equities include companies that are well diversified by industry sector and equity style (i.e., growth and value strategies). Active and passive management strategies are employed. Investments are primarily in large capitalization stocks and, to a lesser extent, mid- and small-cap stocks. |
(b) | International equities are invested in companies that are traded on exchanges outside the U.S. and are well diversified by industry sector, country and equity style. Active and passive strategies are employed. The vast majority of the investments are made in companies in developed markets with a small percentage in emerging markets. |
(c) | Fixed income consists primarily of investment grade bonds from diversified industries. |
The Company expects to make cash contributions of approximately $2,145 to its pension plans in fiscal 2017.
80
Estimated future benefit payments under the Company’s pension plans are as follows:
Pension Benefits | |||
2017 | $ | 2,703 | |
2018 | 2,481 | ||
2019 | 2,751 | ||
2020 | 3,157 | ||
2021 | 3,526 | ||
Years 2022-2026 | 21,036 | ||
Defined Contribution Plan
The Company maintains defined contribution plans primarily in the U.S. and U.K. Eligible employees can contribute a portion of their pre-tax and/or after-tax income in accordance with plan guidelines and the Company will make contributions based on the employees’ eligible pay and/or will match a percentage of the employee contributions up to certain limits. Matching contributions charged to expense for the fiscal years ended March 31, 2016, 2015 and 2014 were $6,730, $7,174 and $6,311, respectively.
15. Stockholders’ Equity and Noncontrolling Interests
Preferred Stock and Common Stock
The Company’s certificate of incorporation authorizes the issuance of up to 1,000,000 shares of preferred stock, par value $0.01 per share (“Preferred Stock”). At March 31, 2016 and 2015, no shares of Preferred Stock were issued or outstanding. The Board of Directors of the Company has the authority to specify the terms of any Preferred Stock at the time of issuance.
The following demonstrates the change in the number of shares of common stock outstanding during fiscal years ended March 31, 2014, 2015 and 2016, respectively:
Shares outstanding as of March 31, 2013 | 47,840,204 | |
Purchase of treasury stock | (1,191,145 | ) |
Shares issued as part of equity-based compensation plans, net of equity awards surrendered for option price and taxes | 293,067 | |
Shares outstanding as of March 31, 2014 | 46,942,126 | |
Purchase of treasury stock | (3,274,829 | ) |
Shares issued as part of equity-based compensation plans, net of equity awards surrendered for option price and taxes | 401,291 | |
Shares outstanding as of March 31, 2015 | 44,068,588 | |
Purchase of treasury stock | (3,216,654 | ) |
Shares issued from treasury stock to settle conversion premium on Convertible Notes | 1,889,431 | |
Shares issued as part of equity-based compensation plans, net of equity awards surrendered for option price and taxes | 448,137 | |
Shares outstanding as of March 31, 2016 | 43,189,502 | |
Treasury Stock
In fiscal 2016 and 2015, the Company purchased 3,216,654 shares of its common stock for $178,244 and 3,274,829 shares for $205,362, respectively. Of the shares purchased in fiscal 2016, 2,961,444 were acquired through an accelerated share repurchase program ("ASR") for a total cash investment of $166,392 at an average price of $56.19. At March 31, 2016 and 2015, the Company held 10,923,274 and 9,596,051 shares as treasury stock, respectively.
81
Treasury Stock Reissuance
On July 17, 2015, the Company settled the conversion premium on the Convertible Notes by issuing 1,889,431 shares from its treasury stock. The reissuance was recorded on a last-in, first-out method, and the difference between the repurchase cost and the fair value at reissuance was recorded as an adjustment to stockholders' equity.
Accumulated Other Comprehensive Income ("AOCI")
The components of AOCI, net of tax, are as follows:
Beginning Balance | Before Reclassifications | Amount Reclassified from AOCI | Ending Balance | |||||||||||||
March 31, 2016 | ||||||||||||||||
Pension funded status adjustment | $ | (23,719 | ) | $ | 298 | $ | 1,560 | $ | (21,861 | ) | ||||||
Net unrealized gain (loss) on derivative instruments | (95 | ) | (4,027 | ) | 4,510 | 388 | ||||||||||
Foreign currency translation adjustment | (85,161 | ) | 9,285 | — | (75,876 | ) | ||||||||||
Accumulated other comprehensive loss | $ | (108,975 | ) | $ | 5,556 | $ | 6,070 | $ | (97,349 | ) | ||||||
March 31, 2015 | ||||||||||||||||
Pension funded status adjustment | $ | (15,207 | ) | $ | (9,259 | ) | $ | 747 | $ | (23,719 | ) | |||||
Net unrealized gain (loss) on derivative instruments | (2,253 | ) | 289 | 1,869 | (95 | ) | ||||||||||
Foreign currency translation adjustment | 85,305 | (170,466 | ) | — | (85,161 | ) | ||||||||||
Accumulated other comprehensive loss | $ | 67,845 | $ | (179,436 | ) | $ | 2,616 | $ | (108,975 | ) | ||||||
March 31, 2014 | ||||||||||||||||
Pension funded status adjustment | $ | (13,169 | ) | $ | (2,662 | ) | $ | 624 | $ | (15,207 | ) | |||||
Net unrealized (loss) on derivative instruments | (832 | ) | (1,414 | ) | (7 | ) | (2,253 | ) | ||||||||
Foreign currency translation adjustment | 54,656 | 30,649 | — | 85,305 | ||||||||||||
Accumulated other comprehensive income | $ | 40,655 | $ | 26,573 | $ | 617 | $ | 67,845 | ||||||||
The following table presents reclassifications from AOCI during the twelve months ended March 31, 2016:
Components of AOCI | Amounts Reclassified from AOCI | Location of (Gain) Loss Recognized on Income Statement | ||||
Derivatives in Cash Flow Hedging Relationships: | ||||||
Net unrealized loss on derivative instruments | $ | 7,144 | Cost of goods sold | |||
Tax benefit | (2,634 | ) | ||||
Net unrealized loss on derivative instruments, net of tax | $ | 4,510 | ||||
Defined benefit pension costs: | ||||||
Prior service costs and deferrals | $ | 2,043 | Net periodic benefit cost, included in cost of goods sold, operating expenses - See Note 14 | |||
Tax benefit | (483 | ) | ||||
Net periodic benefit cost, net of tax | $ | 1,560 | ||||
82
The following table presents reclassifications from AOCI during the twelve months ended March 31, 2015:
Components of AOCI | Amounts Reclassified from AOCI | Location of (Gain) Loss Recognized on Income Statement | ||||
Derivatives in Cash Flow Hedging Relationships: | ||||||
Net unrealized loss on derivative instruments | $ | 2,961 | Cost of goods sold | |||
Tax benefit | (1,092 | ) | ||||
Net unrealized loss on derivative instruments, net of tax | $ | 1,869 | ||||
Defined benefit pension costs: | ||||||
Prior service costs and deferrals | $ | 1,007 | Net periodic benefit cost, included in cost of goods sold, operating expenses - See Note 14 | |||
Tax benefit | (260 | ) | ||||
Net periodic benefit cost, net of tax | $ | 747 | ||||
The following demonstrates the change in redeemable noncontrolling interests during the fiscal years ended March 31, 2014, 2015 and 2016, respectively:
Balance as of March 31, 2013 | $ | 11,095 | |
Net losses attributable to redeemable noncontrolling interests | (3,536 | ) | |
Redemption value adjustment | 4,974 | ||
Purchase of subsidiary shares from redeemable noncontrolling interests | (3,146 | ) | |
Foreign currency translation adjustment | (1,340 | ) | |
Balance as of March 31, 2014 | $ | 8,047 | |
Net earnings attributable to redeemable noncontrolling interests | 191 | ||
Redemption value adjustment | (292 | ) | |
Foreign currency translation adjustment | (990 | ) | |
Balance as of March 31, 2015 | $ | 6,956 | |
Net losses attributable to redeemable noncontrolling interests | (4,272 | ) | |
Redemption value adjustment | 4,272 | ||
Other | 109 | ||
Foreign currency translation adjustment | (1,068 | ) | |
Balance as of March 31, 2016 | $ | 5,997 | |
16. Stock-Based Compensation
As of March 31, 2016, the Company maintains the Second Amended and Restated EnerSys 2010 Equity Incentive Plan (“2010 EIP”). The 2010 EIP reserved 3,177,477 shares of common stock for the grant of various classes of nonqualified stock options, restricted stock units, market share units and other forms of equity-based compensation. Shares subject to any awards that expire without being exercised or that are forfeited or settled in cash shall again be available for future grants of awards under the 2010 EIP. Shares subject to awards that have been retained by the Company in payment or satisfaction of the exercise price and any applicable tax withholding obligation of an award shall not count against the limit described above.
As of March 31, 2016, 1,327,427 shares are available for future grants. The Company’s management equity incentive plans are intended to provide an incentive to employees and non-employee directors of the Company to remain in the service of the Company and to increase their interest in the success of the Company in order to promote the long-term interests of the Company. The plans seek to promote the highest level of performance by providing an economic interest in the long-term performance of the Company. The Company settles employee share-based compensation awards with newly issued shares.
83
Stock Options
During fiscal 2016, the Company granted to management and other key employees 127,966 non-qualified options that vest three years from the date of grant. Options granted prior to fiscal 2016 as well as the options granted in fiscal 2016 expire 10 years from the date of grant.
For fiscal 2016, 2015 and 2014, the Company recognized $1,419 with a related tax benefit of $477, $1,470 with a related tax benefit of $502 and $0, respectively, of stock-based compensation expense associated with stock option grants.
For purposes of determining the fair value of stock options granted in fiscal 2016 and fiscal 2015, the Company used a Black-Scholes Model with the following assumptions:
2016 | 2015 | |||||
Risk-free interest rate | 1.79 | % | 1.94 | % | ||
Dividend yield | 1.02 | % | 1.00 | % | ||
Expected life (years) | 6 | 6 | ||||
Volatility | 32.75 | % | 40.48 | % | ||
The following table summarizes the Company’s stock option activity in the years indicated:
Number of Options | Weighted- Average Remaining Contract Term (Years) | Weighted- Average Exercise Price | Aggregate Intrinsic Value | ||||||||||
Options outstanding as of March 31, 2013 | 77,986 | 2.5 | $ | 14.76 | $ | 2,404 | |||||||
Exercised | (11,813 | ) | 14.72 | 537 | |||||||||
Options outstanding as of March 31, 2014 | 66,173 | 1.4 | $ | 14.77 | $ | 3,608 | |||||||
Granted | 76,512 | 69.85 | — | ||||||||||
Exercised | (39,868 | ) | 14.50 | 1,819 | |||||||||
Options outstanding as of March 31, 2015 | 102,817 | 7 | $ | 55.86 | $ | 1,291 | |||||||
Granted | 127,966 | 68.40 | — | ||||||||||
Exercised | (11,986 | ) | 14.64 | 639 | |||||||||
Expired | (8,500 | ) | |||||||||||
Options outstanding as of March 31, 2016 | 210,297 | 8.5 | $ | 67.54 | $ | 218 | |||||||
Options exercisable as of March 31, 2016 | 31,322 | 6.8 | $ | 60.28 | $ | 218 | |||||||
Options vested and expected to vest as of March 31, 2016 | 207,673 | 8.5 | $ | 67.53 | $ | 218 | |||||||
The following table summarizes information regarding stock options outstanding as of March 31, 2016:
Options Outstanding | |||||||||
Range of Exercise Prices | Number of Options | Weighted- Average Remaining Contractual Life | Weighted- Average Exercise Price | ||||||
$15.01-$20.00 | 5,819 | 1.1 | $ | 18.33 | |||||
$20.01-$69.85 | 204,478 | 8.7 | $ | 68.94 | |||||
210,297 | 8.5 | $ | 67.54 | ||||||
Restricted Stock Units and Market Share Units
In fiscal 2016, the Company granted to non-employee directors 28,970 deferred restricted stock units at the fair value of $55.32 per restricted stock unit at the date of grant. In fiscal 2015, such grants amounted to 14,781 restricted stock units at the fair value of $61.16 per restricted stock unit at the date of grant and in fiscal 2014, amounted to 17,064 restricted stock units at the
84
fair value of $53.92 per restricted stock unit at the date of grant. The awards vest immediately upon the date of grant and the payment of shares of common stock under this grant are payable upon such director’s termination of service as a director.
In fiscal 2016, 2015 and 2014, the Company granted 565, 3,434 and 5,232 restricted stock units, respectively, at various fair values, under deferred compensation plans.
In fiscal 2016, the Company granted to management and other key employees 120,287 restricted stock units at the fair value of $68.40 per restricted stock unit and 212,635 performance market share units at a weighted average fair value of $59.94 per unit at the date of grant.
In fiscal 2015, the Company granted to management and other key employees 118,312 restricted stock units at the fair value of $69.83 per restricted stock unit and 152,300 performance market share units at a weighted average fair value of $70.42 per market share unit at the date of grant.
In fiscal 2014, the Company granted to management and other key employees 161,629 restricted stock units at the fair value of $50.70 per restricted stock unit and 189,438 market share units at a weighted average fair value of $65.03 per market share unit at the date of grant.
For purposes of determining the fair value of performance market share units granted in fiscal 2016 and fiscal 2015, the Company used a Monte Carlo Simulation with the following assumptions:
2016 | 2015 | |||||
Risk-free interest rate | 1.00 | % | 0.87 | % | ||
Dividend yield | — | % | — | % | ||
Expected life (years) | 3 | 3 | ||||
Volatility | 25.52 | % | 30.83 | % | ||
For purposes of determining the fair value of market share units granted in fiscal 2014, the Company used a binomial lattice model with the following assumptions:
2014 | ||
Risk-free interest rate | 0.52 | % |
Dividend yield | 1.00 | % |
Expected life (years) | 3 | |
Volatility | 33.89 | % |
A summary of the changes in restricted stock units and market share units awarded to employees and directors that were outstanding under the Company’s equity compensation plans during fiscal 2016 is presented below:
Restricted Stock Units (RSU) | Performance Market Share Units and Market Share Units (MSU) | |||||||||||||
Number of RSU | Weighted- Average Grant Date Fair Value | Number of MSU | Weighted- Average Grant Date Fair Value | |||||||||||
Non-vested awards as of March 31, 2015 | 502,223 | $ | 45.30 | 616,188 | $ | 55.75 | ||||||||
Granted | 149,822 | 66.66 | 212,635 | 59.94 | ||||||||||
Stock dividend | 5,984 | 51.72 | 6,603 | 64.45 | ||||||||||
Performance factor | — | — | 255,534 | 41.28 | ||||||||||
Vested | (137,636 | ) | 46.15 | (536,490 | ) | 41.55 | ||||||||
Canceled | (17,953 | ) | 63.28 | (5,524 | ) | 63.33 | ||||||||
Non-vested awards as of March 31, 2016 | 502,440 | $ | 51.26 | 548,946 | $ | 64.46 | ||||||||
85
The Company recognized stock-based compensation expense relating to restricted stock units and market share units of approximately $18,184, with a related tax benefit of $4,446 for fiscal 2016, $23,789, with a related tax benefit of $4,790 for fiscal 2015 and $16,742, with a related tax benefit of $2,843 for fiscal 2014.
All Award Plans
As of March 31, 2016, unrecognized compensation expense associated with the non-vested incentive awards outstanding was $24,219 and is expected to be recognized over a weighted-average period of 15 months.
17. Earnings Per Share
The following table sets forth the reconciliation from basic to diluted weighted-average number of common shares outstanding and the calculations of net earnings per common share attributable to EnerSys stockholders.
Fiscal year ended March 31, | ||||||||||||
2016 | 2015 | 2014 | ||||||||||
Net earnings attributable to EnerSys stockholders | $ | 136,150 | $ | 181,188 | $ | 150,328 | ||||||
Weighted-average number of common shares outstanding: | ||||||||||||
Basic | 44,276,713 | 45,606,317 | 47,473,690 | |||||||||
Dilutive effect of: | ||||||||||||
Common shares from exercise and lapse of equity awards, net of shares assumed reacquired | 644,036 | 879,406 | 1,034,505 | |||||||||
Convertible Notes | 553,381 | 1,567,006 | 1,279,960 | |||||||||
Diluted weighted-average number of common shares outstanding | 45,474,130 | 48,052,729 | 49,788,155 | |||||||||
Basic earnings per common share attributable to EnerSys stockholders | $ | 3.08 | $ | 3.97 | $ | 3.17 | ||||||
Diluted earnings per common share attributable to EnerSys stockholders | $ | 2.99 | $ | 3.77 | $ | 3.02 | ||||||
Anti-dilutive equity awards not included in diluted weighted-average common shares | — | — | — | |||||||||
On July 17, 2015, the Company paid $172,388, in aggregate, towards the principal balance of the Convertible Notes, including accreted interest, cash equivalent of fractional shares issued towards conversion premium and settled the conversion premium by issuing, in the aggregate, 1,889,431 shares of its common stock, which were included in the diluted weighted average shares outstanding for the period prior to the extinguishment.
During the second quarter of fiscal 2016, the Company entered into an ASR with a major financial institution to repurchase $120,000 to $180,000 of its common stock. The Company prepaid $180,000 and received an initial delivery of 2,000,000 shares with a fair market value of approximately $108,100. The ASR was accounted for as a treasury stock repurchase, reducing the weighted average number of basic and diluted shares outstanding by the 2,000,000 shares initially repurchased, and as a forward contract indexed to the Company's own common shares to reflect the future settlement provisions.
On January 19, 2016, the ASR was settled and the Company received an additional 961,444 shares. See Note 15 for more information.
18. Commitments, Contingencies and Litigation
Litigation and Other Legal Matters
In the ordinary course of business, the Company and its subsidiaries are routinely defendants in or parties to many pending and threatened legal actions and proceedings, including actions brought on behalf of various classes of claimants. These actions and proceedings are generally based on alleged violations of environmental, anti-competition, employment, contract and other laws. In some of these actions and proceedings, claims for substantial monetary damages are asserted against the Company and its subsidiaries. In the ordinary course of business, the Company and its subsidiaries are also subject to regulatory and governmental examinations, information gathering requests, inquiries, investigations, and threatened legal actions and proceedings. In connection with formal and informal inquiries by federal, state, local and foreign agencies, such subsidiaries
86
receive numerous requests, subpoenas and orders for documents, testimony and information in connection with various aspects of their activities.
European Competition Investigations
Certain of the Company’s European subsidiaries have received subpoenas and requests for documents and, in some cases, interviews from, and have had on-site inspections conducted by the competition authorities of Belgium, Germany and the Netherlands relating to conduct and anticompetitive practices of certain industrial battery participants. The Company is responding to inquiries related to these matters. The Company settled the Belgian regulatory proceeding in February 2016 by acknowledging certain anticompetitive practices and conduct and agreeing to pay a fine of $1,962, which was paid in March 2016 and as of March 31, 2016, the Company had a reserve balance of $2,038 in connection with these remaining investigations and other related legal charges. For the Dutch and German regulatory proceedings, the Company does not believe that such an estimate can be made at this time given the early stages of these proceedings. The foregoing estimate of losses is based upon currently available information for these proceedings. However, the precise scope, timing and time period at issue, as well as the final outcome of the investigations, remains uncertain. Accordingly, the Company’s estimate may change from time to time, and actual losses could vary.
Altergy
In the fourth quarter of fiscal 2014, the Company recorded a $58,184 legal proceedings charge in connection with an adverse arbitration result involving disputes between the Company's wholly-owned subsidiary, EnerSys Delaware Inc. (“EDI”), and Altergy Systems (“Altergy”). In accordance with the final term sheet, EDI paid Altergy $40,000 in settlement of this award. Altergy paid $2,000 to purchase EDI’s entire equity interest in Altergy. Since the full amount of the initial award of $58,184 was recorded in fiscal 2014, the Company reversed approximately $16,233, net of professional fees, from this previously recorded legal proceedings charge in fiscal 2015 and $799 in fiscal 2016. The Company also included the $2,000 received in exchange for its equity interest in Altergy in the Consolidated Statements of Income in Other (income) expense, net in fiscal 2015. The Company had previously written off the carrying value of the investment of $5,000 in fiscal 2014.
Environmental Issues
As a result of its operations, the Company is subject to various federal, state and local, as well as international environmental laws and regulations and is exposed to the costs and risks of registering, handling, processing, storing, transporting, and disposing of hazardous substances, especially lead and acid. The Company’s operations are also subject to federal, state, local and international occupational safety and health regulations, including laws and regulations relating to exposure to lead in the workplace.
The Company is responsible for certain cleanup obligations at the former Yuasa battery facility in Sumter, South Carolina that predates its ownership of this facility. This manufacturing facility was closed in 2001 and is separate from the Company’s current metal fabrication facility in Sumter. The Company has established a reserve for this facility. As of March 31, 2016 and 2015, the reserves related to this facility were $1,123 and $2,902, respectively. Based on current information, the Company’s management believes these reserves are adequate to satisfy the Company’s environmental liabilities at this facility.
Collective Bargaining
At March 31, 2015, the Company had approximately 9,400 employees. Of these employees, approximately 29% were covered by collective bargaining agreements. Employees covered by collective bargaining agreements that did not exceed twelve months were approximately 7% of the total workforce. The average term of these agreements is two years, with the longest term being three years. The Company considers its employee relations to be good and did not experience any significant labor unrest or disruption of production during fiscal 2016.
Lead Contracts
To stabilize its costs, the Company has entered into contracts with financial institutions to fix the price of lead. The vast majority of such contracts are for a period not extending beyond one year. Under these contracts, at March 31, 2016 and 2015, the Company has hedged the price to purchase approximately 27.4 million pounds and 91.6 million pounds of lead, respectively, for a total purchase price of $21,628 and $76,143, respectively.
87
Foreign Currency Forward Contracts
The Company quantifies and monitors its global foreign currency exposures. On a selective basis, the Company will enter into foreign currency forward and option contracts to reduce the volatility from currency movements that affect the Company. The vast majority of such contracts are for a period not extending beyond one year. The Company’s largest exposure is from the purchase and conversion of U.S. dollar based lead costs into local currencies in EMEA. Additionally, the Company has currency exposures from intercompany financing and intercompany and third-party trade transactions. To hedge these exposures, the Company has entered into a total of $29,362 and $102,124, respectively, of foreign currency forward contracts with financial institutions as of March 31, 2016 and 2015, respectively.
Other
The Company has various purchase and capital commitments incident to the ordinary conduct of business. In the aggregate, such commitments are not at prices in excess of current market.
19. Restructuring and Other Exit Charges
Restructuring Plans
During fiscal 2012, the Company announced restructuring plans related to its operations in EMEA, primarily consisting of the transfer of manufacturing of select products between certain of its manufacturing operations and restructuring of its selling, general and administrative operations, which resulted in the reduction of approximately 85 employees upon completion at the end of the second quarter of fiscal 2014. The total charges for these actions amounted to $3,545, primarily from cash expenses for employee severance-related payments. The Company recorded restructuring charges of $3,070 in fiscal 2012 and $475 of charges in fiscal 2013 with no additional charges in fiscal 2014. The Company incurred $2,433 of costs against the accrual during fiscal 2012, and $913 of costs incurred in fiscal 2013 with $185 of additional incurred against the accrual during fiscal 2014. This plan was completed as of September 29, 2013.
During fiscal 2013, the Company announced a restructuring related to improving the efficiency of its manufacturing operations in EMEA. This program was completed during the third quarter of fiscal 2016. Total charges for this program were $6,895, primarily for cash expenses of $5,496 for employee severance-related payments of approximately 140 employees and non-cash expenses of $1,399 associated with the write-off of certain fixed assets and inventory. The Company incurred $5,207 of costs against the accrual through fiscal 2015, and incurred $271 in costs against the accrual during fiscal 2016.
During fiscal 2014, the Company announced further restructuring programs to improve the efficiency of its manufacturing, sales and engineering operations in EMEA including the restructuring of its manufacturing operations in Bulgaria. The restructuring of the Bulgaria operations was announced during the third quarter of fiscal 2014 and consisted of the transfer of motive power and a portion of reserve power battery manufacturing to the Company's facilities in Western Europe. This program was completed during the fourth quarter of fiscal 2016. Total charges for this program were $22,930 primarily for cash expenses of $11,996 for employee severance-related payments of approximately 500 employees and other charges and non-cash expenses of $10,934 associated with the write-off of certain fixed assets and inventory. The Company recorded restructuring charges of $22,115 through fiscal 2015, consisting of non-cash charges of $10,934 and cash charges of $11,181 and recorded an additional $1,229 in cash charges and a favorable accrual adjustment of $414 during fiscal 2016. The Company incurred $9,737 of costs against the accrual through fiscal 2015, and incurred $2,068 in costs against the accrual during fiscal 2016.
During the third quarter of fiscal 2015, the Company announced a restructuring related to its manufacturing facility located in Jiangdu, the People’s Republic of China ("PRC"), pursuant to which the Company completed the transfer of the manufacturing at that location to its other facilities in PRC, as part of the closure of the Jiangdu facility in the first quarter of fiscal 2016. This program was completed during the fourth quarter of fiscal 2016. Total charges for this program were $5,291 primarily for cash expenses of $4,893 for employee severance-related payments of approximately 300 employees and other charges and non-cash expenses of $398. The Company recorded cash restructuring charges of $3,870 during fiscal 2015 and recorded an additional $1,023 in cash charges and $398 in non-cash charges during fiscal 2016. The Company incurred $1,874 of costs against the accrual through fiscal 2015, and incurred $2,970 in costs against the accrual during fiscal 2016.
During fiscal 2015, the Company announced a restructuring primarily related to a portion of its sales and engineering organizations in Europe to improve efficiencies. This program was completed during the fourth quarter of fiscal 2016. Total charges for this program were $804 for cash expenses for employee severance-related payments of approximately 15 employees. The Company recorded cash restructuring charges of $450 during fiscal 2015 and recorded an additional $354
88
during fiscal 2016. The Company incurred $193 of costs against the accrual through fiscal 2015, and incurred $698 in costs against the accrual during fiscal 2016.
During the first quarter of fiscal 2016, the Company completed a restructuring related to a reduction of two executives associated with one of Americas’ recent acquisitions to improve efficiencies. The Company recorded total severance-related charges of $570, all of which was paid during the first quarter of fiscal 2016, primarily per the terms of a pre-existing employee agreement.
During the second quarter of fiscal 2016, the Company announced a restructuring to improve efficiencies primarily related to its motive power assembly and distribution center in Italy and its sales and administration organizations in EMEA. In addition, during the third quarter of fiscal 2016, the Company announced a further restructuring related to its manufacturing operations in Europe. The Company estimates that the total charges for these actions will amount to approximately $6,800, primarily from cash charges for employee severance-related payments and other charges. The Company estimates that these actions will result in the reduction of approximately 120 employees upon completion. During 2016, the Company recorded restructuring charges of $5,232 and incurred $2,993 in costs against the accrual. As of March 31, 2016, the reserve balance associated with these actions is $2,238. The Company expects to be committed to an additional $1,600 of restructuring charges related to these actions during fiscal 2016, and expects to complete the program during fiscal 2017.
During the second quarter of fiscal 2016, the Company announced a restructuring related to improving the efficiency of its manufacturing operations in the Americas. The program consists of the announced closing of its Cleveland, Ohio charger manufacturing facility which is expected to be completed during the second quarter of fiscal 2017, with the transfer of production to other Americas manufacturing facilities. The Company estimates that the total charges for all actions associated with this program will amount to approximately $2,100, primarily from cash charges for employee severance-related payments and other charges of $1,500, along with a pension curtailment charge of $313 and non-cash charges related to the accelerated depreciation of fixed assets of $300. The Company estimates that these actions will result in the reduction of approximately 100 employees at its Cleveland facility. During fiscal 2016, the Company recorded restructuring charges of $1,488 including a pension curtailment charge of $313 and non-cash charges of $305 related to accelerated depreciation of fixed assets and incurred $119 of cost against the accrual. As of March 31, 2016, the reserve balance associated with these actions is $751. The Company expects to be committed to an additional $600 of restructuring charges related to these actions during fiscal 2017 when it expects to complete this program.
A roll-forward of the restructuring reserve is as follows:
Employee Severance | Other | Total | ||||||||||
Balance at March 31, 2013 | $ | 1,738 | $ | 221 | $ | 1,959 | ||||||
Accrued | 10,285 | 1,378 | 11,663 | |||||||||
Costs incurred | (4,966 | ) | (525 | ) | (5,491 | ) | ||||||
Foreign currency impact and other | 255 | 28 | 283 | |||||||||
Balance at March 31, 2014 | $ | 7,312 | $ | 1,102 | $ | 8,414 | ||||||
Accrued | 6,140 | 843 | 6,983 | |||||||||
Costs incurred | (10,378 | ) | (803 | ) | (11,181 | ) | ||||||
Foreign currency impact and other | (108 | ) | (288 | ) | (396 | ) | ||||||
Balance at March 31, 2015 | $ | 2,966 | $ | 854 | $ | 3,820 | ||||||
Accrued | 8,859 | 419 | 9,278 | |||||||||
Accrual adjustments | — | (414 | ) | (414 | ) | |||||||
Costs incurred | (8,817 | ) | (872 | ) | (9,689 | ) | ||||||
Foreign currency impact and other | (44 | ) | 38 | (6 | ) | |||||||
Balance at March 31, 2016 | $ | 2,964 | $ | 25 | $ | 2,989 | ||||||
Other Exit Charges
During fiscal 2016, the Company recorded exit charges of $3,098 related to certain operations in Europe.
89
20. Warranty
The Company provides for estimated product warranty expenses when the related products are sold, with related liabilities included within accrued expenses and other liabilities. Because warranty estimates are forecasts that are based on the best available information, primarily historical claims experience, claims costs may differ from amounts provided. An analysis of changes in the liability for product warranties is as follows:
Balance at March 31, 2013 | $ | 42,591 | |
Current year provisions | 16,098 | ||
Costs incurred | (22,862 | ) | |
Fair value of warranty reserves of acquired businesses | 2,817 | ||
Foreign currency translation adjustment | 1,782 | ||
Balance at March 31, 2014 | 40,426 | ||
Current year provisions | 18,413 | ||
Costs incurred | (16,015 | ) | |
Foreign currency translation adjustment | (3,014 | ) | |
Balance at March 31, 2015 | 39,810 | ||
Current year provisions | 19,735 | ||
Costs incurred | (13,998 | ) | |
Foreign currency translation adjustment | 2,875 | ||
Balance at March 31, 2016 | $ | 48,422 | |
21. Other (Income) Expense, Net
Other (income) expense, net consists of the following:
Fiscal year ended March 31, | ||||||||||||
2016 | 2015 | 2014 | ||||||||||
Foreign exchange transaction (gains) losses | $ | 5,425 | $ | (5,011 | ) | $ | 5,845 | |||||
(Gain) on disposition of equity interest in Altergy / write-off of investment in Altergy | — | (2,000 | ) | 5,000 | ||||||||
Other | 294 | 1,409 | 2,813 | |||||||||
Total | $ | 5,719 | $ | (5,602 | ) | $ | 13,658 | |||||
90
22. Business Segments
Summarized financial information related to the Company’s reportable segments at March 31, 2016, 2015 and 2014 and for each of the fiscal years then ended is shown below.
Fiscal year ended March 31, | ||||||||||||
2016 | 2015 | 2014 | ||||||||||
Net sales by segment to unaffiliated customers | ||||||||||||
Americas | $ | 1,276,027 | $ | 1,322,337 | $ | 1,267,598 | ||||||
EMEA | 787,402 | 948,845 | 966,152 | |||||||||
Asia | 252,820 | 234,330 | 240,683 | |||||||||
Total net sales | $ | 2,316,249 | $ | 2,505,512 | $ | 2,474,433 | ||||||
Net sales by product line | ||||||||||||
Reserve power | $ | 1,109,154 | $ | 1,252,637 | $ | 1,234,538 | ||||||
Motive power | 1,207,095 | 1,252,875 | 1,239,895 | |||||||||
Total net sales | $ | 2,316,249 | $ | 2,505,512 | $ | 2,474,433 | ||||||
Intersegment sales | ||||||||||||
Americas | $ | 32,984 | $ | 29,987 | $ | 33,951 | ||||||
EMEA | 78,812 | 69,396 | 77,549 | |||||||||
Asia | 23,590 | 33,786 | 29,428 | |||||||||
Total intersegment sales(1) | $ | 135,386 | $ | 133,169 | $ | 140,928 | ||||||
Operating earnings | ||||||||||||
Americas | $ | 182,774 | $ | 162,741 | $ | 179,080 | ||||||
EMEA | 75,666 | 109,861 | 84,902 | |||||||||
Asia | 570 | 9,928 | 21,217 | |||||||||
Restructuring charges—Americas | (2,058 | ) | — | — | ||||||||
Restructuring and other exit charges—EMEA | (9,501 | ) | (7,567 | ) | (27,078 | ) | ||||||
Restructuring charges—Asia | (1,419 | ) | (3,869 | ) | (248 | ) | ||||||
Impairment of goodwill and indefinite-lived intangibles—Americas | (32,999 | ) | (23,196 | ) | — | |||||||
Impairment of goodwill and fixed assets—EMEA | (3,253 | ) | (750 | ) | — | |||||||
Goodwill impairment charge—Asia | — | — | (5,179 | ) | ||||||||
Legal proceedings (charge) / reversal of legal accrual, net of fees—Americas | 799 | 16,233 | (58,184 | ) | ||||||||
Legal proceedings charge—EMEA | (4,000 | ) | — | — | ||||||||
Gain on sale of facility—Asia | 3,420 | — | — | |||||||||
Total operating earnings(2) | $ | 209,999 | $ | 263,381 | $ | 194,510 | ||||||
Property, plant and equipment, net | ||||||||||||
Americas | $ | 177,720 | $ | 168,274 | $ | 155,988 | ||||||
EMEA | 112,839 | 114,681 | 145,308 | |||||||||
Asia | 66,850 | 73,899 | 68,870 | |||||||||
Total | $ | 357,409 | $ | 356,854 | $ | 370,166 | ||||||
Capital Expenditures | ||||||||||||
Americas | $ | 39,127 | $ | 34,768 | $ | 24,641 | ||||||
EMEA | 12,625 | 16,215 | 14,871 | |||||||||
Asia | 4,128 | 12,642 | 22,483 | |||||||||
Total | $ | 55,880 | $ | 63,625 | $ | 61,995 | ||||||
Depreciation and Amortization | ||||||||||||
Americas | $ | 31,070 | $ | 30,724 | $ | 26,596 | ||||||
EMEA | 16,337 | 19,664 | 22,708 | |||||||||
Asia | 8,587 | 6,652 | 4,668 | |||||||||
Total | $ | 55,994 | $ | 57,040 | $ | 53,972 | ||||||
(1) | Intersegment sales are presented on a cost-plus basis which takes into consideration the effect of transfer prices between legal entities. |
(2) | The Company does not allocate interest expense or other (income) expense, net to the reportable segments. |
91
The Company markets its products and services in over 100 countries. Sales are attributed to countries based on the location of sales order approval and acceptance. Sales to customers in the United States were 51.0%, 46.0% and 44.0% for fiscal years ended March 31, 2016, 2015 and 2014, respectively. Property, plant and equipment, net, attributable to the United States as of March 31, 2016 and 2015, were $149,348 and $140,514, respectively. No single country, outside the United States, accounted for more than 10% of the consolidated net sales or net property, plant and equipment and, therefore, was deemed not material for separate disclosure.
23. Quarterly Financial Data (Unaudited)
The Company reports interim financial information for 13-week periods, except for the first quarter, which always begins on April 1, and the fourth quarter, which always ends on March 31. The four quarters in fiscal 2016 ended on June 28, 2015, September 27, 2015, December 27, 2015, and March 31, 2016, respectively. The four quarters in fiscal 2015 ended on June 29, 2014, September 28, 2014, December 28, 2014, and March 31, 2015, respectively.
1st Quarter | 2nd Quarter | 3rd Quarter | 4th Quarter | Fiscal Year | ||||||||||||||||
Fiscal year ended March 31, 2016 | ||||||||||||||||||||
Net sales | $ | 562,068 | $ | 569,134 | $ | 573,573 | $ | 611,474 | $ | 2,316,249 | ||||||||||
Gross profit | 150,415 | 154,939 | 145,882 | 160,541 | 611,777 | |||||||||||||||
Operating earnings(1)(3)(5)(6) | 69,037 | 59,548 | 55,461 | 25,953 | 209,999 | |||||||||||||||
Net earnings | 47,934 | 39,768 | 38,214 | 5,908 | 131,824 | |||||||||||||||
Net earnings attributable to EnerSys stockholders | 48,387 | 40,025 | 38,478 | 9,260 | 136,150 | |||||||||||||||
Net earnings per common share attributable to EnerSys stockholders—basic | $ | 1.09 | $ | 0.89 | $ | 0.87 | $ | 0.21 | $ | 3.08 | ||||||||||
Net earnings per common share attributable to EnerSys stockholders—diluted | $ | 1.03 | $ | 0.87 | $ | 0.86 | $ | 0.21 | $ | 2.99 | ||||||||||
Fiscal year ended March 31, 2015 | ||||||||||||||||||||
Net sales | $ | 634,110 | $ | 629,927 | $ | 611,578 | $ | 629,897 | $ | 2,505,512 | ||||||||||
Gross profit | 162,577 | 162,540 | 157,265 | 158,529 | 640,911 | |||||||||||||||
Operating earnings(2)(4)(6) | 71,689 | 80,053 | 68,683 | 42,956 | 263,381 | |||||||||||||||
Net earnings | 49,115 | 56,550 | 49,331 | 26,529 | 181,525 | |||||||||||||||
Net earnings attributable to EnerSys stockholders | 49,169 | 56,316 | 49,252 | 26,451 | 181,188 | |||||||||||||||
Net earnings per common share attributable to EnerSys stockholders—basic | $ | 1.05 | $ | 1.22 | $ | 1.09 | $ | 0.60 | $ | 3.97 | ||||||||||
Net earnings per common share attributable to EnerSys stockholders—diluted | $ | 0.99 | $ | 1.16 | $ | 1.04 | $ | 0.57 | $ | 3.77 | ||||||||||
(1) | Included in Operating earnings were restructuring and other exit charges of $1,218, $2,629, $3,204 and $5,927 for the first, second, third and fourth quarters of fiscal 2016, respectively. |
(2) | Included in Operating earnings were restructuring and other exit charges of $1,829, $1,810, $2,437 and $5,360 for the first, second, third and fourth quarters of fiscal 2015, respectively. |
(3) | Included in Operating earnings for the fourth quarter of fiscal 2016 was a charge relating to the impairment of goodwill, indefinite-lived intangibles and fixed assets for $36,252. |
(4) | Included in Operating earnings for the fourth quarter of fiscal 2015 was a charge relating to the impairment of goodwill and other indefinite-lived intangibles for $23,946. |
(5) | Included in Operating earnings for the first quarter of fiscal 2016 was a gain on sale of facility of $4,348 and in the fourth quarter of fiscal 2016, charges relating to the same of $928. |
(6) | Included in Operating earnings for the second quarter of fiscal 2016 was a legal proceedings charge of $3,201. During the second quarter of fiscal 2015, the Company reversed $16,233, net of professional fees upon final settlement of a legal matter. |
92
24. Subsequent Events
On May 5, 2016, the Company announced the payment of a quarterly cash dividend of $0.175 per share of common stock to be paid on June 24, 2016, to stockholders of record as of June 10, 2016.
On May 16, 2016, under the 2010 EIP, the Company granted 242,068 stock options, which vest over three years, 229,638 restricted stock units, which vest 25% each year over four-years from the date of grant, and 83,720 market condition-based share units, which vest three years from the date of grant.
On April 16, 2016, the Company announced that it had completed the acquisition of certain assets of Enser Corporation, headquartered in Pinellas Park, Florida. Enser is a leading manufacturer of molten salt “thermal” batteries used in powering a multitude of electronics, guidance and other electrical loads on advanced weapon systems.
93
SCHEDULE II
EnerSys
Valuation and Qualifying Accounts
(In Thousands)
Balance at Beginning of Period | Additions Charged to Expense | Charge-Offs | Purchase Accounting Adjustments | Other(1) | Balance at End of Period | |||||||||||||||||||
Allowance for doubtful accounts: | ||||||||||||||||||||||||
Fiscal year ended March 31, 2014 | $ | 9,292 | $ | 907 | $ | (963 | ) | $ | — | $ | 210 | $ | 9,446 | |||||||||||
Fiscal year ended March 31, 2015 | 9,446 | 1,125 | (2,315 | ) | — | (694 | ) | 7,562 | ||||||||||||||||
Fiscal year ended March 31, 2016 | 7,562 | 4,749 | (649 | ) | — | (269 | ) | 11,393 | ||||||||||||||||
Allowance for inventory valuation: | ||||||||||||||||||||||||
Fiscal year ended March 31, 2014 | $ | 17,372 | $ | 5,944 | $ | (3,283 | ) | $ | — | $ | 283 | $ | 20,316 | |||||||||||
Fiscal year ended March 31, 2015 | 20,316 | 9,306 | (7,707 | ) | — | (1,673 | ) | 20,242 | ||||||||||||||||
Fiscal year ended March 31, 2016 | 20,242 | 10,052 | (6,534 | ) | — | (190 | ) | 23,570 | ||||||||||||||||
Deferred tax asset—valuation allowance: (2) | ||||||||||||||||||||||||
Fiscal year ended March 31, 2014 | $ | 54,542 | $ | 6,951 | $ | (27,269 | ) | $ | 327 | $ | (10,968 | ) | $ | 23,583 | ||||||||||
Fiscal year ended March 31, 2015 | 23,583 | 4,222 | (3,796 | ) | (327 | ) | (3,619 | ) | 20,063 | |||||||||||||||
Fiscal year ended March 31, 2016 | 20,063 | 6,670 | (361 | ) | — | (956 | ) | 25,416 | ||||||||||||||||
(1) | Primarily the impact of currency changes. |
(2) | In fiscal 2016, "other" was primarily the impact of currency changes. In fiscal 2015 and 2014, "Other" also included the reversal of deferred tax accounts and related valuation allowance upon the sale of certain foreign subsidiaries of the Company. In fiscal 2014, there was also an adjustment relating to the net operating losses of a foreign subsidiary of the Company and the related valuation allowance. |
94
ITEM 9. | CHANGES IN AND DISAGREEMENTS WITH ACCOUNTANTS ON ACCOUNTING AND FINANCIAL DISCLOSURE |
None.
ITEM 9A. | CONTROLS AND PROCEDURES |
(a) Disclosure Controls and Procedures. The Company’s management, with the participation of the Company’s Chief Executive Officer and Chief Financial Officer, has evaluated the effectiveness of the Company’s disclosure controls and procedures (as such term is defined in Rules 13a-15(e) and 15d-15(e) under the Securities Exchange Act of 1934, as amended (the “Exchange Act”)) as of the end of the period covered by this report. Based on such evaluation, the Company’s Chief Executive Officer and Chief Financial Officer have concluded that, as of the end of such period, the Company’s disclosure controls and procedures are effective.
(b) Internal Control Over Financial Reporting. There have not been any changes in the Company’s internal control over financial reporting (as such term is defined in Rules 13a-15(f) and 15d-15(f) under the Exchange Act) during the fourth quarter of the fiscal year to which this report relates that have materially affected, or are reasonably likely to materially affect, the Company’s internal control over financial reporting.
The report called for by Item 308(a) of Regulation S-K is included herein as “Management Report on Internal Control Over Financial Reporting.”
Management Report on Internal Control over Financial Reporting
Our management is responsible for establishing and maintaining adequate internal control over financial reporting. With the participation of the Chief Executive Officer and Chief Financial Officer, our management conducted an evaluation of the effectiveness of our internal control over financial reporting based on the framework and criteria established in Internal Control—Integrated Framework, issued by the Committee of Sponsoring Organizations of the Treadway Commission (2013 framework).
Based on this evaluation, our management has concluded that our internal control over financial reporting was effective as of March 31, 2016.
The attestation report called for by Item 308(b) of Registration S-K is included herein as “Report of Independent Registered Public Accounting Firm,” which appears in Item 8 in this Annual Report on Form 10-K.
/s/ David M. Shaffer | /s/ Michael J. Schmidtlein | |
David M. Shaffer Chief Executive Officer | Michael J. Schmidtlein Chief Financial Officer | |
ITEM 9B. | OTHER INFORMATION |
Not applicable.
95
PART III
ITEM 10. | DIRECTORS, EXECUTIVE OFFICERS AND CORPORATE GOVERNANCE |
The information required by this item is incorporated by reference from the sections entitled “Board of Directors,” “Executive Officers,” “Section 16(a) Beneficial Ownership Reporting Compliance,” “Corporate Governance—Independence of Directors,” “Corporate Governance—Process for Selection of Director Nominee Candidates,” “Audit Committee Report,” and “Certain Relationships and Related Transactions—Employment of Related Parties” of the Company’s definitive proxy statement for its 2014 Annual Meeting of Stockholders (the “Proxy Statement”) to be filed no later than 120 days after the fiscal year end.
We have adopted a Code of Business Conduct and Ethics that applies to all of our officers, directors and employees (including our Chief Executive Officer, Chief Financial Officer, and Corporate Controller) and have posted the Code on our website at www.enersys.com, and a copy is available in print to any stockholder who requires a copy. If we waive any provision of the Code applicable to any director, our Chief Executive Officer, Chief Financial Officer, and Corporate Controller, such waiver will be promptly disclosed to the Company’s stockholders through the Company’s website.
ITEM 11. | EXECUTIVE COMPENSATION |
The information required by this item is incorporated by reference from the sections entitled “Corporate Governance—Compensation Committee” and “Executive Compensation” of the Proxy Statement”) to be filed no later than 120 days after the fiscal year end.
ITEM 12. | SECURITY OWNERSHIP OF CERTAIN BENEFICIAL OWNERS AND MANAGEMENT RELATED STOCKHOLDER MATTERS |
The information required by this item is incorporated by reference from the section entitled “Security Ownership of Certain Beneficial Owners and Management” of the Proxy Statement to be filed no later than 120 days after the fiscal year end.
Equity Compensation Plan Information | ||||||||||||||
Plan Category | Number of securities to be issued upon exercise of outstanding options, warrants and rights (a) | Weighted-average exercise price of outstanding options, warrants and rights (b) | Number of securities remaining available for future issuance under equity compensation plans (excluding securities reflected in column (a)) (c) | |||||||||||
Equity compensation plans approved by security holders | 1,517,217 | (1) | $ | 67.53 | (2) | 1,327,427 | ||||||||
Equity compensation plans not approved by security holders | — | — | — | |||||||||||
Total | 1,517,217 | $ | 67.53 | 1,327,427 | ||||||||||
(1) | Assumes a 200% payout of market share units and performance market share units. |
(2) | Awards of restricted stock units, market share units, performance market share units and deferred stock units and stock units held in both the EnerSys Voluntary Deferred Compensation Plan for Non-Employee Directors and the EnerSys Voluntary Deferred Compensation Plan for Executives were not included in calculating the weighted-average exercise price as they will be settled in shares of common stock for no consideration. |
ITEM 13. | CERTAIN RELATIONSHIPS AND RELATED TRANSACTIONS, AND DIRECTOR INDEPENDENCE |
The information required by this item is incorporated by reference from the sections entitled “Corporate Governance,” and “Certain Relationships and Related Transactions” of the Proxy Statement to be filed no later than 120 days after the fiscal year end.
96
ITEM 14. | PRINCIPAL ACCOUNTING FEES AND SERVICES |
The information required by this item is incorporated by reference from the section entitled “Audit Committee Report” of the Proxy Statement to be filed no later than 120 days after the fiscal year end.
97
PART IV
ITEM 15. | EXHIBITS, FINANCIAL STATEMENT SCHEDULES |
(a) The following documents are filed as part of this Report:
(1) Consolidated Financial Statements
See Index to Consolidated Financial Statements.
(2) Financial Statement Schedule
The following consolidated financial statement schedule should be read in conjunction with the consolidated financial statements (see Item 8. “Financial Statements and Supplementary Data:”): Schedule II—Valuation and Qualifying Accounts.
All other schedules are omitted because they are not applicable or the required information is contained in the consolidated financial statements or notes thereto.
(b) The following documents are filed herewith as exhibits:
Exhibit Number | Description of Exhibit | |
3.1 | Fifth Restated Certificate of Incorporation (incorporated by reference to Exhibit 3.1 to Amendment No. 3 to EnerSys’ Registration Statement on Form S-1 (File No. 001-32253) filed on February 6, 2013). | |
3.2 | Second Amended and Restated Bylaws (incorporated by reference to Exhibits 3.3 to EnerSys’ Quarterly Report on Form 10-Q for the period ended September 30, 2014 (File No. 001-32253) filed on November 5, 2014). | |
4.1 | Indenture, dated as of May 28, 2008, between EnerSys and The Bank of New York, as trustee (incorporated by reference to Exhibit 4.1 to EnerSys’ Current Report on Form 8-K (File No. 001-32253) filed on May 28, 2008). | |
4.2 | Indenture, dated as of April 23, 2015, among EnerSys, the Guarantors party thereto and MUFG Union Bank, N.A., as Trustee (incorporated by reference to Exhibit 4.1 to EnerSys’ Current Report on Form 8-K (File No. 00-32253) filed on April 23, 2015). | |
4.3 | First Supplemental Indenture, dated as of April 23, 2015, among EnerSys, the Guarantors party thereto and MUFG Union Bank, N.A., as Trustee (incorporated by reference to Exhibit 4.2 to EnerSys’ Current Report on Form 8-K (File No. 00-32253) filed on April 23, 2015). | |
4.4 | Form of 5.00% Senior Note due 2023 (incorporated by reference to Exhibit 4.2 to EnerSys’ Current Report on Form 8-K (File No. 00-32253) filed on April 23, 2015). | |
10.1 | Amended and Restated Credit Agreement, dated as of July 8, 2014, among EnerSys, Bank of America, N.A., as Administrative Agent, Wells Fargo Bank, National Association, as Syndication Agent, RB International Finance (USA) LLC and PNC Bank, National Association, as Co-Documentation Agents and Co-Managers and the various lending institutions party thereto (incorporated by reference to Annex A to Exhibit 10.1 to EnerSys’ Current Report on Form 8-K (File No. 001-32253) filed on July 8, 2014). | |
10.2 | Incremental Commitment Agreement, dated July 8, 2014, among EnerSys and certain financial institutions (incorporated by reference to Exhibit 10.2 to EnerSys’ Current Report on Form 8-K (File No. 001-32253) filed on July 8, 2014). | |
10.3 | Stock Subscription Agreement, dated March 22, 2002, among EnerSys Holdings Inc., Morgan Stanley Dean Witter Capital Partners IV, L.P., Morgan Stanley Dean Witter Capital Investors IV, L.P., MSDW IV 892 Investors, L.P., Morgan Stanley Global Emerging Markets Private Investment Fund, L.P. and Morgan Stanley Global Emerging Markets Private Investors, L.P. (incorporated by reference to Exhibit 10.27 to Amendment No. 3 to EnerSys’ Registration Statement on Form S-1 (File No. 333-115553) filed on July 13, 2004). | |
98
Exhibit Number | Description of Exhibit | |
10.4 | Employment Agreement, dated November 9, 2000, between Yuasa, Inc. and John D. Craig and letter of amendment thereto (incorporated by reference to Exhibit 10.2 to EnerSys’ Registration Statement on Form S-1 (File No. 333-115553) filed on May 17, 2004). | |
10.5 | Side Letter to Employment Agreement, dated October 30, 2014, between EnerSys and John D. Craig (incorporated by reference to Exhibit 10.4 to EnerSys' Quarterly Report on Form 10-Q for the period ended September 28, 2014 (File No. 001-32253) filed on November 5, 2014). | |
10.6 | Consulting Agreement with Richard W. Zuidema (incorporated by reference to Exhibit 10.3 to EnerSys Quarterly Report on Form 10-Q for the period ended September 27, 2015 (File No. 001-32253) filed on November 2, 2015). | |
10.7 | Form of Severance Agreement, (incorporated by reference to Exhibit 10.37 to EnerSys’ Annual Report on Form 10-K (File No. 001-32253) filed on May 28, 2013). | |
10.8 | Employment Offer Letter, dated October 20, 2014, of EnerSys Delaware Inc. to David M. Shaffer (incorporated by reference to Exhibit 10.5 to EnerSys' Quarterly Report on Form 10-Q for the period ended September 28, 2014 (File No. 001-32253) filed on November 5, 2014). | |
10.9 | EnerSys 2013 Management Incentive Plan (incorporated by reference to Appendix A to EnerSys’ Definitive Proxy Statement on Schedule 14A (File No. 001-32253) filed on June 27, 2013). | |
10.10 | Form of Stock Option Agreement (six-month vesting) (incorporated by reference to Exhibit 10.31 to EnerSys’ Annual Report on Form 10-K for the year ended March 31, 2008 (File No. 001-32253) filed on June 1, 2009). | |
10.11 | Form of 2004 Equity Incentive Plan (incorporated by reference to Exhibit 10.24 to Amendment No. 3 to EnerSys’ Registration Statement on Form S-1 (File No. 333-115553) filed on July 13, 2004). | |
10.12 | EnerSys Amended and Restated 2006 Equity Incentive Plan (incorporated by reference to Exhibit 10.27 to EnerSys Annual Report on Form 10-K (File No. 001-32253) filed on June 11, 2008). | |
10.13 | EnerSys Management Incentive Plan for fiscal year 2008 (incorporated by reference to Exhibit 10.1 to EnerSys’ Current Report on Form 8-K (File No. 001-32253) filed on April 2, 2007). | |
10.14 | Second Amended and Restated EnerSys 2010 Equity Incentive Plan (filed herewith). | |
10.15 | EnerSys Voluntary Deferred Compensation Plan for Executives as amended August 5, 2010, and May 26, 2011 (incorporated by reference to Exhibit 10.23 to EnerSys’ Annual Report on Form 10-K (File No. 001-32253) filed on May 31, 2011). | |
10.16 | Form of Employee Stock Purchase Plan (incorporated by reference to Exhibit 10.26 to Amendment No. 3 to EnerSys’ Registration Statement on Form S-1 (File No. 333-115553) filed on July 13, 2004). | |
10.17 | Form of Restricted Stock Agreement (incorporated by reference to Exhibit 10.1 to EnerSys’ Current Report on Form 8-K (File No. 001-32253) filed on December 9, 2005). | |
10.18 | Form of Stock Option Agreement (four-year vesting) (incorporated by reference to Exhibit 10.1 to EnerSys’ Current Report on Form 8-K (File No. 001-32253) filed on May 23, 2007). | |
10.19 | Form of Stock Option Agreement (three-year vesting) (incorporated by reference to Exhibit 10.2 to EnerSys’ Current Report on Form 8-K (File No. 001-32253) filed on May 6, 2008). | |
10.20 | Form of Restricted Stock Unit Agreement (incorporated by reference to Exhibit 10.1 to EnerSys’ Current Report on Form 8-K (File No. 001-32253) filed on May 23, 2007). | |
10.21 | Form of Restricted Stock Unit Agreement – Non-Employee Directors (incorporated by reference to Exhibit 10.29 to EnerSys’ Annual Report on Form 10-K (File No. 001-32253) filed on June 1, 2009). | |
99
Exhibit Number | Description of Exhibit | |
10.22 | Form of Restricted Stock Unit Agreement – Employees – 2006 Equity Incentive Plan (incorporated by reference to Exhibit 10.30 to EnerSys’ Annual Report on Form 10-K (File No. 001-32253) filed on June 1, 2010). | |
10.23 | Form of Market Share Restricted Stock Unit Agreement – Employees (incorporated by reference to Exhibit 10.31 to EnerSys’ Annual Report on Form 10-K (File No. 001-32253) filed on June 1, 2010). | |
10.24 | Form of Market Share Restricted Stock Unit Agreement – Employees – 2010 Equity Incentive Plan (incorporated by reference to Exhibit 10.32 to EnerSys’ Annual Report on Form 10-K (File No. 001-32253) filed on May 31, 2011). | |
10.25 | Form of Restricted Stock Unit Agreement – Employees and Senior Executives – 2010 Equity Incentive Plan (incorporated by reference to Exhibit 10.33 to EnerSys’ Annual Report on Form 10-K (File No. 001-32253) filed on May 31, 2011). | |
10.26 | Form of Restricted Stock Unit Agreement – Employees – 2010 Equity Incentive Plan (incorporated by reference to Exhibit 10.31 to EnerSys’ Annual Report on Form 10-K (File No. 001-32253) filed on May 31, 2011). | |
10.27 | Form of Deferred Stock Unit Agreement – Non-Employee Directors – 2010 Equity Incentive Plan (incorporated by reference to Exhibit 10.35 to EnerSys’ Annual Report on Form 10-K (File No. 001-32253) filed on May 31, 2011). | |
10.28 | Form of Restricted Stock Unit Agreement – Employees – 2010 Equity Incentive Plan (incorporated by reference to Exhibit 10.39 to EnerSys’ Annual Report on Form 10-K for the year ended March 31, 2013 (File No. 001-32253) filed on May 28, 2013). | |
10.29 | Form of Market Share Restricted Stock Unit Agreement – Employees – 2010 Equity Incentive Plan (incorporated by reference to Exhibit 10.39 to EnerSys’ Annual Report on Form 10-K for the year ended March 31, 2013 (File No. 001-32253) filed on May 28, 2013). | |
10.30 | Form of Stock Option Agreement - Employees - 2010 Equity Incentive Plan (incorporated by reference to Exhibit 10.32 to EnerSys’ Annual Report on Form 10-K for the year ended March 31, 2014 (File No. 001-32253) filed on May 28, 2014). | |
10.31 | Form of Stock Option Agreement - Senior Executives - 2010 Equity Incentive Plan (incorporated by reference to Exhibit 10.33 to EnerSys’ Annual Report on Form 10-K for the year ended March 31, 2014 (File No. 001-32253) filed on May 28, 2014). | |
10.32 | Form of Restricted Stock Unit Agreement - Employees - 2010 Equity Incentive Plan (incorporated by reference to Exhibit 10.34 to EnerSys’ Annual Report on Form 10-K for the year ended March 31, 2014 (File No. 001-32253) filed on May 28, 2014). | |
10.33 | Form of Market Share Unit Agreement - Employees - 2010 Equity Incentive Plan (incorporated by reference to Exhibit 10.35 to EnerSys’ Annual Report on Form 10-K for the year ended March 31, 2014 (File No. 001-32253) filed on May 28, 2014). | |
10.34 | Form of Market Share Unit Agreement - Senior Executives - 2010 Equity Incentive Plan (incorporated by reference to Exhibit 10.37 to EnerSys’ Annual Report on Form 10-K for the year ended March 31, 2014 (File No. 001-32253) filed on May 28, 2014). | |
10.35 | Form of Indemnification Agreement - Directors and Officers (incorporated by reference to Exhibit 10.36 to EnerSys’ Annual Report on Form 10-K for the year ended March 31, 2014 (File No. 001-32253) filed on May 28, 2014). | |
10.36 | Form of Stock Option Agreement - Employees - 2010 Equity Incentive Plan (incorporated by reference to Exhibit 10.42 to EnerSys’ Annual Report on Form 10-K for the year ended March 31, 2015 (File No. 001-32253) filed on May 27, 2015). | |
100
Exhibit Number | Description of Exhibit | |
10.37 | Form of Stock Option Agreement - Executives - 2010 Equity Incentive Plan (incorporated by reference to Exhibit 10.43 to EnerSys’ Annual Report on Form 10-K for the year ended March 31, 2015 (File No. 001-32253) filed on May 27, 2015). | |
10.38 | Form of Stock Option Agreement - Senior Executives - 2010 Equity Incentive Plan (incorporated by reference to Exhibit 10.44 to EnerSys’ Annual Report on Form 10-K for the year ended March 31, 2015 (File No. 001-32253) filed on May 27, 2015). | |
10.39 | Form of Restricted Stock Unit Agreement - Employees - 2010 Equity Incentive Plan (incorporated by reference to Exhibit 10.45 to EnerSys’ Annual Report on Form 10-K for the year ended March 31, 2015 (File No. 001-32253) filed on May 27, 2015). | |
10.40 | Form of Market Share Unit Agreement - Employees - 2010 Equity Incentive Plan (incorporated by reference to Exhibit 10.46 to EnerSys’ Annual Report on Form 10-K for the year ended March 31, 2015 (File No. 001-32253) filed on May 27, 2015). | |
10.41 | Form of Market Share Unit Agreement - Executives - 2010 Equity Incentive Plan (incorporated by reference to Exhibit 10.47 to EnerSys’ Annual Report on Form 10-K for the year ended March 31, 2015 (File No. 001-32253) filed on May 27, 2015). | |
10.42 | Form of Market Share Unit Agreement - Senior Executives - 2010 Equity Incentive Plan (incorporated by reference to Exhibit 10.48 to EnerSys’ Annual Report on Form 10-K for the year ended March 31, 2015 (File No. 001-32253) filed on May 27, 2015). | |
10.43 | Form of Fifth Amendment to Credit Agreement, dated as of November 23, 2015, among EnerSys, various lenders and Bank of America, N.A., as administrative agent (incorporated by reference to Exhibit 10.1 to EnerSys Quarterly Report on Form 10-Q for the period ended December 27, 2015 (File No. 001-32253) filed on January 28, 2016). | |
10.44 | Form of Market Share Unit Agreement - Senior Executives - 2010 Equity Incentive Plan (incorporated by reference to Exhibit 10.1 to EnerSys Quarterly Report on Form 10-Q for the period ended September 27, 2015 (File No. 001-32253) filed on November 2, 2016). | |
10.45 | Form of Stock Option Agreement - Senior Executives - 2010 Equity Incentive Plan (incorporated by reference to Exhibit 10.1 to EnerSys Quarterly Report on Form 10-Q for the period ended September 27, 2015 (File No. 001-32253) filed on November 2, 2016). | |
10.46 | Form of Stock Option Agreement - Employees - 2010 Equity Incentive Plan (filed herewith). | |
10.47 | Form of Restricted Stock Unit Agreement - Employees - 2010 Equity Incentive Plan (filed herewith). | |
10.48 | Form of Performance Share Unit Agreement - Employees - 2010 Equity Incentive Plan (filed herewith). | |
10.49 | Employment Agreement, dated December 21, 2015, between EH Europe GmbH and Holger P. Aschke (filed herewith). | |
11.1 | Statement regarding Computation of Per Share Earnings.* | |
12.1 | Computation of Ratio of Earnings to Fixed Charges (filed herewith). | |
21.1 | Subsidiaries of the Registrant (filed herewith). | |
23.1 | Consent of Ernst & Young LLP (filed herewith). | |
31.1 | Certification of the Chief Executive Officer pursuant to Rule 13a-14(a)/15d-14(a) Under the Securities Exchange Act of 1934 (filed herewith). | |
31.2 | Certification of the Chief Financial Officer pursuant to Rule 13a-14(a)/15d-14(a) Under the Securities Exchange Act of 1934 (filed herewith). | |
101
Exhibit Number | Description of Exhibit | |
32.1 | Certification of the Chief Executive Officer and Chief Financial Officer pursuant to 18 U.S.C. Section 1350, as adopted pursuant to Section 906 of the Sarbanes-Oxley Act of 2002 (furnished herewith). | |
101.INS | XBRL Instance Document | |
101.SCH | XBRL Taxonomy Extension Schema Document | |
101.CAL | XBRL Taxonomy Extension Calculation Linkbase Document | |
101.DEF | XBRL Taxonomy Extension Definition Document | |
101.LAB | XBRL Taxonomy Extension Label Document | |
101.PRE | XBRL Taxonomy Extension Presentation Document | |
* | Information required to be presented in Exhibit 11 is provided in Note 17 of Notes to Consolidated Financial Statements under Part II, Item 8 of this Annual Report on Form 10-K. |
102
SIGNATURES
Pursuant to the requirements of Section 13 or 15(d) of the Securities Exchange Act of 1934, the registrant has duly caused this report to be signed on its behalf by the undersigned, thereunto duly authorized.
ENERSYS | ||||
By | David M. Shaffer | |||
May 31, 2016 | David M. Shaffer Chief Executive Officer | |||
POWER OF ATTORNEY
KNOW ALL PERSONS BY THESE PRESENTS, that each person whose name appears below hereby appoints David M. Shaffer and Michael J. Schmidtlein and each of them, as his true and lawful agent, with full power of substitution and resubstitution, for him and in his, place or stead, in any and all capacities, to execute any and all amendments to the within annual report, and to file the same, together with all exhibits thereto, with the Securities and Exchange Commission, granting unto each said attorney-in-fact and agent, full power and authority to do and perform each and every act and thing requisite and necessary to be done in and about the premises, as fully to all intents and purposes as he might or could do in person, hereby ratifying and confirming all that each said attorney-in-fact and agent may lawfully do or cause to be done by virtue hereof.
Pursuant to the requirements of the Securities Exchange Act of 1934, as amended, this annual report has been signed below by the following persons in the capacities and on the dates indicated:
Name | Title | Date | ||
/s/ DAVID M. SHAFFER | Chief Executive Officer | May 31, 2016 | ||
David M. Shaffer | ||||
/s/ MICHAEL J. SCHMIDTLEIN | Chief Financial Officer | May 31, 2016 | ||
Michael J. Schmidtlein | ||||
/s/ KERRY M. KANE | Vice President and Corporate Controller (Principal Accounting Officer) | May 31, 2016 | ||
Kerry M. Kane | ||||
/s/ HWAN-YOON F. CHUNG | Director | May 31, 2016 | ||
Hwan-yoon F. Chung | ||||
/s/ HOWARD I. HOFFEN | Director | May 31, 2016 | ||
Howard I. Hoffen | ||||
/s/ ARTHUR T. KATSAROS | Director | May 31, 2016 | ||
Arthur T. Katsaros | ||||
/s/ JOHN F. LEHMAN | Director | May 31, 2016 | ||
John F. Lehman | ||||
/s/ GENERAL ROBERT MAGNUS, USMC (RETIRED) | Director | May 31, 2016 | ||
General Robert Magnus, USMC (Retired) | ||||
/s/ DENNIS S. MARLO | Director | May 31, 2016 | ||
Dennis S. Marlo | ||||
/s/ JOSEPH C. MUSCARI | Director | May 31, 2016 | ||
Joseph C. Muscari | ||||
/s/ PAUL J. TUFANO | Director | May 31, 2016 | ||
Paul J. Tufano | ||||
103
Exhibit Index
Exhibit Number | Description of Exhibit | |
3.1 | Fifth Restated Certificate of Incorporation (incorporated by reference to Exhibit 3.1 to Amendment No. 3 to EnerSys’ Registration Statement on Form S-1 (File No. 001-32253) filed on February 6, 2013). | |
3.2 | Second Amended and Restated Bylaws (incorporated by reference to Exhibits 3.3 to EnerSys’ Quarterly Report on Form 10-Q for the period ended September 30, 2014 (File No. 001-32253) filed on November 5, 2014). | |
4.1 | Indenture, dated as of May 28, 2008, between EnerSys and The Bank of New York, as trustee (incorporated by reference to Exhibit 4.1 to EnerSys’ Current Report on Form 8-K (File No. 001-32253) filed on May 28, 2008). | |
4.2 | Indenture, dated as of April 23, 2015, among EnerSys, the Guarantors party thereto and MUFG Union Bank, N.A., as Trustee (incorporated by reference to Exhibit 4.1 to EnerSys’ Current Report on Form 8-K (File No. 00-32253) filed on April 23, 2015). | |
4.3 | First Supplemental Indenture, dated as of April 23, 2015, among EnerSys, the Guarantors party thereto and MUFG Union Bank, N.A., as Trustee (incorporated by reference to Exhibit 4.2 to EnerSys’ Current Report on Form 8-K (File No. 00-32253) filed on April 23, 2015). | |
4.4 | Form of 5.00% Senior Note due 2023 (incorporated by reference to Exhibit 4.2 to EnerSys’ Current Report on Form 8-K (File No. 00-32253) filed on April 23, 2015). | |
10.1 | Amended and Restated Credit Agreement, dated as of July 8, 2014, among EnerSys, Bank of America, N.A., as Administrative Agent, Wells Fargo Bank, National Association, as Syndication Agent, RB International Finance (USA) LLC and PNC Bank, National Association, as Co-Documentation Agents and Co-Managers and the various lending institutions party thereto (incorporated by reference to Annex A to Exhibit 10.1 to EnerSys’ Current Report on Form 8-K (File No. 001-32253) filed on July 8, 2014). | |
10.2 | Incremental Commitment Agreement, dated July 8, 2014, among EnerSys and certain financial institutions (incorporated by reference to Exhibit 10.2 to EnerSys’ Current Report on Form 8-K (File No. 001-32253) filed on July 8, 2014). | |
10.3 | Stock Subscription Agreement, dated March 22, 2002, among EnerSys Holdings Inc., Morgan Stanley Dean Witter Capital Partners IV, L.P., Morgan Stanley Dean Witter Capital Investors IV, L.P., MSDW IV 892 Investors, L.P., Morgan Stanley Global Emerging Markets Private Investment Fund, L.P. and Morgan Stanley Global Emerging Markets Private Investors, L.P. (incorporated by reference to Exhibit 10.27 to Amendment No. 3 to EnerSys’ Registration Statement on Form S-1 (File No. 333-115553) filed on July 13, 2004). | |
10.4 | Employment Agreement, dated November 9, 2000, between Yuasa, Inc. and John D. Craig and letter of amendment thereto (incorporated by reference to Exhibit 10.2 to EnerSys’ Registration Statement on Form S-1 (File No. 333-115553) filed on May 17, 2004). | |
10.5 | Side Letter to Employment Agreement, dated October 30, 2014, between EnerSys and John D. Craig (incorporated by reference to Exhibit 10.4 to EnerSys' Quarterly Report on Form 10-Q for the period ended September 28, 2014 (File No. 001-32253) filed on November 5, 2014). | |
10.6 | Consulting Agreement with Richard W. Zuidema (incorporated by reference to Exhibit 10.3 to EnerSys Quarterly Report on Form 10-Q for the period ended September 27, 2015 (File No. 001-32253) filed on November 2, 2015). | |
10.7 | Form of Severance Agreement, (incorporated by reference to Exhibit 10.37 to EnerSys’ Annual Report on Form 10-K (File No. 001-32253) filed on May 28, 2013). | |
10.8 | Employment Offer Letter, dated October 20, 2014, of EnerSys Delaware Inc. to David M. Shaffer (incorporated by reference to Exhibit 10.5 to EnerSys' Quarterly Report on Form 10-Q for the period ended September 28, 2014 (File No. 001-32253) filed on November 5, 2014). | |
104
Exhibit Number | Description of Exhibit | |
10.9 | EnerSys 2013 Management Incentive Plan (incorporated by reference to Appendix A to EnerSys’ Definitive Proxy Statement on Schedule 14A (File No. 001-32253) filed on June 27, 2013). | |
10.10 | Form of Stock Option Agreement (six-month vesting) (incorporated by reference to Exhibit 10.31 to EnerSys’ Annual Report on Form 10-K for the year ended March 31, 2008 (File No. 001-32253) filed on June 1, 2009). | |
10.11 | Form of 2004 Equity Incentive Plan (incorporated by reference to Exhibit 10.24 to Amendment No. 3 to EnerSys’ Registration Statement on Form S-1 (File No. 333-115553) filed on July 13, 2004). | |
10.12 | EnerSys Amended and Restated 2006 Equity Incentive Plan (incorporated by reference to Exhibit 10.27 to EnerSys Annual Report on Form 10-K (File No. 001-32253) filed on June 11, 2008). | |
10.13 | EnerSys Management Incentive Plan for fiscal year 2008 (incorporated by reference to Exhibit 10.1 to EnerSys’ Current Report on Form 8-K (File No. 001-32253) filed on April 2, 2007). | |
10.14 | Second Amended and Restated EnerSys 2010 Equity Incentive Plan (filed herewith). | |
10.15 | EnerSys Voluntary Deferred Compensation Plan for Executives as amended August 5, 2010, and May 26, 2011 (incorporated by reference to Exhibit 10.23 to EnerSys’ Annual Report on Form 10-K (File No. 001-32253) filed on May 31, 2011). | |
10.16 | Form of Employee Stock Purchase Plan (incorporated by reference to Exhibit 10.26 to Amendment No. 3 to EnerSys’ Registration Statement on Form S-1 (File No. 333-115553) filed on July 13, 2004). | |
10.17 | Form of Restricted Stock Agreement (incorporated by reference to Exhibit 10.1 to EnerSys’ Current Report on Form 8-K (File No. 001-32253) filed on December 9, 2005). | |
10.18 | Form of Stock Option Agreement (four-year vesting) (incorporated by reference to Exhibit 10.1 to EnerSys’ Current Report on Form 8-K (File No. 001-32253) filed on May 23, 2007). | |
10.19 | Form of Stock Option Agreement (three-year vesting) (incorporated by reference to Exhibit 10.2 to EnerSys’ Current Report on Form 8-K (File No. 001-32253) filed on May 6, 2008). | |
10.20 | Form of Restricted Stock Unit Agreement (incorporated by reference to Exhibit 10.1 to EnerSys’ Current Report on Form 8-K (File No. 001-32253) filed on May 23, 2007). | |
10.21 | Form of Restricted Stock Unit Agreement – Non-Employee Directors (incorporated by reference to Exhibit 10.29 to EnerSys’ Annual Report on Form 10-K (File No. 001-32253) filed on June 1, 2009). | |
10.22 | Form of Restricted Stock Unit Agreement – Employees – 2006 Equity Incentive Plan (incorporated by reference to Exhibit 10.30 to EnerSys’ Annual Report on Form 10-K (File No. 001-32253) filed on June 1, 2010). | |
10.23 | Form of Market Share Restricted Stock Unit Agreement – Employees (incorporated by reference to Exhibit 10.31 to EnerSys’ Annual Report on Form 10-K (File No. 001-32253) filed on June 1, 2010). | |
10.24 | Form of Market Share Restricted Stock Unit Agreement – Employees – 2010 Equity Incentive Plan (incorporated by reference to Exhibit 10.32 to EnerSys’ Annual Report on Form 10-K (File No. 001-32253) filed on May 31, 2011). | |
10.25 | Form of Restricted Stock Unit Agreement – Employees and Senior Executives – 2010 Equity Incentive Plan (incorporated by reference to Exhibit 10.33 to EnerSys’ Annual Report on Form 10-K (File No. 001-32253) filed on May 31, 2011). | |
10.26 | Form of Restricted Stock Unit Agreement – Employees – 2010 Equity Incentive Plan (incorporated by reference to Exhibit 10.31 to EnerSys’ Annual Report on Form 10-K (File No. 001-32253) filed on May 31, 2011). | |
105
Exhibit Number | Description of Exhibit | |
10.27 | Form of Deferred Stock Unit Agreement – Non-Employee Directors – 2010 Equity Incentive Plan (incorporated by reference to Exhibit 10.35 to EnerSys’ Annual Report on Form 10-K (File No. 001-32253) filed on May 31, 2011). | |
10.28 | Form of Restricted Stock Unit Agreement – Employees – 2010 Equity Incentive Plan (incorporated by reference to Exhibit 10.39 to EnerSys’ Annual Report on Form 10-K for the year ended March 31, 2013 (File No. 001-32253) filed on May 28, 2013). | |
10.29 | Form of Market Share Restricted Stock Unit Agreement – Employees – 2010 Equity Incentive Plan (incorporated by reference to Exhibit 10.39 to EnerSys’ Annual Report on Form 10-K for the year ended March 31, 2013 (File No. 001-32253) filed on May 28, 2013). | |
10.30 | Form of Stock Option Agreement - Employees - 2010 Equity Incentive Plan (incorporated by reference to Exhibit 10.32 to EnerSys’ Annual Report on Form 10-K for the year ended March 31, 2014 (File No. 001-32253) filed on May 28, 2014). | |
10.31 | Form of Stock Option Agreement - Senior Executives - 2010 Equity Incentive Plan (incorporated by reference to Exhibit 10.33 to EnerSys’ Annual Report on Form 10-K for the year ended March 31, 2014 (File No. 001-32253) filed on May 28, 2014). | |
10.32 | Form of Restricted Stock Unit Agreement - Employees - 2010 Equity Incentive Plan (incorporated by reference to Exhibit 10.34 to EnerSys’ Annual Report on Form 10-K for the year ended March 31, 2014 (File No. 001-32253) filed on May 28, 2014). | |
10.33 | Form of Market Share Unit Agreement - Employees - 2010 Equity Incentive Plan (incorporated by reference to Exhibit 10.35 to EnerSys’ Annual Report on Form 10-K for the year ended March 31, 2014 (File No. 001-32253) filed on May 28, 2014). | |
10.34 | Form of Market Share Unit Agreement - Senior Executives - 2010 Equity Incentive Plan (incorporated by reference to Exhibit 10.37 to EnerSys’ Annual Report on Form 10-K for the year ended March 31, 2014 (File No. 001-32253) filed on May 28, 2014). | |
10.35 | Form of Indemnification Agreement - Directors and Officers (incorporated by reference to Exhibit 10.36 to EnerSys’ Annual Report on Form 10-K for the year ended March 31, 2014 (File No. 001-32253) filed on May 28, 2014). | |
10.36 | Form of Stock Option Agreement - Employees - 2010 Equity Incentive Plan (incorporated by reference to Exhibit 10.42 to EnerSys’ Annual Report on Form 10-K for the year ended March 31, 2015 (File No. 001-32253) filed on May 27, 2015). | |
10.37 | Form of Stock Option Agreement - Executives - 2010 Equity Incentive Plan (incorporated by reference to Exhibit 10.43 to EnerSys’ Annual Report on Form 10-K for the year ended March 31, 2015 (File No. 001-32253) filed on May 27, 2015). | |
10.38 | Form of Stock Option Agreement - Senior Executives - 2010 Equity Incentive Plan (incorporated by reference to Exhibit 10.44 to EnerSys’ Annual Report on Form 10-K for the year ended March 31, 2015 (File No. 001-32253) filed on May 27, 2015). | |
10.39 | Form of Restricted Stock Unit Agreement - Employees - 2010 Equity Incentive Plan (incorporated by reference to Exhibit 10.45 to EnerSys’ Annual Report on Form 10-K for the year ended March 31, 2015 (File No. 001-32253) filed on May 27, 2015). | |
10.40 | Form of Market Share Unit Agreement - Employees - 2010 Equity Incentive Plan (incorporated by reference to Exhibit 10.46 to EnerSys’ Annual Report on Form 10-K for the year ended March 31, 2015 (File No. 001-32253) filed on May 27, 2015). | |
10.41 | Form of Market Share Unit Agreement - Executives - 2010 Equity Incentive Plan (incorporated by reference to Exhibit 10.47 to EnerSys’ Annual Report on Form 10-K for the year ended March 31, 2015 (File No. 001-32253) filed on May 27, 2015). | |
106
Exhibit Number | Description of Exhibit | |
10.42 | Form of Market Share Unit Agreement - Senior Executives - 2010 Equity Incentive Plan (incorporated by reference to Exhibit 10.48 to EnerSys’ Annual Report on Form 10-K for the year ended March 31, 2015 (File No. 001-32253) filed on May 27, 2015). | |
10.43 | Form of Fifth Amendment to Credit Agreement, dated as of November 23, 2015, among EnerSys, various lenders and Bank of America, N.A., as administrative agent (incorporated by reference to Exhibit 10.1 to EnerSys Quarterly Report on Form 10-Q for the period ended December 27, 2015 (File No. 001-32253) filed on January 28, 2016). | |
10.44 | Form of Market Share Unit Agreement - Senior Executives - 2010 Equity Incentive Plan (incorporated by reference to Exhibit 10.1 to EnerSys Quarterly Report on Form 10-Q for the period ended September 27, 2015 (File No. 001-32253) filed on November 2, 2016). | |
10.45 | Form of Stock Option Agreement - Senior Executives - 2010 Equity Incentive Plan (incorporated by reference to Exhibit 10.1 to EnerSys Quarterly Report on Form 10-Q for the period ended September 27, 2015 (File No. 001-32253) filed on November 2, 2016). | |
10.46 | Form of Stock Option Agreement - Employees - 2010 Equity Incentive Plan (filed herewith). | |
10.47 | Form of Restricted Stock Unit Agreement - Employees - 2010 Equity Incentive Plan (filed herewith). | |
10.48 | Form of Performance Share Unit Agreement - Employees - 2010 Equity Incentive Plan (filed herewith). | |
10.49 | Employment Agreement, dated December 21, 2015, between EH Europe GmbH and Holger P. Aschke (filed herewith). | |
11.1 | Statement regarding Computation of Per Share Earnings.* | |
12.1 | Computation of Ratio of Earnings to Fixed Charges (filed herewith). | |
21.1 | Subsidiaries of the Registrant (filed herewith). | |
23.1 | Consent of Ernst & Young LLP (filed herewith). | |
31.1 | Certification of the Chief Executive Officer pursuant to Rule 13a-14(a)/15d-14(a) Under the Securities Exchange Act of 1934 (filed herewith). | |
31.2 | Certification of the Chief Financial Officer pursuant to Rule 13a-14(a)/15d-14(a) Under the Securities Exchange Act of 1934 (filed herewith). | |
32.1 | Certification of the Chief Executive Officer and Chief Financial Officer pursuant to 18 U.S.C. Section 1350, as adopted pursuant to Section 906 of the Sarbanes-Oxley Act of 2002 (furnished herewith). | |
101.INS | XBRL Instance Document | |
101.SCH | XBRL Taxonomy Extension Schema Document | |
101.CAL | XBRL Taxonomy Extension Calculation Linkbase Document | |
101.DEF | XBRL Taxonomy Extension Definition Document | |
101.LAB | XBRL Taxonomy Extension Label Document | |
101.PRE | XBRL Taxonomy Extension Presentation Document | |
* | Information required to be presented in Exhibit 11 is provided in Note 17 of Notes to Consolidated Financial Statements under Part II, Item 8 of this Annual Report on Form 10-K. |
107