Attached files
| file | filename |
|---|---|
| EX-31.2 - EX-31.2 - DESTINATION XL GROUP, INC. | dxlg-ex312_6.htm |
| EX-31.1 - EX-31.1 - DESTINATION XL GROUP, INC. | dxlg-ex311_7.htm |
UNITED STATES
SECURITIES AND EXCHANGE COMMISSION
WASHINGTON, D.C. 20549
FORM 10-K/A
(Amendment No. 1)
ANNUAL REPORT PURSUANT TO SECTION 13 OR 15(d)
OF THE SECURITIES EXCHANGE ACT OF 1934
|
|
|
|
For the fiscal year ended January 30, 2016 |
Commission File Number 01-34219 |
DESTINATION XL GROUP, INC.
(Exact name of registrant as specified in its charter)
|
|
|
|
Delaware |
04-2623104 |
|
(State or other jurisdiction of |
(IRS Employer Identification No.) |
|
|
|
|
555 Turnpike Street, Canton, MA |
02021 |
|
(Address of principal executive offices) |
(Zip Code) |
(781) 828-9300
(Registrant’s telephone number, including area code)
Securities registered pursuant to Section 12(b) of the Act:
|
Title of each class
|
Name of each exchange on which registered
|
|
Common Stock, $0.01 par value |
The NASDAQ Stock Market, LLC |
Securities registered pursuant to Section 12(g) of the Act:
None
(Title of Class)
Indicate by check mark if the registrant is a well-known seasoned issuer, as defined in Rule 405 of the Securities Act. Yes ¨ No x
Indicate by check mark if the registrant is not required to file reports pursuant to Section 13 or Section 15(d) of the Act. Yes ¨ No x
Indicate by check mark whether the registrant (1) has filed all reports required to be filed by Section 13 or 15(d) of the Securities Exchange Act of 1934 during the preceding 12 months (or for such shorter period that the registrant was required to file such reports), and (2) has been subject to such filing requirements for the past 90 days. Yes x No ¨
Indicate by check mark whether the registrant has submitted electronically and posted on its corporate Web site, if any, every Interactive Data File required to be submitted and posted pursuant to Rule 405 of Regulation S-T (§232.405 of this chapter) during the preceding 12 months (or for such shorter period that the registrant was required to submit and post such files). Yes x No ¨
Indicate by check mark if disclosure of delinquent filers pursuant to Item 405 of Regulation S-K is not contained herein, and will not be contained, to the best of the registrant’s knowledge, in definitive proxy or information statements incorporated by reference in Part III of this Form 10-K or any amendment to this Form 10-K. ¨
Indicate by check mark whether the registrant is a large accelerated filer, an accelerated filer, a non-accelerated filer, or a smaller reporting company. See the definitions of “large accelerated filer,” “accelerated filer” and “smaller reporting company” in Rule 12b-2 of the Exchange Act. (Check one):
|
|
|
|
Large accelerated filer ¨ |
Accelerated filer x |
|
Non-accelerated filer ¨ (Do not check if a smaller reporting company) |
Smaller reporting company ¨ |
Indicate by check mark whether the registrant is a shell company (as defined in Rule 12b-2 of the Act). Yes ¨ No x
As of August 1, 2015, the aggregate market value of the Common Stock held by non-affiliates of the registrant was approximately $116.6 million, based on the last reported sale price on that date. Shares of Common Stock held by each executive officer and director and by each person who owns 10% or more of the outstanding Common Stock have been excluded on the basis that such persons may be deemed to be affiliates. This determination of affiliate status is not necessarily determinative for other purposes.
The registrant had 50,843,797 shares of Common Stock, $0.01 par value, outstanding as of May 13, 2016.
DOCUMENTS INCORPORATED BY REFERENCE
None.
We are filing this Amendment No. 1 to our Annual Report on Form 10−K for the fiscal year ended January 30, 2016 pursuant to General Instruction G(3) to Form 10−K for the purposes of filing the information required to be disclosed pursuant to Part III of Form 10−K.
Except for the amendments described above, this Form 10−K/A does not modify or update the disclosure in our Annual Report on Form 10−K for the fiscal year ended January 30, 2016 filed with the Securities and Exchange Commission on March 18, 2016.
|
|
|
|
PAGE |
|
|
|
|
|
|
|
2 |
||
|
|
6 |
||
|
Security Ownership of Certain Beneficial Owners and Management and Related Stockholder Matters |
|
27 |
|
|
Certain Relationships and Related Transactions, and Director Independence |
|
31 |
|
|
|
32 |
||
|
|
|
|
|
|
|
33 |
||
|
|
34 |
||
1
Item 10. Directors, Executive Officers and Corporate Governance
Set forth below is certain information regarding our directors, including information furnished by them as to their principal occupations and business experience for the past five years, certain directorships held by each director within the past five years, their respective ages as of May 20, 2016, committee membership, and the year in which each became a director of our Company:
C= current member and committee chairperson
X= current member of the committee
|
|
(1) |
On January 28, 2016, upon the recommendation of the Nominating and Corporate Governance Committee, the Board of Directors approved the formation of the Cybersecurity and Data Privacy Committee to oversee the monitoring and management of cyber risk and data privacy in the Company. |
|
|
(2) |
Mr. Bernikow was a member of the Audit Committee until his seat was filled by Mr. Mooney on May 14, 2015. |
|
|
(3) |
Mr. Choper was a member of the Compensation Committee until January 30, 2016. His seat was filled by Mr. Kyees on January 31, 2016. |
Seymour Holtzman has served as our Executive Chairman of the Board since August 2014. From April 2000 to August 2014, Mr. Holtzman served as our Chairman of the Board. Mr. Holtzman has been involved in the retail business for over 40 years. For many years, he has been the president and chief executive officer of Jewelcor, Incorporated, a former New York Stock Exchange listed company that operated a chain of retail stores. From 1986 to 1988, Mr. Holtzman was chairman of the board and also chief executive officer of Gruen Marketing Corporation, an American Stock Exchange listed company involved in the nationwide distribution of watches. For at least the last five years Mr. Holtzman has served as chairman and chief executive officer of Jewelcor Management, Inc., a company primarily involved in investment and management services. Mr. Holtzman is the chief executive officer and indirectly the owner of C.D. Peacock, Inc., a Chicago, Illinois retail jewelry establishment, the managing member of Luxury Swiss, LLC, a retail Rolex watch establishment, and the chief executive officer and owner of Homeclick, LLC, a privately-held internet retailer specializing in luxury brands for the home. Mr. Holtzman is a successful entrepreneur with extensive experience working with public companies and provides valuable insight to the Board with respect to strategic planning.
David A. Levin has been our President and Chief Executive Officer since April 10, 2000 and a director since April 11, 2000. From 1999 to 2000, he served as the executive vice president of eOutlet.com. Mr. Levin was president of Camp Coleman, a division of The Coleman Company, from 1998 to 1999. Prior to that, Mr. Levin was president of Parade of Shoes, a division of J. Baker, Inc., from 1995 to 1997. Mr. Levin was also president of Prestige Fragrance & Cosmetics, a division of Revlon, Inc., from 1991 to 1995. Mr. Levin has worked in the retail industry for over 30 years. Since joining us, Mr. Levin has been instrumental in transforming us from a company which exclusively operated Levi Strauss & Co. branded apparel to the largest specialty retailer of big & tall men’s apparel. In May 2012, Mr. Levin joined the board of directors of Christopher & Banks Corporation, a publicly-traded company and will continue to serve as a director until his term ends on June 30, 2016. Mr. Levin has extensive knowledge of our Company and valuable experience in merchandising and marketing initiatives. In his role as Chief Executive Officer he also acts as a liaison between the Board and management.
Alan S. Bernikow has been a director since June 29, 2003. From 1998 until his retirement in May 2003, Mr. Bernikow served as the deputy chief executive officer of Deloitte & Touche LLP where he was responsible for assisting the firm on special projects such as firm mergers and acquisitions, partner affairs and litigation matters. Mr. Bernikow joined Touche Ross, the predecessor firm of
2
Deloitte & Touche LLP, in 1977, prior to which Mr. Bernikow was the National Administrative Partner in Charge for the accounting firm of J.K. Lasser & Company. Mr. Bernikow is a member of the board of directors of Revlon, Inc., a publicly-traded company, and Revlon Consumer Products Corporation and is chairman of the audit committee, compensation committee and stock plan committee of Revlon, Inc.; lead director and member of the board of directors of Mack-Cali Realty Corporation, a publicly-traded company, as well as the chairman of the audit committee of Mack-Cali; and is a member of the board of directors of UBS Global Asset Management (US) Inc., a wholly-owned subsidiary of UBS AG, and currently serves as chairman of its audit committee. Mr. Bernikow has also served as a member of the boards of directors of several investment funds managed by UBS. Mr. Bernikow is also a member of the board of directors of FCB Financial Holdings, Inc., as well as chairman of its audit committee and a member of its compensation committee. Based on Mr. Bernikow’s significant financial and accounting background, including 30 years of experience in public accounting, his experience serving as a director and audit committee member, and his previous role as an audit committee financial expert for the Company, the Nominating and Corporate Governance Committee concluded that Mr. Bernikow has the requisite experience, qualifications, attributes and skills necessary to serve as a member of the Board.
Jesse Choper has been a director since October 8, 1999. Mr. Choper is the Dean Earl Warren Professor of Public Law Emeritus at the University of California at Berkeley School of Law, where he taught from 1965 until his retirement in June 2015. From 1960 to 1961, Professor Choper was a law clerk for Supreme Court Chief Justice Earl Warren. Mr. Choper is a member of the California Horseracing Board. Mr. Choper provides valuable legal expertise to the Board. His specific legal background provides valuable insight with respect to corporate governance and ethics. Mr. Choper’s tenure and service as a director for over ten years is also considered a valuable asset to the Board.
John E. Kyees has been a director since May 3, 2010. From February 2, 2014 until May 31, 2014, Mr. Kyees served as Interim Chief Financial Officer of the Company. From 2003 until his retirement in 2010, Mr. Kyees was the chief financial officer of Urban Outfitters, Inc. and also served as the chief of investor relations. Prior to that, from 2002 to 2003, Mr. Kyees was the chief financial officer and chief administrative officer of bebe Stores, Inc. Mr. Kyees serves as lead independent director and chairman of the audit committee of Vera Bradley, Inc., a publicly-traded company. Mr. Kyees was a member of the board of directors of Hot Topic, Inc., a formerly publicly-traded company, and was a member of the audit committee. Mr. Kyees is a member of the board of directors of Rackwise, Inc., a publicly-traded company, and is a member of the audit committee. Mr. Kyees is also a director and chairman of the audit committee of Arhaus Furniture, a privately-held retailer. Mr. Kyees brings to the Board extensive executive-level retail experience having served as chief financial officer for several prominent retailers. His insight with respect to merchandising, operational activities and finance is an asset to our Board.
Willem Mesdag has been a director since January 29, 2014. Mr. Mesdag is the managing partner of Red Mountain Capital Partners LLC, an investment management firm. Prior to founding Red Mountain in 2005, Mr. Mesdag was a partner and managing director of Goldman Sachs & Co., which he joined in 1981. Prior to Goldman Sachs, he was a securities lawyer at Ballard, Spahr, Andrews & Ingersoll, which he joined in 1978. He currently serves on the boards of Encore Capital Group, Inc., a publicly-traded company, and Heidrick & Struggles International, Inc., a publicly-traded company. He previously served on the boards of 3i Group plc, Cost Plus, Inc., Skandia Group AB and Nature’s Sunshine Products, Inc. Having had an extensive career in international investment banking and finance, Mr. Mesdag brings to the Board significant knowledge and experience related to business and financial issues and corporate governance.
Ward K. Mooney has been a director since July 31, 2006. Mr. Mooney is a founding partner of Crystal Financial LLC and since March 2010 has served as its chief executive officer. Prior to 2010, Mr. Mooney was the president of Bank of America Retail Finance Group and chief operating officer of Back Bay Capital, both of which were formerly Bank of Boston businesses which Mr. Mooney founded. Mr. Mooney provides the Board with valuable insight with respect to his extensive experience as a lender in the retail industry. The Board has determined that based on Mr. Mooney’s extensive knowledge and experience in finance qualifies him as an audit committee financial expert.
George T. Porter, Jr. has been a director since October 28, 1999. Mr. Porter was president of Levi’s USA for Levi Strauss & Co. from 1994 to 1997. Beginning in 1974, Mr. Porter held various positions at Levi Strauss & Co., including president of Levi’s Men’s Jeans Division. Mr. Porter was also corporate vice president and general manager of Nike USA from 1997 until his retirement in 1998. Mr. Porter provides the Board with extensive merchandising experience having worked at two highly prominent companies. Mr. Porter’s tenure and service as a director for over ten years is also considered a valuable asset to the Board.
Mitchell S. Presser has been a director since May 1, 2007. Since July 2014, Mr. Presser has been a partner and the head of U.S. M&A and private equity at Freshfields Bruckhaus Deringer. From January 2014 until July 2014, Mr. Presser was a senior advisor to Paine & Partners, LLC, a private equity firm. From November 2006 to December 2013, Mr. Presser was a founding partner of Paine & Partners, LLC. Prior to that, Mr. Presser was a partner with the law firm of Wachtell, Lipton, Rosen & Katz, specializing in mergers & acquisitions. Mr. Presser serves as a director on the boards of several privately-held companies. Mr. Presser’s extensive experience in private equity and strategic planning provides valuable insight to the Board.
3
Ivy Ross has been a director since January 31, 2013. In May 2014, Ms. Ross joined Google X as head of Glass and is currently a vice president and head of Project Aura. From July 2011 until April 2014, Ms. Ross was the chief marketing officer of Art.com from where she oversaw the company's marketing, branding, merchandising and user-experience functions. Prior to Art.com, from June 2008 to June 2011, Ms. Ross was EVP of marketing for the Gap brand, and also acted as the creative catalyst for all brands within Gap, Inc. Ms. Ross also has held senior creative and product design positions at Disney Stores North America, Mattel, Calvin Klein, Coach, Liz Claiborne, Swatch Watch and Avon. She also has served on Proctor and Gamble’s design board since its inception. With her industry insight and marketing expertise, Ms. Ross provides a valuable perspective to the Board as we continue to build our DXL brand.
All directors hold office until the next Annual Meeting of Stockholders and until their respective successors have been duly elected and qualified or until their earlier death, resignation or removal.
Current Non-Director Executive Officers
Peter H. Stratton, Jr., 44, has been our Senior Vice President, Chief Financial Officer and Treasurer since June 1, 2014. From August 2009 to May 31, 2014, Mr. Stratton was our Senior Vice President of Finance, Corporate Controller and Chief Accounting Officer. Mr. Stratton joined us in June 2009 as Vice President of Finance. Prior to joining the Company, Mr. Stratton served as the senior director of corporate accounting at BearingPoint, Inc. from May 2007 to June 2009. Prior to May 2007, Mr. Stratton held various finance and accounting leadership positions at Legal Sea Foods, Inc., Shaw’s Supermarkets, Inc. and Cintas Corporation.
Angela Chan, 49, has been our Senior Vice President and Chief Sourcing Officer since February 2015. From March 2013 to February 2015, Ms. Chan was our Senior Vice President of Global Sourcing and Product Development. Prior to that, from May 2010 to March 2013, Ms. Chan was our Vice President of Global Sourcing. Ms. Chan joined the Company in February 2009 as our Director of Global Sourcing. Prior to joining our Company, from October 2007 to December 2008 Ms. Chan was the senior product manager for Redcats USA. From 2007 to 2009, Ms. Chan was an independent retail consultant and analyst with the Gerson Lehrman Group and in 2006, she held the positions of director and executive vice president of global sourcing for Rocawear. Prior to that, Ms. Chan was the founder & partner of several apparel manufacturing companies & franchise restaurants. She also held various merchandising management positions with Macy’s corporate in New York and Hong Kong.
Francis Chane, 53, has been our Senior Vice President of Distribution, Logistics and Facilities since June 2011. Mr. Chane joined the Company in June 2008 as our Vice President of Distribution & Logistics. Prior to joining our Company, Mr. Chane was the vice president operations & facilities for Redcats USA, a division of the French multi-national company PPR, from 1999 to June 2008. Prior to that, Mr. Chane held various leadership positions with WearGuard Corporation, a division of Aramark Corporation.
John F. Cooney, 33, has been our Vice President of Finance and Corporate Controller since June 2014 and in May 2015 he was also appointed Chief Accounting Officer. From November 2010 until May 2014, Mr. Cooney was our Director of Financial Accounting and Reporting. Prior to joining the Company, Mr. Cooney was an audit manager with PricewaterhouseCoopers LLP, which he joined in August 2004.
Kenneth M. Ederle, 51, has been our Senior Vice President and Chief Merchandising Officer since April 2013 and in April 2015 his role was expanded to include Planning and Allocation. Prior to that, from May 2011 until April 2013, Mr. Ederle was our Senior Vice President – General Merchandising Manager DXL. Mr. Ederle served as our Vice President, General Merchandise Manager of Rochester Clothing from August 2008 until May 2011. From January 2008 to August 2008, Mr. Ederle was our Merchandise Manager of Sportswear for Rochester Clothing and prior to that was one of our Merchandise Managers for Casual Male from November 2006 to December 2007. Prior to joining the Company in 2006, Mr. Ederle was a senior buyer and senior planner for Limited Brands.
Jack R. McKinney, 60, has been our Senior Vice President and Chief Information Officer since June 2002. Mr. McKinney began his career with Casual Male Corp. in 1997 and joined our Company in May 2002 as part of our acquisition of Casual Male Corp.
Robert S. Molloy, 56, has been our Senior Vice President and General Counsel since April 2010 and became Secretary of the Company on May 15, 2014. From February 2008 until April 2010, Mr. Molloy was our Vice President and General Counsel. Prior to joining the Company, Mr. Molloy served as the vice president, assistant general counsel at Staples, Inc. from May 1999 to February 2008. Prior to May 1999, Mr. Molloy was a trial attorney.
Brian S. Reaves, 55, has been our Senior Vice President and Chief Sales Officer since November 2014. From May 2010 until November 2014, Mr. Reaves was our Senior Vice President of Store Sales and Operations. Prior to joining our Company, Mr. Reaves was the vice president – Outreach and Group Sales for David’s Bridal from 2007 to 2009. Before that, Mr. Reaves was the senior vice president of sales for The Bridal Group from 2004 to 2007.
4
Peter E. Schmitz, 57, has been our Senior Vice President and Chief Real Estate Officer since June 2013. Prior to that, Mr. Schmitz was our Senior Vice President, Real Estate and Store Development. Prior to joining the Company in August 2007, Mr. Schmitz was the vice president of real estate for Brooks/Eckerd Pharmacy Chain from October 1995 to August 2007.
Walter E. Sprague, 67, has been our Senior Vice President of Human Resources since May 2006. From August 2003 through April 2006, Mr. Sprague was our Vice President of Human Resources. Prior to joining our Company, Mr. Sprague was the managing director northeast, for Marc-Allen Associates, a nationwide executive recruiting firm. From 1996 to 2002, Mr. Sprague was the assistant vice president – senior director of human resources for Foot Locker Inc. and, prior to that, the assistant vice president – senior director of human resources for Woolworth Corporation, the predecessor company to Foot Locker Inc.
Derrick Walker, 47, has been our Senior Vice President and Chief Marketing Officer since May 2012. Prior to joining our Company, Mr. Walker was the vice president of marketing for Lenscrafters from December 2009 to November 2011. Before that, Mr. Walker was the vice president of marketing for Finish Line from December 2006 to September 2009.
Nancy Youssef, 39, joined the Company in November 2015 as our Senior Vice President, International Business Development. Prior to joining the Company, from April 2009 to October 2015, Ms. Youssef was the vice president, international business development for Genesco, Inc. From June 2007 to March 2009, she was senior brand development manager for HSN, Inc. From 2004 to 2007, Ms. Youssef worked in the Middle East for SAS –Egypt where she was the international business development director.
There are no family relationships between any of our directors and executive officers.
Section 16(a) Beneficial Ownership Reporting Compliance
Section 16(a) of the Securities Exchange Act of 1934, as amended (the “Exchange Act”), requires our executive officers and directors, and persons who own more than 10% of a registered class of our equity securities (collectively, the “Reporting Persons”), to file reports of ownership and changes in ownership with the Securities and Exchange Commission (the “SEC”). The Reporting Persons are required to furnish us with copies of all Section 16(a) reports they file. Based solely upon a review of Forms 3, 4 and 5 and amendments thereto furnished to us by our officers and directors during fiscal 2015, we believe that the Reporting Persons complied with all applicable Section 16(a) reporting requirements and that all required reports were filed in a timely manner.
Code of Ethics
We have adopted a Code of Ethics which applies to our directors, Chief Executive Officer, Chief Financial Officer and Chief Accounting Officer, as well as our other senior officers. The full text of the Code of Ethics can be found under “Corporate Governance –Charters & Policies” on the Investor Relations page of the our corporate web site, which is at http://investor.destinationxl.com. We intend to satisfy the disclosure requirement under Item 5.05 of Form 8-K regarding any amendment to, or waiver from, a provision of our Code of Ethics by posting such information on our website
Audit Committee
We have a separately-designated standing Audit Committee established in accordance with section 3(a)(58)(A) of the Exchange Act. The Audit Committee is currently comprised of Messrs. Choper, Mesdag and Mooney. Each of the members of the Audit Committee is independent, as independence for Audit Committee members is defined under the rules of Nasdaq. Through May 14, 2015, Mr. Bernikow served on the audit committee and was our “audit committee financial expert” under the rules of the SEC. On May 14, 2015, Mr. Mooney replaced Mr. Bernikow as a member of the Audit Committee and serves as our audit committee financial expert.
The Audit Committee operates under a written charter, which can be found under “Corporate Governance - Charters & Policies” on the Investor Relations page of our website at http://investor.destinationxl.com.
5
Item 11. Executive Compensation
Compensation Discussion and Analysis
Executive Summary
This Compensation Discussion and Analysis provides a summary of our executive compensation philosophy and programs and discusses the compensation paid to our Chief Executive Officer (“CEO”) and other named executive officers for fiscal 2015 (collectively, our “Named Executive Officers”).
Our Named Executive Officers for fiscal 2015 were:
|
|
Ø |
David A. Levin, President and CEO |
|
|
Ø |
Peter H. Stratton, Jr., Senior Vice President, Chief Financial Officer and Treasurer |
|
|
Ø |
Kenneth M. Ederle, Senior Vice President and Chief Merchandising Officer – Planning and Allocation |
|
|
Ø |
Robert S. Molloy, Senior Vice President, General Counsel and Secretary |
|
|
Ø |
Brian S. Reaves, Senior Vice President and Chief Sales Officer |
Fiscal 2015 Company Performance
2015 Financial Summary
Our financial performance in fiscal 2015 was very strong despite a weakening retail apparel environment. In almost all areas, we met or exceeded our expectations for the year.
|
|
Ø |
Our sales have grown from $386.5 million in fiscal 2013 to $442.2 million in fiscal 2015 |
|
|
Ø |
Comparable Sales for our DXL stores increased 9.7%, up against a prior year increase of 13.7%. |
|
|
Ø |
Sales per square foot from our DXL comparable stores increased to $177 from $165 in fiscal 2014 and $150 in fiscal 2013. |
|
|
Ø |
Merchandise Margin for the year increased 40 basis points over the prior year, as a result of strong initial markup, disciplined promotional activities and controlled markdowns. |
|
|
Ø |
EBITDA from continuing operations, a non-GAAP measure, has improved from $7.3 million in fiscal 2013 to $23.3 million in fiscal 2015. Due to the intensive capital requirements associated with our DXL conversion strategy, depreciation costs have increased sharply over the past 3 years. As a result, EBITDA and EBITDA from continuing operations are key performance indicators as to how well our strategy is working for our business. |
The following is a summary of results for fiscal 2015, including EBITDA from continuing operations and adjusted net loss per diluted share, which are non-GAAP measures. Please see “Non-GAAP Financial Measures” below for a reconciliation of these measures.
|
|
|
For the fiscal year ending: |
|
|||||
|
|
|
January 30, 2016 |
|
|
January 31, 2015 |
|
||
|
|
|
(Fiscal 2015) |
|
|
(Fiscal 2014) |
|
||
|
|
|
(in millions, except per share and percentages) |
|
|||||
|
Financial Highlights: |
|
|
|
|
|
|
|
|
|
Net loss |
|
$ |
(8.4 |
) |
|
$ |
(12.3 |
) |
|
|
|
|
|
|
|
|
|
|
|
Operating loss |
|
$ |
(5.1 |
) |
|
$ |
(8.8 |
) |
|
Add back: Depreciation and amortization expense |
|
$ |
28.4 |
|
|
$ |
24.0 |
|
|
EBITDA from continuing operations |
|
$ |
23.3 |
|
|
$ |
15.2 |
|
|
|
|
|
|
|
|
|
|
|
|
Diluted loss per share: |
|
|
|
|
|
|
|
|
|
Net loss |
|
$ |
(0.17 |
) |
|
$ |
(0.25 |
) |
|
Adjusted net loss (1) |
|
$ |
(0.10 |
) |
|
$ |
(0.16 |
) |
|
|
|
|
|
|
|
|
|
|
|
Shareholder Return (2) |
|
|
|
|
|
|
|
|
|
Total 1-year Shareholder Return (3) |
|
|
(15.4 |
)% |
|
|
|
|
|
Total 2-year Shareholder Return |
|
|
(20.1 |
)% |
|
|
|
|
|
Total 3-year Shareholder Return |
|
|
(6.5 |
)% |
|
|
|
|
6
|
|
(2) |
Total 1-year Shareholder Return for fiscal 2015 was calculated by taking the percentage change in stock price from January 30, 2015 to January 29, 2016. Total 2-year Shareholder Return for fiscal 2015 was calculated by taking the percentage change in stock price from January 31, 2014 to January 29, 2016. Total 3-year Shareholder Return for fiscal 2015 was calculated by taking the percentage change in stock price from February 1, 2013 to January 29, 2016. No dividends were paid by us. We calculated all shareholder returns using the closing price of our common stock on the last business day of each fiscal year. |
|
|
(3) |
We do not believe that our stock price of $4.30 at the end of fiscal 2015 was indicative of our progress or improved financial results as a result of our DXL rollout in fiscal 2015. We expect that our shareholder returns may not be representative of our financial performance until we return to profitability which is expected to occur in fiscal 2017. |
Fiscal 2015 Executive Compensation Highlights
We believe that the value of compensation awarded to our Named Executive Officers was aligned with the performance of the Company for fiscal 2015. Management’s successful implementation of our DXL strategy is imperative to our long-term growth and profitability. Accordingly, we have tied a significant portion of the compensation for our management team to the achievement of our short-term and long-term goals. For Mr. Levin, our CEO, almost 50% of the compensation that he earned in fiscal 2015 was performance-based and the result of achieving or exceeding each of the performance metrics under our annual incentive plan, or “AIP”. For our other Named Executive Officers, almost 30% of the compensation earned by each of them in fiscal 2015 was performance-based. Participation levels, the performance targets and actual results are discussed below under “Compensation Components, Fiscal 2015 Compensation Decisions, 2016 Annual Incentive Plan Targets and Long-Term Incentive Program – Performance-based annual cash incentive plan – 2015 AIP.” See the “Summary Compensation Table” below for a detailed description of compensation for each Named Executive Officer.
On a comparative basis, the following table shows total compensation earned for each Named Executive Officer for fiscal 2015 as compared to fiscal 2014. Because the Company’s Long-Term Incentive Plan 2013-2016 (“2013-2016 LTIP”) contains a four-year performance period, there was no opportunity for our Named Executive Officers to earn any long-term performance-based compensation in fiscal 2015 or fiscal 2014.
|
Named Executive Officer |
|
% Change (1) |
|
|
Fiscal 2015 |
|
|
Fiscal 2014 |
|
|||
|
David A. Levin |
|
|
13.3 |
% |
|
$ |
2,026,290 |
|
|
$ |
1,788,363 |
|
|
Peter H. Stratton, Jr. |
|
|
17.2 |
% |
|
$ |
479,837 |
|
|
$ |
409,252 |
|
|
Kenneth M. Ederle |
|
|
18.9 |
% |
|
$ |
638,967 |
|
|
$ |
537,394 |
|
|
Robert S. Molloy |
|
|
9.8 |
% |
|
$ |
574,991 |
|
|
$ |
523,672 |
|
|
Brian S. Reaves |
|
|
11.5 |
% |
|
$ |
515,288 |
|
|
$ |
462,076 |
|
|
|
|
|
|
|
|
|
|
|
|
|
|
|
7
Say-on-Pay
At our 2011 Annual Meeting, stockholders voted on a non-binding advisory proposal as to the frequency with which we should conduct an advisory vote on executive compensation (a "say-on-pay proposal"). At that meeting, and in accordance with the recommendation of our Board of Directors, 93.5% of votes cast voted for the “one-year” frequency for advisory votes on executive compensation and we intend to hold such vote every year, until our next "say-on-pay" frequency vote, which we anticipate to be held at our 2017 Annual Meeting.
At our 2015 Annual Meeting, stockholders had an opportunity to cast a non-binding advisory vote on executive compensation as disclosed in the 2015 Proxy Statement. Of the votes cast on the say-on-pay proposal, 93.9% voted in favor of the proposal. The Compensation Committee considered the results of the 2015 advisory vote and believes that it affirms stockholders' support of our approach to executive compensation, namely to align short- and long-term incentives with the Company’s financial performance as we continue to convert to the DXL format. We will continue to consider the outcome of subsequent say-on-pay votes when making future compensation decisions for our executive officers.
Key Features of Our Executive Compensation Program
We believe that our executive compensation program includes key features that align the compensation for the Named Executive Officers with the strategic goals of the Company and interests of our shareholders.
|
What We Do |
What We Don’t Do |
|
üFocus on performance-based pay |
ûNo guaranteed bonuses |
|
üBalance short-term and long-term incentives |
ûNo repricing of underwater options |
|
üUse multiple targets for performance awards |
ûNo hedging of Company stock |
|
üCap all incentive awards at 150% payout |
ûNo tax gross up on severance payments |
|
üRequire “double-trigger” change-in-control provisions |
ûNo active supplemental executive retirement plan |
|
üMaintain a “claw-back” policy in employment agreements |
|
|
üSeek to mitigate undue risk in compensation plans |
|
|
üUtilize a compensation consultant |
|
|
üProvide executives with very limited perquisites |
|
Executive Compensation Philosophy and Objectives
Our Compensation Committee is responsible for establishing, implementing and continually monitoring adherence to our compensation philosophy, and ensuring that the total compensation we pay to our executives is fair, reasonable, competitive and consistent with the interests of the Company’s stockholders. Our Compensation Committee’s compensation guiding principle is to reward our executives for the achievement of our primary business objectives: successfully complete the transformation to our DXL format, grow our market share within the Big & Tall retail industry, increase earnings and operating margins and, ultimately, increase stockholder returns through stock price gains arising from an increase in earnings and operating margins.
The Compensation Committee believes that the most effective executive compensation program is one designed to:
|
|
· |
Attract, retain and engage the executive talent we need to deliver on our performance expectations; |
|
|
· |
Reward the achievement of specific annual, long-term and strategic goals through a combination of both cash and stock-based compensation; |
|
|
· |
Align our executives’ interests with those of our stockholders; and |
8
|
|
· |
Deliver a total compensation opportunity competitive with those available to similarly situated executives at our peer companies. |
When reviewing compensation, the Compensation Committee evaluates the pay structure in two primary ways: “total cash compensation” and “total direct compensation.” Total cash compensation consists of an executive’s base salary and annual performance-based cash incentive award, which is tied to our annual performance targets. Total direct compensation consists of total cash compensation plus target long-term incentive awards. Our current long-term incentives are designed to reward the achievement of our long-term financial objectives, such as increasing revenue and EBITDA, which we believe is aligned with stockholder returns.
Our executive compensation program is designed to balance the mix of short- and long-term compensation in order to ensure adequate base compensation and annual incentive opportunities to attract and retain executive talent, while providing meaningful incentives for our executives to create long-term value for our Company and our stockholders. Every year, we assess the effectiveness of our compensation plans and are continually working to strengthen our overall compensation program. We also evaluate the financial metrics that we use to measure performance and compare them to those used by our peers. Performance targets under our annual incentive plans may change year-to-year as a result of this continuous review.
Use of Compensation Consultants
The Compensation Committee has the authority to retain compensation consultants and other outside advisors, without Board or management approval, to assist in carrying out its duties, including the evaluation of compensation to be paid to our Named Executive Officers. The Compensation Committee may accept, reject or modify any recommendations by compensation consultants or other outside advisors.
The Compensation Committee periodically consults with Sibson Consulting, an independent firm which specializes in benefits and compensation, to advise the Compensation Committee on the structure and competitiveness of our executive compensation program compared to our peer group. The Compensation Committee has assessed the independence of Sibson Consulting and has concluded that no conflict of interest exists with respect to the services that Sibson Consulting performs for our Compensation Committee. Sibson Consulting did not provide any services to the Company other than with respect to the services provided to the Compensation Committee.
Sibson Consulting analyzed compensation and benefits for all of our Named Executive Officers in fiscal 2011 and provided an updated review in January 2012 and again for Mr. Levin in the Spring of 2014 with respect to his compensation and benefits for fiscal 2014. For each of the past three fiscal years, Sibson Consulting has also worked with the Compensation Committee on updating and revising our current annual incentive and long−term incentive plans. Sibson Consulting continues to work with the Compensation Committee on an on-going basis to ensure that the Company’s compensation program remains in line with our peer group as well as with our own business objectives.
Compensation Setting Process
CEO Compensation. The Compensation Committee’s overall goal is for CEO total direct compensation to fall within the median of our peer group. This guideline may differ, however, depending on an individual’s qualifications, role content and scope, overall responsibility, past performance and experience, the demand for individuals with the executive’s specific expertise, the Company’s achievement of our financial objectives and the CEO’s contribution to such achievement, among other criteria.
The Compensation Committee is directly responsible for determining the compensation paid to our CEO. The Compensation Committee, working with Sibson Consulting, compares each element of compensation to published survey data and proxy data from our peer group for executives with comparable positions and responsibilities.
Other Named Executive Officers. For our senior executives other than our CEO, the Compensation Committee’s overall objective is to provide them with a competitive base salary that is within our peer median, while also providing them with an opportunity for short- and long-term compensation if our Company meets or exceeds its financial targets, such as EBITDA and operating margins.
Our CEO and our Senior Vice President of Human Resources are primarily responsible for determining the compensation paid to our other Named Executive Officers, subject to any input the Compensation Committee may provide. For benchmarking purposes, several published industry compensation surveys are utilized when determining compensation packages for our other Named Executive Officers. Through our subscriptions with PayFactors, Salary.com and the National Retail Federation, we have access to the latest compensation data, which includes both base salary and total compensation, inclusive of incentives. While these sites do not identify the specific companies included in the survey, we are able to access information based on industry, size, such as sales volumes, and regional area, among others. In general, we benchmark compensation against companies in the retail industry which are of similar size, based on comparative sales volumes. When recruiting for a senior management position, we will also benchmark against larger or more complex business structures to ensure we attract and retain the best talent to support future growth. A
9
combination of performance, achievement of goals and survey data, among other criteria, is used to determine each Named Executive Officer’s total direct compensation opportunity. Like our CEO, our other Named Executive Officers are provided with a competitive base salary within our retail industry and are provided with an opportunity to earn performance awards each year which are primarily driven by our overall financial targets. See “Compensation Components, Fiscal 2015 Compensation Decisions, 2016 Annual Incentive Plan Targets and Long-Term Incentive Program – Performance–based annual cash incentive plan” and “ – Long-term incentive plans.”
Our Peers
When determining peer companies for use in reviewing and establishing compensation for our Named Executive Officers for fiscal 2015, we chose public companies within the specialty retail apparel business with comparable sales and market capitalization. For fiscal 2015, Body Central Corp., Cache, Inc. and dELiA*s were removed from the Company’s peer group because each has ceased operations and no new peers were added until fiscal 2016. The companies in the fiscal 2015 peer group are listed below.
|
· |
bebe, inc. |
· |
Citi Trends |
· |
Pacific Sunwear |
|
|
|
|
|
|
|
|
· |
Big 5 Sporting Goods |
· |
Destination Maternity |
· |
Sport Chalet |
|
|
|
|
|
|
|
|
· |
The Buckle |
· |
Hibbett Sports |
· |
Wet Seal |
|
|
|
|
|
|
|
|
· |
Cato Group |
· |
Kirkland’s, Inc. |
· |
Zumiez, Inc. |
|
|
|
|
|
|
|
|
· |
Christopher & Banks |
· |
MarineMax, Inc. |
|
|
|
|
|
|
|
|
|
|
|
(1) |
For fiscal 2016, Sport Chalet and Wet Seal were removed due to bankruptcies and the Company added Sportsman’s Warehouse, Tilly’s, Inc., Boot Barn Holdings, Inc., Blue Nile, Inc. and Build-A-Bear Workshop, Inc. |
Risk Assessment
We believe that our compensation programs do not provide incentives for unnecessary risk taking by our employees. Our employment agreements with each of our Named Executive Officers include a “claw-back” provision that permits us to demand full repayment of all amounts paid to the executive in the event we learn after the executive’s termination that the executive could have been terminated for “justifiable cause.” Our emphasis on performance-based annual and long-term incentive awards is also designed to align executives with preserving and enhancing shareholder value. Based on these considerations, among others, we do not believe that our compensation policies and practices create risks that are likely to have a material adverse effect on our Company.
Compensation Components, Fiscal 2015 Compensation Decisions, 2016 Annual Incentive Plan Targets and Long-Term Incentive Program
We believe that our executive compensation policies and practices appropriately balance the interests of our executives with those of our stockholders. Our executive compensation philosophy emphasizes the shared responsibility of our executive officers for the Company’s financial performance. Accordingly, the compensation of our Named Executive Officers, in particular our CEO, is heavily weighted toward “at risk,” performance-based compensation.
The primary components of compensation for our Named Executive Officers include base salary (“fixed compensation”) and annual performance-based cash incentives and long-term incentives (“at-risk compensation”). Although the performance period under our current 2013-2016 LTIP covers a four-year period with no annual performance-based payout, the annual weight of each component leads to the following allocation of potential compensation that each executive can earn.
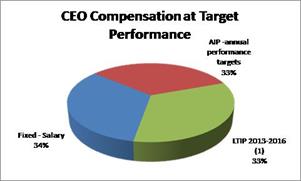
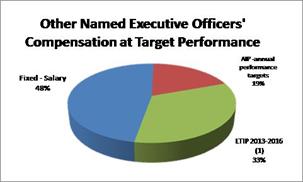
10
|
|
(1) |
Because the 2013-2016 LTIP is a four-year performance-based plan, the annual weight of the LTIP to total compensation is based on the potential payout at target divided by four years. |
The components of executive compensation are as follows:
|
|
· |
Base salary |
Base salary represents the fixed component of an executive’s annual compensation. In order to be competitive in the marketplace and attract the top executive talent, we believe that it is important that our base salary be competitive, generally falling within the median of our industry peers.
Base salaries are reviewed annually and adjustments are influenced by our performance in the previous fiscal year and the executive’s contribution to that performance. The executive’s performance is measured by various factors, including, but not limited to, achievement of specific individual and department goals. Additionally, adjustments may consider an individual’s promotion that may have occurred during the fiscal year, and any modifications in the individual's level of responsibility.
As mentioned above, the Compensation Committee reviews our CEO’s overall compensation and expects the CEO’s base salary to fall in a range that is within the peer median, with approximately one-third of his total direct compensation to be in the form of base salary. In making base salary decisions for our other Named Executive Officers, our CEO, working with our Senior Vice President of Human Resources, relies on published industry compensation surveys and targets the market median range. Any recommended change in the base salary of our other Named Executives Officers is subject to the review and approval of the Compensation Committee.
The Compensation Committee most recently requested of Sibson Consulting to have Mr. Levin’s total direct compensation reviewed in April 2014, at which time the Compensation Committee determined no compensation adjustments were needed. The Compensation Committee believes that Mr. Levin’s salary continues to be competitive and within our peer median.
The following is a summary of each Named Executive Officer’s base salary, as of each fiscal year’s annual review:
|
|
Fiscal 2016 |
|
Fiscal 2015 |
|
% change |
|
|||
|
David A. Levin (1) |
$ |
811,200 |
|
$ |
811,200 |
|
|
- |
|
|
Peter H. Stratton, Jr. (2) |
$ |
355,000 |
|
$ |
285,000 |
|
|
25% |
|
|
Kenneth M. Ederle |
$ |
390,000 |
|
$ |
390,000 |
|
|
- |
|
|
Robert S. Molloy (3) |
$ |
345,000 |
|
$ |
335,000 |
|
|
3% |
|
|
Brian S. Reaves |
$ |
300,000 |
|
$ |
300,000 |
|
|
- |
|
|
|
(1) |
Mr. Levin has not received an increase in base salary since fiscal 2010. Any increase in total compensation has resulted from performance-based incentive programs. |
|
|
(2) |
Mr. Stratton’s received a salary adjustment of 25% for fiscal 2016 to align his base salary with our peer group. |
|
|
(3) |
Mr. Molloy received a salary adjustment of 3% for fiscal 2016 to align his base salary with our peer group. |
|
|
· |
Performance-based annual cash incentive plan (AIP) |
The Compensation Committee believes that a substantial portion of each Named Executive Officer’s compensation should tie directly to our Company’s financial performance. Our AIP provides for an annual performance-based cash incentive opportunity for all executives as well as select non-executive employees. The Compensation Committee believes that an executive’s annual compensation package should include a cash incentive component to provide an additional incentive for the executive to help the Company achieve its annual financial goals, which ultimately benefits our stockholders.
Mr. Levin’s participation in the annual incentive plan is at 100% of his annual salary, whereas our other Named Executive Officers’ participate at 40% of their respective salaries.
The metrics for achievement under our 2015 AIP reflected the Company’s primary financial goals of increasing top line revenues while protecting merchandise margin and managing expenses during our DXL transition. In addition, sales per square foot, comparable sales from our DXL stores and growth in our customer base were determined to be key metrics for our long-term profitability.
Our established targets for achieving a payout under the 2015 AIP show the rigor of our incentive compensation plans. Our sales target of $441.7 million represented an increase of 6.7% from actual sales in fiscal 2014 of $414.0 million, and our EBITDA target of $21.5 million represented a 41.4% increase over actual EBITDA in fiscal 2014. The ability to achieve, and in most cases, exceed our established targets in fiscal 2015, while opening 36 stores and closing 44 stores.
11
The 2015 AIP targets approved by the Compensation Committee and actual results against these targets are as follows:
2015 Annual Incentive Plan
|
|
|
Metric |
|
Award % |
|
Minimum/Maximum Potential Payout |
|
2015 Target |
2015 Actual |
Payout % |
|
Target 1 |
|
Sales |
|
25.0% |
|
100% payout at set target, with 50% payout at 98% of set target and 150% payout at 102%.
|
|
$441.7 million |
$442.2 million |
102.9% |
|
Target 2 |
|
Adjusted EBITDA* |
|
25.0% |
|
100% payout out at set target, with 50% payout at 86% of set target and 150% payout at 114%.
|
|
$21.5 million |
$25.3 million |
150.0% |
|
Target 3 |
|
Merchandise Margin |
|
15.0% |
|
Target must be achieved for a minimum payout of 100%, with 125% payout at 102.7% of target and 150% of payout at 105% of target.
|
|
** |
170 basis points greater than target |
126.8% |
|
Target 4 |
|
DXL Comparable Sales |
|
15.0% |
|
100% payout at set target, with 50% payout at 76.5% of target and 150% of payout at 123.5% of target.
|
|
8.5% |
9.7% |
130.0% |
|
Target 5 |
|
DXL Sales per Square Foot |
|
10.0% |
|
100% payout at set target, with 50% payout at 97.7% of target and 150% of payout at 102.3%. |
|
$174 |
$177 |
137.5% |
|
Target 6 |
|
Customer Counts |
|
10.0% |
|
100% payout at set target, with 50% payout at 98.8% of target and 150% payout at 101.6% of target. |
|
*** |
99.8% of target |
93.4% |
* Adjusted EBITDA, as approved by the Compensation Committee on March 18, 2015, is EBITDA adjusted to exclude the compensation accrual for the Wrap-Around plan as well as costs associated with business development, such as International.
** Merchandise margin is a component of gross margin, net of occupancy costs and is not disclosed because we believe it would be a competitive disadvantage to disclose.
*** We do not disclose information regarding our customer base because we believe it would be a competitive disadvantage to disclose.
These targets were derived from the Company’s operating plan for fiscal 2015 and the Compensation Committee believed that it was possible, within an approximate 50% probability, to meet or exceed each of the targets. As a result of achieving the performance targets for fiscal 2015, on March 15, 2016 the Compensation Committee approved a cash bonus payout of 124.8% under the 2015 AIP and the total cash award paid to 105 participants was approximately $4.9 million. For comparison purposes, the following is the actual amounts earned by our Named Executive Officers under our 2015 AIP and 2014 AIP:
|
Named Executive Officer |
|
Fiscal 2015 Actual Payout |
|
|
Fiscal 2014 Actual Payout |
|
||
|
David A. Levin |
|
$ |
1,012,378 |
|
|
$ |
855,573 |
|
|
Peter H. Stratton, Jr. |
|
$ |
142,272 |
|
|
$ |
113,462 |
|
|
Kenneth M. Ederle |
|
$ |
190,848 |
|
|
$ |
149,713 |
|
|
Robert S. Molloy |
|
$ |
167,232 |
|
|
$ |
141,128 |
|
|
Brian S. Reaves |
|
$ |
149,760 |
|
|
$ |
122,338 |
|
Similar to our 2015 AIP, the metrics for achievement under our annual incentive plan for fiscal 2016 are aligned with the Company’s primary financial goals of increasing top line revenues while protecting merchandise margin and managing expenses during our DXL transition. In addition, sales per square foot and comparable sales from our DXL stores remain key metrics for our long-term profitability. For fiscal 2016, the Company eliminated the customer count as a target and increased the percentage attributable to EBITDA and DXL sales per square foot, because they were more closely aligned with financial success and, ultimately, shareholder returns.
12
The 2016 AIP financial targets and metrics approved by the Compensation Committee are as follows:
2016 Annual Incentive Plan
|
|
|
Metric |
|
Award % |
|
Minimum/Maximum Potential Payout |
|
Target 1 |
|
Sales |
|
25.0% |
|
100% payout at set target, with 50% payout at 98.1% of set target and 150% payout at 101.9% of target |
|
Target 2 |
|
Adjusted EBITDA |
|
30.0% |
|
100% payout at set target, with 50% payout at 91.0% of set target and 150% payout at 108.9% of target |
|
Target 3 |
|
Merchandise Margin |
|
15.0% |
|
Target must be achieved for a minimum payout of 100%, with 125% payout at 102.1% of target and 150% of payout at 104.3% of target. |
|
Target 4 |
|
DXL Comparable Sales |
|
15.0% |
|
100% payout at set target, with 50% payout at 61.0% of target and 150% of payout at 139.0% of target |
|
Target 5 |
|
DXL Sales per Square Foot |
|
15.0% |
|
100% payout at set target, with 50% payout at 97.9% of target and 150% of payout at 102.1% of target |
The Compensation Committee believes that it is possible to meet or exceed the targets set for fiscal 2016. The established targets are intended to be achievable within an approximate 50% probability as a result of executing our operating plan. The target levels are derived from our annual operating plan and budget for the fiscal year. The operating plan and budget set forth our internal goals and objectives for our growth and development, and we expect that achieving these goals and objectives will require substantial efforts by the entire Company. As a result, the likelihood of achieving the 2016 targets reflects the challenges inherent in achieving the goals and objectives in the operating plan and budget. The Compensation Committee considered the likelihood of achieving the target levels when approving the target amount, including historical achievement by our executive officers.
Assuming we achieve 100% of the above targets for fiscal 2016, we estimate that the total potential payout under the 2016 AIP would be approximately $4.3 million, of which $1.4 million would be paid to our Named Executive Officers as set forth below, and the remaining amount would be paid to the approximately 107 other participants.
|
Named Executive Officer |
|
Fiscal 2016 Potential Payout at Target |
|
|
|
David A. Levin |
|
$ |
811,200 |
|
|
Peter H. Stratton, Jr. |
|
$ |
134,462 |
|
|
Kenneth M. Ederle |
|
$ |
156,000 |
|
|
Robert S. Molloy |
|
$ |
136,923 |
|
|
Brian S. Reaves |
|
$ |
120,000 |
|
|
|
· |
Long-term incentive plans |
Long-term incentive plans (“LTIPs”) are an important component of our executive compensation program, as they are designed to align the interests of our executives with those of our stockholders to create long-term value and to promote long-term retention of our executives. Since the Company adopted its first LTIP in 2008, the Compensation Committee has not made annual discretionary grants of stock options or other equity-based awards.
2013-2016 Long-Term Incentive Plan (“LTIP”)
In 2013, the Compensation Committee approved our 2013-2016 LTIP, which was designed for the specific purpose of retaining and rewarding our executives for the efforts required for the Company to transition to the DXL concept, which was originally expected to be four years. In 2013, each participant was granted an unearned and unvested award equal to four times their annual salary multiplied by their long-term incentive program percentage, which was 100% for the CEO and 70% for our other Named Executive Officers (the “Projected Benefit Obligation”). This award consisted of a combination of restricted stock, stock options and cash. Of the total award, 50% is subject to time-based vesting and 50% is subject to performance-based vesting. The time-vested portion of the award (half of the shares of restricted stock, options and cash) vests in three installments with the first 20% having vested at the end of fiscal 2014 and the second installment having vested at the end of fiscal 2015. The remaining 40% will vest at the end of fiscal 2016.
For the performance-based portion of the award to vest, the Company must achieve revenue of at least $600 million and an operating margin of not less than 8.0% for the participants to receive 100% vesting of the performance-based portion of the Projected Benefit Amount. If the Company does not meet the performance target at the end of fiscal 2016, but the Company is able to achieve revenue equal to or greater than $510 million at the end of fiscal 2016 and the operating margin is not less
13
than 8.0%, then the participants will receive a pro-rata portion of the performance-based award based on minimum sales of $510 million (50% payout) and $600 million (100% payout).
The targets for the performance-based portion of the awards were based on having an estimated 215 to 230 DXL stores open by the end of fiscal 2015. At the beginning of fiscal 2014, however, the Board approved a strategic change to slow the timing of the transition, which it expected would improve the Company’s liquidity position during the transition while still achieving a successful rollout, although over a longer time period. In light of the strategic shift and the reduced number of DXL stores expected to be opened during the rollout, it became clear that the performance component of the 2013-2016 LTIP would most likely not be achievable. As a result, the participants in the 2013-2016 LTIP would likely have no opportunity to earn any performance-based compensation for four years, during which time we expect to have significantly transitioned the Company to the DXL concept. The Compensation Committee did not want to penalize the participants as a result of this strategic shift. After consultation with Sibson Consulting, in late 2014, the Compensation Committee established a supplemental plan, the “Wrap-Around Plan,” that exists at the same time as the 2013-2016 LTIP, but will be triggered only if there is no payout on the performance component of the 2013-2016 LTIP, as further described below.
Wrap-Around Plan
The Wrap-Around Plan is a supplemental performance-based incentive plan that is effective only if the Company does not meet the performance targets set forth above in the 2013-2016 LTIP. The performance targets under the Wrap-Around Plan reflect the Company’s forecasted operating results for fiscal 2016 given the revised store roll-out.
Under the Wrap-Around Plan, if the target performance metrics for fiscal 2016 are met, participants will be eligible to receive a payout equal to 80% of the dollar value of the performance-based compensation that they were eligible to receive under the 2013-2016 LTIP. The following is a summary of the key features of the Wrap-Around Plan:
|
Effective Date |
·Triggered, if and only if, there is no vesting of performance-based awards under the 2013-2016 LTIP and, as a result, all performance-based awards under that plan are forfeited. |
|
Two Performance Metrics (weighted 50%-50%) |
·Sales and EBITDA for fiscal 2016 ·However, the EBITDA target must be met for any payout under either metric. |
|
Awards Earned Will be Payable |
·50% restricted stock ·50% cash ·Each participant’s maximum potential benefit is the same as the performance-based component under the 2013-2016 LTIP. |
|
Share Price Bonus (1) |
If, at the close of business on the day that the Company’s earnings for fiscal 2016 are publicly released, the Company’s share price is at least $6.75, then the 50% of the award value to be settled in shares of restricted stock will be increased as follows: ·20% at $6.75 ·30% at $7.25 or higher ·Straight-line interpolation for any price in between |
|
Vesting of Awards |
Any awards granted will not become fully vested until the last day of the second quarter of fiscal 2017. |
|
|
(1) |
A significant component of the 2013-2016 LTIP was that all awards were granted unvested and un-exercisable at the onset of the plan, thereby providing each participant with an opportunity to benefit in the growth of the share price if the performance targets were met. Under the Wrap-Around Plan, any award earned will not be granted until the first quarter of fiscal 2017. Further, if the share price at the time of grant under the Wrap-Around Plan is significantly higher than the share price of the awards granted under the 2013-2016 LTIP, each participant will receive fewer shares. If the closing stock price is higher on the date of grant, it would likely be attributable to a successful transition to the DXL concept, yet the participants would receive fewer shares for their successful efforts. The Share Price Bonus feature is intended to address this. |
The Compensation Committee believes that our performance metrics under the Wrap-Around Plan are rigorous and are established with the expectation that they have a 50% probability of being achieved. To achieve them will require a great deal of focus and effort, which will benefit shareholders and participants alike. The performance targets for the Wrap-Around Plan will be disclosed once the performance period has ended.
14
The following table illustrates the total cumulative value to each of the Named Executive Officers over the term of the 2013-2016 LTIP (1) assuming that the Company is able to achieve the performance targets and the Wrap-Around Plan does not become effective and (2) assuming the performance targets are not achieved under the 2013-2016 LTIP and the Wrap-Around Plan is triggered and payouts are at target:
|
|
|
Potential Payout under 2013-2016 LTIP (assuming time-based and performance-based targets are met) |
|
|
Potential Payout under 2013-2016 LTIP (time-based) and Wrap-Around Plan (performance-based) |
|
||||||||||||||||||||||
|
Named Executive Officer |
|
Value of time-vested awards(cash and equity) |
|
|
Value of unearned performance-based awards (cash and equity) |
|
|
Total potential payout under 2013-2016 LTIP |
|
|
Value of time-vested awards(cash and equity) under 2013-2016 LTIP |
|
Value of performance-based awards under 2013-2016 LTIP |
|
Value of performance-based awards under the Wrap-Around |
|
Value of share bonus assuming $6.75 share price |
|
Total potential payout under 2013-2016 LTIP with Wrap-Around |
|
||||||||
|
David A. Levin |
|
$ |
1,622,400 |
|
|
$ |
1,622,400 |
|
|
$ |
3,244,800 |
|
|
$ |
1,622,400 |
|
$ |
- |
|
$ |
1,297,920 |
|
$ |
129,792 |
|
$ |
3,050,112 |
|
|
Peter H. Stratton, Jr. |
|
$ |
280,000 |
|
|
$ |
280,000 |
|
|
$ |
560,000 |
|
|
$ |
280,000 |
|
$ |
- |
|
$ |
224,000 |
|
$ |
22,400 |
|
$ |
526,400 |
|
|
Kenneth M. Ederle |
|
$ |
455,000 |
|
|
$ |
455,000 |
|
|
$ |
910,000 |
|
|
$ |
455,000 |
|
$ |
- |
|
$ |
364,000 |
|
$ |
36,400 |
|
$ |
855,400 |
|
|
Robert S. Molloy |
|
$ |
455,000 |
|
|
$ |
455,000 |
|
|
$ |
910,000 |
|
|
$ |
455,000 |
|
$ |
- |
|
$ |
364,000 |
|
$ |
36,400 |
|
$ |
855,400 |
|
|
Brian S. Reaves |
|
$ |
385,000 |
|
|
$ |
385,000 |
|
|
$ |
770,000 |
|
|
$ |
385,000 |
|
$ |
- |
|
$ |
308,000 |
|
$ |
30,800 |
|
$ |
723,800 |
|
2016-2017 LTIP
With the 2013-2016 LTIP and Wrap-Around Plan expiring at the end of fiscal 2016, on March 15, 2016, the Compensation Committee approved the Destination XL Group, Inc. Long-Term Incentive Plan (the “New LTIP”).
The 2013-2016 LTIP and Wrap-Around Plans were primarily established to help retain the Company’s management team during its initial transition to its DXL store format, while tying any reward earned to the achievement of this long-term objective. As the Company continues with the DXL concept beyond the initial implementation/roll-out phase, the Compensation Committee has adopted the New LTIP to continue to align the Company with the best practices of similar long-term incentive plans of its peers. The New LTIP will continue to support the Company’s ongoing efforts to attract, retain and develop exceptional talent and enable it to provide incentives directly linked to the Company’s short- and long-term objectives as well as increased shareholder value.
Under the terms of the New LTIP, each year the Compensation Committee will establish performance targets which will cover a two-year performance period (each a “Performance Period”), thereby creating overlapping Performance Periods. Each participant in the plan will be entitled to receive an award based on that participant’s “Target Cash Value” which is defined as the participant’s annual base salary (on the participant’s effective date) multiplied by his or her long-term incentive program percentage, which is 100% for the Company’s executive officer, 70% for its senior executives and 25% for other participants in the plan. Because of the overlapping two-year Performance Period, the Target Cash Value for any award is based on one year of annual salary, as opposed to two years, to avoid doubling compensation in any given fiscal year.
For each participant, 50% of the Target Cash Value is subject to time-based vesting and 50% is subject to performance-based vesting. The time-vested portion of the award will vest in two installments with 50% of the time-vested portion vesting on April 1 following the fiscal year end which marks the end of the applicable Performance Period and 50% vesting on April 1 the succeeding year. The performance-based vesting is subject to the achievement of the performance target(s) for the applicable Performance Period. Any performance award granted will vest on August 31 following the end of the applicable Performance Period.
Because we are still in the process of converting to our DXL concept and will be continuing to open DXL retail and outlet stores while closing more of our Casual Male XL retail and outlet stores, the Compensation Committee believes that a two-year performance period with a subsequent six-month holding period is appropriate until we complete this conversion. As mentioned above, the time-based portion will vest over three years, with the second one-half of the time-based payout being made one-year after the end of the performance period.
The Compensation Committee established two performance targets for the 2016-2017 Performance Period under the New LTIP (the “2016-2017 LTIP”), each weighted 50%, and further approved that all awards under the 2016-2017 LTIP would be issued in restricted stock units. The performance targets for the 2016-2017 LTIP are:
|
|
Ø |
EBITDA for fiscal 2017, defined as earnings before interest, taxes, depreciation and amortization (minimum threshold 85% of target; maximum award 115% of target). |
15
The Compensation Committee sees these two metrics as key measures to ensure that our DXL strategy is successful. As mentioned above, with the substantial new store growth over the past three years, our depreciation costs have increased sharply, which has a short-term impact on net income (loss) and, therefore, EBITDA is a more meaningful measure which we think is best to use to determine how well our DXL concept is performing. Due to its importance in measuring our performance, there is some overlap between our short-term and long-term metrics as it relates to EBITDA. As with our 2016 AIP, we will disclose our targets once the performance period has ended.
|
|
· |
Discretionary Cash and Equity Awards |
There were no discretionary cash or equity awards granted to our Named Executive Officers in fiscal 2015.
In particular circumstances, we also utilize cash signing bonuses and equity-based awards when certain employees join the Company.
|
|
· |
Other Compensation |
In addition to our life insurance programs available to all of our employees, we also pay the insurance premium for an additional $2.0 million life insurance policy for Mr. Levin to the benefit of his designated beneficiaries.
We offer our senior executives, including our Named Executive Officers, supplemental disability insurance and long-term care and pay a portion of the premiums, which we do not do for our other employees.
Our Named Executive Officers also receive benefits under certain group health, long-term disability and life insurance plans, which are generally available to all of our eligible employees.
After six months of service with us, all of our employees, including our Named Executive Officers, are eligible to participate in our 401(k) Plan and after one year of employment, are eligible to receive a Company match. For fiscal 2015, we matched 100% of the first 1% of deferred compensation and 50% of the next 5% (with a maximum contribution of 3.5% of eligible compensation). Benefits under these plans are not tied to corporate performance.
|
|
· |
Termination Based Compensation |
We have employment agreements with our CEO and all of our other Named Executive Officers. Upon termination of employment, each executive is entitled to receive severance payments under his/her employment agreement(s) in the event of a termination without justifiable cause. These employment agreements are discussed in detail below in the section “Employment Agreements” following the “Summary Compensation Table.” Our employment agreements do not contain any tax gross-ups pursuant to Section 280(g) of the Internal Revenue Code.
|
|
· |
Tax Implications |
Under Section 162(m) of the Internal Revenue Code, certain executive compensation in excess of $1 million in any fiscal year is limited and is not deductible by the Company for federal income tax purposes unless the compensation qualifies as "performance-based compensation" under Section 162(m). The Compensation Committee will consider whether a form of compensation will be deductible under Section 162(m) in determining executive compensation, though other factors will also be considered. The Compensation Committee may authorize compensation payments that do not comply with the exemptions to Section 162(m) when it believes that such payments are appropriate to attract and retain executive talent.
Non-GAAP Financial Measures
The above discussion references non-GAAP measures that we use on a regular basis in order to track the progress of our business. These measures include adjusted net loss, adjusted net loss per diluted share, EBITDA and EBITDA from continuing operations (earnings before interest, taxes, depreciation and amortization and discontinued operations). We believe these measures provide helpful information with respect to the Company’s operating performance and cash flows. We believe that the inclusion of these non-GAAP measures is important to assist investors in comparing our Company’s performance in fiscal 2015 to fiscal 2014. In addition, we use EBITDA because it: (i) measures performance over the periods in which executives can have significant impact, (ii) is directly linked to our annual incentive plan and long-term growth plan, and (iii) is a key metric used by management and the Board to assess our operating performance. However, these measures may not be comparable to similar measures used by other companies and should not be considered superior to or as a substitute for operating income (loss), income (loss) from continuing operations, net income (loss) per diluted share or cash flows from operating activities in accordance with GAAP.
16
The following is a reconciliation of EBITDA and EBITDA from continuing operations from Net Loss, on a GAAP basis:
|
(in millions) |
|
Fiscal 2015 |
|
|
Fiscal 2014 |
|
|
Fiscal 2013 |
|
|||
|
Net loss, on a GAAP basis |
|
$ |
(8.7 |
) |
|
$ |
(12.3 |
) |
|
$ |
(59.8 |
) |
|
Add back: |
|
|
|
|
|
|
|
|
|
|
|
|
|
Provision for income taxes |
|
|
(0.3 |
) |
|
|
(0.2 |
) |
|
|
(45.7 |
) |
|
Interest Expense |
|
|
(3.3 |
) |
|
|
(2.1 |
) |
|
|
(1.0 |
) |
|
Depreciation and amortization |
|
|
(28.4 |
) |
|
|
(24.0 |
) |
|
|
(20.8 |
) |
|
EBITDA |
|
$ |
23.3 |
|
|
$ |
14.1 |
|
|
$ |
7.8 |
|
|
Income (loss) from discontinued operations |
|
|
- |
|
|
|
(1.1 |
) |
|
|
0.5 |
|
|
EBITDA from continuing operations |
|
$ |
23.3 |
|
|
$ |
15.2 |
|
|
$ |
7.3 |
|
The following is a reconciliation of loss from continuing operations to adjusted net loss, assuming a normal tax rate of 40% for both periods:
|
|
|
Fiscal 2015 |
|
|
Fiscal 2014 |
|
||||||||||
|
|
|
$ |
|
|
Per diluted share |
|
|
$ |
|
|
Per diluted share |
|
||||
|
(in millions, except per share data) |
|
|
|
|
|
|
|
|
|
|
|
|
|
|
|
|
|
Loss from continuing operations, on a GAAP basis |
|
$ |
(8.4 |
) |
|
$ |
(0.17 |
) |
|
$ |
(11.2 |
) |
|
$ |
(0.23 |
) |
|
Add back: |
|
|
|
|
|
|
|
|
|
|
|
|
|
|
|
|
|
Actual income tax provision |
|
|
0.3 |
|
|
|
— |
|
|
|
0.2 |
|
|
|
— |
|
|
Income tax benefit, assuming normal tax rate of 40% |
|
|
3.3 |
|
|
|
0.07 |
|
|
|
4.4 |
|
|
|
0.09 |
|
|
Adjusted loss from continuing operations, non-GAAP basis |
|
$ |
(4.9 |
) |
|
$ |
(0.10 |
) |
|
$ |
(6.6 |
) |
|
$ |
(0.13 |
) |
|
Loss from discontinued operations, GAAP basis |
|
|
- |
|
|
|
- |
|
|
|
(1.1 |
) |
|
|
(0.02 |
) |
|
Adjusted net loss, non-GAAP basis |
|
$ |
(4.9 |
) |
|
$ |
(0.10 |
) |
|
$ |
(7.7 |
) |
|
$ |
(0.16 |
) |
|
Weighted average number of common shares outstanding on a diluted basis |
|
|
|
|
|
|
49.1 |
|
|
|
|
|
|
|
48.7 |
|
17
We, the Compensation Committee of the Company, have reviewed and discussed the Compensation Discussion and Analysis required by Item 402(b) of Regulation S-K with management and, based on this review and discussion, recommend to the Board of Directors that the Compensation Discussion and Analysis be included in this Form 10-K/A.
|
|
The Compensation Committee *
|
|
|
George T. Porter, Jr., Chairman
|
|
|
Jesse Choper *
|
|
|
John E. Kyees * |
|
|
Willem Mesdag |
|
|
Ward K. Mooney
|
* Mr. Choper was a member of the Compensation Committee until January 30, 2016 and participated in the review and discussions relating to compensation for fiscal 2015 referred to in the Compensation Discussion and Analysis. Mr. Kyees became a member of the Compensation Committee on January 31, 2016.
18
Summary Compensation Table. The following Summary Compensation Table sets forth certain information regarding compensation paid or accrued by us with respect to our "Named Executive Officers" for fiscal 2015.
SUMMARY COMPENSATION TABLE
|
Name and Principal Position |
|
Year |
|
Salary ($) |
|
|
Bonus ($) |
|
|
Stock Awards ($) (1) (2) |
|
|
Option Awards ($) (1) (2) |
|
|
Non-Equity Incentive Plan Compensation ($)(1)(3) |
|
|
Change in Pension Value and Nonqualified Deferred Compensation Earnings ($) |
|
|
All Other Compensation ($)(4) |
|
|
Total ($) |
|
||||||||
|
David A. Levin |
|
2015 |
|
$ |
811,200 |
|
|
|
— |
|
|
|
— |
|
|
|
— |
|
|
$ |
1,174,618 |
|
|
|
— |
|
|
$ |
40,472 |
|
|
$ |
2,026,290 |
|
|
President and Chief Executive |
|
2014 |
|
$ |
811,200 |
|
|
|
— |
|
|
|
— |
|
|
|
— |
|
|
$ |
936,693 |
|
|
|
— |
|
|
$ |
40,470 |
|
|
$ |
1,788,363 |
|
|
Officer |
|
2013 |
|
$ |
811,200 |
|
|
|
— |
|
|
$ |
811,200 |
|
|
$ |
405,600 |
|
|
$ |
116,002 |
|
|
|
— |
|
|
$ |
38,460 |
|
|
$ |
2,182,462 |
|
|
|
|
|
|
|
|
|
|
|
|
|
|
|
|
|
|
|
|
|
|
|
|
|
|
|
|
|
|
|
|
|
|
|
|
|
|
Peter H. Stratton, Jr. (5) |
|
2015 |
|
$ |
285,000 |
|
|
|
— |
|
|
|
— |
|
|
|
— |
|
|
$ |
170,272 |
|
|
|
— |
|
|
$ |
24,565 |
|
|
$ |
479,837 |
|
|
Senior Vice President, Chief |
|
2014 |
|
$ |
257,443 |
|
|
|
— |
|
|
|
— |
|
|
|
— |
|
|
$ |
127,462 |
|
|
|
— |
|
|
$ |
24,347 |
|
|
$ |
409,252 |
|
|
Financial Officer and Treasurer |
|
|
|
|
|
|
|
|
|
|
|
|
|
|
|
|
|
|
|
|
|
|
|
|
|
|
|
|
|
|
|
|
|
|
|
|
|
|
|
|
|
|
|
|
|
|
|
|
|
|
|
|
|
|
|
|
|
|
|
|
|
|
|
|
|
|
|
|
|
|
|
Kenneth M. Ederle |
|
2015 |
|
$ |
380,769 |
|
|
|
— |
|
|
|
— |
|
|
|
— |
|
|
$ |
236,348 |
|
|
|
— |
|
|
$ |
21,850 |
|
|
$ |
638,967 |
|
|
Senior Vice President and Chief |
|
2014 |
|
$ |
343,269 |
|
|
|
— |
|
|
|
— |
|
|
|
— |
|
|
$ |
172,463 |
|
|
|
— |
|
|
$ |
21,662 |
|
|
$ |
537,394 |
|
|
Merchandising Officer - |
|
2013 |
|
$ |
313,462 |
|
|
|
— |
|
|
$ |
227,500 |
|
|
$ |
113,750 |
|
|
$ |
15,785 |
|
|
|
— |
|
|
$ |
21,473 |
|
|
$ |
691,970 |
|
|
Planning and Allocation |
|
|
|
|
|
|
|
|
|
|
|
|
|
|
|
|
|
|
|
|
|
|
|
|
|
|
|
|
|
|
|
|
|
|
|
Robert S. Molloy |
|
2015 |
|
$ |
335,000 |
|
|
|
— |
|
|
|
— |
|
|
|
— |
|
|
$ |
212,732 |
|
|
|
|
|
|
$ |
27,259 |
|
|
$ |
574,991 |
|
|
Senior Vice President, General |
|
2014 |
|
$ |
332,308 |
|
|
|
— |
|
|
|
— |
|
|
|
— |
|
|
$ |
163,878 |
|
|
|
— |
|
|
$ |
27,486 |
|
|
$ |
523,672 |
|
|
Counsel and Secretary |
|
2013 |
|
$ |
325,000 |
|
|
|
— |
|
|
$ |
227,500 |
|
|
$ |
113,750 |
|
|
$ |
16,266 |
|
|
|
— |
|
|
$ |
25,188 |
|
|
$ |
707,704 |
|
|
|
|
|
|
|
|
|
|
|
|
|
|
|
|
|
|
|
|
|
|
|
|
|
|
|
|
|
|
|
|
|
|
|
|
|
|
Brian S. Reaves |
|
2015 |
|
$ |
300,000 |
|
|
|
— |
|
|
|
— |
|
|
|
— |
|
|
$ |
188,260 |
|
|
|
— |
|
|
$ |
27,028 |
|
|
$ |
515,288 |
|
|
Senior Vice President and |
|
2014 |
|
$ |
293,269 |
|
|
|
— |
|
|
|
— |
|
|
|
— |
|
|
$ |
141,588 |
|
|
|
— |
|
|
$ |
27,219 |
|
|
$ |
462,076 |
|
|
Chief Sales Officer |
|
2013 |
|
$ |
275,000 |
|
|
|
— |
|
|
$ |
192,500 |
|
|
$ |
96,250 |
|
|
$ |
13,764 |
|
|
|
— |
|
|
$ |
24,400 |
|
|
$ |
601,914 |
|
|
|
(1) |
The amounts reflect the fair value, as of grant date, of non-performance awards computed in accordance with FASB ASC Topic 718, and not the actual amount paid to or realized by the Named Executive Officers during the applicable fiscal year. The fair value of each stock option award is estimated as of the date of grant using a Black-Scholes valuation model. Additional information regarding the assumptions used to estimate the fair value of all stock option awards is included in Note A to Consolidated Financial Statements contained in our Annual Report on Form 10-K for the fiscal year ended January 30, 2016. |
|
|
(2) |
Excluded from the Stock Awards and Option Awards columns are the fair values associated with the grant in fiscal 2013 of performance-based awards computed in accordance with FASB ASC Topic 718. As of January 30, 2016, the achievement of the performance targets were not deemed probable and, therefore, no compensation expense has been recognized through the end of fiscal 2015. As a result, the following fair values, at the highest performance level, associated with the grant of performance-based awards to each of the Named Executive Officers are not reflected in the table above: |
|
|
|
|
Stock Awards |
|
|
Option Awards |
|
|
David Levin |
|
|
$ 811,200 |
|
|
$ 405,600 |
|
|
Peter Stratton, Jr. |
|
|
140,000 |
|
|
70,000 |
|
|
Kenneth Ederle |
|
|
227,500 |
|
|
113,750 |
|
|
Robert Molloy |
|
|
227,500 |
|
|
113,750 |
|
|
Brian Reaves |
|
|
192,500 |
|
|
96,250 |
|
|
|
(3) |
Represents cash awards earned under the AIP and the time-vested cash portion of the 2013-2016 LTIP. See “2015 Non-Equity (Cash) Incentive Plan Compensation” for detail and the “Grants of Plan-Based Awards” table for the total estimated possible payouts over the term of the 2013-2016 LTIP. |
|
|
(4) |
See table “All Other Compensation” below for a breakdown. |
|
|
(5) |
Mr. Stratton was appointed Senior Vice President, Chief Financial Officer and Treasurer on June 1, 2014. |
19
The following table is a supplement to the Summary Compensation Table and provides a breakdown of the non-equity incentive-based awards earned by each Named Executive Officer in fiscal 2015.
2015 Non-Equity (Cash) Incentive Plan Compensation
|
|
|
Long-Term Incentive Plan (1) |
|
|
Annual Incentive Plan (2) |
|
Totals Non-Equity Incentive Plan Compensation |
|
||||
|
David A. Levin |
|
$ |
162,240 |
|
|
$ |
1,012,378 |
|
|
$ |
1,174,618 |
|
|
Peter H. Stratton, Jr. |
|
$ |
28,000 |
|
|
$ |
142,272 |
|
|
$ |
170,272 |
|
|
Kenneth M. Ederle |
|
$ |
45,500 |
|
|
$ |
190,848 |
|
|
$ |
236,348 |
|
|
Robert S. Molloy |
|
$ |
45,500 |
|
|
$ |
167,232 |
|
|
$ |
212,732 |
|
|
Brian S. Reaves |
|
$ |
38,500 |
|
|
$ |
149,760 |
|
|
$ |
188,260 |
|
|
|
(1) |
Each Named Executive Officer earned 40% of the time-based portion of the cash award under the 2013-2016 LTIP in fiscal 2015. |
|
|
(2) |
Each Named Executive Officer earned a cash bonus, with a payout of 124.8% of performance targets. |
The following table sets forth the components of All Other Compensation listed above in the Summary Compensation Table.
|
Name |
|
Year |
|
Auto Allowance |
|
|
401(k) Match |
|
|
|
|
Life Insurance Premiums |
|
|
Long-Term Healthcare Premiums |
|
|
Supplemental Disability Insurance |
|
|
Total Other Compensation |
|
||||||
|
David A. Levin |
|
2015 |
|
$ |
10,000 |
|
|
$ |
9,275 |
|
|
|
|
$ |
3,585 |
|
|
$ |
6,033 |
|
|
$ |
11,579 |
|
|
$ |
40,472 |
|
|
|
|
2014 |
|
$ |
10,000 |
|
|
$ |
9,100 |
|
|
|
|
$ |
3,255 |
|
|
$ |
6,536 |
|
|
$ |
11,579 |
|
|
$ |
40,470 |
|
|
|
|
2013 |
|
$ |
10,000 |
|
|
$ |
8,925 |
|
|
|
|
$ |
2,958 |
|
|
$ |
5,028 |
|
|
$ |
11,549 |
|
|
$ |
38,460 |
|
|
Peter H. Stratton, Jr. |
|
2015 |
|
$ |
8,400 |
|
|
$ |
9,275 |
|
|
|
|
$ |
— |
|
|
$ |
4,034 |
|
|
$ |
2,856 |
|
|
$ |
24,565 |
|
|
|
|
2014 |
|
$ |
8,400 |
|
|
$ |
9,100 |
|
|
|
|
$ |
— |
|
|
$ |
4,370 |
|
|
$ |
2,477 |
|
|
$ |
24,347 |
|
|
|
|
|
|
|
|
|
|
|
|
|
|
|
|
|
|
|
|
|
|
|
|
|
|
|
|
|
|
|
|
Kenneth M. Ederle |
|
2015 |
|
$ |
8,400 |
|
|
$ |
9,275 |
|
|
|
|
|
|
|
|
$ |
— |
|
|
$ |
4,175 |
|
|
$ |
21,850 |
|
|
|
|
2014 |
|
$ |
8,400 |
|
|
$ |
9,100 |
|
|
|
|
$ |
— |
|
|
$ |
— |
|
|
$ |
4,162 |
|
|
$ |
21,662 |
|
|
|
|
2013 |
|
$ |
8,400 |
|
|
$ |
8,925 |
|
|
|
|
$ |
— |
|
|
$ |
— |
|
|
$ |
4,148 |
|
|
$ |
21,473 |
|
|
Robert S. Molloy |
|
2015 |
|
$ |
8,400 |
|
|
$ |
9,275 |
|
|
|
|
$ |
— |
|
|
$ |
4,821 |
|
|
$ |
4,763 |
|
|
$ |
27,259 |
|
|
|
|
2014 |
|
$ |
8,400 |
|
|
$ |
9,100 |
|
|
|
|
$ |
— |
|
|
$ |
5,223 |
|
|
$ |
4,763 |
|
|
$ |
27,486 |
|
|
|
|
2013 |
|
$ |
8,400 |
|
|
$ |
8,925 |
|
|
|
|
$ |
— |
|
|
$ |
3,100 |
|
|
$ |
4,763 |
|
|
$ |
25,188 |
|
|
Brian S. Reaves |
|
2015 |
|
$ |
8,400 |
|
|
$ |
9,275 |
|
|
|
|
$ |
— |
|
|
$ |
4,715 |
|
|
$ |
4,638 |
|
|
$ |
27,028 |
|
|
|
|
2014 |
|
$ |
8,400 |
|
|
$ |
9,100 |
|
|
|
|
$ |
— |
|
|
$ |
5,107 |
|
|
$ |
4,612 |
|
|
$ |
27,219 |
|
|
|
|
2013 |
|
$ |
8,400 |
|
|
$ |
8,925 |
|
|
|
|
$ |
— |
|
|
$ |
2,463 |
|
|
$ |
4,612 |
|
|
$ |
24,400 |
|
20
Chief Executive Officer
We have an employment agreement with Mr. Levin, which was revised and restated as of November 5, 2009. The initial three-year term of Mr. Levin’s employment agreement (the “Employment Agreement”) was January 1, 2009 through December 31, 2011. On January 1, 2011 and thereafter on each anniversary of the employment agreement’s commencement date, the term is extended for a one-year period, making Mr. Levin’s employment agreement a rolling two-year agreement after the initial three-year term.
The Employment Agreement requires Mr. Levin to devote substantially all of his time and attention to our business as necessary to fulfill his duties. The Employment Agreement provides that Mr. Levin would be paid a base salary at annual rate of $811,200, with an annual automobile allowance of $10,000.
Mr. Levin is eligible to participate in our AIP at a target rate of 100% of his actual annual base salary, as defined in that plan, and in our LTIP at a target incentive rate of 100% of his combined actual annual base earnings for the incentive period. The Employment Agreement also provides for the payment of discretionary bonuses in such amounts as may be determined by the Compensation Committee or Board of Directors.
The Employment Agreement provides that in the event Mr. Levin’s employment is terminated by the Company at any time for any reason other than “justifiable cause” (as defined in the Employment Agreements), disability or death, or in the event Mr. Levin resigns with “good reason” (as defined in the Employment Agreement), we are required to pay Mr. Levin the following:
|
|
· |
A pro rata bonus under the AIP; |
|
|
· |
A pro-rata vesting of LTIP awards; and |
|
|
· |
A severance comprised as the sum of (1) Mr. Levin’s monthly base salary then in effect plus (2) a monthly amount calculated by dividing by twelve the average of the sum of (i) the annual incentive bonuses earned under the AIP and (ii) the cash amounts paid to Mr. Levin pursuant to the LTIP or the cash value of the options or stock issued to Mr. Levin, during each of the two most recent fiscal years, with the monthly sum of (1) plus (2) payable for 24 consecutive months. This severance benefit is conditioned upon Mr. Levin’s execution of a general release. |
The above-listed payments are not made if Mr. Levin is terminated with “justifiable cause,” if Mr. Levin resigns and such resignation is not for “good reason”, or Mr. Levin dies or becomes disabled; provided, however, that if Mr. Levin’s employment terminates by reason of death, disability or retirement on or after age 65, Mr. Levin shall be entitled to a pro-rata bonus under the AIP.
In the event Mr. Levin’s employment is terminated at any time within one year following a Change of Control (as defined in the Employment Agreement) other than for "justifiable cause," or if Mr. Levin resigns for “good reason”, Mr. Levin is entitled to receive a lump sum payment equal to the sum of two times his base salary, and two times his target annual incentive bonus under the AIP for the fiscal year in which the Change of Control occurs. Payments made under this provision are to be reduced if and to the extent necessary to avoid any payments or benefits to executive being treated as “excess parachute payments” within the meaning of Internal Revenue Code Section 280G(b)(i). This payment also is conditioned upon Mr. Levin’s execution of a general release.
The Employment Agreement contains confidentiality provisions pursuant to which Mr. Levin agrees not to disclose confidential information regarding our Company. The Employment Agreement also contains covenants pursuant to which he agrees, during the term of his employment and for a one-year period following the termination of his employment, not to have any connection with any business which is a specialty retailer that primarily distributes, sells or markets so-called “big and tall” apparel of any kind for men or which utilizes the “big and tall” retail or wholesale marketing concept as part of its business.
The Employment Agreement also provides that we will, during the term of employment, pay the insurance premiums under one or more life insurance policies on Mr. Levin’s life pursuant to an arrangement under which $2,000,000 of the death benefit under the policy or policies would be payable to Mr. Levin’s named beneficiary (with the executive officer making the election of the designated beneficiary) upon Mr. Levin’s death.
Senior Executives
We also have employment agreements with each of our Senior Executives (the “Sr. Exec. Employment Agreements”). The term of each employment agreement begins on the respective effective date and continues until terminated by either party. Our Senior Executives are eligible to participate in our AIP. During fiscal 2015, they participated at a target rate of 40% of their respective average base salaries. Senior Executives are also eligible to participate in our LTIPs at 70% of their respective average base salaries, as defined in the plan, depending on our performance (based on long-term performance goals). Each executive is entitled to vacation and to participate in and receive any other benefits customarily provided by us to our senior executives.
21
The Sr. Exec. Employment Agreements provide that in the event the executive officer’s employment is terminated by us at any time for any reason other than “justifiable cause” (as defined in the Sr. Exec. Employment Agreements), disability or death, we are required to pay the executive his or her then current base salary for five months after the effective date of such termination. This severance benefit is conditioned upon the senior executive’s execution of a general release.
The above-listed payments are not made if the senior executive is terminated with “justifiable cause,” the senior executive resigns, or the senior executive dies or becomes disabled.
In the event the senior executive’s employment is terminated at any time within one year following a Change of Control (as defined in the Sr. Exec. Employment Agreement) other than for "justifiable cause," or if the senior executive resigns for “good reason,” we shall pay the senior executive an amount equal to twelve months of executive’s highest base salary in effect at any time during the six month period ending on the date of the Change of Control. This payment also is conditioned upon the senior executive’s execution of a general release. Payments made under this provision are to be reduced if and to the extent necessary to avoid any payments or benefits to senior executive being treated as “excess parachute payments” within the meaning of Internal Revenue Code Section 280G(b)(i).
The Sr. Exec. Employment Agreements contain confidentiality provisions pursuant to which each senior executive agrees not to disclose confidential information regarding our Company. The Sr. Exec. Employment Agreements also contain covenants pursuant to which each senior executive agrees, during the term of his employment and for a one-year period following the termination of his employment, not to have any connection with any business which is a specialty retailer that primarily distributes, sells or markets so-called “big and tall” apparel of any kind for men or which utilizes the “big and tall” retail or wholesale marketing concept as part of its business.
Claw-Back Provision
Our employment agreements contain a “claw-back” provision which provides for remedies in the event we learn, after the executive’s termination by us, other than for “justifiable cause”, that his or her termination could have been terminated for “justifiable cause”. Pursuant to the employment agreements, an executive shall be required to pay to the Company all amounts paid to the executive other than such portion of an executive’s base salary and reimbursement of expenses accrued through the date of the termination; all vested and unvested awards, as defined therein, held by the executive shall immediately expire; and the executive shall be required to pay to the Company an amount equal to any gains resulting from the exercise or payment of any awards.
Subject to the implementation of final rules by the SEC, the Dodd-Frank Act requires that we implement a policy providing for the recovery of erroneously paid incentive-based compensation following a required accounting restatement. Once the final rules are issued by the SEC, we will revise, in a timely manner, the current claw-back provision of our employment agreements. In addition, under the Sarbanes-Oxley Act, our CEO and CFO are required to reimburse the Company for bonuses and other incentive compensation and stock sale profits if the Company is required to restate its financial statements, as a result of misconduct, due to material noncompliance with the financial reporting requirements of the securities laws.
Grants of Plan-Based Awards. The following table sets forth certain information with respect to plan-based awards granted to the Named Executive Officers in fiscal 2015.
2015 GRANTS OF PLAN-BASED AWARDS
|
|
|
|
|
Estimated Possible Payouts Under Non-Equity Incentive Plan Awards (1)(2) |
|
|
Estimated Possible Payouts Under Equity Incentive Plan Awards (2) |
|
|
All Other Stock Awards: Number of Shares of Stock |
|
|
All Other Option Awards: Number of Securities Underlying |
|
|
Exercise or Base Price of Option |
|
|
Grant Date Fair Value of Stock and Option |
|
||||||||||||||||||||||
|
|
|
Approval |
|
Threshold |
|
|
Target |
|
|
Maximum |
|
|
Threshold |
|
|
Target |
|
|
Maximum |
|
|
or Units |
|
|
Options |
|
|
Awards |
|
|
Awards |
|
||||||||||
|
|
|
Date |
|
($) |
|
|
($) |
|
|
($) |
|
|
($) |
|
|
($) |
|
|
($) |
|
|
(#) |
|
|
(#) |
|
|
($ / Sh) |
|
|
($) |
|
||||||||||
|
|
|
|
|
|
|
|
|
|
|
|
|
|
|
|
|
|
|
|
|
|
|
|
|
|
|
|
|
|
|
|
|
|
|
|
|
|
|
|
|
|
|
|
|
David A. Levin |
|
3/18/2015 |
|
$ |
466,440 |
|
|
$ |
811,200 |
|
|
$ |
1,216,800 |
|
|
|
— |
|
|
|
— |
|
|
|
— |
|
|
|
— |
|
|
|
— |
|
|
|
— |
|
|
|
— |
|
|
Peter H. Stratton, Jr. |
|
3/18/2015 |
|
$ |
65,550 |
|
|
$ |
114,000 |
|
|
$ |
171,000 |
|
|
|
— |
|
|
|
— |
|
|
|
— |
|
|
|
— |
|
|
|
— |
|
|
|
— |
|
|
|
— |
|
|
Kenneth M. Ederle |
|
3/18/2015 |
|
$ |
89,700 |
|
|
$ |
156,000 |
|
|
$ |
234,000 |
|
|
|
— |
|
|
|
— |
|
|
|
— |
|
|
|
— |
|
|
|
— |
|
|
|
— |
|
|
|
— |
|
|
Robert S. Molloy |
|
3/18/2015 |
|
$ |
77,050 |
|
|
$ |
134,000 |
|
|
$ |
201,000 |
|
|
|
— |
|
|
|
— |
|
|
|
— |
|
|
|
— |
|
|
|
— |
|
|
|
— |
|
|
|
— |
|
|
Brian S. Reaves |
|
3/18/2015 |
|
$ |
69,000 |
|
|
$ |
120,000 |
|
|
$ |
180,000 |
|
|
|
— |
|
|
|
— |
|
|
|
— |
|
|
|
— |
|
|
|
— |
|
|
|
— |
|
|
|
— |
|
22
Outstanding Equity Awards at Fiscal Year-End. The following table sets forth certain information with respect to outstanding equity awards held by the Named Executive Officers at the end of fiscal 2015.
2015 OUTSTANDING EQUITY AWARDS AT FISCAL YEAR-END
|
|
|
Option Awards |
|
Stock Awards |
|
|||||||||||||||||||||||||||||
|
|
|
Number of Securities Underlying Unexercised Options (#) |
|
|
Number of Securities Underlying Unexercised Options (#) |
|
|
Equity Incentive Plan Awards: Number of Securities Underlying Unexercised Unearned Options |
|
|
Option Exercise Price |
|
|
Option Expiration |
|
Number of Shares or Units of Stock That Have Not Vested |
|
|
Market Value of Shares or Units of Stock That Have Not Vested |
|
|
Equity Incentive Plan Awards: Number of Unearned Shares, Units or Other Rights That Have Not Vested |
|
|
Equity Incentive Plan Awards: Market or Payout Value of Unearned Shares, Units or Other Rights That Have Not Vested |
|
||||||||
|
Name |
|
Exercisable |
|
|
Unexercisable |
|
|
(#) |
|
|
($) |
|
|
Date |
|
(#) |
|
|
($)(1) |
|
|
(#) |
|
|
($)(1) |
|
||||||||
|
David A. Levin |
|
|
117,565 |
|
|
|
78,377 |
|
|
|
195,942 |
|
(3) |
$ |
5.04 |
|
|
5/28/2023 |
|
|
|
|
|
|
|
|
|
|
|
|
|
|
|
|
|
|
|
|
|
|
|
|
|
|
|
|
|
|
|
|
|
|
|
|
|
|
64,381 |
|
(2) |
$ |
276,838 |
|
|
|
160,952 |
|
(3) |
$ |
692,094 |
|
|
Peter H. Stratton, Jr. |
|
|
8,587 |
|
|
|
|
|
|
|
|
|
|
$ |
4.19 |
|
|
3/16/2021 |
|
|
|
|
|
|
|
|
|
|
|
|
|
|
|
|
|
|
|
|
20,289 |
|
|
|
13,527 |
|
|
|
33,816 |
|
(3) |
$ |
5.04 |
|
|
5/28/2023 |
|
|
|
|
|
|
|
|
|
|
|
|
|
|
|
|
|
|
|
|
|
|
|
|
|
|
|
|
|
|
|
|
|
|
|
|
|
|
11,111 |
|
(2) |
$ |
47,777 |
|
|
|
27,777 |
|
(3) |
$ |
119,441 |
|
|
Kenneth M. Ederle |
|
|
10,000 |
|
|
|
|
|
|
|
|
|
|
$ |
7.52 |
|
|
10/22/2017 |
|
|
|
|
|
|
|
|
|
|
|
|
|
|
|
|
|
|
|
|
32,970 |
|
|
|
21,981 |
|
|
|
54,951 |
|
(3) |
$ |
5.04 |
|
|
5/28/2023 |
|
|
|
|
|
|
|
|
|
|
|
|
|
|
|
|
|
|
|
|
|
|
|
|
|
|
|
|
|
|
|
|
|
|
|
|
|
|
18,056 |
|
(2) |
$ |
77,641 |
|
|
|
45,138 |
|
(3) |
$ |
194,093 |
|
|
Robert S. Molloy |
|
|
20,606 |
|
|
|
|
|
|
|
|
|
|
$ |
3.20 |
|
|
3/19/2020 |
|
|
|
|
|
|
|
|
|
|
|
|
|
|
|
|
|
|
|
|
13,955 |
|
|
|
|
|
|
|
|
|
|
$ |
4.19 |
|
|
3/16/2021 |
|
|
|
|
|
|
|
|
|
|
|
|
|
|
|
|
|
|
|
|
32,970 |
|
|
|
21,981 |
|
|
|
54,951 |
|
(3) |
$ |
5.04 |
|
|
5/28/2023 |
|
|
|
|
|
|
|
|
|
|
|
|
|
|
|
|
|
|
|
|
|
|
|
|
|
|
|
|
|
|
|
|
|
|
|
|
|
|
18,056 |
|
(2) |
$ |
77,641 |
|
|
|
45,138 |
|
(3) |
$ |
194,093 |
|
|
Brian S. Reaves |
|
|
17,183 |
|
|
|
|
|
|
|
|
|
|
$ |
4.19 |
|
|
3/16/2021 |
|
|
|
|
|
|
|
|
|
|
|
|
|
|
|
|
|
|
|
|
27,896 |
|
|
|
18,600 |
|
|
|
46,496 |
|
(3) |
$ |
5.04 |
|
|
5/28/2023 |
|
|
|
|
|
|
|
|
|
|
|
|
|
|
|
|
|
|
|
|
|
|
|
|
|
|
|
|
|
|
|
|
|
|
|
|
|
|
15,278 |
|
(2) |
$ |
65,695 |
|
|
|
38,194 |
|
(3) |
$ |
164,234 |
|
|
|
(1) |
The value of shares was calculated using the closing price of our common stock of $4.30 on January 30, 2016. |
|
|
(2) |
These equity awards represent awards granted on May 28, 2013 in connection with our 2013-2016 LTIP and represent the unvested portion of the time-based awards. |
|
|
(3) |
These equity awards represent awards granted on May 28, 2013 in connection with our 2013-2016 LTIP and represent unearned and unvested performance-based awards. See “Compensation Components, Fiscal 2015 Compensation Decisions, 2016 Annual Incentive Plan Targets and Long-Term Incentive Program –Long-Term Incentive Plans –2013-2016 Long-Term Incentive Plan” above for more information. |
23
Option Exercises and Stock Vested Table. The following table sets forth information for the Named Executive Officers with respect to the exercise of option awards and the vesting of stock awards during fiscal 2015.
2015 OPTION EXERCISES AND STOCK VESTED
|
|
|
Option Awards |
|
|
Stock Awards |
|
||||||||||
|
Name |
|
Number of shares Acquired on Exercise (#) |
|
|
Value Realized on Exercise ($)(1) |
|
|
Number of shares Vested (#) |
|
|
Value Realized on Vesting ($)(1) |
|
||||
|
David A. Levin |
|
|
- |
|
|
$ |
- |
|
|
|
64,381 |
|
|
$ |
276,838 |
|
|
Peter H. Stratton, Jr. |
|
|
- |
|
|
$ |
- |
|
|
|
11,111 |
|
|
$ |
47,777 |
|
|
Kenneth M. Ederle |
|
|
- |
|
|
$ |
- |
|
|
|
18,055 |
|
|
$ |
77,637 |
|
|
Robert S. Molloy |
|
|
- |
|
|
$ |
- |
|
|
|
18,055 |
|
|
$ |
77,637 |
|
|
Brian S. Reaves |
|
|
- |
|
|
$ |
- |
|
|
|
15,278 |
|
|
$ |
65,695 |
|
|
|
(1) |
The “Value Realized on Exercise” is the difference between the market price of the underlying security at exercise and the exercise price of the option. The “Value Realized on Vesting” is the market price of the underlying security on the date of vesting. The value realized is for informational purposes only and does not purport to represent that such individual actually sold the underlying shares, or that the underlying shares were sold on the date of exercise. Furthermore, such value realized does not take into consideration individual income tax consequences. |
Pension Benefits
None of our Named Executive Officers was a participant in any pension plan and, therefore, none has accumulated benefits.
Non-Qualified Deferred Compensation
We do not offer to our executive officers or employees any defined contribution or similar plan that provides for the deferral of compensation on a basis that is not tax-qualified. We offer a 401(k) saving plan to all of our employees eligible to participate, as further described below.
401(k) Plans
The Company has one defined contribution plan, the Destination XL Group, Inc. 401(k) Savings Plan (the “401(k) Plan”). Under the 401(k) Plan, the Company offers a qualified automatic contribution arrangement (“QACA”) with the Company matching 100% of the first 1% of deferred compensation and 50% of the next 5% (with a maximum contribution of 3.5% of eligible compensation). As of January 1, 2015, employees who are 21 years of age or older are eligible to make deferrals after 6 months of employment and are eligible to receive a Company match after one year of employment and 1,000 hours.
Our Named Executive Officers are eligible to participate in the 401(k) Plan, and the amount of any Company match to our Named Executive Officers is set forth above in the “All Other Compensation” table.
Key Man Insurance
We have a key man life insurance policy on the life of Mr. Levin in the amount of $2,000,000.
The Compensation Committee is responsible for reviewing and making recommendations to our Board of Directors with respect to the compensation paid to our non-employee directors.
In January 2010, the Company established a Non-Employee Director Stock Purchase Plan to provide a convenient method for its non-employee directors to acquire shares of the Company’s common stock at fair market value by voluntarily electing to receive shares of common stock in lieu of cash for service as a director. The substance of this plan is now encompassed within the Company’s Second Amended and Restated Non-Employee Director Compensation Plan (the “Non-Employee Director Compensation Plan”). There are 500,000 shares authorized for issuance under this plan for the sole purpose of satisfying elections to receive shares of common stock in lieu of cash for service as a director, of which 330,865 shares remain available for future issuances at January 30, 2016. The Non-Employee Director Compensation Plan is a stand-alone plan and is not a sub-plan under our 2006 Incentive Compensation Plan (the “2006 Plan”). Accordingly, shares issued under this plan do not reduce the shares available for issuance under the 2006 Plan.
With respect to the compensation of our non−employee directors, the Compensation Committee’s goal is to maintain a level of compensation paid to our non-employee directors that is in the median of the companies within our peer group as well as similarly-
24
sized companies. The Compensation Committee has historically retained Sibson Consulting, most recently in June 2013, to review compensation for our non-employee directors in comparison to our then peer group. As described above in “Compensation Discussion and Analysis – Use of Compensation Consultants,” the Compensation Committee has the authority to retain compensation consultants and other outside advisors, without Board or management approval, to assist it in carrying out its duties, including the evaluation of compensation for our non−employee directors. The Compensation Committee may accept, reject or modify any recommendations by compensation consultants or other outside advisors.
For fiscal 2015, our Non-Employee Director Compensation Plan provided that non-employee directors receive an annual retainer of $102,250, which is paid in quarterly installments of $25,562.50. Each director receives $1,500 for participation in each in-person meeting of the Board and its committees and $750 for participation in each telephonic meeting. In addition, the Chairmen of the Audit Committee, Compensation Committee and Nominating and Corporate Governance Committee receive an annual payment of $10,000, $5,000 and $5,000, respectively, which is paid quarterly. Upon the initial election to the Board, a non-employee director will receive a stock option grant of 15,000 shares under the 2006 Plan. On January 28, 2016, the Board formed the Cybersecurity and Data Privacy Committee to oversee the monitoring and management of cyber risk and data privacy in the Company. Members of the committee will receive $1,500 each in-person meeting and $750 for each telephonic meeting. The Chairman of the Cybersecurity and Data Privacy Committee will receive an annual payment of $5,000, paid in quarterly installments.
Beginning in fiscal 2015, each non-employee director was required to receive 50% of his or her annual retainer in equity, in the form of stock options, stock or deferred shares. Because the Non-Employee Director Compensation Plan is not a shareholder approved plan and the acquisition of equity must be voluntary under NASDAQ rules, we cannot utilize shares under this plan to satisfy this mandated election. Therefore, any grants of equity to satisfy this required election were issued from the 2006 Plan. Any voluntary election of shares, above this 50% retainer requirement, was issued from the Non-Employee Director Compensation Plan. Stock options and deferred shares will continue to be issued from the 2006 Plan.
We believe that our Non-Employee Director Compensation Plan will support our ongoing efforts to attract and retain exceptional directors to provide strategic guidance to our Company. We believe that the total compensation that our non-employee directors receive is in line with our current peer group.
Director Compensation Table
The following table sets forth the compensation paid to our directors during fiscal 2015. David A. Levin is not included in the following table as he is a Named Executive Officer and, accordingly, received no compensation for his services as a director. Compensation earned by Mr. Levin is included above in the “Summary Compensation Table.”
2015 DIRECTOR COMPENSATION TABLE
|
Name |
|
Fees Earned or Paid in Cash ($)(1) |
|
|
Option Awards ($)(2) |
|
|
All Other Compensation ($) |
|
|
Total ($) |
|
||||
|
Seymour Holtzman, Executive Chairman |
|
$ |
— |
|
|
$ |
— |
|
|
$ |
396,750 |
|
(3) |
$ |
396,750 |
|
|
Alan S. Bernikow |
|
$ |
115,000 |
|
|
$ |
— |
|
|
$ |
— |
|
|
$ |
115,000 |
|
|
Jesse Choper |
|
$ |
137,500 |
|
|
$ |
— |
|
|
$ |
— |
|
|
$ |
137,500 |
|
|
John E. Kyees |
|
$ |
107,500 |
|
|
$ |
— |
|
|
$ |
— |
|
|
$ |
107,500 |
|
|
Willem Mesdag |
|
$ |
117,250 |
|
|
$ |
— |
|
|
$ |
— |
|
|
$ |
117,250 |
|
|
Ward K. Mooney |
|
$ |
116,500 |
|
|
$ |
— |
|
|
$ |
— |
|
|
$ |
116,500 |
|
|
George T. Porter, Jr. |
|
$ |
117,750 |
|
|
$ |
— |
|
|
$ |
— |
|
|
$ |
117,750 |
|
|
Mitchell S. Presser |
|
$ |
112,750 |
|
|
$ |
— |
|
|
$ |
— |
|
|
$ |
112,750 |
|
|
Ivy Ross |
|
$ |
107,500 |
|
|
$ |
— |
|
|
$ |
5,000 |
|
(4) |
$ |
112,500 |
|
|
|
(1) |
All non-employee directors are required to receive at least 50% of their annual retainer in the form of equity. For fiscal 2015, Messrs. Bernikow, Choper, Mooney and Ms. Ross elected to receive 50% of their retainer in unrestricted shares of our common stock and Messrs. Kyees and Porter elected to receive deferred stock. Messrs. Presser and Mesdag elected to receive 100% of their retainers in unrestricted shares of our common stock. Messrs. Bernikow, Choper, Mooney, Porter and Ms. Ross elected to receive cash for all meetings and Messrs. Presser and Mesdag elected to receive shares of unrestricted stock. Mr. Kyees elected to receive his fees for meetings in a combination of 50% cash and 50% deferred shares of our common stock. The number of shares issued as payment for an earned director fee is determined by taking the director fee earned and dividing by the closing price of our common stock on the grant date. For quarterly retainer fees, the grant date is the first business day of each respective quarter. For meetings, the grant date is the last business day of the month in which the meeting occurred and for a director’s re-election to the board, the grant date is the last business day of the month in which such re-election occurs. Mr. Holtzman did not receive any payment for director meetings. |
25
|
|
(3) |
Mr. Holtzman received compensation from us pursuant to Employment and Chairman Compensation Agreement. See “Chairman Compensation” below for additional information. |
|
|
(4) |
Ms. Ross received a cash payment of $5,000, paid in quarterly installments, to serve as Chair to the Company’s Interim Marketing Advisory Group. |
Executive Chairman Compensation
As of August 7, 2014, Mr. Holtzman is compensated for his services pursuant to an Employment and Chairman Compensation Agreement. Pursuant to that agreement, Mr. Holtzman serves as both an employee of the Company, reporting to the Board of Directors, and, as Executive Chairman, with the duties of the Chairman of the Board set forth in the Company’s Fourth Amended and Restated By-Laws. The initial term of the agreement is for two years. Commencing August 7, 2015, the agreement can be automatically extended for an additional one-year term on each anniversary date. Accordingly, the current expiration date of the agreement is August 7, 2017. As compensation, Mr. Holtzman receives an annual base salary of $24,000 for his employment services and an annual compensation of $372,750 for his services as Executive Chairman. Sibson Consulting reviewed Mr. Holtzman’s compensation under this agreement and concluded that the total compensation was at the higher end of the range, when compared to our peer group. The Compensation Committee reviewed the Sibson report and approved the agreement and compensation.
Prior to this arrangement, Mr. Holtzman was compensated for his services pursuant to a consulting agreement with Jewelcor Management Inc. (“JMI”). Under the consulting agreement, Mr. Holtzman received the same compensation as above, $24,000 for his employment services and $372,750 for services as Chairman of the Board. Mr. Holtzman is the president and chief executive officer and, together with his wife, indirectly, the majority shareholder of JMI. The consulting agreement with JMI was terminated on August 7, 2014 in connection with the execution of the Employment and Chairman Compensation Agreement, discussed above.
If we engage Mr. Holtzman’s services to assist us in a specific and significant corporate transaction or event, the Compensation Committee, at its discretion, has the right to grant Mr. Holtzman a bonus for his additional services. No such bonus was granted during fiscal 2015.
Section 6.2(A) of our Fourth Amended and Restated By-Laws states that the Chairman of the Board is to preside at all meetings of the Board of Directors and stockholders of the Corporation and perform such other duties and functions as may from time to time be assigned by the Board of Directors.
Compensation Committee Interlocks and Insider Participation
For fiscal 2015, the members of the Compensation Committee were Messrs. Choper, Mesdag, Mooney and Porter. Mr. Choper resigned his position as a member of the Compensation Committee effective January 30, 2016. His seat was filled by Mr. Kyees on January 31, 2016. Persons serving on the Compensation Committee had no relationships with our Company in fiscal 2015 other than their relationship to us as directors entitled to the receipt of standard compensation as directors and members of certain committees of the Board and their relationship to us as beneficial owners of shares of our common stock and options exercisable for shares of common stock. No person serving on the Compensation Committee or on the Board of Directors is an executive officer of another entity for which an executive officer of ours serves on such entity’s board of directors or compensation committee.
26
Item 12. Security Ownership of Certain Beneficial Owners and Management and Related Stockholder Matters
The following table sets forth certain information with respect to persons known to us to be the beneficial owners of more than five percent of the issued and outstanding shares of our common stock as of May 13, 2016. We were informed that, except as indicated, each person has sole voting and investment power with respect to all shares of our common stock shown as beneficially owned by such person, subject to community property laws where applicable.
|
Name and Address of Beneficial Owner |
|
Number of |
|
Percent of |
|
|
Red Mountain Capital Partners, LLC |
|
7,560,125 |
(2) |
14.86 |
% |
|
Red Mountain Partners, L.P. |
|
|
|
|
|
|
RMCP GP LLC |
|
|
|
|
|
|
Red Mountain Capital Management, Inc. |
|
|
|
|
|
|
Willem Mesdag |
|
|
|
|
|
|
10100 Santa Monica Boulevard, Suite 925 |
|
|
|
|
|
|
Los Angeles, California 90067 |
|
|
|
|
|
|
|
|
|
|
|
|
|
RBC Global Asset Management (U.S.) Inc. |
|
6,371,490 |
(3) |
12.53 |
% |
|
50 South Sixth Street |
|
|
|
|
|
|
Suite 2350 |
|
|
|
|
|
|
Minneapolis, Minnesota 55402 |
|
|
|
|
|
|
|
|
|
|
|
|
|
Glenhill Advisors, LLC |
|
6,220,285 |
(4) |
12.23 |
% |
|
Glenn J. Krevlin |
|
|
|
|
|
|
Glenhill Capital Advisors, LLC |
|
|
|
|
|
|
Glenhill Capital Management, LLC |
|
|
|
|
|
|
Glenhill Capital Overseas Master Fund, LP |
|
|
|
|
|
|
600 Fifth Avenue, 11th Floor |
|
|
|
|
|
|
New York, New York 10020 |
|
|
|
|
|
|
|
|
|
|
|
|
|
Seymour Holtzman |
|
4,475,658 |
(5) |
8.80 |
% |
|
100 N. Wilkes Barre Blvd. |
|
|
|
|
|
|
Wilkes Barre, Pennsylvania 18702 |
|
|
|
|
|
|
|
|
|
|
|
|
|
|
(1) |
Beneficial ownership is determined in accordance with the rules of the SEC and generally includes voting or investment power with respect to securities. In computing the number of shares beneficially owned by a person and the percentage ownership of that person, shares of our common stock subject to options and warrants held by that person that are currently exercisable, or that become exercisable within 60 days, are deemed outstanding. Such shares, however, are not deemed outstanding for the purpose of computing the percentage ownership of any other person. Percentage ownership is based on 50,843,797 shares of our common stock outstanding as of May 13, 2016. |
|
|
(2) |
Based on a Form 4, dated February 1, 2016, stating that 7,522,354 shares are held directly by Red Mountain Partners, L.P., a Delaware limited partnership (“RMP”) and the remaining 22,771 shares are held directly by Red Mountain Capital Partners LLC, a Delaware limited liability company (“RMCP LLC”). RMP, RMCP LLC, RMCP GP LLC, a Delaware limited liability company (“RMCP GP”), Red Mountain Capital Management, Inc., a Delaware corporation (“RMCM”), and Willem Mesdag, a natural person and citizen of the United States of America, were the beneficial owners of the 7,560,125 shares of common stock. RMP has the sole power to vote or direct the vote, and the sole power to disclose or direct the disposition of these shares. RMCP GP, RMCP LLC, RMCM and Mr. Mesdag may be deemed to control RMP and may be deemed to beneficially own, and to have the power to vote or direct the vote, or dispose or direct the disposition of the these shares beneficially owned by RMP. Mr. Mesdag disclaims beneficial ownership of the shares beneficially owned by RMP, and RMCM disclaims beneficial ownership of all these shares. The number of shares of common stock in the table includes 15,000 shares subject to stock options exercisable within 60 days and excludes 5,109 shares of deferred stock held directly by Willem Mesdag. |
|
|
(3) |
Based on Amendment No. 7 to Schedule 13G, dated February 8, 2016, stating that RBC Global Asset Management (U.S.) Inc. was the beneficial owner of the number of shares of common stock set forth opposite its name in the table. |
27
|
|
were the beneficial owners of the number of shares of common stock set forth opposite their names in the table (except that Glenhill Capital Management, LLC indicates beneficial ownership of only 5,027,151 shares and Glenhill Capital Overseas Master Fund, LP indicates beneficial ownership of only 3,232,536 shares). Glenn J. Krevlin is the managing member and control person of Glenhill Advisors, LLC and is the sole shareholder of Krevlin Management, Inc. Krevlin Management, Inc. is the managing member of Glenhill Capital Advisors, LLC, which is the investment manager of Glenhill Capital Overseas Master Fund, LP, Glenhill Concentrated Long Master Fund LLC, and Glenhill Long Fund, LP, each (along with Mr. Krevlin) a security holder of the Company. Glenhill Advisors, LLC is the managing member of Glenhill Capital Management LLC. Glenhill Capital Management, LLC is the managing member of Glenhill Concentrated Long Master Fund, LLC, and Glenhill Long Fund GP, LLC, and is sole shareholder of Glenhill Capital Overseas GP, Ltd. Glenhill Capital Overseas GP, Ltd. is the general partner of Glenhill Capital Overseas Master Fund, LP. Glenhill Long GP, LCC is the general partner of Glenhill Long Fund, LP. |
|
|
(5) |
Based on a Form 4, dated April 8, 2013. |
28
Security Ownership of Management
The following table sets forth certain information as of May 13, 2016, with respect to our directors, our Named Executive Officers (as defined below under “Executive Compensation”) and our directors and executive officers as a group. Except as indicated, each person has sole voting and investment power with respect to all shares of our common stock shown as beneficially owned by such person, subject to community property laws where applicable.
|
Name and Title |
|
Number of |
|
Percent of |
|
|
Seymour Holtzman |
|
4,475,658 |
|
8.80 |
% |
|
Chairman of the Board |
|
|
|
|
|
|
David A. Levin |
|
1,336,552 |
(2) |
2.62 |
% |
|
Chief Executive Officer, President and Director |
|
|
|
|
|
|
Peter H. Stratton, Jr. |
|
106,236 |
(3) |
* |
|
|
Senior Vice President, Chief Financial Officer and Treasurer |
|
|
|
|
|
|
Kenneth M. Ederle |
|
170,831 |
(4) |
* |
|
|
Senior Vice President, Chief Merchandising Officer – Planning and Allocation |
|
|
|
|
|
|
Robert S. Molloy |
|
227,437 |
(5) |
* |
|
|
Senior Vice President, General Counsel and Secretary |
|
|
|
|
|
|
Brian S. Reaves |
|
134,530 |
(6) |
* |
|
|
Senior Vice President and Chief Sales Officer |
|
|
|
|
|
|
Alan S. Bernikow, Director |
|
68,829 |
(7) |
* |
|
|
Jesse Choper, Director |
|
121,189 |
(7) |
* |
|
|
John E. Kyees, Director |
|
45,372 |
(8) |
* |
|
|
Willem Mesdag, Director |
|
7,560,125 |
(9) |
14.86 |
% |
|
Ward K. Mooney, Director |
|
87,983 |
(7) |
* |
|
|
George T. Porter, Jr., Director |
|
134,551 |
(10) |
* |
|
|
Mitchell S. Presser, Director |
|
206,526 |
(7) |
* |
|
|
Ivy Ross, Director |
|
34,910 |
(11) |
* |
|
|
Directors and executive officers as a group (22 persons) |
|
15,667,295 |
(12) |
30.35 |
% |
|
* |
Less than 1% |
|
(1) |
Beneficial ownership is determined in accordance with the rules of the SEC and generally includes voting or investment power with respect to securities. In computing the number of shares beneficially owned by a person and the percentage ownership of that person, shares of our common stock subject to options and warrants held by that person that are currently exercisable, or that become exercisable within 60 days, are deemed outstanding. Such shares, however, are not deemed outstanding for the purpose of computing the percentage ownership of any other person. Percentage ownership is based on 50,843,797 shares of our common stock outstanding as of May 13, 2016. |
|
(2) |
Includes 117,565 shares subject to stock options exercisable within 60 days, 64,381 shares of unvested restricted stock and 160,952 shares of unvested restricted stock subject to performance pursuant to the 2013-2016 LTIP. |
|
(3) |
Includes 28,876 shares subject to stock options exercisable within 60 days, 11,111 shares of unvested restricted stock and 27,777 shares of unvested restricted stock subject to performance pursuant to the LTIP 2013-2016. |
|
(4) |
Includes 42,970 shares subject to stock options exercisable within 60 days, 18,056 shares of unvested restricted stock and 45,138 shares of unvested restricted stock subject to performance pursuant to the LTIP 2013-2016. |
|
(5) |
Includes 67,531 shares subject to stock options exercisable within 60 days, 18,056 shares of unvested restricted stock and 45,138 shares of unvested restricted stock subject to performance pursuant to the LTIP 2013-2016. |
|
(6) |
Includes 45,079 shares subject to stock options exercisable within 60 days, 15,278 shares of unvested restricted stock and 38,194 shares of unvested restricted stock subject to performance pursuant to the LTIP 2013-2016. |
|
(7) |
Includes 25,000 shares subject to stock options exercisable within 60 days. |
|
(8) |
Includes 43,648 shares subject to stock options exercisable within 60 days and excludes 26,939 shares of deferred stock. |
|
(9) |
Includes 15,000 shares subject to stock options exercisable within 60 days and excludes 5,109 shares of deferred stock. Mr. Mesdag is the president, sole executive officer, sole director and sole shareholder of Red Mountain Capital Management, Inc. With the exception of the stock options, all shares are held by Red Mountain Partners, L.P., a wholly-owned subsidiary of Red Mountain Capital Management, Inc. Mr. Mesdag, by virtue of his direct or indirect control of Red Mountain Partners, L.P., is deemed to beneficially own all of the securities reported held by Red Mountain Partners, L.P. |
|
(10) |
Includes 44,136 shares subject to stock options exercisable within 60 days and excludes 15,020 shares of deferred stock held by the George Porter Trust. Mr. Porter is the trustee of the trust and has all voting and investment rights. |
|
(11) |
Includes 15,000 shares subject to stock options exercisable within 60 days. |
29
EQUITY COMPENSATION PLAN INFORMATION
The following is a summary of information with respect to our equity compensation plans as of January 30, 2016:
|
Plan category |
|
Number of securities to be issued upon exercise of outstanding options, warrants and rights (a) |
|
|
Weighted-average exercise price of outstanding options, warrants and rights (b) |
|
|
Number of securities remaining available for future issuance under equity compensation plans (excluding securities reflected in column (a)) (c) |
|
|
|||
|
Equity compensation plans approved by security holders (1) |
|
|
2,728,621 |
|
|
$ |
5.00 |
|
|
|
1,014,685 |
|
(3) |
|
Equity compensation plans not approved by security holders (2) |
|
|
— |
|
|
|
— |
|
|
|
330,865 |
|
|
|
Total |
|
|
2,728,621 |
|
|
$ |
5.00 |
|
|
|
1,345,550 |
|
(3) |
|
|
(1) |
During fiscal 2015, we had one stockholder-approved equity compensation plan, our 2006 Incentive Compensation Plan (as amended, the “2006 Plan”). Pursuant to the 2006 Plan, at January 30, 2016, we had a total of 7,250,000 shares authorized for issuance, of which 1,014,685 shares were available for future issuances. The 2006 Plan will expire on August 1, 2016. The Company will submit a new equity compensation plan to shareholders for approval in August 2016. |
Of the 2,728,621 options outstanding at January 30, 2016, approximately 1,181,168 options are subject to the achievement of performance targets. At January 30, 2016, the performance targets were not deemed probable and as a result no compensation expense was recognized as of January 30, 2016. See “Compensation Discussion and Analysis- Compensation Components, Fiscal 2015 Compensation Decisions, 2016 Annual Incentive Plan Targets and Long-Term Incentive Programs” for more information.
|
|
(2) |
Pursuant to our Second Amended and Restated Non-Employee Director Compensation Plan (“Director Plan”), we have 500,000 shares authorized for stock issuances in lieu of cash director fees, of which 330,865 shares remained available at January 30, 2016. |
|
|
(3) |
Our 2006 Plan includes a limitation of 4,250,000 shares which may be issued in the form of restricted stock, deferred stock, performance awards or other stock-based awards. At January 30, 2016, 910,279 shares remained subject to this limitation. |
Subsequent to the end of fiscal 2015, in April 2016, we granted 427,874 time-based restricted stock units in connection with our 2016-2017 LTIP.
30
Item 13. Certain Relationships and Related Transactions, and Director Independence
Seymour Holtzman/Jewelcor Management, Inc.(JMI)
Seymour Holtzman, the Executive Chairman of the Company’s Board of Directors (the “Board”), is the chairman, chief executive officer and president and, together with his wife, indirectly, the majority shareholder of Jewelcor Management, Inc. (“JMI”).
Pursuant to an Employment and Chairman Compensation Agreement entered into on August 7, 2014, Mr. Holtzman serves as both an employee of the Company, reporting to the Board, and, in his capacity as Chairman of the Board, as Executive Chairman, with the duties of the Chairman of the Board as set forth in the Company’s Fourth Amended and Restated By-Laws. The initial term of the agreement is for two years. Commencing August 7, 2015, the agreement can be automatically extended for an additional one-year term on each anniversary date. Accordingly, the current expiration date of the agreement is August 7, 2017. As compensation for the employment services, Mr. Holtzman receives an annual base salary of $24,000 and, as compensation for his services as Executive Chairman, Mr. Holtzman receives annual compensation of $372,750.
Prior to the execution of the Employment and Chairman Compensation Agreement, from October 1999 through August 7, 2014, Mr. Holtzman was primarily compensated by the Company for his services pursuant to this Consulting Agreement between JMI and the Company (the “Consulting Agreement”). Under the terms of the Consulting Agreement at the time of its termination, Mr. Holtzman was entitled to receive annual consulting compensation of $372,750 and a salary of $24,000.
A complete summary of all compensation and consulting fees paid to Mr. Holtzman is described above under “Director Compensation- Executive Chairman Compensation.”
Review, Approval or Ratification of Transactions with Related Persons
Due to Mr. Holtzman’s role as our Executive Chairman of the Board of Directors and the relevance of the services he provides on a consulting basis, our Compensation Committee had the primary responsibility for reviewing and approving the Employment and Chairman Compensation Agreement dated August 7, 2014.
Our Audit Committee Charter, which was adopted in June 2003, provides that our Audit Committee shall review all related party transactions on an ongoing basis and all such transactions must be approved by the Audit Committee, to the extent required by the Sarbanes−Oxley Act of 2002, the Securities Exchange Commission and NASDAQ. Because NASDAQ provides that such oversight can be conducted by either a company’s audit committee or another independent body of the board of directors, the Audit Committee determined that due to the nature of Mr. Holtzman’s ownership in the Company as well as our previous consulting agreement with JMI the review and approval of all transactions pursuant to any arrangement with Mr. Holtzman would be the primary responsibility of the Compensation Committee.
For all other related party transactions, the review and approval of such transactions is the responsibility of our Audit Committee.
Director Independence
Our Board of Directors is currently comprised of ten members and there are no vacancies. A majority of the members of the Board are “independent” under the rules of the Nasdaq Global Select Market (“Nasdaq”). The Board has determined that the following directors are independent: Messrs. Bernikow, Choper, Kyees, Mesdag, Mooney, Porter, Presser and Ms. Ross.
31
Item 14. Principal Accounting Fees and Services
The Audit Committee engaged KPMG LLP to serve as our independent registered public accounting firm during the fiscal year ended January 30, 2016. KPMG LLP has served as the Company’s independent registered public accounting firm since June 6, 2013.
Principal Accounting Fees and Services
The following table sets forth the fees accrued or paid to the Company’s independent registered accounting firm for the fiscal years ended January 30, 2016 (“fiscal 2015”) and January 31, 2015 (“fiscal 2014”):
|
|
|
Fiscal 2015 |
|
|
Fiscal 2014 |
|
||
|
Audit fees (1) |
|
$ |
770,000 |
|
|
$ |
555,509 |
|
|
Audit-related fees |
|
|
— |
|
|
|
— |
|
|
Tax fees |
|
|
— |
|
|
|
— |
|
|
Other fees (2) |
|
|
1,650 |
|
|
|
1,650 |
|
|
Total fees |
|
$ |
771,650 |
|
|
$ |
557,159 |
|
|
|
(1) |
Audit fees relate to professional services rendered in connection with the audits of our financial statements included in our Annual Reports on Form 10-K for fiscal 2015 and fiscal 2014, for services performed related to compliance with Section 404 of the Sarbanes-Oxley Act of 2002, and for reviews of the financial statements included in each of our Quarterly Reports on Form 10-Q. |
|
|
(2) |
Other fees relate to an annual fee for online accounting research tool. |
Pre-Approval of Services by Independent Auditors
The Audit Committee has adopted a policy governing the provision of audit and non-audit services by our independent registered public accounting firm. Pursuant to this policy, the Audit Committee will consider annually and, if appropriate, approve the provision of audit services (including audit review and attest services) by our independent registered public accounting firm and consider and, if appropriate, pre-approve the provision of certain defined permitted non-audit services within a specified dollar limit. It will also consider on a case-by-case basis and, if appropriate, approve specific engagements that do not fit within the definition of pre-approved services or established fee limits.
The policy provides that any proposed engagement that does not fit within the definition of a pre-approved service or is not within the fee limits must be presented to the Audit Committee for consideration at its next regular meeting or to the Chairman of the Audit Committee in time sensitive cases. The Audit Committee will regularly review summary reports detailing all services (and related fees and expenses) being provided to us by the independent registered public accounting firm.
All of the services provided in fiscal 2015 and fiscal 2014 under Audit Fees and Other Fees were pre-approved by the Audit Committee.
32
PART IV.
Item 15. Exhibits, Financial Statement Schedules
15(a)(3) Exhibits
Index to Exhibits
|
31.1 |
Certification of Chief Executive Officer of the Company pursuant to Rule 13a-14(a) under the Securities Exchange Act of 1934. |
|
|
|
|
|
|
31.2 |
Certification of Chief Financial Officer of the Company pursuant to Rule 13a-14(a) under the Securities Exchange Act of 1934. |
|
|
|
|
|
|
|
|
|
33
Pursuant to the requirements of Section 13 or 15(d) of the Securities Exchange Act of 1934, the Company has duly caused this report to be signed on its behalf by the undersigned, thereunto duly authorized.
|
|
|
|
||
|
|
DESTINATION XL GROUP, INC. |
|||
|
May 31, 2016 |
|
|||
|
|
|
|
||
|
|
By: |
/s/ DAVID A. LEVIN |
||
|
|
|
David A. Levin President and Chief Executive Officer
|
||
|
|
|
/s/ PETER H. STRATTON, JR. |
||
|
|
|
Peter H. Stratton, Jr. |
||
|
|
|
Senior Vice President, Chief Financial Officer and Treasurer |
||
|
|
||||
34