Attached files
| file | filename |
|---|---|
| EX-99.1 - EX-99.1 - WESTERN DIGITAL CORP | d190658dex991.htm |
| 8-K - FORM 8-K - WESTERN DIGITAL CORP | d190658d8k.htm |
Exhibit 99.2
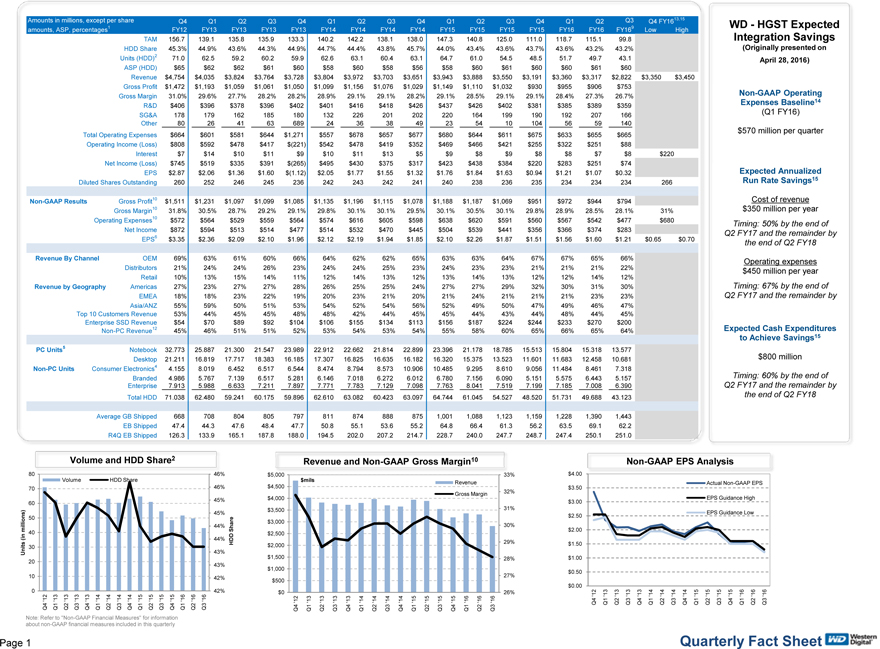
Amounts in millions, except per share amounts, ASP, percentages1 Q4 FY12 Q1 FY13 Q2 FY13 Q3 FY13 Q4 FY13 Q1 FY14 Q2 FY14 Q3 FY14 Q4 FY14 Q1 FY15 Q2 FY15 Q3 FY15 Q4 FY15 Q1 FY16 Q2 FY16 Q3 FY169 TAM 156.7 139.1 135.8 135.9 133.3 140.2 142.2 138.1 138.0 147.3 140.8 125.0 111.0 118.7 115.1 99.8 HDD Share 45.3% 44.9% 43.6% 44.3% 44.9% 44.7% 44.4% 43.8% 45.7% 44.0% 43.4% 43.6% 43.7% 43.6% 43.2% 43.2% Units (HDD)2 7 1.0 6 2.5 5 9.2 6 0.2 5 9.9 6 2.6 6 3.1 6 0.4 6 3.1 6 4.7 6 1.0 5 4.5 4 8.5 5 1.7 4 9.7 43.1 ASP (HDD) $65 $62 $62 $61 $60 $58 $60 $58 $56 $58 $60 $61 $60 $60 $61 $60 Revenue $4,754 $4,035 $3,824 $3,764 $3,728 $3,804 $3,972 $3,703 $3,651 $3,943 $3,888 $3,550 $3,191 $3,360 $3,317 $2,822 $3,350 $3,450 Gross Profit $1,472 $1,193 $1,059 $1,061 $1,050 $1,099 $1,156 $1,076 $1,029 $1,149 $1,110 $1,032 $930 $955 $906 $753 Gross Margin 31.0% 29.6% 27.7% 28.2% 28.2% 28.9% 29.1% 29.1% 28.2% 29.1% 28.5% 29.1% 29.1% 28.4% 27.3% 26.7% R&D $406 $396 $378 $396 $402 $401 $416 $418 $426 $437 $426 $402 $381 $385 $389 $359 SG&A 1 78 1 79 1 62 1 85 1 80 1 32 2 26 2 01 2 02 2 20 1 64 1 99 1 90 1 92 2 07 166 Other 8 0 26 41 63 6 89 24 36 38 49 23 54 10 1 04 56 59 140 Total Operating Expenses $664 $601 $581 $644 $1,271 $557 $678 $657 $677 $680 $644 $611 $675 $633 $655 $665 Operating Income (Loss) $808 $592 $478 $417 $(221) $542 $478 $419 $352 $469 $466 $421 $255 $322 $251 $88 Interest $7 $14 $10 $11 $9 $10 $11 $13 $5 $9 $8 $9 $8 $8 $7 $8 Net Income (Loss) $745 $519 $335 $391 $(265) $495 $430 $375 $317 $423 $438 $384 $220 $283 $251 $74 EPS $2.87 $2.06 $1.36 $1.60 $(1.12) $2.05 $1.77 $1.55 $1.32 $1.76 $1.84 $1.63 $0.94 $1.21 $1.07 $0.32 Diluted Shares Outstanding 2 60 2 52 2 46 2 45 2 36 2 42 2 43 2 42 2 41 2 40 2 38 2 36 2 35 2 34 2 34 234 Non-GAAP Results Gross Profit10 $1,511 $1,231 $1,097 $1,099 $1,085 $1,135 $1,196 $1,115 $1,078 $1,188 $1,187 $1,069 $951 $972 $944 $794 Gross Margin10 31.8% 30.5% 28.7% 29.2% 29.1% 29.8% 30.1% 30.1% 29.5% 30.1% 30.5% 30.1% 29.8% 28.9% 28.5% 28.1% Operating Expenses10 $572 $564 $529 $559 $564 $574 $616 $605 $598 $638 $620 $591 $560 $567 $542 $477 Net Income $872 $594 $513 $514 $477 $514 $532 $470 $445 $504 $539 $441 $356 $366 $374 $283 EPS6 $3.35 $2.36 $2.09 $2.10 $1.96 $2.12 $2.19 $1.94 $1.85 $2.10 $2.26 $1.87 $1.51 $1.56 $1.60 $1.21 $0.65 $0.70 Revenue By Channel OEM 69% 63% 61% 60% 66% 64% 62% 62% 65% 63% 63% 64% 67% 67% 65% 66% Distributors 21% 24% 24% 26% 23% 24% 24% 25% 23% 24% 23% 23% 21% 21% 21% 22% Retail 10% 13% 15% 14% 11% 12% 14% 13% 12% 13% 14% 13% 12% 12% 14% 12% Revenue by Geography Americas 27% 23% 27% 27% 28% 26% 25% 25% 24% 27% 27% 29% 32% 30% 31% 30% EMEA 18% 18% 23% 22% 19% 20% 23% 21% 20% 21% 24% 21% 21% 21% 23% 23% Asia/ANZ 55% 59% 50% 51% 53% 54% 52% 54% 56% 52% 49% 50% 47% 49% 46% 47% Q4 FY1613,15 Low High 31% $680 266 $220 WD - HGST Expected Integration Savings (Originally presented on April 28, 2016) Non-GAAP Operating Expenses Baseline14 (Q1 FY16) $570 million per quarter Expected Annualized Run Rate Savings15 Cost of revenue $350 million per year Timing: 50% by the end of Q2 FY17 and the remainder by the end of Q2 FY18 Operating expenses $450 million per year Timing: 67% by the end of Q2 FY17 and the remainder by Top 10 Customers Revenue 53% 44% 45% 45% 48% 48% 42% 44% 45% 45% 44% 43% 44% 48% 44% 45% Enterprise SSD Revenue $54 $70 $89 $92 $104 $106 $155 $134 $113 $156 $187 $224 $244 $233 $270 $200 Non-PC Revenue12 45% 46% 51% 51% 52% 53% 54% 53% 54% 55% 58% 60% 65% 66% 65% 64% PC Units5 Notebook 32.773 25.887 21.300 21.547 23.989 22.912 22.662 21.814 22.899 23.396 21.178 18.785 15.513 15.804 15.318 13.577 Desktop 21.211 16.819 17.717 18.383 16.185 17.307 16.825 16.635 16.182 16.320 15.375 13.523 11.601 11.683 12.458 10.681 Non-PC Units Consumer Electronics4 4.155 8.019 6.452 6.517 6.544 8.474 8.794 8.573 10.906 10.485 9.295 8.610 9.056 11.484 8.461 7.318 Branded 4.986 5.767 7.139 6.517 5.281 6.146 7.018 6.272 6.012 6.780 7.156 6.090 5.151 5.575 6.443 5.157 Enterprise 7.913 5.988 6.633 7.211 7.897 7.771 7.783 7.129 7.098 7.763 8.041 7.519 7.199 7.185 7.008 6.390 Total HDD 71.038 62.480 59.241 60.175 59.896 62.610 63.082 60.423 63.097 64.744 61.045 54.527 48.520 51.731 49.688 43.123 Average GB Shipped 6 68 7 08 8 04 8 05 7 97 8 11 8 74 8 88 8 75 1,001 1,088 1,123 1,159 1,228 1,390 1,443 EB Shipped 4 7.4 4 4.3 4 7.6 4 8.4 4 7.7 5 0.8 5 5.1 5 3.6 5 5.2 6 4.8 6 6.4 6 1.3 5 6.2 6 3.5 6 9.1 62.2 R4Q EB Shipped 126.3 133.9 165.1 187.8 188.0 194.5 202.0 207.2 214.7 228.7 240.0 247.7 248.7 247.4 250.1 251.0 $0 $500 $1,000 $1,500 $2,000 $2,500 $3,000 $3,500 $4,000 $4,500 $5,000 Q4 ‘12 Q1 ‘13 Q2 ‘13 Q3 ‘13 Q4 ‘13 Q1 ‘14 Q2 ‘14 Q3 ‘14 Q4 ‘14 Q1 ‘15 Q2 ‘15 Q3 ‘15 Q4 ‘15 Q1 ‘16 Q2 ‘16 Q3 ‘16 26% 27% 28% 29% 30% 31% 32% 33% Revenue Gross Margin Revenue and Non-GAAP Gross Margin10 $mils Q4 ‘12 Q1 ‘13 Q2 ‘13 Q3 ‘13 Q4 ‘13 Q1 ‘14 Q2 ‘14 Q3 ‘14 Q4 ‘14 Q1 ‘15 Q2 ‘15 Q3 ‘15 Q4 ‘15 Q1 ‘16 Q2 ‘16 Q3 ‘16 $0.00 $0.50 $1.00 $1.50 $2.00 $2.50 $3.00 $3.50 $4.00 Actual Non-GAAP EPS EPS Guidance High EPS Guidance Low Non-GAAP EPS Analysis Note: Refer to “Non-GAAP Financial Measures” for information about non-GAAP financial measures included in this 42% 42% 43% 43% 44% 44% 45% 45% 46% 46% 0 10 20 30 40 50 60 70 80 Q4 ‘12 Q1 ‘13 Q2 ‘13 Q3 ‘13 Q4 ‘13 Q1 ‘14 Q2 ‘14 Q3 ‘14 Q4 ‘14 Q1 ‘15 Q2 ‘15 Q3 ‘15 Q4 ‘15 Q1 ‘16 Q2 ‘16 Q3 ‘16 HDD Share Units (in millions) Volume HDD Share Volume and HDD Share2 Expected Cash Expenditures to Achieve Savings15 $800 million Timing: 60% by the end of Q2 FY17 and the remainder by the end of Q2 FY18 non quarterly Page 1 Quarterly Fact Sheet
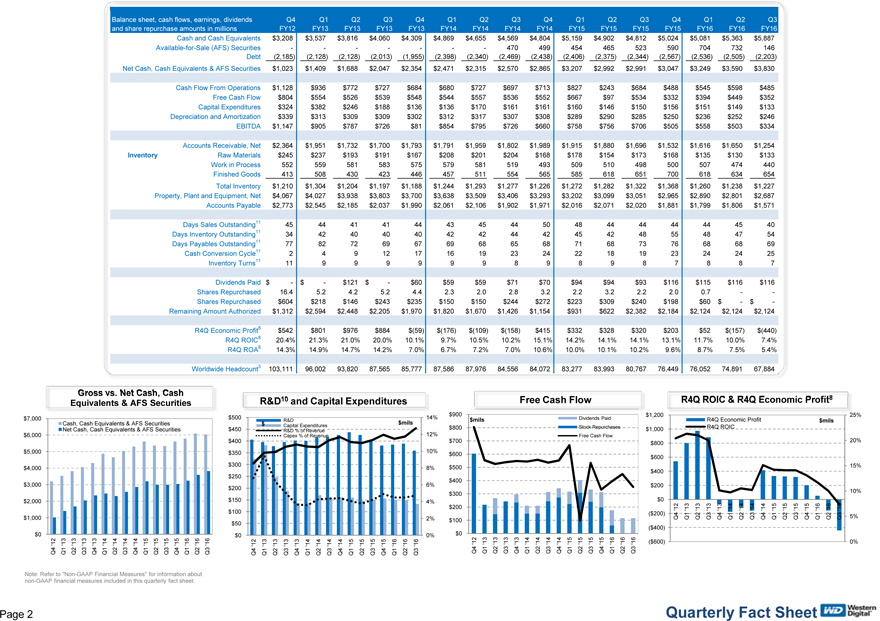
Balance sheet, cash flows, earnings, dividends and share repurchase amounts in millions Q4 FY12 Q1 FY13 Q2 FY13 Q3 FY13 Q4 FY13 Q1 FY14 Q2 FY14 Q3 FY14 Q4 FY14 Q1 FY15 Q2 FY15 Q3 FY15 Q4 FY15 Q1 FY16 Q2 FY16 Q3 FY16 Cash and Cash Equivalents $3,208 $3,537 $3,816 $4,060 $4,309 $4,869 $4,655 $4,569 $4,804 $5,159 $4,902 $4,812 $5,024 $5,081 $5,363 $5,887 Available-for-Sale (AFS) Securities 470 499 454 465 523 590 704 732 146 Debt (2,185) (2,128) (2,128) (2,013) (1,955) (2,398) (2,340) (2,469) (2,438) (2,406) (2,375) (2,344) (2,567) (2,536) (2,505) (2,203) Net Cash, Cash Equivalents & AFS Securities $1,023 $1,409 $1,688 $2,047 $2,354 $2,471 $2,315 $2,570 $2,865 $3,207 $2,992 $2,991 $3,047 $3,249 $3,590 $3,830 Cash Flow From Operations $1,128 $936 $772 $727 $684 $680 $727 $697 $713 $827 $243 $684 $488 $545 $598 $485 Free Cash Flow $804 $554 $526 $539 $548 $544 $557 $536 $552 $667 $97 $534 $332 $394 $449 $352 Capital Expenditures $324 $382 $246 $188 $136 $136 $170 $161 $161 $160 $146 $150 $156 $151 $149 $133 Depreciation and Amortization $339 $313 $309 $309 $302 $312 $317 $307 $308 $289 $290 $285 $250 $236 $252 $246 EBITDA $1,147 $905 $787 $726 $81 $854 $795 $726 $660 $758 $756 $706 $505 $558 $503 $334 Accounts Receivable, Net $2,364 $1,951 $1,732 $1,700 $1,793 $1,791 $1,959 $1,802 $1,989 $1,915 $1,880 $1,696 $1,532 $1,616 $1,650 $1,254 Inventory Raw Materials $245 $237 $193 $191 $167 $208 $201 $204 $168 $178 $154 $173 $168 $135 $130 $133 Work in Process 552 559 581 583 575 579 581 519 493 509 510 498 500 507 474 440 Finished Goods 413 508 430 423 446 457 511 554 565 585 618 651 700 618 634 654 Total Inventory $1,210 $1,304 $1,204 $1,197 $1,188 $1,244 $1,293 $1,277 $1,226 $1,272 $1,282 $1,322 $1,368 $1,260 $1,238 $1,227 Property, Plant and Equipment, Net $4,067 $4,027 $3,938 $3,803 $3,700 $3,638 $3,509 $3,406 $3,293 $3,202 $3,099 $3,051 $2,965 $2,890 $2,801 $2,687 Accounts Payable $2,773 $2,545 $2,185 $2,037 $1,990 $2,061 $2,106 $1,902 $1,971 $2,016 $2,071 $2,020 $1,881 $1,799 $1,806 $1,571 Days Sales Outstanding11 45 44 41 41 44 43 45 44 50 48 44 44 44 44 45 40 Days Inventory Outstanding11 34 42 40 40 40 42 42 44 42 45 42 48 55 48 47 54 Days Payables Outstanding11 77 82 72 69 67 69 68 65 68 71 68 73 76 68 68 69 Cash Conversion Cycle11 2 4 9 12 17 16 19 23 24 22 18 19 23 24 24 25 Inventory Turns11 11 9 9 9 9 9 9 8 9 8 9 8 7 8 8 7 Dividends Paid $ - $ - $121 $ - $60 $59 $59 $71 $70 $94 $94 $93 $116 $115 $116 $116 Shares Repurchased 16.4 5.2 4.2 5.2 4.4 2.3 2.0 2.8 3.2 2.2 3.2 2.2 2.0 0.7 - - Shares Repurchased $604 $218 $146 $243 $235 $150 $150 $244 $272 $223 $309 $240 $198 $60 $ - $ - Remaining Amount Authorized $1,312 $2,594 $2,448 $2,205 $1,970 $1,820 $1,670 $1,426 $1,154 $931 $622 $2,382 $2,184 $2,124 $2,124 $2,124 R4Q Economic Profit8 $542 $801 $976 $884 $(59) $(176) $(109) $(158) $415 $332 $328 $320 $203 $52 $(157) $(440) R4Q ROIC8 20.4% 21.3% 21.0% 20.0% 10.1% 9.7% 10.5% 10.2% 15.1% 14.2% 14.1% 14.1% 13.1% 11.7% 10.0% 7.4% R4Q ROA8 14.3% 14.9% 14.7% 14.2% 7.0% 6.7% 7.2% 7.0% 10.6% 10.0% 10.1% 10.2% 9.6% 8.7% 7.5% 5.4% Worldwide Headcount3 103,111 96,002 93,820 87,565 85,777 87,586 87,976 84,556 84,072 83,277 83,993 80,767 76,449 76,052 74,891 67,884 $0 $1,000 $2,000 $3,000 $4,000 $5,000 $6,000 $7,000 Q4 ‘12 Q1 ‘13 Q2 ‘13 Q3 ‘13 Q4 ‘13 Q1 ‘14 Q2 ‘14 Q3 ‘14 Q4 ‘14 Q1 ‘15 Q2 ‘15 Q3 ‘15 Q4 ‘15 Q1 ‘16 Q2 ‘16 Q3 ‘16 Cash, Cash Equivalents & AFS Securities Net Cash, Cash Equivalents & AFS Securities Gross vs. Net Cash, Cash Equivalents & AFS Securities Q4 ‘12 Q1 ‘13 Q2 ‘13 Q3 ‘13 Q4 ‘13 Q1 ‘14 Q2 ‘14 Q3 ‘14 Q4 ‘14 Q1 ‘15 Q2 ‘15 Q3 ‘15 Q4 ‘15 Q1 ‘16 Q2 ‘16 Q3 ‘16 $0 $100 $200 $300 $400 $500 $600 $700 $800 $900 Dividends Paid Stock Repurchases Free Cash Flow Free Cash Flow $0 $50 $100 $150 $200 $250 $300 $350 $400 $450 $500 Q4 ‘12 Q1 ‘13 Q2 ‘13 Q3 ‘13 Q4 ‘13 Q1 ‘14 Q2 ‘14 Q3 ‘14 Q4 ‘14 Q1 ‘15 Q2 ‘15 Q3 ‘15 Q4 ‘15 Q1 ‘16 Q2 ‘16 Q3 ‘16 0% 2% 4% 6% 8% 10% 12% R&D 14% Capital Expenditures R&D % of Revenue Capex % of Revenue R&D10 and Capital Expenditures $mils $mils 0% 5% 10% 15% 20% 25% Q4 ‘12 Q1 ‘13 Q2 ‘13 Q3 ‘13 Q4 ‘13 Q1 ‘14 Q2 ‘14 Q3 ‘14 Q4 ‘14 Q1 ‘15 Q2 ‘15 Q3 ‘15 Q4 ‘15 Q1 ‘16 Q2 ‘16 Q3 ‘16 ($600) ($400) ($200) $0 $200 $400 $600 $800 $1,000 $1,200 R4Q Economic Profit R4Q ROIC R4Q ROIC & R4Q Economic Profit8 $mils Note: Refer to “Non-GAAP Financial Measures” for information about non-GAAP financial measures included in this quarterly fact sheet. $ Page 2 Quarterly Fact Sheet
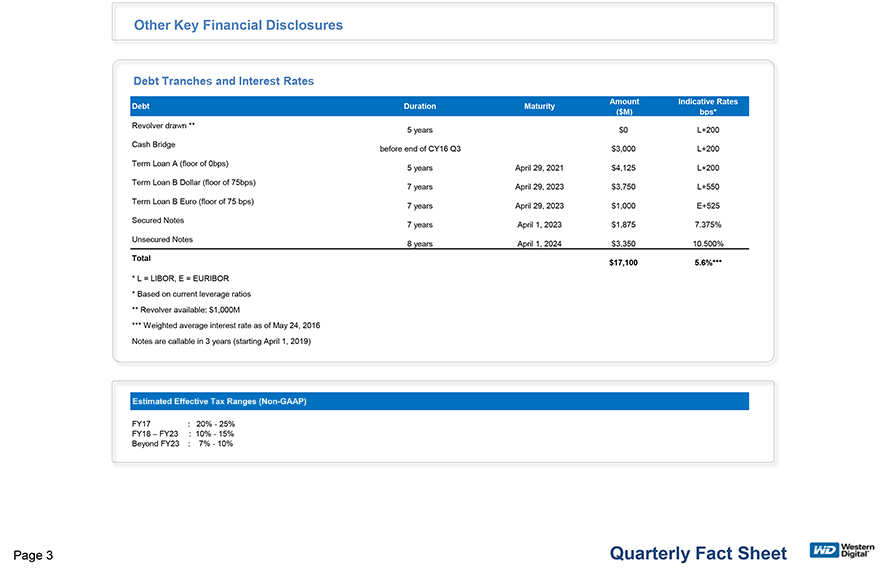
Other Key Financial Disclosures Debt Tranches and Interest Rates Debt Duration Maturity Amount ($M) Indicative Rates bps* Revolver drawn ** 5 years $0 L+200 Cash Bridge on/before end of CY16 Q3 $3,000 L+200 Term Loan A (floor of 0bps) 5 years April 29, 2021 $4,125 L+200 Term Loan B Dollar (floor of 75bps) 7 years April 29, 2023 $3,750 L+550 Term Loan B Euro (floor of 75 bps) 7 years April 29, 2023 $1,000 E+525 Secured Notes 7 years April 1, 2023 $1,875 7.375% Unsecured Notes 8 years April 1, 2024 $3,350 10.500% Total $17,100 5.6%*** * L = LIBOR, E = EURIBOR * Based on current leverage ratios ** Revolver available: $1,000M *** Weighted average interest rate as of May 24, 2016 Notes are callable in 3 years (starting April 1, 2019) Estimated Tax Ranges (Non-GAAP) FY17 : 20% - 25% FY18 – FY23 : 10% - 15% Beyond FY23 : 7% - 10%
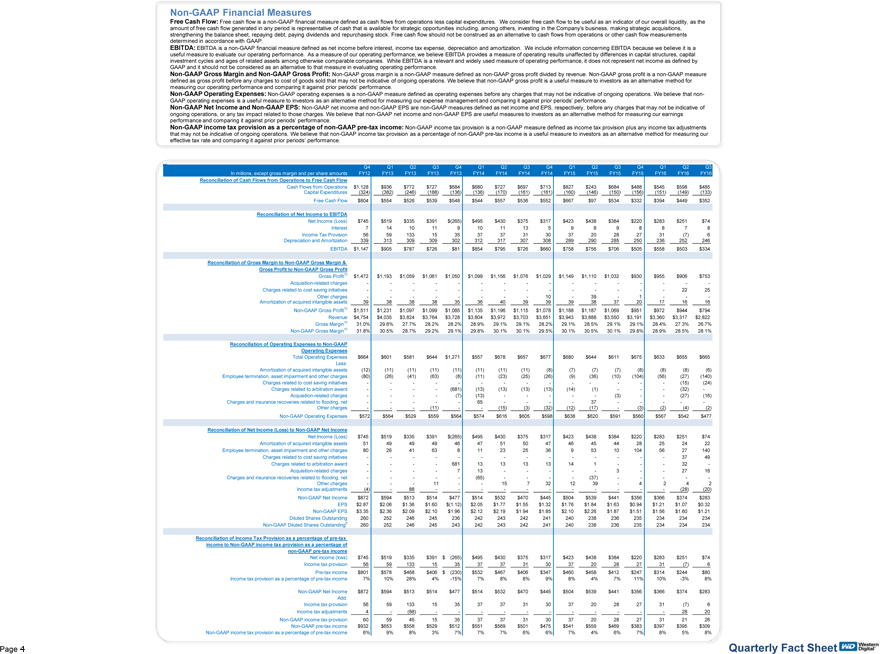
In millions, except gross margin and per share amounts Q4 FY12 Q1 FY13 Q2 FY13 Q3 FY13 Q4 FY13 Q1 FY14 Q2 FY14 Q3 FY14 Q4 FY14 Q1 FY15 Q2 FY15 Q3 FY15 Q4 FY15 Q1 FY16 Q2 FY16 Q3 FY16 Reconciliation of Cash Flows from Operations to Free Cash Flow Cash Flows from Operations $1,128 $936 $772 $727 $684 $680 $727 $697 $713 $827 $243 $684 $488 $545 $598 $485 Capital Expenditures (324) (382) (246) (188) (136) (136) (170) (161) (161) (160) (146) (150) (156) (151) (149) (133) Free Cash Flow $804 $554 $526 $539 $548 $544 $557 $536 $552 $667 $97 $534 $332 $394 $449 $352 Reconciliation of Net Income to EBITDA Net Income (Loss) $745 $519 $335 $391 $(265) $495 $430 $375 $317 $423 $438 $384 $220 $283 $251 $74 Interest 7 14 10 11 9 10 11 13 5 9 8 9 8 8 7 8 Income Tax Provision 56 59 133 15 35 37 37 31 30 37 20 28 27 31 ( 7) 6 Depreciation and Amortization 339 313 309 309 302 312 317 307 308 289 290 285 250 236 252 246 EBITDA $1,147 $905 $787 $726 $81 $854 $795 $726 $660 $758 $756 $706 $505 $558 $503 $334 Reconciliation of Gross Margin to Non-GAAP Gross Margin & Gross Profit to Non-GAAP Gross Profit Gross Profit10 $1,472 $1,193 $1,059 $1,061 $1,050 $1,099 $1,156 $1,076 $1,029 $1,149 $1,110 $1,032 $930 $955 $906 $753 Acquisition-related charges Charges related to cost saving initiatives 22 25 Other charges 10 - 39 - 1 - - - Amortization of acquired intangible assets 39 38 38 38 35 36 40 39 39 39 38 37 20 17 16 16 Non-GAAP Gross Profit10 $1 511 $1 231 $1 097 $1 099 $1 085 $1 135 $1 196 $1 115 $1 078 $1 188 $1 187 $1 069 $951 $972 $944 $794 Non-GAAP Financial Measures Free Cash Flow: Free cash flow is a non-GAAP financial measure defined as cash flows from operations less capital expenditures. We consider free cash flow to be useful as an indicator of our overall liquidity, as the amount of free cash flow generated in any period is representative of cash that is available for strategic opportunities including, among others, investing in the Company’s business, making strategic acquisitions, strengthening the balance sheet, repaying debt, paying dividends and repurchasing stock. Free cash flow should not be construed as an alternative to cash flows from operations or other cash flow measurements determined in accordance with GAAP. EBITDA: EBITDA is a non-GAAP financial measure defined as net income before interest, income tax expense, depreciation and amortization. We include information concerning EBITDA because we believe it is a useful measure to evaluate our operating performance. As a measure of our operating performance, we believe EBITDA provides a measure of operating results unaffected by differences in capital structures, capital investment cycles and ages of related assets among otherwise comparable companies. While EBITDA is a relevant and widely used measure of operating performance, it does not represent net income as defined by GAAP and it should not be considered as an alternative to that measure in evaluating operating performance. Non-GAAP Gross Margin and Non-GAAP Gross Profit: Non-GAAP gross margin is a non-GAAP measure defined as non-GAAP gross profit divided by revenue. Non-GAAP gross profit is a non-GAAP measure defined as gross profit before any charges to cost of goods sold that may not be indicative of ongoing operations. We believe that non-GAAP gross profit is a useful measure to investors as an alternative method for measuring our operating performance and comparing it against prior periods’ performance. Non-GAAP Operating Expenses: Non-GAAP operating expenses is a non-GAAP measure defined as operating expenses before any charges that may not be indicative of ongoing operations. We believe that non- GAAP operating expenses is a useful measure to investors as an alternative method for measuring our expense management and comparing it against prior periods’ performance. Non-GAAP Net Income and Non-GAAP EPS: Non-GAAP net income and non-GAAP EPS are non-GAAP measures defined as net income and EPS, respectively, before any charges that may not be indicative of ongoing operations, or any tax impact related to those charges. We believe that non-GAAP net income and non-GAAP EPS are useful measures to investors as an alternative method for measuring our earnings performance and comparing it against prior periods’ performance. Non-GAAP income tax provision as a percentage of non-GAAP pre-tax income: Non-GAAP income tax provision is a non-GAAP measure defined as income tax provision plus any income tax adjustments that may not be indicative of ongoing operations. We believe that non-GAAP income tax provision as a percentage of non-GAAP pre-tax income is a useful measure to investors as an alternative method for measuring our effective tax rate and comparing it against prior periods’ performance. Non Profit 1,511 1,231 1,097 1,099 1,085 1,135 1,196 1,115 1,078 1,188 1,187 1,069 Revenue $4,754 $4,035 $3,824 $3,764 $3,728 $3,804 $3,972 $3,703 $3,651 $3,943 $3,888 $3,550 $3,191 $3,360 $3,317 $2,822 Gross Margin10 31.0% 29.6% 27.7% 28.2% 28.2% 28.9% 29.1% 29.1% 28.2% 29.1% 28.5% 29.1% 29.1% 28.4% 27.3% 26.7% Non-GAAP Gross Margin10 31.8% 30.5% 28.7% 29.2% 29.1% 29.8% 30.1% 30.1% 29.5% 30.1% 30.5% 30.1% 29.8% 28.9% 28.5% 28.1% Reconciliation of Operating Expenses to Non-GAAP Operating Expenses Total Operating Expenses $664 $601 $581 $644 $1,271 $557 $678 $657 $677 $680 $644 $611 $675 $633 $655 $665 Less: Amortization of acquired intangible assets ( 12) (11) ( 11) ( 11) ( 11) ( 11) ( 11) ( 11) ( 8) ( 7) ( 7) ( 7) ( 8) ( 8) ( 8) (6) Employee termination, asset impairment and other charges ( 80) (26) ( 41) ( 63) ( 8) ( 11) ( 23) ( 25) ( 26) ( 9) ( 36) ( 10) ( 104) ( 56) ( 27) (140) Charges related to cost saving initiatives ( 15) (24) Charges related to arbitration award ( 681) ( 13) ( 13) ( 13) ( 13) ( 14) ( 1) ( 32) - Acquisition-related charges ( 7) ( 13) ( 3) ( 27) (16) Charges and insurance recoveries related to flooding, net 65 37 Other charges - - - (11) - - (15) ( 3) ( 32) (12) (17) - (3) (2) (4) (2) Non-GAAP Operating Expenses $572 $564 $529 $559 $564 $574 $616 $605 $598 $638 $620 $591 $560 $567 $542 $477 Reconciliation of Net Income (Loss) to Non-GAAP Net Income Net Income (Loss) $745 $519 $335 $391 $(265) $495 $430 $375 $317 $423 $438 $384 $220 $283 $251 $74 Amortization of acquired intangible assets 51 49 49 49 46 47 51 50 47 46 45 44 28 25 24 22 Employee termination, asset impairment and other charges 80 26 41 63 8 11 23 25 36 9 53 10 104 56 27 140 Charges related to cost saving initiatives - - 37 49 Charges related to arbitration award 681 13 13 13 13 14 1 32 - Acquisition-related charges 7 13 - 3 - - 27 16 Charges and insurance recoveries related to flooding, net ( 65) ( 37) - Other charges - - - 11 - - 15 7 32 12 39 - 4 2 4 2 Income tax adjustments (4) - 88 - - - (28) (20) Non-GAAP Net Income $872 $594 $513 $514 $477 $514 $532 $470 $445 $504 $539 $441 $356 $366 $374 $283 EPS $2.87 $2.06 $1.36 $1.60 $(1.12) $2.05 $1.77 $1.55 $1.32 $1.76 $1.84 $1.63 $0.94 $1.21 $1.07 $0.32 Non-GAAP EPS $3.35 $2.36 $2.09 $2.10 $1.96 $2.12 $2.19 $1.94 $1.85 $2.10 $2.26 $1.87 $1.51 $1.56 $1.60 $1.21 Diluted Shares Outstanding 260 252 246 245 236 242 243 242 241 240 238 236 235 234 234 234 Non-GAAP Diluted Shares Outstanding6 260 252 246 245 243 242 243 242 241 240 238 236 235 234 234 234 Reconciliation of Income Tax Provision as a percentage of pre-tax income to Non-GAAP income tax provision as a percentage of non-GAAP pre-tax income Net income (loss) $745 $519 $335 $391 $ ( 265) $495 $430 $375 $317 $423 $438 $384 $220 $283 $251 $74 Income tax provision 56 59 133 15 35 37 37 31 30 37 20 28 27 31 ( 7) 6 Pre-tax income $801 $578 $468 $406 $ ( 230) $532 $467 $406 $347 $460 $458 $412 $247 $314 $244 $80 Income tax provision as a percentage of pre-tax income 7% 10% 28% 4% -15% 7% 8% 8% 9% 8% 4% 7% 11% 10% -3% 8% Non-GAAP Net Income $872 $594 $513 $514 $477 $514 $532 $470 $445 $504 $539 $441 $356 $366 $374 $283 Add: Income tax provision 56 59 133 15 35 37 37 31 30 37 20 28 27 31 ( 7) 6 Income tax adjustments 4 - ( 88) - - - 28 20 Non-GAAP income tax provision 60 59 45 15 35 37 37 31 30 37 20 28 27 31 21 26 Non-GAAP pre-tax income $932 $653 $558 $529 $512 $551 $569 $501 $475 $541 $559 $469 $383 $397 $395 $309 Non-GAAP income tax provision as a percentage of pre-tax income 6% 9% 8% 3% 7% 7% 7% 6% 6% 7% 4% 6% 7% 8% 5% 8% Page 3 Quarterly Fact Sheet
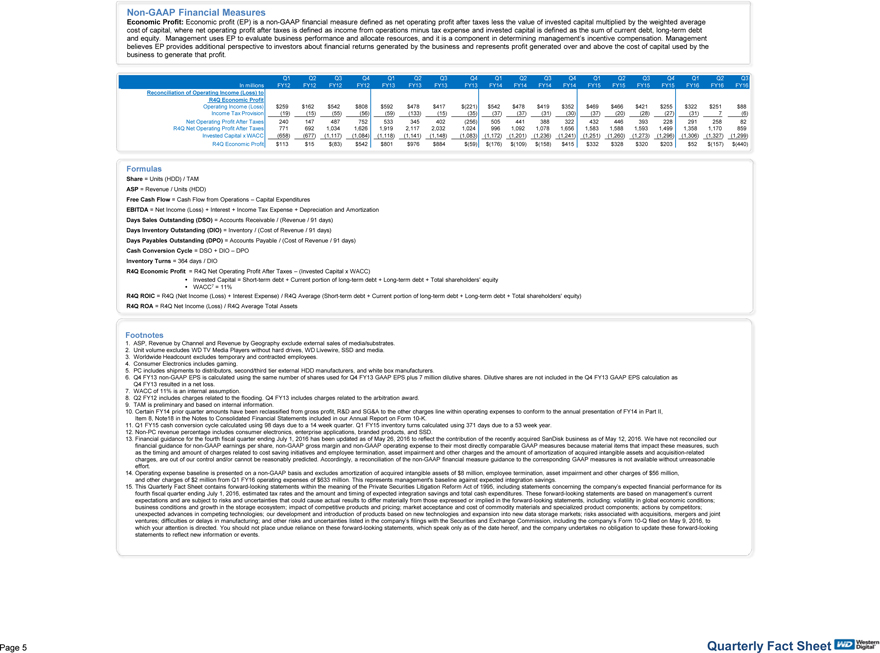
In millions Q1 FY12 Q2 FY12 Q3 FY12 Q4 FY12 Q1 FY13 Q2 FY13 Q3 FY13 Q4 FY13 Q1 FY14 Q2 FY14 Q3 FY14 Q4 FY14 Q1 FY15 Q2 FY15 Q3 FY15 Q4 FY15 Q1 FY16 Q2 FY16 Q3 FY16 Reconciliation of Operating Income (Loss) to R4Q Economic Profit Operating Income (Loss) $259 $162 $542 $808 $592 $478 $417 $(221) $542 $478 $419 $352 $469 $466 $421 $255 $322 $251 $88 Income Tax Provision (19) (15) (55) (56) (59) (133) (15) (35) (37) (37) (31) (30) (37) (20) (28) (27) (31) 7 (6) Net Operating Profit After Taxes 240 147 487 752 533 345 402 (256) 505 441 388 322 432 446 393 228 291 258 82 R4Q Net Operating Profit After Taxes 771 692 1,034 1,626 1,919 2,117 2,032 1,024 996 1,092 1,078 1,656 1,583 1,588 1,593 1,499 1,358 1,170 859 Invested Capital x WACC (658) ( 677) (1,117) (1,084) (1,118) (1,141) (1,148) (1,083) (1,172) (1,201) (1,236) (1,241) (1,251) (1,260) (1,273) (1,296) (1,306) (1,327) (1,299) R4Q Economic Profit $113 $15 $(83) $542 $801 $976 $884 $(59) $(176) $(109) $(158) $415 $332 $328 $320 $203 $52 $(157) $(440) Formulas Share = Units (HDD) / TAM ASP = Revenue / Units (HDD) Free Cash Flow = Cash Flow from Operations – Capital Expenditures EBITDA = Net Income (Loss) + Interest + Income Tax Expense + Depreciation and Amortization Days Sales Outstanding (DSO) = Accounts Receivable / (Revenue / 91 days) Days Inventory Outstanding (DIO) = Inventory / (Cost of Revenue / 91 days) Days Payables Outstanding (DPO) = Accounts Payable / (Cost of Revenue / 91 days) Cash Conversion Cycle = DSO + DIO – DPO Inventory Turns = 364 days / DIO R4Q Economic Profit = R4Q Net Operating Profit After Taxes – (Invested Capital x WACC) Invested Capital = Short-term debt + Current portion of long-term debt + Long-term debt + Total shareholders’ equity WACC7 = 11% R4Q ROIC = R4Q (Net Income (Loss) + Interest Expense) / R4Q Average (Short-term debt + Current portion of long-term debt + Long-term debt + Total shareholders’ equity) R4Q ROA = R4Q Net Income (Loss) / R4Q Average Total Assets Non-GAAP Financial Measures Economic Profit: Economic profit (EP) is a non-GAAP financial measure defined as net operating profit after taxes less the value of invested capital multiplied by the weighted average cost of capital, where net operating profit after taxes is defined as income from operations minus tax expense and invested capital is defined as the sum of current debt, long-term debt and equity. Management uses EP to evaluate business performance and allocate resources, and it is a component in determining management’s incentive compensation. Management believes EP provides additional perspective to investors about financial returns generated by the business and represents profit generated over and above the cost of capital used by the business to generate that profit. Footnotes 1. ASP, Revenue by Channel and Revenue by Geography exclude external sales of media/substrates. 2. Unit volume excludes WD TV Media Players without hard drives, WD Livewire, SSD and media. 3. Worldwide Headcount excludes temporary and contracted employees. 4. Consumer Electronics includes gaming. 5. PC includes shipments to distributors, second/third tier external HDD manufacturers, and white box manufacturers. 6. Q4 FY13 non-GAAP EPS is calculated using the same number of shares used for Q4 FY13 GAAP EPS plus 7 million dilutive shares. Dilutive shares are not included in the Q4 FY13 GAAP EPS calculation as Q4 FY13 resulted in a net loss. 7. WACC of 11% is an internal assumption. 8. Q2 FY12 includes charges related to the flooding. Q4 FY13 includes charges related to the arbitration award. 9. TAM is preliminary and based on internal information. 10. Certain FY14 prior quarter amounts have been reclassified from gross profit, R&D and SG&A to the other charges line within operating expenses to conform to the annual presentation of FY14 in Part II, Item 8, Note18 in the Notes to Consolidated Financial Statements included in our Annual Report on Form 10-K. 11. Q1 FY15 cash conversion cycle calculated using 98 days due to a 14 week quarter. Q1 FY15 inventory turns calculated using 371 days due to a 53 week year. 12. Non-PC revenue percentage includes consumer electronics, enterprise applications, branded products, and SSD. 13. Financial guidance for the fourth fiscal quarter ending July 1, 2016 has been updated as of May 26, 2016 to reflect the contribution of the recently acquired SanDisk business as of May 12, 2016. We have not reconciled our financial guidance for non-GAAP earnings per share, non-GAAP gross margin and non-GAAP operating expense to their most directly comparable GAAP measures because material items that impact these measures, such as the timing and amount of charges related to cost saving initiatives and employee termination, asset impairment and other charges and the amount of amortization of acquired intangible assets and acquisition-related charges, are out of our control and/or cannot be reasonably predicted. Accordingly, a reconciliation of the non-GAAP financial measure guidance to the corresponding GAAP measures is not available without unreasonable effort. 14. Operating expense baseline is presented on a non-GAAP basis and excludes amortization of acquired intangible assets of $8 million, employee termination, asset impairment and other charges of $56 million, and other charges of $2 million from Q1 FY16 operating expenses of $633 million. This represents management’s baseline against expected integration savings. 15. This Quarterly Fact Sheet contains forward-looking statements within the meaning of the Private Securities Litigation Reform Act of 1995, including statements concerning the company’s expected financial performance for its fourth fiscal quarter ending July 1, 2016, estimated tax rates and the amount and timing of expected integration savings and total cash expenditures. These forward-looking statements are based on management’s current expectations and are subject to risks and uncertainties that could cause actual results to differ materially from those expressed or implied in the forward-looking statements, including: volatility in global economic conditions; business conditions and growth in the storage ecosystem; impact of competitive products and pricing; market acceptance and cost of commodity materials and specialized product components; actions by competitors; unexpected advances in competing technologies; our development and introduction of products based on new technologies and expansion into new data storage markets; risks associated with acquisitions, mergers and joint ventures; difficulties or delays in manufacturing; and other risks and uncertainties listed in the company’s filings with the Securities and Exchange Commission, including the company’s Form 10-Q filed on May 9, 2016, to which your attention is directed. You should not place undue reliance on these forward-looking statements, which speak only as of the date hereof, and the company undertakes no obligation to update these forward-looking statements to reflect new information or events. Page 5 Quarterly Fact Sheet