Attached files
| file | filename |
|---|---|
| 8-K - 8-K - WAYNE SAVINGS BANCSHARES INC /DE/ | c440858_8k.htm |
Exhibit 99.1

Annual Shareholders’ Meeting Annual Shareholders ’ Meeting May 26, 2016
Forward Looking Statements In addition to the historical information contained herein, the following discussion contains forward - looking statements that involve risks and uncertainties . Economic circumstances, the Company’s operations, and actual results could differ significantly from those discussed in forward - looking statements . Some of the factors that could cause or contribute to such differences are discussed herein but also include changes in the economy and interest rates in the nation and the Company’s general market area . The forward - looking statements contained herein include, but are not limited to, those with respect to the following matters : ( 1 ) management’s determination of the amount and adequacy of the allowance for loan losses ; ( 2 ) the effect of changes in interest rates ; ( 3 ) management’s opinion as to the effects of recent accounting pronouncements on the Company’s consolidated financial statements ; and ( 4 ) management’s opinion as to the Bank’s ability to maintain regulatory capital at current levels .
Call to order Peggy J. Schmitz Chair, Board of Directors
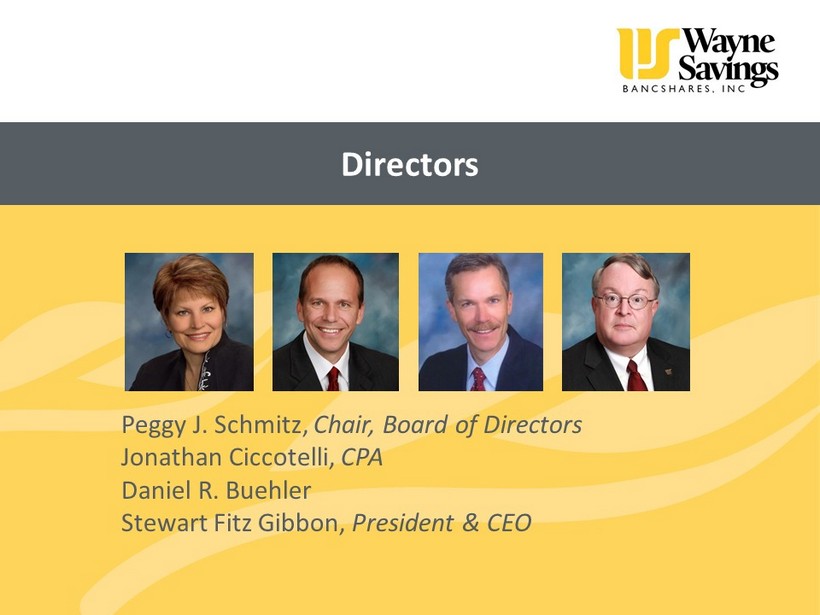
Directors Peggy J. Schmitz, Chair, Board of Directors Jonathan Ciccotelli, CPA Daniel R. Buehler Stewart Fitz Gibbon, President & CEO

Directors David L. Lehman Debra A. Marthey Glenn W. Miller, CPA
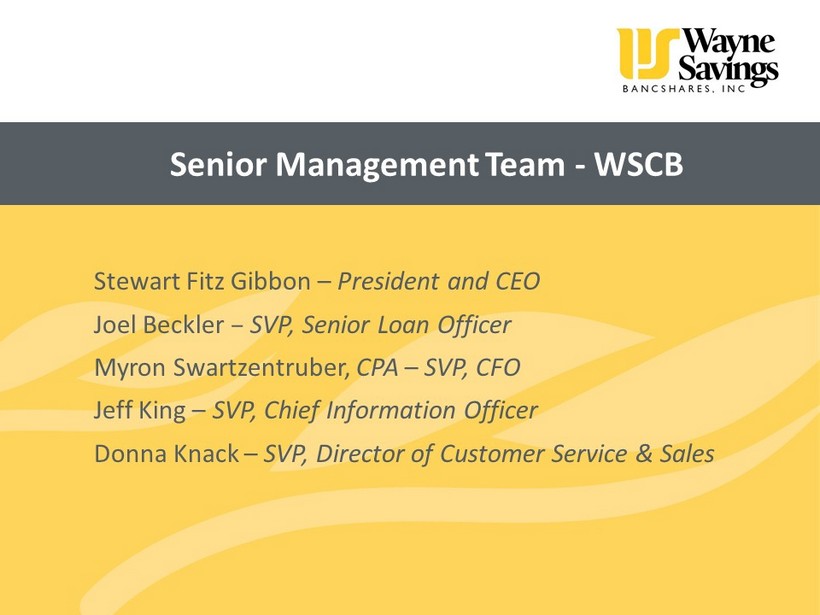
Senior Management Team - WSCB Stewart Fitz Gibbon – President and CEO Joel Beckler – SVP, Senior Loan Officer Myron Swartzentruber, CPA – SVP, CFO Jeff King – SVP, Chief Information Officer Donna Knack – SVP, Director of Customer Service & Sales
Also Present Matthew Hartzler – VP , Chief Risk Officer: Inspector of Election Brittany Hartzler – A VP, Corporate Secretary John Schlagenhauf, CPA – BKD LLP Scott Hopf, CPA – BKD LLP Francis Grady – Grady and Associates
Instructions on Procedures
Opening of the Polls
Closing of the Polls
Business Overview Stewart Fitz Gibbon President and CEO
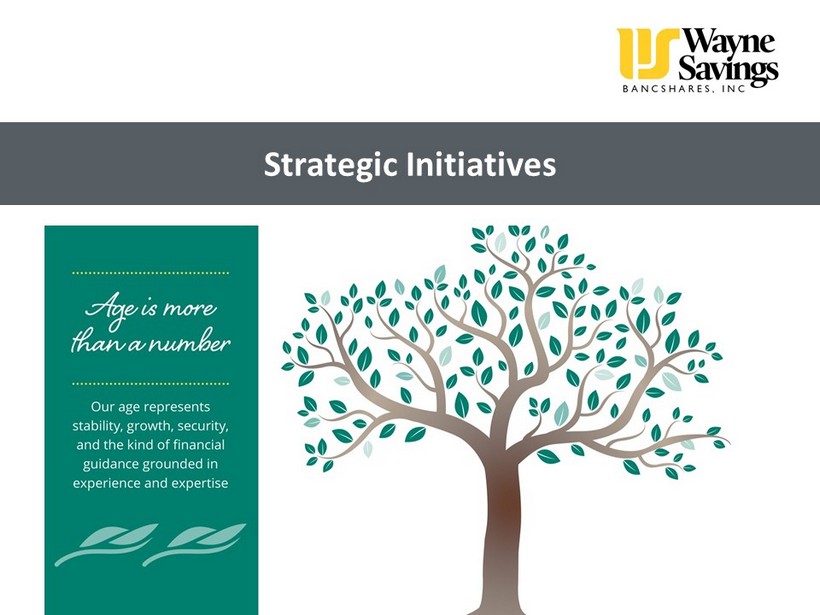
Strategic Initiatives Focus on core mission, vision and values statements – a balanced and sustainable approach to continued improvement in: □ Shareholder returns □ Customer and community relationships □ Staff development and change from thrift to bank culture
Strategic Initiatives Enhancement of balance sheet assets □ Commercial Loans □ Residential Mortgage Loans □ Consumer Loans – Auto and Home Equity
Balance Sheet Liabilities □ Fairly priced consumer deposit accounts □ Fairly priced business transaction accounts Strategic Initiatives
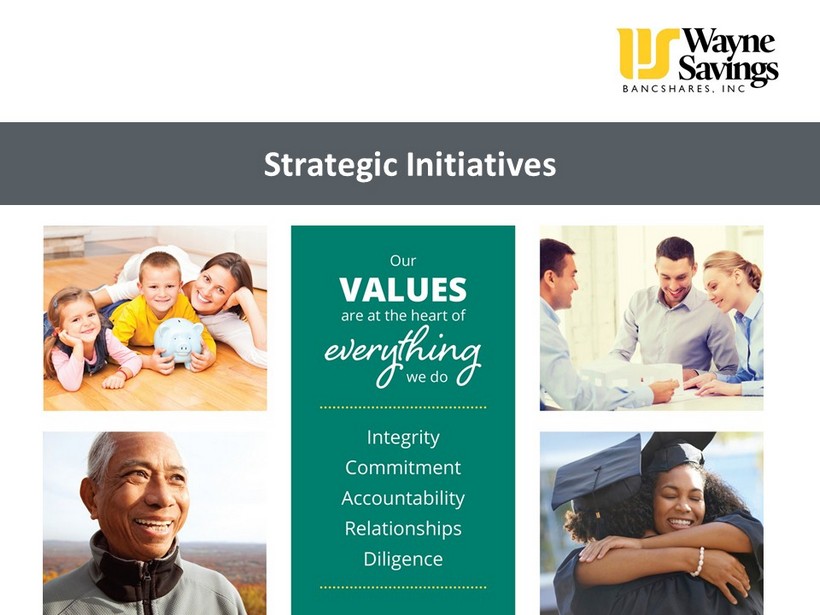
Strategic Initiatives Culture Change □ Shift from a transaction oriented thrift culture to a relationship oriented commercial bank culture □ Focus on the community banking model where local decision making is our primary competitive advantage □ Development of a balanced culture where customer service and regulatory compliance are both appropriately valued
Technology □ Continued work on a project list to improve customer service and operational efficiency □ A highlight of 2015 was the redesign of our website as our platform for digital engagement. As shown on the cover of your annual report, the site is scalable to whatever device is being used to view the site □ Increased focus on all matters cybersecurity to protect customer information Strategic Initiatives
□ Branch lobby graphics □ Advertising □ Mobile responsive website □ Social Media Marketing Strategic Initiatives Promote community bank brand message through:

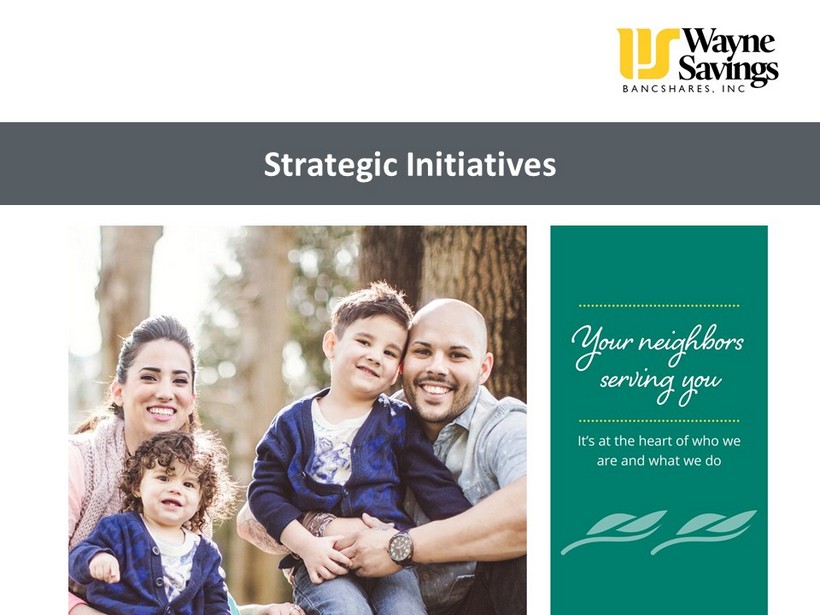
Strategic Initiatives We continue to focus on our community bank brand using several messages □ Together We Grow □ Your Neighbors Serving You □ Other Banks have Branches, We have Roots Marketing
Strategic Initiatives We continue to focus on our community bank brand using several messages □ Together We Grow □ Your Neighbors Serving You □ Other Banks have Branches, We have Roots Marketing
Strategic Initiatives We continue to focus on our community bank brand using several messages □ Together We Grow □ Your Neighbors Serving You □ Other Banks have Branches, We have Roots Marketing
Strategic Initiatives We continue to focus on our community bank brand using several messages □ Together We Grow □ Your Neighbors Serving You □ Other Banks have Branches, We have Roots Marketing
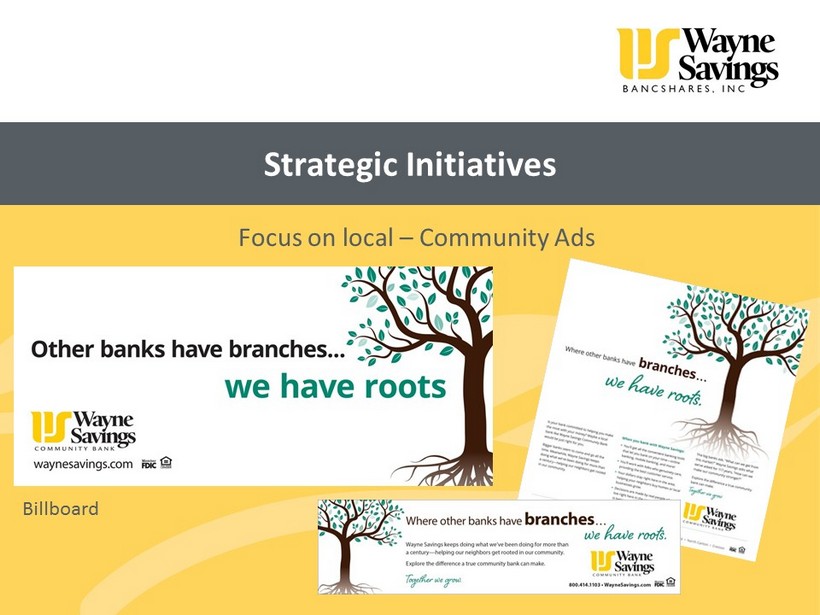
Strategic Initiatives Focus on local – Community Ads Billboard
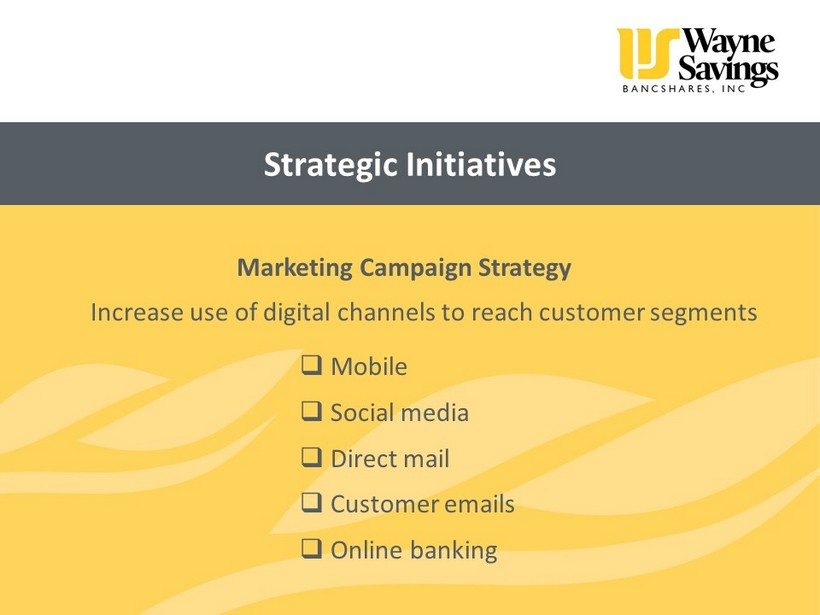
Strategic Initiatives Marketing Campaign Strategy Increase use of digital channels to reach customer segments □ Mobile □ Social media □ Direct mail □ Customer emails □ Online banking

Strategic Initiatives Mobile App Advertisement
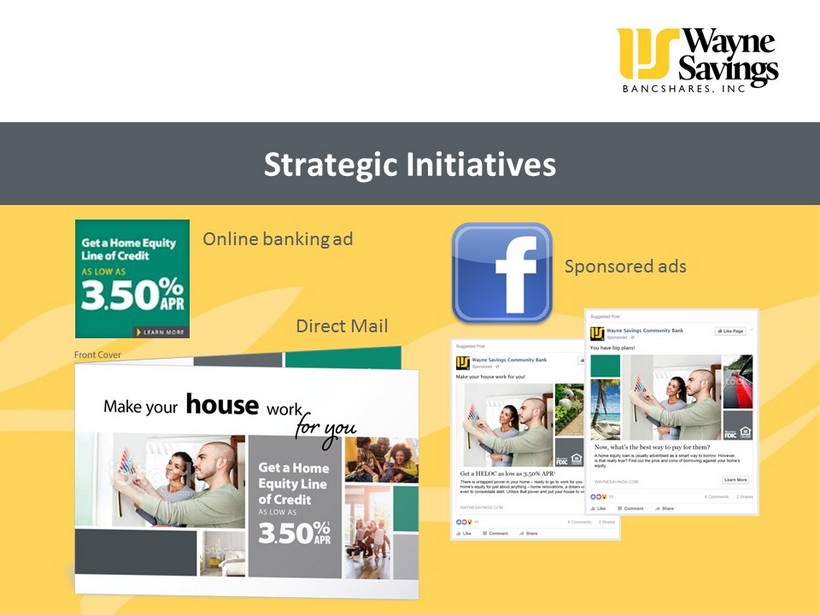
Strategic Initiatives Online banking ad Direct Mail Sponsored ads
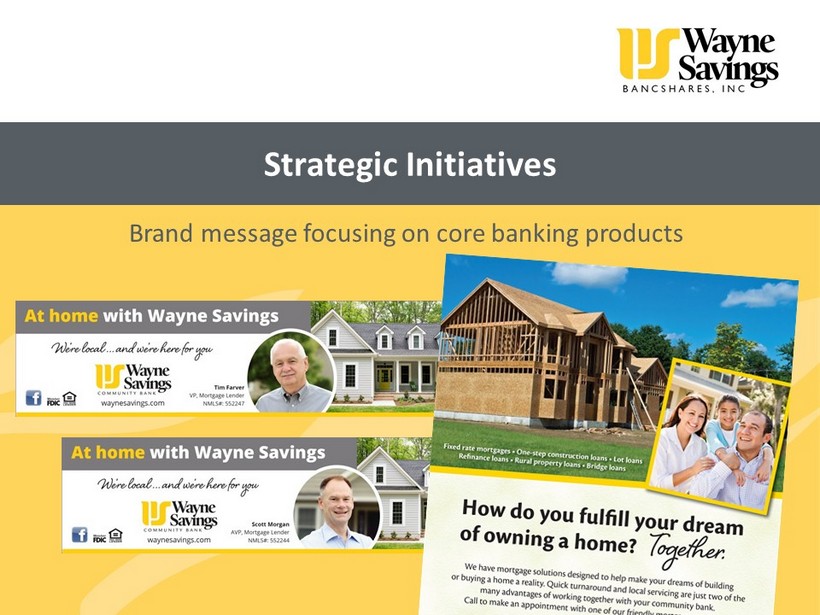
Strategic Initiatives Brand message focusing on core banking products
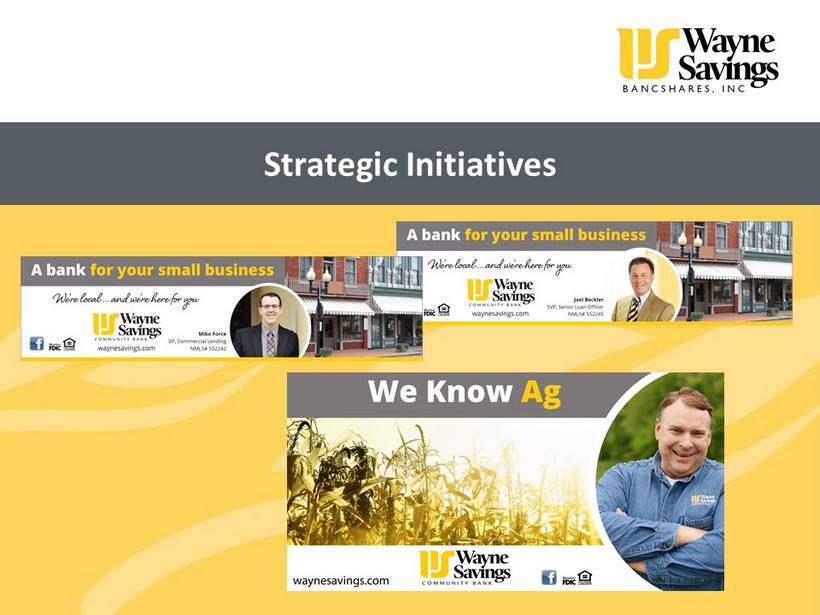
Strategic Initiatives
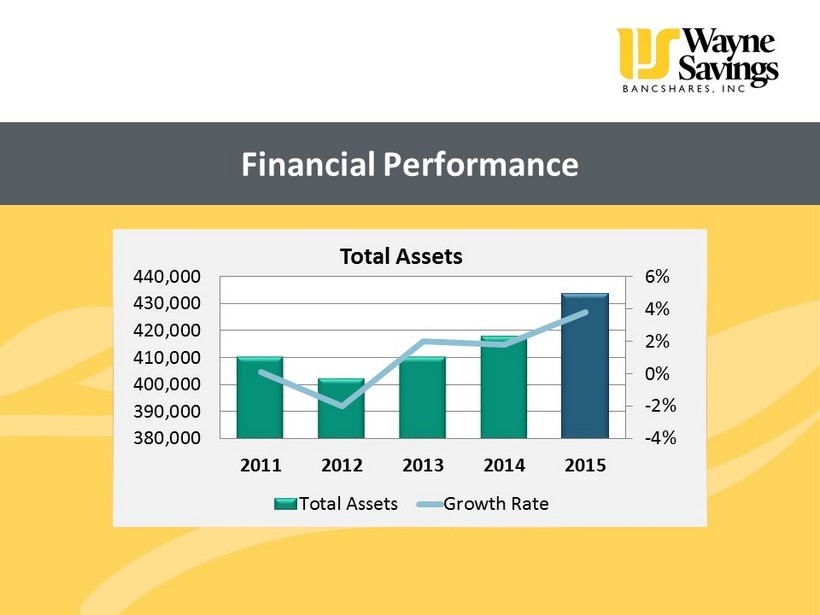
Financial Performance -4% -2% 0% 2% 4% 6% 380,000 390,000 400,000 410,000 420,000 430,000 440,000 2011 2012 2013 2014 2015 Total Assets Total Assets Growth Rate
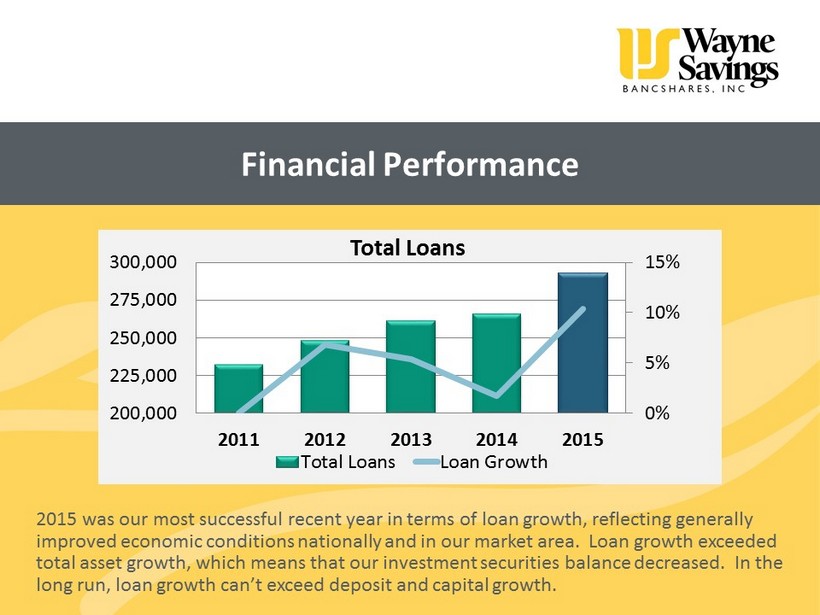
Financial Performance 0% 5% 10% 15% 200,000 225,000 250,000 275,000 300,000 2011 2012 2013 2014 2015 Total Loans Total Loans Loan Growth 2015 was our most successful recent year in terms of loan growth, reflecting generally improved economic conditions nationally and in our market area. Loan growth exceeded total asset growth, which means that our investment securities balance decreased. In the long run, loan growth can’t exceed deposit and capital growth.
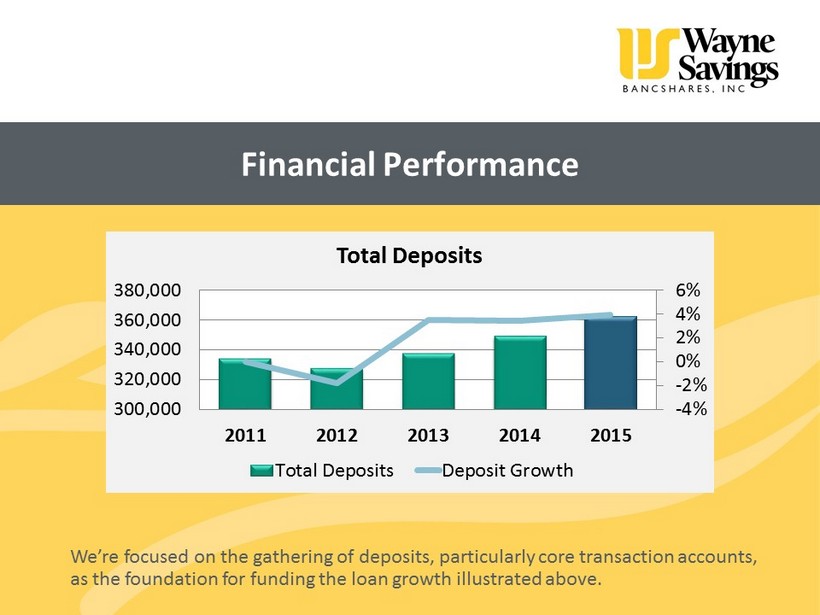
Financial Performance -4% -2% 0% 2% 4% 6% 300,000 320,000 340,000 360,000 380,000 2011 2012 2013 2014 2015 Total Deposits Total Deposits Deposit Growth We’re focused on the gathering of deposits, particularly core transaction accounts, as the foundation for funding the loan growth illustrated above.
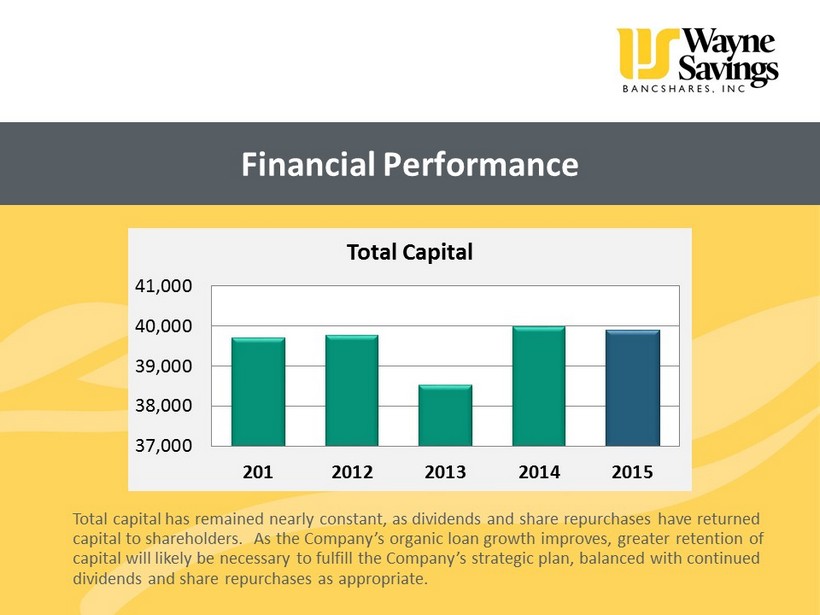
Financial Performance 201 2012 2013 2014 2015 37,000 38,000 39,000 40,000 41,000 Total Capital Total capital has remained nearly constant, as dividends and share repurchases have returned capital to shareholders. As the Company’s organic loan growth improves, greater retention of capital will likely be necessary to fulfill the Company’s strategic plan, balanced with continued dividends and share repurchases as appropriate.
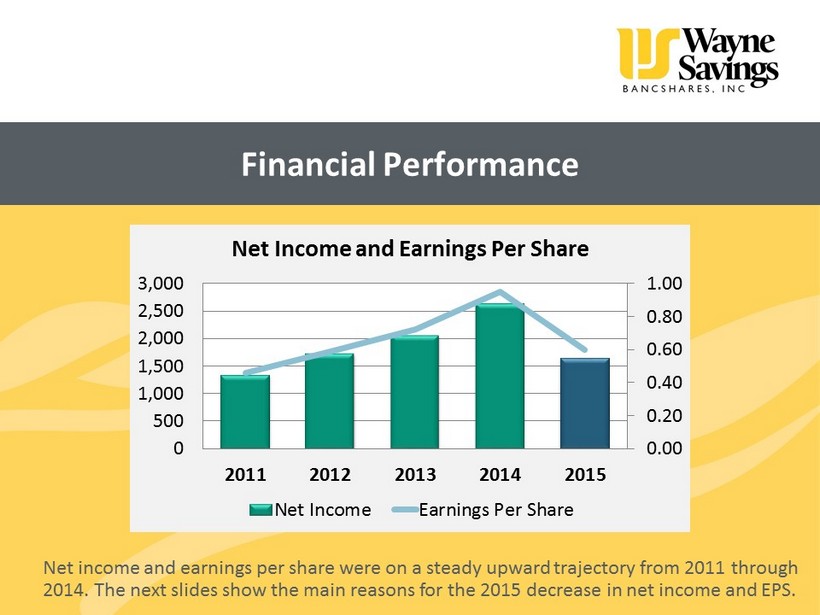
Financial Performance 0.00 0.20 0.40 0.60 0.80 1.00 0 500 1,000 1,500 2,000 2,500 3,000 2011 2012 2013 2014 2015 Net Income and Earnings Per Share Net Income Earnings Per Share Net income and earnings per share were on a steady upward trajectory from 2011 through 2014. The next slides show the main reasons for the 2015 decrease in net income and EPS.
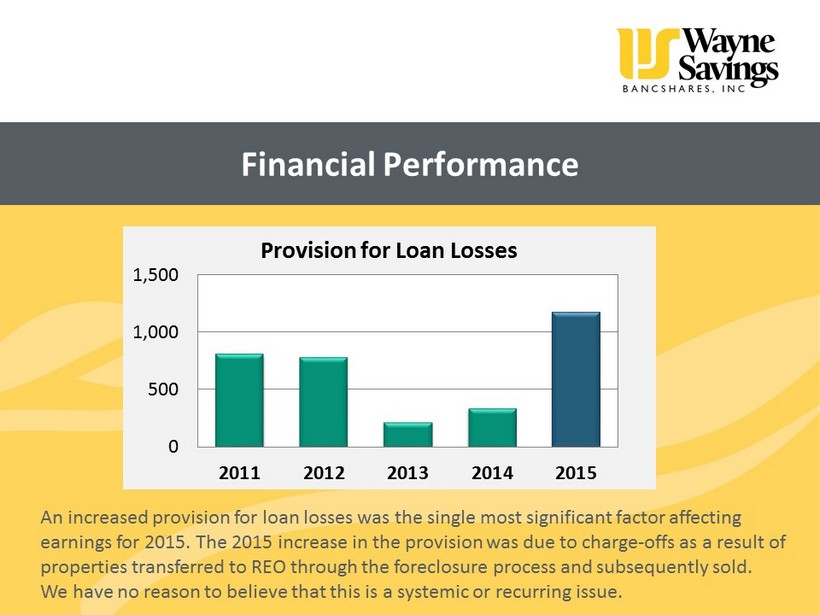
Financial Performance 0 500 1,000 1,500 2011 2012 2013 2014 2015 Provision for Loan Losses An increased provision for loan losses was the single most significant factor affecting earnings for 2015. The 2015 increase in the provision was due to charge - offs as a result of properties transferred to REO through the foreclosure process and subsequently sold. We have no reason to believe that this is a systemic or recurring issue.
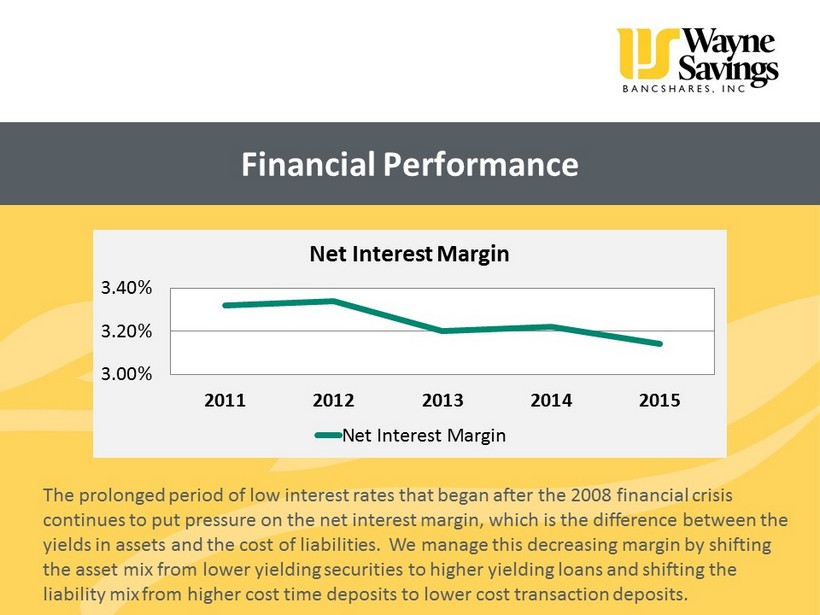
Financial Performance 3.00% 3.20% 3.40% 2011 2012 2013 2014 2015 Net Interest Margin Net Interest Margin The prolonged period of low interest rates that began after the 2008 financial crisis continues to put pressure on the net interest margin, which is the difference between the yields in assets and the cost of liabilities. We manage this decreasing margin by shifting the asset mix from lower yielding securities to higher yielding loans and shifting the liability mix from higher cost time deposits to lower cost transaction deposits.
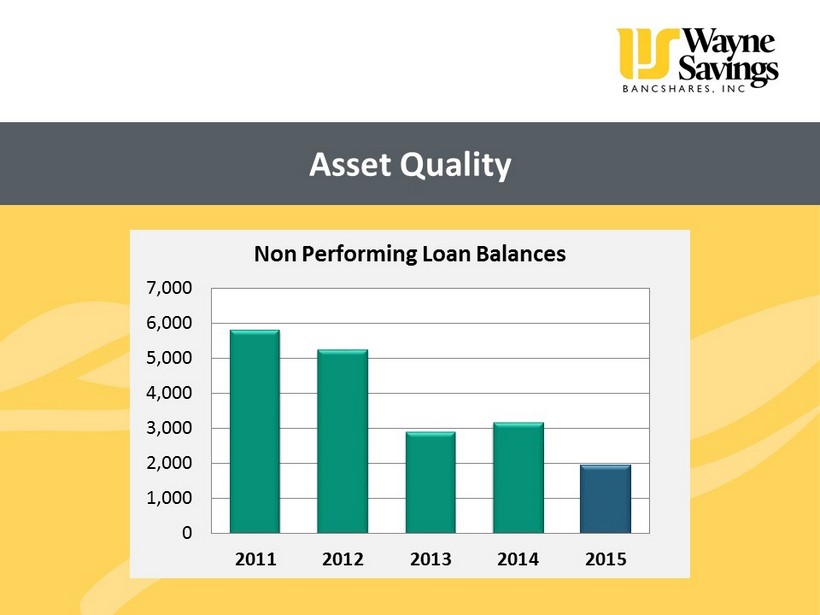
Asset Quality 0 1,000 2,000 3,000 4,000 5,000 6,000 7,000 2011 2012 2013 2014 2015 Non Performing Loan Balances
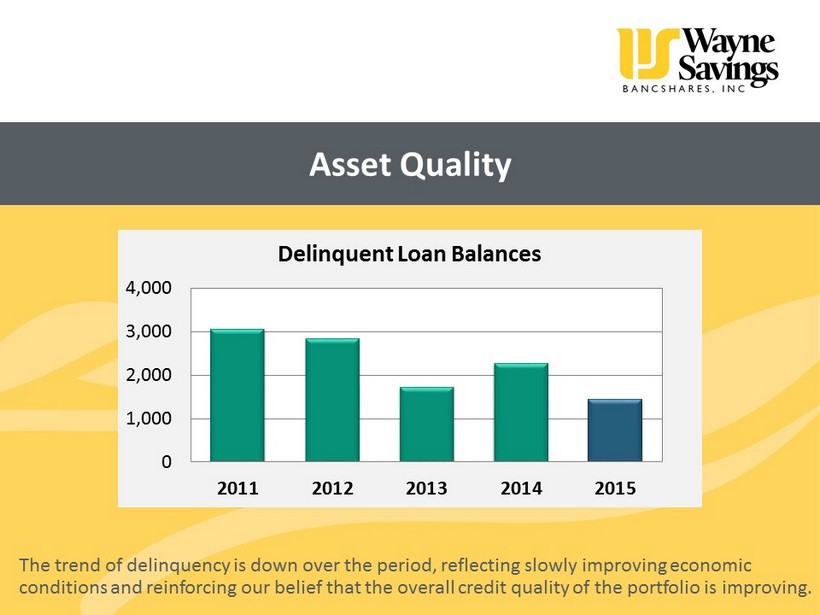
Asset Quality 0 1,000 2,000 3,000 4,000 2011 2012 2013 2014 2015 Delinquent Loan Balances The trend of delinquency is down over the period, reflecting slowly improving economic conditions and reinforcing our belief that the overall credit quality of the portfolio is improving.
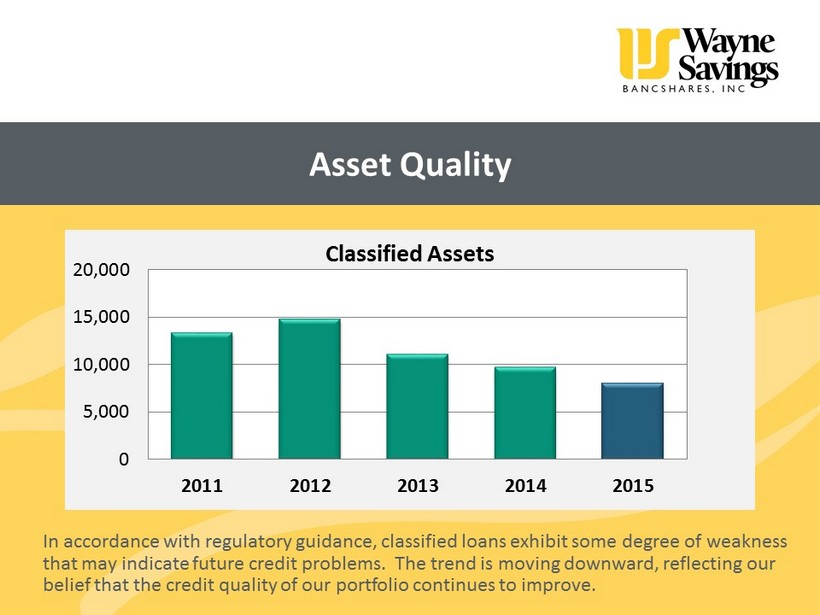
Asset Quality 0 5,000 10,000 15,000 20,000 2011 2012 2013 2014 2015 Classified Assets In accordance with regulatory guidance, classified loans exhibit some degree of weakness that may indicate future credit problems. The trend is moving downward, reflecting our belief that the credit quality of our portfolio continues to improve.
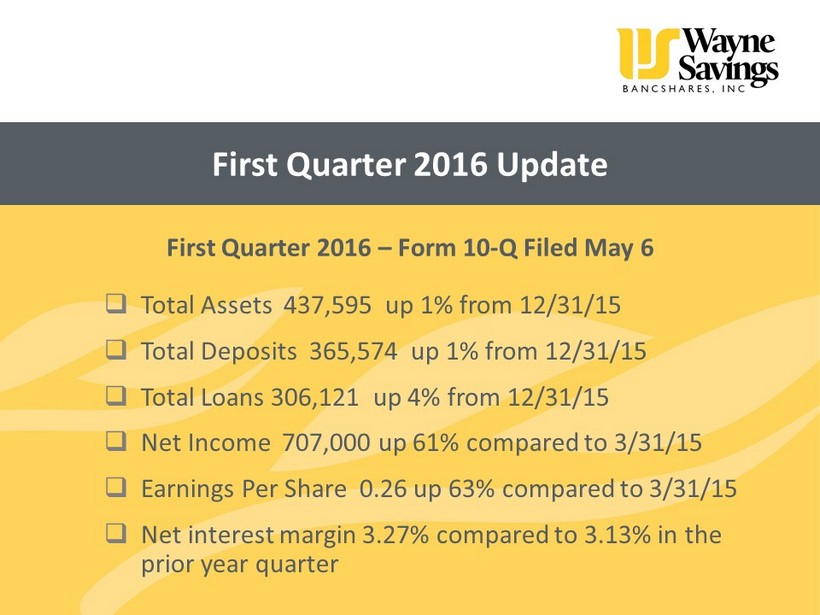
First Quarter 2016 Update First Quarter 2016 – Form 10 - Q Filed May 6 □ Total Assets 437,595 up 1% from 12/31/15 □ Total Deposits 365,574 up 1% from 12/31/15 □ Total Loans 306,121 up 4% from 12/31/15 □ Net Income 707,000 up 61% compared to 3/31/15 □ Earnings Per Share 0.26 up 63% compared to 3/31/15 □ Net interest margin 3.27% compared to 3.13% in the prior year quarter
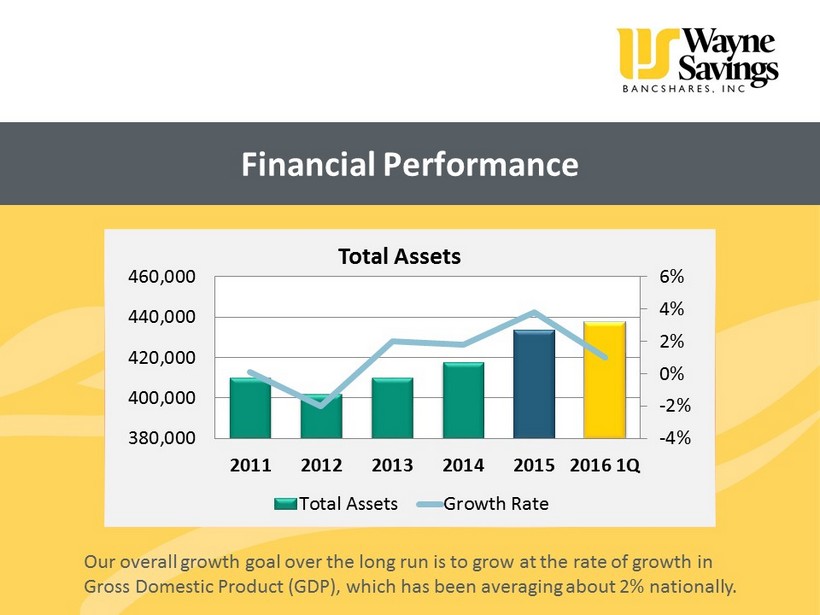
Financial Performance -4% -2% 0% 2% 4% 6% 380,000 400,000 420,000 440,000 460,000 2011 2012 2013 2014 2015 2016 1Q Total Assets Total Assets Growth Rate Our overall growth goal over the long run is to grow at the rate of growth in Gross Domestic Product (GDP), which has been averaging about 2% nationally.
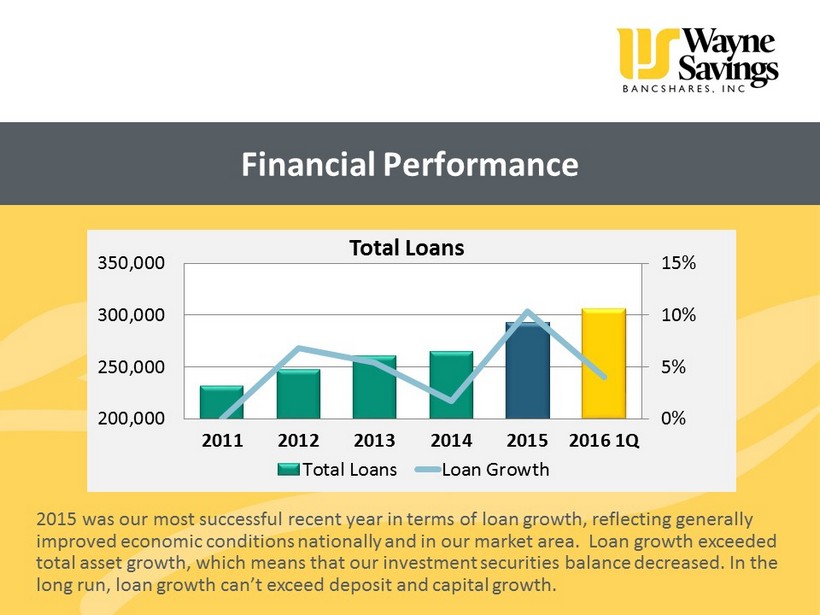
Financial Performance 0% 5% 10% 15% 200,000 250,000 300,000 350,000 2011 2012 2013 2014 2015 2016 1Q Total Loans Total Loans Loan Growth 2015 was our most successful recent year in terms of loan growth, reflecting generally improved economic conditions nationally and in our market area . Loan growth exceeded total asset growth, which means that our investment securities balance decreased . In the long run, loan growth can’t exceed deposit and capital growth.
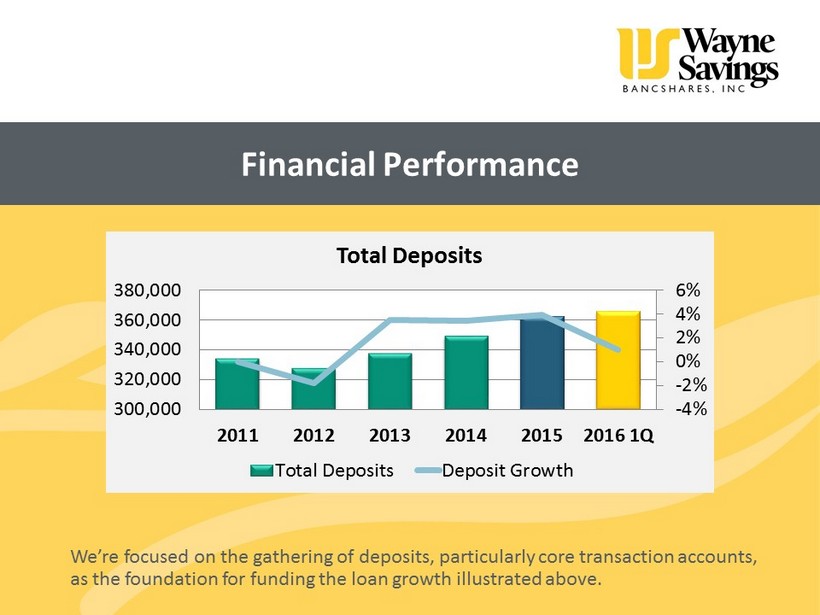
Financial Performance -4% -2% 0% 2% 4% 6% 300,000 320,000 340,000 360,000 380,000 2011 2012 2013 2014 2015 2016 1Q Total Deposits Total Deposits Deposit Growth We’re focused on the gathering of deposits, particularly core transaction accounts, as the foundation for funding the loan growth illustrated above.
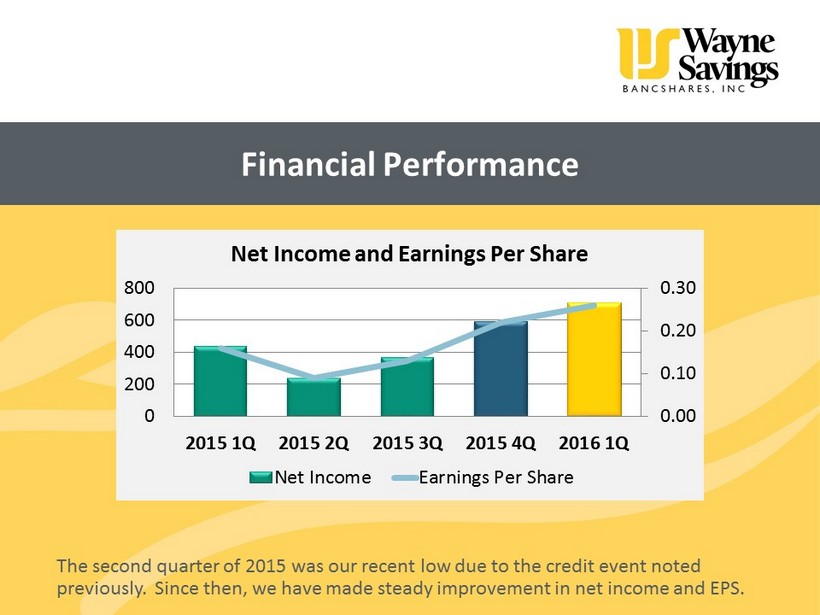
Financial Performance 0.00 0.10 0.20 0.30 0 200 400 600 800 2015 1Q 2015 2Q 2015 3Q 2015 4Q 2016 1Q Net Income and Earnings Per Share Net Income Earnings Per Share The second quarter of 2015 was our recent low due to the credit event noted previously. Since then, we have made steady improvement in net income and EPS.
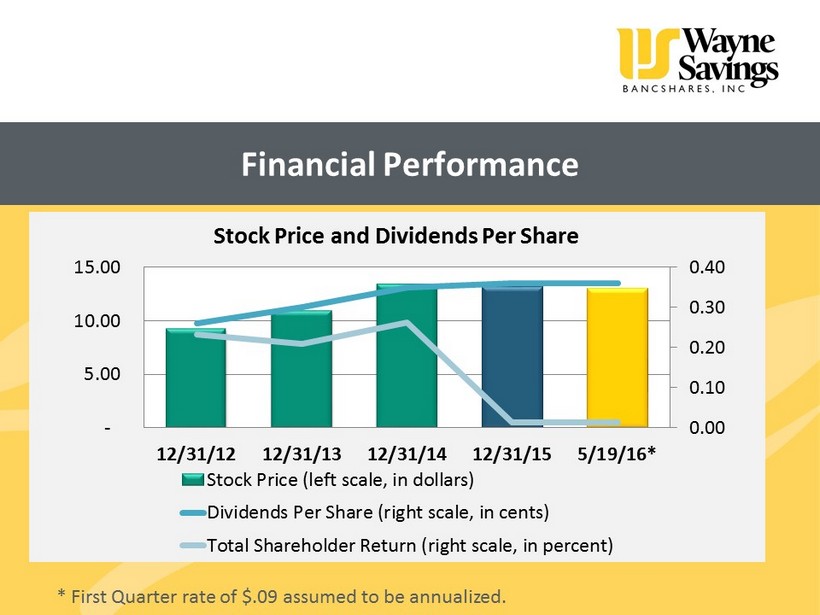
Financial Performance 0.00 0.10 0.20 0.30 0.40 - 5.00 10.00 15.00 12/31/12 12/31/13 12/31/14 12/31/15 5/19/16* Stock Price and Dividends Per Share Stock Price (left scale, in dollars) Dividends Per Share (right scale, in cents) Total Shareholder Return (right scale, in percent) * First Quarter rate of $.09 assumed to be annualized.
Report of the Inspector of Election Matthew Hartzler VP, Chief Risk Officer

Adjournment Annual Shareholders’ Meeting Management will answer questions after meeting