Attached files
| file | filename |
|---|---|
| 8-K - FORM 8-K - PUBLIC SERVICE ENTERPRISE GROUP INC | d199877d8k.htm |
 2020 Onwards RPM Auction Impacted By: • 100% Capacity
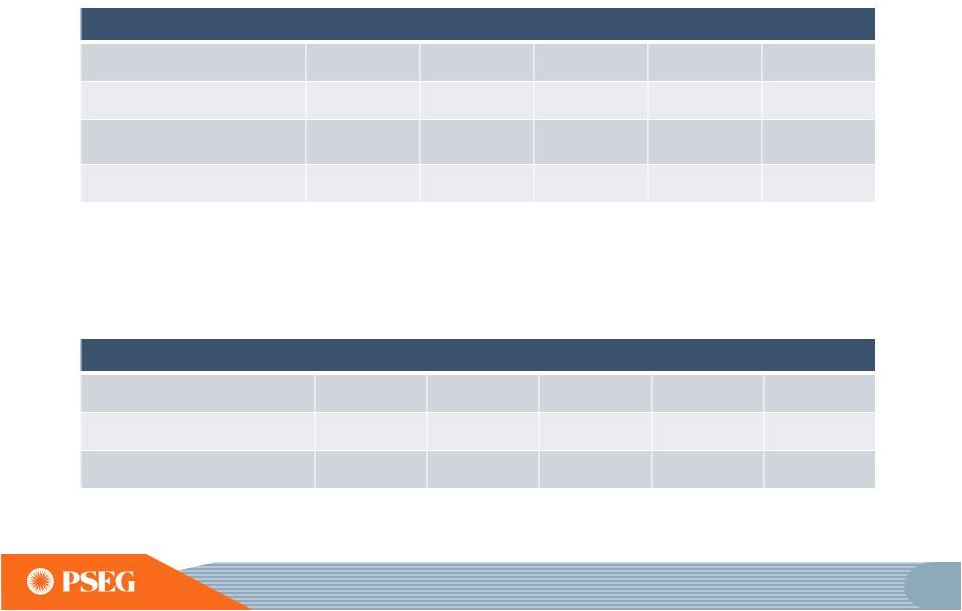
Performance • Demand Response Rules • Change in Net CONE • Reduction in Load Forecast • Change in PJM Parameters • Environmental Retirement Exhibit 99 Capacity Market Pricing PJM’s RPM Auction Results Delivery Year 2015/2016 2016/2017 2017/2018*+ 2018/2019+ 2019/2020 Power’s Average Prices
($/MW-day) $168 $172 $177 $215 $116 Rest of Pool Prices $136 $59 $120 $165/$150 (CP/Base) $100/$80 (CP/Base) Power’s Cleared Capacity (MW) 8,750 8,700 8,700 8,650 8,900 ISO New England’s Forward Capacity Market Auction Results
Delivery Year
2015/2016
2016/2017
2017/2018
2018/2019+
2019/2020
Power’s Average
Prices ($/MW-day) $113 $104 $232 $315 $231 Power’s Cleared Capacity (MW) 773 777 848 831 1,333 1 *PSEG POWER’S AVERAGE PRICES AND CLEARED CAPACITY (MW) REFLECT BASE AND INCREMENTAL AUCTIONS.
DELIVERY YEARS RUN FROM JUNE 1 TO MAY 31 OF THE NEXT CALENDAR
YEAR. + INCLUDES CP TRANSITION AUCTION RESULTS
FOR ‘16/’17 AND ‘17/’18 AS OF SEPTEMBER 10, 2015. |