Attached files
| file | filename |
|---|---|
| 8-K - FORM 8-K - CPI AEROSTRUCTURES INC | v440905_8k.htm |
Exhibit 99.1

A Premier Supplier of Aircraft Structures and Systems NYSE MKT: CVU 17 th Annual B. Riley Investor Conference May 26, 2016 Vincent Palazzolo, Chief Financial Officer

Disclosure Statement Forward - Looking Statements This presentation contains forward - looking statements that involve risks and uncertainties . All statements, other than statements of historical fact, included in this presentation, including without limitation, statements regarding projections, future financing needs, and statements regarding future plans and objectives of the Company, are forward - looking statements . Words such as "believes," "expects," "anticipates," "intends," "plans," "estimates" and similar expressions are intended to identify forward - looking statements . These forward - looking statements are based upon the current expectations of management and certain assumptions that are subject to risks and uncertainties . Accordingly, there can be no assurance that such risks and uncertainties will not affect the accuracy of the forward - looking statements contained herein or that our actual results will not differ materially from the results anticipated in such forward - looking statements . Such factors include, but are not limited to, the following : the cyclicality of the aerospace market, the level of U . S . defense spending, production rates for commercial and military aircraft programs, competitive pricing pressures, start - up costs for new programs, technology and product development risks and uncertainties, product performance, increasing consolidation of customers and suppliers in the aerospace industry and costs resulting from changes to and compliance with applicable regulatory requirements . The information contained in this presentation is qualified in its entirety by cautionary statements and risk factors disclosed in the Company's Securities and Exchange Commission filings, including its Annual Report on Form 10 - K filed on March 28 , 2016 and quarterly report on Form 10 - Q filed on May 10 , 2016 , available at http : //www . sec . gov . We caution readers not to place undue reliance on any forward - looking statements, which speak only as of the date hereof and for which the Company assumes no obligation to update or revise the forward - looking statements herein . CPI AERO is a registered trademark of CPI Aerostructures, Inc . All other trademarks referenced herein are the property of their respective owners . Non - GAAP Financial Data Adjusted Earnings (arrived at by eliminating the Company's A - 10 Program with Boeing from reported results) is not derived in accordance with generally accepted accounting principles (“GAAP”) . Adjusted earnings is a key metric CPI Aero has used in evaluating its financial performance . Adjusted earnings is considered a non - GAAP financial measure as defined by Regulation G promulgated by the SEC under the Securities Act of 1933 , as amended . CPI Aero considers Adjusted Earnings important in evaluating its financial performance on a consistent basis across various periods . Due to the significance of the non - cash and non - recurring change in estimate recognized in the three months ended March 31 , 2016 , Adjusted Earnings enables the Company's Board of Directors and management to monitor and evaluate the business on a consistent basis . CPI Aero uses Adjusted Earnings as a measure, among others, to analyze and evaluate financial and strategic planning decisions regarding future operating decisions and investments . The presentation of Adjusted Earnings should not be construed as an inference that CPI Aero's future results will be unaffected by unusual or non - recurring items or by non - cash items, such as changes in estimates . Adjusted Earnings should be considered in addition to, rather than as a substitute for, pre - tax income, net income and cash flows from operating activities . 2

About CPI Aero: Overview 3 Aircraft photos are for illustrative purposes only Manufacturer of aerospace structural assemblies and integrated systems for commercial and defense markets Wing Spar Assys Fuselage Skin Panels Engine Cowl Doors ISR Pod Systems Engine Inlets Kits & supply chain services Fueling Systems Crew Seats Aircraft structural assembly Aerospace Systems Value Added Services x Program management x Global supply chain management x Manufacturing engineering x Complex assembly x System installation x Subsystem integration and test

Product and Services Portfolio 4 Wings Inlets / Nacelles Pods MRO Special Products Triumph G650 Cessna Citation X+ HondaJet Embraer Phenom 300 HondaJet Bell AH - 1Z Aerostructures Sikorsky H - 60 Window Assemblies Spirit CH - 53K Step and Rack Assemblies Aerosystems UTAS DB - 110 NGC ALMDS NGC AN/ASQ - 236 Sikorsky H - 60 Fuel Panels NGC E - 2D Seats F - 35 Lock Assemblies Wings Secondary Structures Kitting & SCM NGC E - 2/C - 2 OWP F - 16 MRO Sikorsky S - 92 Kits H - 60 Stabilators Tow Hooks CH - 53H Secondary Structures Primary Structures T - 38 Pacer Classic III

Investment Considerations 5 Additional growth opportunities 26% Funded 74% Defense $ 407.4M Large and diversified backlog Growing bid pipeline Improving Defense Outlook 51% Defense 31% Aerosystems In both Defense and Commercial At 03/31/16 Defense opportunities are increasing CRH CH - 53K ISR Pods C - Series Embraer E2 F - 16 SLEP • DoD budget back in growth mode • Increasing spending internationally • Increasing operating tempos for U.S. and Allied air forces
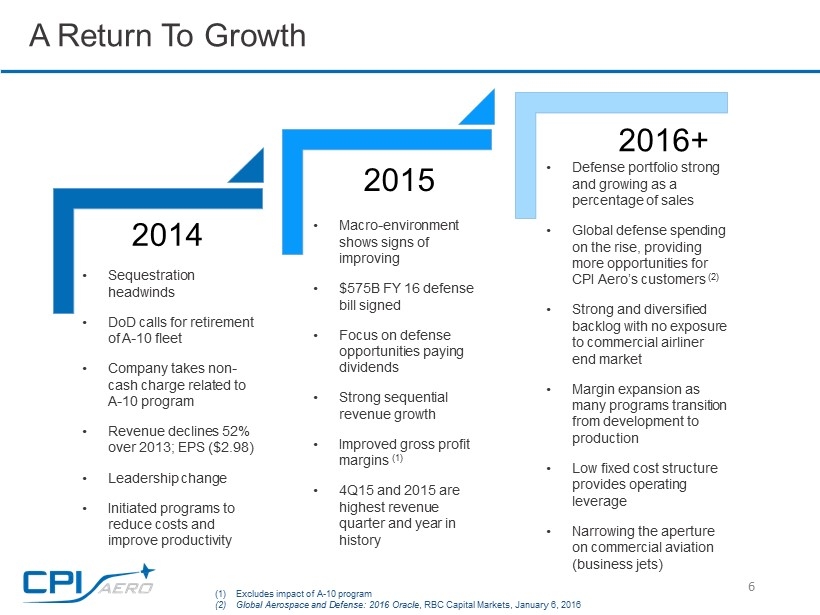
2014 2015 2016+ A Return To Growth 6 • Macro - environment shows signs of improving • $575B FY 16 defense bill signed • Focus on defense opportunities paying dividends • Strong sequential revenue growth • Improved gross profit margins (1) • 4Q15 and 2015 are highest revenue quarter and year in history • Defense portfolio strong and growing as a percentage of sales • Global defense spending on the rise, providing more opportunities for CPI Aero’s customers (2) • Strong and diversified backlog with no exposure to commercial airliner end market • Margin expansion as many programs transition from development to production • Low fixed cost structure provides operating leverage • Narrowing the aperture on commercial aviation (business jets) • Sequestration headwinds • DoD calls for retirement of A - 10 fleet • Company takes non - cash charge related to A - 10 program • Revenue declines 52% over 2013; EPS ($2.98) • Leadership change • Initiated programs to reduce costs and improve productivity (1) Excludes impact of A - 10 program (2) Global Aerospace and Defense: 2016 Oracle , RBC Capital Markets, January 6, 2016

Driven By Renewed Strength in Defense Business 7 Recent wins added approx. $225 million in backlog until 2022 $ 86.1M $25 - 30M $49M Contract Period 2013 - 2021 Contract Period 2016 - 2019 Contract Period 2015 - 2021 E - 2D Advanced Hawkeye/C - 2A Greyhound T - 38C Talon Trainer $ 53.5M Contract Period 2014 - 2022 F - 35A $ 10.6M Contract Period 2015 - 2021 Japan E - 2D Hawkeye F - 16 Falcon Announced November 2014 Announced January 2016 Announced February 2015 Announced November 2014 Announced July 2015

Backlog 8 Funded 26% / Unfunded 76% Defense 74% / Commercial 26% Consolidated Backlog at 03/31/2016 – $407.4 Million, up 5% from end of 2015 $ 104.0M $ 303.4M Funded Unfunded Unfunded backlog represents remaining potential value of long term agreements $300.9M $ 106.5M Defense Commercial Funded backlog up from $101.1 at 12/31/2015

Current Market Trends Driving Opportunity 9 • U.S. DoD budget back in growth mode » U.S. fiscal and geo - political situations key drivers of defense spending 1 • After 5% growth in the approved FY16 budget, FY17 could see at least another 2% 2 • Intelligence, Surveillance and Reconnaissance (ISR) top priority for USAF military commanders 3 • More flying hours expected to lead to increased maintenance 4 1 Global Aerospace and Defense: 2016 Oracle, RBC Capital Markets, January 6, 2016 2 DEFCON: Budget Booming, RBC Capital Markets, January 19, 2016 3 Comments by USAF Secretary James to AFA Warfare Symposium, February 13, 2015 4 Estimating the cost of operations against ISIL, Center for Strategic and Budgetary Assessments, September 2014.

CPI Aero’s Advantages 10 Since inception: - Focused on assembly and integration - Use suppliers to manufacture 100% of components Provides a competitive advantage over vertically integrated competitors due to: • 35+ years of highly evolved assembly, supply chain and program management skills • We are NOT a parts manufacturer trying to move up the value - added chain Competence • We do not have our own production capacity to feed • We leverage component production capacity on a global basis to find the best combination of price, quality, and delivery for each type of component (composites, sheet metal, machined parts) Best Value • Our capacity is only limited by people and floor space • We can achieve superior organic growth without major investments in machinery and without the risk of future obsolescence (examples: metals vs. composites) Scalable

CPI Aero’s Role Within Supply Chain 11 CPI Aero is…. Tier 3 Tier 1 Tier 2 OEM Components or detailed parts Manufacture subassemblies Manufacture aircraft sections Final assembly, finish and delivery Tier 1 to : Tier 2 to : Goal: Maintain and Expand our Tier 1 Status Prime to :

Programs: Defense Aerospace 12 E - 2D Advanced Hawkeye $25M - $30M contract Japan Defense Programs

A - 10 Program: Overhang Removed 13 Completion of the program under the current terms will result in a net positive inflow of cash over the balance of the contract as remaining billings exceed estimated future cash expenses by approximately $1.5 million We anticipate that Congress will continue to prevent the Air Force from retiring the A - 10 until another platform capable of meeting the Close Air Support mission We believe that the Air Force will need to acquire new wings beyond what is already on order with Boeing Given our incumbency, we are in a great competitive position to secure new work at more favorable terms January 2016 - U.S. Air Force announces it is very likely to delay the retirement of the aircraft given ongoing operational needs February 2016 - fiscal 2017 President’s Budget Request pushes out the retirement of the A - 10 through 2022 in order to preserve the aircraft’s capabilities during the Air Force’s transition to the F - 35 April 2016 - Air Force clarifies its position, states it intends to begin retirement as early as GFY 2018; timing and quantity of anticipated future wing orders becomes uncertain. These new facts and recent communications from our customer affect how company accounts for the A - 10: − Assume contract will not be terminated prior to completion of current Boeing subcontract (through qty 173) − Estimate running the A - 10 contract through completion of ship set 173 − No justification for deferral of expenses or the addition of estimated revenue related to anticipated future orders, as these orders are not ‘probable,’ as that term has meaning under GAAP − POC accounting rules requires entire estimated loss remaining to be booked in current quarter, resulting in a total charge of approximately $13.5 ($8.9 reduction to revenue and $4.6 million increase to COGS) Recent Developments: Our View:
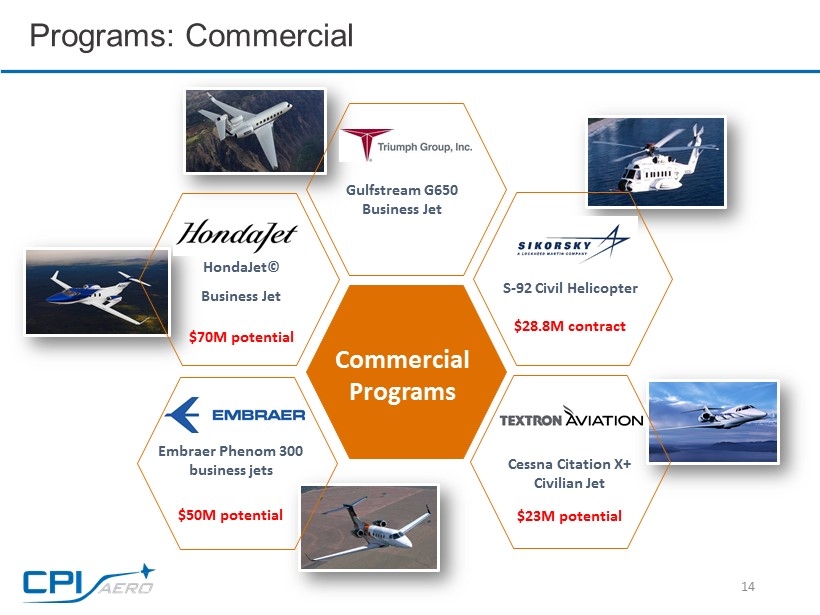
Programs: Commercial 14 Commercial Programs Gulfstream G650 Business Jet HondaJet© Business Jet $70M potential Embraer Phenom 300 business jets $50M potential S - 92 Civil Helicopter $28.8M contract Cessna Citation X+ Civilian Jet $23M potential

Long - Term Visibility - Contracts 15 Firm, Funded Contracts Provide Long - Term Revenue Visibility and Operating Leverage U.S. GOVERNMENT – F - 16 TRIUMPH GROUP - Gulfstream G650 SIKORSKY – UH - 60 Black Hawk U.S. GOVERNMENT – T - 38C Talon Trainer TEXTRON - Cessna Citation X+ SIKORSKY – S - 92 EMBRAER – Phenom 300 LOCKHEED – F - 35A BELL HELICOPTER – AH - 1Z ZULU ‘08 ‘09 ’10 ’11 ’12 ’13 ‘14 ‘15 ‘16 ‘17 ‘18 ‘19 ‘20 ‘21 ‘22 ‘23 ‘24 ‘25 NORTHROP GRUMMAN – for the E - 2D & C - 2A NORTHROP GRUMMAN – Japan E - 2D HONDA - HondaJet Defense ; Commercial UTC AEROSPACE SYSTEMS – DB - 110 ISR Pod Potential to collectively generate revenue of $ 407.4M during their remaining periods of performance (as of 3/31/16)

Illustrative Long - Term Contract 16 Heavy investment up - front with returns generated over the life of the contract - Cumulative cash grows Costs decline over time through productivity gains - Resulting in increasing gross margin CEE (unbilled receivables declines over time as contract is completed -20 -10 0 10 20 30 40 50 60 2016 2017 2018 2019 2020 2021 2022 rev cum POC rev Cum Cash CEE 0% 5% 10% 15% 20% 25% 30% 35% 40% 45% 0 10 20 30 40 50 60 2016 2017 2018 2019 2020 2021 2022 cum POC rev cum cash rev cash GP GAAP GP

Bid Pipeline (5/06/16) 17 Continued Diversification Across Product Categories Defense opportunities are increasing 51% 49% Defense Commercial 12% 4% 53% 31% Kitting MRO Aerostructures Aerosystems

Program Opportunities 18 Aerostructures ― Military Helos : H - 92, AH - 1Z, CH - 53K, V - 280 ― Various regional commercial aircraft (Tier 1 and Tier 2 opportunities) ― Military Fixed Wing: A - 10 thick skin urgent spares kitting (TUSK), F - 35 ― MRO: F - 16 SLEP, BLACK HAWK Aerosystems ― ISR and EW Pod structures Supply Chain Management/Kitting ― Various regional commercial aircraft (Tier 1 opportunity) ― Various business jets ― S - 92 (commercial) Current opportunities (12 months):

Future Opportunities: 12+ months 19 T - X Trainer Foreign sales – F - 16 Northrop Grumman B - 21 Lockheed Martin F - 35
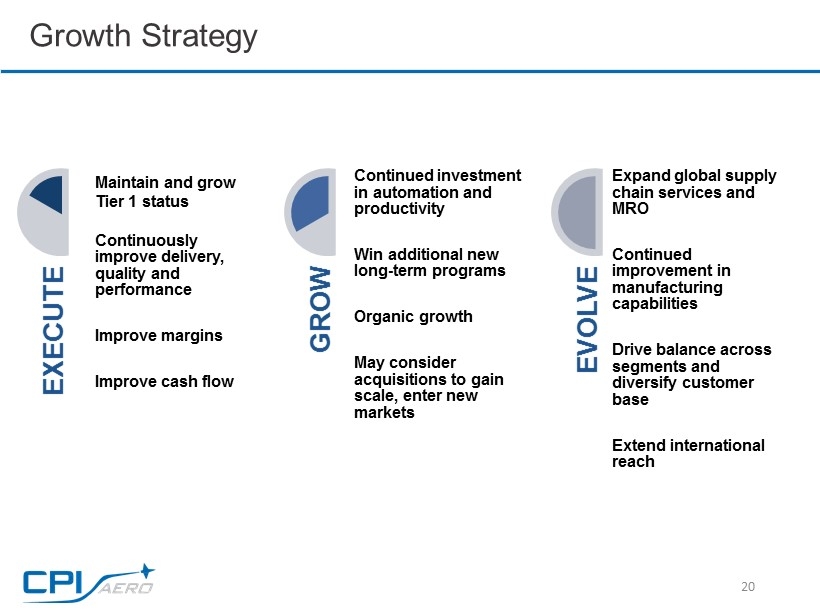
Growth Strategy 20 EXECUTE Maintain and grow Tier 1 status Continuously improve delivery , quality and performance Improve margins Improve cash flow GROW Continued investment in automation and productivity Win additional new long - term programs Organic growth May consider acquisitions to gain scale, enter new markets EVOLVE Expand global supply chain services and MRO Continued improvement in manufacturing capabilities Drive balance across segments and diversify customer base Extend international reach

21 Recent Financial Highlights

Consolidated Financial Highlights 22 ($ in Millions, except per share data) 2016 2015 2016 2015 Revenue $12.7 $19.9 $19.5 15.7 Cost of sales 24.3 16.3 15.8 12.0 Gross profit (loss) (11.6) 3.6 3.7 3.6 Selling, general and administrative expenses 2.7 2 2.7 2.0 Income (loss) from operations (14.4) 1.6 0.9 1.6 Income before provision for income taxes (14.6) 1.4 0.7 1.4 Net income (loss) (9.2) 0.9 0.4 0.9 Income (loss) per common share – diluted ($1.07) $0.11 $0.05 $0.11 GAAP as Reported 1 Adjusted Earnings For the 3M Ended March 31, For the 3M Ended March 31, 1 Excludes impact of the A - 10 program on the Company's financial performance for both time periods,

Balance Sheet Highlights 23 Total Debt Total Debt Credit Facility Shareholders’ Equity Book Value Debt - to - Capital As of March 31, 2016 CEE (unbilled receivables, $/M) $ 92.9 Total Debt ($/M) 31.2 Shareholders’ Equity ($/M) 61.6 Book Value, per diluted share ($/shares) 7.16 Debt - to - Capital 0.51 Recent Debt Refinancing $40M, 3 - year senior debt facility − $10M term loan − $30M revolving line - of - credit Replaces previous $35.0M credit facility Expands availability by $ 5M Liquidity Approximately $9 million still available under credit facility FY16 unlevered cash flow priorities: 1. Pay down debt 2. Improve overhead and operational efficiencies to improve cash flow 3. CAPEX

2016 Financial Initiatives 24 Strengthen Balance Sheet Continue Investment In Automation Improve Debt Coverage Ratios Further Reduce Overhead & SG&A Expenses Lower inventory levels and reduce unbilled receivables (CEE) Investments made in 2015 expected to favorably impact margins G&A rate reduced by 50 basis points since 2014; Factory Overhead rate reduced by over 5,000 basis points since 2014 Already lower than industry peers

Updated 2016 Financial Guidance 1 25 R e ve n ue Pre - tax Income Net Income Effective Tax Rate • $ 82.5M – $ 88.5M • Reduces all projected A - 10 program revenue from forecast Adjusted Revenue • $9.8M - $10.5M • Adds back the $15.3 million charge recorded in 1Q16 related to A - 10 program Adjusted Pre - tax Income • Approximately 37% Effective Tax Rate 1 Excludes A - 10 WRP program revenue and costs.

Conclusion 26 CPI Aero is well positioned to continue to grow its business due to: • Large, diversified and growing backlog • Growing bid pipeline – new opportunities for both the defense and commercial markets • Ability to perform on larger and more complex programs due to investments in advanced technologies • Vast growth opportunities arising from developments in both commercial aerospace and defense sector • Opportunities in North America and internationally

Contact Us 27 CPI Aerostructures Vincent Palazzolo, CFO (631) 586 - 5200 www.cpiaero.com Investor Relations Jody Burfening & Sanjay M. Hurry (212) 838 - 3777 cpiaero@lhai.com www.lhai.com

Financial Appendix

Adjusted Statement of Earnings Adjusted Earnings (arrived at by eliminating the Company's A - 10 Program with Boeing from reported results) is not derived in acc ordance with generally accepted accounting principles (“GAAP”). Adjusted earnings is a key metric CPI Aero has used in evaluating its financial performance. Adj usted earnings is considered a non - GAAP financial measure as defined by Regulation G promulgated by the SEC under the Securities Act of 1933, as amended. CPI Aero co nsi ders Adjusted Earnings important in evaluating its financial performance on a consistent basis across various periods. Due to the significance of the non - cash and n on - recurring change in estimate recognized in the three months ended March 31, 2016, Adjusted Earnings enables the Company's Board of Directors and management to monito r a nd evaluate the business on a consistent basis. CPI Aero uses Adjusted Earnings as a measure, among others, to analyze and evaluate financial and strategic pl anning decisions regarding future operating decisions and investments. The presentation of Adjusted Earnings should not be construed as an inference that CPI A ero 's future results will be unaffected by unusual or non - recurring items or by non - cash items, such as changes in estimates. Adjusted Earnings should be considered in add ition to, rather than as a substitute for, pre - tax income, net income and cash flows from operating activities. GAAP Adjusted as Reported Adjustments Earnings Revenues $12,670,032 $6,820,981 $19,491,013 Cost of sales 24,309,136 (8,470,714) 15,838,422 Gross profit (11,639,104) 15,291,695 3,652,591 Selling, general and administrative expenses Income from operations (14,359,487) 15,291,695 932,208 Other income (expense), net Interest expense 275,733 275,733 Income before provision for income taxes (14,635,220) 15,291,695 656,475 Provision for income taxes (5,415,000) 5,658,000 243,000 Net income (loss) ($9,220,220) $9,633,695 $413,475 Diluted Earnings per share ($1.07) $0.05 For the Three Months Ended March 31, 2016 2,720,3832,720,383
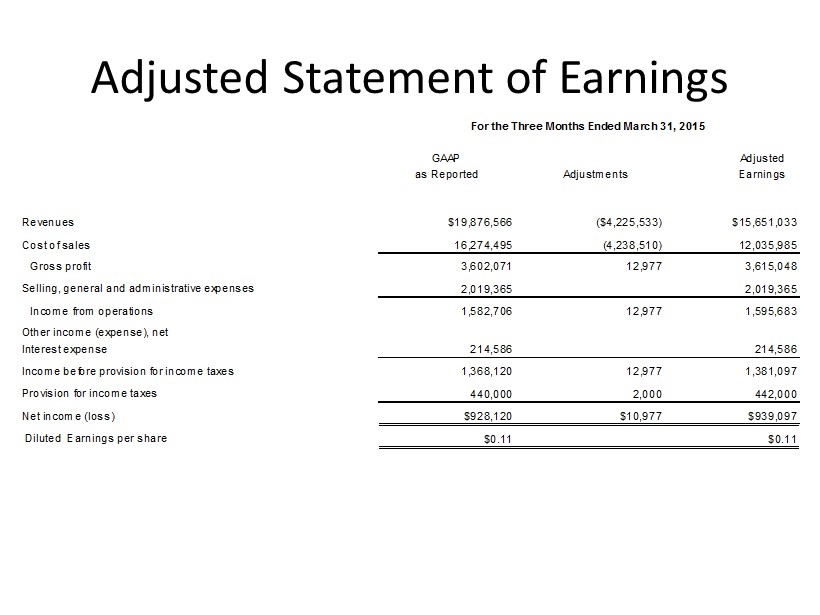
Adjusted Statement of Earnings GAAP Adjusted as Reported Adjustments Earnings Revenues $19,876,566 ($4,225,533) $15,651,033 Cost of sales 16,274,495 (4,238,510) 12,035,985 Gross profit 3,602,071 12,977 3,615,048 2,019,365 2,019,365 Income from operations 1,582,706 12,977 1,595,683 Interest expense 214,586 214,586 1,368,120 12,977 1,381,097 440,000 2,000 442,000 Net income (loss) $928,120 $10,977 $939,097 $0.11 $0.11 Income before provision for income taxes Provision for income taxes Diluted Earnings per share Selling, general and administrative expenses Other income (expense), net For the Three Months Ended March 31, 2015