Attached files
| file | filename |
|---|---|
| 8-K - KIMBALL ELECTRONICS, INC. FORM 8-K - Kimball Electronics, Inc. | a05252016investorpresentat.htm |

?Investor Presentation May 2016 Exhibit 99.1

2 Safe Harbor Statement Certain statements contained within this presentation may be considered forward-looking under the Private Securities Litigation Reform Act of 1995 and are subject to risks and uncertainties including, but not limited to, our ability to fully realize the expected benefits of the completed spin-off, successful integration of acquisitions and new operations, the global economic conditions, significant volume reductions from key contract customers, loss of key customers or suppliers, financial stability of key customers and suppliers, availability or cost of raw materials, and increased competitive pricing pressures reflecting excess industry capacities. Additional cautionary statements regarding other risk factors that could have an effect on the future performance of Kimball Electronics, Inc. (the “Company”) are contained in the Company’s Annual Report on Form 10-K for the fiscal year ended June 30, 2015 and other filings with the Securities and Exchange Commission (the “SEC”). This presentation contains non-GAAP financial measures. A non-GAAP financial measure is a numerical measure of a company’s financial performance that excludes or includes amounts so as to be different than the most directly comparable measure calculated and presented in accordance with Generally Accepted Accounting Principles (GAAP) in the United States in the statement of income, statement of comprehensive income, balance sheet, statement of cash flows, or statement of equity of the company. The non-GAAP financial measures contained herein include Selling & Administrative Expense (%), Adjusted Operating Income, Adjusted Net Income, and Adjusted EBITDA which have been adjusted for spin-off expenses. Management believes it is useful for investors to understand how its core operations performed without the effects of incremental costs related to the spin-off. Excluding these amounts allows investors to meaningfully trend, analyze, and benchmark the performance of the Company’s core operations. Many of the Company’s internal performance measures that management uses to make certain operating decisions use these and other non-GAAP measures to enable meaningful trending of core operating metrics. KIMBALL ELECTRONICS

? TABLE OF CONTENTS Kimball Electronics Snapshot Why Invest in Kimball Electronics Strategic Plan Acquisition Strategy Financial Results

Headquartered in Jasper, Indiana with manufacturing locations in the U.S., Mexico, Poland, China, Thailand and Romania Differentiated package of value and well established in a growing niche of the Electronic Manufacturing Services (EMS) market A leading global EMS provider for high-quality, high-reliability, and durable electronics serving customers in the automotive, industrial, medical, and public safety end markets SNAPSHOT Kimball Electronics, Inc. (NasdaqGS: KE) 4 KIMBALL ELECTRONICS (1) Adjusted Net Income excludes spin off costs; See “Non GAAP Reconciliation” at the end of presentation (2) Unaudited Over 4,300 employees in 9 countries 4,300+ EMPLOYEES 3/31/16 trailing 4 quarter Adjusted Net Income (1) (2) $24.0 MILLION 3/31/16 trailing 4 quarter Net Sales (2) $822.8 MILLION 3/31/2016 Share Owners’ Equity (2) $324.7 MILLION

Solid foundation for growth Poised to win market share Disciplined execution Committed to building long term shareholder value KIMBALL ELECTRONICS Why Invest in Kimball Electronics
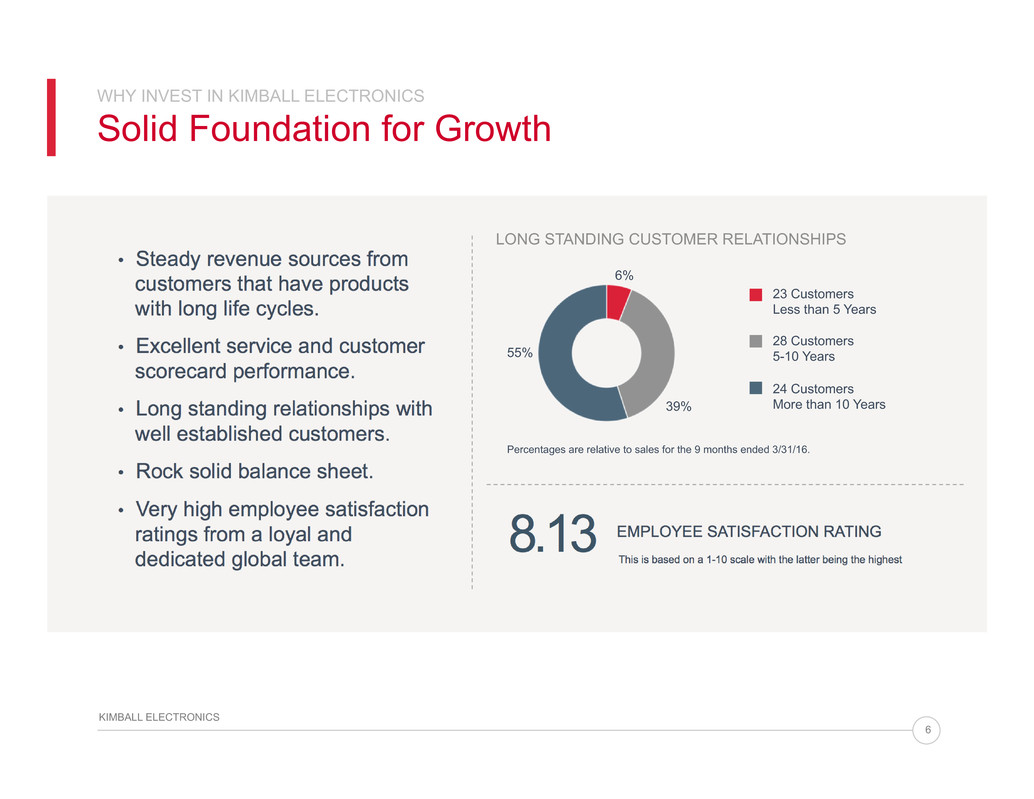
WHY INVEST IN KIMBALL ELECTRONICS Solid Foundation for Growth 6 KIMBALL ELECTRONICS • Steady revenue sources from customers that have products with long life cycles. • Excellent service and customer scorecard performance. • Long standing relationships with well established customers. • Rock solid balance sheet. • Very high employee satisfaction ratings from a loyal and dedicated global team. 8.13 EMPLOYEE SATISFACTION RATING This is based on a 1-10 scale with the latter being the highest 6% 39% 55% LONG STANDING CUSTOMER RELATIONSHIPS 23 Customers Less than 5 Years 28 Customers 5-10 Years 24 Customers More than 10 Years Percentages are relative to sales for the 9 months ended 3/31/16.

WHY INVEST IN KIMBALL ELECTRONICS Poised to Win Market Share 7 KIMBALL ELECTRONICS • As a more focused alternative • With a tightly integrated global footprint and CRM model designed for global support • With the right resources and capabilities that are aligned with the needs and preferences of our customers Ranking # of Customers Trailing 4 Quarters Net Sales % Increase (Decrease) Automotive 8th 15 $319.4M 9% Medical 7th 26 $242.1M 1% Industrial 19th 19 $182.8M (11%) Public Safety 9th 15 $61.4M 1% Source: Manufacturing Market Insider (MMI) 2015 MMI Top 50 EMS Providers Goal to be $1 Billion company by FY ‘18 $1B MMI KEI 7.7% 6.8% THREE YEAR CAGR (Unaudited)
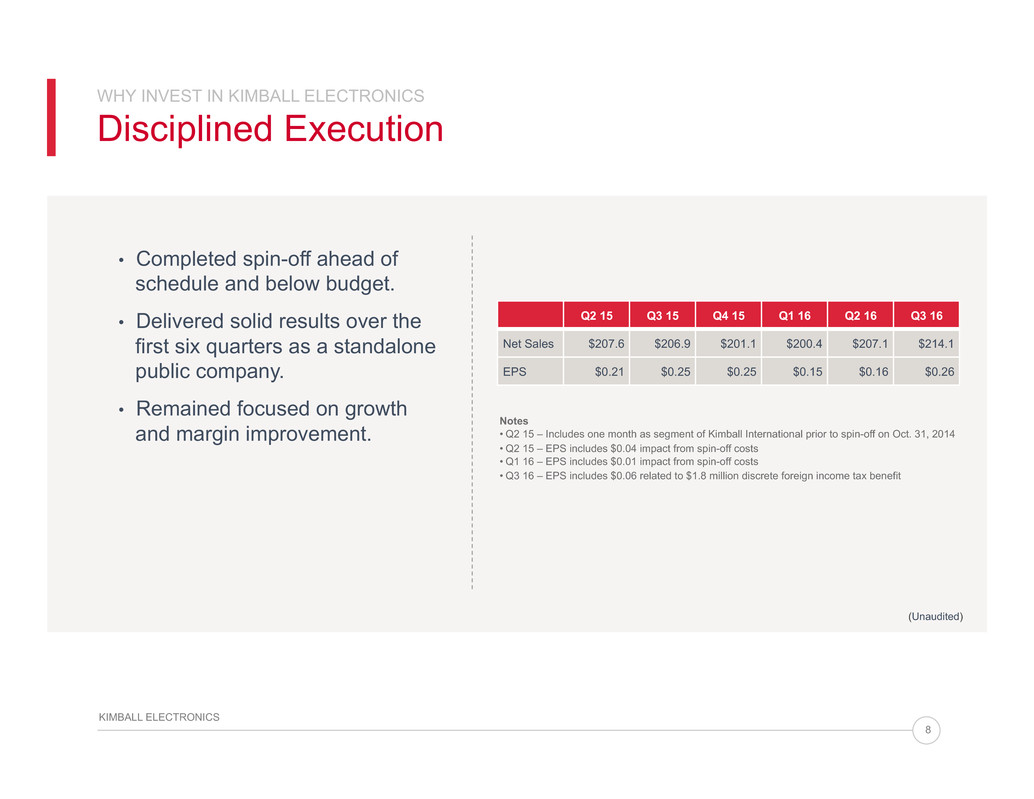
WHY INVEST IN KIMBALL ELECTRONICS Disciplined Execution 8 KIMBALL ELECTRONICS • Completed spin-off ahead of schedule and below budget. • Delivered solid results over the first six quarters as a standalone public company. • Remained focused on growth and margin improvement. Q2 15 Q3 15 Q4 15 Q1 16 Q2 16 Q3 16 Net Sales $207.6 $206.9 $201.1 $200.4 $207.1 $214.1 EPS $0.21 $0.25 $0.25 $0.15 $0.16 $0.26 Notes • Q2 15 – Includes one month as segment of Kimball International prior to spin-off on Oct. 31, 2014 • Q2 15 – EPS includes $0.04 impact from spin-off costs • Q1 16 – EPS includes $0.01 impact from spin-off costs • Q3 16 – EPS includes $0.06 related to $1.8 million discrete foreign income tax benefit (Unaudited)
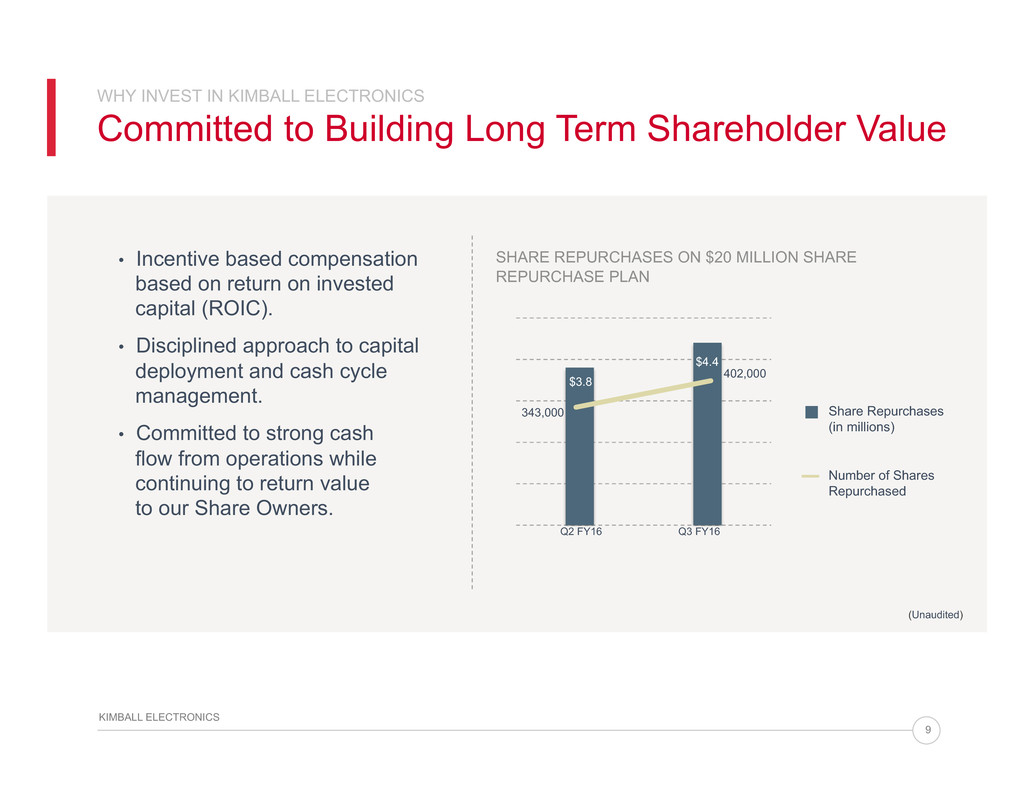
WHY INVEST IN KIMBALL ELECTRONICS Committed to Building Long Term Shareholder Value 9 KIMBALL ELECTRONICS • Incentive based compensation based on return on invested capital (ROIC). • Disciplined approach to capital deployment and cash cycle management. • Committed to strong cash flow from operations while continuing to return value to our Share Owners. Q2 FY16 Q3 FY16 343,000 $4.4 Share Repurchases (in millions) Number of Shares Repurchased SHARE REPURCHASES ON $20 MILLION SHARE REPURCHASE PLAN 402,000 (Unaudited) $3.8

KIMBALL ELECTRONICS Strategic Plan COMMUNICATION & COLLABORATION PEOPLE & SYSTEMS OPERATIONAL EXCELLENCE GROWTH & DIVERSIFICATION 10 KIMBALL ELECTRONICS
?Growth & Diversification

COMPELLING INDUSTRY DYNAMICS: Worldwide EMS Industry Revenue Forecast 2014-2018 CAGR EMS Sector 5% ODM Sector 3% Source: IDC EMS: Electronic Manufacturing Services–contract manufacturers who provide outsourcing services ODM: Original Design Manufacturing–provide design services, support and products for OEMs and may also sell their own branded products Note: EMS Sector + ODM Sector = EMS Industry 12 KIMBALL ELECTRONICS EMS ODM $422.5 $445.9 $469.1 $492.2 $517.4 2014 2015 2016 2017 2018 IN BILLIONS
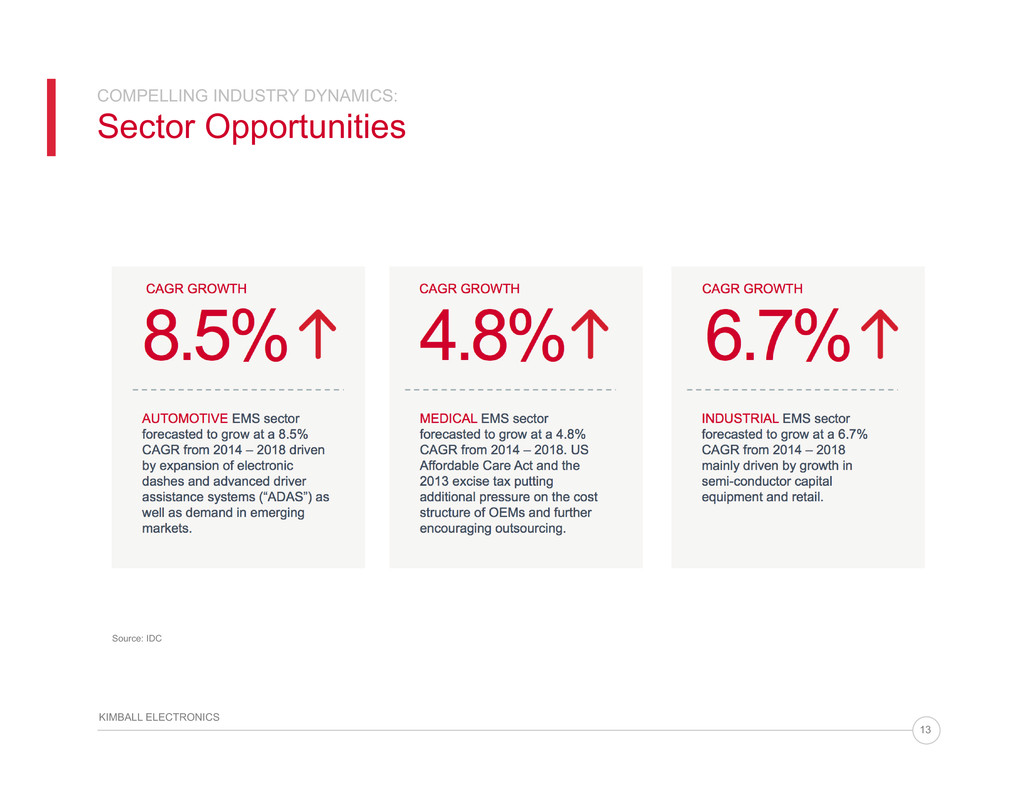
COMPELLING INDUSTRY DYNAMICS: Sector Opportunities AUTOMOTIVE EMS sector forecasted to grow at a 8.5% CAGR from 2014 – 2018 driven by expansion of electronic dashes and advanced driver assistance systems (“ADAS”) as well as demand in emerging markets. 8.5% CAGR GROWTH 13 KIMBALL ELECTRONICS MEDICAL EMS sector forecasted to grow at a 4.8% CAGR from 2014 – 2018. US Affordable Care Act and the 2013 excise tax putting additional pressure on the cost structure of OEMs and further encouraging outsourcing. 4.8% CAGR GROWTH INDUSTRIAL EMS sector forecasted to grow at a 6.7% CAGR from 2014 – 2018 mainly driven by growth in semi-conductor capital equipment and retail. 6.7% CAGR GROWTH Source: IDC
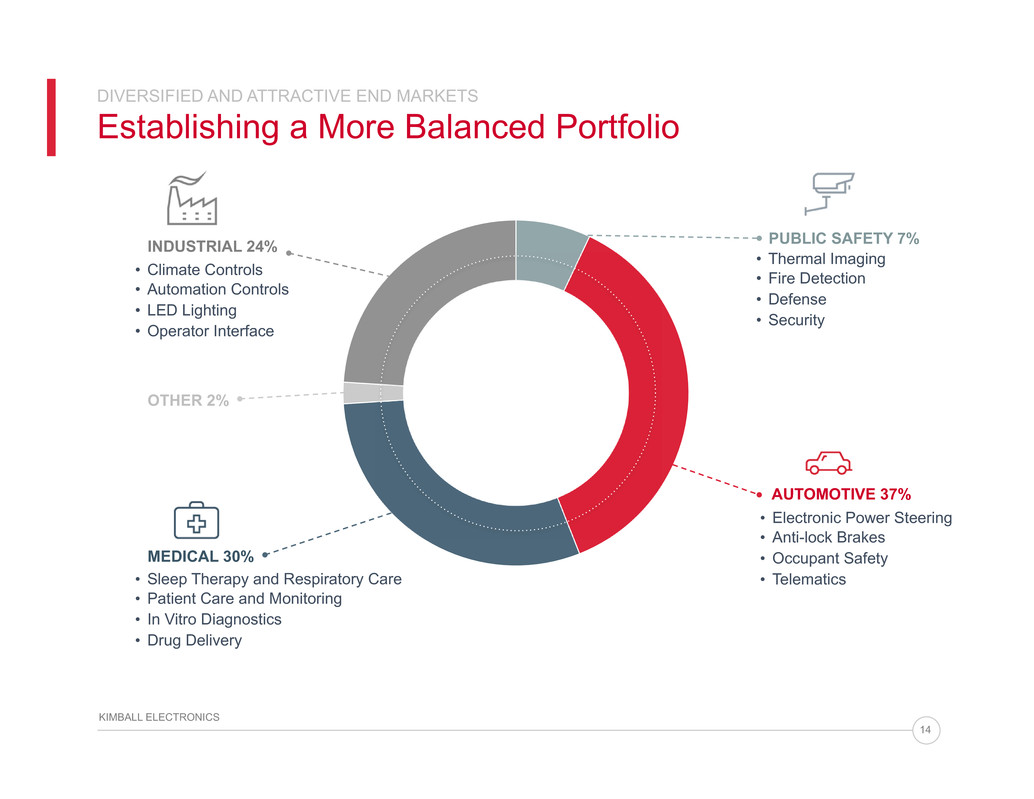
DIVERSIFIED AND ATTRACTIVE END MARKETS Establishing a More Balanced Portfolio 14 KIMBALL ELECTRONICS AUTOMOTIVE 37% • Electronic Power Steering • Anti-lock Brakes • Occupant Safety • Telematics • Thermal Imaging • Fire Detection • Defense • Security PUBLIC SAFETY 7% MEDICAL 30% • Sleep Therapy and Respiratory Care • Patient Care and Monitoring • In Vitro Diagnostics • Drug Delivery OTHER 2% • Climate Controls • Automation Controls • LED Lighting • Operator Interface INDUSTRIAL 24%

Our Automotive market team manufactures assemblies for power steering controls that boost performance, improve driver safety and will one day help make autonomous driving a common feature in automobiles. DIVERSIFIED AND ATTRACTIVE END MARKETS Automotive Market 15 KIMBALL ELECTRONICS 5 Facilities Worldwide 37% • Electronic Power Steering • Anti-lock Brakes • Occupant Safety • Telematics AUTOMOTIVE 1 in 6 Vehicles produced worldwide contain Kimball Electronics assemblies are ISO/TS16949 certified and produce products for the Automotive Industry
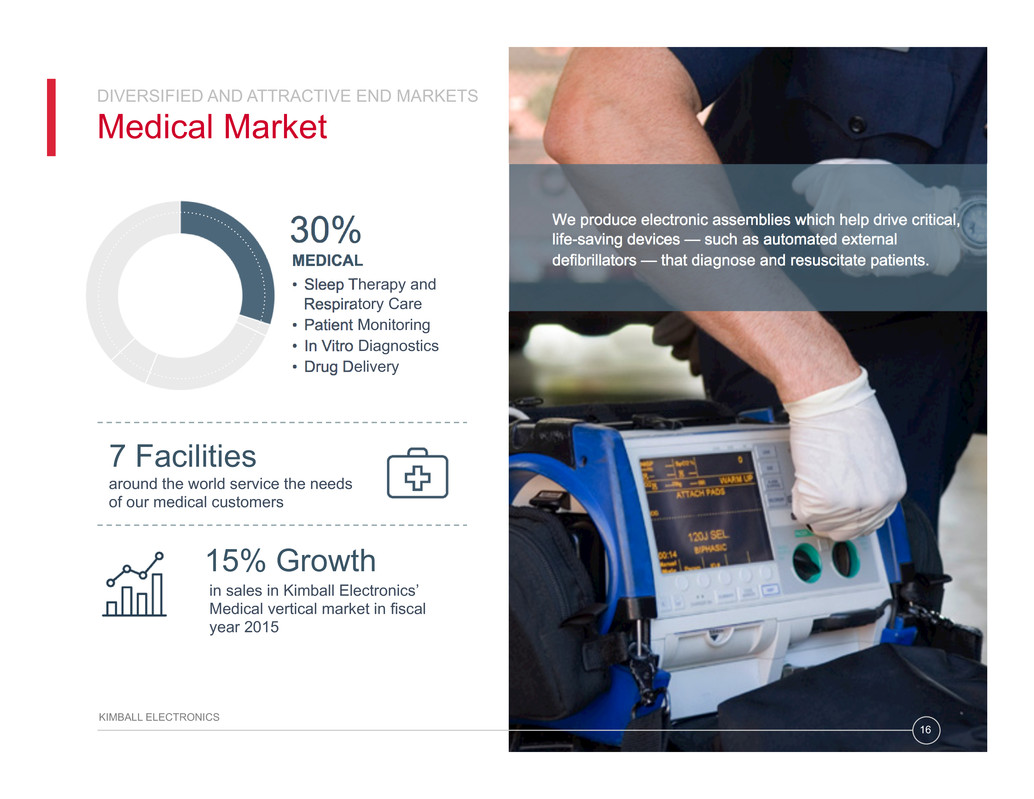
We produce electronic assemblies which help drive critical, life-saving devices — such as automated external defibrillators — that diagnose and resuscitate patients. DIVERSIFIED AND ATTRACTIVE END MARKETS Medical Market 16 KIMBALL ELECTRONICS 30% • Sleep Therapy and Respiratory Care • Patient Monitoring • In Vitro Diagnostics • Drug Delivery MEDICAL 7 Facilities around the world service the needs of our medical customers 15% Growth in sales in Kimball Electronics’ Medical vertical market in fiscal year 2015

We manufacture electronic assemblies for HVAC applications that improve energy efficiency while maintaining reliable performance. DIVERSIFIED AND ATTRACTIVE END MARKETS Industrial Market 17 KIMBALL ELECTRONICS 2 MILLION+ high efficiency pump controls manufactured globally in fiscal year 2015 24% • Climate Controls • Automation Controls • LED Lighting • Operator Interface INDUSTRIAL 26% Growth in the number of customers we support worldwide

Our Public Safety team supports our customers’ needs by assembling electronics that are critical to protecting lives, equipment and facilities. DIVERSIFIED AND ATTRACTIVE END MARKETS Public Safety Market 18 KIMBALL ELECTRONICS 1 MILLION+ safety assemblies shipped worldwide in fiscal year 2015 7% • Thermal Imaging • Fire Detection • Defense • Security PUBLIC SAFETY 16% Growth in revenue in the public safety vertical

DIVERSIFIED AND ATTRACTIVE END MARKETS End Market Evolution 19 KIMBALL ELECTRONICS Automotive 82% Medical 5% Industrial 11% Public Safety 2% Automotive 37% Medical 30% Industrial 24% Public Safety 7% Other 2% FY 2004 FY 2015

BLUE CHIP CUSTOMER BASE Reputation Comes from the Company You Keep 20 KIMBALL ELECTRONICS Healthcare Healthcare Medical

?Operational Excellence

KEMX Reynosa, Mexico KETA Tampa, FL KEJ Jasper, IN KEPS Poznan, Poland KETL Laem Chabang, Thailand KECN Nanjing, China KERO Timisoara, Romania 22 KIMBALL ELECTRONICS 4,300+ Employees Worldwide 1,160,000 sq. ft. Total Facility Square Footage KEIND Indianapolis, IN KIMBALL ELECTRONICS Global Manufacturing Footprint
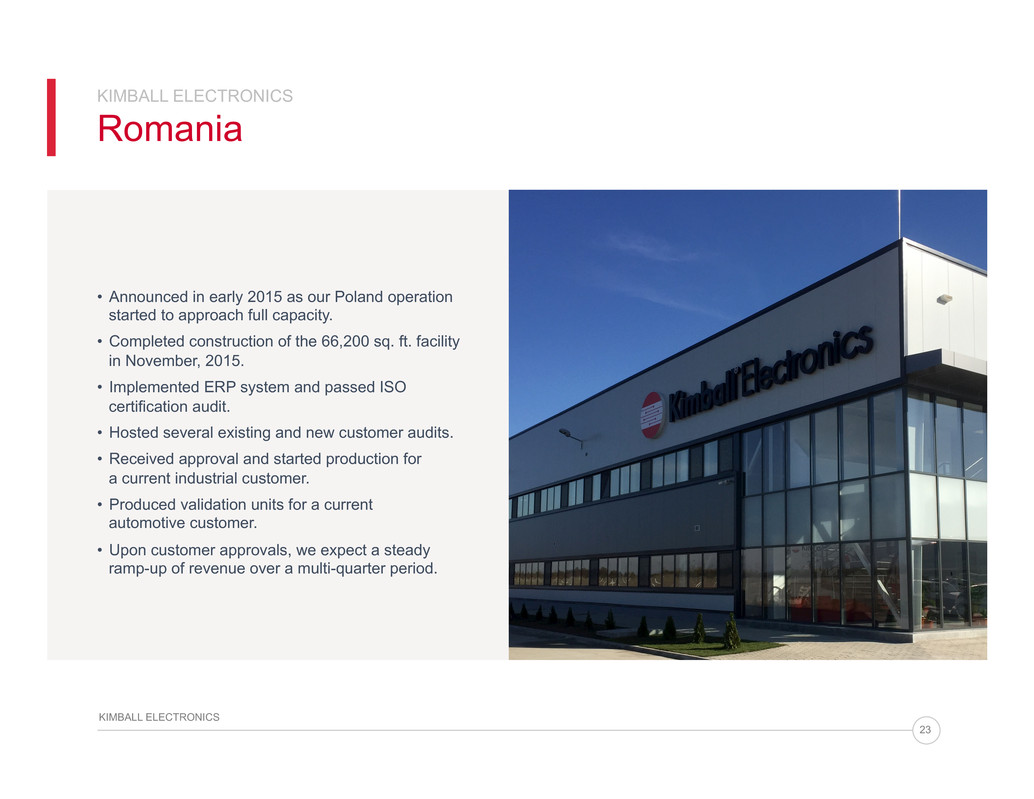
23 KIMBALL ELECTRONICS ? • Announced in early 2015 as our Poland operation started to approach full capacity. • Completed construction of the 66,200 sq. ft. facility in November, 2015. • Implemented ERP system and passed ISO certification audit. • Hosted several existing and new customer audits. • Received approval and started production for a current industrial customer. • Produced validation units for a current automotive customer. • Upon customer approvals, we expect a steady ramp-up of revenue over a multi-quarter period. KIMBALL ELECTRONICS Romania

KIMBALL ELECTRONICS Best-in-Class Manufacturing Operations 24 KIMBALL ELECTRONICS Disciplined quality management system that is certified to global standards and compliant with various regulatory requirements. Common business operating system supported by one ERP system, global processes and procedures. Experienced body of knowledge for the production of high quality, high reliability, and durable electronics. Established lean six sigma practices that provide a solid foundation for problem solving and continuous improvement. Tight process controls for change management and complete traceability with supporting process interlocks.

KIMBALL ELECTRONICS International Quality System Certifications 25 KIMBALL ELECTRONICS ISO 9001 CERTIFIED ISO 13485 CERTIFIED ????????? ISO/TS 16949 CERTIFIED ??????????? ITAR COMPLIANT ????????????????????? FDA REGISTERED ????????? ISO 14001 CERTIFIED ????????????????

?People & Systems

? 27 KIMBALL ELECTRONICS KIMBALL ELECTRONICS People & Systems Our guiding principles and company culture are keys to our ability to attract and retain talent and deliver award winning service. Our incentive based compensation philosophy based on the principles of economic value add (ROIC) drives alignment and disciplined execution. All of our manufacturing operations run on a single instance of SAP supporting collaboration and consistency across the company. Our systems strategy enables operating leverage, lower cost of compliance, and ease of doing business.

?Communication & Collaboration
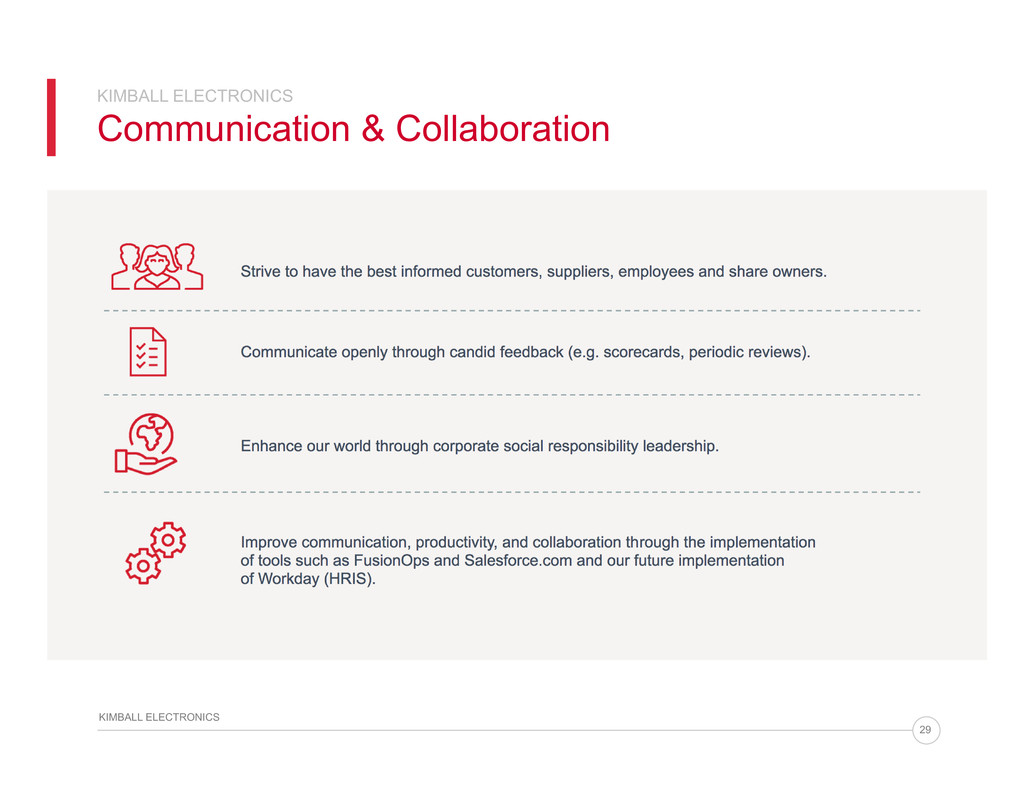
29 KIMBALL ELECTRONICS ? KIMBALL ELECTRONICS Communication & Collaboration Communicate openly through candid feedback (e.g. scorecards, periodic reviews). Enhance our world through corporate social responsibility leadership. Improve communication, productivity, and collaboration through the implementation of tools such as FusionOps and Salesforce.com and our future implementation of Workday (HRIS). Strive to have the best informed customers, suppliers, employees and share owners.
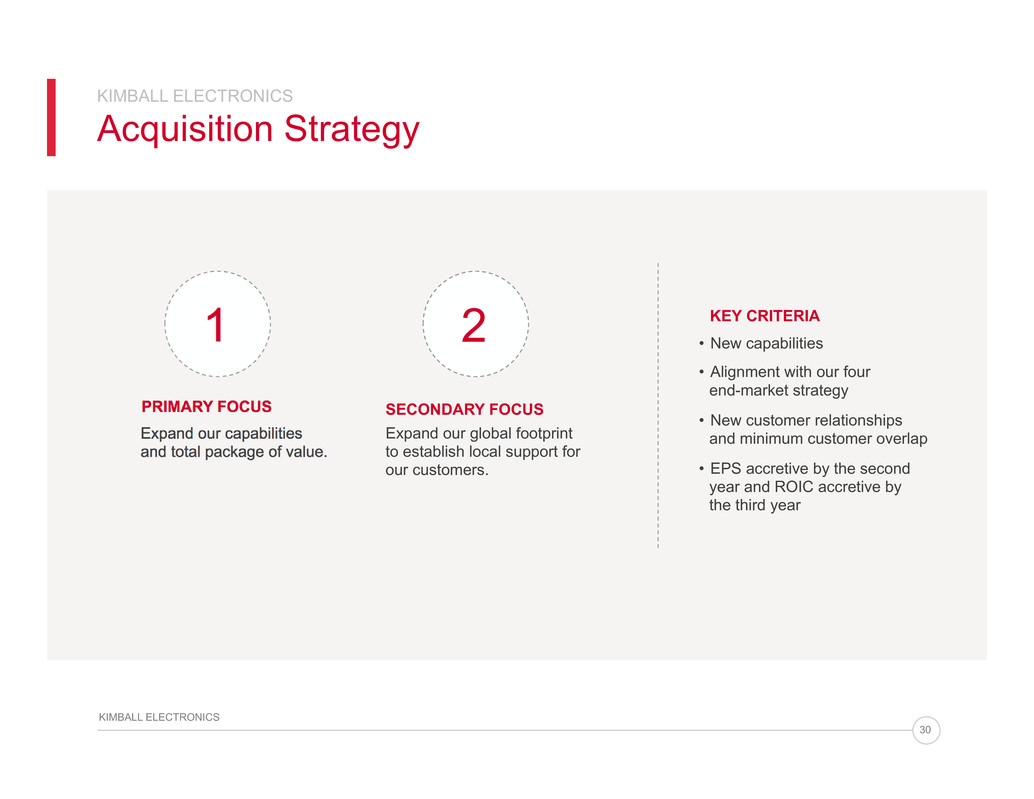
? KIMBALL ELECTRONICS Acquisition Strategy 30 KIMBALL ELECTRONICS Expand our capabilities and total package of value. 1 PRIMARY FOCUS Expand our global footprint to establish local support for our customers. 2 SECONDARY FOCUS KEY CRITERIA • New capabilities • Alignment with our four end-market strategy • New customer relationships and minimum customer overlap • EPS accretive by the second year and ROIC accretive by the third year
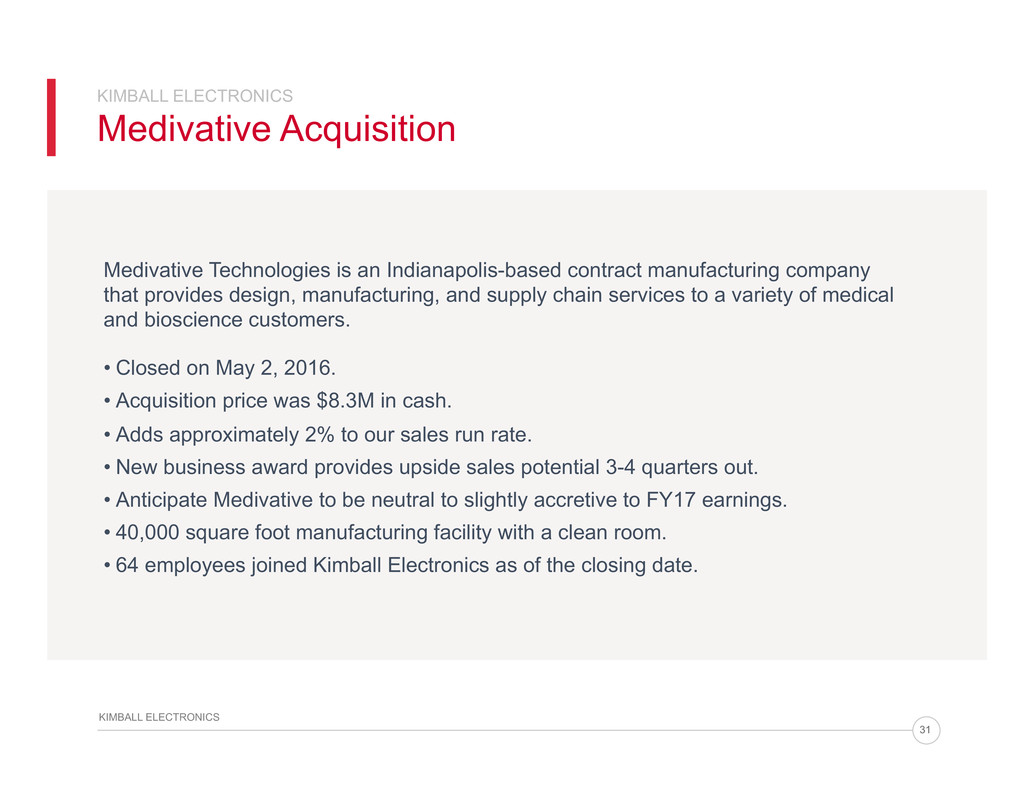
? KIMBALL ELECTRONICS Medivative Acquisition 31 KIMBALL ELECTRONICS Medivative Technologies is an Indianapolis-based contract manufacturing company that provides design, manufacturing, and supply chain services to a variety of medical and bioscience customers. • Closed on May 2, 2016. • Acquisition price was $8.3M in cash. • Adds approximately 2% to our sales run rate. • New business award provides upside sales potential 3-4 quarters out. • Anticipate Medivative to be neutral to slightly accretive to FY17 earnings. • 40,000 square foot manufacturing facility with a clean room. • 64 employees joined Kimball Electronics as of the closing date.

KIMBALL ELECTRONICS Medivative Acquisition 32 KIMBALL ELECTRONICS ? Adds strategic capabilities and experience in: Mechanical Design • Precision Plastics • Combination Devices Complex System Assembly • Instruments Adds strategic relationships with a number of well-known medical and bioscience customers.

?Kimball Electronics Financial Overview

34 KIMBALL ELECTRONICS ? FINANCIAL OVERVIEW Net Sales $190 $195 $200 $205 $210 $215 $220 Q4 ‘14 Q1 ‘15 Q2 ‘15 Q3 ‘15 Q4 ‘15 Q1 ‘16 Q2 ‘16 Q3 ‘16 $199 $204 $208 $207 $201 $200 $207 $214 +4% from Q3’15 IN MILLIONS (Unaudited)

35 KIMBALL ELECTRONICS ? FINANCIAL OVERVIEW Net Sales Mix by Vertical Market ???? ???? ???? ???? ???? ???? ???? ???? 28% 30% 30% 29% 29% 29% 29% 31% ???? ???? ???? ???? ???? ???? ???? ???? ??? ??? ??? ??? ??? ??? ??? ??? ??? ??? ??? ??? ??? ??? ??? ??? 0% 10% 20% 30% 40% 50% 60% 70% 80% 90% 100% Automotive Medical Industrial Public Safety Other Q4 ‘14 Q1 ‘15 Q2 ‘15 Q3 ‘15 Q4 ‘15 Q1 ‘16 Q2 ‘16 Q3 ‘16 % OF SALES (Unaudited)

36 KIMBALL ELECTRONICS ? FINANCIAL OVERVIEW Gross Margin % (Unaudited) 9.1% 8.8% 8.6% 9.2% 8.8% 7.6% 7.8% 7.6% 0.0% 1.0% 2.0% 3.0% 4.0% 5.0% 6.0% 7.0% 8.0% 9.0% 10.0% Q4 ‘14 Q1 ‘15 Q2 ‘15 Q3 ‘15 Q4 ‘15 Q1 ‘16 Q2 ‘16 Q3 ‘16 % OF SALES

37 KIMBALL ELECTRONICS ? FINANCIAL OVERVIEW Selling & Administrative Expense (%) (Excludes spin-off costs*) 4.5% 4.5% 3.8% 3.8% 4.3% 4.1% 4.5% 4.3% 3.4% 3.6% 3.8% 4.0% 4.2% 4.4% 4.6% Q4 ‘14 Q1 ‘15 Q2 ‘15 Q3 ‘15 Q4 ‘15 Q1 ‘16 Q2 ‘16 Q3 ‘16 % OF SALES *Spin-off costs excluded by quarter were Q4’14 - $1.4M (0.7%), Q1’15 - $1.0M (0.5%), Q2’15 - $1.3M (0.6%), Q3’15 - $0.3M (0.2%), Q1’16 - $0.1M (0.0%) (Unaudited)

? Q4 ‘14 Q1 ‘15 Q2 ‘15 Q3 ‘15 Q4 ‘15 Q1 ‘16 Q2 ‘16 Q3 ‘16 Adj Op Income % of Net Sales IN MILLIONS % OF SALES (Unaudited) $9.2 $8.8 $10.0 $11.1 $9.1 $7.1 $6.9 $7.1 $0.0 $2.0 $4.0 $6.0 $8.0 $10.0 $12.0 4.6% 4.3% 4.8% 5.4% 4.5% 3.5% 3.3% 3.3% 0.0% 1.0% 2.0% 3.0% 4.0% 5.0% 6.0% 38 KIMBALL ELECTRONICS FINANCIAL OVERVIEW Adjusted Operating Income (Excludes spin-off costs) Note: Adjusted Operating Income is a Non-GAAP measure – refer to Reconciliation of Non-GAAP Results on the final slide.

? Note: Q3’16 includes a $1.8 million discrete foreign tax benefit related to the capitalization of our Romania subsidiary; Adjusted Net Income is a Non-GAAP measure – refer to Reconciliation of Non-GAAP Results on the final slide. IN MILLIONS Q4 ‘14 Q1 ‘15 Q2 ‘15 Q3 ‘15 Q4 ‘15 Q1 ‘16 Q2 ‘16 Q3 ‘16 (Unaudited) $6.8 $6.4 $7.4 $7.5 $7.4 $4.6 $4.6 $7.5 $0.0 $1.0 $2.0 $3.0 $4.0 $5.0 $6.0 $7.0 $8.0 39 KIMBALL ELECTRONICS FINANCIAL OVERVIEW Adjusted Net Income (Excludes spin-off costs)

? $13.4 $13.0 $15.0 $15.0 $13.7 $11.2 $11.2 $11.9 $0.0 $2.0 $4.0 $6.0 $8.0 $10.0 $12.0 $14.0 $16.0 40 KIMBALL ELECTRONICS FINANCIAL OVERVIEW Adjusted EBITDA (Unaudited) (Excludes spin-off costs) Note: Adjusted EBITDA is a Non-GAAP measure – refer to Reconciliation of Non-GAAP Results on the final slide. IN MILLIONS Q4 ‘14 Q1 ‘15 Q2 ‘15 Q3 ‘15 Q4 ‘15 Q1 ‘16 Q2 ‘16 Q3 ‘16

? $6.4 -$4.5 $8.0 $7.7 $16.8 -$0.5 $16.8 $11.7 -$10.0 -$5.0 $0.0 $5.0 $10.0 $15.0 $20.0 41 KIMBALL ELECTRONICS FINANCIAL OVERVIEW Operating Cash Flow (Unaudited) IN MILLIONS Q4 ‘14 Q1 ‘15 Q2 ‘15 Q3 ‘15 Q4 ‘15 Q1 ‘16 Q2 ‘16 Q3 ‘16
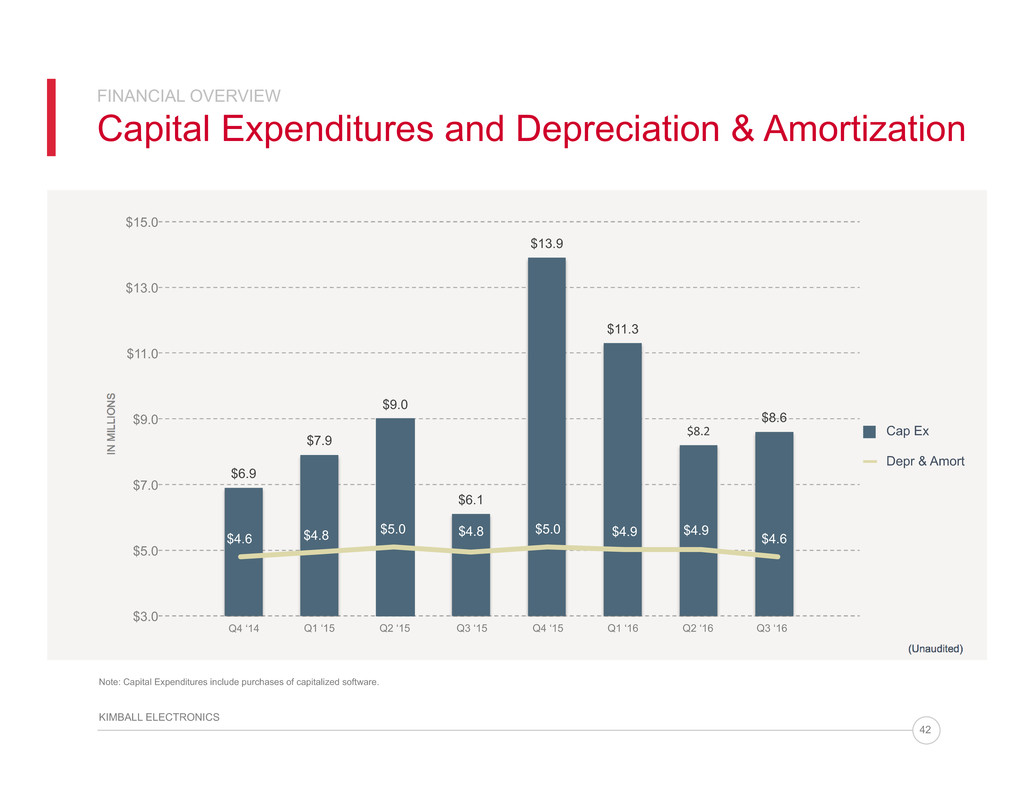
? 42 FINANCIAL OVERVIEW Capital Expenditures and Depreciation & Amortization (Unaudited) KIMBALL ELECTRONICS IN MILLIONS $6.9 $7.9 $9.0 $6.1 $13.9 $11.3 ????? $8.6 $3.0 $5.0 $7.0 $9.0 $11.0 $13.0 $15.0 $4.6 $4.8 $5.0 $4.8 $5.0 $4.9 $4.9 $4.6 Depr & Amort Note: Capital Expenditures include purchases of capitalized software. Q4 ‘14 Q1 ‘15 Q2 ‘15 Q3 ‘15 Q4 ‘15 Q1 ‘16 Q2 ‘16 Q3 ‘16 Cap Ex
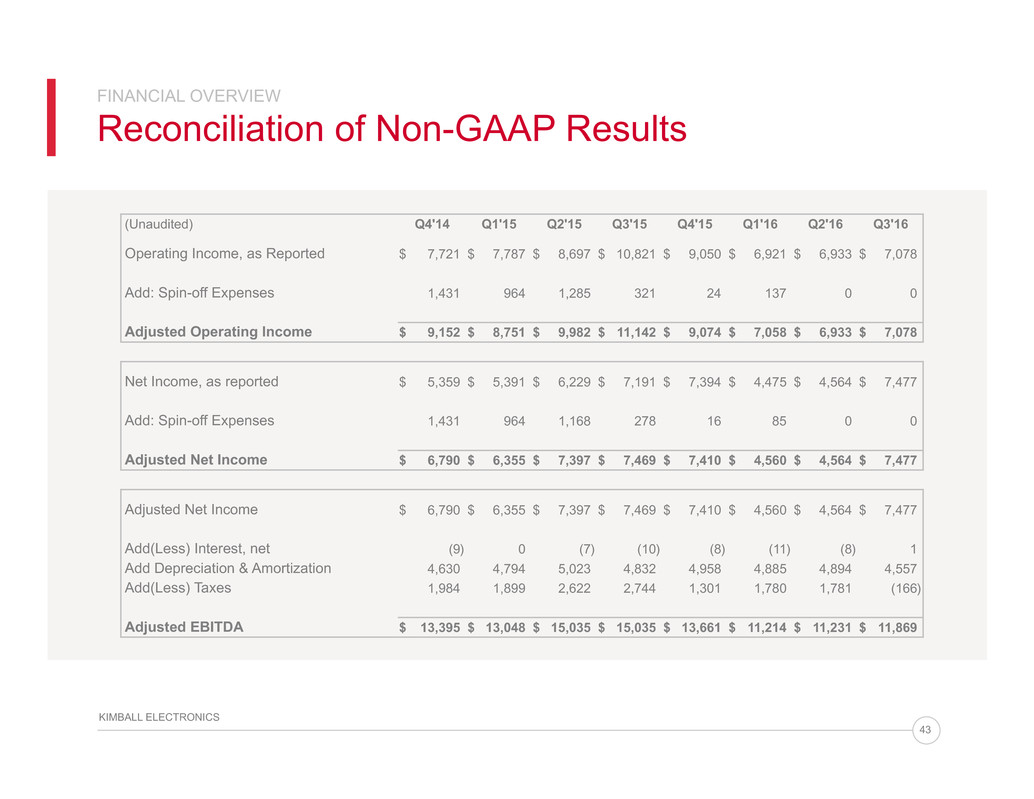
? 43 KIMBALL ELECTRONICS FINANCIAL OVERVIEW Reconciliation of Non-GAAP Results (Unaudited) Q4'14 Q1'15 Q2'15 Q3'15 Q4'15 Q1'16 Q2'16 Q3'16 Operating Income, as Reported $ 7,721 $ 7,787 $ 8,697 $ 10,821 $ 9,050 $ 6,921 $ 6,933 $ 7,078 Add: Spin-off Expenses 1,431 964 1,285 321 24 137 0 0 Adjusted Operating Income $ 9,152 $ 8,751 $ 9,982 $ 11,142 $ 9,074 $ 7,058 $ 6,933 $ 7,078 Net Income, as reported $ 5,359 $ 5,391 $ 6,229 $ 7,191 $ 7,394 $ 4,475 $ 4,564 $ 7,477 Add: Spin-off Expenses 1,431 964 1,168 278 16 85 0 0 Adjusted Net Income $ 6,790 $ 6,355 $ 7,397 $ 7,469 $ 7,410 $ 4,560 $ 4,564 $ 7,477 Adjusted Net Income $ 6,790 $ 6,355 $ 7,397 $ 7,469 $ 7,410 $ 4,560 $ 4,564 $ 7,477 Add(Less) Interest, net (9) 0 (7) (10) (8) (11) (8) 1 Add Depreciation & Amortization 4,630 4,794 5,023 4,832 4,958 4,885 4,894 4,557 Add(Less) Taxes 1,984 1,899 2,622 2,744 1,301 1,780 1,781 (166) Adjusted EBITDA $ 13,395 $ 13,048 $ 15,035 $ 15,035 $ 13,661 $ 11,214 $ 11,231 $ 11,869
