Attached files
| file | filename |
|---|---|
| EX-32.1 - EX-32.1 - InvenSense Inc | d179874dex321.htm |
| EX-31.2 - EX-31.2 - InvenSense Inc | d179874dex312.htm |
| EX-31.1 - EX-31.1 - InvenSense Inc | d179874dex311.htm |
| EX-23.1 - EX-23.1 - InvenSense Inc | d179874dex231.htm |
| EX-21.1 - EX-21.1 - InvenSense Inc | d179874dex211.htm |
Table of Contents
UNITED STATES
SECURITIES AND EXCHANGE COMMISSION
Washington, DC 20549
FORM 10-K
(Mark One)
| x | Annual report pursuant to Section 13 or 15(d) of the Securities Exchange Act of 1934 for the fiscal year ended April 3, 2016 |
or
| ¨ | Transition report pursuant to Section 13 or 15(d) of the Securities Exchange Act of 1934 for the transition period from to |
Commission File Number 001-35269
INVENSENSE, INC.
(Exact name of registrant as specified in its charter)
| Delaware | 01-0789977 | |
| (State or other jurisdiction of | (I.R.S. Employer | |
| Incorporation or organization) | Identification No.) | |
| 1745 Technology Drive, Suite 200, San Jose, California | 95110 | |
| (Address of principal executive offices) | (Zip code) | |
(408) 501-2200
(Registrant’s telephone number, including area code)
Securities registered pursuant to Section 12(b) of the Act:
| Title of Each Class |
Name of Each Exchange on Which Registered | |
| Common Stock, $0.001 Par Value | New York Stock Exchange LLC |
Securities registered pursuant to Section 12(g) of the Act:
None
Indicate by check mark if the registrant is a well-known seasoned issuer, as defined in Rule 405 of the Securities Act. YES ¨ NO x
Indicate by check mark if the registrant is not required to file reports pursuant to Section 13 or Section 15(d) of the Act. YES ¨ NO x
Indicate by check mark whether the registrant (1) has filed all reports required to be filed by Section 13 or 15(d) of the Securities Exchange Act of 1934 during the preceding 12 months (or for such shorter period that the registrant was required to file such reports), and (2) has been subject to such filing requirements for the past 90 days. YES x NO ¨
Indicate by check mark whether the registrant has submitted electronically and posted on its corporate Web site, if any, every Interactive Data File required to be submitted and posted pursuant to Rule 405 of Regulation S-T during the preceding 12 months (or for such shorter period that the registrant was required to submit and post such files). YES x NO ¨
Indicate by check mark if disclosure of delinquent filers pursuant to Item 405 of Regulation S-K is not contained herein, and will not be contained, to the best of registrant’s knowledge, in definitive proxy or information statements incorporated by reference in Part III of this Form 10-K or any amendment to this Form 10-K. ¨
Indicate by check mark whether the registrant is a large accelerated filer, an accelerated filer, a non-accelerated filer, or a smaller reporting company. See the definitions of “large accelerated filer,” “accelerated filer” and “smaller reporting company” in Rule 12b-2 of the Exchange Act:
| Large accelerated filer x | Accelerated filer ¨ | |
| Non-accelerated filer ¨ | Smaller reporting company ¨ | |
| (Do not check if a smaller reporting company) |
Indicate by check mark whether the registrant is a shell company (as defined in Rule 12b-2 of the Act). YES ¨ NO x
Based on the closing sale price of the Common Stock on the New York Stock Exchange on the last day of our second fiscal quarter, the aggregate market value of the Common Stock held by non-affiliates of the registrant was approximately $720 million.
As of May 6, 2016, there were 93,088,000 shares of the registrant’s common stock, $0.001 par value, outstanding.
DOCUMENTS INCORPORATED BY REFERENCE
Information required in response to Part III of Form 10-K (Items 10, 11, 12, 13 and 14) is hereby incorporated by reference to portions of the Registrant’s Proxy Statement for the Annual Meeting of Stockholders to be held in 2016. The Proxy Statement will be filed by the Registrant with the Securities and Exchange Commission no later than 120 days after the end of the registrant’s fiscal year ended April 3, 2016.
Table of Contents
INVENSENSE, INC.
2
Table of Contents
Special Note Regarding Forward-Looking Statements and Industry Data
This Annual Report on Form 10-K, including this Management’s Discussion and Analysis of Financial Condition and Results of Operations, includes a number of forward-looking statements that involve many risks and uncertainties. Forward-looking statements are identified by the use of the words “would”, “could”, “will”, “may”, “expect”, “believe”, “should”, “anticipate”, “outlook”, “if”, “future”, “intend”, “plan”, “estimate”, “predict”, “potential”, “targets”, “seek” or “continue” and similar words and phrases, including the negatives of these terms, or other variations of these terms, that denote future events. These forward-looking statements include our strategy, our expectations as to future sales of consumer electronics devices that could potentially integrate motion processors, our expectation that our products will remain a component of customers’ products throughout any such product’s life cycle, our belief that users of our products are likely to introduce these products into other devices as well as to adopt our more advanced devices, our belief that certain end-markets pose large growth opportunities for motion processing functionality, our ability to protect our intellectual property in the United States and abroad, our freedom to manufacture and sell our product without infringing the intellectual property of third parties, our belief in the sufficiency of our cash flows to meet our needs and our future financial and operating results. These statements reflect our current views with respect to future events and our potential financial performance and are subject to risks and uncertainties that could cause our actual results and financial position to differ materially and adversely from what is projected or implied in any forward-looking statements included in this Annual Report on Form 10-K. These factors include, but are not limited to, the risks described under Item 1A of Part I— “Risk Factors,” Item 7 of Part II— “Management’s Discussion and Analysis of Financial Condition and Results of Operations,” elsewhere in this Annual Report on Form 10-K and those discussed in other documents we file with the SEC. We make these forward-looking statements based upon information available on the date of this Annual Report on Form 10-K, and we have no obligation (and expressly disclaim any such obligation) to update or alter any forward-looking statements, whether as a result of new information or otherwise except as otherwise required by securities regulations.
As used herein, “InvenSense,” the “Company,” “we,” “our,” and similar terms refer to InvenSense, Inc., unless the context indicates otherwise.
InvenSense, MotionTracking, MotionProcessing, MotionProcessor, MotionFusion, MotionApps, DMP, AAR, and the InvenSense logo are trademarks of InvenSense, Inc. Other company and product names may be trademarks of the respective companies with which they are associated.
3
Table of Contents
PART I.
| Item 1. | Business. |
Overview
We are a leader in sensor solutions, particularly sensors that combine microelectromechanical systems (MEMS) transducers, such as accelerometers, gyroscopes, barometers, compasses, and microphones, with proprietary algorithms, processors and firmware that synthesize and calibrate sensor output data. Our solutions typically detect and track a host device’s (e.g. smartphone) motion, direction, elevation, and what it is hearing. When an end user is holding or attached to such a host device, our solutions can detect and track many types of data about the end user. We leverage our intellectual property in MEMS design and manufacturing to reduce sensor size, cost and power. Our proprietary algorithms improve the speed and accuracy of sensor output data, and our application programming interfaces (APIs) and design tools simplify the task of incorporating sensor output into end user applications.
While our solutions have broad applicability, we currently target the mobile, automotive, gaming, industrial, drone, wearables, smart home and other internet of things (IoT ) markets. We utilize a fabless model, leveraging generally available complementary metal oxide semiconductor (CMOS) and MEMS foundries to whom we have granted licenses to use our proprietary additions and improvements for our benefit, as well as semiconductor packaging and services vendors. We perform the critical test and calibration functions in our wholly owned subsidiary located in Hsinchu, Taiwan. We design our products and solutions in California, Massachusetts, China, Taiwan, Korea, Japan, France, Canada, Slovakia, and Italy. We sell our products to consumer electronics device manufacturers, original design manufacturers and contract manufacturers through our direct worldwide sales organization and through our channel of distributors. Recently, we have also begun offering sensor data analytics platforms and services for which we leverage third party computer servers. We operate and track our results in one operating segment for financial reporting purposes. We are headquartered in San Jose, California and had 632 employees as of April 3, 2016.
Our strategy is to develop and offer products that meet customer performance and cost requirements, are easy to integrate into our customers’ products, and set industry performance benchmarks. Our ability to secure new customers depends primarily on winning competitive selection processes, known as design wins. These selection processes are typically lengthy, and, as a result, our sales vary based on such factors as the end-user market, whether the design win is with an existing or a new customer, and whether our product is a first or subsequent generation product. Because the sales cycle for our products is long and the market is competitive, we often incur design and development support expenditures in circumstances where we do not realize any revenue for an extended period of time, or at all. We typically do not receive long-term purchase commitments from our customers. While our product life cycles vary by application, once one of our solutions is incorporated into a customer’s design, it often remains a component of the customer’s designed product for the product’s life cycle. Once a customer introduces one of our products (or a competing supplier’s product) into one of their devices, we believe they are likely to introduce it into other products.
We were incorporated in California in June 2003 and reincorporated in Delaware in October 2004. Our principal executive offices are located at 1745 Technology Drive Suite 200, San Jose, CA 95110. Our telephone number is (408) 501-2200. Our website is located at www.invensense.com and our investor relations website is located at ir.invensense.com.
Our fiscal year is a 52 or 53 week period ending on the Sunday closest to March 31. Our three most recent fiscal years ended on April 3, 2016 (“fiscal year 2016”), March 29, 2015 (“fiscal year 2015”) and March 30, 2014 (“fiscal year 2014”). Fiscal year 2016 was comprised on 53 weeks, and fiscal years 2015 and 2014 was comprised of 52 weeks each.
4
Table of Contents
Our net revenue was $418.4 million, $372.0 million, and $252.5 million for fiscal years 2016, 2015, and 2014, respectively, and our net income (loss) was $(21.2) million, $(1.1) million, and $6.1 million for these periods, respectively.
Industry Background
Advances in technology have led to the wide proliferation of industrial and consumer electronics devices containing sensors. In order to differentiate their products, industrial and end-user device designers and manufacturers are eager to adopt new sensor-enabled features and create compelling human-machine interfaces and interactive experiences that expand the utility of their products.
Use of MEMS-based audio sensors has grown significantly in consumer electronics. Steady improvement in the size, power consumption, cost, manufacturing methods, calibration requirements, performance and other design complexities involved with MEMS motion sensors and MEMS audio sensors has led to adoption in various industries.
We believe the following five principal types of MEMS sensors, and the data they generate, are particularly important to our business:
| • | Accelerometers measure linear acceleration and tilt angle. Single and multi-axis accelerometers detect the combined magnitude and direction of linear, rotational and gravitational acceleration. They can be used to provide motion sensing functionality. For example, a device with an accelerometer can detect its rotation from a vertical orientation to a horizontal orientation in a fixed location. As a result, accelerometers along with motion processing algorithms are primarily used for simple motion sensing applications in consumer devices, such as changing the screen of a mobile device from portrait to landscape orientation, counting the steps a user takes over a given period of time, and even activity classification such as walking and running. |
| • | Gyroscopes (Gyros) measure the angular rate of rotational movement about one or more axes, such as in a video game controller, or jitter, such as in an image stabilizer. While accelerometers primarily detect movement in a particular direction, and are more prone to error in complex motion scenarios, gyroscopes can measure complex motion accurately in free space, and therefore can be effective tools for tracking position. |
| • | Magnetic Sensors (Compasses) detect magnetic fields and measure their absolute position relative to the Earth’s magnetic north and nearby magnetic materials. Information from magnetic sensors can also be used to correct errors from other motion sensors, such as gyroscopes. One example of how magnetic sensors are used in consumer devices is reorienting a displayed map to match the general direction the device displaying the map is facing. |
| • | Pressure Sensors (Barometers) measure relative and absolute altitude through the analysis of changing atmospheric pressure. Pressure sensors can be used in consumer devices for sports and fitness or location-based applications, where the information provided by such sensors can be used to count the number of flights of stairs a user has climbed to improve the accuracy of a calorie counter or to measure elevation (or a change thereof). |
| • | Audio Sensors (Microphones) detect audible sound, as well as ultrasound in some use cases. The waveform audio signal received by a microphone is delivered to circuits that convert the signal into a digital signal to be processed, transmitted, played back or stored. Microphones are used in devices like mobile phones, digital still and video cameras, laptops, headsets, smart watches, remote controls, cars and even industrial applications. Mobile phones and cars often contain several microphones mated with sound-processing algorithms in order to ensure high quality pick up of the desired audio signal. |
5
Table of Contents
The InvenSense Solution
We have developed a range of proprietary, intelligent, integrated devices that sense motion, audio, or both, as well as algorithms that make the data collected by such devices useful in myriad applications. Our products span levels of integration and data analytics, from standalone single-chip gyroscopes to multi-sensor, multi-core systems-on-chip, or SOCs, which are composed of several fundamental proprietary components.
| • | Our MEMS-based motion sensors combined with our mixed-signal circuitry for signal processing provide the functionality required to measure motion in three-dimensional space. |
| • | Our MotionFusion technology, a digital signal processor that calibrates the sensors during runtime and intelligently converts raw sensor data from multiple sensors into application-specific data. |
| • | Our MotionApps and Sensor Studio platforms provide graphical and application programming interfaces (API) for popular operating systems that simplify access to complex functionality commonly needed by our customers while simultaneously accelerating integration of sensor data into applications. |
| • | Our audio technology includes three core components: MEMS elements designed specifically for high-quality audio sensing; Application Specific Integrated Circuits (ASICs)—the circuits that take the raw sensor output and process it for transmission; and packaging technology, which is an important part of the acoustic design of the microphone. We are one of the few microphone suppliers that develops all three components of the entire microphone, giving us better control of the overall acoustic system. This advantage allows us to better support our customers’ needs and deliver differentiated products to market. Besides standard MEMS microphones that have two separate “die”, one for the MEMS element and one for the ASIC, we have developed a patented CMOS-MEMS integrated platform for microphones, analogous to our inertial sensor technology. |
| • | Our patented InvenSense CMOS-MEMS Fabrication Platform allows for high-volume manufacturing of low-cost, high-performance MEMS devices. We believe the platform gives us a competitive advantage. Most MEMS devices are manufactured in proprietary in-house fabrication facilities utilizing numerous fabrication steps, esoteric substrates and MEMS-specific manufacturing processes that are not compatible with standard CMOS fabrication processes. Our fabrication process allows us to utilize a fabless business model without relying on specialty foundries for MEMS manufacturing, and enables cost-effective, high-volume production along with the flexibility to quickly react to our customers’ needs without investing substantial capital. Additionally, our ability to perform wafer-level testing combined with our collaborative relationships with third-party foundries enables us to better control the manufacturing process and obtain better product yields, resulting in lower cost and improved device performance and reliability. Our wafer bonding platform enables direct bonding of MEMS components with related CMOS signal conditioning and logic circuitry. We use MEMS fabrication processes to create wafers containing the structural layers used for our motion and audio sensors and standard CMOS fabrication technology to create wafers that provide drive conditioning circuits, signal conditioning circuits, and the logic circuitry that processes sensor signals to deliver complete MotionTracking and audio solutions. In addition to our CMOS-MEMS wafer bonding process, we have developed low-cost, high-throughput proprietary test and calibration systems, which further reduce back-end costs. We believe that we have pioneered a technological breakthrough in the high-volume manufacture of low-cost, high-performance MEMS sensors. Combining this unique fabrication capacity with our other proprietary technologies, we are able to deliver our sensor SoC devices with industry-leading integration and cost-effectiveness. We have successfully employed our fabrication platform in the high-volume production of 150mm and 200mm wafers, and we have successfully tested the manufacture of 300mm wafers. |
| • | In fiscal year 2016, we announced two significant long term business opportunities. The first is UltraPrint, our ultrasonic fingerprint authentication solution, which leverages a new iteration of our proprietary CMOS-MEMS fabrication platform to provide a dense array of Piezoelectric Micromachined Ultrasonic Transducers (PMUTs) controlled by bonded CMOS logic. We believe that |
6
Table of Contents
| PMUT-based fingerprint will provide new advantages and use cases unserved by incumbent technologies. The second is Coursa, a cloud-based motion data platform, enabling analysis and understanding of user activities (Coursa Sports) and retail shopper behavior (Coursa Retail). We have not yet realized material revenue from either of these initiatives. |
Markets and Customers
Our end customers include several of the world’s largest mobile, automotive, wearable, industrial and smart home manufacturers, many diverse smaller customers and those who buy products through distributors and contract manufacturers throughout the world. For fiscal year 2016, Apple Inc., or Apple accounted for 40% of net revenue and Samsung Electronics Co., Ltd., or Samsung accounted for 16% of net revenue. For fiscal year 2015, Apple accounted for 30% of net revenue and Samsung accounted for 28% of net revenue. For fiscal year 2014 Samsung accounted for 35% of total net revenue. Sales to end customers in Asia countries accounted for 54% of our net revenue in fiscal year 2016, 63% of our net revenue in fiscal year 2015 and 87% of our net revenue in fiscal year 2014.
Seasonality of Business
Our business is subject to seasonality because of the nature of our target markets. At present, virtually all of our motion interface products are sold in the consumer electronics market. Sales of consumer electronics tend to be weighted towards holiday periods and periods when our customers typically introduce their own new products. Many consumer electronics manufacturers typically experience seasonality in sales of their products. Holiday seasonality affects the timing and volume of orders for our products as our customers tend to increase production of their products that incorporate our solutions in the second and third quarters of our fiscal year in order to build inventories for the holiday season. Sales of our products tend to correspondingly and generally increase during these quarters and to significantly decrease in the fourth quarter of our fiscal year.
Backlog
Backlog refers to orders we received from our customers or distributors for delivery in the future. As of April 3, 2016, our backlog from customers was $10.2 million, compared to $64.3 million as of March 29, 2015. Due to the short period between receipt of orders and shipment of products to customers, backlog may not be a reliable indicator of future fiscal quarter or fiscal year sales.
Sales and Marketing
We sell our products through our direct worldwide sales organization and through our indirect channel of distributors to manufacturers of consumer electronics devices, original design manufacturers and contract manufacturers.
Our product marketing, business development and application solution engineering teams focus on leveraging our core sensor SoCs for motion and sound across end markets. These teams are responsible for all new applications and market specific engagements, providing customized technical and application support, and identifying new business opportunities and strategic relationships. Furthermore, they work closely with ecosystem partners to further promote and enable the motion and audio interface market. For example, these teams are engaged with leading application providers and may also engage with microcontroller suppliers, operating system platform vendors, independent software developers, and system solution platform vendors. Further, the technical marketing and application engineering teams actively engage with new customers during their design-in processes to educate them on the value proposition of our sensor system on chip devices, identify how they could utilize our solutions in their products and provide them with the most suitable solutions, APIs and potential reference designs.
7
Table of Contents
We work directly with large original equipment manufacturer (OEM) customers and other manufacturers who influence product designs to assist them in developing solutions and applications that may lead to more demand for our products. Early adoptees in new market segments typically take six to twelve months to evaluate their need for motion interface before the start of any development activities, which typically take an additional six to twelve months. For customers that have already adopted motion interface, we typically undertake a shorter sales cycle. If successful, this process culminates in the use of our product in their system, which we refer to as a design win. Volume production can begin shortly after the design win. For our larger OEM customers, we believe that our direct customer engagement approach, ecosystem partnerships and adoption of our APIs into major software operating systems provides us with significant differentiation in the customer sales process by aligning us more closely with the changing needs of these OEM customers and their end markets. We utilize field application engineers as part of our sales process to better engage the customer with our products. To service our other customers, we achieve greater reach by using manufacturers’ representatives and distributors.
Manufacturing
Substantially all of our wafers are currently provided by Taiwan Semiconductor Manufacturing Corporation, Limited (TSMC) and GLOBALFOUNDRIES Inc. For our MotionTracking devices, wafer foundries manufacture both the MEMS and CMOS wafers, perform the critical wafer level bonding step of our patented fabrication process and deliver the final combined CMOS-MEMS wafer product to our wholly owned subsidiary in Hsinchu, Taiwan for proprietary wafer level testing prior to forwarding to our assembly vendors. For our audio devices, wafer foundries manufacture both the MEMS and ASIC wafers and deliver the wafers to our assembly vendors for multi-chip packaging and final test. We primarily outsource our assembly packaging operations to Lingsen Precision Industries, Limited, Siliconware Precision Industries Co. Limited, Advanced Semiconductor Engineering, Inc. and Amkor Technology, Inc. The assembled products are then forwarded to our Hsinchu facility for final calibration and outgoing functionality test and/or shipment to our customers or distributors.
Over the last three years, we believe we have increased our annual manufacturing capacity sufficiently to meet the volume demands of our customers, as well as potential additional demand. We continued to expand our CMOS-MEMS and audio device manufacturing capacity in fiscal year 2016, shipping wafers in high volumes from both TSMC and GLOBALFOUNDRIES Inc., as well as expanding our captive wafer sort, sensor test, and calibration testing facilities in Hsinchu.
Research and Development
We have assembled an experienced team of engineers with competencies in MEMS design and fabrication, CMOS mixed-signal design, and software development. We have developed a collection of intellectual property and know-how that we are able to leverage across our products and end markets. Our research and development efforts are generally targeted at five areas:
| • | In the area of our patented fabrication platform, we intend to continue to invest in our process technology to further refine our technology platform with respect to overall form factor, product performance and process yield enhancement and to expand the platform to enable us to further develop our product offerings beyond what is currently achievable. |
| • | With our history in high-volume fabless MEMS manufacturing, we believe we are uniquely positioned to help enable a fabless MEMS ecosystem. We maintain a fabrication shuttle program that allows universities and industry peers to license and leverage our technology in the development of CMOS-MEMS based solutions. |
| • | In the area of MEMS development and design, we intend to expand our portfolio of products, exploring new ways of integrating various sensors in a monolithic processor that eliminates the need for discrete sensors. We are expanding our CMOS-MEMS integration beyond electrostatic sensing to include other types of transduction. We are also investing in the development of systems expertise in new markets and applications that leverage our core capabilities. |
8
Table of Contents
| • | In the area of CMOS design and integration, our initiatives include developing analog and digital IC design capabilities and circuit development intellectual property to facilitate our MEMS development roadmap, improving our sensor performance, and adding new functions to our products. |
| • | In the area of software and algorithms, our initiatives include expanding into open platforms that include both advanced RISC machine (ARM) and digital signal processing (DSP) define based SoC’s running motion and audio features. Software initiatives include an SoC infrastructure on a software architecture that is modular, scalable, and easy to use, including sensor optimized tool chains. The result is an easy to use SoC that enables ultra-low power processing with advanced features. The algorithm initiatives include improvements in traditional motion fusion, as well as additional motion algorithms that incorporate higher level functionality such as context, activity classification, location, gestures, and imaging. Additionally, the InvenSense Positioning Library (IPL) software and Coursa analytics services deliver sensor assisted positioning and motion data analysis, which are particularly useful in places where other geo-location technologies such as global navigation satellite system (GNSS) alone cannot provide desired accuracy or availability. |
Through our research and development efforts, we intend to continually expand our portfolio of patents and enhance our intellectual property position. As of April 3, 2016, we had 311 employees involved in research and development. Our engineering design teams are primarily located in Bratislava, Slovakia; Calgary, Canada; Milan of Italy; Shanghai, China; Boston and San Jose, United States. For fiscal years 2016, 2015, and 2014, we incurred $97.4 million, $90.6 million and $48.4 million, respectively, research and development expenses.
Intellectual Property Rights
We primarily rely on patent, trademark, copyright and trade secrets laws, confidentiality procedures, and contractual provisions to protect our technology. We focus our patent efforts in the United States, and, when justified by cost and strategic importance, we file corresponding foreign patent applications in strategic jurisdictions, such as Europe, the Republic of Korea, Taiwan, and China. As of April 3, 2016 we have 180 issued U.S. patents and 130 issued foreign patents December 2018 and January 2033, and have more than 688 additional patent applications pending in the United States and foreign countries.
Our issued patents and certain of our pending patent applications relate to our patented fabrication platform and to our sensor designs and related system advances. In addition, we have issued patents and pending patent applications that relate to mixed-signal circuits and architectures, which have a wide variety of applications, and to algorithms, software and applications for location, activity tracking and context sensing.
We intend to continue to file additional patent applications with respect to our technology and inventions. We do not know whether any of our pending patent applications will result in the issuance of patents or whether the examination process will require us to narrow our claims. Even if granted, there can be no assurance that these pending patent applications will provide us with protection. Our intellectual property strategy is to, where feasible, defend our intellectual property across the various aspects of our solution. While we license intellectual property and software libraries from third parties, none of these are fundamental to our MotionTracking and audio devices, analytics capabilities or fabrication platforms.
Employees
As of April 3, 2016, our total headcount was 632, comprised of 311 employees in research and development, 175 employees in manufacturing operations, 84 employees in sales and marketing, and 62 employees in a general and administrative capacity. None of our employees are represented by a labor union with respect to their employment with us. We have not experienced any work stoppages, and we consider our relations with our employees to be good.
9
Table of Contents
Executive Officers of the Registrant
The following table sets forth certain information about our executive officers as of April 30, 2016:
| Name |
Age | Position | ||||
| Behrooz Abdi |
54 | President and Chief Executive Officer | ||||
| Mark Dentinger |
58 | Vice President—Chief Financial Officer | ||||
| Daniel Goehl |
45 | Vice President—Worldwide Sales | ||||
| Mo Maghsoudnia |
50 | Vice President—Technology and WW Manufacturing | ||||
| Adam Tachner |
49 | Vice President—Corporate Development and General Counsel | ||||
Behrooz Abdi has served on our board of directors since June 2011 and was appointed President and Chief Executive Officer in October 2012. Mr. Abdi served as Executive Vice President and General Manager at NetLogic Microsystems, Inc., a provider of semiconductor solutions, from November 2009 to December 2011. Mr. Abdi served as the President and Chief Executive Officer of RMI Corporation (formerly Raza Microelectronics Inc.), a fabless semiconductor company, from November 2007 to October 2009. He served as Senior Vice President and General Manager of CDMA Technologies (QCT) at Qualcomm, Inc., a provider of wireless technology and services, from March 2004 to November 2007. Prior to joining Qualcomm, he held leadership and engineering positions of increasing responsibility at Motorola, Inc. in its Semiconductor Products Sector (SPS). From September 1999 to March 2003, he served as Vice President and General Manager for Motorola’s radio products division, in charge of RF and mixed signal ICs for the wireless mobile market. He currently serves as a director at Tabula, Inc. He also serves as a director at Encore Semi and Exar Corporation, a provider of high performance mixed-signal integrated circuits and sub-system solutions for networking and telecommunications, and industrial markets. Mr. Abdi served as the Chairman and director of SMSC Storage, Inc. (Formerly Symwave, Inc.), from September 2009 to November 2010 and as a director of RMI Corporation from November 2007 to November 2009. Mr. Abdi holds a B.S. from Montana State University and an M.S. from the Georgia Institute of Technology, both in Electrical Engineering.
Mark Dentinger joined us in 2014 as our Vice President and Chief Financial Officer. Prior to joining us, Mr. Dentinger served as Executive Vice President and Chief Financial Officer of KLA-Tencor Corporation from September 2008 to August 2013. Prior to joining KLA-Tencor, from February 2005 to April 2008, Mr. Dentinger served as Executive Vice President and Chief Financial Officer for BEA Systems, Inc., until the company was acquired by Oracle Corporation. Mr. Dentinger was with BEA Systems for a total of nine years, during which he held various senior financial and managerial roles within the company. Prior to joining BEA Systems, Mr. Dentinger served in various financial management positions at Compaq Computer Corporation (now Hewlett-Packard) for six years, culminating in his appointment as Director of Finance, High Performance Systems Manufacturing in 1996. Mr. Dentinger received his bachelor’s degree in economics from St. Mary’s College of California and his M.B.A. in finance from the University of California at Berkeley.
Daniel Goehl joined us in 2004 as our Director of Business Development and became our Vice President of Worldwide Sales in March 2007. Prior to joining us, Mr. Goehl held senior management positions and led sales and business development initiatives at start-up companies in semiconductor and wireless technology markets, such as Nazomi Communications, CSI Wireless, Meridian Wireless and Omni Telecommunications. Mr. Goehl has a B.A. in Economics from the University of Illinois and attended Kansai Gaidai University in Osaka, Japan for International Business and Japanese language studies.
Mo Maghsoudnia joined us in 2012 as our Vice President of Technology and Worldwide Manufacturing. Prior to InvenSense, he was the Vice President of Worldwide Manufacturing at NetLogic Microsystems where he was responsible for all worldwide operations including process technology, packaging, corporate quality and supply chain management. At NetLogic, Mr. Maghsoudnia successfully managed the manufacturing operations of the company from a single product line to a highly diversified product portfolio. Prior to NetLogic Microsystems, Mr. Maghsoudnia spent 15 years at Analog Devices where he was responsible for the
10
Table of Contents
management of wafer fabrication and technology. Mr. Maghsoudnia holds a Master of Science Degree in Electrical Engineering from Santa Clara University and a Bachelor of Science Degree in Microelectronic Engineering from Rochester Institute of Technology. He holds three U.S. patents and has co-authored various technical papers.
Adam Tachner served as our Vice President and General Counsel from August 2013 until May 16, 2016, and as our Corporate Secretary from September 2013 until May 16, 2016. Prior to joining us, Mr. Tachner served as Vice President and General Counsel of Qualcomm Atheros, Inc. from May 2011 to August 2013. From October 2000 to May 2011, he served as Vice President and General Counsel, and from October 2000 to October 2003, he served as Director, Intellectual Property at Atheros Communications, Inc. From September 1994 to September 2000, Mr. Tachner was an associate attorney with Crosby, Heafy, Roach & May, P.C., a law firm. Mr. Tachner currently serves on the board of directors of two private companies. Mr. Tachner holds a J.D. from the University of Oregon School of Law, a Master of Business Administration from Columbia University, a Bachelor of Science degree in Electrical Engineering from California State University at Fullerton and a Bachelor of Arts degree in Social Science from the University of California at Berkeley.
Competition
We compete with companies that may have substantially greater financial and other resources with which to pursue engineering, manufacturing, marketing and distribution of their products. We currently and primarily compete with the following companies: Analog Devices, Inc., Epson Toyocom Corporation, Kionix, Inc. (a wholly owned subsidiary of Rohm Co., Ltd.), Knowles Corporation, MEMSIC, Inc., Murata Manufacturing Co., Ltd., Panasonic Corporation, Robert Bosch GmbH, Sony Corporation and STMicroelectronics N.V. (STMicro). Currently, we believe STMicro is our primary competitor in the consumer motion sensing market. Over time, we expect continued competition from motion sensor companies as well as competition from new entrants into the motion interface market.
The principal methods of competition include the following:
| • | The design and volume production of new products that anticipate the sensor and analytics integration needs of customers’ next generation products and applications. |
| • | Scalable operations to meet customers’ volume and timing demands. |
| • | A flexible manufacturing and operating cost structure. |
| • | Identification of new and emerging markets, applications and technologies, and developing products for these markets. |
| • | Product pricing points, performance and cost effectiveness. |
| • | The recruitment and retention of key employees. |
| • | Intellectual property, including patents, trade secrets and trademarks. |
| • | High product quality, reliability and customer support. |
| • | Financial stability. |
| • | Manufacturing, distribution and marketing capability. |
| • | Brand recognition. |
| • | Size of customer base. |
| • | Strength and length of key customer relationships. |
We believe we are competitive with respect to these factors, particularly because our products are typically smaller in size, are highly integrated, and achieve high performance specifications at lower price points than competitive products. However, most of our current competitors have longer operating histories, significantly greater resources, greater brand recognition and a larger base of customers than we do.
11
Table of Contents
Available Information
Our website address is www.invensense.com. The following filings are made available free of charge through our investor relations website when such reports are available on the SEC’s website: Annual Reports on Form 10-K, Quarterly Reports on Form 10-Q, and our Proxy Statements for our annual meetings of stockholders. We also provide a link to the section of the website at www.sec.gov that has all of our public filings, including Quarterly Reports on Form 10-Q, Current Reports on Form 8-K, all amendments to those reports, our Proxy Statements, and other ownership related filings. Further, a copy of this Annual Report on Form 10-K is located at the SEC’s Public Reference Room at 100 F Street, NE, Washington, D.C. 20549. Information on the operation of the Public Reference Room can be obtained by calling the SEC at 1-800-SEC-0330.
The contents of our websites are not intended to be incorporated by reference into this Annual Report on Form 10-K or in any other report or document we file with the SEC, and any references to our websites are intended to be inactive textual references only.
Additional information required by this Item 1 is incorporated by reference in Item 6, “Selected Financial Data”, Item 7, “Management’s Discussion and Analysis of Financial Condition and Results of Operations” and Item 8, “Financial Statements and Supplementary Data” of this Annual Report on Form 10-K.
12
Table of Contents
| Item 1A. | Risk Factors. |
Our operations and financial results are subject to various risks and uncertainties, including those described below, which could adversely affect our business, financial condition, results of operations, cash flows, and the trading price of our common stock.
Our operating results are subject to substantial fluctuations due to a number of factors that could adversely affect our business and our stock price.
Our net revenue and operating results have fluctuated in the past and are likely to fluctuate in the future. These fluctuations may occur on a quarterly and annual basis and are due to a number of factors, many of which are beyond our control. These factors include, among others:
| • | changes in end-user demand for the products manufactured and sold by our customers; |
| • | the receipt, reduction, cancellation or delay of significant orders by customers; |
| • | the gain or loss of a significant customer; |
| • | market acceptance of our products and our customers’ products; |
| • | our ability to develop, introduce and market new products and technologies on a timely basis; |
| • | delays in our customers’ ability to manufacture and ship products that incorporate our products caused by internal and external factors unrelated to our business and beyond our control; |
| • | shortages of key third party components; |
| • | new product announcements and introductions by us or our competitors; |
| • | incurrence of research and development and related new product expenditures; |
| • | seasonality or cyclical fluctuations in our markets; |
| • | fluctuations in manufacturing yields; |
| • | significant warranty claims, including those not covered by our suppliers; |
| • | write-downs of inventory for excess quantity, changes in business priorities, technological obsolescence and erosion in net realizable value; |
| • | changes in our product mix or customer mix; |
| • | intellectual property disputes involving us, our customers or their suppliers, including court injunctions on sales of our or our customers’ products from intellectual property claims by third party intellectual property rights enforcers; |
| • | loss of key personnel or the availability of skilled workers; and |
| • | the effects of competitive pricing pressures, including decreases in average selling prices of our products; |
The foregoing factors are difficult to forecast, and these, as well as other factors, could materially adversely affect our quarterly or annual operating results. In addition, a significant amount of our operating expenses are relatively fixed in nature due to our significant sales, and research and development costs. Any failure to adjust spending quickly enough to compensate for a net revenue shortfall could magnify its adverse impact on our results of operations.
The average selling prices of our products have historically decreased over time and will likely continue to do so, which could have a material adverse effect on our net revenue and gross margins if we cannot reduce our costs or increase volumes to offset.
We expect the average selling prices of our products to decrease as a result of several factors. We offer volume pricing discounts to our significant customers. These discounts may offset the revenue expected from
13
Table of Contents
such customers and impact our gross margins. In addition, competitive pricing pressures, new product introductions by our competitors, shifts in customers’ product architectures, and product end-of-life programs may cause a reduction in our average selling prices. We have experienced and may continue to experience substantial period-to-period fluctuations in future operating results due to the erosion of the average selling prices of our products. If we are unable to offset any reductions in our average selling prices by increasing our sales volumes, introducing new products with higher gross margins or implementing product manufacturing or internal cost reduction programs, our net revenue and gross margins will decline, which could have a material adverse effect on our results of operations.
We currently depend on a limited number of customers and distributors for a material portion of our net revenue. The loss of or a substantial reduction in orders, or default in payments from these customers and distributors would significantly reduce our net revenue, increase our credit risk and adversely impact our operating results.
Historically, large purchases by a relatively limited number of customers and distributors have accounted for a substantial portion of our revenue. Our revenue is generated on the basis of purchase orders with our customers and distributors rather than long-term purchase commitments. We expect that sales to these customers and distributors will continue to account for a substantial portion of our net revenue for the foreseeable future. The loss of, or a substantial reduction in orders and default in payments from any of these customers and distributors would have a significant negative impact on our business and our operating results. For fiscal year 2016, Apple accounted for 40% of net revenue and Samsung accounted for 16% of net revenue. For fiscal year 2015, Apple accounted for 30% of net revenue and Samsung accounted for 28% of net revenue. For fiscal year 2014 Samsung accounted for 35% of total net revenue.
The termination of a relationship with a major distributor, either by us or by the distributor, could have a negative effect on our revenue. We may not be successful in finding suitable alternative distributors on satisfactory terms, or at all, and this could adversely affect our ability to sell in certain geographical locations or to certain end customers. Additionally, if we terminate a relationship with a major distributor, we may be obligated to repurchase unsold products, which could be difficult or impossible to sell to other end customers. Furthermore, distributors we do business with may face issues obtaining credit, which could impair their ability to make timely payments to us. If any of these events were to occur, it could have a negative impact on our revenue and results of operations.
We may not sustain our growth rate, and we may not be able to manage any future growth effectively.
We have experienced significant growth in a short period of time. Our net revenue increased from $153.0 million in fiscal 2012 to $418.4 million in fiscal year 2016. We may not achieve similar growth rates in future periods. Our operating results for any prior quarterly or annual period should not be relied on as an indication of our future operating performance. If we are unable to maintain adequate net revenue growth, our financial results could suffer and our stock price could decline.
To manage our growth successfully, we believe we must effectively, among other things:
| • | recruit, hire, train and manage additional qualified engineers for our research and development activities, especially in the positions of design engineering, product and test engineering and applications engineering, as well as adding additional sales personnel; |
| • | implement improvements in our financial, administrative, and operational systems, procedures and controls necessary to support larger manufacturing and sales volumes, a greater number of customers and an increased range of products; and |
| • | enhance our information technology support for enterprise resource planning and design engineering by adapting and expanding our systems and tool capabilities, and properly training new hires as to their use. |
14
Table of Contents
If we are unable to manage our growth effectively, we may not be able to take advantage of market opportunities or develop new products, and we may fail to satisfy customer requirements, maintain product quality, execute our business plan or respond to competitive pressures.
We face intense competition and we expect competition to increase in the future, which could have an adverse effect on our operating results, net revenue growth rate and market share.
The market for microphone and motion interface products is highly competitive, particularly in the market for consumer electronics, which is highly sensitive to price. In the market for consumer electronics, we compete to various degrees on the basis of our products’ size, price, integration, performance, product roadmap, and reliability. Competition may increase and intensify from semiconductor companies, or the internal resources of large, integrated original equipment manufacturers (OEMs), entering our markets. Increased competition could result in price pressure, reduced profitability and loss of market share, any of which could materially and adversely affect our business and operating results.
Our primary competitors in most of our target markets are STMicro and Bosch Sensortec, a division of Robert Bosch GmbH. We also face competition from other integrated and fabless semiconductor manufacturers, from in-house development organizations within some of our potential customers and from smaller companies specializing in MEMS, microphone and motion-sensing products, including those that provide sensor products offering less functionality at a lower cost, such as accelerometers and non-MEMS microphones. We also supply to large, sophisticated platform developers that may prefer to integrate less sophisticated sensors and to develop their own sensor interface application for developers, marginalizing the total solution we offer. Additionally, competitors that have traditionally focused on industrial or automotive applications for MEMS sensors may pursue the consumer electronics market, thus intensifying competition for our products. We expect competition in the markets in which we participate to increase in the future as existing competitors improve or expand their product offerings.
Most of our current competitors have longer operating histories, significantly greater resources, greater brand recognition and a larger base of customers than we do. Some of our competitors also have in-house, vertically integrated manufacturing capabilities. In addition, these competitors may have greater credibility with our existing or prospective customers and in some cases are already providing components for products to such existing and prospective customers that may in the future include motion and microphone devices. Moreover, many of our competitors have been doing business with our customers or potential customers for a long period of time and have established relationships that may provide them with information regarding future market trends and requirements that may not be available to us. Additionally, some of our larger competitors may be able to provide greater incentives to customers through rebates and similar programs, particularly to win design opportunities in new product categories. Finally, some of our competitors with multiple product lines may bundle their products to offer customers a broader product portfolio at a more competitive price point. These factors may make it difficult for us to gain or maintain market share.
Revenue delays and reductions could result from shortages of key third party components to our customers, injunctions prohibiting sales of our customers’ products arising from intellectual property claims or a reduction in orders of our products due to governmental actions taken against or affecting our customers.
We are dependent on our customers for our net revenue and our net revenue could be negatively impacted by shortages of key third party components to our customers. In 2012, a third party chip supplier’s supply shortages limited the ability of handset makers to utilize our motion sensing technology.
In addition, our revenues could be negatively impacted by court injunctions on sales of our customer products arising from intellectual property claims by their competitors or other intellectual property rights enforcers.
15
Table of Contents
In addition, our customers and their suppliers are subject to various laws and regulations in the jurisdictions in which they operate, the violation of which could subject them to governmental enforcement actions that could limit their ability to import necessary components or restrict their ability to sell and distribute their own products. If such actions are taken against our customers, this could cause them to reduce their orders for our products, which could have a material adverse effect on our business, financial condition or results of operations. In addition, the U.S. government may limit our ability to export our products to certain customers pursuant to the Export Administration Regulations, which could have a negative impact on our revenues. In 2016, a telecommunications equipment manufacturer was added to the Entity List by the U.S. Department of Commerce, thereby prohibiting U.S. companies from exporting their products to this company. The imposition of such a sanction on one of our significant customers could negatively affect our business and results of operations.
We are subject to order and shipment uncertainties, and differences between our estimates of customer demand and actual results could negatively affect our inventory levels, sales and operating results.
Changes in the customer demand for our products may affect our revenue, cost of goods sold, gross margin percentage and inventory level. Our products are manufactured by third-party manufacturers according to our estimates of customer demand, which requires us to make separate demand forecast assumptions for every customer, each of which may introduce significant variability into our aggregate estimates. In addition, substantially all of our sales to date, including sales to Apple and Samsung, have been made on a purchase order basis. We do not have any long-term commitments with any of our customers. As a result, our customers may cancel, change or delay product purchase commitments with little or no notice to us and without penalty which could negatively impact our business and results of operations. Our limited visibility into future customer demand and the product mix could lead to inadequate or excess purchase of raw material, obsolete inventory which could adversely affect our net revenue, gross margin and operating results. Moreover, because products with motion interface platforms have only recently been introduced into many of our target markets, many of our customers could have difficulty accurately forecasting demand for their products and the timing of their new product introductions, which ultimately affects their demand for our products. This in turn could cause our revenue to decline and materially and adversely affect our results of operations.
We generally place orders for products with some of our suppliers approximately three to four months prior to the anticipated delivery date, with order volumes based on our forecasts of demand from our customers. Accordingly, if we inaccurately forecast demand for our products, we may be unable to obtain adequate and cost-effective foundry or assembly capacity from our third-party manufacturers to meet our customers’ delivery requirements, or we may accumulate excess inventories. On occasion, we have been unable to adequately respond to unexpected increases in customer purchase orders and therefore were unable to benefit from this incremental demand. In addition, our third-party manufacturers may prioritize orders placed by other companies that order higher volumes of products or otherwise qualify for more favorable treatment, many of whom are larger and more established than us. In the event that manufacturing capacity is reduced or eliminated at one or more of our third-party manufacturers’ facilities, we could have difficulties fulfilling our customer orders, and our net revenue and results of operations could decline.
Historically, because of this limited visibility, at times our actual results have been different from our forecasts of customer demand. Some of these differences have been material, leading to net revenue and margin forecasts different from the results we were actually able to achieve. These differences may occur in the future. Conversely, if we were to underestimate customer demand or if sufficient manufacturing capacity were unavailable, we could be unable to take advantage of net revenue opportunities, potentially lose market share and damage our customer relationships and market reputation, and be subject to contractual penalties for not meeting customer demand. In addition, any significant future cancellations or deferrals of product orders could materially and adversely impact our profit margins, increase our inventory write-downs due to product obsolescence and restrict our ability to fund our operations.
16
Table of Contents
If we have significant inventories that become obsolete or cannot be sold at acceptable prices, our results may be negatively impacted.
As our business has grown, our inventory levels have risen and include items for which we may not have customer purchase orders when manufactured, requiring us to actively market and sell those products. If significant inventories of our products become obsolete, or are otherwise not able to be sold at favorable prices or without significant distraction from our other business priorities, our operating results could be materially affected.
If we are unable to implement our business strategy, our revenues and profitability may be adversely affected.
Our future financial performance and success are largely dependent on our ability to implement our business strategy successfully. Our present business strategy which is to develop and offer products that are easy to integrate, meet or exceed the customer-required performance and cost requirements, and that set industry performance benchmarks, includes plans to introduce new products and services and establish new sales channels as well as to manage, maintain and refine our product portfolio in the mobile, wearables, smart home, gaming, industrial, drone, automotive and IoT (internet of things) product opportunity spaces. We cannot assure you that we will successfully implement our business strategy or that implementing our strategy will sustain or improve our results of operations. In particular, we cannot assure you that we will be able to build our position in markets with high growth potential, increase our volume or net revenue, rationalize our manufacturing operations or reduce our costs and expenses.
Our business strategy is based on our assumptions about the future demand for our current products, and the new products, services and applications that we are developing, and on our ability to produce our products profitably. Each of these factors depends on our ability, among other factors, to finance our operating and product development activities, maintain high quality and efficient operations, contract for manufacturing services in a cost-effective and timely manner and successfully diversify our business or introduce new products and services that will maintain or increase our revenues. In addition, circumstances beyond our control and changes in our business or industry may require us to change our business strategy.
Our primary customers, our sales and support facilities, our testing facilities and our third-party manufacturers are located in regions that are subject to natural disasters.
Currently, our wafer sort, final test and shipping operations, as well as the facilities of our third-party wafer manufacturing and assembly suppliers, are located in Singapore, Hong Kong, Taiwan, and the Philippines. Our largest customers are based in the United States, Korea, China and Japan. We have sales and support centers in China, Japan, the Republic of Korea, United Arab Emirates and Taiwan. In addition, our headquarters are located in Northern California. Taiwan, the Republic of Korea and Japan are susceptible to earthquakes, tsunamis, typhoons, floods and other natural disasters, and have experienced severe earthquakes, typhoons and floods in recent years that caused significant property damage and loss of life. The Northern California area is also subject to significant risk of earthquakes.
In addition, facilities located in the Republic of Korea, Taiwan and China are subject to other risks, including the outbreak of contagious diseases, such as the H1N1 virus, and natural disasters, such as earthquakes in Taiwan. Although these risks have not materially adversely affected our business, financial condition or results of operations to date, there can be no assurance that such risks will not do so in the future. There also can be no assurance that another earthquake, tsunami or other natural disaster will not occur in the Pacific Rim region, where the risk of such an event is significant due to, among other things, the proximity of major earthquake fault lines in the area. Any such future event could include power outages, fires, flooding or other adverse conditions, as well as disruption or impairment of production capacity and the operations of our manufacturers and customers, which could have a material adverse effect on us. Any disruption resulting from these events could cause significant delays in shipments of our products until we are able to shift our manufacturing, assembly or testing from the affected facilities or contract to another location or third-party vendor. Under such
17
Table of Contents
circumstances, there can be no assurance that alternative capacity could be obtained on favorable terms, if at all. Any catastrophic loss to any of our facilities would likely disrupt our operations, delay production, shipments and net revenue and result in significant expenses to repair or replace the facility. In particular, any catastrophic loss at the San Jose, California or Taiwan facilities would materially and adversely affect our business.
To date, a significant amount of our net revenue has been attributable to demand for our products used in handheld devices, including smartphones, tablet devices and video gaming and the failure of this market to grow could have a negative impact on our business and results of operation.
We derive a significant amount of our net revenue from our products used in handheld devices, including smartphones and tablet devices, and historically we have derived significant revenue from video gaming. Future generations of these products may not adopt motion interface at all or, if they do, may use our competitors’ products, internally developed solutions or alternative technologies not based on MEMS sensors. If we are not successful in obtaining design wins in new generations of these products or, if these products that incorporate our products are not successful, our net revenue and operating results will decline. Even if we achieve design wins, the markets for specific products incorporating our solutions may not continue to grow or may decline for a number of reasons outside of our control, including competition among companies and market saturation.
Additionally, these markets are subject to volatility from changes in the macroeconomic environment as well as industry specific trends, such as trends resulting from feature, product, acquisition or other announcements by one of the major companies in these markets. Any decline or volatility in these overall markets could cause our net revenue and operating results to fall short of expectations or decline.
While the general market for handheld devices is very fragmented, a limited number of manufacturers command a relatively large share of the market for smartphones with enhanced functionality. All of these customers are large, multinational companies with substantial negotiating power relative to us over price and terms of supply. Securing design wins with any of these companies or other smartphone manufacturers requires a substantial investment of our time and resources. Some of these companies produce products that already include motion sensors and microphones, and they may decide not to adopt our sensor devices. Additionally, the smartphone market is subject to a unique set of industry dynamics, such as shorter design cycles and multiple devices and manufacturers. The smartphone market and the market for related peripheral products is highly competitive, and if we are unable to continue to successfully navigate these dynamics, if we are unable to adapt our products in response to any future changes in the requirements of the operating systems or if the products of manufacturers that choose to incorporate our solutions are not commercially successful, our net revenue may decrease and our operating results may be adversely affected.
We are dependent upon the continued market acceptance and adoption of motion interface and, in particular, the adoption of our MotionTracking devices in consumer electronics products, the failure of which could have an adverse effect on our business and our operating results.
Market adoption and acceptance of motion interface technology, including our MotionTracking devices, in consumer electronics products is dependent on a number of factors that are outside of our control. For example, device manufacturers must decide whether incorporating the improved functionality and performance that comes with motion interface will result in improved sales and acceptance of their products. In addition, device manufacturers may not be able to integrate motion interface or processing technologies into their products in a manner that they, or their customers, consider to deliver cost-effective, compelling functionality, and developers may not introduce applications that employ motion interface in a compelling way. In addition, there are a number of companies that claim intellectual property ownership over motion as a user interface, and these claims could discourage manufacturers from integrating motion interface technology into their products.
We are dependent upon the continued adoption of motion interface technology, including our MotionTracking devices, in mobile handheld devices, including smartphones and tablet devices. While smartphone manufacturers
18
Table of Contents
are incorporating advanced motion sensing functionality, including three-axis gyroscopes, into their devices, if applications that utilize this functionality are not further developed or if consumers do not find the applications provided by motion interface technology compelling, mobile device manufacturers may curtail their adoption of this technology. Consequently, our net revenue may fall short of our expectations and our operating results could be adversely affected. Any unanticipated delay in the launch or decline in the volume of our customers’ smartphone and tablet device platforms into which we have been designed may negatively impact our operating results.
Failure to achieve expected manufacturing yields for our products could negatively impact our operating results.
Manufacturing yields for our products may be negatively impacted by increasing product design complexity, increased integration, higher performance levels demanded by our customers and usage of MEMS process technology. We do not know whether a yield problem exists until our products are manufactured in high volume based on our design. As a result, yield deficiencies may not be identified until well into the production process. Because of our potentially limited access to wafer foundry capacity, decreases in manufacturing yields could result in an increase in our costs which would negatively impact our gross margin, cause us to fail to meet product delivery commitments and force us to allocate our available product supply among end customers. Lower than expected yields could harm our operating results, our customer relationships and our reputation.
We rely on a limited number of third parties to supply, manufacture and assemble our products, and the failure to manage our relationships with these third-party contractors could adversely affect our ability to produce, market and sell our products.
We do not have our own manufacturing facilities. We operate based on an outsourced manufacturing business model that utilizes third-party foundry and packaging capabilities. Relying on third-party manufacturing, assembly and packaging presents significant risks to us, including the following:
| • | reduced control over delivery schedules, yields and product reliability; |
| • | price increases; |
| • | the unavailability of, or potential delays in obtaining access to, key process technologies; |
| • | the inability to achieve required production or test capacity and acceptable yields on a timely basis; |
| • | difficulties in establishing additional manufacturing suppliers if we are presented with the need to transfer our manufacturing process technologies to them; |
| • | shortages of materials; |
| • | failures to allocate sufficient capacity for us to have our products produced and shipped to our customers on a timely basis; |
| • | misappropriation of our intellectual property; and |
| • | limited warranties on wafers or products supplied to us. |
We make substantially all of our purchases through purchase orders based on our own rolling forecasts, and our third-party manufacturers are not required to supply us products beyond these forecasted quantities. Beyond minimal capacity guarantees, most of our third-party manufacturers do not have any obligations to provide us with additional capacity on a timely basis.
The performance of our third-party manufacturers is outside of our control. At present, we depend primarily upon TSMC and Global Foundries to manufacture most of our products. Although we are not obligated to purchase a specific volume of products from, or to contract with these manufacturers on an exclusive basis, we anticipate that we will be dependent on these manufacturers to supply a substantial portion of our products for the next several fiscal quarters. We expect that it would take approximately nine to 16 months to transition our
19
Table of Contents
manufacturing to new third-party manufacturers. Such a transition would likely require certain customers to qualify our new manufacturers. If one or more of our third-party contractors or other outsourcers fail to perform their obligations in a timely manner or at satisfactory quality levels, our ability to bring products to market, the reliability of our products and our reputation could suffer.
In the future, if our third-party manufacturers fail to deliver quality products and components on time and at reasonable prices, we could have difficulties fulfilling our customer orders, our net revenue could decline and our business, financial condition and results of operations would be adversely affected. In addition, if our foundry partners materially increase their prices for the fabrication of our products, our business would be materially harmed.
We rely on our ecosystem partners to enhance our product offerings and our inability to continue to develop or maintain these relationships in the future would harm our ability to remain competitive.
Our strategy is to work closely with third parties, which we refer to as ecosystem partners, including developers of operating systems such as Android, developers of motion sensing applications, engineering services companies, and manufacturers of semiconductors with complementary functionality such as micro-controllers, application processors, and other sensors. We work with these ecosystem partners in order to add features and improve time-to-market for customers, thereby taking advantage of our unique capabilities and encouraging potential customers to adopt our solutions. Continued growth in adoption of motion tracking solutions depends in part on activities of these ecosystem partners supporting the development of systems and applications that can fully utilize the capabilities of our products. If we are not able to maintain and develop our relationships with these third parties, our ability to compete could be harmed.
Our product development efforts are time consuming and expensive and may not generate an acceptable return, if any.
Our product development efforts require us to incur substantial research and development expense. Our research and development expense was $97.4 million for fiscal year 2016 and $90.6 million for fiscal year 2015, and we anticipate that research and development expense will increase in the future as we expand our product offerings and diversify our business. We may not be able to achieve an acceptable return, if any, on our research and development efforts.
The development of our products is highly complex. We have experienced delays in completing the development and introduction of new products and product enhancements, and we could experience delays in the future. Unanticipated problems in developing products could also divert substantial engineering resources, which may impair our ability to develop new products and enhancements and could substantially increase our costs. Furthermore, we may expend significant amounts on research and development programs that may not ultimately result in commercially successful products. As a result of these and other factors, we may be unable to develop and introduce new products successfully and in a cost-effective and timely manner, and any new products we develop and offer may never achieve market acceptance. Any failure to successfully develop future products would have a material and adverse effect on our business, financial condition and results of operations.
If we fail to develop and introduce new or enhanced products on a timely basis, our ability to attract and retain customers could be impaired, and our competitive position could be harmed.
We operate in a dynamic environment characterized by rapidly changing technologies and industry standards, and rapid technological obsolescence. To compete successfully, we must design, develop, market and sell new or enhanced products that provide increasingly higher levels of performance, integration and reliability and meet the cost expectations of our customers. A key element of our product strategy is to integrate additional sensors, sensor-based functions and sensor interface functionality into our products, and to reduce the size and power consumption of products providing a given level of functionality. The majority of our production volume
20
Table of Contents
today derives from our integrated three-axis and six-axis product families. We have introduced, and intend to continue to introduce, more highly integrated products that include greater motion sensing functionality, microphone and other audio functionality and further enhancements to on-board sensor interface capabilities. We may not be successful in achieving market acceptance of our more highly integrated single-chip products on the financial or other terms that we expect to obtain, and existing or potential new customers may instead rely on multi-chip, discrete sensor solutions. This could result in the loss of net revenue and earnings and potential inventory write-downs or obsolescence. In addition, the introduction of new products by our competitors, the market acceptance of products based on new or alternative technologies, or the emergence of new industry standards could render our existing or future products obsolete.
Our failure to anticipate or timely develop new or enhanced products or technologies in response to technological change could result in decreased net revenue and our competitors achieving more design wins. In particular, we may experience difficulties with product design, manufacturing or marketing that could delay or prevent our development, introduction or marketing of new or enhanced products, including products with higher levels of sensor integration such as our seven-axis device. If we fail to introduce new or enhanced products with potentially greater integration that meet the needs of our customers, or penetrate new markets, in a timely fashion, we will lose market share and our operating results will be adversely affected.
In addition, we have expanded our product portfolio to include software, fingerprint and automotive technology offerings. In fiscal year 2016, we announced several long term business opportunities: UltraPrint, our ultrasonic fingerprint authentication solution, Coursa, a cloud-based motion data platform and a strategic alliance with a sensor and system integration partner for automotive applications. We have not yet realized revenue from either of these initiatives and may not do so in the future. We have limited experience in designing and selling SaaS and fingerprint technology products. The markets for these products are intensely competitive and we may not achieve market acceptance or design wins in substantial numbers. In addition, we may encounter unforeseen difficulties, complications and other unknown factors that may delay deployment of our new products. If we are unable to realize revenue from our new software and fingerprint technology products, we may not be able to maintain or increase our revenue.
The complexity of our products could result in unforeseen delays or expenses caused by defects or bugs, which could delay the introduction or acceptance of our new products, damage our reputation with current or prospective customers, lead to warranty and product liability claims and product recalls and adversely affect our operating results.
Our products are highly complex and may contain defects and bugs when they are first introduced or as new versions are released. In addition, it is important that they work well with a range of operating systems, networks, devices and standards that we do not control. We have in the past experienced, and may in the future experience, defects, bugs and interoperability issues. There may be additional defects and bugs contained in our products that may not have manifested. If any of our products contains defects or bugs, or have reliability, quality, interoperability or other problems, we may not be able to successfully correct such problems in a timely manner. Consequently, our reputation may be damaged and customers may be reluctant to buy our products, which could materially and adversely affect our ability to retain existing customers and attract new customers. In addition, these defects or bugs could interrupt or delay sales to our customers. Defects or bugs could materially and adversely affect our ability to achieve design wins from existing customers and to attract new customers, which could adversely affect our market share and operating results. In addition, defects or bugs could interrupt or delay shipments to existing customers. If a significant defect or bug is not found until after we have commenced commercial production of a new product, we may be required to incur additional development costs and product recall, repair or replacement costs. As a result, our operating results could be adversely affected.
Any defects in our products may also result in product liability claims against us by our customers or others and from time to time, and may require us to make significant expenditures to defend against these claims or pay damage awards. In the event of a warranty claim, we may also incur costs if we compensate the affected
21
Table of Contents
customer. For example, under the terms of our contracts with our larger customers, we are obligated to replace, repair or refund payment for defective products discovered by the customer generally for a period of up to three years after such products are delivered, and we remain responsible and liable for any latent defects caused by reasons attributable to us even after the contractual warranty period has elapsed. We maintain product liability insurance, but this insurance is limited in amount and subject to significant deductibles. There is no guarantee that our insurance will be available or adequate to protect against all such claims. We also may incur costs and expenses if defects in a device we supply make it necessary to recall a customer’s product. The process of identifying a recalled device in products that have been widely distributed may be lengthy and require significant resources, and we may incur significant replacement costs, contract damage claims from our customers and reputational harm. Costs or payments made in connection with warranty and product liability claims and product recalls could have a material adverse effect on our financial condition and results of operations.
Our business is subject to seasonality, which causes our net revenue to fluctuate.
In addition to the general cyclicality of the semiconductor and consumer electronics industries, our business is subject to seasonality because of the nature of our target markets. At present, virtually all of our motion interface products are sold in the consumer electronics market. Sales of consumer electronics tend to be weighted towards holiday periods, and many consumer electronics manufacturers typically experience seasonality in sales of their products. Seasonality affects the timing and volume of orders for our products as our customers tend to increase production of their products that incorporate our solutions in the first three quarters of our fiscal year in order to build inventories for the holiday season. Sales of our products tend to correspondingly increase during these quarters and to significantly decrease in the fourth quarter of our fiscal year. For example, our net revenue was $120 million for the third quarter of fiscal year 2016 and declined to $80 million for the fourth quarter of fiscal year 2016. We expect this seasonality to continue in future periods and, as a result, our operating results are likely to vary significantly from quarter to quarter.
Our future success depends on the continuing efforts of our key personnel, and on our ability to successfully attract, train and retain additional key personnel.
Our future success depends heavily upon the continuing services of the members of our senior management team and various engineering and other technical personnel. If one or more of our senior executives or other key personnel are unable or unwilling to continue in their present positions, we may not be able to replace them easily or at all, our business may be disrupted, and our financial condition and results of operations may be materially and adversely affected. In addition, if any member of our senior management team or any of our other key personnel joins a competitor or forms a competing company, we may experience material disruption of our operations and development plans and lose customers, distributors, know-how and key professionals and staff members, and we may incur increased operating expenses as the attention of other senior executives is diverted to recruit replacements for key personnel. Our industry is characterized by high demand and intense competition for talent, and the pool of qualified candidates is very limited. We cannot ensure that we will be able to retain existing, or attract and retain new, qualified personnel, including senior executives and skilled engineers, whom we will need to achieve our strategic objectives. In addition, our ability to train and integrate new employees into our operations may not meet the growing demands of our business. The loss of any of our key personnel or our inability to attract or retain qualified personnel, including engineers and others, could delay the development and introduction of, and would have an adverse effect on our ability to sell, our products, which could harm our overall business and growth prospects.
Our intellectual property is integral to our business and if we are unable to protect our intellectual property, our business could be adversely affected.
Our success depends in part upon our ability to protect our intellectual property. To accomplish this, we rely on a combination of intellectual property rights, including patents, copyrights, trademarks and trade secrets in the United States and in selected foreign countries where we believe filing for such protection is advantageous and
22
Table of Contents
cost-justified. Our ability to use and prevent others from using our patented fabrication platform, which is the subject of several patents and patent applications, is crucial to our success. Effective patent, copyright, trademark and trade secret protection may be unavailable, limited or not applied for in some countries. Some of our products and technologies are not covered by any patent or patent application. We cannot guarantee that:
| • | any of our present or future patents or patent claims will not lapse or be invalidated, circumvented, challenged or abandoned; |
| • | our intellectual property rights will provide competitive advantages to us; |
| • | our ability to assert our intellectual property rights against potential competitors or to settle current or future disputes will not be limited by our agreements with third parties; |
| • | any of our pending or future patent applications will be issued or have the coverage originally sought; |
| • | our intellectual property rights will be enforced in jurisdictions where legal protection may be weak or legal rights difficult to obtain or enforce for a company headquartered outside that jurisdiction; |
| • | third parties will not infringe our key intellectual property, and specifically, our patented fabrication platform; |
| • | any of the trademarks, copyrights, trade secrets or other intellectual property rights that we presently employ in our business will not lapse or be invalidated, circumvented, challenged or abandoned; or |
| • | we will not lose the ability to assert our intellectual property rights against others. |
In addition, our competitors or others, such as our fabrication process vendors, may design around our patents or technologies, such as by creating a fabrication process that is distinct from ours. Effective intellectual property protection may be unavailable or more limited in one or more relevant jurisdictions relative to the protections available in the United States, or may not be applied for in one or more relevant jurisdictions. If we pursue litigation to assert our intellectual property rights, an adverse judicial decision in any of these legal actions could limit our ability to assert our intellectual property rights, limit our ability to obtain new product inventory, limit the value of our technology or otherwise negatively impact our business, financial condition and results of operations.
Monitoring unauthorized use of our intellectual property is difficult and costly. Unauthorized use of our intellectual property may have occurred or may occur in the future. Although we have taken steps to try to minimize the risk of this occurring, any such failure to identify unauthorized use and otherwise adequately protect our intellectual property would adversely affect our business.
We also rely on customary contractual protections with our customers, suppliers, distributors, employees and consultants, and we implement security measures to protect our trade secrets. We cannot ensure that these contractual protections and security measures will not be breached, that we will have adequate remedies for any such breach or that our suppliers, employees or consultants will not assert rights to intellectual property arising out of such contracts.
We face claims of intellectual property infringement from time to time and may face additional such claims in the future, which could be time-consuming and costly to defend or settle and, if adversely adjudicated, could result in the loss of significant rights.
The semiconductor and MEMS industries are characterized by companies that hold large numbers of patents and other intellectual property rights and that vigorously pursue, protect and enforce intellectual property rights. STMicro, one of our competitors, previously filed two lawsuits and an action before the United States International Trade Commission asserting that several of our products infringe its patents, although those lawsuits have been settled and the companies entered into a multi-year, worldwide patent cross license agreement. A non-practicing entity asserted in litigation that one of our gyroscope products infringes a patent held by it. This matter was
23
Table of Contents
resolved. Robert Bosch GmbH, another one of our competitors, previously made generalized assertions of potential patent infringement. We have resolved all assertions of potential infringement between the companies and entered into a multi-year, worldwide patent cross license agreement. In the future other third parties may assert against us and our customers and distributors, their patent and other intellectual property rights to technologies that are important to our business.
Claims that our products, processes or technology, including products, processes or technology provided by our manufacturers or suppliers about which we have no or limited knowledge, infringe third-party intellectual property rights, regardless of their merit or resolution, have been, and may continue in the future to be, costly to defend or settle and could divert the efforts and attention of our management and technical personnel. In addition, many of our customer and distributor agreements, including our agreement with our largest customer, require us to indemnify and defend our customers or distributors, as applicable, from third-party infringement claims and pay damages in the case of adverse rulings. Claims of this sort also could harm our relationships with our customers or distributors and might deter future customers from doing business with us. Indemnification from our manufacturers and suppliers may not be required or adequate to cover our damages and litigation costs. We do not know whether we will prevail in current assertions of potential infringement or in any future proceedings we may be involved in given the complex technical issues involved and the inherent uncertainties in intellectual property litigation. If any such assertions or proceedings result in an adverse outcome, we could be required to:
| • | cease the manufacture, use or sale of the infringing products, processes or technology; |
| • | pay substantial damages for infringement; |
| • | expend significant resources to develop non-infringing products, processes or technology; |
| • | license technology from the third party claiming infringement, which license may not be available on commercially reasonable terms, or at all; |
| • | cross-license our technology to a competitor to resolve an infringement claim, which could weaken our ability to compete with that competitor; or |
| • | pay substantial damages to our customers or end users to discontinue their use of or to replace infringing technology sold to them with non-infringing technology. |
Any of the foregoing results could have a material adverse effect on our business, financial condition and results of operations.
We rely on information technology systems, and failure of these systems to function properly or unauthorized access to our systems could result in business disruption.
We rely on information technology, or IT systems to manage our operations. We regularly evaluate these systems to make enhancements. We periodically implement new, or upgrade existing operational and IT systems. Any delay in the implementation of, or disruption in the transition to systems could adversely affect our ability to record and report financial and management information on a timely and accurate basis.
These information technology systems are subject to damage or interruption from a number of potential sources including natural disasters, viruses, destructive or inadequate code, malware, power failures, cyber attacks, phishing and other events. We have experienced, and we may in the future experience, breaches or unauthorized access of our IT systems. To the extent that these information systems are under our control, we have implemented security procedures, such as virus protection software and emergency recovery processes, to address the outlined risks. We may incur significant costs in order to implement, maintain and/or update security systems that may be necessary to protect our information systems. A material breach in the security of our information systems could include the theft of our intellectual property or trade secrets, negatively impact our operations, or result in the compromise of personal and confidential information of our employees, customers or
24
Table of Contents
suppliers. To the extent that any system failure, accident or security breach results in disruptions or interruptions to our operations or the theft, loss or disclosure of, or damage to our data or confidential information, our reputation, business, results of operations and/or financial condition could be materially adversely affected. In addition, a miscalculation of the level of investment needed to ensure our technology solutions are current and up-to-date as technology advances and evolves could result in disruptions in our business should the software, hardware or maintenance of such items become out-of-date or obsolete. Furthermore, when we implement new systems and/or upgrade existing systems, there is a risk that our business may be temporarily disrupted during the period of implementation.
If we do not achieve continued tax benefits as a result of our corporate restructuring completed in fiscal year 2011, our financial condition and operating results could be adversely affected.
We completed a restructuring of our corporate organization during fiscal year 2011 to more closely align our corporate structure with the international nature of our business activities. This corporate restructuring activity has allowed us to reduce our overall effective tax rate through changes in how we develop and use our intellectual property and the structure of our international procurement and sales operations, including by entering into arrangements that establish transfer prices for our intercompany transactions. There can be no assurance that the taxing authorities of the jurisdictions in which we operate or to which we are otherwise deemed to have sufficient tax nexus will not challenge the tax benefits that we expect to realize as a result of the restructuring. In addition, future changes to U.S. or non-U.S. tax laws, including proposed legislation to reform U.S. taxation of international business activities as described above, could negatively impact the anticipated tax benefits of the proposed restructuring. Any benefits to our tax rate will also depend on our ability to operate our business in a manner consistent with the restructuring of our corporate organization and applicable taxing provisions, including by eliminating the amount of cash distributed to our U.S. parent by our subsidiaries. If the intended tax treatment is not accepted by the applicable taxing authorities, or changes in tax law(s) negatively impact the proposed structure or we do not operate our business consistent with the restructuring and applicable tax provisions, we may fail to achieve the financial efficiencies that we anticipate as a result of the restructuring and our future operating results and financial condition may be negatively impacted.
Because we have a wide range of statutory tax rates in the multiple jurisdictions in which we operate, any changes in our geographical earnings mix, including those resulting from our intercompany transfer pricing arrangements or from changes in the rules governing transfer pricing, could materially impact our effective tax rate. For example, a recent U.S. Tax Court ruling may change the way stock-based compensation costs are treated in cost sharing arrangements with subsidiaries which, if upheld, could affect our effective tax rate and cash flow. In addition, we maintain significant deferred tax assets related to federal research credits and other tax attributes. Our ability to use these credits is dependent upon having sufficient future taxable income in the relevant jurisdiction, particularly the United States. Changes in our forecasts of future income could result in an adjustment to the deferred tax asset and a related charge to earnings that could materially affect our financial results.
The enactment of legislation implementing changes in U.S. taxation of international business activities and/or the adoption of other tax reform policies and related government and regulations in the countries in which we operate could materially impact our financial position and results of operations.
Tax bills are introduced from time to time to reform U.S. taxation of international business activities. Depending on the final form of legislation enacted, if any, the consequences may be significant for us due to the large scale of our international business activities. If any of these proposals are enacted into legislation, they could have material adverse consequences on the amount of tax we pay and thereby on our financial position and results of operations.
25
Table of Contents
Further, recent developments on the Organisation for Economic Co-operation and Development (OECD) project on Base Erosion and Profit Shifting may result in changes to long-standing tax principles, which could adversely affect our effective tax rate or result in higher cash tax liabilities. We are currently undergoing income tax audits in the U.S. and several foreign tax jurisdictions, The U.S. and foreign tax authorities have questioned our intercompany transfer pricing arrangements during these audits. In recent years, several other U.S. companies have had their transfer pricing arrangements challenged as part of Internal Revenue Service (IRS) examinations, which have resulted in material proposed assessments and/or litigation with respect to those companies. If the ultimate determination of income taxes or at-source withholding taxes assessed under the current IRS audits or audits being conducted in any other tax jurisdiction results in an amount in excess of the tax provision we have recorded or reserved for, our operating results, cash flows and financial condition would be adversely affected. Our effective tax rate could also be adversely affected by different and evolving interpretations of existing law or regulations, which in turn would negatively impact our operating and financial results as a whole.
We are exposed to fluctuations in currency exchange rates, which could negatively affect our financial condition and results of operations.
Our sales contracts are primarily denominated in U.S. dollars and therefore substantially all of our net revenue is not subject to short-term foreign currency risk. Some of our operating expenses are incurred outside the United States, are denominated in foreign currency and are subject to fluctuations due to changes in foreign currency exchange rates, particularly changes in the New Taiwan Dollar. We do not currently hedge currency exposures relating to operating expenses incurred outside of the United States, but we may do so in the future. If we do not hedge against these risks, or if our attempts to hedge against these risks are not successful, our financial condition and results of operations could be adversely affected. We also may be indirectly affected by movements in exchange rates. For example, the recent strength of the US dollar against the Euro may result in our European-based competitors obtaining a cost advantage over us in negotiations with customers.
Our business, financial condition and results of operations could be adversely affected by the political and economic conditions of the countries in which we conduct business and other factors related to our international operations.
Sales to end customers in Asia countries accounted for 54% of our net revenue in fiscal year 2016 and 63% of our net revenue in fiscal year 2015. In addition, approximately 40% of our employees are located in Asia, and substantially all of our products are manufactured, assembled or tested in Asia. Multiple factors relating to our international operations and to the particular countries in which we operate could have a material adverse effect on our business, financial condition and results of operations. These factors include:
| • | changes in political, regulatory, legal or economic conditions; |
| • | restrictive governmental actions, such as restrictions on the transfer or repatriation of funds and foreign investments and trade protection measures, including export duties, quotas, customs duties and tariffs; |
| • | disruptions of capital and trading markets; |
| • | changes in import or export licensing requirements; |
| • | transportation delays; |
| • | civil disturbances or political instability; |
| • | geopolitical turmoil, including terrorism, war or political or military coups; |
| • | public health emergencies; |
| • | currency fluctuations relating to our international operating activities; |
| • | differing employment practices and labor standards; |
26
Table of Contents
| • | limitations on our ability under local laws to protect our intellectual property; |
| • | local business and cultural factors that differ from our customary standards and practices; |
| • | nationalization and expropriation; |
| • | changes in tax laws; and |
| • | difficulties in obtaining distribution and support services. |
Substantially all of our products and our end customers’ products are manufactured in Taiwan and China. Any conflict or uncertainty in these countries, including due to public health or safety concerns, could have a material adverse effect on our business, financial condition and results of operations.
Adverse global economic conditions could have a negative effect on our business, results of operations and financial condition and liquidity.
Adverse global economic conditions have from time to time caused or exacerbated significant slowdowns in the semiconductor industry generally, as well as in our target markets, which have adversely affected our business and results of operations. In recent periods, investor and customer concerns about the global economic outlook, including concerns about the level of growth in China, economic recovery in the United States and conflict in Eastern Europe have adversely affected market and business conditions in general. Macroeconomic weakness and uncertainty also make it more difficult for us to accurately forecast revenue, gross margin and expenses. Sustained uncertainty about, or worsening of, current global economic conditions may cause our customers and consumers to reduce or delay spending (leading to reduced demand for our products), could lead to the insolvency of key suppliers (resulting in product delays) and customers, and could intensify pricing pressures. Any or all of these factors could negatively affect our business, financial condition and result of operations.
Industry consolidation may lead to increased competition and may harm our operating results.
There has been a trend toward industry consolidation in our markets for several years. We expect this trend to continue. Companies that are strategic alliance partners in some areas of our business may acquire or form alliances with our competitors, thereby reducing their business with us. We believe that industry consolidation may result in stronger competitors that are better able to compete as sole-source vendors for customers. This could lead to more variability in our operating results and could have a material adverse effect on our business, operating results and financial condition.
We are subject to the cyclical nature of the semiconductor and consumer electronics industries.
The semiconductor and consumer electronics industries are highly cyclical and are characterized by constant and rapid technological change, rapid product obsolescence and price erosion, evolving standards, short product life cycles and wide fluctuations in product supply and demand. These industries experienced a significant downturn as part of the broader global recession in 2008 and 2009. Industry downturns have been characterized by diminished product demand, production overcapacity, high inventory levels and accelerated erosion of average selling prices. The most recent downturn and any future downturns could have a material adverse effect on our business and operating results. Furthermore, any upturn in the semiconductor or consumer electronics industries could result in increased competition for access to the third-party foundry and assembly capacity on which we are dependent to manufacture and assemble our products. None of our third-party foundry or assembly contractors has provided assurances that adequate capacity will be available to us in the future.
27
Table of Contents
If we fail to maintain effective internal controls, our ability to produce accurate financial statements could be impaired, which could adversely affect our operating results, our ability to operate our business and investors’ views of us.
Maintaining adequate internal controls and procedures over financial reporting to help ensure that we can produce accurate financial statements on a timely basis is a costly and time-consuming effort that needs to be re-evaluated frequently. We have established processes, controls and procedures that are designed to allow our management to report on, and our independent registered public accounting firm to attest to, our internal control over financial reporting under the rules adopted by the Securities and Exchange Commission, or SEC, pursuant to Section 404 of the Sarbanes-Oxley Act, or Section 404.
Implementing any appropriate changes to our internal controls may require specific compliance training of our directors, officers and employees, entail substantial costs in order to modify our existing accounting systems, and take a significant period of time to complete. Such changes may not, however, be effective in maintaining the adequacy of our internal controls, and any failure to maintain that adequacy, or consequent inability to produce accurate Consolidated Financial Statements and related Notes on a timely basis, could increase our operating costs and could materially impair our ability to operate our business. Furthermore, as we grow our business or acquire other businesses, our internal controls may become more complex and we may require significantly more resources to ensure they remain effective. Failure to implement required new or improved controls, or difficulties encountered in their implementation, either in our existing business or in businesses that we may acquire, could harm our operating results or cause us to fail to meet our reporting obligations to identify material weaknesses in our internal controls; the disclosure of such failure, even if quickly remedied, may cause investors to lose confidence in our financial statements and the trading price of our ordinary shares may decline. Remediation of a material weakness could require us to incur significant expense and if we fail to remedy any material weakness, our financial statements may be inaccurate, our ability to report our financial results on a timely and accurate basis may be adversely affected, our access to the capital markets may be restricted, the trading price of our ordinary shares may decline, and we may be subject to sanctions or investigation by regulatory authorities, including the SEC or The New York Stock Exchange. We may also be required to restate our financial statements from prior periods. As a result, investors’ perceptions that our internal controls are inadequate or that we are unable to produce accurate financial statements may adversely affect our stock price.
Our business is subject to various governmental regulations, and compliance with these regulations may cause us to incur significant expenses. If we fail to maintain compliance with applicable regulations, we may be forced to recall products and cease their manufacture and distribution, which could subject us to civil or criminal penalties.
The complex legal and regulatory environment exposes us to compliance and litigation costs and risks that could materially affect our operations and financial results. These laws and regulations may change, sometimes significantly, as a result of political or economic events. They include tax laws and regulations, import and export laws and regulations, government contracting laws and regulations, labor and employment laws and regulations, securities and exchange laws and regulations (and other laws applicable to publicly-traded companies such as the Foreign Corrupt Practices Act), and environmental laws and regulations. In addition, proposed laws and regulations in these and other areas, such as healthcare, could affect the cost of our business operations. Our international operations face political, legal, operational, exchange rate and other risks that we do not face in our domestic operations. We face the risk of discriminatory regulation, nationalization or expropriation of assets, changes in both domestic and foreign laws regarding trade and investment abroad, potential loss of proprietary information due to piracy, misappropriation or laws that may be less protective of our intellectual property rights. Violations of any of these laws and regulations could subject us to criminal or civil enforcement actions, any of which could have a material adverse effect on our business, financial condition or results of operations.
28
Table of Contents
Acquisitions or strategic investments may not generate the results expected and could be difficult to integrate, divert the attention of key personnel, disrupt our business, dilute stockholder value and impair our financial results.
In December 2015, we acquired certain assets of Spirit Corp LLC (“Spirit”) and its affiliates involved in the development of navigation solutions. In July 2014, we acquired 100% equity interest of Movea, S.A., (“Movea”) a French company based in Grenoble, France. In August 2014, we completed the acquisition of Trusted Positioning, Inc., (“TPI”), a Canadian corporation based in Calgary, Canada. In October 2013, we concluded the acquisition of the assets of Analog Devices, Inc.’s MEMS microphone business line. We may experience difficulties integrating these operations with ours and may not realize the anticipated value of our investment in the acquired companies.
We expect to continue to pursue acquisitions of, or strategic investments into, companies, technologies and products that we believe could accelerate our ability to compete in our core markets or allow us to enter new markets. We may enter into license or cross license agreements with strategic partners or competitors. These and other strategic transactions may involve numerous risks, any of which could harm our business, including:
| • | difficulties in integrating the manufacturing, operations, technologies, products, offices, systems, existing contracts, accounting, personnel and culture of acquired business or company and realizing the anticipated synergies of the combined businesses; |
| • | difficulties in supporting and transitioning customers, if any, of the acquired business or company; |
| • | diversion of financial and management resources from our existing operations; |
| • | the effect license and cross license agreements can have on our competitive position in our markets; |
| • | the price we pay or other resources that we devote may exceed the value we actually realize, or the value we could have realized if we had allocated the purchase price or other resources to another opportunity or for our existing operations; |
| • | risks associated with entering new markets in which we have limited or no experience, including risks related to technology, customers, competitors, product cycles, customer demand, terms and conditions and other industry specific issues; |
| • | potential loss of key employees; |
| • | customers, potential customers or strategic partners from either our current business or the acquired business may terminate or scale back their business relationships with us for many reasons, including to reduce reliance on a single company or because they view the combined businesses as potentially competitive; |
| • | assumption of unanticipated problems or latent liabilities, such as problems with the quality of the acquired company’s products; |
| • | inability to generate sufficient revenue and profitability to offset acquisition costs; |
| • | equity-based acquisitions may have a dilutive effect on our stock; and |
| • | inability to successfully consummate transactions with identified acquisition or investment candidates. |
Further, there can be no assurance that any acquisition or license agreements we consummate will generate the expected returns and other projected results we anticipate. For example, we may incur costs in excess of what we anticipate, the acquisitions of product lines with lower operating margins than our existing business may reduce our overall lower operating margins, and acquisitions frequently result in the recording of goodwill and other intangible assets that are subject to potential impairments in the future that could harm our financial results. In addition, we could use substantial portions of our available cash or, subject to provisions of any existing indebtedness we have, incur additional debt, or issue additional equity securities in order to finance acquisitions, the result of which may be to constrain our access to cash for other purposes or result in dilution to our existing stockholders. As a result of these and other risks, if we fail to manage the pursuit, consummation and integration of acquisitions or license agreements effectively, our business could suffer.
29
Table of Contents
Our sales are subject to a competitive selection process conducted by our prospective customers that can be lengthy and require us to expend significant resources, even though we ultimately may not be selected and revenue from being selected may be lower than anticipated.
The process of identifying potential new customers, developing their interest in our products, moving through their design cycle, obtaining a design win, obtaining purchase orders and entering into volume production is extremely time consuming. We compete during our customers’ product design and planning processes to achieve “design wins,” which refers to a customer’s decision to include one of our solutions in its products under development. These selection processes can be lengthy and time-sensitive and can require us to invest significant time and effort. Our products may not be selected during a customer’s design process, and we may not generate net revenue despite incurring expenses and devoting significant resources to achieving a design win, even after the customer has made its adverse selection but failed to inform us. Because the life cycles for our customers’ products can last several years and changing suppliers involves significant cost, time, effort and risk, our failure to be selected in a competitive design process can result in our foregoing net revenue from a given customer’s product line for the life of that product.
Typically, many customers, including most of our current customers, initially include our products in only one or a few product lines. It generally takes time for sales volumes of a new product line to grow and for customers to incorporate one of our solutions into additional product lines, if any. Even after we achieve a design win, a customer may decide to cancel or change its product plans, may fail to commercialize its products, or those products may fail to achieve market acceptance, any of which could cause us to fail to generate sales from a particular design win and adversely affect our results of operations. In addition, large consumer electronics companies often elect to establish more than one source for components to promote competition and control risks of supply interruption. Such “dual source” strategies can result in lower sales from a design win than anticipated. Further, failure to achieve design wins could result in lost sales and hurt our prospects in future competitive selection processes because we may not be perceived as a preferred or competitive vendor.
Our debt obligations may be a burden on our future cash flows and cash resources.
In November 2013, we issued $175 million of 1.75% Convertible Senior Notes due 2018 (the “Notes”). Our ability to make scheduled payments of the principal of, to pay interest on or to refinance our indebtedness depends on our future performance, which is subject to economic, financial, competitive and other factors beyond our control. Our business may not generate cash flow from operations in the future sufficient to satisfy our obligations under the Notes and any future indebtedness we may incur and to make necessary capital expenditures. If we are unable to generate such cash flow, we may be required to adopt one or more alternatives, such as reducing or delaying investments or capital expenditures, selling assets, refinancing or obtaining additional equity capital on terms that may be onerous or highly dilutive. Our ability to refinance the Notes or future indebtedness will depend on the capital markets and our financial condition at such time. We may not be able to engage in any of these activities or engage in these activities on desirable terms, which could result in a default on the Notes or future indebtedness.
We may issue additional shares of our common stock in connection with the conversion of the Notes, and thereby dilute our existing stockholders and potentially adversely affect the market price of our common stock.
In the event that some or all of the Notes are converted into common stock, the ownership interests of existing stockholders will be diluted, and any sales in the public market of any shares of our common stock issuable upon such conversion of the Notes could adversely affect the prevailing market price of our common stock. In addition, the anticipated conversion of the Notes could depress the market price of our common stock.
30
Table of Contents
The accounting method for convertible debt securities that may be settled in cash, such as the Notes, could have a material effect on our reported financial results.
Under Accounting Standards Codification 470-20 (ASC 470-20), Debt with Conversion and Other Options, which we refer to as ASC 470-20, an entity must separately account for the liability and equity components of the convertible debt instruments (such as the Notes) that may be settled entirely or partially in cash upon conversion in a manner that reflects the issuer’s economic interest cost. The effect of ASC 470-20 on the accounting for the Notes is that the equity component is required to be included in the additional paid-in capital section of stockholders’ equity on our consolidated balance sheet at the issuance date and the value of the equity component is treated as debt discount for purposes of accounting for the debt component of the Notes. As a result, we are required to record a greater amount of non-cash interest expense from the amortization of the discounted carrying value of the Notes to their face amount over the term of the Notes. We have and will report lower net income in our financial results because ASC 470-20 will require interest to include both the amortization of the debt discount and the instrument’s coupon interest, which could adversely affect our future financial results, the trading price of our common stock and the trading price of the Notes.
The make-whole fundamental change provisions of the Notes may delay or prevent an otherwise beneficial takeover attempt of us.
If a make-whole fundamental change such as an acquisition of our company occurs prior to the maturity of the Notes, under certain circumstances, the conversion rate for the Notes will increase such that additional shares of our common stock will be issued upon conversion of the Notes in connection with such make-whole fundamental change. The increase in the conversion rate will be determined based on the date on which the make-whole fundamental change occurs or becomes effective and the price paid (or deemed paid) per share of our common stock in such transaction. This increase will be dilutive to our existing stockholders. Our obligation to increase the conversion rate upon the occurrence of a make-whole fundamental change may, in certain circumstances, delay or prevent a takeover of us that might otherwise be beneficial to our stockholders.
Our stock price has been and will likely continue to be volatile, and stockholders may not be able to resell shares of our common stock at or above the price they originally paid.
The trading price of our common stock has been and will likely continue to be highly volatile and could be subject to wide fluctuations in price in response to various factors, some of which are beyond our control. For example since our initial public offering through April 3, 2016, the closing price of our common stock has ranged from $6.81 to $25.85. In addition to the factors discussed in this “Risk Factors” section and elsewhere in this Annual Report on Form 10-K, factors that may cause volatility in our stock price include:
| • | our small public float relative to the total number of shares of common stock that are issued and outstanding; |
| • | sales of common stock by us or our stockholders; |
| • | share price and volume fluctuations attributable to inconsistent trading volume levels of our shares; |
| • | the expiration of the contractual lock-up and market stand-off agreements; |
| • | quarterly variations in our results of operations, those of our competitors or those of our largest customers; |
| • | announcements by us or our competitors of acquisitions, design wins, new solutions, significant contracts, commercial relationships or capital commitments; |
| • | general economic conditions and slow or negative growth of related markets; |
| • | our ability to develop and market new and enhanced solutions on a timely basis; |
| • | disruption to our operations; |
31
Table of Contents
| • | the emergence of new sales channels in which we are unable to compete effectively; |
| • | any change in our board of directors or management; |
| • | changes in financial estimates including our ability to meet our future net revenue and operating profit or loss projections; |
| • | changes in governmental regulations or in the status of our regulatory approvals; |
| • | commencement of, or our involvement in, litigation; and |
| • | changes in earnings estimates or recommendations by securities analysts. |
In addition, the stock market in general, and the market for semiconductor and other technology companies in particular, have recently experienced extreme price and volume fluctuations that have often been unrelated or disproportionate to the operating performance of those companies. These broad market and industry factors may seriously harm the market price of our common stock, regardless of our actual operating performance. These trading price fluctuations may also make it more difficult for us to use our common stock as a means to make acquisitions or to use equity-related compensation to attract and retain employees.
We are currently the subject of securities class action litigation and we could be the subject of such litigation in the future due to stock price volatility, which could divert management’s attention and adversely affect our results of operations.
The stock market in general, and market prices for the securities of technology companies like ours in particular, have from time to time experienced volatility. These broad market and industry fluctuations may adversely affect the market price of our common stock, regardless of our operating performance. In several recent situations where the market price of a stock has been volatile, holders of that stock have instituted securities class action litigation against the company that issued the stock. We are currently, and in the future may be, the target of this type of litigation, see Item 3 Legal Proceedings. Securities litigation against us could result in substantial costs and divert our management’s attention from other business concerns, which could seriously harm our business. If any of our stockholders were to bring additional lawsuits against us, the defense and disposition of these lawsuits could be costly and divert the time and attention of our management and harm our operating results.
Provisions in our charter documents and under Delaware law and measures imposed by regulatory authorities to protect national security could discourage or prohibit a takeover that stockholders may consider favorable.
Provisions in our certificate of incorporation and bylaws, as amended and restated, may have the effect of delaying or preventing a change of control or changes in our management. These provisions include the following:
| • | the right of our board of directors to elect directors to fill a vacancy created by the expansion of our board of directors or the resignation, death or removal of a director, which prevents stockholders from being able to fill vacancies on our board of directors; |
| • | the establishment of a classified board of directors requiring that only a subset of the members of our board of directors be elected at each annual meeting of stockholders; |
| • | the prohibition of cumulative voting in our election of directors, which would otherwise allow less than a majority of stockholders to elect director candidates; |
| • | the requirement that stockholders provide advance notice to nominate individuals for election to our board of directors or to propose matters that can be acted upon at a stockholders’ meeting. These provisions may discourage or deter a potential acquirer from conducting a solicitation of proxies to elect the acquirer’s own slate of directors or otherwise attempting to obtain control of our company; |
32
Table of Contents
| • | the ability of our board of directors to issue, without stockholder approval, shares of undesignated preferred stock with terms set by the board of directors, which rights could be senior to those of our common stock. The ability to authorize undesignated preferred stock makes it possible for our board of directors to issue preferred stock with voting or other rights or preferences that could impede the success of any attempt to acquire us; |
| • | the required approval of the holders of at least two-thirds of the shares entitled to vote at an election of directors to repeal or adopt any provision of our certificate of incorporation regarding the election of directors; |
| • | the required approval of the holders of at least 80% of such shares to amend or repeal the provisions of our bylaws regarding the election and classification of directors; and |
| • | the required approval of the holders of at least a majority of the shares entitled to vote at an election of directors to remove directors without cause. |
As a Delaware corporation, we are also subject to certain Delaware anti-takeover provisions. Under Delaware law, a corporation may not engage in a business combination with any holder of 15% or more of its capital stock unless the holder has held the stock for three years or, among other things, the board of directors has approved the transaction. Our board of directors could rely on Delaware law to prevent or delay an acquisition of us.
A number of companies in our industry have been acquired by foreign entities, subjecting such transactions to regulatory review. The Committee of Foreign Investment in the United States (“CFIUS”) has previously stated that there may be national security concerns when considering foreign control of semiconductor manufacturers. CFIUS is a U.S. government inter-agency committee authorized to review proposed transactions that could result in control of U.S. businesses by foreign entities and affect U.S. national security. There is no certainty that a CFIUS challenge to a transaction will not be made or that CFIUS clearance will be obtained or that CFIUS clearance would not be conditioned upon actions that would be materially adverse to us or other entities involved in a transaction.
| Item 1B. | Unresolved Staff Comments. |
None.
| Item 2. | Properties. |
Our corporate headquarters are located at 1745 Technology Drive in San Jose, California in a facility consisting of approximately 159,000 square feet of office space under a lease, which expires December 2019. We sublease approximately 59,000 square feet of the office space to third parties. Our corporate headquarters facility accommodates our product design, software engineering, sales, marketing, operations, finance, and administrative activities. We also occupy space in Hsinchu, Taiwan, under a lease that expires in December 2018, which serves as our wafer-sort and testing facility. We also lease sales and support offices in China, Japan, and the Republic of Korea and have research and development offices in the Slovak Republic, Canada, France, Italy and in Massachusetts. We currently do not own any real estate or facilities. We believe that our leased facilities are adequate to meet our current needs and expect to be able to lease additional or alternative facilities to meet our future needs.
| Item 3. | Legal Proceedings. |
From time to time the Company is involved in various disputes and litigation matters that arise in the ordinary course of our business, including disputes and lawsuits related to intellectual property and employment issues. In addition, we are a party to class action lawsuits.
33
Table of Contents
In January and March of 2015, purported shareholders filed five substantially similar class action complaints in the U.S. District Court, Northern District of California against the Company and two of the Company’s current and former executives (“Class Action Defendants”) (Jim McMillan v. InvenSense, Inc., et al. Case No. 3:15-cv-00084-JD, filed January 7, 2015; William Lendales v. InvenSense, Inc. et al., Case No. 3:15-cv-00142-VC, filed on January 12, 2015; Plumber & Steamfitters Local 21 Pension Fund v. InvenSense, Inc., et al., Case No. 5:15-cv-00249-BLF, filed on January 16, 2015; William B. Davis vs. InvenSense, Inc., et al., Case No. 5:15-cv-00425-RMW, filed on January 29, 2015; and Saratoga Advantage Trust Technology & Communications Portfolio v. InvenSense et al., Case No. 3:15-cv-01134, filed on March 11, 2015). On April 23, 2015, those cases were consolidated into a single proceeding which is currently pending in the U.S. District Court, Northern District of California and captioned In re InvenSense, Inc. Securities Litigation, Case No. 3:15-cv-00084-JD (the “Securities Case”), and the Vossen Group was designated as lead plaintiff. On May 26, 2015, the lead plaintiffs filed a consolidated amended class action complaint, which alleges that the defendants violated the federal securities laws by making materially false and misleading statements regarding our business results between July 29, 2014 and October 28, 2014, and seeks unspecified damages along with plaintiff’s costs and expenses, including attorneys’ fees. On June 25, 2015, the Class Action Defendants filed a motion seeking dismissal of the case and a hearing on that motion was held on October 7, 2015. On March 28, 2016, the court granted the motion to dismiss, in part with prejudice and in part with leave to amend. On April 18, 2016, the lead plaintiff’s counsel filed an amended complaint. On May 5, 2016, the Class Action Defendants filed a motion seeking dismissal of the case. The court has scheduled a hearing on the motion for June 15, 2016.
In addition, in January and March of 2015, other purported shareholders filed three substantially similar shareholder derivative complaints against two of our current and former officers and several of our current directors, twice in the U.S. District Court, Northern District of California and once in Santa Clara Superior Court (George E Rollins v. Behrooz Abdi et al., Case No. 5:15-cv-00184-PSG, filed on January 13, 2015; Linda Karr v. Behrooz Abdi et al., Case No. 5:15-cv-00200-NC, filed on January 14, 2015; and Robert Bilbrey v. Behrooz Abdi et al., Case No. 1-15-CV-278742 was filed on March 20, 2015) (collectively, the “Derivative Cases”). In the Derivative Cases complaints, the plaintiffs make allegations similar to those presented in the Securities Case, but the plaintiffs assert various state law causes of action, including claims of breach of fiduciary duty and unjust enrichment. The Company has undertaken an evaluation of these complaints. Plaintiffs in the Derivative Cases have agreed to an indefinite stay pending developments in the Securities Case. In light of the unresolved legal issues, while a loss is reasonably possible, the amount of any potential loss cannot be estimated. At this stage, the Company is unable to predict the outcome of this matter and, accordingly, cannot estimate the potential financial impact on the Company’s business, operating results, cash flows or financial position.
The semiconductor and MEMS industries are characterized by companies that hold large numbers of patents and other intellectual property rights and that vigorously pursue, protect and enforce intellectual property rights.
Robert Bosch GmbH (“Bosch”), one of the Company’s competitors, and the Company have each previously made generalized assertions of potential patent infringement by the other. On October 28, 2015, the Company and Bosch resolved all assertions of potential infringement between them and entered into a multi-year, worldwide patent cross license agreement for MEMS and sensor technologies, excluding patents covering InvenSense’s CMOS-MEMS eutectic bonding production process and Bosch’s two-layer porous silicon production process, and an upfront payment of $11.5 million to Bosch. The other terms of the settlement and the patent cross license agreement remain confidential and are not expected to have a material impact on our future results. Based on the status of the negotiations, the Company recognized a pre-tax charge of $11.7 million during the quarter ended June 28, 2015; there were no significant changes to the final terms which required any additional charge for prior periods to be recorded in fiscal year ended April 3, 2016. In the future, other third parties may assert against the Company and its customers and distributors, their patent and other intellectual property rights to technologies that are important to our business.
34
Table of Contents
On May 16, 2012, and again on March 11, 2013 STMicroelectronics, Inc. (“STMicro”) filed patent infringement complaints (“ST Microelectronics Patent Litigation I and II”) against us, alleging infringement of certain of their patents (collectively, the “Asserted Patents”). STI alleged that certain lnvenSense MEMS products and services infringed one or more claims of the Asserted Patents. On July 9, 2012, we filed counterclaims against STI alleging infringement of certain of our patents. On February 9, 2014, we and STI settled and resolved all litigation and proceedings pending between us and STI for a one-time cash payment of $15.0 million to STI, and entered into a patent cross license agreement. The other terms of the settlement and the patent cross license agreement remain confidential and are not expected to have a material impact on our future results. This settlement and patent cross license resolves all outstanding legal proceeding between us and STMicro. The settlement resulted in recognition of a pre-tax charge of $15.0 million in fiscal year 2014.
We are not aware of any other pending legal matters or claims, individually or in the aggregate, that are expected to have a material adverse impact on its consolidated financial position, results of operations, or cash flows. However, our analysis of whether a claim may proceed to litigation cannot be predicted with certainty, nor can the results of litigation be predicted with certainty. Nevertheless, defending any of these actions, regardless of the outcome, may be costly, time consuming, distract management personnel, and have a negative effect on our business. An adverse outcome in any of these actions, including a judgment or settlement, may cause a material adverse effect on our future business, operating results, and/or financial condition.
| Item 4. | Mine Safety Disclosures. |
Not applicable.
35
Table of Contents
PART II
| Item 5. | Market for Registrant’s Common Equity, Related Stockholder Matters and Issuer Purchases of Equity Securities. |
Market Information
Our common stock is traded on the New York Stock Exchange (“NYSE”) under the symbol “INVN”. The following table sets forth for the periods indicated the high and low sales prices per share of our common stock as reported on the NYSE:
| High | Low | |||||||
| Fiscal Year ended April 3, 2016 |
||||||||
| First Quarter |
$ | 16.47 | $ | 13.79 | ||||
| Second Quarter |
$ | 15.79 | $ | 8.46 | ||||
| Third Quarter |
$ | 12.77 | $ | 8.88 | ||||
| Fourth Quarter |
$ | 11.05 | $ | 6.60 | ||||
| Fiscal Year ended March 29, 2015 |
||||||||
| First Quarter |
$ | 23.82 | $ | 17.10 | ||||
| Second Quarter |
$ | 26.78 | $ | 19.25 | ||||
| Third Quarter |
$ | 21.94 | $ | 13.50 | ||||
| Fourth Quarter |
$ | 17.56 | $ | 13.19 | ||||
As of April 3, 2016, we had approximately 34 holders of record of our common stock. The actual number of stockholders is greater than this number of record holders, and includes stockholders who are beneficial owners, but whose shares are held in street name by brokers and other nominees. This number of holders of record also does not include stockholders whose shares may be held in trust by other entities.
Dividend Policy
We have never declared or paid any cash dividends on our capital stock. We currently anticipate that we will retain all of our future earnings for use in the expansion and operation of our business and do not anticipate paying any cash dividends in the foreseeable future. Any future determination to declare cash dividends will be made at the discretion of our board of directors, subject to applicable law, and will depend on our financial condition, results of operations, capital requirements, general business conditions and other factors that our board of directors may deem relevant.
Equity Compensation Plan Information
For equity compensation plan information refer to Item 12 in Part III of this Annual Report on Form 10-K. Such information will be included in our Proxy Statement, which is incorporated herein by reference.
36
Table of Contents
Performance Graph
This performance graph shall not be deemed “soliciting material” or to be “filed” with the Securities and Exchange Commission for purposes of Section 18 of the Securities Exchange Act of 1934, as amended, or the Exchange Act, or otherwise subject to the liabilities under that Section, and shall not be deemed to be incorporated by reference into any of the Company’s filings under the Securities Act of 1933, as amended, or the Exchange Act.
The following graph shows a comparison of the cumulative total return for our common stock, the S&P 500 Index and the NYSE Composite Index from November 16, 2011 (the date our common stock commenced trading on the NYSE) through April 3, 2016. Such returns are based on historical results and are not intended to suggest future performance. Data for the S&P 500 Index and the NYSE Composite Index assume reinvestment of dividends.
These comparisons assume the investment of $100 on November 16, 2011 and the reinvestment of any dividends. The data below represents past performance and should not be an indication of future performance.
InvenSense Inc.
Total Return Performance
InvenSense Inc., S&P 500 Composite Index and the NYSE Composite Index
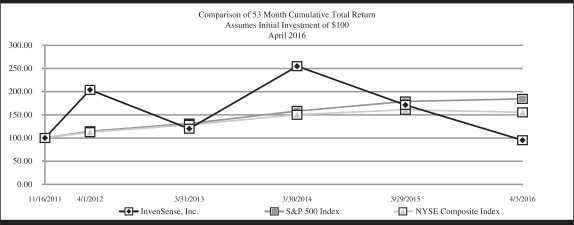
| Period Ended | ||||||||||||||||||||||||
| 11/16/2011 | 4/1/2012 | 3/31/2013 | 3/30/2014 | 3/29/2015 | 4/3/2016 | |||||||||||||||||||
| InvenSense, Inc. |
100.00 | 203.37 | 120.00 | 255.06 | 171.46 | 94.94 | ||||||||||||||||||
| S&P 500 Index |
100.00 | 114.78 | 130.81 | 158.14 | 179.06 | 184.06 | ||||||||||||||||||
| NYSE Composite Index |
100.00 | 112.16 | 128.08 | 150.58 | 160.86 | 155.28 | ||||||||||||||||||
| Item 6. | Selected Financial Data. |
We have derived the selected consolidated statements of operations data for the fiscal years ended 2016, 2015 and 2014, and selected consolidated balance sheet data as of April 3, 2016 and March 29, 2015, from our audited Consolidated Financial Statements and related Notes included elsewhere in this Annual Report on Form 10-K. We have derived the statements of operations data for fiscal year prior to fiscal year 2014, and selected consolidated balance sheet data prior to March 29, 2015, from our audited Consolidated Financial Statements and related Notes not included in this Annual Report on Form 10-K. Our historical results are not necessarily indicative of the results that may be expected for any future period. The following selected financial data should be read in conjunction with “Management’s Discussion and Analysis of Financial Condition and Results of Operations” and our Consolidated Financial Statements and the related Notes included elsewhere in this Annual Report on Form 10-K.
37
Table of Contents
Consolidated Statements of Operations Data:
| Fiscal Years | ||||||||||||||||||||
| 2016 | 2015 | 2014 | 2013 | 2012 | ||||||||||||||||
| Net revenue |
$ | 418,395 | $ | 372,019 | $ | 252,533 | $ | 208,634 | $ | 152,967 | ||||||||||
| Costs of revenue(1) |
244,257 | 216,160 | 127,724 | 97,937 | 67,571 | |||||||||||||||
|
|
|
|
|
|
|
|
|
|
|
|||||||||||
| Gross profit |
174,138 | 155,859 | 124,809 | 110,697 | 85,396 | |||||||||||||||
| Operating expenses: |
||||||||||||||||||||
| Research and development(1) |
97,368 | 90,623 | 48,431 | 24,648 | 19,672 | |||||||||||||||
| Selling, general and administrative(1) |
62,165 | 59,386 | 51,344 | 29,391 | 18,710 | |||||||||||||||
| Litigation settlement |
11,708 | — | 15,000 | — | — | |||||||||||||||
|
|
|
|
|
|
|
|
|
|
|
|||||||||||
| Total operating expenses |
171,241 | 150,009 | 114,775 | 54,039 | 38,382 | |||||||||||||||
|
|
|
|
|
|
|
|
|
|
|
|||||||||||
| Income from operations |
2,897 | 5,850 | 10,034 | 56,658 | 47,014 | |||||||||||||||
| Interest (expense) |
(11,358 | ) | (10,553 | ) | (4,012 | ) | (2 | ) | (22 | ) | ||||||||||
| Other income, net |
392 | 1,368 | 167 | 350 | 160 | |||||||||||||||
|
|
|
|
|
|
|
|
|
|
|
|||||||||||
| Other income (expense), net |
(10,966 | ) | (9,185 | ) | (3,845 | ) | 348 | 138 | ||||||||||||
|
|
|
|
|
|
|
|
|
|
|
|||||||||||
| Income (loss) before income taxes |
(8,069 | ) | (3,335 | ) | 6,189 | 57,006 | 47,152 | |||||||||||||
| Income tax provision (benefit) |
13,141 | (2,255 | ) | 70 | 5,301 | 10,205 | ||||||||||||||
|
|
|
|
|
|
|
|
|
|
|
|||||||||||
| Net income (loss) |
(21,210 | ) | (1,080 | ) | 6,119 | 51,705 | 36,947 | |||||||||||||
| Net income (loss) allocable to convertible preferred stockholders |
— | — | — | — | 20,618 | |||||||||||||||
|
|
|
|
|
|
|
|
|
|
|
|||||||||||
| Net income (loss) allocable to common stockholders |
$ | (21,210 | ) | $ | (1,080 | ) | $ | 6,119 | $ | 51,705 | $ | 16,329 | ||||||||
|
|
|
|
|
|
|
|
|
|
|
|||||||||||
| Net income (loss) per common share allocable to common stockholders: |
||||||||||||||||||||
| Basic |
$ | (0.23 | ) | $ | (0.01 | ) | $ | 0.07 | $ | 0.62 | $ | 0.39 | ||||||||
|
|
|
|
|
|
|
|
|
|
|
|||||||||||
| Diluted |
$ | (0.23 | ) | $ | (0.01 | ) | $ | 0.07 | $ | 0.59 | $ | 0.37 | ||||||||
|
|
|
|
|
|
|
|
|
|
|
|||||||||||
| Weighted average shares outstanding in computing net income (loss) per share allocable to common stockholders: |
||||||||||||||||||||
| Basic |
91,787 | 89,359 | 86,520 | 82,738 | 41,614 | |||||||||||||||
|
|
|
|
|
|
|
|
|
|
|
|||||||||||
| Diluted |
91,787 | 89,359 | 89,928 | 87,359 | 47,011 | |||||||||||||||
|
|
|
|
|
|
|
|
|
|
|
|||||||||||
| (1) | Includes stock-based compensation expense as follows: |
| Fiscal Years | ||||||||||||||||||||
| 2016 | 2015 | 2014 | 2013 | 2012 | ||||||||||||||||
| Costs of revenue |
$ | 2,472 | $ | 2,520 | $ | 1,296 | $ | 649 | $ | 325 | ||||||||||
| Research and development |
14,845 | 14,183 | 6,218 | 2,753 | 1,474 | |||||||||||||||
| Selling, general and administrative |
17,562 | 13,801 | 8,510 | 5,117 | 1,889 | |||||||||||||||
|
|
|
|
|
|
|
|
|
|
|
|||||||||||
| Total stock-based compensation expense |
$ | 34,879 | $ | 30,504 | $ | 16,024 | $ | 8,519 | $ | 3,688 | ||||||||||
|
|
|
|
|
|
|
|
|
|
|
|||||||||||
38
Table of Contents
Fiscal year 2016 was a 53-week fiscal year ended April 3, 2016. The Company’s fiscal years 2015, 2014, 2013 & 2012 were each comprised of 52 weeks.
Consolidated Balance Sheet Data:
| As of | ||||||||||||||||||||
| April 3, 2016 |
March 29, 2015 |
March 30, 2014 |
March 31, 2013 |
April 1, 2012 |
||||||||||||||||
| Cash and cash equivalents |
$ | 41,105 | $ | 85,637 | $ | 26,025 | $ | 100,843 | $ | 153,643 | ||||||||||
| Short-term investments |
243,755 | 129,919 | 91,307 | 77,040 | 4,129 | |||||||||||||||
| Working capital |
332,406 | 295,012 | 215,011 | 222,828 | 172,931 | |||||||||||||||
| Long-term investments |
— | — | 128,755 | 22,442 | — | |||||||||||||||
| Total assets |
622,461 | 585,891 | 494,735 | 279,094 | 193,318 | |||||||||||||||
| Total debt, including current portion |
151,038 | 142,810 | 135,592 | 22 | 50 | |||||||||||||||
| Common stock |
303,153 | 262,677 | 215,958 | 158,108 | 136,792 | |||||||||||||||
| Total stockholders’ equity |
378,745 | 359,501 | 313,828 | 249,947 | 176,877 | |||||||||||||||
39
Table of Contents
| Item 7. | Management’s Discussion and Analysis of Financial Condition and Results of Operations. |
The following discussion and analysis of our financial condition and results of operations should be read in conjunction with the Consolidated Financial Statements for the fiscal year ended April 3, 2016 and the Notes to those statements included elsewhere in this Annual Report on Form 10-K.
Business overview
We are a leader in sensor solutions, particularly sensors that combine microelectromechanical systems (MEMS) transducers, such as accelerometers, gyroscopes, barometers, compasses, and microphones, with proprietary algorithms, processors and firmware that synthesize and calibrate sensor output data. We utilize a fabless model, leveraging generally available complementary metal oxide semiconductor (CMOS) and MEMS foundries to whom we have granted licenses to use our proprietary additions and improvements for our benefit, as well as semiconductor packaging and services vendors. We perform the critical test and calibration functions in our wholly owned subsidiary located in Hsinchu, Taiwan. We design our products and solutions in California, Massachusetts, China, Taiwan, Korea, Japan, France, Canada, Slovakia, and Italy.
Our net revenue increased to $418.4 million in fiscal year 2016 from $372.0 million in fiscal year 2015 and $252.5 million in fiscal year 2014, respectively. We had net losses of $21.2 million and $1.1 million and net income of $6.1 million in fiscal years 2016, 2015 and 2014, respectively. At April 3, 2016, we had $284.9 million in cash, cash equivalents and investments.
Net revenue
We derive our net revenue from sales of our Motion and Audio sensor solutions. We primarily sell our products through our worldwide sales organization. We also sell our products through an indirect channel of distributors that fulfill orders from manufacturers of consumer electronics devices, original design manufacturers and contract manufacturers (collectively referred to as “intermediaries”). When we reference customers, we are referring to the manufacturers of consumer electronics devices to whom these intermediaries sell our products.
| Fiscal Year | ||||||||||||
| 2016 | 2015 | 2014 | ||||||||||
| (in thousands) | ||||||||||||
| Net revenue |
$ | 418,395 | $ | 372,019 | $ | 252,533 | ||||||
Net revenue for fiscal year 2016 increased by $46.4 million, or 12%, year-over-year, primarily due to higher volume shipments, partially offset by lower per unit average selling prices. For fiscal year 2016, total unit shipments increased by 26% and overall average unit selling price decreased by 11% year-over-year. We expect a continued trend of declining unit average selling prices for our products during their life cycles.
Net revenue for fiscal year 2015 increased by $119.5 million, or 47%, year-over-year, primarily due to higher volume shipments to manufacturers of smartphones and tablet devices, and camera modules incorporating optimal image stabilization, partially offset by lower per unit average selling prices. For fiscal year 2015, total unit shipments increased by 83% and overall average unit selling price decreased by 19% year-over-year.
For fiscal year 2016, Apple accounted for 40% of net revenue and Samsung accounted for 16% of net revenue. For fiscal year 2015, Apple accounted for 30% of net revenue and Samsung accounted for 28% of net revenue. For fiscal year 2014 Samsung accounted for 35% of total net revenue. No other customer accounted for more than 10% of total net revenue for fiscal years 2016, 2015 or 2014.
40
Table of Contents
Net revenue by end market
| Fiscal Year | ||||||||||||
| 2016 | 2015 | 2014 | ||||||||||
| (in thousands) | ||||||||||||
| Smartphone and tablet devices |
$ | 267,837 | $ | 288,448 | $ | 199,535 | ||||||
| % of net revenue |
64 | % | 78 | % | 79 | % | ||||||
| Optical image stabilization |
$ | 66,315 | $ | 44,411 | $ | 16,932 | ||||||
| % of net revenue |
16 | % | 12 | % | 7 | % | ||||||
| IoT and other |
$ | 84,243 | $ | 39,160 | $ | 36,066 | ||||||
| % of net revenue |
20 | % | 10 | % | 14 | % | ||||||
The net revenue decrease for the smartphone and tablet end market in fiscal year 2016 as compared to fiscal year 2015 was due to an initial sales ramp at a key customer in fiscal year 2015, combined with increased competition for market share across this market segment. The net revenue growth and contribution to total net revenue for the optimal image stabilization end market in fiscal year 2016 primarily reflects increased adoption of our technology for optical image stabilization in smartphone camera modules. The net revenue growth and contribution to total net revenue for the IoT and other end market in fiscal year 2016 primarily reflects increased adoption and expansion of a range of consumer electronic products in this market including the IoT market.
Net revenue by geographic region
| Fiscal Year | ||||||||||||
| Region |
2016 | 2015 | 2014 | |||||||||
| (in thousands) | ||||||||||||
| United States |
$ | 182,590 | $ | 129,665 | $ | 24,681 | ||||||
| China |
102,324 | 65,115 | 43,796 | |||||||||
| Korea |
81,211 | 130,807 | 112,880 | |||||||||
| Japan |
22,086 | 18,788 | 45,493 | |||||||||
| Taiwan |
20,365 | 21,264 | 18,737 | |||||||||
| Rest of world |
9,819 | 6,380 | 6,946 | |||||||||
|
|
|
|
|
|
|
|||||||
| $ | 418,395 | $ | 372,019 | $ | 252,533 | |||||||
|
|
|
|
|
|
|
|||||||
We report revenue by geographic region based upon the location of the headquarters of our customers. We primarily sell our products directly to customers and distributors in Asia and North America. Sales into companies headquartered in Asian countries constituted 54% of our net revenue in fiscal year 2016 compared with 63% of our net revenue in fiscal year 2015 and 87% of our net revenue in fiscal year 2014. The net revenue increases in the United States and China reflect growing demand for our products primarily by mobile device manufacturers and consumer electronics manufacturers. The net revenue decrease in Korea in fiscal year 2016 compared with fiscal year 2015 resulted from a loss of market share at a major customer.
We believe that a substantial majority of our net revenue will continue to come from sales to customers and contract manufacturers located in Asia, where most of the manufacturers of consumer electronics devices that use and may in the future use our products are headquartered. As a result of this regional customer concentration, we may be subject to economic and political events and other developments that impact our customers in Asia. For more information, see the section titled “Risk Factors—Our business, financial condition and results of operations could be adversely affected by the political and economic conditions of the countries in which we conduct business.”
Gross profit and gross margin
Gross profit is the difference between net revenue and cost of revenue and gross margin is gross profit as a percentage of net revenue.
41
Table of Contents
We price our products based on market and competitive conditions and we periodically reduce the price of our products as market and competitive conditions change. Typically, we experience price decreases over the life cycle of our products, which may vary by market and customer. As a result, if we are not able to decrease the cost of our products in line with the price decreases of our products, we may experience a reduction in our gross margin. Gross margin has been and will continue to be affected by a variety of factors, including:
| • | demand for our products and services; |
| • | our ability to add new product features to our existing products; |
| • | the rate of adoption of our products by new markets; |
| • | product manufacturing cost and yields; |
| • | intellectual property and technology licensing costs; |
| • | write-downs of inventory for excess quantity and technological obsolescence; |
| • | benefit from sale of previously written down inventories; |
| • | product mix; |
| • | erosion of average selling prices, as required by agreements entered into with our customers and in anticipation of competitive pricing pressures, new product introductions by us and our competitors, product end of life programs, and for other reasons; |
| • | the proportion of our products that are sold through direct versus indirect channels; |
| • | our ability to attain volume manufacturing pricing from our foundry partners and suppliers; |
| • | growth in our headcount and other related costs incurred in our organization; and |
| • | amortization of acquired developed technologies and fair value write-up of inventories. |
| Fiscal Year | ||||||||||||
| 2016 | 2015 | 2014 | ||||||||||
| (in thousands) | ||||||||||||
| Gross profit |
$ | 174,138 | $ | 155,859 | $ | 124,809 | ||||||
| % of net revenue |
42 | % | 42 | % | 49 | % | ||||||
Gross profit for fiscal year 2016 increased by $18.3 million, or 12%, year-over-year. Gross profit increased primarily due to a significant increase in unit sales of our products and reductions in average unit costs, partially offset by decreases in average selling price per unit sold for comparable products and an increase in the amortization of acquisition-related intangible assets. Gross profit was negatively impacted by net inventory charges largely related to excess and obsolete inventories of $4.4 million and $8.6 million in fiscal years 2016 and 2015, respectively. Gross margin remained consistent for fiscal years 2016 and 2015.
Gross profit for fiscal year 2015 increased by $31.1 million, or 25%, year-over-year primarily due to an increase in unit sales of our products, partially offset by decreases in average selling price per unit sold for comparable products and inventory charges of $8.6 million largely related to older generation products for which the company chose to discontinue selling efforts, resulting in excess and obsolete inventories. The $8.6 million of inventory charges include $0.6 million of cancellation fees. Gross profit as a percentage of net revenue, or gross margin, decreased primarily due to lower average unit selling prices resulted from a shift of revenue mix towards lower margin, high volume customers and inventory charges. Lower manufacturing yields resulting from particular customer specification changes also affected our gross margin.
We expect gross margins to fluctuate in future periods due to changes in product mix, average unit selling prices, manufacturing costs, manufacturing yields, amortization of acquired intangible assets, levels of inventory valuation and excess reserves recorded, if any, and levels of product demand.
42
Table of Contents
Research and development
Research and development expense primarily consists of personnel related expenses (including employee cash compensation and benefits, and stock-based compensation), contract engineering services, reference design development costs, development testing and evaluation costs, depreciation expense, amortization of certain acquisition intangibles and allocated occupancy costs. Research and development activities include the design of new products, refinement of existing products and processes and design of test methodologies, including hardware and software to ensure compliance with required specifications. All research and development costs are expensed as incurred. We expect our research and development expenses to increase on an absolute basis as we continue to expand our product offerings and enhance existing products.
| Fiscal Year | ||||||||||||
| 2016 | 2015 | 2014 | ||||||||||
| (in thousands) | ||||||||||||
| Research and development |
$ | 97,368 | $ | 90,623 | $ | 48,431 | ||||||
| % of net revenue |
23 | % | 24 | % | 19 | % | ||||||
Research and development expense for fiscal year 2016 increased by $6.7 million, or 7%, year-over-year. The increase was primarily attributable to a $9.0 million increase in employee compensation and benefits costs mainly due to an increase in full time equivalent headcount in part from the full year impact of our acquisitions of Movea and TPI, a $4.0 million increase in third party project and contractor costs associated with new product development, a $1.4 million increase in allocated infrastructure costs to support higher headcount, a $0.7 million increase in depreciation costs related to increased capital equipment, a $0.5 million increase in facility costs due to expansion of global facilities. Offsetting these increases was a decrease of $7.0 million from adjustments to contingent consideration related to our acquisitions (See Note 8 to Consolidated Financial Statements), $1.8 million of project cost reimbursement from third parties and $0.3 million decrease in equipment and supply costs.
Research and development expense for fiscal year 2015 increased by $42.2 million, or 87%, year-over-year. The increase was primarily attributable to a $24.5 million increase in employee compensation and benefits costs mainly due to an increase in headcount in part from our acquisitions of Movea and TPI, a $9.2 million increase in equipment and supply costs used to support research and development activities, a $2.8 million increase in third party project and contractor costs associated with new product development, a $2.6 million increase in allocated occupancy costs due to expended facilities costs to support higher headcount, and a $1.4 million increase in depreciation costs related to increased capital equipment. Research and development headcount was 299 at the end of fiscal year 2015 and 194 at the end of fiscal year 2014. Additions to headcount including employees from our acquisition of Movea and TPI primarily supported expansion of new product and future technology development activities.
Selling, general and administrative
Selling, general and administrative expense primarily consists of personnel related expenses (including employee cash compensation and benefits, and stock-based compensation), sales commissions, field application engineering support, travel costs, professional and consulting fees, legal fees, depreciation expense and allocated occupancy costs. We expect selling, general and administrative expenses to increase on an absolute basis in the future as we expand our sales, marketing, finance and administrative personnel.
| Fiscal Year | ||||||||||||
| 2016 | 2015 | 2014 | ||||||||||
| (in thousands) | ||||||||||||
| Selling, general and administrative |
$ | 62,165 | $ | 59,386 | $ | 51,344 | ||||||
| % of net revenue |
15 | % | 16 | % | 20 | % | ||||||
43
Table of Contents
Selling, general and administrative expense for fiscal year 2016 increased by $2.8 million, or 5%, year-over-year. The increase was primarily attributable to a $5.6 million increase in employee compensation and benefits costs, offset partially by a decrease of $2.9 million in outside expenses due primarily to non-recurring legal costs resulting from the Movea and TPI acquisitions in fiscal year 2015 and a decrease of $0.4 million in allocated infrastructure costs.
Selling, general and administrative expense for fiscal year 2015 increased by $8.0 million, or 16%, year-over-year. The increase was primarily attributable to a $11.4 million increase in employee compensation and benefits costs mainly due to an increase in headcount, a $1.9 million increase in facility costs, offset partially by a decrease of $5.3 million in outside expenses due primarily to patent legal costs related to the settlement with ST Microelectronics, Inc. (“STMicro”) concluded in fiscal year 2014. Selling, general and administrative headcount increased to 150 at the end of fiscal year 2015 from 132 in fiscal year 2014. Additions to headcount primarily supported expanded geographic, customer and market opportunities for our products.
Litigation settlement
| Fiscal Year | ||||||||||||
| 2016 | 2015 | 2014 | ||||||||||
| (in thousands) | ||||||||||||
| Patent litigation settlement |
$ | 11,708 | $ | — | $ | 15,000 | ||||||
| % of net revenue |
3 | % | — | % | 6 | % | ||||||
On October 28, 2015, Bosch and the Company resolved all assertions of potential infringement made by the respective parties. The settlement resulted in the Company incurring a charge of $11.7 million in fiscal year 2016. The other terms of the settlement and the patent cross license agreement remain confidential and are not expected to have a material impact on our future results, see Item 3, Legal Proceedings. On February 9, 2014, we settled and resolved all litigation and re-examination proceedings pending between STMicro and us for a one- time cash payment of $15.0 million to STMicro, and entered into a patent cross license agreement. This settlement and patent cross license resolves all outstanding legal proceeding between us and STMicro. The settlement resulted in recognition of a pre-tax charge of $15.0 million in fiscal year 2014. The other terms of the settlement and the patent cross license agreement remain confidential and are not expected to have a material impact on our future results.
Income from operations
| Fiscal Year | ||||||||||||
| 2016 | 2015 | 2014 | ||||||||||
| (in thousands) | ||||||||||||
| Income from operations |
$ | 2,897 | $ | 5,850 | $ | 10,034 | ||||||
| % of net revenue |
1 | % | 2 | % | 4 | % | ||||||
Income from operations for fiscal year 2016 decreased by $3.0 million, or 50%, compared to fiscal year 2015, primarily due to an increase in operating expenses of $21.2 million, of which $11.7 million was due to the Bosch settlement, partially offset by an increase in gross profit of $18.3 million. As a percentage of net revenue, income from operations decreased by 1%.
Income from operations for fiscal year 2015 decreased by $4.2 million, or 42%, compared to fiscal year 2014. As a percentage of net revenue, income from operations decreased by 2% year-over-year primarily due to decreased gross profit as a percentage of net revenue.
44
Table of Contents
Interest (expense)
| Fiscal Year | ||||||||||||
| 2016 | 2015 | 2014 | ||||||||||
| (in thousands) | ||||||||||||
| Interest (expense) |
$ | (11,358 | ) | $ | (10,553 | ) | $ | (4,012 | ) | |||
| % of net revenue |
(3 | )% | (3 | )% | (2 | )% | ||||||
Interest (expense) increased by $0.8 million for fiscal year 2016 compared to fiscal year 2015 due to the increased accretion interest expense on the Convertible Senior Notes issued in the third quarter of fiscal year 2014.
Interest (expense) increased by $6.5 million in fiscal year 2015 compared to fiscal year 2014 due to interest expense related to the Convertible Senior Notes issued which were outstanding five months in fiscal year 2014.
Other income, net
| Fiscal Year | ||||||||||||
| 2016 | 2015 | 2014 | ||||||||||
| (in thousands) | ||||||||||||
| Other income, net |
$ | 392 | $ | 1,368 | $ | 167 | ||||||
| % of net revenue |
0 | % | 0 | % | 0 | % | ||||||
Other income, net decreased by $1.0 million, or 71%, for fiscal year 2016 compared to fiscal year 2015 primarily due to a non-recurring $0.9 million gain recognized on our equity investment in TPI during fiscal year 2015.
Other income, net increased by $1.2 million, or 719%, for fiscal year 2015 compared to fiscal year 2014. The increase in other income, net was primarily due to the gain recognized on our equity investment in TPI of $0.9 million.
Income tax provision (benefit)
The provision for income taxes consists of our estimated Federal, State and foreign income taxes based on our pre-tax income. The effective rate for fiscal year 2016 differs from the federal statutory rate of 35%, primarily due to the valuation allowance set up to against all US domestic defer tax assets, the benefit of the federal and California research and development tax credits, the earnings in foreign jurisdictions, which are subject to lower tax rates, and the tax effect of non-deductible stock compensation and the integration of acquired technologies. The passage of Protecting Americans from Tax Hike Act of 2015 on December 18, 2015 retroactively and permanently reinstated the U.S. federal R&D tax credit effective January 1, 2015.
| Fiscal Year | ||||||||||||
| 2016 | 2015 | 2014 | ||||||||||
| (in thousands) | ||||||||||||
| Income tax provision (benefit) |
$ | 13,141 | $ | (2,255 | ) | $ | 70 | |||||
| % of income (loss) before income tax |
(163 | )% | 68 | % | 1 | % | ||||||
In fiscal year 2016, we recorded an income tax expense of $13.1 million compared to an income tax benefit of ($2.3) million for fiscal year 2015. The expense was primarily due to the valuation allowance provided in fiscal year 2016 in the amount of $17.7 million against all U.S. domestic deferred tax assets.
In fiscal year 2015, we recorded an income tax benefit of $(2.3) million compared to an income tax provision of $0.1 million for fiscal year 2014. The benefit was primarily due to the research and development tax
45
Table of Contents
credits and the foreign rate differentials, and was negatively affected by an increase in non-deductible stock option expense, and other deductible federal tax attributes.
The provision for income tax differs from the amount computed by applying the federal statutory tax rate to income before income taxes as follows:
| Fiscal Year | ||||||||||||
| 2016 | 2015 | 2014 | ||||||||||
| (in thousands) | ||||||||||||
| Income tax provision at the federal statutory rate |
35.0 | % | 35.0 | % | 35.0 | % | ||||||
| Research and development credits |
35.8 | 90.7 | (27.3 | ) | ||||||||
| Foreign tax rate differential |
31.5 | (27.3 | ) | (22.0 | ) | |||||||
| Non-deductible stock compensation |
(48.3 | ) | (27.3 | ) | 19.5 | |||||||
| Other |
2.8 | (3.5 | ) | (4.1 | ) | |||||||
| Valuation allowance |
(219.6 | ) | — | — | ||||||||
|
|
|
|
|
|
|
|||||||
| Effective tax rate |
(162.8 | )% | 67.6 | % | 1.1 | % | ||||||
|
|
|
|
|
|
|
|||||||
Over 90% of our revenues are derived from sales to customers located outside the U.S. A significant percentage of our pre-tax income in 2016, 2015, and 2014 was generated internationally, primarily from our Cayman Island subsidiary, which is currently a zero tax jurisdiction. Since 2011, our Cayman Island subsidiary has procured the rights to manufacture and sell our products in non-US locations via an intercompany technology license arrangement with its U.S. parent company. In addition, the Company has not provided for U.S. federal income and foreign withholding taxes on undistributed earnings from its non-U.S. subsidiaries, as it is the practice and intention of the Company to reinvest the earnings of its non-U.S. subsidiaries in those operations. Our effective tax rate is highly dependent upon the geographic distribution of our worldwide earnings or losses, and the tax regulations in each geographic region. We expect that a large percentage of our consolidated pre-tax income will continue to be derived from, and reinvested in, our overseas operations. We anticipate that this pre-tax income will continue to be subject to foreign tax at significantly lower tax rates when compared to the United States federal statutory tax rate. Our effective tax rate could also fluctuate due to changes in the valuation of our deferred tax assets or liabilities, or by changes in tax laws, regulations, or accounting principles, as well as certain discrete items.
As of April 3, 2016, we had $17.7 million of US federal deferred tax assets (DTAs) related to research and development credits and other tax attributes including accrued expenses and stock based compensation that can be used to offset federal taxable income in future periods. The realizability of these DTAs is based on our ability to generate sufficient and timely income in the US federal tax jurisdiction in future periods.
We consider both positive and negative evidence to conclude if sufficient future taxable income will be generated to be able to realize our DTAs. One significant, objective piece of evidence is the amount of domestic income or loss recognized by us in the three preceding years. Through the end of fiscal 2015, and for the first three quarters of fiscal 2016, this analysis, after adjustment for certain non-recurring charges, indicated that the cumulative twelve-quarter results was positive, and, along with our short and long-term earnings projections, formed the basis for concluding realization was more likely than not for our domestic DTAs. In the fourth quarter of fiscal 2016, as a result of the loss incurred in the quarter, this cumulative analysis turned to a loss. In addition, we lowered our short-term operating forecast. Based on this updated information, we changed our conclusions on the realizability of our US federal DTAs and recorded a valuation allowance charge of $17.7 million in the quarter. We continue to be profitable in our international operations, and accordingly no valuation allowance has been provided on the $0.9 million of foreign DTAs as of April 3, 2016.
On July 27, 2015, the Tax Court issued an opinion (Altera Corp. et al. v. Commissioner) regarding the treatment of stock-based compensation expense in intercompany cost-sharing arrangements. However, U.S.
46
Table of Contents
Treasury has not withdrawn the requirement to include stock-based compensation from its regulations. Also, there is uncertainty related to the IRS response to the Tax Court opinion, the final resolution of this issue, and the potential favorable benefits to the Company. As such, no impact will be recorded at this time. The Company will continue to monitor developments related to this opinion and the potential impact of those developments on the Company’s current and prior fiscal years.
Net income
| Fiscal Year | ||||||||||||
| 2016 | 2015 | 2014 | ||||||||||
| (in thousands) | ||||||||||||
| Net income |
$ | (21,210 | ) | $ | (1,080 | ) | $ | 6,119 | ||||
| % of net revenue |
(5 | )% | (0 | )% | 2 | % | ||||||
Net income decreased by $20.1 million for fiscal year 2016 compared to fiscal year 2015. As a percentage of net revenue, net income decreased by 5% year-over-year primarily due to valuation allowance against all U.S. domestic deferred tax assets and Bosch settlement recorded in fiscal year 2016.
Net income for fiscal year 2015 decreased by $7.2 million, or 118%, year-over-year. As a percentage of net revenue, net income decreased by 2% year-over-year primarily due to the decreased gross profit combined with increased interest expense, offset partially by income tax benefit.
Quarterly results of operations and seasonality
Tables setting forth our unaudited consolidated statements of operations for each quarter of fiscal years 2016 and 2015 may be found in Note 10, Quarterly Financial Data (Unaudited), in our Notes to Consolidated Financial Statements included elsewhere in this Annual Report on Form 10-K, which information is incorporated herein by reference. The quarterly data have been prepared on the same basis as the audited Consolidated Financial Statements and related Notes included elsewhere in this Annual Report on Form 10-K and include all adjustments consisting only of normal recurring adjustments that we consider necessary for a fair presentation of the financial information set forth below.
Sales of certain consumer electronic devices, such as smartphone and tablet models, video gaming consoles and portable video gaming devices, tend to be weighted towards holiday periods. As a result, historically, our customers in this market tend to increase production of products incorporating our solutions in the second and third quarters of our fiscal year in order to build inventories. Sales of our products tend to correspondingly increase during these periods and to be lower in the first and fourth quarters of the fiscal year. Additionally, some smartphone and tablet customers seasonally increase purchases of our products during certain times of year (principally spring and fall) when they typically introduce new models of their own products. We expect this seasonality to continue in future periods, although we expect the magnitude of holiday seasonality to decrease as we increase sales to manufacturers of smartphones and tablet devices relative to sales to gaming manufacturers. We believe the quarterly sales progression for smartphones devices is less subject to seasonality due to the fact that end customer demand is also driven by consumer upgrade cycles that typically occur throughout the year. We have limited visibility into future customer demand and the product mix that our customers will require, which could adversely affect our net revenue forecasts and operating margins.
For a variety of reasons, including those listed in Item 1A, Risk Factors, our revenue can fluctuate each quarter independent of the historical seasonality patterns discussed in the prior paragraph. For example, we are expecting our first quarter of fiscal year 2017 revenue to fall within a range of $58 million to $62 million, which represents both a significant sequential decline from the fourth quarter of fiscal year 2016 and a significant decline from our revenue reported in the first quarter of fiscal year 2016. Because of this anticipated revenue
47
Table of Contents
decline, we are also expecting a larger operating loss for the first quarter of fiscal year 2017 when compared with the fourth quarter of fiscal year 2016 or the first quarter of fiscal year 2016.
In addition to the impact of competitive pricing pressures, we have also experienced fluctuations in gross profit generally due to variability in customer and product mix, levels of inventory valuation and excess reserves recorded as well as manufacturing cost efficiencies which can be influenced by fluctuations in manufacturing process yields as well as introductions of new less expensive to manufacture products. As a result of our acquisition of Movea and TPI in the second quarter of fiscal year 2015, we have incurred expenses for the amortization of the fair value of acquired developed technology. Our products are manufactured by third-party manufacturers according to our estimates of future customer demand, of which we have limited visibility. If we inaccurately forecast demand for our products, we may be unable to obtain adequate and cost-effective foundry or assembly capacity from our third-party manufacturers to meet our customers’ delivery requirements, or we may accumulate excess inventories, which could adversely impact our gross margins.
Our operating expenses generally increased over the eight quarters in fiscal years 2016 and 2015 in absolute dollars primarily as a result of our increase in headcount related to our acquisitions, our investment in the development of new products, and our corporate infrastructure to support higher levels of sales and operation as a public company.
We base our planned operating expenses on our expectations of future net revenue. If net revenue for a particular quarter is lower than expected, we may be unable to proportionately reduce our operating expenses. As a result, we believe that period-to-period comparisons of our past operating results should not be relied upon as an indication of our future performance.
Financial condition, liquidity and capital resources
Our primary uses of cash are to fund operating expenses, purchase inventory, acquire property and equipment and to pursue strategic investments or acquisitions if opportunities arise. Cash used to fund operating expenses excludes the impact of non-cash items such as depreciation, amortization and stock-based compensation and is impacted by the timing of when we pay these expenses as reflected in the change in our outstanding accounts payable and accrued expenses.
Our primary sources of cash are cash receipts on accounts receivable from our shipment of products to customers and distributors. Aside from the growth in amounts billed to our customers, net cash collections of accounts receivable are impacted by the efficiency of our cash collections process, which can vary from period to period depending on the payment cycles of our major customers and distributors. Other sources of liquidity include cash proceeds from the sale of debt or equity securities. If we raise funds by issuing equity securities, dilution to stockholders may result. Any equity securities issued may also provide for rights, preferences or privileges senior to those of holders of our common stock. If we raise funds by issuing debt securities, these debt securities would have rights, preferences and privileges senior to those of holders of our common stock.
We believe our current cash, cash equivalents and investments along with net cash provided by operating activities, will be sufficient to satisfy our liquidity requirements for the next 12 months. We also believe our current cash, cash equivalents and investments positions us to pursue acquisitions if opportunities arise. Our liquidity may be negatively impacted as a result of a decline in sales of our products due to a decline in our end markets, decrease in sales of our customers’ products in the market, or adoption of competitors’ products. Additionally, $21.0 million of the $41.1 million of cash and cash equivalents was held by our foreign subsidiaries as of April 3, 2016. If these funds are needed for our operations in the United States, we would be required to accrue and pay U.S. taxes to repatriate these funds. However, our intent is to indefinitely reinvest these funds outside of the United States, and our current plans do not demonstrate a need to repatriate them to fund our U.S. operations including liquidity needs arising in the normal course of business and any cash debt service requirements. Additionally, as of April 3, 2016, we had short-term available-for-sale investments of $243.8 million which are held in the US entity.
48
Table of Contents
Our cash and cash equivalents balance decreased by $44.5 million during the year ended April 3, 2016, primarily due to the purchase of available-for-sale investments partially offset by sale and maturity of short-term investments and cash generated from operating activities. The change in cash and cash equivalents for fiscal years 2016, 2015 and 2014 was as follows:
| Fiscal Year | ||||||||||||
| 2016 | 2015 | 2014 | ||||||||||
| (in thousands) | ||||||||||||
| Net cash provided by (used in) operating activities |
$ | 83,038 | $ | 66,842 | $ | (11,298 | ) | |||||
| Net cash used in investing activities |
(129,867 | ) | (10,632 | ) | (237,247 | ) | ||||||
| Net cash provided by financing activities |
2,297 | 3,402 | 173,727 | |||||||||
|
|
|
|
|
|
|
|||||||
| Net increase (decrease) in cash and cash equivalents |
$ | (44,532 | ) | $ | 59,612 | $ | (74,818 | ) | ||||
|
|
|
|
|
|
|
|||||||
Net cash provided by (used in) operating activities
Net cash provided by operating activities for fiscal year 2016 of $83.0 million was primarily due to non-cash expenses of $70.6 million and a change in operating assets and liabilities of $33.6 million, offset by a net loss of $21.2 million. The non-cash expenses of $70.6 million consisted primarily of stock-based compensation of $34.9 million, depreciation and amortization of $21.9 million, non-cash interest expense of $8.2 million, deferred income tax assets of $10.4 million, partially offset by contingent consideration adjustment of $5.3 million. The changes in our net operating assets and liabilities of $33.6 million were primarily comprised of a net increase of $18.4 million in accounts payable and accrued liabilities mainly due to timing of purchases and payments to our vendors, a decrease of $12.8 million in inventories and a decrease of $3.1 million in accounts receivables.
Net cash provided by operating activities in fiscal year 2015 of $66.8 million compared with a net loss of $1.1 million primarily reflected non-cash expenses of $50.2 million and changes in operating assets and liabilities which generated cash of $17.8 million. The non-cash expenses were mainly comprised of stock-based compensation of $30.5 million, depreciation and amortization of $17.2 million, non-cash interest expense of $7.5 million, offset partially by deferred income tax assets of $5.5 million. The changes in our net operating assets and liabilities were comprised of a net increase of $16.1 million in accounts payable and accrued liabilities, a decrease of $8.8 million in prepaid and other current assets, offset partially by an increase of $4.9 million in accounts receivable and an increase of $2.1 million in inventories. The $16.1 million increase in accounts payable and accrued liabilities was primarily due to price discounts to a customer and employee compensation accruals. The $8.8 million decrease in prepaid expenses and other current assets was primarily due to tax refund received in fiscal year 2015. The $4.9 million increase in accounts receivable and $2.1 million increase in inventories were primarily due to business growth.
Net cash used in operating activities in fiscal year 2014 of $11.3 million primarily reflected net income of $6.1 million, and non-cash expenses of $23.1 million, which was more than offset by a net increase in operating assets and liabilities of $40.5 million. The net increase in operating assets and liabilities of $40.5 million consisted primarily of an increase in accounts receivable of $8.9 million, an increase in inventories of $44.2 million, an increase in prepaid expenses and other current assets of $2.7 million, and an increase of other assets of $1.0 million partially offset by an increase in accounts payable of $4.5 million and an increase in accrued liabilities of $11.8 million. The movements in working capital were primarily based on the changes in accounts receivables, prepaid and other current assets and inventories resulting from our increase in sales volume and strategic decision to build inventory. Non-cash expenses of $23.1 million consisted primarily of depreciation and amortization of $6.6 million, stock-based compensation of $16.0 million and non-cash interest expense of $2.8 million, partially offset by $2.3 million change in deferred income taxes.
49
Table of Contents
Net cash used in investing activities
Net cash used in investing activities in fiscal year 2016 of $129.9 million primarily reflected the purchase of available-for-sale investments of $284.5 million, the purchase of property and equipment of $7.8 million and the Spirit acquisitions of $6.7 million, partially offset by the sale and maturity of available-for-sale investments of $170.0 million.
Net cash used in investing activities in fiscal year 2015 of $10.6 million primarily reflected the Movea and TPI acquisitions of $71.3 million, purchase of available-for-sale investments of $55.8 million, and the purchase of property and equipment of $27.3 million, partially offset by the sale and maturity of available-for-sale investments of $146.0 million.
Net cash used in investing activities in fiscal year 2014 of $237.2 million primarily reflected the purchase of available-for-sale investments of $206.9 million, acquisition of a business of $99.3 million, and the purchase of property and equipment of $17.2 million, partially offset by the sale and maturity of available-for-sale investments of $86.2 million.
Net cash provided by financing activities
Net cash provided by financing activities in fiscal year 2016 of $2.3 million resulted primarily from proceeds from the issuance of common stock of $5.6 million partially offset by payments of contingent consideration and acquisition holdback related to the TPI of $3.3 million.
Net cash provided by financing activities in fiscal year 2015 of proceeds from the issuance of common stock of $10.4 million partially offset by certain payments of contingent consideration related to the Movea and TPI acquisitions of $7.1 million.
Net cash provided by financing activities in fiscal year 2014 of $173.7 million resulted primarily from net proceeds from debt issuance of $169.3 million, proceeds from issuance of call options of $25.6 million, proceeds from the issuance of common stock of $14.3 million and excess tax benefit from stock-based compensation of $4.8 million, partially offset by payment for purchase options of $39.1 million.
Contractual obligations
The following table summarizes our outstanding contractual obligations as of April 3, 2016:
| Payments due by period | ||||||||||||||||||||
| Total | Less than 1 year |
1-3 years |
3-5 years | More than 5 years |
||||||||||||||||
| (in thousands) | ||||||||||||||||||||
| Convertible senior notes obligations |
$ | 175,000 | $ | — | $ | 175,000 | $ | — | $ | — | ||||||||||
| Interest on convertible senior notes obligations |
7,886 | 3,054 | 4,832 | — | ||||||||||||||||
| Operating lease obligations |
25,222 | 5,001 | 13,030 | 6,675 | 516 | |||||||||||||||
| Purchase obligations |
18,118 | 18,118 | — | — | — | |||||||||||||||
|
|
|
|
|
|
|
|
|
|
|
|||||||||||
| Total contractual obligations |
$ | 226,226 | $ | 26,173 | $ | 192,862 | $ | 6,675 | $ | 516 | ||||||||||
|
|
|
|
|
|
|
|
|
|
|
|||||||||||
Convertible senior notes and interest on convertible senior notes obligations relate to the convertible senior notes issued in November 2013. See Note 5 to the Consolidated Financial Statements included elsewhere in this Annual Report on Form 10-K for a description of the convertible senior notes.
Operating lease obligations consist of contractual obligations from agreements for non-cancelable office space, net of future minimum lease income. Minimum sublease income from the third parties was approximately
50
Table of Contents
$1.5 million and $1.3 million in fiscal year 2016 and 2015, respectively. The failure of the third party to comply with its obligations under the subleases, we remain contractually obligated, as primary lessee, under the lease.
Purchase obligations consist of the minimum purchase commitments made to contract manufacturers.
Included in our gross unrecognized tax benefits balance of $32.7 million at April 3, 2016 are $18.3 million of tax positions which would affect income tax expense if recognized. As of April 3, 2016, approximately $14.4 million of unrecognized tax benefits including $11.7 million in federal and $2.7 million in states have been established as our valuation allowance which primarily due to the Company being unable to generate sufficient taxable income in the future to fully utilize operating loss carryforwards and research and development credits before they expire. Due to the high degree of uncertainty regarding the settlement of these liabilities, we are unable to estimate the year in which the future cash flows may occur. As a result, these amounts are not included in the table above.
Warranties and indemnification
In connection with the sale of products in the ordinary course of business, we often agree to indemnify customers against third-party claims that our products infringe on the intellectual property rights of others. Further, our certificate of incorporation and bylaws require us to indemnify our officers and directors against any action that may arise out of their services in that capacity. We have not been subject to any material liabilities under such provisions and therefore believe that our exposure for these indemnification obligations is minimal. Accordingly, we have no liabilities recorded for these indemnity agreements as of April 3, 2016.
Off-balance sheet arrangements
As part of our ongoing business, we do not participate in transactions that generate relationships with unconsolidated entities of financial partnerships, such as entities often referred to as structured finance or special purpose entities, or SPEs, which would have been established for the purpose of facilitating off-balance sheet arrangements or other contractually narrow or limited purposes. As of April 3, 2016, we were not involved in any unconsolidated SPE transactions.
Recent accounting pronouncements
Information with respect to Recent Accounting Pronouncements may be found in Note 1- Organization and Summary of Significant Accounting Policies-Item 15: Financial Statements and Exhibits.
Critical accounting policies and estimates
Our Consolidated Financial Statements and the related Notes included elsewhere in this Annual Report on Form 10-K are prepared in accordance with accounting principles generally accepted in the United States. The preparation of these Consolidated Financial Statements and the related Notes requires us to make estimates and assumptions that affect the reported amounts of assets, liabilities, net revenue, costs, and expenses, and any related disclosures. We base our estimates on historical experience and on various other assumptions that we believe to be reasonable under the circumstances. Changes in accounting estimates are reasonably likely to occur from period to period. Accordingly, actual results could differ significantly from the estimates made by our management. We evaluate our estimates and assumptions on an ongoing basis. To the extent that there are material differences between these estimates and our actual results, our future financial statement presentation, financial condition results of operations and cash flows will be affected.
Business combinations
The purchase price of an acquisition is allocated to the underlying assets acquired and liabilities assumed based upon their estimated fair values at the date of acquisition. To the extent the purchase price exceeds the fair
51
Table of Contents
value of the net identifiable tangible and intangible assets acquired and liabilities assumed, such excess is allocated to goodwill. The Company determines the estimated fair values after review and consideration of relevant information, including discounted cash flows, quoted market prices and estimates made by management. The Company adjusts the preliminary purchase price allocation, as necessary, during the measurement period of up to one year after the acquisition closing date as it obtains more information as to facts and circumstances existing at the acquisition date impacting asset valuations and liabilities assumed. Acquisition-related costs are recognized separately from the acquisition and are expensed as incurred.
Goodwill
Goodwill represents the excess of the purchase price over the fair value of the net tangible and identifiable intangible assets acquired in a business combination. In accordance with Accounting Standards Codification (“ASC”) 350, the Company reviews goodwill for impairment at the reporting unit level on an annual basis or whenever events or changes in circumstances indicate the carrying value may not be recoverable. The Company performed the first step of the two-step goodwill impairment test. As the Company uses the market approach to assess impairment, its common stock price is an important component of the fair value calculation. The Company has determined that it has a single reporting unit for purposes of performing its goodwill impairment test. The Company performed its annual impairment test during the quarter ended December 27, 2015 and determined that the fair value of its reporting unit was substantially in excess of its carrying value, and thus its goodwill was not impaired.
Intangible assets
Intangible assets consist of developed technology, customer relationships, and in-process research and development resulting from the Company’s acquisition of MEMS microphone business of Analog Devices, Inc. (“ADI”) in fiscal year 2014, Movea S.A, Trusted Positioning, Inc. and patents in fiscal year 2015 as well as Spirit Corp LLC in fiscal year 2016 (see note 8). Acquired intangible assets that are subject to amortization are developed technology and customer relationships and are recorded at cost, net of accumulated amortization. Intangible assets are amortized on a straight-line basis over their estimated useful lives. In-process research and development capitalized during business combination is amortized only after successful completion of project, over the expected useful life.
Impairment of long lived assets
The Company regularly reviews the carrying amount of its long-lived assets, including property and equipment and intangible assets, as well as the useful lives, to determine whether indicators of impairment may exist which warrant adjustments to carrying values or estimated useful lives. An impairment loss would be recognized when the sum of the expected future undiscounted net cash flows is less than the carrying amount of the asset. Should impairment exist, the impairment loss would be measured based on the excess of the carrying amount of the asset over the asset’s fair value.
Income taxes
We account for income taxes under the asset and liability approach. Under this approach, deferred tax assets and liabilities are recognized for the expected tax consequences of temporary differences between the tax basis of assets and liabilities and their reported amounts in the Consolidated Financial Statements and related Notes using enacted tax rates and laws that will be in effect when the difference is expected to reverse. Deferred income tax assets are recognized for net operating loss carryforwards, research and development credits, and temporary differences. Valuation allowances are provided against deferred tax assets that are not likely to be realized. In assessing the need for a valuation allowance, we consider positive and negative evidence such as historical levels of income or loss, projections of future income, expectations and risks associated with estimates of future taxable income and ongoing prudent and practical tax planning strategies. The Company believes that uncertainty exists
52
Table of Contents
regarding the realizability of certain deferred income tax assets and, accordingly, has established a valuation allowance for those deferred income tax assets to the extent the realizability is not deemed to be more likely than not. Deferred income tax assets and liabilities are measured using enacted tax rates.
As of April 3, 2016, we had $17.7 million of US federal DTAs related to research and development credits and other tax attributes including accrued expenses and stock based compensation that can be used to offset federal taxable income in future periods. The realizability of these DTAs is based on our ability to generate sufficient and timely income in the US federal tax jurisdiction in future periods.
We consider both positive and negative evidence to conclude if sufficient future taxable income will be generated to be able to realize our DTAs. One significant, objective piece of evidence is the amount of domestic income or loss recognized by us in the three preceding years. Through the end of fiscal 2015, and for the first three quarters of fiscal 2016, this analysis, after adjustment for certain non-recurring charges, indicated that the cumulative twelve-quarter results was positive, and, along with our short and long-term earnings projections, formed the basis for concluding realization was more likely than not for our domestic DTAs. In the fourth quarter of fiscal 2016, as a result of the loss incurred in the quarter, this cumulative analysis turned to a loss. In addition, we lowered our short-term operating forecast. Based on this updated information, we changed our conclusions on the realizability of our US federal DTAs and recorded a valuation allowance charge of $17.7 million in the quarter. We continue to be profitable in our international operations, and accordingly no valuation allowance has been provided on the $0.9 million of foreign DTAs as of April 3, 2016.
We are subject to income taxes in the United States and foreign countries, and we expect to be subject to routine corporate income tax audits in many of these jurisdictions. We believe that our tax return positions are fully supported, but tax authorities are likely to challenge certain positions, which may not be fully sustained. Our income tax expense includes amounts intended to satisfy income tax assessments that result from these challenges. Determining the income tax expense for these potential assessments and recording the related assets and liabilities requires management judgment and estimates. We believe that our provision for uncertain tax positions, including related interest and penalties, is adequate based on information currently available to us. The amount ultimately paid upon resolution of audits could be materially different from the amounts previously included in income tax expense and therefore could have a material impact on our tax provision, net income and cash flows. Our overall provision requirement could change due to the issuance of new regulations or new case law, negotiations with tax authorities, resolution with respect to individual audit issues, or the entire audit, or the expiration of statutes of limitation.
We have expanded our international operations and staff, and expect to continue to do so in the future, to better support our expansion in international markets. This business expansion has included an international structure that, among other things, consists of research and development cost-sharing arrangements, certain licenses and other contractual arrangements between us and our wholly owned foreign subsidiaries. These arrangements may result in a lower percentage of our pre-tax income being subject to a relatively higher U.S. federal statutory tax rate. As a result, our effective tax rate is expected to be lower than the U.S. federal statutory rate. However, the realization of any expected tax benefits is contingent upon numerous factors, including the judgments of tax authorities in several jurisdictions, and thus cannot be assured.
We have not provided for U.S. federal income and foreign withholding taxes on undistributed earnings from non-U.S. operations as in general, it is our practice and intention to reinvest the earnings of our non-U.S. subsidiaries in those operations. We have not made a provision for U.S. or additional foreign withholding taxes on the excess of the amount for financial reporting over the tax basis of investments in foreign subsidiaries that are essentially permanent in duration of approximately $141.0 million and $99.8 million at April 3, 2016 and March 29, 2015, respectively. Generally, such amounts become subject to U.S. taxation upon the remittance of dividends and under certain other circumstances. It is not practicable to estimate the amount of deferred tax liability related to investments in these foreign subsidiaries.
53
Table of Contents
Inventory valuation
Our inventories are stated at the lower of cost or market on a first-in, first-out basis. Inventories include finished good parts that may be specialized in nature and subject to obsolescence. As our business has grown and our inventory levels have risen, and include items for which we may not have customer purchase orders when manufactured, requiring us to actively market and sell those products. We periodically review the quantities and carrying values of inventories to assess whether the inventories are recoverable. Write-down of inventory for excess quantity and technological obsolescence are charged to cost of revenues as incurred. Actual demand may materially differ from our projected demand, and this difference could have a material impact on our gross margin and inventory balances based on additional provisions for excess or obsolete inventory or a benefit from sales of inventory previously written down. Write-down amounts charged to cost of revenues for fiscal years 2016 and 2015 were $4.4 million and $8.6 million, respectively. Write-down amounts charged to cost of revenues for fiscal year 2014 were insignificant.
Stock-based compensation
We measure the cost of employee services received in exchange for equity incentive awards, including stock options, based on the grant date fair value of the award. The fair value is estimated using the Black-Scholes option pricing model. The Black-Scholes model requires us to estimate certain key assumptions including future stock price volatility, expected term of the options, risk free rates, and dividend yields. Certain of our stock-based awards contained a market-based condition for vesting; these awards were valued using a Monte Carlo simulation analysis to model and value multiple possible outcomes. We also estimate potential forfeiture of equity incentive awards granted and adjust compensation expense accordingly. The estimate of forfeitures is adjusted over the estimated term to the extent that the actual forfeiture rate or expected forfeiture rate is expected to differ from these estimates. The resulting cost is recognized over the period during which the employee is required to provide services in exchange for the award, which is usually the vesting period. We recognize compensation expense over the vesting period using the straight-line method and classify these amounts in the statements of operations based on the department to which the related employee is assigned. For fiscal years 2016, 2015 and 2014, we recognized stock-based compensation of $34.9 million, $30.5 million and $16.0 million, respectively.
If any of the assumptions in the Black-Scholes option pricing model changes significantly, stock-based compensation for future awards may differ materially compared to awards granted previously.
We estimate our expected volatility and expected term based on trading history and exercise history, respectively. We derive the risk-free interest rate assumption using the published interest rate for a U.S. Treasury zero-coupon issue having a maturity similar to the expected term of the options. We base the assumed dividend yield on the expectation that we will not pay cash dividends in the foreseeable future.
We estimate forfeitures at the time of grant and revise, if necessary, in subsequent periods if actual forfeitures differ from those estimates. We utilized our historical forfeiture rates since inception to estimate our future forfeiture rate. We will continue to evaluate the appropriateness of estimating the forfeiture rate based on actual forfeiture experience, analysis of employee turnover behavior and other factors. Quarterly changes in the estimated forfeiture rate can have a significant effect on stock-based compensation expense as the cumulative effect of adjusting the rate for all stock compensation expense amortization is recognized in the period the forfeiture estimate is changed. If a revised forfeiture rate is higher than the previously estimated forfeiture rate, an adjustment is made that will result in a decrease to the stock-based compensation expense recognized in the consolidated financial statements. If a revised forfeiture rate is lower than the previously estimated forfeiture rate, an adjustment is made that will result in an increase to the stock-based compensation expense recognized in the consolidated financial statements.
54
Table of Contents
| Item 7A. | Quantitative and Qualitative Disclosures About Market Risk. |
Interest Rate Risk
We had cash, cash equivalents and investments of $284.9 million at April 3, 2016, which was held for liquidity purposes. We do not enter into investments for trading or speculative purposes. At April 3, 2016 and March 29, 2015, a 10% change in interest rates would not have a significant impact on our future interest income or investment fair value. As of April 3, 2016, our cash, cash equivalents and investments were in money market funds, corporate notes and bonds, commercial paper and U.S. agency securities. Since the interest rate on our $175 million Convertible Senior Notes is fixed, changes in interest rates will not impact our future interest expense.
Foreign Currency Risk
Our sales contracts are primarily denominated in U.S. dollars and therefore substantially all of our net revenue is not subject to foreign currency risk. However, a portion of our operating expenses are incurred outside the U.S., are denominated in foreign currencies and are subject to fluctuations due to changes in foreign currency exchange rates, particularly changes in the New Taiwan Dollar, Chinese Yuan and Korean Won. Additionally, fluctuations in foreign currency exchange rates may cause us to recognize transaction gains and losses in our statements of operations. We recognized no significant foreign currency transaction gains or losses for fiscal years 2016, 2015 and 2014 related to fluctuations in foreign currency exchange rates.
| Item | 8. Financial Statements and Supplementary Data. |
| Item 8. | Financial Statements and Supplementary Data. |
Our Consolidated Financial Statements and related Notes and schedules are incorporated by reference from Part IV, Item 15, below.
| Item 9. | Changes in and Disagreements with Accountants on Accounting and Financial Disclosure. |
None.
| Item 9A. | Controls and Procedures. |
Disclosure Controls and Procedures
As of the end of the period covered by this Annual Report on Form 10-K, our management conducted an evaluation, under the supervision and with the participation of our Chief Executive Officer and Chief Financial Officer, of the effectiveness of the design and operation of our disclosure controls and procedures, as such term is defined in Rule 13a-15(e) of the Securities Exchange Act of 1934 (the Exchange Act). Based upon that evaluation, our Chief Executive Officer and Chief Financial Officer concluded that our disclosure controls and procedures were effective as of the end of the period covered by this Annual Report on Form 10-K in ensuring that information required to be disclosed was recorded, processed, summarized and reported within the time periods specified in the SEC’s rules and forms, and to provide reasonable assurance that information required to be disclosed by us in such reports is accumulated and communicated to our management, including our Chief Executive Officer and Chief Financial Officer, as appropriate to allow timely decisions regarding required disclosure.
Management’s Report on Internal Control Over Financial Reporting
Our management is responsible for establishing and maintaining adequate internal control over financial reporting, as such term is defined in Rule 13a-15(f) of the Exchange Act. Under the supervision and with the participation of our Chief Executive Officer and Chief Financial Officer, our management conducted an
55
Table of Contents
evaluation of the effectiveness of our internal control over financial reporting based upon the framework in “Internal Control—Integrated Framework, 2013” issued by the Committee of Sponsoring Organizations of the Treadway Commission. Based on that evaluation, management concluded that our internal control over financial reporting was effective as of April 3, 2016.
Deloitte & Touche LLP, an independent registered public accounting firm, has audited the consolidated financial statements included in this Annual Report on Form 10-K and, as part of the audit, has issued a report, included herein, on the effectiveness of the Company’s internal control over financial reporting as of April 3, 2016.
Changes in Internal Control over Financial Reporting
There were no changes in our internal control over financial reporting during the quarter ended April 3, 2016 that have materially affected, or are reasonably likely to materially affect, our internal control over financial reporting.
Inherent Limitations of Internal Controls
Our management, including our Chief Executive Officer and Chief Financial Officer, does not expect that our disclosure controls and procedures or our internal controls will prevent or detect all errors and all fraud. A control system, no matter how well designed and operated, can provide only reasonable, not absolute, assurance that the objectives of the control system are met. Because of the inherent limitations in all control systems, no evaluation of controls can provide absolute assurance that all control issues and instances of fraud, if any, within the Company have been detected. These inherent limitations include the realities that judgments in decision-making can be faulty, and that breakdowns can occur because of a simple error or mistake. Additionally, controls can be circumvented by the individual acts of some persons, by collusion of two or more people, or by management override of the control. The design of any system of controls also is based in part upon certain assumptions about the likelihood of future events, and there can be no assurance that any design will succeed in achieving its stated goals under all potential future conditions. Over time, controls may become inadequate because of changes in conditions, or the degree of compliance with the policies or procedures may deteriorate. Because of the inherent limitations in a cost-effective control system, misstatements due to error or fraud may occur and not be detected.
56
Table of Contents
REPORT OF INDEPENDENT REGISTERED PUBLIC ACCOUNTING FIRM
To the Board of Directors and Stockholders of
InvenSense, Inc.
San Jose, California
We have audited the internal control over financial reporting of InvenSense, Inc. and subsidiaries (the “Company”) as of April 3, 2016, based on criteria established in Internal Control—Integrated Framework (2013) issued by the Committee of Sponsoring Organizations of the Treadway Commission. The Company’s management is responsible for maintaining effective internal control over financial reporting and for its assessment of the effectiveness of internal control over financial reporting, included in the accompanying Management’s Report on Internal Control over Financial Reporting. Our responsibility is to express an opinion on the Company’s internal control over financial reporting based on our audit.
We conducted our audit in accordance with the standards of the Public Company Accounting Oversight Board (United States). Those standards require that we plan and perform the audit to obtain reasonable assurance about whether effective internal control over financial reporting was maintained in all material respects. Our audit included obtaining an understanding of internal control over financial reporting, assessing the risk that a material weakness exists, testing and evaluating the design and operating effectiveness of internal control based on the assessed risk, and performing such other procedures as we considered necessary in the circumstances. We believe that our audit provides a reasonable basis for our opinion.
A company’s internal control over financial reporting is a process designed by, or under the supervision of, the company’s principal executive and principal financial officers, or persons performing similar functions, and effected by the company’s Board of Directors, management, and other personnel to provide reasonable assurance regarding the reliability of financial reporting and the preparation of financial statements for external purposes in accordance with generally accepted accounting principles. A company’s internal control over financial reporting includes those policies and procedures that (1) pertain to the maintenance of records that, in reasonable detail, accurately and fairly reflect the transactions and dispositions of the assets of the company; (2) provide reasonable assurance that transactions are recorded as necessary to permit preparation of financial statements in accordance with generally accepted accounting principles, and that receipts and expenditures of the company are being made only in accordance with authorizations of management and directors of the company; and (3) provide reasonable assurance regarding prevention or timely detection of unauthorized acquisition, use, or disposition of the company’s assets that could have a material effect on the financial statements.
Because of the inherent limitations of internal control over financial reporting, including the possibility of collusion or improper management override of controls, material misstatements due to error or fraud may not be prevented or detected on a timely basis. Also, projections of any evaluation of the effectiveness of the internal control over financial reporting to future periods are subject to the risk that the controls may become inadequate because of changes in conditions, or that the degree of compliance with the policies or procedures may deteriorate.
In our opinion, the Company maintained, in all material respects, effective internal control over financial reporting as of April 3, 2016, based on the criteria established in Internal Control—Integrated Framework (2013) issued by the Committee of Sponsoring Organizations of the Treadway Commission.
We have also audited, in accordance with the standards of the Public Company Accounting Oversight Board (United States), the consolidated financial statements as of and for the year ended April 3, 2016 of the Company and our report dated May 25, 2016 expressed an unqualified opinion on those consolidated financial statements.
/s/ DELOITTE & TOUCHE LLP
San Jose, California
May 25, 2016
57
Table of Contents
| Item 9B. | Other Information. |
None.
58
Table of Contents
PART III
We are incorporating by reference the information required by Part III of this Annual Report on Form 10-K from our proxy statement relating to our 2016 annual meeting of stockholders (the “Proxy Statement”), which will be filed with the SEC within 120 days after April 3, 2016.
| Item 10. | Directors, Executive Officers and Corporate Governance. |
The information required by this item with respect to directors is incorporated by reference from the information under the caption “Election of Directors” contained in our Proxy Statement.
| Item 11. | Executive Compensation. |
The information required by this item is incorporated by reference from the information under the captions “Election of Directors—Director Compensation” and “Executive Compensation” contained in the Proxy Statement.
| Item 12. | Security Ownership of Certain Beneficial Owners and Management and Related Stockholder Matters. |
The information required by this item is incorporated by reference from the information under the captions “Security Ownership of Certain Beneficial Owners and Management” and “Executive Compensation—Equity Compensation Plan Information” contained in the Proxy Statement.
| Item 13. | Certain Relationships and Related Transactions, and Director Independence. |
The information required by this item is incorporated by reference from the information under the caption “Election of Directors—Certain Relationships and Related Transactions” and “—Director Independence” contained in the Proxy Statement.
| Item 14. | Principal Accounting Fees and Services. |
The information required by this item is incorporated by reference from the information under the caption “Ratification of the Appointment of Independent Registered Public Accounting Firm—Principal Accountant Fees and Services” contained in the Proxy Statement.
59
Table of Contents
PART IV
| ITEM 15. | Exhibits, Financial Statement Schedules. |
| (a) | The following documents are filed as part of this Form: |
| 1. | Financial Statements |
| Page | ||||
| 61 | ||||
| 62 | ||||
| 63 | ||||
| 64 | ||||
| 65 | ||||
| 66 | ||||
| 67 | ||||
| 2. | Financial Statement Schedules |
Schedules are omitted because they are not applicable or the required information is shown in the Consolidated Financial Statements or related Notes thereto.
| 3. | Exhibits |
See Index to Exhibits at the end of this Report, which is incorporated herein by reference. The Exhibits listed in the accompanying Index to Exhibits are filed as part of this report.
60
Table of Contents
REPORT OF INDEPENDENT REGISTERED PUBLIC ACCOUNTING FIRM
To the Board of Directors and Stockholders of
InvenSense, Inc.
San Jose, California
We have audited the accompanying consolidated balance sheets of InvenSense, Inc. and subsidiaries (the “Company”) as of April 3, 2016 and March 29, 2015, and the related consolidated statements of operations, comprehensive income (loss), stockholders’ equity, and cash flows for each of the three years in the period ended April 3, 2016. These financial statements are the responsibility of the Company’s management. Our responsibility is to express an opinion on the consolidated financial statements based on our audits.
We conducted our audits in accordance with the standards of the Public Company Accounting Oversight Board (United States). Those standards require that we plan and perform the audit to obtain reasonable assurance about whether the financial statements are free of material misstatement. An audit includes examining, on a test basis, evidence supporting the amounts and disclosures in the financial statements. An audit also includes assessing the accounting principles used and significant estimates made by management, as well as evaluating the overall financial statement presentation. We believe that our audits provide a reasonable basis for our opinion.
In our opinion, such consolidated financial statements present fairly, in all material respects, the financial position of InvenSense, Inc. and subsidiaries at April 3, 2016 and March 29, 2015, and the results of their operations and their cash flows for each of the three years in the period ended April 3, 2016, in conformity with accounting principles generally accepted in the United States of America.
We have also audited, in accordance with the standards of the Public Company Accounting Oversight Board (United States), the Company’s internal control over financial reporting as of April 3, 2016, based on the criteria established in Internal Control-Integrated Framework (2013) issued by the Committee of Sponsoring Organizations of the Treadway Commission, and our report dated May 25, 2016, expressed an unqualified opinion on the Company’s internal control over financial reporting.
/s/ DELOITTE & TOUCHE LLP
San Jose, California
May 25, 2016
61
Table of Contents
InvenSense, Inc.
(In thousands, except par value)
| April 3, 2016 |
March 29, 2015 |
|||||||
| Assets |
| |||||||
| Current assets: |
||||||||
| Cash and cash equivalents |
$ | 41,105 | $ | 85,637 | ||||
| Short-term investments |
243,755 | 129,919 | ||||||
| Accounts receivable |
41,447 | 44,522 | ||||||
| Inventories |
62,297 | 75,105 | ||||||
| Prepaid expenses and other current assets |
9,250 | 14,950 | ||||||
|
|
|
|
|
|||||
| Total current assets |
397,854 | 350,133 | ||||||
| Property and equipment, net |
36,271 | 41,849 | ||||||
| Intangible assets, net |
43,169 | 45,508 | ||||||
| Goodwill |
139,175 | 139,175 | ||||||
| Other assets |
5,992 | 9,019 | ||||||
|
|
|
|
|
|||||
| Total assets |
$ | 622,461 | $ | 585,684 | ||||
|
|
|
|
|
|||||
| Liabilities and Stockholders’ Equity |
||||||||
| Current liabilities: |
||||||||
| Accounts payable |
$ | 35,200 | $ | 23,130 | ||||
| Accrued liabilities |
30,248 | 31,991 | ||||||
|
|
|
|
|
|||||
| Total current liabilities |
65,448 | 55,121 | ||||||
| Long-term debt |
151,038 | 142,810 | ||||||
| Other long-term liabilities |
27,230 | 28,252 | ||||||
|
|
|
|
|
|||||
| Total liabilities |
243,716 | 226,183 | ||||||
|
|
|
|
|
|||||
| Commitments and contingencies (Note 4) |
||||||||
| Stockholders’ equity: |
||||||||
| Preferred stock: |
||||||||
| Preferred stock, $0.001 par value—20,000 shares authorized, no shares issued and outstanding at April 3, 2016 and March 29, 2015 |
— | — | ||||||
| Common stock: |
||||||||
| Common stock, $0.001 par value—750,000 shares authorized, 93,010 shares issued and outstanding at April 3, 2016; 90,894 shares issued and outstanding at March 29, 2015 |
303,153 | 262,677 | ||||||
| Accumulated other comprehensive (loss) |
(26 | ) | (4 | ) | ||||
| Retained earnings |
75,618 | 96,828 | ||||||
|
|
|
|
|
|||||
| Total stockholders’ equity |
378,745 | 359,501 | ||||||
|
|
|
|
|
|||||
| Total liabilities and stockholders’ equity |
$ | 622,461 | $ | 585,684 | ||||
|
|
|
|
|
|||||
See accompanying notes to the consolidated financial statements.
62
Table of Contents
InvenSense, Inc.
Consolidated Statements of Operations
(In thousands, except per share data)
| Fiscal Years Ended | ||||||||||||
| April 3, 2016 |
March 29, 2015 |
March 30, 2014 |
||||||||||
| Net revenue |
$ | 418,395 | $ | 372,019 | $ | 252,533 | ||||||
| Costs of revenue |
244,257 | 216,160 | 127,724 | |||||||||
|
|
|
|
|
|
|
|||||||
| Gross profit |
174,138 | 155,859 | 124,809 | |||||||||
| Operating expenses: |
||||||||||||
| Research and development |
97,368 | 90,623 | 48,431 | |||||||||
| Selling, general and administrative |
62,165 | 59,386 | 51,344 | |||||||||
| Litigation settlement |
11,708 | — | 15,000 | |||||||||
|
|
|
|
|
|
|
|||||||
| Total operating expenses |
171,241 | 150,009 | 114,775 | |||||||||
|
|
|
|
|
|
|
|||||||
| Income from operations |
2,897 | 5,850 | 10,034 | |||||||||
| Interest (expense) |
(11,358 | ) | (10,553 | ) | (4,012 | ) | ||||||
| Other income, net |
392 | 1,368 | 167 | |||||||||
|
|
|
|
|
|
|
|||||||
| Income (loss) before income taxes |
(8,069 | ) | (3,335 | ) | 6,189 | |||||||
| Income tax provision (benefit) |
13,141 | (2,255 | ) | 70 | ||||||||
|
|
|
|
|
|
|
|||||||
| Net income (loss) |
$ | (21,210 | ) | $ | (1,080 | ) | $ | 6,119 | ||||
|
|
|
|
|
|
|
|||||||
| Net income (loss) per share of common stock: |
||||||||||||
| Basic |
$ | (0.23 | ) | $ | (0.01 | ) | $ | 0.07 | ||||
|
|
|
|
|
|
|
|||||||
| Diluted |
$ | (0.23 | ) | $ | (0.01 | ) | $ | 0.07 | ||||
|
|
|
|
|
|
|
|||||||
| Weighted average shares outstanding used in computing net income (loss) per share: |
||||||||||||
| Basic |
91,787 | 89,359 | 86,520 | |||||||||
|
|
|
|
|
|
|
|||||||
| Diluted |
91,787 | 89,359 | 89,928 | |||||||||
|
|
|
|
|
|
|
|||||||
See accompanying notes to the consolidated financial statements.
63
Table of Contents
InvenSense, Inc.
Consolidated Statements of Comprehensive Income (Loss)
(In thousands)
| Fiscal Years Ended | ||||||||||||
| April 3, 2016 |
March 29, 2015 |
March 30, 2014 |
||||||||||
| Net income (loss) |
$ | (21,210 | ) | $ | (1,080 | ) | $ | 6,119 | ||||
| Other comprehensive income (loss): |
||||||||||||
| Unrealized gain (loss) on available-for-sale securities, net of tax expense (benefit) of $0, $19 and $(48) in fiscal years 2016, 2015 and 2014, respectively |
(22 | ) | 34 | (88 | ) | |||||||
|
|
|
|
|
|
|
|||||||
| Comprehensive income (loss) |
$ | (21,232 | ) | $ | (1,046 | ) | $ | 6,031 | ||||
|
|
|
|
|
|
|
|||||||
See accompanying notes to the consolidated financial statements.
64
Table of Contents
InvenSense, Inc.
Consolidated Statements of Stockholders’ Equity
(In thousands, except per share amounts)
| Common Stock | Accumulated Other Comprehensive Income (Loss) |
Retained Earnings |
Total | |||||||||||||||||
| Shares | Amount | |||||||||||||||||||
| BALANCE—April 1, 2013 |
84,980 | 158,108 | 50 | 91,789 | 249,947 | |||||||||||||||
| Issuance of common stock from restricted stock and vesting of restricted stock units |
105 | — | — | — | — | |||||||||||||||
| Issuance of common stock from exercise of stock warrants |
90 | — | — | — | — | |||||||||||||||
| Equity component of the convertible notes issuance |
— | 39,280 | — | — | 39,280 | |||||||||||||||
| Equity component of the convertible notes issuance costs |
— | (1,995 | ) | — | — | (1,995 | ) | |||||||||||||
| Purchase of convertible note hedges |
— | (39,118 | ) | — | — | (39,118 | ) | |||||||||||||
| Issuance of common stock from exercise of stock options |
3,221 | 14,410 | — | — | 14,410 | |||||||||||||||
| Repurchase of restricted stock for tax withholding |
(64 | ) | (1,233 | ) | — | — | (1,233 | ) | ||||||||||||
| Excess tax benefit from stock-based compensation |
— | 4,839 | — | — | 4,839 | |||||||||||||||
| Stock compensation relating to stock options issued to employees |
— | 16,024 | — | — | 16,024 | |||||||||||||||
| Proceeds from sale of warrant |
— | 25,643 | — | — | 25,643 | |||||||||||||||
| Other comprehensive loss |
— | — | (88 | ) | — | (88 | ) | |||||||||||||
| Net income |
— | — | — | 6,119 | 6,119 | |||||||||||||||
|
|
|
|
|
|
|
|
|
|
|
|||||||||||
| BALANCE—March 30, 2014 |
88,332 | 215,958 | (38 | ) | 97,908 | 313,828 | ||||||||||||||
| Issuance of common stock from exercise of stock options |
1,421 | 9,233 | — | — | 9,233 | |||||||||||||||
| Issuance of common stock from restricted stock and vesting of restricted stock units |
784 | — | — | — | — | |||||||||||||||
| Issuance of common stock from Employee Stock Purchase Plan |
170 | 2,195 | — | — | 2,195 | |||||||||||||||
| Issuance of common stock from business acquisitions |
236 | 5,703 | — | — | 5,703 | |||||||||||||||
| Repurchase of restricted stock for tax withholding |
(49 | ) | (957 | ) | — | — | (957 | ) | ||||||||||||
| Excess tax benefit from stock-based compensation |
— | 41 | — | — | 41 | |||||||||||||||
| Stock compensation relating to stock options issued to employees |
— | 30,504 | — | — | 30,504 | |||||||||||||||
| Other comprehensive loss |
— | — | 34 | — | 34 | |||||||||||||||
| Net income |
— | — | (1,080 | ) | (1,080 | ) | ||||||||||||||
|
|
|
|
|
|
|
|
|
|
|
|||||||||||
| BALANCE—March 29, 2015 |
90,894 | $ | 262,677 | $ | (4 | ) | $ | 96,828 | $ | 359,501 | ||||||||||
| Issuance of common stock from exercise of stock options |
644 | 3,677 | — | — | 3,677 | |||||||||||||||
| Issuance of common stock from restricted stock and vesting of restricted stock units & awards |
1,292 | — | — | — | — | |||||||||||||||
| Issuance of common stock from Employee Stock Purchase Plan |
230 | 2,479 | — | — | 2,479 | |||||||||||||||
| Repurchase of restricted stock for tax withholding |
(50 | ) | (559 | ) | — | — | (559 | ) | ||||||||||||
| Stock compensation relating to stock options issued to employees |
— | 34,879 | — | — | 34,879 | |||||||||||||||
| Other comprehensive loss |
— | — | (22 | ) | — | (22 | ) | |||||||||||||
| Net income |
— | — | (21,210 | ) | (21,210 | ) | ||||||||||||||
|
|
|
|
|
|
|
|
|
|
|
|||||||||||
| BALANCE—April 3, 2016 |
93,010 | $ | 303,153 | $ | (26 | ) | $ | 75,618 | $ | 378,745 | ||||||||||
|
|
|
|
|
|
|
|
|
|
|
|||||||||||
See accompanying notes to the consolidated financial statements.
65
Table of Contents
InvenSense, Inc.
Consolidated Statements of Cash Flows
(In thousands)
| Fiscal Years Ended | ||||||||||||
| April 3, 2016 |
March 29, 2015 |
March 30, 2014 |
||||||||||
| Cash flows from operating activities: |
||||||||||||
| Net income (loss) |
$ | (21,210 | ) | $ | (1,080 | ) | $ | 6,119 | ||||
| Adjustments to reconcile net income (loss) to net cash provided by operating activities: |
||||||||||||
| Depreciation |
12,769 | 10,203 | 4,492 | |||||||||
| Non-cash interest expense |
8,228 | 7,505 | 2,854 | |||||||||
| Amortization of intangible assets |
9,088 | 7,003 | 2,073 | |||||||||
| Write-off of in-process research and development |
— | 770 | — | |||||||||
| Loss on disposal of property and equipment |
— | 552 | — | |||||||||
| Loss (gain) on other investment |
525 | (890 | ) | — | ||||||||
| Stock-based compensation expense |
34,879 | 30,504 | 16,024 | |||||||||
| Contingent consideration adjustment |
(5,307 | ) | — | — | ||||||||
| Deferred income tax assets |
10,424 | (5,484 | ) | (2,337 | ) | |||||||
| Tax effect of employee benefit plan |
— | 42 | 4,839 | |||||||||
| Excess tax benefit from stock-based compensation |
— | (42 | ) | (4,839 | ) | |||||||
| Changes in operating assets and liabilities, net of effects of acquisitions: |
||||||||||||
| Accounts receivable |
3,075 | (4,895 | ) | (8,911 | ) | |||||||
| Inventories |
12,808 | (2,072 | ) | (44,164 | ) | |||||||
| Prepaid expenses and other assets |
1,607 | 8,778 | (2,699 | ) | ||||||||
| Other assets |
(2,279 | ) | (135 | ) | (1,013 | ) | ||||||
| Accounts payable |
12,639 | 3,122 | 4,474 | |||||||||
| Accrued liabilities |
5,792 | 12,961 | 11,790 | |||||||||
|
|
|
|
|
|
|
|||||||
| Net cash provided by (used in) operating activities |
83,038 | 66,842 | (11,298 | ) | ||||||||
|
|
|
|
|
|
|
|||||||
| Cash flows from investing activities: |
||||||||||||
| Acquisitions, net of cash acquired |
(6,700 | ) | (71,326 | ) | (99,324 | ) | ||||||
| Purchase of property and equipment |
(7,771 | ) | (27,315 | ) | (17,207 | ) | ||||||
| Purchase of patents |
— | (2,120 | ) | — | ||||||||
| Other non-marketable investments |
(850 | ) | — | — | ||||||||
| Sales and maturities of available-for-sale investments |
169,988 | 145,974 | 86,233 | |||||||||
| Purchase of available-for-sale investments |
(284,534 | ) | (55,845 | ) | (206,949 | ) | ||||||
|
|
|
|
|
|
|
|||||||
| Net cash used in investing activities |
(129,867 | ) | (10,632 | ) | (237,247 | ) | ||||||
|
|
|
|
|
|
|
|||||||
| Cash flows from financing activities: |
||||||||||||
| Proceeds from debt issuance, net of issuance costs |
— | — | 169,259 | |||||||||
| Payment for purchase of convertible notes hedge |
— | — | (39,118 | ) | ||||||||
| Proceeds from sale of warrants |
— | — | 25,643 | |||||||||
| Proceeds from the issuance of common stock, net |
5,586 | 10,425 | 13,115 | |||||||||
| Payments of long-term debt and capital lease obligations |
— | (9 | ) | (11 | ) | |||||||
| Payment of contingent consideration |
(1,909 | ) | (7,056 | ) | — | |||||||
| Payment of acquisition holdback |
(1,380 | ) | — | — | ||||||||
| Excess tax benefit from stock-based compensation |
— | 42 | 4,839 | |||||||||
|
|
|
|
|
|
|
|||||||
| Net cash provided by financing activities |
2,297 | 3,402 | 173,727 | |||||||||
|
|
|
|
|
|
|
|||||||
| Net increase (decrease) in cash and cash equivalents |
(44,532 | ) | 59,612 | (74,818 | ) | |||||||
| Cash and cash equivalents: |
||||||||||||
| Beginning of period |
85,637 | 26,025 | 100,843 | |||||||||
|
|
|
|
|
|
|
|||||||
| End of period |
$ | 41,105 | $ | 85,637 | $ | 26,025 | ||||||
|
|
|
|
|
|
|
|||||||
| Supplemental disclosures of cash flow information: |
||||||||||||
| Cash paid for interest |
$ | 3,063 | $ | 2,960 | $ | — | ||||||
|
|
|
|
|
|
|
|||||||
| Cash paid (received) for income taxes |
$ | 670 | $ | (5,855 | ) | $ | 183 | |||||
|
|
|
|
|
|
|
|||||||
| Noncash investing and financing activities: |
||||||||||||
| Unpaid purchases of property and equipment |
$ | 490 | $ | 1,070 | $ | 1,770 | ||||||
|
|
|
|
|
|
|
|||||||
| Total contingent consideration from business acquisition |
$ | — | $ | 16,034 | $ | — | ||||||
|
|
|
|
|
|
|
|||||||
See accompanying notes to the consolidated financial statements.
66
Table of Contents
InvenSense, Inc.
Notes to Consolidated Financial Statements
| 1. | Organization and summary of significant accounting policies |
Business
InvenSense, Inc. (the “Company”) was incorporated in California in June 2003 and reincorporated in Delaware in January 2004. The Company designs, develops, markets and sells sensor systems on a chip, including accelerometers, gyroscopes and microphones for the mobile, wearable, smart home, gaming, industrial, and automotive market segments. The Company delivers leading solutions based on its advanced motion and sound technology and is dedicated to bringing the best-in-class size, performance and cost solutions to market; targeting solutions such as: smartphones, tablets, wearables, console and portable video gaming devices, digital television and set-top box remote controls, fitness accessories, sports equipment, digital still cameras, automobiles, ultra-books, laptops, hearing aids, stabilization systems, tools, navigation devices, remote controlled toys and other household consumer and industrial devices.
Basis of consolidation
The consolidated financial statements have been prepared in conformity with U.S. generally accepted accounting principles, or GAAP, and include the Company’s accounts and the accounts of its wholly-owned subsidiaries. All intercompany accounts and transactions have been eliminated in consolidation. The functional currency of each of the Company’s subsidiaries is the U.S. dollar. Foreign currency gains or losses are recorded as other income (expense), net, in the consolidated statements of operations. During the fiscal years ended April 3, 2016, March 29, 2015 and March 30, 2014, foreign currency losses were $847,000, $198,000 and $260,000, respectively.
Fiscal year
The Company’s fiscal year is a 52 or 53 week period ending on the Sunday closest to March 31. Fiscal year 2016 was a 53-week fiscal year ended April 3, 2016 (“Fiscal year 2016”). The extra week was included in our fourth fiscal quarter ended April 3, 2016. The Company’s fiscal years 2015 and 2014 ended on March 29, 2015 (“fiscal year 2015”) and March 30, 2014 (“fiscal year 2014”) were each comprised of 52 weeks.
Use of estimates
The preparation of the Company’s Consolidated Financial Statements and related Notes in conformity with accounting principles generally accepted in the United States of America (U.S. GAAP) requires management to make estimates and assumptions that affect the reported amounts of assets and liabilities and disclosure of contingent assets and liabilities at the date of the Consolidated Financial Statements and related Notes and the reported amounts of income and expenses during the reporting period. Significant estimates included in the Consolidated Financial Statements and related Notes include income taxes, inventory valuation, stock-based compensation, loss contingencies, warranty reserves, valuation of acquired assets, and valuation of convertible senior notes, including the related convertible notes hedges and warrants. These estimates are based upon information available as of the date of the consolidated financial statements, and actual results could differ from those estimates.
Cash equivalents
The Company considers all highly liquid instruments acquired with a remaining maturity of three months or less when purchased to be cash equivalents. Cash and cash equivalents are stated at cost, which approximates their fair value.
67
Table of Contents
InvenSense, Inc.
Notes to Consolidated Financial Statements—(Continued)
Available-for-sale investments
Securities with remaining maturities at the time of purchase of greater than three months are considered available for sale investments. If the securities have remaining maturities of less than twelve months from the balance sheet date they are classified as short-term investments in the Company’s consolidated balance sheets; if their maturities exceed twelve months beyond the balance sheet date, they are classified as long-term investments in the Company’s consolidated balance sheets. Available-for-sale securities are carried at fair value with temporary unrealized gains and losses, net of taxes, reported within “accumulated other comprehensive income (loss)” in the Company’s consolidated financial statements.
Available-for-sale investments are considered to be impaired when a decline in fair value is judged to be other than temporary. The Company considers available quantitative and qualitative evidence in evaluating potential impairment of its investments on a quarterly basis. If the cost of an investment exceeds its fair value, management evaluates, among other factors, general market conditions, the duration and extent to which the fair value is less than cost, and the Company’s intent and ability to hold the investment. Once a decline in fair value is determined to be other than temporary, an impairment charge is recorded and a new cost basis in the investment is established. During fiscal years 2016, 2015 and 2014, the Company did not identify any other than temporary impairments.
Accounts receivable
Trade accounts receivable are recorded at the invoiced amount, net of allowances for doubtful accounts and sales returns and allowances. The allowance for doubtful accounts is based on the Company’s assessment of the collectability of customer accounts. The Company periodically reviews the need for an allowance by considering factors such as historical experience, credit quality, the age of the accounts receivable balances and current economic conditions that may affect a customer’s ability to pay. No allowance for doubtful accounts was recorded during the years ended April 3, 2016 and March 29, 2015. The Company recorded bad debt expense of $26,000 during the year ended March 29, 2015. The reserve for sales returns and allowances is based on specific criteria including agreements to provide rebates and other factors known at the time, as well as estimates of the amount of goods shipped that will be returned. To determine the adequacy of the reserve for sales returns and allowances, the Company analyzes historical experience of actual returns as well as current product return information. During fiscal years 2016, 2015 and 2014, the Company incurred charges related to its reserve for sales returns and allowances of $702,000, $357,000 and $134,000, respectively. At April 3, 2016 and March 29, 2015, the balances for the reserve for sales returns and allowances were $172,000, and $57,000, respectively.
Concentration of credit risk
Financial instruments, which potentially subject the Company to concentrations of credit risk, consist primarily of cash, cash equivalents, investments, advances to vendors, accounts receivable and the Note Hedge (see Note 5). The Company limits exposure to credit loss by placing cash, cash equivalents and investments with major financial institutions within the United States that management assesses to be of high credit quality. The Company periodically reviews the credit worthiness of its customers and generally does not require collateral or other security to support accounts receivable. The Company has not experienced any significant losses on accounts receivables or on deposits of cash and cash equivalents for fiscal years 2016, 2015 or 2014.
The majority of the Company’s products are shipped to distributors, original design manufacturers and contract manufacturers (collectively referred to as “intermediaries”), who are the legal counter-parties to the Company’s sales. When the Company references customers, sales and revenue in this report, the Company is referring to the manufacturers of consumer electronics devices who are the end customers for our products.
68
Table of Contents
InvenSense, Inc.
Notes to Consolidated Financial Statements—(Continued)
However, any disclosure about the composition of the Company’s accounts receivable refers to the intermediaries. Some of the Company’s intermediaries may serve more than one of the Company’s customers. As a result, attempting to compare or correlate disclosures about the Company’s accounts receivable composition as of a particular date with the disclosures regarding revenues generated by the Company’s customers for the period ending on the same date can be difficult or misleading.
One distributor accounted for 48% of accounts receivable and another distributor accounted for 11% of accounts receivable at April 3, 2016. A distributor and a customer accounted for 38% and 26% of accounts receivable, respectively, at March 29, 2015. No other customers accounted for more than 10% of total accounts receivable at April 3, 2016 and March 29, 2015.
For fiscal year 2016, Apple accounted for 40% of net revenue and Samsung accounted for 16% of net revenue. For fiscal year 2015, Apple accounted for 30% of net revenue and Samsung accounted for 28% of net revenue. For fiscal year 2014 Samsung accounted for 35% of total net revenue. No other customers accounted for more than 10% of total net revenue for fiscal years 2016, 2015 or 2014.
Inventories
Inventories are stated at the lower of cost or market on a first-in, first-out basis. Inventories include finished good parts that may be specialized in nature and subject to obsolescence. The Company periodically reviews the quantities and carrying values of inventories to assess whether the inventories are recoverable. The costs associated with write-downs of inventory for excess quantity and technological obsolescence are charged to cost of revenue as incurred. Actual demand may materially differ from the Company’s projected demand, and this difference could have a material impact on the Company’s gross margin and inventory balances based on additional provisions for excess or obsolete inventory or a benefit from sales of inventory previously written down. Write-downs in fiscal years 2016 and 2015 were $4.4 million and $8.6 million, respectively. Write-downs in fiscal year 2014 were insignificant.
Property and equipment, net
Property and equipment, net are stated at cost and are depreciated using the straight-line method over the estimated useful lives of the assets. The estimated useful lives are as follows: production equipment and furniture and fixtures—four to five years, lab equipment, computer equipment and software—three to five years, and leasehold improvements—over the shorter of the estimated useful life or the remaining lease term.
Business combinations
The purchase price of an acquisition is allocated to the underlying assets acquired and liabilities assumed based upon their estimated fair values at the date of acquisition. To the extent the purchase price exceeds the fair value of the net identifiable tangible and intangible assets acquired and liabilities assumed, such excess is allocated to goodwill. The Company determines the estimated fair values after review and consideration of relevant information, including discounted cash flows, quoted market prices and estimates made by management. The Company adjusts the preliminary purchase price allocation, as necessary, during the measurement period of up to one year after the acquisition closing date as it obtains more information as to facts and circumstances existing at the acquisition date impacting asset valuations and liabilities assumed. Acquisition-related costs are recognized separately from the acquisition and are expensed as incurred.
69
Table of Contents
InvenSense, Inc.
Notes to Consolidated Financial Statements—(Continued)
Goodwill
Goodwill represents the excess of the purchase price over the fair value of the net tangible and identifiable intangible assets acquired in a business combination. In accordance with Accounting Standard Codification (“ASC”) 350, the Company reviews goodwill for impairment at the reporting unit level on an annual basis or whenever events or changes in circumstances indicate the carrying value may not be recoverable. As the Company uses the market approach to assess impairment, its common stock price is an important component of the fair value calculation. The Company has determined that it has a single reporting unit for purposes of performing its goodwill impairment test. The Company monitors the recoverability of goodwill recorded in connection with acquisitions annually, or whenever events or changes in circumstances indicate the carrying value may not be recoverable. There were no changes in the carrying amount of goodwill since March 29, 2015. The Company performs the annual goodwill impairment analysis as of the first day of the third quarter of each fiscal year. As of April 3, 2016, no events or changes in circumstances indicate the carrying value may not be recoverable.
Intangible assets
Intangible assets consist of developed technology and customer relationships, and in-process research and development resulting from the Company’s acquisitions. Acquired intangible assets that are subject to amortization are developed technology and customer relationships and are recorded at cost, net of accumulated amortization. Intangible assets are amortized on a straight-line basis over their estimated useful lives. In-process research and development capitalized during business combination is amortized only after successful completion of project, over the expected useful life.
Impairment of long lived assets
The Company regularly reviews the carrying amount of its long-lived assets, including property and equipment and intangible assets, as well as the useful lives, to determine whether indicators of impairment may exist which warrant adjustments to carrying values or estimated useful lives. An impairment loss would be recognized when the sum of the expected future undiscounted net cash flows is less than the carrying amount of the asset. Should impairment exist, the impairment loss would be measured based on the excess of the carrying amount of the asset over the asset’s fair value.
Warranty
The Company offers one year standard warranty on its products. In selective cases, the warranty period could be extended to multiple years. The Company’s accrual for anticipated warranty costs has increased primarily due to an increase in unit sales volume and a commensurate increase in the volume of product returned under the warranty agreements. The accrual also includes management’s judgment regarding anticipated rates of warranty claims and associated repair costs. The following table summarizes the activity related to product warranty liability during fiscal years 2016, 2015 and 2014:
| Fiscal Year | ||||||||||||
| 2016 | 2015 | 2014 | ||||||||||
| (in thousands) | ||||||||||||
| Beginning balance |
$ | 341 | $ | 80 | $ | 123 | ||||||
| Provision for warranty |
568 | 221 | 59 | |||||||||
| Adjustments related to changes in estimates |
(78 | ) | 193 | (71 | ) | |||||||
| Less: Actual warranty costs incurred |
(206 | ) | (153 | ) | (31 | ) | ||||||
|
|
|
|
|
|
|
|||||||
| Ending balance |
$ | 625 | $ | 341 | $ | 80 | ||||||
|
|
|
|
|
|
|
|||||||
70
Table of Contents
InvenSense, Inc.
Notes to Consolidated Financial Statements—(Continued)
Revenue recognition
Revenue from the sale of the Company’s products is recognized when all of the following four criteria are met: (1) persuasive evidence of an arrangement exists; (2) the product has been delivered; (3) the price is fixed or determinable; and (4) collection is reasonably assured. Delivery takes place after the transfer of title which historically has occurred upon shipment of the product unless otherwise stated in the customer agreement.
For direct customers (i.e., other than distributors), the Company recognizes revenue when title to the product is transferred to the customer, which occurs upon shipment or delivery, depending upon the terms of the customer order.
The Company primarily enters into sales transactions with distributors in which the distributor is purchasing product for an identified end customer. For these transactions, the Company recognizes net revenue upon either shipment or delivery to the distributor, depending upon when title transfers under the terms of the order. Pursuant to the terms and conditions contained in the agreement with these distributors, all sales to these distributors purchased for an identified end customer are non-refundable, do not have rights to return product purchases except under the Company’s standard warranty terms.
Research and development
Research and development activities are expensed as incurred.
Stock-based compensation
The Company measures the cost of employee services received in exchange for equity incentive awards, including stock options, based on the grant date fair value of the award. The fair value is estimated using the Black-Scholes option pricing model. The Black-Scholes model requires the Company to estimate certain key assumptions including future stock price volatility, expected term of the options, risk free rates, and dividend yields. Certain of the Company’s stock-based awards contained a market-based condition for vesting; these awards were valued using a Monte Carlo simulation analysis to model and value multiple possible outcomes. The Company also estimates potential forfeiture of equity incentive awards granted and adjust compensation expense accordingly. The estimate of forfeitures is adjusted over the estimated term to the extent that the actual forfeiture rate or expected forfeiture rate is expected to differ from these estimates. The resulting cost is recognized over the period during which the employee is required to provide services in exchange for the award, which is usually the vesting period. The Company recognizes compensation expense over the vesting period using the straight-line method and classifies these amounts in the statements of operations based on the department to which the related employee is assigned. See Note 6 “Stockholders’ Equity” for a description of our stock-based employee compensation plans and the assumptions the Company uses to calculate the fair value of stock-based employee compensation.
Income taxes
The Company accounts for income taxes in accordance with ASC 740-10 “Income Taxes,” which requires the asset and liability approach and the recognition of taxes payable or receivable for the current year and deferred tax liabilities and assets for future tax consequences of events that have been recognized in the Company’s Consolidated Financial Statements and related Notes or tax returns. The measurement of current and deferred tax liabilities and assets are based on provisions of the enacted laws; the effects of future changes in tax laws or rates are not anticipated. Deferred tax assets are reduced, if necessary, by the amount of any tax benefits that, based on available evidence, are not expected to be realized. Valuation allowances are established when
71
Table of Contents
InvenSense, Inc.
Notes to Consolidated Financial Statements—(Continued)
necessary to reduce deferred tax assets to the amount that is more likely than not to be realized. The Company believes that uncertainty exists regarding the realizability of certain deferred income tax assets and, accordingly, has established a valuation allowance for those deferred income tax assets to the extent the realizability is not deemed to be more likely than not. Deferred income tax assets and liabilities are measured using enacted tax rates.
ASC 740-10 also prescribes a recognition threshold and measurement attribute for the financial statement recognition and measurement of a tax position taken or expected to be taken in a tax return. ASC 740-10 also provides guidance on de-recognition, classification, interest and penalties, accounting in interim periods, disclosure and transition. The Company’s policy is to recognize interest and penalties related to unrecognized tax benefits in income tax provision.
Net income (loss) per share
Basic net income (loss) per share is computed by dividing net income (loss) by the weighted average number of shares outstanding during the period, which excludes dilutive unvested restricted stock. Diluted net income (loss) per share is computed by dividing net income (loss) by the weighted average number of shares outstanding, including unvested restricted stock, certain warrants to purchase common stock and potential dilutive shares from the dilutive effect of outstanding stock options using the treasury stock method. In periods in which the Company has reported a net loss, the common stock equivalents are excluded from the calculation of diluted net loss per share of common stock as their effect is antidilutive under the treasury stock method.
The following table presents the calculation of basic and diluted net income (loss) per share:
| Fiscal Year | ||||||||||||
| 2016 | 2015 | 2014 | ||||||||||
| (in thousands, except per share data) | ||||||||||||
| Numerator: |
||||||||||||
| Basic and diluted |
||||||||||||
| Net income (loss) |
$ | (21,210 | ) | $ | (1,080 | ) | $ | 6,119 | ||||
|
|
|
|
|
|
|
|||||||
| Denominator: |
||||||||||||
| Basic shares: |
||||||||||||
| Weighted-average shares used in computing basic net income (loss) per share |
91,787 | 89,359 | 86,520 | |||||||||
|
|
|
|
|
|
|
|||||||
| Diluted shares: |
||||||||||||
| Weighted-average shares used in computing basic net income (loss) per share |
91,787 | 89,359 | 86,520 | |||||||||
| Effect of potentially dilutive securities: |
||||||||||||
| Stock options and unvested restricted stock |
— | — | 3,367 | |||||||||
| Common stock warrants |
— | — | 41 | |||||||||
|
|
|
|
|
|
|
|||||||
| Weighted-average shares used in computing diluted net income (loss) per share |
91,787 | 89,359 | 89,928 | |||||||||
|
|
|
|
|
|
|
|||||||
| Net income (loss) per share |
||||||||||||
| Basic |
$ | (0.23 | ) | $ | (0.01 | ) | $ | 0.07 | ||||
| Diluted |
$ | (0.23 | ) | $ | (0.01 | ) | $ | 0.07 | ||||
72
Table of Contents
InvenSense, Inc.
Notes to Consolidated Financial Statements—(Continued)
The following summarizes the potentially dilutive securities outstanding at the end of each period that were excluded from the computation of diluted net income per common share for the periods presented as their effect would have been antidilutive:
| Fiscal Year | ||||||||||||
| 2016 | 2015 | 2014 | ||||||||||
| (in thousands) | ||||||||||||
| Employee stock options |
9,209 | 8,562 | 1,992 | |||||||||
| Unvested restricted stock units |
4,310 | 3,699 | 1,338 | |||||||||
|
|
|
|
|
|
|
|||||||
| Total antidilutive securities |
13,519 | 12,261 | 3,330 | |||||||||
|
|
|
|
|
|
|
|||||||
In November 2013, the Company issued $175.0 million aggregate principal amount of 1.75% Convertible Senior Notes due on November 1, 2018 (the “Notes”). On or after August 1, 2018 until the maturity date, the Notes may be converted at the option of the holders under certain circumstances. The conversion rate is initially 45.683 shares per $1,000 principal amount of the Notes (equivalent to an initial conversion price of approximately $21.89 per share of common stock), subject to certain adjustments (see Note 5).
Comprehensive income (loss)
Comprehensive income (loss) includes certain changes in equity that are excluded from net income. Specifically, unrealized gains and losses are included in accumulated other comprehensive income (loss). During fiscal years 2016, 2015 and 2014, comprehensive income (loss) included a combination of the current period net income and unrealized gain (loss) on available for sale investments.
Segment information
The Company operates in one operating segment by designing, developing, manufacturing and marketing sensor systems on a chip. The Chief Executive Officer has been identified as the Chief Operating Decision Maker as defined by Financial Accounting Standards Board’s ASC 280 “Segment Reporting”. Enterprise-wide information is provided in accordance with ASC 280. Geographical revenue information is based on the location of our customers’ head offices. Property and equipment information is based on the physical location of the assets at the end of each fiscal period.
Property and equipment by country were as follows:
| Country |
April 3, 2016 |
March 29, 2015 |
||||||
| (in thousands) | ||||||||
| Taiwan |
$ | 25,183 | $ | 31,334 | ||||
| United States |
9,207 | 9,442 | ||||||
| Other |
1,881 | 1,073 | ||||||
|
|
|
|
|
|||||
| $ | 36,271 | $ | 41,849 | |||||
|
|
|
|
|
|||||
73
Table of Contents
InvenSense, Inc.
Notes to Consolidated Financial Statements—(Continued)
Net revenue from unaffiliated customers by location of our customers’ headquarters was as follows:
| Fiscal Year | ||||||||||||
| Region |
2016 | 2015 | 2014 | |||||||||
| (in thousands) | ||||||||||||
| United States |
$ | 182,590 | $ | 129,665 | $ | 24,681 | ||||||
| China |
102,324 | 65,115 | 43,796 | |||||||||
| Korea |
81,211 | 130,807 | 112,880 | |||||||||
| Japan |
22,086 | 18,788 | 45,493 | |||||||||
| Taiwan |
20,365 | 21,264 | 18,737 | |||||||||
| Rest of world |
9,819 | 6,380 | 6,946 | |||||||||
|
|
|
|
|
|
|
|||||||
| $ | 418,395 | $ | 372,019 | $ | 252,533 | |||||||
|
|
|
|
|
|
|
|||||||
Over 90% of sales to U.S. headquartered companies are sold to their distributors or contract manufacturers located overseas.
Recent accounting pronouncements
On March 30, 2016, the Financial Accounting Standards Board (“FASB”) issued Accounting Standards Update (ASU) 2016-09, Improvements to Employee Share-Based Payment Accounting, which amends ASC Topic 718, Compensation—Stock Compensation. The new guidance simplifies several aspects of the accounting for employee share-based payment transactions for both public and nonpublic entities, including the accounting for income taxes, forfeitures, and statutory tax withholding requirements, as well as classification in the statement of cash flows. The new guidance is effective for public business entities for annual reporting periods beginning after December 15, 2016, and interim periods within that reporting period. The Company is currently evaluating the impact on its consolidated financial statements.
On February 25, 2016, the FASB issued a new standard, Leases, Accounting Standards Codification (“ASC”) 842. Lessees will need to recognize all lease arrangements with terms longer than 12 months on their balance sheet as a right-of-use asset and a lease liability. For income statement purposes, the FASB retained a dual model, requiring leases to be classified as either operating or finance. Lessor accounting is similar to the current model. Existing sale-leaseback guidance, including guidance for real estate, is replaced with a new model applicable to both lessees and lessors. The new guidance is effective for public business entities in fiscal years beginning after December 15, 2018. While management is evaluating the comprehensive impact of this guidance, this new guidance would require us to capitalize, at the appropriate discount rate, our operating lease commitments as disclosed in Note 4—Commitments and Contingencies.
On January 5, 2016, the FASB published Accounting Standards Update (“ASU”) 2016-01, Recognition and Measurement of Financial Assets and Financial Liabilities. The new guidance requires the fair value measurement of investments in equity securities and other ownership interests in an entity that do not result in consolidation and are not accounted for under the equity method. Entities will have to measure these investments at the end of each reporting period and recognize changes in fair value in net income. Entities will no longer be able to recognize unrealized holding gains and losses on equity securities they classify today as available for sale in Other Comprehensive Income (“OCI”). They also will no longer be able to use the cost method of accounting for equity securities that do not have readily determinable fair values. The guidance doesn’t apply to certain industries. The amendments are effective for public business entities for fiscal years, and interim periods within those fiscal years, beginning after December 15, 2017. The Company is currently evaluating the impact on its consolidated financial statements.
74
Table of Contents
InvenSense, Inc.
Notes to Consolidated Financial Statements—(Continued)
On November 20, 2015, the FASB issued ASU 2015-17. The new guidance requires that all deferred tax assets and liabilities, along with any related valuation allowance for each tax-paying jurisdiction within each tax-paying component, be classified as noncurrent on the balance sheet. The new guidance will be effective for public business entities in fiscal years beginning after December 15, 2016, including interim periods within those years. Early adoption is permitted for all entities as of the beginning of an interim or annual reporting period. The Company is currently evaluating the impact on its consolidated financial statements.
On September 25, 2015, the FASB issued ASU 2015-16, the new guidance eliminates the requirement that an acquirer in a business combination account for measurement-period adjustments retrospectively. An acquirer will recognize a measurement-period adjustment during the period in which it determines the amount of the adjustment. The guidance is effective for public business entities for fiscal years beginning after December 15, 2015, and interim periods within those fiscal years. The Company does not expect this guidance to have significant impact on its consolidated financial statements.
On August 18, 2015, the FASB issued ASU No. 2015-15, the ASU states that the Securities and Exchange Commission (“SEC”) staff would not object to an entity deferring and presenting debt issuance costs as an asset and subsequently amortizing deferred debt issuance costs ratably over the term of the line-of-credit arrangement, regardless of whether there are outstanding borrowings under that line-of-credit arrangement. For public business entities, ASU 2015-15 is effective concurrent with adoption of ASU No. 2015-03 which is effective for financial statements issued for fiscal years beginning after December 15, 2015, and interim periods within those fiscal years. The FASB issued ASU 2015-03, Simplifying the Presentation of Debt Issuance Costs on April 7, 2015. ASU 2015-03 requires debt issuance costs to be presented in the balance sheet as a direct deduction from the carrying value of the associated debt liability, consistent with the presentation of a debt discount. The Company does not expect this guidance to have significant impact on its consolidated financial statements.
On July 22, 2015, the FASB issued ASU 2015-11, the FASB issued final guidance that simplifies the subsequent measurement of inventories by replacing today’s lower of cost or market test with a lower of cost and net realizable value test. The guidance applies only to inventories for which cost is determined by methods other than last-in first-out and the retail inventory method. Entities that use last-in, first-out or retail inventory method will continue to use existing impairment models. The guidance is effective for public business entities for fiscal years beginning after December 15, 2016, and interim periods within those fiscal years. The Company does not expect this guidance to have significant impact on its consolidated financial statements.
On April 7, 2015, the FASB issued ASU 2015-03, Simplifying the Presentation of Debt Issuance Costs. ASU 2015-03 requires debt issuance costs to be presented in the balance sheet as a direct deduction from the carrying value of the associated debt liability, consistent with the presentation of a debt discount. For public business entities, the standard is effective for financial statements issued for fiscal years beginning after December 15, 2015, and interim periods within those fiscal years. Early adoption is permitted for financial statements that have not been previously issued. The Company has implemented the standard for the first quarter of fiscal year 2016; see Note 5, Convertible Senior Notes.
In May 2014, the FASB issued Accounting Standards Update (“ASU”) No. 2014-09, Revenue from Contracts with Customers (Topic 606). ASU No. 2014-09 provides guidance that companies will recognize revenue to depict the transfer of goods or services to customers in amounts that reflect the payment to which a company expects to be entitled in exchange for those goods or services. The standard requires public entities to apply the amendments in ASU 2014-09 for annual reporting periods beginning after December 15, 2016, including interim reporting periods therein. On April 1, 2015, the FASB proposed for a one-year deferral of the effective date for this pronouncement. The Company then will be required to implement the new revenue recognition standard for the first quarter of fiscal year 2019. The Company is currently evaluating the impact on its consolidated financial statements.
75
Table of Contents
InvenSense, Inc.
Notes to Consolidated Financial Statements—(Continued)
| 2. | Cash equivalents and available-for-sale investments |
At April 3, 2016, cash and cash equivalents totaled $41.1 million, of which $25.4 million was cash and $15.7 million was cash equivalents invested in money market funds. At April 3, 2016, $21.0 million of the cash and cash equivalents were held by our foreign subsidiaries. Additionally, as of April 3, 2016, the Company had short-term available-for-sale investments of $243.8 million.
At March 29, 2015, of the $85.6 million of the Company’s cash and cash equivalents, $61.6 million was cash, $24.0 million was cash equivalents, of which $22.0 million was invested in money market funds and $2.0 million was invested in corporate debt. At March 29, 2015, $47.7 million of the $85.6 million of cash and cash equivalents were held by our foreign subsidiaries. Additionally, as of March 29, 2015, the Company had short-term available-for-sale investments of $129.9 million which is held in the US entity.
The Company applies the provisions of ASC 820-10, “Fair Value Measurements”. Fair value is defined as the price that would be received to sell an asset or paid to transfer a liability (i.e., the “exit price”) in an orderly transaction between market participants at the measurement date. As such, fair value is a market-based measurement that should be determined based on assumptions that market participants would use in pricing an asset or liability. ASC 820-10 requires disclosure that establishes a framework for measuring fair value and expands disclosure about fair value measurements. The standard describes a fair value hierarchy based on three levels of inputs that may be used to measure fair value. The inputs for the first two levels are considered observable and the last is unobservable and include the following:
Level 1—Unadjusted quoted prices in active markets that are accessible at the measurement date for identical, unrestricted assets or liabilities;
Level 2—Quoted prices in markets that are not active, or inputs which are observable, either directly or indirectly, for substantially the full term of the asset or liability; or
Level 3—Unobservable inputs in which there is little or no market data, and as a result, prices or valuation techniques are employed that require inputs that are significant to the fair value measurement.
This hierarchy requires the Company to use observable market data, when available, and to minimize the use of unobservable inputs when determining fair value. On a recurring basis, the Company measures certain financial assets and liabilities at fair value. The fair values of the Company’s money market funds were derived from quoted market prices as active markets for these instruments exist. The Company chose not to elect the fair value option as prescribed by ASC 825-10-05 “Fair Value Option” for its financial assets and liabilities that had not been previously carried at fair value. Therefore, financial assets and liabilities not carried at fair value, such as accounts payable, are reported at their carrying values.
76
Table of Contents
InvenSense, Inc.
Notes to Consolidated Financial Statements—(Continued)
Fair value measurements at each reporting date were as follows:
April 3, 2016:
Assets and liabilities measured at fair value on a recurring basis were presented in the Company’s consolidated balance sheet as of April 3, 2016.
| April 3, 2016 balance |
Quoted prices
in active markets for identical assets or liabilities Level 1 |
Significant other observable inputs Level 2 |
Significant other unobservable inputs Level 3 |
|||||||||||||
| (in thousands) | ||||||||||||||||
| Assets |
||||||||||||||||
| Money market funds |
$ | 15,697 | $ | 15,697 | $ | — | $ | — | ||||||||
| Corporate notes and bonds |
163,675 | — | 163,675 | — | ||||||||||||
| Commercial paper |
45,473 | — | 45,473 | — | ||||||||||||
| U.S. agency securities |
34,607 | — | 34,607 | — | ||||||||||||
|
|
|
|
|
|
|
|
|
|||||||||
| Total investments |
$ | 259,452 | $ | 15,697 | $ | 243,755 | $ | — | ||||||||
|
|
|
|
|
|
|
|
|
|||||||||
| Liabilities |
||||||||||||||||
| Contingent consideration |
$ | 1,909 | $ | — | $ | — | $ | 1,909 | ||||||||
|
|
|
|
|
|
|
|
|
|||||||||
| Assets |
||||||||||||||||
| Cash equivalents |
$ | 15,697 | $ | 15,697 | $ | — | $ | — | ||||||||
| Short-term investments |
243,755 | — | 243,755 | — | ||||||||||||
|
|
|
|
|
|
|
|
|
|||||||||
| Total investments |
$ | 259,452 | $ | 15,697 | $ | 243,755 | $ | — | ||||||||
|
|
|
|
|
|
|
|
|
|||||||||
| Liabilities |
||||||||||||||||
| Accrued liabilities |
$ | 1,909 | $ | — | $ | — | $ | 1,909 | ||||||||
|
|
|
|
|
|
|
|
|
|||||||||
| Total contingent consideration |
$ | 1,909 | $ | — | $ | — | $ | 1,909 | ||||||||
|
|
|
|
|
|
|
|
|
|||||||||
| April 3, 2016 amortized cost |
Gross unrealized gain |
Gross unrealized loss |
April 3, 2016 estimated FMV |
|||||||||||||
| Corporate notes and bonds |
$ | 163,712 | $ | 19 | $ | (56 | ) | $ | 163,675 | |||||||
| Commercial paper |
45,480 | 3 | (10 | ) | 45,473 | |||||||||||
| U.S. agency securities |
34,589 | 25 | (7 | ) | 34,607 | |||||||||||
|
|
|
|
|
|
|
|
|
|||||||||
| Total available-for-sale investments |
$ | 243,781 | $ | 47 | $ | (73 | ) | $ | 243,755 | |||||||
|
|
|
|
|
|
|
|
|
|||||||||
| Money market funds |
15,697 | |||||||||||||||
|
|
|
|||||||||||||||
| Total aggregate fair value |
$ | 259,452 | ||||||||||||||
|
|
|
|||||||||||||||
The fair values of money market funds were derived from quoted market prices as active markets for these instruments exist. The fair values of corporate notes and bonds, commercial paper and U.S. agency securities were derived from non-binding market consensus prices that are corroborated by observable market data.
None of the gross unrealized losses as of April 3, 2016 were considered to be other-than-temporary impairments.
There were no transfers of assets measured at fair value between Level 1 and Level 2 during fiscal year 2016.
77
Table of Contents
InvenSense, Inc.
Notes to Consolidated Financial Statements—(Continued)
March 29, 2015:
Assets and liabilities measured at fair value on a recurring basis were presented in the Company’s consolidated balance sheet as of March 29, 2015.
| March 29, 2015 balance |
Quoted prices in active markets for identical assets or liabilities Level 1 |
Significant other observable inputs Level 2 |
Significant other unobservable inputs Level 3 |
|||||||||||||
| (in thousands) | ||||||||||||||||
| Assets |
||||||||||||||||
| Money market funds |
$ | 22,023 | $ | 22,023 | $ | — | $ | — | ||||||||
| Corporate notes and bonds |
122,124 | — | 122,124 | — | ||||||||||||
| Commercial paper |
6,991 | — | 6,991 | — | ||||||||||||
| Municipal notes and bonds |
302 | — | 302 | — | ||||||||||||
| U.S. agency securities |
2,502 | — | 2,502 | — | ||||||||||||
|
|
|
|
|
|
|
|
|
|||||||||
| Total investments |
$ | 153,942 | $ | 22,023 | $ | 131,919 | $ | — | ||||||||
|
|
|
|
|
|
|
|
|
|||||||||
| Liabilities |
||||||||||||||||
| Contingent consideration |
$ | 9,124 | $ | — | $ | — | $ | 9,124 | ||||||||
|
|
|
|
|
|
|
|
|
|||||||||
| Assets |
||||||||||||||||
| Cash equivalents |
$ | 24,023 | $ | 24,023 | $ | — | $ | — | ||||||||
| Short-term investments |
129,919 | — | 129,919 | — | ||||||||||||
|
|
|
|
|
|
|
|
|
|||||||||
| Total investments |
$ | 153,942 | $ | 24,023 | $ | 129,919 | $ | — | ||||||||
|
|
|
|
|
|
|
|
|
|||||||||
| Liabilities |
||||||||||||||||
| Accrued liabilities |
$ | 6,364 | $ | — | $ | — | $ | 6,364 | ||||||||
| Long-term liabilities |
2,760 | — | — | 2,760 | ||||||||||||
|
|
|
|
|
|
|
|
|
|||||||||
| Total contingent consideration |
$ | 9,124 | $ | — | $ | — | $ | 9,124 | ||||||||
|
|
|
|
|
|
|
|
|
|||||||||
| March 29, 2015 amortized cost |
Gross unrealized gain |
Gross unrealized loss |
March 29, 2015 estimated FMV |
|||||||||||||
| Corporate notes and bonds |
$ | 122,131 | $ | 22 | $ | (29 | ) | $ | 122,124 | |||||||
| Commercial paper |
6,992 | — | (1 | ) | 6,991 | |||||||||||
| Municipal notes and bonds |
302 | — | — | 302 | ||||||||||||
| U.S. agency securities |
2,500 | 2 | — | 2,502 | ||||||||||||
|
|
|
|
|
|
|
|
|
|||||||||
| Total available-for-sale investments |
$ | 131,925 | $ | 24 | $ | (30 | ) | $ | 131,919 | |||||||
|
|
|
|
|
|
|
|
|
|||||||||
| Money market funds |
22,023 | |||||||||||||||
|
|
|
|||||||||||||||
| Total aggregate fair value |
$ | 153,942 | ||||||||||||||
|
|
|
|||||||||||||||
The fair values of money market funds were derived from quoted market prices as active markets for these instruments exist. The fair values of corporate notes and bonds, commercial paper, and U.S. agency securities were derived from non-binding market consensus prices that are corroborated by observable market data.
There were no transfers of assets measured at fair value between Level 1 and Level 2 during fiscal year 2015.
78
Table of Contents
InvenSense, Inc.
Notes to Consolidated Financial Statements—(Continued)
Level 3 financial liabilities:
The following table provides a summary of changes in fair value of the Company’s contingent consideration categorized in Level 3 as of April 3, 2016 and March 29, 2015:
| April 3, 2016 | March 29, 2015 | |||||||
| (in thousands) | ||||||||
| Beginning balance |
$ | 9,124 | $ | — | ||||
| Add: Contingent consideration in connection with acquisitions |
16,034 | |||||||
| Payments made on contingent liabilities |
(1,908 | ) | (7,863 | ) | ||||
| Change in fair value and other |
(5,307 | ) | 953 | |||||
|
|
|
|
|
|||||
| Ending balance |
$ | 1,909 | $ | 9,124 | ||||
|
|
|
|
|
|||||
Contingent consideration on acquired businesses (See Note 8) was measured at fair value using Level 3 inputs as defined in the fair value hierarchy. The following table presents certain information about the significant unobservable inputs used in the fair value measurement for the contingent consideration measured at fair value on a recurring basis using significant unobservable inputs:
| Description |
Valuation Techniques |
Significant Unobservable Inputs | ||
| Liabilities: Contingent consideration | Present value of a Probability Weighted Earn-out model using an appropriate discount rate. | Estimate of achieving the milestones. |
An increase in the estimate of probability of meeting the milestones could result in a significantly higher estimated fair value of the contingent consideration liability. Alternatively, a decrease in the estimate of probability of meeting the milestones could result in a significantly lower estimated fair value of contingent consideration liability. The fair value of contingent consideration was derived from a probability weighted earn-out model of future contingent payments. The cash payments are expected to be made upon meeting the milestones (See Note 8). The initial valuation of the contingent consideration was based on a collaborative effort of the Company’s engineering and finance departments, and third party valuation experts. The estimate of meeting the milestones and discount rates will be reviewed quarterly and updated as and when necessary. Potential valuation adjustments will be made to adjust the contingent consideration payments. These adjustments will be recorded in the statements of operations.
In fiscal year 2016, the fair value of contingent consideration declined by $5.3 million. The decline in fair value was the result of a reduction in the probability of a design win milestone associated with the Movea, S.A., (“Movea”) acquisition from 50% to 0% and a reduction in the probability of a design win associated with the Trusted Positioning, Inc. (“TPI”) acquisition from 50% to 0%. The decline in fair value of the design win milestones for Movea and TPI was $4.0 million and $2.4 million, respectively, which were recorded as a credit to research and development expense. The earn-out payments for the Movea and TPI design win milestones were not made as these milestones were not met and expired during fiscal year 2016. Offsetting this amount is an increase in the fair value of two TPI cloud application milestones as a result of an increase in the estimated probability of achievement of those milestones. The increase in the fair value of the cloud application milestones was $1.1 million which was recorded as a debit to research and development expense in fiscal year 2016. A design milestone for TPI was achieved and the payment of $1.9 million was made in fiscal year 2016.
79
Table of Contents
InvenSense, Inc.
Notes to Consolidated Financial Statements—(Continued)
| 3. | Balance sheet details |
Inventories
Inventories at April 3, 2016 and March 29, 2015 consist of the following:
| April 3, 2016 | March 29, 2015 | |||||||
| (in thousands) | ||||||||
| Work in process |
$ | 40,329 | $ | 49,146 | ||||
| Finished goods |
21,968 | 25,959 | ||||||
|
|
|
|
|
|||||
| Total inventories |
$ | 62,297 | $ | 75,105 | ||||
|
|
|
|
|
|||||
Prepaid expenses and other current assets
Prepaid expenses and other current assets at April 3, 2016 and March 29, 2015 consist of the following:
| April 3, 2016 | March 29, 2015 | |||||||
| (in thousands) | ||||||||
| Prepaid expenses |
$ | 5,256 | $ | 4,280 | ||||
| Income tax receivable |
156 | 1,398 | ||||||
| Deferred tax assets |
— | 5,127 | ||||||
| Other receivables |
1,676 | 2,675 | ||||||
| Other current assets |
2,162 | 1,470 | ||||||
|
|
|
|
|
|||||
| Total prepaid expenses and other current assets |
$ | 9,250 | $ | 14,950 | ||||
|
|
|
|
|
|||||
Property and equipment, net
Property and equipment at April 3, 2016 and March 29, 2015 consist of the following:
| April 3, 2016 | March 29, 2015 | |||||||
| (in thousands) | ||||||||
| Production and lab equipment |
$ | 52,821 | $ | 47,107 | ||||
| Computer equipment and software |
9,074 | 6,044 | ||||||
| Equipment under construction |
607 | 2,820 | ||||||
| Leasehold improvements and furniture and fixtures |
8,396 | 7,163 | ||||||
|
|
|
|
|
|||||
| Subtotal |
70,898 | 63,134 | ||||||
| Accumulated depreciation and amortization |
(34,627 | ) | (21,285 | ) | ||||
|
|
|
|
|
|||||
| Property and equipment—net |
$ | 36,271 | $ | 41,849 | ||||
|
|
|
|
|
|||||
Depreciation expense was $12.8 million, $10.2 million and $4.5 million for fiscal years 2016, 2015, and 2014, respectively. Equipment under construction consists primarily of production and lab equipment. Equipment under construction is not subject to depreciation until it is available for its intended use. All of the equipment under construction is expected to be completed and placed in service by the end of fiscal 2017.
80
Table of Contents
InvenSense, Inc.
Notes to Consolidated Financial Statements—(Continued)
Accrued liabilities
Accrued liabilities at April 3, 2016 and March 29, 2015 consist of the following:
| April 3, 2016 | March 29, 2015 | |||||||
| (in thousands) | ||||||||
| Payroll-related expenses |
$ | 8,030 | $ | 7,197 | ||||
| Bonuses |
5,040 | 5,352 | ||||||
| Contingent consideration, current portion |
1,908 | 6,364 | ||||||
| Deferred revenue |
1,949 | 1,584 | ||||||
| Legal fees |
197 | 921 | ||||||
| Accrued contractual coupon interest payable on convertible senior notes |
1,313 | 1,252 | ||||||
| Income tax payable |
553 | 311 | ||||||
| Other tax payable |
768 | 768 | ||||||
| Acquisition-related payable |
— | 1,380 | ||||||
| Customer deposit |
4,008 | 900 | ||||||
| Other accrued liabilities |
6,482 | 5,962 | ||||||
|
|
|
|
|
|||||
| Total accrued liabilities |
$ | 30,248 | $ | 31,991 | ||||
|
|
|
|
|
|||||
Other long-term liabilities
Other long-term liabilities at April 3, 2016 and March 29, 2015 consist of the following:
| April 3, 2016 | March 29, 2015 | |||||||
| (in thousands) | ||||||||
| Long-term tax payable |
$ | 13,928 | $ | 11,918 | ||||
| Deferred rent |
3,436 | 3,630 | ||||||
| Deferred tax liabilities |
3,026 | 3,936 | ||||||
| Deferred revenue |
4,100 | 3,400 | ||||||
| Contingent consideration, noncurrent portion |
— | 2,760 | ||||||
| Long-term debt |
2,465 | 2,472 | ||||||
| Other long-term liabilities |
275 | 136 | ||||||
|
|
|
|
|
|||||
| Total other long-term liabilities |
$ | 27,230 | $ | 28,252 | ||||
|
|
|
|
|
|||||
81
Table of Contents
InvenSense, Inc.
Notes to Consolidated Financial Statements—(Continued)
| 4. | Commitments and contingencies |
Operating lease obligations
The Company has non-cancelable operating leases for its facilities through fiscal year 2022.
Future minimum lease payments, net of future minimum lease income, under operating leases as of April 3, 2016 are as follows:
| Fiscal Years Ending: |
Amount | |||
| (in thousands) | ||||
| 2017 |
5,001 | |||
| 2018 |
6,427 | |||
| 2019 |
6,603 | |||
| 2020 |
5,282 | |||
| 2021 |
1,393 | |||
| Beyond |
516 | |||
|
|
|
|||
| Total |
$ | 25,222 | ||
|
|
|
|||
The Company’s lease agreements provide for rental payments which have certain lease incentives and graduated rental payments. As a result, the rent expense is recognized on a straight-line basis over the term of the lease. The Company’s rental expense under operating leases net of the rent income from subleases, was approximately $4.9 million, $5.2 million and $5.6 million for fiscal years 2016, 2015 and 2014, respectively. The Company’s rental income from sublease was approximately $1.5 million and $0.3 million for fiscal years 2016 and 2015. No rental income from sublease was recorded for fiscal year 2014.
Purchase commitments
The Company has non-cancelable purchase commitments with its foundry vendors. As of April 3, 2016, the Company had future minimum payments of $18.1 million under the purchase commitments over a period of less than 12 months.
401(k) savings plan
In November 2004, the Company established a defined contribution savings plan under Section 401(k) of the Internal Revenue Code. This plan covers substantially all employees who meet minimum age and service requirements and allows participants to defer a portion of their annual compensation on a pretax basis. The Company may make contributions to the plan at the discretion of the Board of Directors. During the fiscal years 2016, 2015 and 2014, the Company contributed $0.5 million, $0.2 million and $43,000 to the plan, respectively.
Legal proceedings and contingencies
From time to time the Company is involved in various disputes and litigation matters that arise in the ordinary course of our business, including disputes and lawsuits related to intellectual property and employment issues. In addition, the Company is a party to class action lawsuits.
In January and March of 2015, purported shareholders filed five substantially similar class action complaints in the U.S. District Court, Northern District of California against the Company and two of the Company’s current and former executives (“Class Action Defendants”) (Jim McMillan v. InvenSense, Inc.,
82
Table of Contents
InvenSense, Inc.
Notes to Consolidated Financial Statements—(Continued)
et al. Case No. 3:15-cv-00084-JD, filed January 7, 2015; William Lendales v. InvenSense, Inc. et al., Case No. 3:15-cv-00142-VC, filed on January 12, 2015; Plumber & Steamfitters Local 21 Pension Fund v. InvenSense, Inc., et al., Case No. 5:15-cv-00249-BLF, filed on January 16, 2015; William B. Davis vs. InvenSense, Inc., et al., Case No. 5:15-cv-00425-RMW, filed on January 29, 2015; and Saratoga Advantage Trust Technology & Communications Portfolio v. InvenSense et al., Case No. 3:15-cv-01134, filed on March 11, 2015). On April 23, 2015, those cases were consolidated into a single proceeding which is currently pending in the U.S. District Court, Northern District of California and captioned In re InvenSense, Inc. Securities Litigation, Case No. 3:15-cv-00084-JD (the “Securities Case”), and the Vossen Group was designated as lead plaintiff. On May 26, 2015, the lead plaintiffs filed a consolidated amended class action complaint, which alleges that the defendants violated the federal securities laws by making materially false and misleading statements regarding our business results between July 29, 2014 and October 28, 2014, and seeks unspecified damages along with plaintiff’s costs and expenses, including attorneys’ fees. On June 25, 2015, the Class Action Defendants filed a motion seeking dismissal of the case and a hearing on that motion was held on October 7, 2015. On March 28, 2016, the court granted the motion to dismiss, in part with prejudice and in part with leave to amend. On April 18, 2016, the lead plaintiff’s counsel filed an amended complaint. On May 5, 2016, the Class Action Defendants filed a motion seeking dismissal of the case. The court has scheduled a hearing on the motion for June 15, 2016.
In addition, in January and March of 2015, other purported shareholders filed three substantially similar shareholder derivative complaints against two of our current and former officers and several of our current directors, twice in the U.S. District Court, Northern District of California and once in Santa Clara Superior Court (George E Rollins v. Behrooz Abdi et al., Case No. 5:15-cv-00184-PSG, filed on January 13, 2015; Linda Karr v. Behrooz Abdi et al., Case No. 5:15-cv-00200-NC, filed on January 14, 2015; and Robert Bilbrey v. Behrooz Abdi et al., Case No. 1-15-CV-278742 was filed on March 20, 2015) (collectively, the “Derivative Cases”). In the Derivative Cases complaints, the plaintiffs make allegations similar to those presented in the Securities Case, but the plaintiffs asserts various state law causes of action, including claims of breach of fiduciary duty and unjust enrichment. The Company has undertaken an evaluation of these complaints. Plaintiffs in the Derivative Cases have agreed to an indefinite stay pending developments in the Securities Case. In light of the unresolved legal issues, while a loss is reasonably possible, the amount of any potential loss cannot be estimated. At this stage, the Company is unable to predict the outcome of this matter and, accordingly, cannot estimate the potential financial impact on the Company’s business, operating results, cash flows or financial position.
The semiconductor and MEMS industries are characterized by companies that hold large numbers of patents and other intellectual property rights and that vigorously pursue, protect and enforce intellectual property rights.
Robert Bosch GmbH (“Bosch”), one of the Company’s competitors, and the Company have each previously made generalized assertions of potential patent infringement by the other. On October 28, 2015, the Company and Bosch resolved all assertions of potential infringement between them and entered into a multi-year, worldwide patent cross license agreement for MEMS and sensor technologies, excluding patents covering InvenSense’s CMOS-MEMS eutectic bonding production process and Bosch’s two-layer porous silicon production process, and an upfront payment of $11.5 million to Bosch. The other terms of the settlement and the patent cross license agreement remain confidential and are not expected to have a material impact on our future results. Based on the status of the negotiations, the Company recognized a pre-tax charge of $11.7 million during the quarter ended June 28, 2015. On October 28, 2015, Bosch and the Company resolved all assertions of potential infringement made by the other. There were no significant changes to the final terms which required any additional charge in the fiscal year 2016. In the future, other third parties may assert against the Company and its customers and distributors, their patent and other intellectual property rights to technologies that are important to our business.
83
Table of Contents
InvenSense, Inc.
Notes to Consolidated Financial Statements—(Continued)
On May 16, 2012, and again on March 11, 2013 STMicroelectronics, Inc. (“STMicro”) filed patent infringement complaints (“ST Microelectronics Patent Litigation I and II”) against us, alleging infringement of certain of their patents (collectively, the “Asserted Patents”). STI alleged that certain lnvenSense MEMS products and services infringed one or more claims of the Asserted Patents. On July 9, 2012, we filed counterclaims against STI alleging infringement of certain of our patents. On February 9, 2014, we and STI settled and resolved all litigation and proceedings pending between us and STI for a one-time cash payment of $15.0 million to STI, and entered into a patent cross license agreement. The other terms of the settlement and the patent cross license agreement remain confidential and are not expected to have a material impact on our future results. This settlement and patent cross license resolves all outstanding legal proceeding between us and STMicro. The settlement resulted in recognition of a pre-tax charge of $15.0 million in fiscal year 2014.
The Company is not aware of any other pending legal matters or claims, individually or in the aggregate, that are expected to have a material adverse impact on its consolidated financial position, results of operations, or cash flows. However, the Company’s analysis of whether a claim may proceed to litigation cannot be predicted with certainty, nor can the results of litigation be predicted with certainty. Nevertheless, defending any of these actions, regardless of the outcome, may be costly, time consuming, distract management personnel, and have a negative effect on our business. An adverse outcome in any of these actions, including a judgment or settlement, may cause a material adverse effect on our future business, operating results, and/or financial condition.
The Company indemnifies certain customers, distributors, suppliers and subcontractors for attorney fees and damages and costs awarded against such parties in certain circumstances in which the Company’s products are alleged to infringe third-party intellectual property rights, including patents, registered trademarks or copyrights. Indemnification costs are charged to operations as incurred.
The Company’s Third Amended and Restated Bylaws require the Company to indemnify its directors and officers and employees to the fullest extent permitted by the Delaware General Corporation Law (DGCL). In addition, the Company’s current directors, the Company’s chief executive officer and certain executive officers have entered into separate indemnification agreements with the Company. The Company’s Second Amended and Restated Certificate of Incorporation, as amended, limits the liability of directors to the Company or its stockholders to the fullest extent permitted by the DGCL. The obligation to indemnify generally means that the Company is required to pay or reimburse the individuals’ reasonable legal expenses and possibly damages and other liabilities incurred in connection with these matters.
| 5. | Convertible senior notes |
In November 2013, the Company issued $175.0 million aggregate principal amount of 1.75% Convertible Senior Notes due on November 1, 2018 (the “Notes”), in a private placement to qualified institutional buyers pursuant to Rule 144A under the Securities Act of 1933 (the “Securities Act”). The Notes have not been registered under the Securities Act, or applicable state securities laws or blue sky laws, and may not be offered or sold in the United States absent registration under the Securities Act and applicable state securities laws or available exemptions from the registration requirements.
The Notes are senior unsecured obligation of the Company and rank equally in right of payment with all of the Company’s existing and future senior unsecured indebtedness and are junior to any of the Company’s existing and future secured indebtedness. The Notes pay interest in cash semi-annually (May and November) at a rate of 1.75% per annum. Net proceeds received by the Company, after issuance costs, were approximately $169.3 million.
84
Table of Contents
InvenSense, Inc.
Notes to Consolidated Financial Statements—(Continued)
On or after August 1, 2018 until the maturity date, the Notes may be converted at the option of the holders. Holders may convert the Notes at their option prior to August 1, 2018 only under the following circumstances:
1) During any calendar quarter and only during such calendar quarter, if the last reported sale price of the Company’s common stock for at least 20 trading days (whether or not consecutive) during a period of 30 consecutive trading days ending on the last trading day of the immediately preceding calendar quarter is greater than or equal to 130% of the conversion price of $21.89 on each applicable trading day;
2) During the five business day period after any five consecutive trading day period in which the “trading price” per $1,000 principal amount of Notes for each trading day of the measurement period was less than 98% of the product of the last reported sale price of our common stock and the conversion rate on each such trading day; or
3) Upon the occurrence of specified corporate events, including if there is a fundamental change.
Upon conversion, the Company will pay cash up to the aggregate principal amount of the Notes to be converted and pay or deliver cash, shares of its own common stock or a combination of cash and shares of its own common stock, at the Company’s election, in respect of the remainder, if any, of its conversion obligation in excess of the aggregate principal amount of the Notes being converted.
The conversion rate is initially 45.683 shares per $1,000 principal amount of the Notes (equivalent to an initial conversion price of approximately $21.89 per share of common stock), subject to certain adjustments.
The Notes are not redeemable by the Company prior to the maturity date. At an event of default or fundamental change, the principal amount of the Notes plus accrued and unpaid interest may become due immediately at the Note holders’ option.
The Company separately accounts for the liability and equity components of the Notes. The initial debt component of the Notes was valued at $135.7 million based on the contractual cash flows discounted at an appropriate comparable market non-convertible debt borrowing rate at the date of issuance of 7.3%, with the equity component representing the residual amount of the proceeds of $39.3 million which was recorded as a debt discount. The issuance costs were allocated pro-rata based on the relative initial carrying amounts of the debt and equity components, including the Note hedges and warrants transactions described below. As a result, $2.5 million of the issuance costs were allocated to the equity component of the Notes, $3.0 million of issuance costs paid to the initial purchaser were accounted for as a debt discount and $0.25 million of the issuance costs were classified as other non-current assets. Debt issuance costs were reclassified and presented in the balance sheet as a direct deduction from the carrying value of the debt liability, consistent with the presentation of a debt discount in the first quarter of the Company’s fiscal year 2016 pertaining to the requirement of ASU 2015-03, Simplifying the Presentation of Debt Issuance Costs. The debt discount and the issuance costs allocated to the debt component are amortized as additional interest expense over the term of the Notes using the effective interest method. As of April 3, 2016, the remaining amortization period of the debt discount and the issuance costs is 2.6 years. The effective interest rate of the Notes is 7.84% per annum (1.75% coupon rate plus 6.09% of non-cash accretion expense).
Convertible notes hedges and warrants
Concurrent with the issuance of the Notes on November 6 and 7, 2013, the Company purchased call options for its own common stock to hedge the Notes (the “Note Hedge”) and sold call options for its own common stock
85
Table of Contents
InvenSense, Inc.
Notes to Consolidated Financial Statements—(Continued)
(the “Warrants”). The Note Hedges and Warrants transactions are structured to reduce the potential future economic dilution associated with the conversion of the Notes and are excluded from the computation of diluted earnings per share for each period presented, as the Company’s average stock price during each period is less than the conversion price.
The Note Hedges—On November 6 and 7, 2013, the Company purchased call options from a counterparty for an aggregate price of approximately $39.1 million, which gives the Company the right to buy from the counterparty up to approximately 8.0 million shares of the Company’s common stock at a price of $21.89 per share, subject to adjustments. The Note Hedge is exercisable upon conversion of the Note for a number of shares equal to the product of 0.045683 and amount of the converted Note. Upon exercise of the Note Hedge, the Company will receive from the counterparty cash, shares of the Company’s common stock, or a combination thereof, equal to the amount by which the market price per share of the Company’s common stock exceeds $21.89 during the applicable valuation period. By the Note Hedge terms the Company will receive cash and shares in a combination that offsets share dilution caused by conversion of the Note.
Warrants—On November 6 and 7, 2013, the Company sold call options to the same counterparty for approximately $25.6 million, which gives the counterparty the right to buy from the Company up to approximately 8.0 million shares of the Company’s common stock at an exercise price of $28.66 per share, subject to adjustments, on a series of days commencing on February 1, 2019 and ending May 13, 2019. Upon exercise of the Warrants, the Company has the option to deliver cash or shares of its common stock equal to the difference between the market price on the exercise date and the strike price of the Warrants. Upon exercise of the Warrants, the Company will pay to the Initial Purchaser cash, shares of Company’s common stock, or a combination thereof (at the Company’s choice), equal to the amount by which the market price per share of the Company’s common stock exceeds $28.66 during the applicable valuation period.
The Note Hedges and Warrants above are classified in stockholders’ equity in the Company’s consolidated balance sheets.
The following table summarizes the principal amounts, the unamortized discount on the Notes and the unamortized debt issuance cost related to the Notes (in thousands):
| April 3, 2016 | March 29, 2015 | |||||||
| (in thousands) | ||||||||
| Principal amount of the Notes |
$ | 175,000 | $ | 175,000 | ||||
| Unamortized discount on the Notes |
23,809 | 31,983 | ||||||
| Unamortized debt issuance costs |
153 | 207 | ||||||
|
|
|
|
|
|||||
| Net carrying value |
$ | 151,038 | $ | 142,810 | ||||
|
|
|
|
|
|||||
The following table presents the amount of interest expense recognized related to the Notes (in thousands):
| Fiscal Year | ||||||||||||
| 2016 | 2015 | 2014 | ||||||||||
| (in thousands) | ||||||||||||
| Contractual coupon interest expense |
$ | 3,113 | $ | 3,059 | $ | 1,158 | ||||||
| Accretion of debt discount |
8,173 | 7,435 | 2,835 | |||||||||
| Amortization of debt issuance costs |
55 | 51 | 19 | |||||||||
|
|
|
|
|
|
|
|||||||
| Total interest expense related to the Notes |
$ | 11,341 | $ | 10,545 | $ | 4,012 | ||||||
|
|
|
|
|
|
|
|||||||
86
Table of Contents
InvenSense, Inc.
Notes to Consolidated Financial Statements—(Continued)
As of April 3, 2016, aggregate future principal debt maturities are as follows:
| Fiscal Year |
April 3, 2016 | |||
| (in thousands) | ||||
| 2019 |
$ | 175,000 | ||
|
|
|
|||
| Total |
$ | 175,000 | ||
|
|
|
|||
The Notes issued by the Company in November 2013 are shown in the accompanying consolidated balance sheets at their original issuance value, net of unamortized discount, and are not marked to market each period. The approximate fair value of the Notes as of April 3, 2016 was $162.8 million. The fair value of the Notes was determined using quoted market prices for similar securities, which, due to limited trading activity, are considered Level 2 in the fair value hierarchy.
| 6. | Stockholders’ equity |
Stock plans
In July 2011, the Company’s Board of Directors and its stockholders approved the establishment of the 2011 Stock Incentive Plan (the “2011 Plan”). The 2011 Plan provides for annual increases in the number of shares available for issuance thereunder on the first business day of each fiscal year, equal to four percent (4%) of the number of shares of the Company’s common stock outstanding as of such date, which resulted in an annual increase of 3.6 million shares, 3.5 million shares and 3.4 million shares for fiscal years 2016, 2015 and 2014.
Under the 2011 Plan, the Board of Directors may grant either incentive stock options, nonqualified stock options, or stock awards to eligible persons, including employees, nonemployees, members of the Board of Directors, consultants and other independent advisors who provide services to the Company.
Incentive stock options may only be granted to employees and at an exercise price of no less than fair value on the date of grant. Nonqualified stock options may be granted at an exercise price of no less than 100% of fair value on the date of grant. For owners of more than 10% of the Company’s common stock, options may only be granted for an exercise price of not less than 110% of fair value, and these options generally expire 10 years from the date of grant. Stock options may be exercisable immediately but subject to repurchase. Stock options vest over the period determined by the Board of Directors, generally four years.
87
Table of Contents
InvenSense, Inc.
Notes to Consolidated Financial Statements—(Continued)
Stock option activities of the Company under the 2011 Plan and 2004 Stock Incentive Plan (the “Plans”) are as follows (in thousands, except per share amounts):
| Options issued and outstanding |
Weighted- average exercise price |
Weighted- average remaining contractual term (in years) |
Aggregate intrinsic value |
|||||||||||||
| Outstanding—April 1, 2013 |
10,495 | $ | 7.65 | |||||||||||||
| Options granted |
1,578 | 16.14 | ||||||||||||||
| Exercised options |
(3,221 | ) | 4.47 | |||||||||||||
| Cancelled options |
(576 | ) | 9.71 | |||||||||||||
|
|
|
|
|
|||||||||||||
| Outstanding—March 30, 2014 |
8,276 | $ | 10.37 | |||||||||||||
| Options granted |
1,916 | 19.22 | ||||||||||||||
| Exercised options |
(1,421 | ) | 6.50 | |||||||||||||
| Cancelled options |
(464 | ) | 11.89 | |||||||||||||
|
|
|
|
|
|||||||||||||
| Outstanding—March 29, 2015 |
8,307 | $ | 12.99 | |||||||||||||
| Options granted |
3,291 | 11.01 | ||||||||||||||
| Exercised options |
(644 | ) | 5.71 | |||||||||||||
| Cancelled options |
(828 | ) | 13.59 | |||||||||||||
|
|
|
|
|
|||||||||||||
| Outstanding—April 3, 2016 |
10,126 | $ | 12.76 | 7.53 | $ | 5,016 | ||||||||||
|
|
|
|
|
|||||||||||||
| Vested and expected to vest—April 3, 2016 |
9,203 | $ | 12.74 | 7.38 | $ | 4,635 | ||||||||||
| Exercisable—April 3, 2016 |
4,903 | $ | 12.10 | 6.25 | $ | 3,278 | ||||||||||
Additional information regarding options outstanding as of April 3, 2016 is as follows (in thousands except per share amounts):
| Options outstanding | Options exercisable | |||||||||||||||||||
| Exercise Prices |
Number outstanding at April 3, 2016 (in thousands) |
Weighted- average remaining contractual Life (in years) |
Weighted- average exercise price per share |
Number exercisable at April 3, 2016 (in thousands) |
Weighted- average exercise price per share |
|||||||||||||||
| $0.70 - $7.27 |
2,073 | 8.0 | $ | 6.33 | 683 | $ | 4.37 | |||||||||||||
| $7.32 - $11.57 |
2,736 | 6.5 | $ | 10.36 | 2,018 | $ | 10.31 | |||||||||||||
| $11.85 - $14.57 |
2,389 | 7.7 | $ | 13.64 | 1,088 | $ | 13.07 | |||||||||||||
| $14.65 - $24.99 |
2,928 | 8.0 | $ | 18.86 | 1,114 | $ | 19.15 | |||||||||||||
|
|
|
|
|
|||||||||||||||||
| 10,126 | 7.5 | $ | 12.76 | 4,903 | $ | 12.10 | ||||||||||||||
|
|
|
|
|
|||||||||||||||||
Valuation of stock-based awards
The Company applies the provisions of ASC 718-10 “Compensation—Stock Compensation” which establishes the accounting for stock-based awards based on the fair value of the award measured at grant date. Accordingly, stock-based compensation cost is recognized in the consolidated statements of operations as a component of both cost of revenues and operating expenses over the requisite service period. ASC 718-10 requires tax benefits in excess of compensation cost to be reported as a financing cash flow rather than as a reduction of taxes paid. The determination of the fair value of stock-based payment awards on the date of grant using the Black-Scholes option pricing model is affected by the volatilities of a peer group of companies based on industry, stage of life cycle, size and financial leverage, actual and projected employee stock option exercise
88
Table of Contents
InvenSense, Inc.
Notes to Consolidated Financial Statements—(Continued)
behaviors, risk-free interest rate and expected dividends. The Company used historical experience to estimate expected term. The expected volatility was based on the historical stock volatilities of the Company’s historical data with that of a peer group of publicly listed companies over a period equal to the expected terms. The risk-free interest rate is based on U.S. Treasury zero-coupon issues with remaining terms similar to the expected term. The Company does not anticipate paying any cash dividends in the foreseeable future and, therefore, uses an expected dividend yield of zero.
The aggregate intrinsic value of the stock options exercised during fiscal year 2016, fiscal year 2015 and fiscal year 2014 was $3.8 million, $20.1 million and $39.4 million, respectively. The aggregate intrinsic value was calculated as the difference between the exercise price of the stock options and the estimated fair market value of the underlying common stock at the date of exercise.
The number of options expected to vest takes into account an estimate of expected forfeitures. As of April 3, 2016, the remaining unamortized stock-based compensation expense, reduced for estimated forfeitures and related to non-vested options, was $18.9 million to be amortized over a weighted-average remaining period of 2.8 years. Total unrecognized expense will be adjusted for future changes in estimated forfeitures.
The Company used the following weighted-average assumptions in determining stock-based compensation expense for option grants made during fiscal year 2016, fiscal year 2015 and fiscal year 2014.
| Fiscal Year | ||||||
| 2016 | 2015 | 2014 | ||||
| Expected term (in years) |
5.1 - 5.3 | 4.5 - 5.0 | 4.7 | |||
| Volatility |
44.4% - 46.6% | 41.4% - 45.9% | 40.1% - 41.9% | |||
| Risk-free interest rate |
1.2% - 1.7% | 1.4% - 1.6% | 0.6% - 2.7% | |||
| Dividend rate |
0% | 0% | 0% | |||
The weighted-average grant date fair value of the Company’s stock options granted in fiscal years 2016, 2015 and 2014 was $4.59, $7.16 and $5.90 per share, respectively.
Market-based awards
During fiscal 2013, the Company’s current chief executive officer was granted options to purchase up to 622,155 shares at $11.57 per share whose vesting is contingent upon meeting various price target thresholds that will trigger a four year ratable vesting period if the minimum twenty day closing stock prices cross thresholds of $15.00, $17.50 and $20.00, respectively. As of April 3, 2016, 367,241 shares of the granted options were exercisable. The exercise price of the options represents the stock price on the date of grant, and the options have a legal term of 10 years. The fair value of each option granted was estimated on the date of grant using a Monte Carlo Simulation analysis valuation model, assumes that price target thresholds will be achieved and results in an estimated term for the tranches ranging from 5.0 to 6.2 years. If the price target thresholds are not met, compensation cost is not reversed. The Company used the following assumptions in estimating the fair value of the shares; expected volatility 46.5%, expected dividends 0%, and risk-free rate of 0.8%. The weighted-average grant-date fair value of options granted during the period was $4.87 and is included in the stock option activities table above. During fiscal years 2016, 2015 and 2014, none of the market-based options were exercised. At April 3, 2016, there was $0.7 million of total unrecognized compensation cost to be recognized over a period of approximately 3 years.
89
Table of Contents
InvenSense, Inc.
Notes to Consolidated Financial Statements—(Continued)
Restricted stock units and restricted stock
Restricted stock unit and restricted stock activity of the Company under the Plans are as follows (in thousands, except per share amounts):
| Restricted stock units and restricted stock activities |
Shares | Weighted average grant date fair value per share |
||||||
| (in thousands, except per share amount) | ||||||||
| Unvested at April 1, 2013 |
806 | $ | 12.05 | |||||
| Granted |
2,952 | 17.28 | ||||||
| Released |
(251 | ) | 11.84 | |||||
| Forfeited |
(182 | ) | 13.62 | |||||
|
|
|
|
|
|||||
| Unvested at March 30, 2014 |
3,325 | 16.63 | ||||||
| Granted |
1,989 | 19.01 | ||||||
| Released |
(888 | ) | 16.09 | |||||
| Forfeited |
(396 | ) | 18.39 | |||||
|
|
|
|
|
|||||
| Unvested at March 29, 2015 |
4,030 | 17.75 | ||||||
| Granted |
3,074 | 10.38 | ||||||
| Released |
(1,286 | ) | 17.22 | |||||
| Forfeited |
(846 | ) | 16.96 | |||||
|
|
|
|
|
|||||
| Unvested at April 3, 2016 |
4,972 | $ | 13.47 | |||||
|
|
|
|
|
|||||
Restricted stock units and restricted stock granted to employees are generally subject to the employee’s continued service to the Company over that period. The fair value of restricted stock units and restricted stock is determined using the fair value of the Company’s common stock on the date of the grant. Compensation expense is generally recognized on a straight-line basis over the requisite service period of each grant adjusted for estimated forfeitures. At April 3, 2016, there was $44.7 million of total unrecognized compensation cost related to restricted stock units and restricted stock, which the Company expects to recognize over a weighted-average period of 2.7 years. The weighted-average grant-date fair value per share of restricted stock units and restricted stock for fiscal years 2016, 2015 and 2014 was $10.38, $19.01 and $17.28 per share, respectively.
2013 Employee stock purchase plan
Under the 2013 Employee Stock Purchase Plan, as amended (the “ESPP”), eligible employees may apply accumulated payroll deductions, which may not exceed 10% of an employee’s compensation, to the purchase of shares of the Company’s common stock at periodic intervals. The purchase price of stock under the ESPP is equal to 85% of the lower of (i) the fair market value of the Company’s common stock on the first day of each offering period, or (ii) the fair market value of the Company’s common stock on the purchase date (as defined in the ESPP). Each offering period consists of one purchase period of approximately six months duration.
At the 2015 annual meeting of stockholders, stockholders of the Company approved an amendment to the ESPP to increase the number of shares of common stock reserved for future issuance by 1,000,000 shares which brought the total amount of common stock reserved for issuance pursuant to the ESPP to employees to an aggregate of 1,400,000 shares. As of April 3, 2016, 400,000 shares had been purchased.
During fiscal years 2016, 2015 and 2014, compensation expense recognized in connection with the ESPP was $0.9 million, $0.9 million and $0.2 million, respectively.
90
Table of Contents
InvenSense, Inc.
Notes to Consolidated Financial Statements—(Continued)
Stock-based compensation expense
Total stock-based compensation costs for the Company’s stock plans for fiscal years 2016, 2015 and 2014 are as follows:
| Fiscal Year | ||||||||||||
| 2016 | 2015 | 2014 | ||||||||||
| (in thousands) | ||||||||||||
| Cost of revenue |
$ | 2,472 | $ | 2,520 | $ | 1,296 | ||||||
| Research and development |
14,845 | 14,183 | 6,218 | |||||||||
| Selling, general and administrative |
17,562 | 13,801 | 8,510 | |||||||||
|
|
|
|
|
|
|
|||||||
| Total stock-based compensation expense |
$ | 34,879 | $ | 30,504 | $ | 16,024 | ||||||
|
|
|
|
|
|
|
|||||||
Common stock
As of April 3, 2016 and March 29, 2015, common stock reserved for future issuance was as follows (in thousands):
| Common stock reserved for issuance |
April 3, 2016 | March 29, 2015 | ||||||
| (in thousands) | ||||||||
| Stock plans |
||||||||
| Outstanding stock options |
10,126 | 8,307 | ||||||
| Outstanding restricted stock units and restricted stocks |
4,972 | 4,030 | ||||||
| Reserved for future equity incentive grants |
9,295 | 10,300 | ||||||
|
|
|
|
|
|||||
| 24,393 | 22,637 | |||||||
| ESPP |
1,000 | 230 | ||||||
| Warrants to purchase common stock |
7,995 | 7,995 | ||||||
|
|
|
|
|
|||||
| Total common stock reserved for future issuances |
33,388 | 30,862 | ||||||
|
|
|
|
|
|||||
| 7. | Income taxes |
The components of pretax income (loss) are summarized as follows:
| Fiscal Year | ||||||||||||
| 2016 | 2015 | 2014 | ||||||||||
| (in thousands) | ||||||||||||
| United States |
$ | (47,000 | ) | $ | (12,723 | ) | $ | (3,817 | ) | |||
| International |
38,931 | 9,388 | 10,006 | |||||||||
|
|
|
|
|
|
|
|||||||
| Income (loss) before provision for income taxes |
$ | (8,069 | ) | $ | (3,335 | ) | $ | 6,189 | ||||
|
|
|
|
|
|
|
|||||||
91
Table of Contents
InvenSense, Inc.
Notes to Consolidated Financial Statements—(Continued)
The provision for income taxes is summarized as follows:
| Fiscal Year | ||||||||||||
| 2016 | 2015 | 2014 | ||||||||||
| (in thousands) | ||||||||||||
| Current |
||||||||||||
| Federal |
$ | 62 | $ | 468 | $ | 1,658 | ||||||
| State |
1 | 1 | 1 | |||||||||
| International |
4,113 | 3,843 | 179 | |||||||||
|
|
|
|
|
|
|
|||||||
| Total current |
4,176 | 4,312 | 1,838 | |||||||||
|
|
|
|
|
|
|
|||||||
| Deferred |
||||||||||||
| Federal |
9,989 | (5,715 | ) | (1,856 | ) | |||||||
| State |
— | — | — | |||||||||
| International |
(1,024 | ) | (852 | ) | 88 | |||||||
|
|
|
|
|
|
|
|||||||
| Total deferred |
8,965 | (6,567 | ) | (1,768 | ) | |||||||
|
|
|
|
|
|
|
|||||||
| Income tax provision (benefit) |
$ | 13,141 | $ | (2,255 | ) | $ | 70 | |||||
|
|
|
|
|
|
|
|||||||
The provision for income taxes differs from the amount computed by applying the federal statutory rate to pretax income (loss) as follows:
| Fiscal Year | ||||||||||||
| 2016 | 2015 | 2014 | ||||||||||
| Income tax provision at the federal statutory rate |
35.0 | % | 35.0 | % | 35.0 | % | ||||||
| Research and development credits |
35.8 | 90.7 | (27.3 | ) | ||||||||
| Foreign tax rate differential |
31.5 | (27.3 | ) | (22.0 | ) | |||||||
| Non deductible stock compensation |
(48.3 | ) | (27.3 | ) | 19.5 | |||||||
| Other |
2.8 | (3.5 | ) | (4.1 | ) | |||||||
| Valuation allowance |
(219.6 | ) | — | — | ||||||||
|
|
|
|
|
|
|
|||||||
| Effective tax rate |
(162.8 | )% | 67.6 | % | 1.1 | % | ||||||
|
|
|
|
|
|
|
|||||||
Historically, over 90% of the Company’s revenues are derived from sales to customers located outside the U.S. A significant percentage of the Company’s pre-tax income in 2016, 2015, and 2014 was generated internationally, primarily from the Company’s Cayman Island subsidiary, which is currently a zero tax jurisdiction. Since 2011, the Company’s Cayman Island subsidiary has procured the rights to manufacture and sell the Company’s products in non-US locations via an intercompany technology license arrangement with its U.S. parent company. In addition, the Company has not provided for U.S. federal income and foreign withholding taxes on undistributed earnings from its non-U.S. subsidiaries, as it is the practice and intention of the Company to reinvest the earnings of its non-U.S. subsidiaries in those operations. The Company’s effective tax rate is highly dependent upon the geographic distribution of our worldwide earnings or losses, and the tax regulations in each geographic region. The Company expects that a large percentage of its consolidated pre-tax income will continue to be derived from, and reinvested in, the Company’s overseas operations. The Company anticipates that this pre-tax income will continue to be subject to foreign tax at significantly lower tax rates when compared to the United States federal statutory tax rate. Our effective tax rate could also fluctuate due to changes in the valuation of our deferred tax assets or liabilities, or by changes in tax laws, regulations, or accounting principles, as well as certain discrete items.
92
Table of Contents
InvenSense, Inc.
Notes to Consolidated Financial Statements—(Continued)
The passage of Protecting Americans from Tax Hike Act of 2015, on December 18, 2015, retroactively and permanently reinstated the U.S. federal R&D tax credit effective January 1, 2015.
Deferred income taxes reflect the net tax effects of tax carry-forward items and temporary differences between the carrying amounts of assets and liabilities for financial reporting purposes and the amounts used for income tax purposes. During the year ended April 3, 2016, the Company adopted ASU No. 2015-17, Balance Sheet Classification of Deferred Taxes, requiring all deferred tax assets and liabilities, and any related valuation allowance, to be classified as non-current on the Consolidated Balance Sheets. Certain amounts in the prior-year Consolidated Financial Statements were retrospectively adjusted to conform to the current-year presentation.
Significant components of the Company’s long-term deferred tax assets and deferred tax liabilities are as follows:
| April 3, 2016 | March 29, 2015 | |||||||
| (in thousands) | ||||||||
| Deferred tax assets: |
||||||||
| Accrued expenses and reserves |
$ | 2,936 | $ | 3,179 | ||||
| Stock based compensation |
5,507 | 4,081 | ||||||
| Research and development credits |
17,060 | 8,418 | ||||||
| Net operating loss carryforwards |
1,689 | 1,001 | ||||||
|
|
|
|
|
|||||
| Gross Deferred tax assets |
27,192 | 16,679 | ||||||
| Valuation Allowance |
(26,334 | ) | (5,221 | ) | ||||
|
|
|
|
|
|||||
| Deferred tax assets, net of valuation allowance |
858 | 11,458 | ||||||
|
|
|
|
|
|||||
| Deferred tax liabilities: |
||||||||
| Fixed Assets |
— | (175 | ) | |||||
| Acquired Intangibles |
(3,026 | ) | (3,935 | ) | ||||
|
|
|
|
|
|||||
| Total deferred tax liabilities |
(3,026 | ) | (4,110 | ) | ||||
|
|
|
|
|
|||||
| Deferred tax assets, net of valuation allowance and deferred tax liabilities |
$ | (2,168 | ) | $ | 7,348 | |||
|
|
|
|
|
|||||
The valuation allowance shown in the table above relates to net operating loss carryforwards, tax credits and temporary differences for which the Company believes that realization is uncertain.
As of April 3, 2016, the Company had $17.7 million of US federal deferred tax assets (DTAs) related to research and development credits and other tax attributes including accrued expenses and stock based compensation that can be used to offset federal taxable income in future periods. The realizability of these DTAs is based on the Company’s ability to generate sufficient and timely income in the US federal tax jurisdiction in future periods.
The Company considers both positive and negative evidence to conclude if sufficient future taxable income will be generated to be able to realize its DTAs. One significant, objective piece of evidence is the amount of domestic income or loss recognized by the Company in the three preceding years. Through the end of fiscal 2015, and for the first three quarters of fiscal 2016, this analysis, after adjustment for certain non-recurring charges, indicated that the cumulative twelve-quarter results was positive, and, along with the Company’s short and long-term earnings projections, formed the basis for concluding realization was more likely than not for its domestic DTAs. In the fourth quarter of fiscal 2016, as a result of the loss incurred in the quarter, this cumulative analysis turned to a loss. In addition, the Company lowered its short-term operating forecast. Based on this
93
Table of Contents
InvenSense, Inc.
Notes to Consolidated Financial Statements—(Continued)
updated information, the Company changed its conclusions on the realizability of its US federal DTAs and recorded a valuation allowance charge of $17.7 million in the quarter. The Company continues to be profitable in its international operations, and accordingly no valuation allowance has been provided on the $0.9 million of foreign DTAs as of April 3, 2016.
On July 27, 2015, the Tax Court issued an opinion (Altera Corp. et al. v. Commissioner) regarding the treatment of stock-based compensation expense in intercompany cost-sharing arrangements. However, U.S. Treasury has not withdrawn the requirement to include stock-based compensation from its regulations. Also, there is uncertainty related to the IRS response to the Tax Court opinion, the final resolution of this issue, and the potential favorable benefits to the Company. As such, no impact will be recorded at this time. The Company will continue to monitor developments related to this opinion and the potential impact of those developments on the Company’s current and prior fiscal years.
At April 3, 2016, the Company had approximately $45.3 million of federal net operating loss carryforwards for next 20 years and the Company had approximately $10.8 million federal research and development tax credit available to carryforwards which will expire from fiscal year 2032 to fiscal year 2036.
At April 3, 2016, the Company had approximately $19.9 million of state loss carryforwards. The net operating loss carryforwards expire between fiscal year 2017 and fiscal year 2033. At April 2016, the Company had approximately $12.6 million state research tax credit carryforwards. Of the $12.6 million of research credits generated, $12.2 million attributable to California will have an indefinite life.
At April 3, 2016, The Company had approximately $14.5 million of foreign net operating losses. These foreign net operating losses will carryforward indefinitely until they are utilized.
The Company has historically maintained a valuation allowance against the state deferred tax assets. The Company considers all available evidence, both positive and negative, in assessing the extent to which a valuation allowance should be applied against deferred tax assets. The Company’s valuation allowance increased $6.4 million as of April 3, 2016 compared to March 29, 2015, and increased $1.5 million as of March 29, 2015 compared to March 30, 2014.
Deferred income taxes reflect the net tax effects of temporary differences between the carrying amount of assets and liabilities for financial reporting purposes and the amounts for income tax purposes. The Company has not provided for U.S. federal income and foreign withholding taxes on undistributed earnings from non-U.S. operations as of April 2016, as in general, it is the practice and intention of the Company to reinvest the earnings of its non-U.S. subsidiaries in those operations. The Company has not made a provision for U.S. or additional foreign withholding taxes on the excess of the amount for financial reporting over the tax basis of investments in foreign subsidiaries that are essentially permanent in duration of approximately $141.0 million and $99.8 million at April 2016 and March 2015, respectively. Generally, such amounts become subject to U.S. taxation upon the remittance of dividends and under certain other circumstances. It is not practicable to estimate the amount of deferred tax liability related to investments in these foreign subsidiaries.
As a result of certain realization requirements of ASC 718, Compensation—Stock Compensation, the table of deferred tax assets and liabilities shown above does not include certain deferred tax assets as of April 03, 2016 that arose directly from (or the use of which was postponed by) tax deductions related to equity compensation that are greater than the compensation recognized for financial reporting. The excess tax benefit and the credit to APIC have not been recorded in fiscal year 2016 until the deduction reduces income taxes payable, on the basis that cash tax savings have not occurred.
94
Table of Contents
InvenSense, Inc.
Notes to Consolidated Financial Statements—(Continued)
While management believes that the Company has adequately provided for all tax positions, amounts asserted by tax authorities could be greater or less than the recorded position. Accordingly, the Company’s provisions on federal, state and foreign tax-related matters to be recorded in the future may change as revised estimates are made or the underlying matters are settled or otherwise resolved.
A reconciliation of the change in unrecognized tax benefits is as follows:
| (in thousands) | ||||
| Balance at April 1, 2013 |
$ | 7,816 | ||
| Increases in unrecognized tax benefits |
2,797 | |||
|
|
|
|||
| Balance at March 30, 2014 |
10,613 | |||
| Increases arising from acquisitions |
7,605 | |||
| Increases in unrecognized tax benefits |
4,309 | |||
|
|
|
|||
| Balance at March 29, 2015 |
$ | 22,527 | ||
| Increases in unrecognized tax benefits |
10,177 | |||
|
|
|
|||
| Balance at April 3, 2016 |
$ | 32,704 | ||
|
|
|
|||
Included in our gross unrecognized tax benefits balance of $32.7 million at April 3, 2016 are $18.3 million of tax positions which would affect income tax expense if recognized. As of April 3, 2016, approximately $14.4 million of unrecognized tax benefits including $11.7 million in federal and $2.7 million in states have been set up as our valuation allowance which primarily due to the Company being unable to generate sufficient taxable income in the future to fully utilize operating loss carryforwards and research and development credits before they expire.
The Company recognizes interest and penalties related to unrecognized tax benefits within the income tax expense line in the accompanying Consolidated Statements of Operations. Accrued interest and penalties are included within the related tax liability line in the Consolidated Balance Sheet. As of April 2016, the Company had $0.46 million accrued interest related to uncertain tax matters. The Company files income tax returns in the U.S. federal, California and various international jurisdictions. The 2004 through 2015 tax years are open and may be subject to potential examination in one or more jurisdictions.
The Company is required to file U.S. federal income tax returns as well as income tax returns in various states and foreign jurisdictions. The Company is in the process of an Internal Revenue Service (“IRS”) examination for tax years 2011, 2012, 2013 and 2014. The Company may be subject to examination by California for tax years 2010 and forward. Generally, the Company is subject to routine examination for tax years 2008 and forward in various foreign tax jurisdictions in which it operates.
| 8. | Acquisitions |
The Company completed one acquisition in fiscal year 2016, two acquisitions in fiscal year 2015 and one acquisition in fiscal year 2014. The acquisitions have been accounted for under ASC 805. Under ASC 805, the total purchase consideration of the acquisition is allocated to the tangible assets and identifiable intangible assets and liabilities assumed based on their relative fair values. The excess of the purchase consideration over the net tangible and identifiable intangible assets is recorded as goodwill, and was derived from expected benefits from future technology development, synergies and the knowledgeable and experienced workforce who joined the Company after the acquisition.
95
Table of Contents
InvenSense, Inc.
Notes to Consolidated Financial Statements—(Continued)
The fair values of the identifiable intangible assets were determined using the following methodologies:
Developed technology: The value assigned to the acquired developed technology was determined using the multi-period excess earnings method. The fair value of developed technology was capitalized as of the acquisition date and is amortized using a straight-line method to cost of revenues over the estimated remaining life.
In-process research & development: The value assigned to the acquired in-process research and development was determined using the multi-period excess earnings method. The fair value of in-process research & development was capitalized as of the acquisition date. In-process research and development is assessed for impairment on a fair value basis each fiscal quarter until the point at which the project is completed or terminates. If successfully completed, acquired in-process research and development will be amortized over its expected useful life.
Customer relationships: An intangible customer relationship asset was recognized to the extent that the Company was expected to benefit from future revenues reasonably anticipated given the history and operating practices of Microphone Product Line. The value assigned to customer relationships was determined using the incremental cash flow method. The fair value of customer relationships was capitalized as of the acquisition date and will be amortized using a straight-line method to sales and marketing expenses over the estimated remaining life.
Contingent consideration: The fair value of contingent consideration was derived from a probability weighted earn-out model of future contingent payments. The cash payments are expected to be made upon meeting the milestones. Potential valuation adjustments will be made to adjust the contingent consideration payments. These adjustments will be recorded in the statements of operations.
Fiscal year 2016
The Company acquired certain assets of Spirit Corp LLC and its affiliates involved in the development of navigation solutions in fiscal year 2016. The total cash consideration associated with the acquisition was approximately $7 million for which the purchase price was attributable to the acquired in-process research & development. The fair value of in-process research & development was determined using a cost approach, which includes an estimate of time and expenses required to recreate the intangible asset. The Company also will record approximately $1 million post-acquisition expense that may be payable in the future should certain specified milestones be met. This acquisition is not significant to the Company’s results of operations.
Fiscal year 2015
Movea S.A
On July 22, 2014, the Company acquired 100% equity interest of Movea S.A., a company formed under the laws of France (“Movea”), and a leading provider of software for ultra-low power location, activity tracking and context sensing. The acquisition of Movea further scales the Company’s leadership in motion software.
The Company paid $60.9 million in cash as consideration for the acquisition, and an additional $13.0 million in cash contingent upon the achievement of certain milestones within one year of the acquisition described below.
96
Table of Contents
InvenSense, Inc.
Notes to Consolidated Financial Statements—(Continued)
The table below is a summary of the preliminary purchase price allocation of the fair value of assets acquired and liabilities assumed in connection with the acquisition of Movea (in thousands):
| Cash consideration |
$ | 60,900 | ||
| Contingent consideration |
8,400 | |||
|
|
|
|||
| $ | 69,300 | |||
|
|
|
|||
| Allocation of purchase price: |
||||
| Current assets |
$ | 3,082 | ||
| Fixed assets |
209 | |||
| Other non-current assets |
592 | |||
| Developed technology |
7,200 | |||
| Goodwill |
68,330 | |||
| Current liabilities |
(5,016 | ) | ||
| Long-term liabilities |
(5,097 | ) | ||
|
|
|
|||
| Total preliminary purchase price |
$ | 69,300 | ||
|
|
|
The purchase price included $2.6 million of long-term debt which was included in the long-term liabilities. The debt was measured at fair value using the effective interest rate method which approximates carrying value as of April 3, 2016.
The purchase price includes contingent considerations of (i) $8.0 million payable in cash to the former Movea shareholders upon a design win with a major smartphone manufacturer within one year of closing date, and (ii) $5.0 million payable in cash to the former Movea shareholders upon a specific product development milestone before December 29, 2014. The fair value of the contingent consideration of $8.4 million was derived from a probability weighted earn-out model of future contingent payments and recorded in accrued liabilities. The product development milestone of $5.0 million was achieved and the payment was made in fiscal year 2015. The difference between the contractual amount of $5.0 million and the fair value of this contingent consideration was recorded in research and development expense for fiscal year 2015. In fiscal year 2016, the fair value of contingent consideration for Movea declined by $4.0 million. The decline in fair value was the result of a reduction in the probability of a design win milestone associated with the Movea acquisition from 50% to 0%. The decline in fair value of the design win milestones for Movea was recorded as a credit to research and development expense.
The purchase price exceeded the fair value of the net tangible and identifiable intangible assets acquired and, as a result, the Company recorded goodwill in connection with this transaction. The acquisition provides assembled workforce and synergy with other of the Company’s offerings. These factors primarily contributed to a purchase price that resulted in goodwill.
The following table presents certain information on acquired identifiable intangible assets related to the Movea acquisition:
| Estimated Fair Value (in thousands) |
Estimated Useful Life (in years) |
|||||||
| Developed technology |
$ | 7,200 | 5 | |||||
The fair value of developed technology was determined using a cost approach, which includes an estimate of time and expenses required to recreate the intangible asset. The fair value of developed technology was capitalized as of the acquisition date and is being amortized using a straight-line method to cost of revenue over the estimated useful life of five years.
97
Table of Contents
InvenSense, Inc.
Notes to Consolidated Financial Statements—(Continued)
Pro forma financial information
The unaudited pro forma combined financial information is for informational purposes only and does not purport to represent what the Company’s actual results would have been if the acquisition had been completed as of the date indicated above, or that may be achieved in the future. The unaudited pro forma combined supplemental information does not include the effects of any cost savings from operating efficiencies or synergies that may result from the acquisition.
The following unaudited pro forma financial information presents the combined results of operations of InvenSense and Movea as if the acquisition had occurred as of the beginning of fiscal year 2014:
| Fiscal Year | ||||||||
| 2015 | 2014 | |||||||
| (in thousands) | ||||||||
| Net revenue |
$ | 372,693 | $ | 255,709 | ||||
| Net income (loss) |
$ | (4,097 | ) | $ | (800 | ) | ||
Following the acquisition, sales of Movea products have been less than 10% of consolidated revenues for fiscal year 2016 and the eight months of fiscal year 2015.
Trusted Positioning, Inc.
On August 29, 2014, the Company completed the acquisition of Trusted Positioning, Inc., (“TPI”), a Canadian corporation, which is an indoor/outdoor positioning software company. The acquisition of TPI, particularly its advanced location tracking software, strengthens the Company’s position as a provider of intelligent sensor System on Chips (SoC) for the fast growing mobile market.
The Company’s acquisition of TPI was completed through a step acquisition. In fiscal year 2014, the Company made investments totaling $0.3 million to own approximately 4.57% of TPI’s outstanding common stock. On August 29, 2014, the Company purchased the remaining outstanding common stock of TPI for a total consideration of $25.9 million. The total purchase price, as presented in the table below, consists of (i) cash of $11.4 million, (ii) issuance of 236,000 shares of the Company’s common stock with a fair value of $5.7 million, (iii) contingent considerations with a combined fair value of $7.6 million payable upon TPI’s achievement of certain product development milestones, and (iv) initial investments with a fair value of $1.2 million.
98
Table of Contents
InvenSense, Inc.
Notes to Consolidated Financial Statements—(Continued)
The table below is a summary of the preliminary purchase price allocation for the 100% equity interest of the fair value of assets acquired and liabilities assumed in connection with the acquisition of TPI (in thousands):
| Cash consideration |
$ | 11,379 | ||
| Issuance of common stock |
5,703 | |||
| Contingent consideration |
7,634 | |||
| Fair value of previously held 4.57% equity interest |
1,215 | |||
|
|
|
|||
| $ | 25,931 | |||
|
|
|
|||
| Allocation of purchase price: |
||||
| Current assets |
$ | 392 | ||
| Fixed assets |
50 | |||
| Other non-current assets |
546 | |||
| Developed technology |
8,600 | |||
| Goodwill |
19,893 | |||
| Current liabilities |
(1,247 | ) | ||
| Long-term liabilities |
(2,303 | ) | ||
|
|
|
|||
| Total preliminary purchase price |
$ | 25,931 | ||
|
|
|
The purchase price includes contingent consideration comprised of (i) $5 million payable upon a design win within one year of acquisition, (ii) $3 million payable upon achieving a development milestone before December 29, 2014, (iii) $2 million payable upon successful development of cloud application within two years of acquisition and (iv) $2 million upon first deployment of cloud application which is expected within one year of successful development of cloud application. The contingent considerations, which was derived from a probability weighted earn-out model of future contingent payments, have a combined fair value of $7.6 million, of which $4.9 million was recorded in accrued liabilities and $2.7 million was recorded in other long-term liabilities. The development milestone of $3 million was achieved and the payment was made in fiscal year 2015. The difference between the contractual amount of $3.0 million and the fair value of this contingent consideration was recorded in the research and development expense for the year ended March 29, 2015.
In fiscal year 2016, the fair value of contingent consideration for TPI declined by $1.3 million. The decline in fair value was the result of a reduction in the probability of a design win associated with the TPI acquisition from 50% to 0%. The decline in fair value of the design win milestones for TPI was $2.4 million which was recorded as a credit to research and development expense. Offsetting this amount is an increase in the fair value of two TPI cloud application milestones as a result of an increase in the estimated probability of achievement of those milestones. The increase in the fair value of the cloud application milestones was $1.1 million which was recorded as a debit to research and development expense. A design milestone for TPI was achieved and the payment of $1.9 million was made in fiscal year 2016.
The following table presents certain information on acquired identifiable intangible assets related to the TPI acquisition:
| Estimated Fair Value (in thousands) |
Estimated Useful Life (in years) |
|||||||
| Developed technology |
$ | 8,600 | 5 | |||||
99
Table of Contents
InvenSense, Inc.
Notes to Consolidated Financial Statements—(Continued)
The fair value of developed technology was determined using a cost approach, which includes an estimate of time and expenses required to recreate the intangible asset. The fair value of developed technology was capitalized as of the acquisition date and will be amortized using a straight-line method to cost of revenue over the estimated useful life of five years.
In connection with the acquisition of TPI, the Company recorded a non-cash gain of approximately $0.9 million resulting from the difference between carrying value of its initial investments in TPI of $0.3 million and fair value of such investments of $1.2 million, as of the acquisition date. This non-cash gain is recorded in “Other income, net” on the Consolidated Statement of Operations in fiscal year 2015.
Fiscal year 2014
MEMS Microphone Business of Analog Devices, Inc.
In the third quarter of fiscal year 2014, the Company acquired certain assets relating to Analog Devices, Inc. (“ADI”) MEMS microphone business for a purchase price of $100 million in cash, of which the Company is entitled to certain contingent future expense reimbursements of approximately $2.2 million. The Company received reimbursements of $0.3 million and $1.4 million in fiscal years 2016 and 2015, respectively. As of April 3, 2016, the Company received the contingent expense reimbursements of $0.5 million. The Company also agreed to a contingent cash payment of up to $70.0 million payable upon the achievement of certain revenue performance targets within one year of the transaction close date. Due to a low probability of achieving and was not met the revenue targets, the fair value of the contingent consideration was estimated to be zero in the purchase price allocation described below. ADI licensed certain technology related to the MEMS microphone business to the Company on a royalty-free, worldwide basis, and provides certain transition services to the Company following the closing.
The strategic rationale for the acquisition was to accelerate the Company’s audio roadmap and complement its current MEMS System on Chip product offerings at existing mobile, gaming and wearable device customers, while gaining entry into new markets. The acquisition expands the Company’s patent portfolio and existing tier one customer base, which includes major OEM brands worldwide.
The allocation of the purchase price of the assets acquired and liabilities assumed based on their fair values was as follows:
| Total Amount | ||||
| (in thousands) | ||||
| Inventories |
$ | 5,107 | ||
| Property and equipment, net |
4,339 | |||
| Intangible assets: |
||||
| Developed technology |
28,520 | |||
| In-Process Research & Development |
7,330 | |||
| Customer Relationships |
1,560 | |||
| Goodwill |
50,952 | |||
|
|
|
|||
| Total assets acquired |
$ | 97,808 | ||
|
|
|
|||
| Total purchase price (net of $2.2 million of contingent expense reimbursements) |
97,808 | |||
|
|
|
|||
100
Table of Contents
InvenSense, Inc.
Notes to Consolidated Financial Statements—(Continued)
The fair value of intangible assets of $37.4 million has been allocated to the following three asset categories: 1) developed technology, 2) in-process research & development and 3) customer relationships. Developed technology and customer relationships are amortized on a straight line basis over the estimated useful life of the assets. The table below presents certain information on acquired identifiable intangible assets related to the ADI acquisition:
| Estimated Fair Value (in thousands) |
Estimated Useful Life (in years) | |||||
| Developed technology |
$ | 28,520 | 6 | |||
| Customer relationships |
$ | 1,560 | 7 | |||
| In-Process Research & Development |
$ | 7,330 | 3-5 | |||
Following the acquisition, sales of microphone products have been less than 10% of consolidated revenues for the five months ended March 30, 2014 and the twelve months ended March 29, 2015.
Pro forma information
The unaudited pro forma combined financial information is for informational purposes only and does not purport to represent what the Company’s actual results would have been if the acquisition had been completed as of the date indicated above, or that may be achieved in the future. The unaudited pro forma combined supplemental information does not include the effects of any cost savings from operating efficiencies or synergies that may result from the acquisition.
The following unaudited pro forma financial information presents the combined results of operations of InvenSense and ADI as if the acquisition had occurred as of the beginning of fiscal year 2014:
| Fiscal Year | ||||
| 2014 | ||||
| (in thousands) | ||||
| Net revenue |
$ | 276,592 | ||
| Net income (loss) |
$ | 4,051 | ||
| 9. | Goodwill and intangible assets |
The Company monitors the recoverability of goodwill recorded in connection with acquisitions annually, or whenever events or changes in circumstances indicate the carrying value may not be recoverable. There were no changes in the carrying amount of goodwill since March 29, 2015. The Company performed its annual impairment test during the quarter ended December 27, 2015 and determined that the $139.2 million goodwill was not impaired. As of April 3, 2016, no events or changes in circumstances indicate the carrying value may not be recoverable.
Purchased intangible assets subject to amortization consist primarily of developed technology, customer relationships and patents and are reported net of accumulated amortization. Developed technology, customer relationships and patents are amortized on a straight line basis over the estimated useful life of the assets. In-process research and development (“IPR&D”) is assessed for impairment until the development is completed and products are available for sale. In fiscal year 2015, the Company recorded $0.8 million of impairment on IPR&D on the MEMS Microphone business. In fiscal year 2016, one product from one of the IPR&D projects was released to production. The IPR&D value allocated to this project of $3.3 million was transferred to developed technology. The estimated useful life for this technology is five years. Another product from one of the IPR&D projects was also released to production in fiscal year 2016. The IPR&D value allocated to this project of $1.7 million was transferred to developed technology. The amortization of the product will start in the first
101
Table of Contents
InvenSense, Inc.
Notes to Consolidated Financial Statements—(Continued)
quarter of fiscal year 2017. The costs that the Company incurred on the IPR&D projects after the acquisition were expensed. The Company expects to complete the remaining IPR&D project during fiscal year 2017 at which time amortization will commence.
Amortization for purchased intangible assets for the years ended April 3, 2016, March 29, 2015 and March 30, 2014 was approximately $9.1 million, $7.0 million and $2.1 million, respectively.
The following table represents intangible assets and accumulated amortization:
| April 3, 2016 | ||||||||||||
| Gross | Accumulated Amortization |
Net | ||||||||||
| (in thousands) | ||||||||||||
| Developed technology |
$ | 49,310 | $ | 17,159 | $ | 32,151 | ||||||
| Customer relationships |
1,560 | 539 | 1,021 | |||||||||
| Patents |
2,120 | 443 | 1,677 | |||||||||
|
|
|
|
|
|
|
|||||||
| Total intangible assets subject to amortization |
$ | 52,990 | $ | 18,141 | $ | 34,849 | ||||||
|
|
|
|
|
|
|
|||||||
| March 29, 2015 | ||||||||||||
| Gross | Accumulated Amortization |
Net | ||||||||||
| (in thousands) | ||||||||||||
| Developed technology |
$ | 44,320 | $ | 8,697 | $ | 35,623 | ||||||
| Customer relationships |
1,560 | 316 | 1,244 | |||||||||
| Patents |
2,120 | 39 | 2,081 | |||||||||
|
|
|
|
|
|
|
|||||||
| Total intangible assets subject to amortization |
$ | 48,000 | $ | 9,052 | $ | 38,948 | ||||||
|
|
|
|
|
|
|
|||||||
The estimated future amortization expense related to intangible assets at April 3, 2016, is as follows:
| Fiscal Year |
Estimated Amortization (in thousands) |
|||
| 2017 |
9,500 | |||
| 2018 |
9,500 | |||
| 2019 |
9,500 | |||
| 2020 |
5,556 | |||
| 2021 |
793 | |||
|
|
|
|||
| Total |
$ | 34,849 | ||
|
|
|
|||
102
Table of Contents
InvenSense, Inc.
Notes to Consolidated Financial Statements—(Continued)
| 10. | Quarterly financial data (unaudited) |
| Fiscal Year 2016: | Three Months Ended | |||||||||||||||
| June 28, 2015 |
September 27, 2015 |
December 27, 2015 |
April 3, 2016 |
|||||||||||||
| Net revenue |
$ | 106,296 | $ | 112,545 | $ | 120,029 | $ | 79,525 | ||||||||
| Costs of revenue |
61,465 | 65,974 | 70,228 | 46,590 | ||||||||||||
|
|
|
|
|
|
|
|
|
|||||||||
| Gross profit |
44,831 | 46,571 | 49,801 | 32,935 | ||||||||||||
| Operating expenses: |
||||||||||||||||
| Research and development |
20,255 | 24,991 | 25,690 | 26,432 | ||||||||||||
| Selling, general and administrative |
15,824 | 15,186 | 14,295 | 16,860 | ||||||||||||
| Legal settlement |
11,708 | — | — | — | ||||||||||||
|
|
|
|
|
|
|
|
|
|||||||||
| Total operating expenses |
47,787 | 40,177 | 39,985 | 43,292 | ||||||||||||
|
|
|
|
|
|
|
|
|
|||||||||
| Income (loss) from operations |
(2,956 | ) | 6,394 | 9,816 | (10,357 | ) | ||||||||||
| Interest (expense) |
(2,724 | ) | (2,765 | ) | (2,798 | ) | (3,071 | ) | ||||||||
| Other income (expense), net |
61 | 104 | (35 | ) | 262 | |||||||||||
|
|
|
|
|
|
|
|
|
|||||||||
| Income (loss) before income taxes |
(5,619 | ) | 3,733 | 6,983 | (13,166 | ) | ||||||||||
| Income tax provision (benefit) |
228 | (1,960 | ) | 5,093 | 9,780 | |||||||||||
|
|
|
|
|
|
|
|
|
|||||||||
| Net income (loss) |
$ | (5,847 | ) | $ | 5,693 | $ | 1,890 | $ | (22,946 | ) | ||||||
|
|
|
|
|
|
|
|
|
|||||||||
| Net income (loss) per share of common stock: |
||||||||||||||||
| Basic |
$ | (0.06 | ) | $ | 0.06 | $ | 0.02 | $ | (0.25 | ) | ||||||
|
|
|
|
|
|
|
|
|
|||||||||
| Diluted |
$ | (0.06 | ) | $ | 0.06 | $ | 0.02 | $ | (0.25 | ) | ||||||
|
|
|
|
|
|
|
|
|
|||||||||
| Weighted average shares outstanding used in computing net income (loss) per share: |
||||||||||||||||
| Basic |
91,076 | 91,574 | 91,957 | 92,487 | ||||||||||||
|
|
|
|
|
|
|
|
|
|||||||||
| Diluted |
91,076 | 92,569 | 92,922 | 92,487 | ||||||||||||
|
|
|
|
|
|
|
|
|
|||||||||
Fiscal year 2016 was a 53-week fiscal year ended April 3, 2016. The extra week was included in our fourth fiscal quarter ended April 3, 2016.
103
Table of Contents
InvenSense, Inc.
Notes to Consolidated Financial Statements—(Continued)
| Fiscal Year 2015: | Three Months Ended | |||||||||||||||
| June 29, 2014 |
September 28, 2014 |
December 28, 2014 |
March 29, 2015 |
|||||||||||||
| Net revenue |
$ | 66,681 | $ | 90,195 | $ | 115,864 | $ | 99,279 | ||||||||
| Costs of revenue |
35,505 | 58,854 | 65,468 | 56,333 | ||||||||||||
|
|
|
|
|
|
|
|
|
|||||||||
| Gross profit |
31,176 | 31,341 | 50,396 | 42,946 | ||||||||||||
| Operating expenses: |
||||||||||||||||
| Research and development |
19,408 | 21,593 | 24,391 | 25,231 | ||||||||||||
| Selling, general and administrative |
13,918 | 14,592 | 15,551 | 15,325 | ||||||||||||
|
|
|
|
|
|
|
|
|
|||||||||
| Total operating expenses |
33,326 | 36,185 | 39,942 | 40,556 | ||||||||||||
|
|
|
|
|
|
|
|
|
|||||||||
| Income (loss) from operations |
(2,150 | ) | (4,844 | ) | 10,454 | 2,390 | ||||||||||
| Interest (expense) |
(2,584 | ) | (2,620 | ) | (2,690 | ) | (2,659 | ) | ||||||||
| Other income (expense), net |
181 | 1,199 | (281 | ) | 269 | |||||||||||
|
|
|
|
|
|
|
|
|
|||||||||
| Income (loss) before income taxes |
(4,553 | ) | (6,265 | ) | 7,483 | — | ||||||||||
| Income tax provision (benefit) |
279 | 603 | (2,738 | ) | (399 | ) | ||||||||||
|
|
|
|
|
|
|
|
|
|||||||||
| Net income (loss) |
$ | (4,832 | ) | $ | (6,868 | ) | $ | 10,221 | $ | 399 | ||||||
|
|
|
|
|
|
|
|
|
|||||||||
| Net income (loss) per share of common stock: |
||||||||||||||||
| Basic |
$ | (0.05 | ) | $ | (0.08 | ) | $ | 0.11 | $ | 0.00 | ||||||
|
|
|
|
|
|
|
|
|
|||||||||
| Diluted |
$ | (0.05 | ) | $ | (0.08 | ) | $ | 0.11 | $ | 0.00 | ||||||
|
|
|
|
|
|
|
|
|
|||||||||
| Weighted average shares outstanding used in computing net income (loss) per share: |
||||||||||||||||
| Basic |
88,302 | 88,997 | 89,779 | 90,359 | ||||||||||||
|
|
|
|
|
|
|
|
|
|||||||||
| Diluted |
88,302 | 88,997 | 92,336 | 92,619 | ||||||||||||
|
|
|
|
|
|
|
|
|
|||||||||
Fiscal year 2015 was a 52-week fiscal year ended March 29, 2015.
104
Table of Contents
Pursuant to the requirements of Section 13 or 15(d) of the Securities Exchange Act of 1934, the registrant has duly caused this report to be signed on its behalf by the undersigned, thereunto duly authorized.
| InvenSense, Inc. | ||||||
| Dated: May 25, 2016 | By: | /s/ Mark P. Dentinger | ||||
| Mark P. Dentinger | ||||||
| Chief Financial Officer (Duly Authorized Officer and Principal Financial Officer and Chief Accounting Officer) | ||||||
POWER OF ATTORNEY
KNOW ALL PERSONS BY THESE PRESENTS, that each person whose signature appears below constitutes and appoints Behrooz Abdi and Mark P. Dentinger his true and lawful attorney-in-fact and agent, with full power of substitution and, for him and in his name, place and stead, in any and all capacities to sign any and all amendments to this Annual Report on Form 10-K, and to file the same, with all exhibits thereto and other documents in connection therewith, with the Securities and Exchange Commission, granting unto said attorney-in-fact and agent full power and authority to do and perform each and every act and thing requisite and necessary to be done in connection therewith, as fully to all intents and purposes as he might or could do in person, hereby ratifying and confirming all that said attorney-in-fact and agent, or his substitute or substitutes, may lawfully do or cause to be done by virtue hereof.
Pursuant to the requirements of the Securities Act of 1934, as amended, this report has been signed by the following persons in the capacities and on the dates indicated.
| Dated: May 25, 2016 | By: | /s/ Behrooz Abdi | ||
| Behrooz Abdi | ||||
| Chief Executive Officer and Director | ||||
| (Principal Executive Officer) | ||||
| Dated: May 25, 2016 | By: | /s/ Mark P. Dentinger | ||
| Mark P. Dentinger | ||||
| Chief Financial Officer | ||||
| (Principal Financial and Principal Accounting Officer) | ||||
| Dated: May 25, 2016 | By: | /s/ Amir Faintuch | ||
| Amir Faintuch | ||||
| Director | ||||
| Dated: May 25, 2016 | By: | /s/ Usama Fayyad | ||
| Usama Fayyad | ||||
| Director | ||||
| Dated: May 25, 2016 | By: | /s/ Emiko Higashi | ||
| Emiko Higashi | ||||
| Director | ||||
105
Table of Contents
| Dated: May 25, 2016 | By: | /s/ Jon Olson | ||
| Jon Olson | ||||
| Director | ||||
| Dated: May 25, 2016 | By: | /s/ Amit Shah | ||
| Amit Shah | ||||
| Director | ||||
| Dated: May 25, 2016 | By: | /s/ Eric Stang | ||
| Eric Stang | ||||
| Director | ||||
| Dated: May 25, 2016 | By: | /s/ Yunbei “Ben” Yu, Ph.D | ||
| Yunbei “Ben” Yu, Ph.D | ||||
| Director | ||||
106
Table of Contents
INDEX TO EXHIBITS
TO
FORM 10-K ANNUAL REPORT
For the Year Ended
April 3, 2016
| Exhibit Number |
Exhibit Description |
Incorporated by Reference | ||||||||||||||||||
| Form | File No. | Exhibit | Filing Date | Filed Herewith | ||||||||||||||||
| 3.1 |
Form of Third Amended and Restated Certificate of Incorporation of InvenSense, Inc. | S-1 | 333-167843 | 3.5 | July 25, 2011 | |||||||||||||||
| 3.2 |
Form of Third Amended and Restated Bylaws of InvenSense, Inc. | S-1 | 333-167843 | 3.7 | July 25, 2011 | |||||||||||||||
| 4.1 |
Form of InvenSense, Inc.’s Common Stock Certificate. | S-1 | 333-167843 | 4.1 | July 25, 2011 | |||||||||||||||
| 4.2 |
Indenture, dated November 13, 2013, between InvenSense, Inc. and Wells Fargo Bank, National Association. | 8-K | 001-35269 | 4.1 | November 13, 2013 | |||||||||||||||
| 4.3 |
Form of 1.75% Convertible Senior Note due 2018 | 8-K | 001-35269 | 4.1 | November 13, 2013 | |||||||||||||||
| 10.1† |
InvenSense, Inc. 2004 Stock Incentive Plan, as amended and related documents. | S-1 | 333-167843 | 10.1 | June 28, 2010 | |||||||||||||||
| 10.2† |
InvenSense, Inc. 2011 Stock Incentive Plan and related documents. | S-1 | 333-167843 | 10.2 | July 25, 2011 | |||||||||||||||
| 10.3† |
Form of Indemnification Agreement by and between the Company and each of its directors. | S-1 | 333-167843 | 10.16 | July 25, 2011 | |||||||||||||||
| 10.4† |
Offer Letter, between the Company and Stephen Lloyd, dated November 13, 2008. | S-1 | 333-167843 | 10.8 | June 28, 2010 | |||||||||||||||
| 10.5† |
Offer Letter, between the Company and Daniel Goehl, dated October 28, 2004. | S-1 | 333-167843 | 10.9 | June 28, 2010 | |||||||||||||||
| 10.6† |
Compensation Agreement, between the Company and Jim Callas, dated January 18, 2011. | S-1 | 333-167843 | 10.12 | May 24, 2011 | |||||||||||||||
| 10.7† |
Offer Letter, between the Company and Jim Callas, dated August 20, 2010. | S-1 | 333-167843 | 10.12.1 | May 24, 2011 | |||||||||||||||
| 10.8† |
Employment Agreement, between the Company and Alan Krock, dated as of May 31, 2011. | S-1 | 333-167843 | 10.13 | July 25, 2011 | |||||||||||||||
| 10.9† |
Offer Letter between Mark P. Dentinger and the Company effective September 2, 2014 | 10-K | 001-35269 | 10.9 | May 28, 2015 | |||||||||||||||
| 10.1 |
Office Lease between the Company and CA The Concourse Limited Partnership dated May 16, 2013. | 10-Q | 001-35269 | 10.1 | August 9, 2013 | |||||||||||||||
| 10.11 |
Master Asset Purchase and Sale Agreement, dated as of October 14, 2013, by and between Analog Devices, Inc. and InvenSense, Inc. | 8-K | 001-35269 | 10.1 | October 18, 2013 | |||||||||||||||
| 10.12† |
Employment Agreement between the Company and Behrooz Abdi, dated October 23, 2012 | 8-K | 001-35269 | 10.1 | October 25, 2012 | |||||||||||||||
107
Table of Contents
| Exhibit Number |
Exhibit Description |
Incorporated by Reference | ||||||||||||||||||||
| Form | File No. | Exhibit | Filing Date | Filed Herewith | ||||||||||||||||||
| 10.13† |
Executive Change in Control and Severance Agreement between the Company and Behrooz Abdi, dated October 23, 2012 | 8-K | 001-35269 | 10.2 | October 25, 2012 | |||||||||||||||||
| 10.14† |
Separation Agreement and Release dated as of September 1, 2014, by the Company and Alan Krock | 8-K | 001-35269 | 10.1 | September 4, 2014 | |||||||||||||||||
| 10.15† |
Form of Executive Change in Control and Severance Agreement | 8-K | 001-35269 | 10.1 | May 21, 2014 | |||||||||||||||||
| 10.16 |
Purchase Agreement, dated November 6, 2013, between InvenSense, Inc. and Goldman, Sachs & Co., as initial purchaser. | 8-K | 001-35269 | 10.1 | November 13, 2013 | |||||||||||||||||
| 10.17 |
Form of Convertible Bond Hedge Confirmation. | 8-K | 001-35269 | 10.2 | November 13, 2013 | |||||||||||||||||
| 10.18 |
Form of Warrant Confirmation. | 8-K | 001-35269 | 10.3 | November 13, 2013 | |||||||||||||||||
| 10.19† |
InvenSense, Inc. 2013 Employee Stock Purchase Plan, as amended on September 9, 2015. | 8-K | 001-35269 | 10.1 | September 15, 2015 | |||||||||||||||||
| 21.1 |
Subsidiary List. | X | ||||||||||||||||||||
| 23.1 |
Consent of Deloitte & Touche LLP. | X | ||||||||||||||||||||
| 24.1 |
Power of Attorney (included on signature page). | X | ||||||||||||||||||||
| 31.1 |
Certification of the Principal Executive Officer Pursuant to Section 302 of the Sarbanes-Oxley Act | X | ||||||||||||||||||||
| 31.2 |
Certification of the Principal Financial Officer Pursuant to Section 302 of the Sarbanes-Oxley Act | X | ||||||||||||||||||||
| 32.1 |
Certification of the Principal Executive Officer and Principal Financial Officer Pursuant to Section 906 of the Sarbanes-Oxley Act | X | ||||||||||||||||||||
| 101.INS |
XBRL Instance Document | X | ||||||||||||||||||||
| 101.SCH |
XBRL Taxonomy Extension Schema | X | ||||||||||||||||||||
| 101.CAL |
XBRL Taxonomy Extension Calculation Linkbase | X | ||||||||||||||||||||
| 101.DEF |
XBRL Taxonomy Extension Definition Linkbase | X | ||||||||||||||||||||
| 101.LAB |
XBRL Taxonomy Extension Label Linkbase | X | ||||||||||||||||||||
| 101.PRE |
XBRL Taxonomy Extension Presentation Linkbase | X | ||||||||||||||||||||
| † | Indicates a management contract or compensatory plan or arrangement. |
108