Attached files
| file | filename |
|---|---|
| EX-31.1 - EXHIBIT 31.1 - LOGITECH INTERNATIONAL S.A. | exhibit31110k-2016.htm |
| EX-32.1 - EXHIBIT 32.1 - LOGITECH INTERNATIONAL S.A. | exhibit32110k-2016.htm |
| EX-31.2 - EXHIBIT 31.2 - LOGITECH INTERNATIONAL S.A. | exhibit31210k-2016.htm |
| EX-23.1.2 - EXHIBIT 23.1.2 - LOGITECH INTERNATIONAL S.A. | exhibit231210k-2016.htm |
| EX-23.1.1 - EXHIBIT 23.1.1 - LOGITECH INTERNATIONAL S.A. | exhibit231110k-2016.htm |
| EX-21.1 - EXHIBIT 21.1 - LOGITECH INTERNATIONAL S.A. | exhibit21110k-2016.htm |
| EX-10.32 - EXHIBIT 10.32 - LOGITECH INTERNATIONAL S.A. | exhibit103210k-2016.htm |
| EX-10.31 - EXHIBIT 10.31 - LOGITECH INTERNATIONAL S.A. | exhibit103110k-2016.htm |
| EX-2.2 - EXHIBIT 2.2 - LOGITECH INTERNATIONAL S.A. | exhibit2210k-2016.htm |
UNITED STATES
SECURITIES AND EXCHANGE COMMISSION
Washington, D.C. 20549
FORM 10-K
ý | ANNUAL REPORT PURSUANT TO SECTION 13 OR 15(d) OF THE SECURITIES EXCHANGE ACT OF 1934 | |
For the fiscal year ended March 31, 2016 | ||
or | ||
o | TRANSITION REPORT PURSUANT TO SECTION 13 OR 15(d) OF THE SECURITIES EXCHANGE ACT OF 1934 | |
For the Transition Period from to | ||
Commission File Number: 0-29174
LOGITECH INTERNATIONAL S.A.
(Exact name of registrant as specified in its charter)
Canton of Vaud, Switzerland (State or other jurisdiction of incorporation or organization) | None (I.R.S. Employer Identification No.) | |
Logitech International S.A.
Apples, Switzerland
c/o Logitech Inc.
7700 Gateway Boulevard
Newark, California 94560
(Address of principal executive offices and zip code)
(510) 795-8500
(Registrant's telephone number, including area code)
Securities registered pursuant to Section 12(b) of the Act:
Title of each class | Name of each exchange on which registered | |
Registered Shares par value CHF 0.25 per share | The NASDAQ Global Select Market; SIX Swiss Exchange | |
Securities registered or to be registered pursuant to Section 12(g) of the Act: None
Indicate by check mark if the registrant is a well-known seasoned issuer, as defined in Rule 405 of the Securities Act. Yes ý No o
Indicate by check mark if the registrant is not required to file reports pursuant to Section 13 or Section 15(d) of the Act. Yes o No ý
Indicate by check mark whether the registrant (1) has filed all reports required to be filed by Section 13 or 15(d) of the Securities Exchange Act of 1934 during the preceding 12 months (or for such shorter period that the registrant was required to file such reports), and (2) has been subject to such filing requirements for the past 90 days. Yes ý No o
Indicate by check mark whether the registrant has submitted electronically and posted on its corporate Web site, if any, every Interactive Data file required to be submitted and posted pursuant to Rule 405 of Regulation S-T during the preceding 12 months (or for such shorter period that the registrant was required to submit and post such files). Yes ý No o
Indicate by check mark if disclosure of delinquent filers pursuant to Item 405 of Regulation S-K (§229.405 of this chapter) is not contained herein, and will not be contained, to the best of the registrant's knowledge, in definitive proxy or information statements incorporated by reference in Part III of this Form 10-K or any amendment to this Form 10-K. ý
Indicate by check mark whether the registrant is a large accelerated filer, an accelerated filer, a non-accelerated filer or a smaller reporting company. See the definitions of "large accelerated filer," "accelerated filer" and "smaller reporting company" in Rule 12b-2 of the Exchange Act.
Large accelerated filer ý | Accelerated filer o | Non-accelerated filer o (Do not check if a smaller reporting company) | Smaller reporting company o | |||
Indicate by check mark whether the registrant is a shell company (as defined in Rule 12b-2 of the Act). Yes o No ý
The aggregate market value of the voting shares held by non-affiliates of the registrant, based upon the closing sale price of the shares on September 25, 2015, the last business day of the registrant's second fiscal quarter on the NASDAQ Global Select Market, was $1,665,196,761. For purposes of this disclosure, voting shares held by persons known to the Registrant to beneficially own more than 5% of the Registrant's shares and shares held by officers and directors of the Registrant have been excluded because such persons may be deemed to be affiliates. This determination is not necessarily a conclusive determination for other purposes.
As of May 6, 2016, there were 161,748,881 shares of the Registrant's share capital outstanding.
DOCUMENTS INCORPORATED BY REFERENCE
Portions of the registrant's Proxy Statement for the 2016 Annual Meeting of Shareholders are incorporated herein by reference in Part III of this Annual Report on Form 10-K to the extent stated herein. Such proxy statement will be filed with the Securities and Exchange Commission within 120 days of the registrant's fiscal year ended March 31, 2016.
TABLE OF CONTENTS
Page | ||
Part I | ||
Part II | ||
Part III | ||
Part IV | ||
In this document, unless otherwise indicated, references to the "Company" or "Logitech" are to Logitech International S.A., its consolidated subsidiaries and predecessor entities. Unless otherwise specified, all references to U.S. Dollar, Dollar or $ are to the United States Dollar, the legal currency of the United States of America. All references to CHF are to the Swiss Franc, the legal currency of Switzerland.
Logitech, the Logitech logo, and the Logitech products referred to herein are either the trademarks or the registered trademarks of Logitech. All other trademarks are the property of their respective owners.
The Company's fiscal year ends on March 31. Interim quarters are thirteen-week periods, each ending on a Friday of each quarter. For purposes of presentation, the Company has indicated its quarterly periods ending on the last day of the calendar quarter.
Logitech International S.A. | Fiscal 2016 Form 10-K | 1
FORWARD-LOOKING INFORMATION
This Annual Report on Form 10-K contains "forward-looking statements" within the meaning of the Private Securities Litigation Reform Act of 1995. Forward-looking statements are based on beliefs of our management as of the filing date of this Annual Form 10-K. These forward-looking statements include, among other things, statements related to:
• | Our strategy for growth, future revenues, earnings, cash flow, uses of cash and other measures of financial performance, and market position; |
• | Our business strategy and investment priorities in relation to competitive offerings and evolving consumer demand trends affecting our products and markets, worldwide economic and capital market conditions, fluctuations in currency exchange rates, and current and future general regional economic conditions for fiscal year 2017 and beyond; |
• | The scope, nature or impact of acquisition, strategic alliance and divestiture activities; |
• | Our business and product plans and development and product innovation and their impact on future operating results and anticipated operating costs for fiscal year 2017 and beyond; |
• | Market opportunities and our ability to take advantage of them; |
• | Capital investments and research and development; |
• | Our expectations regarding our share buyback and dividend programs; |
• | The sufficiency of our cash and cash equivalents, cash generated from operations, and available borrowings under our bank lines of credit to fund capital expenditures and working capital needs; and |
• | The effects of changes in tax, environmental and other laws and regulations in the United States and other countries in which we operate. |
Forward-looking statements also include, among others, those statements including the words "anticipate", "believe", "could", "estimate", "expect", "forecast", "intend", "may", "plan", "project", "predict", "should", "will" and similar language. These statements reflect our views and assumptions as of the date of this Annual Report on Form 10-K. All forward-looking statements involve risks and uncertainties that could cause our actual performance to differ materially from those anticipated in the forward-looking statements depending on a variety of factors. Important information as to these factors can be found in this Annual Report on Form 10-K under the headings of “Management’s Discussion and Analysis of Financial Condition and Results of Operations”, “Overview”, “Critical Accounting Estimates” and “Liquidity and Capital Resources”, among others. Factors that might cause or contribute to such differences include, but are not limited to, those discussed under Item 1A, Risk Factors, as well as elsewhere in this Annual Report on Form 10-K and in our other filings with the U.S. Securities and Exchange Commission, or "SEC." You are cautioned not to place undue reliance on the forward-looking statements, which speak only as of the date of this Annual Report on Form 10-K. We undertake no obligation to publicly release any revisions to the forward-looking statements or reflect events or circumstances after the date of this document.
Logitech International S.A. | Fiscal 2016 Form 10-K | 2
PART I
ITEM 1. BUSINESS
Company Overview
Logitech is a world leader in designing products that have an everyday place in people's lives, connecting them to the digital experiences they care about. Over 30 years ago Logitech started connecting people through computers, and now it’s designing products that bring people together through music, gaming, video and computing.
Logitech was founded in Switzerland in 1981, and Logitech International S.A. has been the parent holding company of Logitech since 1988. Logitech International S.A. is a Swiss holding company with its registered office in Apples, Switzerland, which conducts its business through subsidiaries in Americas (including North and South America), EMEA (Europe, Middle East, Africa) and Asia Pacific (including, among other countries, China, Taiwan, Japan and Australia). Shares of Logitech International S.A. are listed on both the SIX Swiss Exchange, under the trading symbol LOGN, and the Nasdaq Global Select Market, under the trading symbol LOGI. References in this Annual Report on Form 10-K to the "Company," "Logitech," "we," "our," and "us" refer to Logitech International S.A. and its consolidated subsidiaries.
Logitech designs, manufactures and markets products that allow people to connect through music, gaming, video, computing, and other digital platforms. Our products participate in five large markets that all have growth potential:
• | Music: This market is comprised of both wired and wireless devices that capitalize on the rapid growth of streaming music. Products in this category include mobile speakers, wearables, and headsets connecting to all music services used on both PCs and mobile devices. |
• | Gaming: The Gaming market includes products designed for the PCs and consoles as well as gaming devices designed to deliver experiences such as virtual and augmented reality. The rapid rise of eSports, and the promise of new implementations in virtual and augmented reality present growth opportunities in this market. Our products in Gaming include gaming mice and keyboards, gaming headsets, gamepads and steering wheels. |
• | Video Collaboration: Video Collaboration is focused on delivering solutions that enable real-time video, audio and content sharing capability to businesses and individuals. With the rapid adoption of cloud-based solutions that can lower the cost of adoption, our devices and solutions enable the rapid deployment of these cloud-based services through our platform agnostic, and easy to use end points and peripherals. |
• | Home: The connected home is a market in its early stages of formation and growth. The push to realize the vision of the internet-of-things is delivering more and more connected devices that populate our homes, from the more traditionally connected devices like set-top boxes and digital entertainment devices to things like appliances, lighting, door locks and thermostats. We have a foundation for growth in this market through our entertainment control capabilities in devices such as our Harmony products. |
• | Creativity and Productivity: This market is defined by products that enhance the users’ experiences associated with computing platforms. With ever increasing connectivity globally and the consistent growth in time spent by people on these computing platforms, we believe there are meaningful growth opportunities for our products. Our continued innovation in navigation, input and content creation on these platforms can drive growth in this market despite the secular decline of new PC sales. Pointing Devices, Keyboards & Combos, Tablet & Other Accessories, and PC Webcams comprise our product categories that address this market. |
We sell our products to a broad network of domestic and international customers, including direct sales to retailers, e-tailers, and indirect sales through distributors. Our worldwide retail network includes consumer electronics distributors, retailers, mass merchandisers, specialty electronics stores, computer and telecommunications stores, value-added resellers and online merchants.
In fiscal years prior to fiscal year 2016, we had two segments: Peripherals, including retail and OEM products; and Lifesize Video Conferencing. During fiscal year 2016, we divested the Lifesize Video Conferencing segment, and exited the OEM business. Our financial results treat the Lifesize segment as discontinued operations for all the periods presented in this Annual Report on Form 10-K. As a result, sales of products through our retail channels represented 96%, 94% and 93% of our net sales for the fiscal years 2016, 2015 and 2014, respectively.
Logitech International S.A. | Fiscal 2016 Form 10-K | 3
Recent Developments
On April 20, 2016, we acquired Jaybird LLC of Salt Lake City, Utah, ("Jaybird") for approximately $50 million in cash, with an additional earn-out of up to $45 million based on achievement of growth targets over two years. Jaybird is a leader in wireless audio wearables for sports and active lifestyles, and the acquisition of Jaybird expands our long-term growth potential in our Music market.
On December 28, 2015, we and Lifesize, Inc., a wholly owned subsidiary of Logitech that held the assets of our Lifesize video conferencing reportable segment ("Lifesize"), entered into a stock purchase agreement with entities associated with three venture capital firms, or the Venture Investors. Immediately following the December 28, 2015 closing of the transaction, the Venture Investors held 62.5% of the outstanding shares of Lifesize, which resulted in a divestiture of the Lifesize video conferencing business by us. The historical results of operations and the financial position of Lifesize are included in the consolidated financial statements of Logitech and are reported as discontinued operations within this Annual Report on Form 10-K.
We exited our OEM business during our fiscal quarter ended December 31, 2015. The results of our OEM business are included in our financial statements as part of continuing operations for the nine months ended December 31, 2015 and prior periods. There is no revenue or cost associated with our OEM business in the three months ended March 31, 2016 and we do not expect any such revenue or cost in future periods.
Industry Overview
Historically, Logitech's business has been driven by the same trends that drove the adoption of desktop and laptop PCs for consumers, businesses and institutional applications, including the growth in affordable processing power, communications bandwidth, the increased accessibility of digital content, and the growing and pervasive use of the Internet for productivity, communication and entertainment. These trends have created opportunities for new applications, new users and dramatically richer interaction between people and digital content.
In the last several years, the PC market has changed dramatically and there continues to be weakness in the global market for new PCs. Traditionally, the trends in the PC market have dictated sales in our PC-related categories however the aging installed base is creating new opportunities for users to refresh their computing experience with new peripherals. The gaming platform continues to show strong growth as online gaming and multi-platform experiences gain greater popularity. Our Video Collaboration business shows growth with the proliferation of meeting rooms yet to be enabled with HD videoconferencing capabilities.
The decline in shipments of new desktop PCs, combined with the increased interest in smaller, touch-interfaced mobile computing devices (such as smartphones and tablets) has rapidly changed the market for PC peripherals. The installed base of PC users is large in our traditional mature markets (the United States, Canada, Western and Nordic Europe, Japan and Australia), but we believe consumer demand for new PCs will continue to decline in future years. We do see nonetheless, some opportunities created by consumer desire to refresh their old PC with new peripherals and in new trends developing within the PC and mobile computing markets.
As the PC market declined, there has been growth in the popularity of smaller, mobile computing devices, such as tablets and smartphones with touch interfaces, which have created new markets and usage models for mobile peripherals and accessories. Logitech offers peripherals and accessories to enhance the use of such digital platforms. For today's consumers, listening to music is a popular entertainment activity, fueled by the growth in smartphones, tablets, music services and internet radio. Consumers are optimizing their audio experiences on their tablets and smartphones with wireless mobile speakers that pair easily with their mobile devices and with in-ear and other headphones. Our mobile speakers and in-ear headphone products target a large and growing market that reflects the increasing popularity of mobile devices for accessing digital music. Additionally, within the music market, consumers are increasingly listening to wireless earphones while they undertake other activities such as athletics. Consumers are also enhancing their tablet experience with a range of keyboards and cases that enable them to create, consume and do more with their tablets conveniently and comfortably.
The use of video across multiple platforms—PCs, laptops and mobile devices such as tablets and smartphones—is a continuing trend. The video communication industry continues to make progress towards a vision in which people can conduct a video call from any of these platforms to any other platform. The market opportunity to provide innovative, affordable, and easy to use video collaboration products to the millions of small to medium sized meeting rooms lacking video is substantial, and we are well-positioned to take advantage of it.
Logitech International S.A. | Fiscal 2016 Form 10-K | 4
The trend among businesses and institutions to embrace cloud video conferencing is driving our Video Collaboration category, and offers a long-term growth opportunity for Logitech. For businesses and institutions, video conferencing is increasingly substituted for travel, because of high travel costs as well as the productivity gain that can be achieved by a high-quality face-to-face meeting that does not require travel away from the office. Further, with the increased availability of higher Internet bandwidth, video conferencing is becoming a key component of Unified Communications, which is the integration of communications solutions such as voicemail, e-mail, chat, presentation sharing and live video meetings.
The home is also an important place for technological development, particularly as increasing amounts of objects become connected smart home devices such as light bulbs, security locks, thermostats etc. Logitech’s line of universal remote controls control electronic devices around the home as well as these other smart devices.
Finally, we believe that trends established in consumer technology, such as brand identity, affordability, ease of installation and use, customer support, and design, have become important aspects of the purchase decision when buying a consumer electronics product. These are strengths that we believe Logitech offers in both consumer and enterprise markets.
Business Strategy
Logitech's foundation for future growth is built on:
•Powerful design - design experiences that transcend their functional value and are loved by people;
•Revitalized product creation for existing and new categories;
•Augment a winning, talented and passionate global team;
•Outstanding execution and operational excellence; and
•Delivering operating leverage to improve profitability and to create the capacity to invest in growth.
We are focusing our investments in product categories with growth opportunities in which we can leverage our areas of expertise, competitive advantages and technology.
Our product development process and responsiveness to consumers have become faster. We laid the foundation in fiscal year 2014 for building a design company that leverages technology, innovation and consumer insights. We are continuing to build on this foundation by making design a more integral part of our product development with the goals of creating fewer but more impactful products while increasing consumer satisfaction.
We continually review our product offerings and our strategic direction in light of our profitability targets, competitive conditions, changing consumer trends, and the evolving nature of the interface between the consumer and the digital world. We continue to evaluate and phase out products as part of our ongoing efforts to strengthen our overall portfolio.
Our turnaround strategy, which we originally outlined in May 2013, has been a success to date and we continue to transform Logitech into a simpler, faster, growing company. We are focused on design and innovation driving a diverse portfolio of brands and product categories that will deliver both growth and profitability. In addition to exiting our OEM business and divesting our Lifesize video conferencing business, we continue to streamline our overall cost structure through product, overhead and infrastructure cost reductions. The savings from all these actions will be used to offset currency headwinds and invest in future growth.
Product Strategy
To take advantage of the opportunities we anticipate in the growing digital marketplace, Logitech's product strategy focuses on enabling and enhancing the multiple interfaces for input, navigation, audio and video across the many digital devices used by today's consumers and enterprises in our five large market opportunities.
Music
Logitech has a solid foundation of audio solutions designed to satisfy consumers' needs for music consumption sourced from a variety of platforms. Our music solutions are focused primarily on Mobile Speakers, including our UE BOOM family of mobile wireless speakers, our Jaybird wireless audio wearables for sports and active lifestyles, and our custom in-ear headphones. We enhance our mobile speakers with related applications that
Logitech International S.A. | Fiscal 2016 Form 10-K | 5
allow consumers to control the speakers through their mobile devices, including features such as Double Up and Block Party to combine two or more speakers with double or stereo sound.
Gaming
Our Gaming strategy is to leverage our deep research and development (R&D) expertise in the areas of PC peripherals and gaming devices to build the most advanced gaming gear on the market. We develop our software development kits, intelligent illumination, G-Key Macros and Arx Control application to better integrate our products with games and provide gamers with differentiated experiences that enhance gameplay. In addition, we sponsor and work closely with eSports athletes to enhance our brand and the quality and functionality of our gaming products.
Video Collaboration
The market opportunity to provide innovative, affordable, and easy to use video collaboration products to the millions of meeting rooms lacking video (especially so-called huddle rooms), is substantial, and we are well positioned to take advantage of it. Over the past year, we have built momentum with our award winning ConferenceCam family that provides all-in-one video and audio conferencing solutions, including Logitech GROUP, CONNECT, and the CC3000e.
Home
Logitech's Harmony brand is well recognized as the leader in programmable, performance remote controls for home entertainment, leveraging our proprietary database. We built on this expertise in remote controls and our Harmony brand to develop devices to control the digital home, and Harmony products are now being used by many consumers to control a broad range of their connected home devices. We believe this provides a strong foundation to expand beyond the remote control category and create entirely new product categories dedicated to the smart home.
Creativity and Productivity
PC/Mac Accessories
Logitech continues to provide new, innovative, high-performance PC and Mac computer navigation devices and audio and video products for the large installed base of PC and Mac computers for the consumer and enterprise markets.
Tablet & Other Accessories
We are focusing on innovating new features and products to provide excellent consumer experience, and on reducing product cycle time to address the evolving market demand and frequent introductions of new devices. We have developed a range of products for the tablet market, for both Apple and Android platforms. We believe there will be additional opportunities for complementary peripherals to enhance consumers' experiences with tablets and other mobile devices.
Design and Technological Innovation
Logitech seeks to fulfill the increasing demand for interfaces between people and the expanding digital world across multiple platforms and user environments. The interface evolves as platforms, user models and our target markets evolve. As access to digital information has expanded, we have extended our focus beyond the PC to other entry and control points to the internet and digital world, including mobile devices and the meeting room. All of these platforms require interfaces that are customized according to how the devices are used. We believe this expansion of access points provides additional attractive opportunities for Logitech because the relevance and importance of navigation, interaction, video and audio interfaces and applications remain substantially the same across platforms.
We recognize that continued investment in product research and development is critical to facilitate innovation of new and improved products and technologies. These products have been earning prestigious design awards and enthusiastic reviews in the media - more than 70 design awards over the past three years. This is an important indication that Logitech’s strategic aim to become a design company is working. During the fourth quarter of fiscal year 2016 alone, we won five GOOD DESIGN awards, eight iF Design awards and a record for us, nine Red Dot awards. Our research and development expenses for fiscal years 2016, 2015 and 2014 were $113.6 million, $108.3
Logitech International S.A. | Fiscal 2016 Form 10-K | 6
million and $112.4 million, respectively. We expect to continue to devote significant resources to research and development, including devices for digital platforms, video communications, wireless technologies, power management, user interfaces and device database management to sustain our competitive position.
Logitech is committed to meeting consumer needs for peripheral devices and other kinds of accessories, and believes that design, innovation, value and product quality are important elements in gaining market acceptance and strengthening our market position.
Products
Logitech designs, manufactures and markets products that allow people to connect through music, gaming, video, computing, and other digital platforms. The large majority of our revenues have historically been derived from sales of our products for use by consumers.
Our brand, portfolio management, product definition and engineering teams are responsible for product strategy, technological innovation and development, and for bringing our products to market. Our marketing team is responsible for supporting the Logitech brand, social media, and digital marketing. Our design team provides creative leadership, consumer insights, design direction and management from concept exploration to product and experience execution.
Music
Mobile Speakers: Our Mobile Speakers category comprises of portable wireless Bluetooth speakers. Our top revenue-generating product during fiscal year 2016 was UE BOOM 2, the 360° portable bluetooth wireless speaker that provides bold, immersive sound in every direction. The UE BOOM 2 was a key driver for success in this product category along with the UE MEGABOOM, a 360° portable, waterproof, bluetooth wireless speaker with more bass that is a larger and more powerful complement to UE BOOM 2 and was one of our best selling products in fiscal year 2016. We also offer the UE Roll, the UE Mini Boom and UE Pro.
Audio-PC & Wearables: category comprises PC speakers, PC headsets, in-ear headphones and premium wireless audio wearables designed to enhance the audio experience. We offer both the Jaybird wireless audio wearable for sports and active lifestyles and our custom in-ear headphones.
Gaming
Logitech offers a full range of dedicated gaming gear for gamers, including mice, keyboards, headsets, gamepads and steering wheels. Some of our products in this category include:
• | The Logitech G810 Orion Spectrum Mechanical Gaming Keyboard, features Romer-G switches, intelligent RGB illumination, and a wide range of options to customize colors and profiles. |
• | The Logitech G933 Wireless Gaming Headset, offers high-performance 7.1 channel Dolby and DTS surround sound, a lag-free 2.4 GHz wireless connection, and three customizable G keys for one-touch command over music, chat, lighting and other features. |
• | The Logitech G900 Chaos Spectrum Gaming Mouse, features professional grade wireless technology, an advanced optical gaming sensor, a flexible ambidextrous design, and customizable lighting, for maximum performance and comfort over long gameplay sessions. |
• | The Logitech G920 Driving Force Steering Wheel, features a powerful dual-motor force feedback transmission, hand-stitched leather-wrapped rim, and stainless steel throttle, brake and clutch pedals for an ultra-realistic driving experience. |
Video Collaboration
The Video Collaboration category includes Logitech’s ConferenceCams, which combine enterprise-quality audio and HD 1080p video with affordability to bring video conferencing to business of any size. Our key products in this category include:
• | The recently launched Logitech ConferenceCam Group offers best-in-class videoconferencing with HD 1080p video and professional audio that easily turns medium to large sized conference rooms into video-enabled collaboration rooms. |
• | The Logitech ConferenceCam Connect is a portable, all-in-one video conference solution with HD 1080p video, and professional audio designed for huddle rooms. |
Logitech International S.A. | Fiscal 2016 Form 10-K | 7
Home
Our Smart Home category includes our Harmony line of advanced home entertainment controllers and new products dedicated to controlling emerging categories of connected smart home devices such as lighting, thermostats, door locks, etc. Examples include:
• | The Logitech Harmony Elite and the Logitech Harmony Companion, both of which feature Logitech's Harmony Hub and Harmony Smartphone App to complete control of the home entertainment system including Bluetooth and IP devices such as PS4 and Roku as well as connected home devices such as Philips Hue lights and Nest thermostats. |
• | The Logitech Harmony 350, 650 and 950 remotes, offer infrared (IR) only control of home entertainment devices. |
Creativity and Productivity
Pointing devices: Logitech offers a variety of pointing devices, sold through retail channels. Some of our key products in this category include:
• | The Logitech MX Master Wireless mouse is our flagship wireless mouse that is the new paradigm for precise, fast, comfortable computer navigation. |
• | The Logitech Wireless Mouse M325 offers micro-precise scrolling with a feel-good, contoured design. |
• | The Logitech Wireless Mouse M185 is a wireless mouse with nano receiver technology that is compatible with any computer. |
Keyboards & Combos: Logitech offers a variety of corded and cordless keyboards, living room keyboards, and combos (keyboard-and-mouse combinations). Some of our products in this category include:
• | The Logitech Wireless Touch Keyboard K400 Plus is a compact keyboard with an integrated touchpad and 10-meter wireless range, designed for use in the living room. |
• | The Logitech Combo MK270 offers a wireless compact mouse and keyboard with nano technology. |
• | The Logitech Combo MK520 is a sleek full size keyboard and mouse combination with unifying receiver. |
Tablet & Other Accessories: Our Tablet & Other Accessories category includes keyboards and covers for tablets and smartphones as well as other accessories for mobile devices, mostly iPads but also for select Samsung tablets. We expect to continue to enhance this category through the introduction of additional innovative and complementary products. Some of our products in this category include:
• | The Logitech CREATE Backlit Keyboard Case with Smart Connector for iPad Pro 12.9-inch provides thin and light front and back protection, full size 19 mm keys, and adjustable backlighting. |
• | The Logitech Type-S, a keyboard case for the Samsung Galaxy Tab A 9.7, Samsung Galaxy Tab. |
• | The Logitech Keys-To-Go, an ultra-portable, stand-alone keyboard. |
PC Webcams: Our PC Webcams category comprises of PC-based webcams targeted primarily at consumers. Our top revenue-generating webcams during fiscal year 2016 was the Logitech HD Pro Webcam C920, which offers razor-sharp HD 1080p video recordings and stereo sound.
Competitive Strengths
We believe the key competitive strengths that enable Logitech to achieve success are:
• | Our innovation capability, including understanding of product development, technology and industrial design excellence as an emerging strength, eight of our products have been selected as 2016 iF DESIGN AWARD Winners, in addition to our patent portfolio of over 670 patents. |
• | Our expertise in key engineering disciplines that underlie our products, and our continued enhancement of our products through the use of advanced technologies. |
• | Our designs have an everyday place in people's lives, connecting them to the digital experiences they care about. |
• | The Logitech and Ultimate Ears (UE) brand names are recognized worldwide as symbols of product quality, innovation, ease of use and price-performance value. Our recently acquired Jaybird brand is a leader in wireless audio wearables for sports and active lifestyles. |
• | Our hybrid model of in-house manufacturing and third-party contract manufacturers, which allows us to effectively respond to rapidly changing demand and leverage economies of scale. |
Logitech International S.A. | Fiscal 2016 Form 10-K | 8
• | Our supply chain's extensive global reach, key distribution and strategic business relationships combined with extensive analytic modeling expertise, optimization tools and global processes. |
• | Our global presence, capable of drawing on the strengths of our global resources, global distribution system and geographic revenue mix. |
• | Our expertise in developing products for broad array of platforms gear such as PC, Mac, and Apple and Android mobile devices. |
• | Our extensive retail and e-tail presence across consumer electronics, mass merchandisers and office infrastructures. |
We believe that we have competed successfully based on these factors. We believe that Logitech's future lies with our ability to continue to capitalize on these strengths.
Marketing and Design
Logitech's Design and Marketing team strives to understand consumers so that we can innovate, create and deliver amazing design to our users at each and every touch point of the consumer experience with the Logitech and UE brands and products.
We believe that by creating products that people desire and love, we maximize the number of consumers who actively buy and recommend Logitech products, fueling brand preference within and across our many product categories.
We are making good progress building a strong internal Design and Marketing team, while partnering with world renowned design agencies to further our “design-led” approach to product development and launch. Our key design centers are in Switzerland, Ireland, the United States, and Taiwan.
Sales and Distribution
Principal Markets
Net sales to unaffiliated customers by geographic region for fiscal years 2016, 2015 and 2014 (based on the customers' location) are as follows (in thousands):
Year Ended March 31, | ||||||||||||
2016 | 2015 | 2014 | ||||||||||
Americas | $ | 881,379 | $ | 864,761 | $ | 799,431 | ||||||
EMEA | 645,694 | 670,890 | 724,671 | |||||||||
Asia Pacific | 491,027 | 469,257 | 483,926 | |||||||||
$ | 2,018,100 | $ | 2,004,908 | $ | 2,008,028 | |||||||
Revenues from sales to customers in Switzerland, our home domicile, represented 2% of our total consolidated net sales in each of fiscal years 2016, 2015 and 2014. In fiscal years 2016, 2015 and 2014, the United States represented 38%, 36% and 34% of our total consolidated net sales, respectively. No other single country represented more than 10% of our total consolidated net sales for fiscal years 2016, 2015 or 2014.
Sales and Distribution
Our sales and marketing activities are organized into three geographic regions: Americas (North and South America), EMEA (Europe, Middle East, Africa) and Asia Pacific (China, Japan, Australia, Taiwan, India and other countries).
We primarily sell our products to a network of distributors and retailers. We support these channels with third-party distribution centers located in North America, Europe and Asia Pacific. Some of these distribution centers perform product localization with local language manuals, packaging and power plugs.
Logitech directly sells products to distributors and large retailers. Distributors in North America include Ingram Micro, Tech Data Corporation, D&H Distributing, and Synnex Corporation. In Europe, pan-European distributors include Ingram Micro, Tech Data, and Gem Distribution. We also sell to many regional distributors such as Actebis GmbH in Germany and Copaco Dc B.V. in the Netherlands. In Asia, major distributors include Beijing Digital China Limited in China, Daiwabo in Japan, and the pan-Asian distributor, Ingram Micro. Our distributor customers typically resell products to retailers, value-added resellers, systems integrators and other distributors with whom Logitech does not have a direct relationship.
Logitech International S.A. | Fiscal 2016 Form 10-K | 9
In fiscal years 2016, 2015 and 2014, Ingram Micro Inc. and its affiliated entities together accounted 14%, 15% and 15% of our net sales, respectively. In fiscal year 2016 Amazon Inc. and its affiliated entities together accounted for 10% of our net sales. No other customer individually accounted for more than 10% of our net sales during fiscal years 2016, 2015 or 2014. The material terms of our distribution agreements with Ingram Micro and its affiliated entities are summarized as follows:
• | The agreements are non-exclusive in the particular territory and contain no minimum purchase requirements. |
• | Each agreement may be terminated for convenience at any time by either party. Most agreements provide for termination on 30 days written notice from either party, with two Ingram Micro agreements providing for termination on 90 days notice. |
• | We generally offer an allowance for marketing activities equal to a negotiated percentage of sales and volume rebates related to purchase volumes or sales of specific products to specified retailers. These terms vary by agreement. |
• | Most agreements allow price protection credits to be issued for on-hand or in-transit new inventory if we, in our sole discretion, lower the price of the product. |
• | We grant limited stock rotation return rights, which vary by agreement. |
The material terms of our distribution agreements with Amazon and its affiliated entities are summarized as follows:
• | Each agreement has a one year term followed by one year automatic renewals. |
• | We generally offer an allowance for marketing activities equal to a negotiated percentage of sales through transactions and additional rebates related to sales of specific products to end users. These terms vary by agreement. |
• | Most agreements allow price protection credits to be issued for on-hand or in-transit new inventory if we, in our sole discretion, lower the price of the product. |
• | We grant limited stock rotation return rights, which vary by agreement. |
Logitech's products can be purchased in most major retail chains, where we typically have access to significant shelf space. These chains in the U.S. include Best Buy, Wal-Mart, Staples, Office Depot and Target. In Europe, chains include Metro Group (Media-Saturn Group), Carrefour Group, Kesa Electricals, Fnac, and Dixons Stores Group PLC. Logitech products can also be purchased online either directly from Logitech.com or through e-tailers, such as Amazon.com, the websites of our major retail chains noted previously, and others. Logitech products are also carried by business-to-business direct market resellers such as CDW, Insight, Zones, PC Connection, and SHI.
Through our operating subsidiaries, we maintain sales offices or sales representatives in approximately 43 countries.
Backlog
We typically have a relatively small amount of orders at the end of our fiscal periods that we have received but have not shipped, which is referred to as backlog. In our experience, the amount of backlog at any particular fiscal period-end is not a meaningful indication of our future business prospects.
Customer Service and Technical Support
Our customer service organization provides user technical support, support related to product inquiry, and order support. We support these customer service functions with an outsourced operation that has support centers located in the Philippines, Mexico, and Northern Ireland.
Logitech maintains customer service and technical support capabilities in the United States, Canada, Europe, and the Asia Pacific region. Customer service and technical personnel provide support services to retail purchasers of products through telephone, e-mail, forums, chat, facsimile and the Logitech Web site. Logitech provides warranties on our branded products that range from one to three years.
In Korea, India and China, there are multiple locations where consumers may obtain service for their Logitech products. These locations are managed by a third party logistics provider. Consumers who have purchased Logitech products can visit these locations for product inspection, and return or exchange of products. Within China, there is also a mail-in center to provide these services for more remote locations in China.
Logitech International S.A. | Fiscal 2016 Form 10-K | 10
Manufacturing
Logitech's manufacturing operations consist principally of final assembly and testing. Since 1994, we have had our own manufacturing operations in Suzhou, China, which currently handles approximately half of our total production of products. We continue to focus on ensuring the efficiency of the Suzhou facilities, through the implementation of quality management, automation, process improvements, and employee involvement programs. We outsource the remaining production to contract manufacturers and original design manufacturers located in Asia. Both our in-house and outsourced manufacturing operations are managed by our worldwide operations group. The worldwide operations group also supports the business units and marketing and sales organizations through management of distribution centers, the supply chain, and the provision of technical support, and other services.
New product launches, process engineering, commodities management, logistics, quality assurance, operations management and management of Logitech's contract manufacturers occur in Hsinchu, Taiwan, Malaysia, Suzhou, China, Shenzhen, China and Hong Kong, China. Certain components are manufactured to Logitech's specifications by vendors in Asia, the United States and Europe. We also use contract manufacturers to supplement internal capacity and to reduce volatility in production volumes. In addition, some products, including most keyboards, certain gaming devices, certain audio products are manufactured by third-party suppliers to Logitech's specifications. Retail product localization with local language manuals, packaging, and power plugs may be performed at distribution centers in North America, Europe and Asia Pacific.
Our hybrid model of in-house manufacturing and third-party contract manufacturers allows us to effectively respond to rapidly changing demand and leverage economies of scale. Through our high-volume manufacturing operations located in Suzhou, China, we believe we have been able to maintain strong quality process controls and have realized significant cost efficiencies. Our Suzhou operation provides for increased production capacity, manufacturing know-how, IP protection and greater flexibility in responding to product demand. Further, by outsourcing the manufacturing of certain products, we seek to reduce volatility in production volumes as well as improve time to market.
Competition
Our product categories are characterized by large, well-financed competitors, short product life cycles, continual performance enhancements, and rapid adoption of technological and product advancements by competitors in our retail markets. We have experienced aggressive price competition and other promotional activities from our primary competitors and from less-established brands, including brands owned by some retail customers known as house brands. We may also encounter more competition if any of our competitors in one or more categories decide to enter other categories in which we currently operate.
As we target opportunities in new categories and markets, we are confronting new competitors, many of which may have more experience in the categories or markets and have greater marketing resources and brand name recognition than we have. In addition, because of the continuing convergence of the markets for computing devices and consumer electronics, we expect greater competition in the future from well-established consumer electronics companies in our developing categories, as well as future ones we might enter. Many of these companies have greater financial, technical, sales, marketing and other resources than we have.
We expect continued competitive pressure in our business, including in the terms and conditions that our competitors offer customers, which may be more favorable than our terms and conditions, and may require us to take actions to increase our customer incentive programs, which could impact our revenues and operating margins.
Music
Mobile Speakers: Our competitors for Bluetooth wireless speakers include Bose, JBL, Harman Kardon, and Beats. Bose is our largest competitor. Apple's ownership of Beats may impact our access to shelf space in Apple retail stores and adversely impact our ability to succeed in this important growth market. Personal assistance and other devices that offer music, such as Amazon's Echo, may also compete with our products. Amazon is also a significant distributor for our products.
Audio-PC & Wearables: In the PC speakers business, our competitors include Bose, Cyber Acoustics, Phillips and Creative Labs, Inc. In the PC headset business, our main competitors include Plantronics and Altec Lansing. In-ear headphones competitors include Skull Candy, Sennheiser, Sony, Beats, and others.
Gaming
Competitors for our Gaming products include Razer USA Ltd., SteelSeries, and Turtle Beach.
Logitech International S.A. | Fiscal 2016 Form 10-K | 11
Video Collaboration
Our competitors for Video Collaboration products include Cisco Systems, Inc., Polycom, Inc., and Avaya, Inc.
Home
• | Direct competitors in the remote control market include pro-installer-focused Universal Remote Control Inc., and new “DIY” entrants from Savant Systems and Ray Enterprises. Indirect competition exists in the form of low-end “replacement remotes” such as Sony, RCA, GE, pure app-based solutions such as Peel, as well as device and/or subscriber-specific solutions from TV makers such as Samsung and Vizio and multiple-system operator (MSOs) such as Comcast and DirecTV. |
• | Competition in the home control market exists in form of home automation platforms such as Smart Things (owned by Samsung), Amazon with their Echo product, Nest (owned by Google), Wink and many other startups in the space. Many of these products and brands are partners with Logitech as well via integrations with Harmony remotes. |
Creativity and Productivity
Pointing Devices: Microsoft Corporation and Hewlett Packard are our main competitors. We also experience competition and pricing pressure from less-established brands, including house brands, which we believe have impacted our market share in some sales geographies.
Keyboards & Combos: Microsoft Corporation, Hewlett Packard and Apple Inc. are our main competitors in our PC mice and keyboard product lines. We also experience competition and pricing pressure for corded and cordless mice and combos from less-established brands, including house brands.
Tablet & Other Accessories: Competitors in the tablet case market include Apple, Otter, Speck and a large number of small brands. Competitors in the tablet keyboard market are Zagg, Kensington, Belkin, Targus and other less-established brands. Although we are the leaders in the tablet keyboard market and continue to bring innovative offerings to the market, we expect the competition may increase.
PC Webcams: Our primary competitors for PC webcams are Microsoft Corporation and Hewlett Packard.
Intellectual Property and Proprietary Rights
Intellectual property rights that apply to Logitech's products and services include patents, trademarks, copyrights and trade secrets.
We hold various United States patents and pending applications, together with corresponding patents and pending applications from other countries. While we believe that patent protection is important, we also believe that patents are of less competitive significance than factors such as technological expertise and innovation, ease of use, and quality design. No single patent is in itself essential to Logitech as a whole. From time to time we receive claims that we may be infringing on patents or other intellectual property rights of others. As appropriate, claims are referred to counsel, and current claims are in various stages of evaluation and negotiation. If necessary or desirable, we may seek licenses for certain intellectual property rights. Refer also to the discussion in Item 1A, Risk Factors—"We may be unable to protect our proprietary rights. Unauthorized use of our technology may result in the development of products that compete with our products." and "Claims by others that we infringe their proprietary technology could adversely affect our business."
To distinguish genuine Logitech products from competing products and counterfeit products, Logitech has used, registered, or applied to register certain trademarks and trade names in the U.S. and in other countries and jurisdictions. Logitech enforces its trademark and trade name rights in the U.S. and in other countries. In addition, the software for Logitech's products and services is entitled to copyright protection, and we generally require our customers to obtain a software license before providing them with that software. We also protect details about our products and services as trade secrets through employee training, license and non-disclosure agreements, technical measures and other reasonable efforts to preserve confidentiality.
Environmental Regulation
We are subject to laws and regulations in many jurisdictions regulating the materials used in our products and, increasingly, product-related energy consumption, and the recycling of our products, batteries and packaging.
Logitech International S.A. | Fiscal 2016 Form 10-K | 12
Europe. In Europe we are subject to the European Union's (EU's) RoHS (Restriction of Use of Certain Hazardous Substances in Electrical and Electronics Equipment) Directive 2011/65/EU, or RoHS 2. This directive restricts the placement into the EU market of electrical and electronic equipment containing certain hazardous materials including lead, mercury, cadmium, chromium, and halogenated flame-retardants. All Logitech products are covered by the directive and have been modified, if necessary, to be RoHS 2 compliant. Logitech has an active program to ensure compliance with the RoHS 2 directive and to ensure RoHS 2 compliant components and manufacturing methods in order to comply with the requirements of the directive including issuing of a declaration of conformity and marking the product with the 'CE' mark.
Logitech is also subject to the EU's ErP (Energy-related Products) Directive, which aims to encourage manufacturers and importers to produce products designed to minimize overall environmental impact. Under the Directive, manufacturers must ensure that their energy-related products comply with applicable requirements, issue a declaration of conformity and mark the product with the 'CE' mark. The Directive does not have binding requirements for specific products, but does define conditions and criteria for setting, through subsequent implementing measures, requirements regarding environmentally relevant product characteristics. To date the following implementing measures within the ErP Directive are active and applicable to Logitech products:
• | 1275/2008: Eco-design requirements for standby and off mode electric power consumption of electrical and electronic household and office equipment. |
• | 278/2009: Eco-design requirements for no-load condition power consumption and average active efficiency of external power supplies. |
Logitech has assessed the applicability of implementing these measures on relevant product lines and has taken steps to ensure that our products meet the requirements. Adoption of the ErP Directive will be aligned in all EU member states, and we expect conformity will be demonstrated by Logitech in conjunction with current CE conformity marking requirements. Similar requirements exist in the four member states of the European Free Trade Association (Iceland, Norway, Liechtenstein and Switzerland). Such requirements are substantially met by compliance with the ErP Directive.
We are also subject to a number of EOL (End of Life) Stewardship directives including the EU's WEEE (Waste Electrical and Electronic Equipment) Directive, the EU Packaging Directive and the EU Battery Directive, which require producers of electrical goods, packaging and batteries to be financially responsible for costs of specified collection, recycling, treatment and disposal of covered products. Where applicable, we have provided for the estimated costs, which are not material, of managing and recycling historical and future waste equipment, packaging and batteries. Logitech has also assessed the applicability of the European REACH Directive (Regulation (EC) No. 1907/2006 for Registration, Evaluation, Authorization, and Restrictions of Chemicals). Logitech is not subject to aspects of this Directive which relate to chemical substance import and control due to our current manufacturing structure. The aspect of this Directive that relates to product content does impact Logitech, and we have taken steps to ensure that all substances of very high concern (on a list of candidate substances for authorization that is published on the EU Agency-Web site) present in products above a concentration limit are eliminated in subsequent product designs or notified per the Directive requirements. Additions to this list of candidate substances are reviewed on a regular basis to give consideration to any updates to the substances of very high concern (SVHC) list performed by the relevant EU agency.
China. In China we are subject to China's law on Management Methods on the Control of Pollution Caused by Electronic Information Products (China RoHS). This is substantially similar to the EU RoHS Directive, and as such, Logitech products are already compliant. China RoHS requires additional labeling of product that will be shipped in China and Logitech has taken steps to help ensure we comply with these requirements.
United States and Canada. In the U.S., we are subject to, among other laws, Appliance Efficiency Regulations adopted via the U.S. Energy Independence and Security Act of 2007. The regulations set out standards for the energy consumption performance of products within the scope of the regulations, which includes some of Logitech's products. The standards apply to appliances sold or offered for sale throughout the U.S., and Logitech has redesigned or changed products to comply with these regulations. We are also subject to California's Proposition 65, which requires that clear and reasonable warnings be given to consumers who are exposed to certain chemicals deemed by the state of California to be dangerous.
Logitech is also subject to the requirement as set out by the Dodd-Frank Wall Street Reform and Consumer Protection Act of 2010, specifically Section 1502, which addresses the use of "Conflict Minerals" in the supply chain. We have established systems which facilitate our compliance with the sourcing and traceability obligations and the reporting requirements of this Act aligned with guidelines published by the Securities and Exchange Commission.
Logitech International S.A. | Fiscal 2016 Form 10-K | 13
As an EICC (Electronic Industry Citizenship Coalition) member, Logitech is participating in the industry-wide Conflict Free Sourcing Initiative and its Conflict Free Smelter Program by which these requirements will be met.
In addition, the Transparency in Supply Chain Act of 2010 (S.B. 657) is effective from Logitech's fiscal year 2012. The law requires all retailers and manufacturers of tangible products who do business in California and have annual worldwide gross receipts exceeding $100 million to disclose on their company websites their efforts to combat forced labor and human trafficking in their own supply chains. Logitech's disclosure is posted on our Web site, www.logitech.com.
In Canada and the United States, we are subject to laws in various Canadian provinces and U.S. states that impose fees to cover the cost of end of life responsible disposal and recycling of packaging, product and batteries. These laws require producers of electrical goods, packaging and batteries to be financially responsible for costs of specified collection, recycling, treatment and disposal of covered products. Where applicable, we have provided for the estimated costs, which are not material, of managing and recycling historical and future waste equipment, packaging and batteries.
Australia and New Zealand. In Australia and New Zealand, we are subject to the MEPS (Minimum Energy Performance Standards) regulations. These regulations set out standards for the energy consumption performance of products within the scope of the regulations, which includes some of Logitech's products. We have taken steps to modify products to ensure they are in compliance with MEPS.
We expect further laws governing product and packaging recycling to be introduced in other jurisdictions, many or most of which could impose fees to cover recycling costs, the cumulative impact of which could be significant. If such legislation is enacted in other countries, Logitech intends to develop compliance programs as necessary. However, until that time, we are not able to estimate any possible impact.
The effects on Logitech's business of complying with other government regulations are limited to the cost of agency fees and testing, as well as the time required to obtain agency approvals. There are also stewardship costs associated with the end of life collection, recycling and recovery of Logitech products, packaging and batteries where Logitech is recognized as the steward and participates in relevant programs. The costs and schedule requirements are industry requirements and therefore do not represent an undue burden relative to Logitech's competitive position. As regulations change, we will modify our products or processes to address those changes.
Seasonality
Our product sales are typically seasonal. Sales are generally highest during our third fiscal quarter (October to December) primarily due to the increased demand for our products during the year-end holiday buying season. Due to the timing of our new product introductions, we believe that year-over-year comparisons are more indicative of variability in our results of operations than current quarter to prior quarter comparisons.
Materials
We purchase certain products and key components used in our products from a limited number of sources. If the supply of these products or key components, such as micro-controllers and optical sensors, were to be delayed or constrained, or if one or more of our single-source suppliers goes out of business, we might be unable to find a new supplier on acceptable terms, or at all, and our shipments to our customers could be delayed. In addition, lead times for materials, components and products ordered by us or by our contract manufacturers can vary significantly and depend on factors such as contract terms, demand for a component, our ability to forecast product demand, and supplier capacity. From time to time, we have experienced component shortages and extended lead times on semiconductors, such as micro-controllers and optical sensors, and base metals used in our products. Shortages or interruptions in the supply of components or subcontracted products, or our inability to procure these components or products from alternate sources at acceptable prices in a timely manner, could delay shipment of our products or increase our production costs.
Employees
As of March 31, 2016 we employed approximately 5,900 regular employees, of which approximately 3,250 employees are in our Suzhou manufacturing facility, and from the remaining 2,650 regular employees, approximately 600 are dedicated to research and development. None of Logitech's U.S. employees are represented by a labor union or are subject to a collective bargaining agreement. Certain other countries, such as China, provide by law for employee rights, which include requirements similar to collective bargaining agreements. We believe that our employee relations are good.
Logitech International S.A. | Fiscal 2016 Form 10-K | 14
Executive Officers of the Registrant
The following sets forth certain information regarding our executive officers as of March 31, 2016:
Name | Age | Nationality | Position | |||
Guerrino De Luca | 63 | Italian and U.S. | Executive Chairman of the Board | |||
Bracken Darrell | 53 | U.S. | President and Chief Executive Officer | |||
Vincent Pilette | 44 | Belgian | Chief Financial Officer | |||
Marcel Stolk | 48 | Dutch | Sr. Vice President, Consumer Computing Platforms Business Group | |||
L. Joseph Sullivan | 62 | U.S. | Sr. Vice President, Worldwide Operations | |||
Guerrino De Luca has served as Chairman of the Logitech Board of Directors since 2008. Mr. De Luca served as Chief Executive Officer from April 2012 to January 2013 and acting President and Logitech's Chief Executive Officer from July 2011 to April 2012. Previously, Mr. De Luca served as Logitech's President and Chief Executive Officer from February 1998, when he joined the Company, to January 2008. He has been an executive member of the Board of Directors since June 1998. Prior to joining Logitech, Mr. De Luca served as Executive Vice President of Worldwide Marketing for Apple Computer, Inc., a consumer electronics and computer company, from February 1997 to September 1997, and as President of Claris Corporation, a U.S. personal computing software vendor, from May 1994 to February 1997. Prior to joining Claris, Mr. De Luca held various positions with Apple in the United States and in Europe. Mr. De Luca holds a Laurea degree in Electronic Engineering from the University of Rome, Italy.
Bracken Darrell joined Logitech as President in April 2012 and became Chief Executive Officer in January 2013. Prior to joining Logitech, Mr. Darrell served as President of Whirlpool EMEA and Executive Vice President of Whirlpool Corporation, a home appliance manufacturer and marketing company, from January 2009 to March 2012. Previously, Mr. Darrell had been Senior Vice President, Operations of Whirlpool EMEA from May 2008 to January 2009. From 2002 to May 2008, Mr. Darrell was with P&G (The Procter & Gamble Company), a consumer brand company, most recently as the President of its Braun GmbH subsidiary. Prior to rejoining P&G in 2002, Mr. Darrell served in various executive and managerial positions with General Electric Company from 1997 to 2002, with P&G from 1991 to 1997, and with PepsiCo Inc. from 1987 to 1989. Mr. Darrell holds a BA degree from Hendrix College and an MBA from Harvard University.
Vincent Pilette joined Logitech in September 2013 as Chief Financial Officer. Prior to joining Logitech, Mr. Pilette served as Chief Financial Officer of Electronics for Imaging, Inc., a digital printing innovation and solutions company, from January 2011 through August 2013. From January 2009 through December 2010, he served as Vice President of Finance for the Enterprise Server, Storage and Networking Group at Hewlett-Packard Company ("HP"). Prior to this role, Mr. Pilette served as Vice President of Finance for the HP Software Group from December 2005 through December 2008. Mr. Pilette held various other finance positions at HP, in the U.S and Europe, Middle East and Africa, since joining HP in 1997. Mr. Pilette holds an MS in Engineering and Business from Université Catholique de Louvain in Belgium and an MBA from Kellogg School of Management at Northwestern University.
Marcel Stolk joined Logitech in March 2011 as Vice President, Sales and Marketing EMEA and Executive Managing Director EMEA, and was appointed Senior Vice President, Consumer Computing Platforms Business Group in January 2013. Previously, Mr. Stolk was the Senior Vice President, Worldwide Sales and Marketing at Logitech, from March 2001 to October 2005, and held a number of positions within the sales and marketing functions at Logitech from 1991 to 2001. Prior to rejoining Logitech in 2011, he was the Chief Executive Officer of SourceTag BV, a software company for unique tagging of Cloud-based data, from September 2010 to March 2011. Mr. Stolk has also been the founder and Chief Executive Officer of Adoria Investments BV, a private equity company, from October 2005 to July 2010, and he remains the sole owner. Before joining Logitech in 1991, Mr. Stolk held various sales and product marketing positions at Aashima Technology BV, a provider of PC components and accessories, in the Netherlands. Mr. Stolk studied at Utrecht in the Netherlands and has participated in university-level executive courses, including an executive training course at Stanford University.
L. Joseph Sullivan joined Logitech in October 2005 as Vice President, Operations Strategy, and was appointed Senior Vice President, Worldwide Operations in April 2006. Prior to joining Logitech, Mr. Sullivan was Vice President of Operational Excellence and Quality for Carrier Corporation, a subsidiary of United Technologies, from 2001 to 2005. Previously, he was with ACCO Brands, Inc. in engineering and manufacturing management roles from 1998
Logitech International S.A. | Fiscal 2016 Form 10-K | 15
to 2001. Mr. Sullivan holds a BS degree in Marketing Management and an MBA degree in Operations Management from Suffolk University in Massachusetts.
Available Information
Our Investor Relations Web site is located at http://ir.logitech.com. We post and maintain an archive of our earnings and other press releases, current reports, annual and quarterly reports, earnings release schedule, information regarding annual general meetings, further information on corporate governance, and other information regarding the Company on the Investor Relations Web site. The information we post includes filings we make with the U.S. Securities and Exchange Commission (SEC), including reports on Forms 10-K, 10-Q, 8-K, our proxy statement related to our annual shareholders' meeting and any amendments to those reports or statements filed or furnished pursuant to U.S. securities laws or Swiss laws. All such filings and information are available free of charge on the Web site, and we make them available on the Web site as soon as reasonably possible after we file or furnish them with the SEC. The contents of these Web sites are not intended to be incorporated by reference into this report or in any other report or document we file and our references to these Web sites are intended to be inactive textual references only.
In addition, Logitech publishes press releases upon occurrence of significant events within Logitech. Shareholders and members of the public may elect to receive e-mails when Logitech issues press releases upon occurrence of significant events within Logitech or other press releases by subscribing through http://ir.logitech.com/alerts.cfm.
As a Swiss company traded on the SIX Swiss Exchange, and as a company subject to the provisions of Section 16 of the Securities Exchange Act of 1934, as amended, we file reports on transactions in Logitech securities by members of Logitech's Board of Directors and executive officers. The reports that we file with the Securities and Exchange Commission on Forms 3, 4 and 5, along with our other SEC filings, may be accessed on our Web site or on the Securities and Exchange Commission's Web site at http://www.sec.gov, and the reports we file that are published by the SIX Swiss Exchange may be accessed at: http://www.six-exchange-regulation.com/obligations/management_transactions_en.html.
ITEM 1A. RISK FACTORS
Our operating results are difficult to predict and fluctuations in results may cause volatility in the price of our shares.
Our revenues and profitability are difficult to predict due to the nature of the markets in which we compete, fluctuating user demand, the uncertainty of current and future global economic conditions, and for many other reasons, including the following:
• | Our operating results are highly dependent on the volume and timing of orders received during the quarter, which are difficult to forecast. Customers generally order on an as-needed basis and we typically do not obtain firm, long-term purchase commitments from our customers. As a result, our revenues in any quarter depend primarily on orders booked and shipped in that quarter. |
• | A significant portion of our quarterly retail sales typically occurs in the last weeks of each quarter, further increasing the difficulty in predicting quarterly revenues and profitability. |
• | Our sales are impacted by consumer demand and current and future global economic conditions, and can therefore fluctuate abruptly and significantly during periods of uncertain economic conditions or geographic distress, as well as from shifts in distributor inventory practices and consumer buying patterns. |
• | We must incur a large portion of our costs in advance of sales orders, because we must plan research and production, order components, buy tooling equipment, and enter into development, sales and marketing, and other operating commitments prior to obtaining firm commitments from our customers. This makes it difficult for us to rapidly adjust our costs during the quarter in response to a revenue shortfall, which could adversely affect our operating results. |
• | In the first quarter of fiscal year 2016 we had substantially completed the implementation of our turnaround strategy that began in fiscal year 2013. As part of our turnaround strategy, we have attempted to simplify our organization, to reduce operating costs through expense reduction and global workforce reductions, to reduce the complexity of our product portfolio, and to better align costs with our current business as we |
Logitech International S.A. | Fiscal 2016 Form 10-K | 16
attempt to expand from PC accessories to growth opportunities in accessories and other products for music, gaming, video collaboration, digital home, mobile devices and other product categories. We may not achieve the cost savings or other anticipated benefits from these efforts, and such efforts may cause our operating results to fluctuate from quarter to quarter, making our results difficult to predict.
• | Fluctuations in currency exchange rates can impact our revenues, expenses and profitability because we report our financial statements in U.S. Dollars, whereas a significant portion of our revenues and expenses are in other currencies. We attempt to adjust product prices over time to offset the impact of currency movements. However, over short periods of time, during periods of weakness in consumer spending or given high levels of competition in many product categories, our ability to change local currency prices to offset the impact of currency fluctuations is limited. |
Because our operating results are difficult to predict, our results may be below the expectations of financial analysts and investors, which could cause the price of our shares to decline.
If we fail to innovate and develop new products in a timely and cost-effective manner for our new and existing product categories, our business and operating results could be adversely affected.
Our product categories are characterized by short product life cycles, frequent new product introductions, rapidly changing technology, dynamic consumer demand and evolving industry standards. As a result, we must continually innovate in our new and existing product categories, introduce new products and technologies, and enhance existing products in order to remain competitive.
The success of our product portfolio depends on several factors, including our ability to:
•Identify new features, functionality and opportunities;
•Anticipate technology, market trends and consumer preferences;
• | Develop innovative, high-quality, and reliable new products and enhancements in a cost-effective and timely manner; |
•Distinguish our products from those of our competitors; and
•Offer our products at prices and on terms that are attractive to our customers and consumers.
If we do not execute on these factors successfully, products that we introduce or technologies or standards that we adopt may not gain widespread commercial acceptance, and our business and operating results could suffer. In addition, if we do not continue to differentiate our products through distinctive, technologically advanced features, designs, and services that are appealing to our customers and consumers, as well as continue to build and strengthen our brand recognition and our access to distribution channels, our business could be adversely affected.
The development of new products and services is very difficult and requires high levels of innovation. The development process is also lengthy and costly. There are significant initial expenditures for research and development, tooling, manufacturing processes, inventory and marketing, and we may not be able to recover those investments. If we fail to accurately anticipate technological trends or our users’ needs or preferences, are unable to complete the development of products and services in a cost-effective and timely fashion or are unable to appropriately increase production to fulfill customer demand, we will be unable to successfully introduce new products and services into the market or compete with other providers. Even if we complete the development of our new products and services in a cost-effective and timely manner, they may be not competitive with products developed by others, they may not achieve acceptance in the market at anticipated levels or at all, they may not be profitable or, even if they are profitable, they may not achieve margins as high as our expectations or as high as the margins we have achieved historically.
As we introduce new or enhanced products, integrate new technology into new or existing products, or reduce the overall number of products offered, we face risks including, among other things, disruption in customers’ ordering patterns, excessive levels of new and existing product inventories, revenue deterioration in our existing product lines, insufficient supplies of new products to meet customers’ demand, possible product and technology defects, and a potentially different sales and support environment. Premature announcements or leaks of new
Logitech International S.A. | Fiscal 2016 Form 10-K | 17
products, features or technologies may exacerbate some of these risks by reducing the effectiveness of our product launches, reducing sales volumes of current products due to anticipated future products, making it more difficult to compete, shortening the period of differentiation based on our product innovation, straining relationships with our partners or increasing market expectations for the results of our new products before we have had an opportunity to demonstrate the market viability of the products. Our failure to manage the transition to new products or the integration of new technology into new or existing products could adversely affect our business, results of operations, operating cash flows and financial condition.
We believe sales of PCs will continue to decline, and that our future growth will depend on our diversified product growth opportunities beyond the PC, and if we do not successfully execute on our growth opportunities, if our growth opportunities are more limited than we expect or if our sales of PC peripherals are less than we expect, our operating results could be adversely affected.
We have historically targeted peripherals for the PC platform. Consumer demand for PCs, especially in our traditional, mature markets such as North America, Western and Nordic Europe, Japan and Australia, has been declining and we expect it to continue to decline in the future. As a result, consumer demand for PC peripherals in many of our markets is slowing and in some cases declining and we expect this trend may continue.
Our sales of PC peripherals might be less than we expect due to a decline in business or economic conditions in one or more of the countries or regions, a greater decline than we expect in demand for our products, our inability to successfully execute our sales and marketing plans, or for other reasons. Global economic concerns, such as the varying pace of global economic recovery, the impact of sovereign debt issues in Europe, the impact of low oil prices on Russia and conflicts with either local or global financial implications in places such as Russia and Ukraine, and economy slowdown in China, create unpredictability and add risk to our future outlook.
As a result, we are focusing more of our attention, which may include the personnel, financial resources, and management attention on product innovations and growth opportunities, including products for the consumption of digital music, products for gaming, products for video collaboration, products for the digital home, and on other potential growth opportunities. Our investments may not result in the growth we expect, or when we expect it, for a variety of reasons including those described below.
Music. We are focused on products for the consumption of digital music as a continued sales growth area. For example, we recently acquired Jaybird to expand into the wireless audio wearables market. Competition in the mobile speaker and audio wearables categories is intense, and we expect it to increase. If we are not able to grow our existing and acquired product lines, introduce differentiated product and marketing strategies to separate ourselves from competitors, our mobile speaker and audio wearables efforts will not be successful, and our business and results of operations could be adversely affected.
Gaming. We are building a diverse business that features a variety of gaming devices. The rapidly evolving and changing market and increasing competition increase the risk that if we do not allocate our resources in line with the market and our business then our results of operations could be adversely affected.
Video Collaboration. While we view the small and medium sized user groups' opportunity to be large and relatively unaddressed, this is a new and evolving market segment that we are developing. If the market opportunity proves to exist, we expect increasing competition from the strong competitors in the video conferencing market as well as potential new entrants.
Home. While we are a leader in programmable, performance remote controls for home entertainment, the smart home market is still in its early stages and it is not yet clear when the category will produce dynamic growth or which products will succeed and be able to take advantage of market growth or to help define and grow the market. Despite its early stages, the smart home market already is experiencing increasing competition from strong competitors.
In addition to our current growth opportunities, our future growth may be reliant on our ability to identify and develop potential new growth opportunities. This process is inherently risky and will result in investments in time and resources for which we do not achieve any return or value.
Each of these growth opportunities is subject to rapidly changing and evolving technologies and may be replaced by new technology concepts or platforms. Some of these growth opportunities are also dependent on
Logitech International S.A. | Fiscal 2016 Form 10-K | 18
rapidly changing and evolving consumer preferences with respect to design and features that require calculated risk-taking and fast responsiveness. If we do not develop innovative and reliable products and enhancements in a cost-effective and timely manner that are attractive to consumers in these markets, if we are otherwise unsuccessful entering and competing in these growth opportunities, if the growth opportunities in which we invest our limited resources do not emerge as the opportunities or do not produce the growth or profitability we expect, or when we expect it, or if we do not correctly anticipate changes and evolutions in technology and platforms, our business and results of operations could be adversely affected.
If we do not compete effectively, demand for our products could decline and our business and operating results could be adversely affected.
The peripherals industry is intensely competitive. Most of our product categories are characterized by large, well-financed competitors, short product life cycles, continual performance enhancements, and rapid adoption of technological and product advancements by competitors in our retail markets. We experience aggressive price competition and other promotional activities from our primary competitors and from less-established brands, including brands owned by retail customers known as house brands. In addition, our competitors may offer customers terms and conditions that may be more favorable than our terms and conditions and may require us to take actions to increase our customer incentive programs, which could impact our revenues and operating margins.
In recent years, we have expanded the categories of products we sell, and entered new markets. We remain alert to opportunities in new categories and markets. As we do so, we are confronting new competitors, many of which have more experience in the categories or markets and have greater marketing resources and brand name recognition than we have. In addition, because of the continuing convergence of the markets for computing devices and consumer electronics, we expect greater competition in the future from well-established consumer electronics companies in our developing categories as well as in future categories we might enter. Many of these companies, such as Microsoft, Apple, Google, Cisco, Sony Corporation, Polycom, Samsung and others, have greater financial, technical, sales, marketing and other resources than we have.
Microsoft, Apple and Google are leading producers of operating systems, hardware and applications with which our mice, keyboards and other products are designed to operate. In addition, Microsoft, Apple and Google each has significantly greater financial, technical, sales, marketing and other resources than Logitech, as well as greater name recognition and a larger customer base. As a result, Microsoft, Apple and Google each may be able to improve the functionality of its products, if any, or may choose to show preference to our competitors' products, to correspond with ongoing enhancements to its operating systems, hardware and software applications before we are able to make such improvements. This ability could provide Microsoft, Apple, Google or other competitors with significant lead-time advantages. In addition, Microsoft, Apple, Google or other competitors may be able to offer pricing advantages on bundled hardware and software products that we may not be able to offer, and may be financially positioned to exert significant downward pressure on product prices and upward pressure on promotional incentives in order to gain market share.
Music
Mobile Speakers. Our competitors for Bluetooth wireless speakers include Bose, JBL, Harmon Kardon, and Beats Electronics. Bose is our largest competitor. Apple's ownership of Beats Electronics may impact our access to shelf space in Apple retail stores and adversely impact our ability to succeed in this important growth market. Personal assistance and other devices that offer music, such as Amazon's Echo, may also compete with our products. Amazon is also a significant distributor for our products.
Audio-PC & Wearables. In the PC speakers category, our competitors include Bose, Cyber Acoustics, Phillips and Creative Labs, Inc. In the PC headset business, our main competitors include Plantronics and Altec Lansing. In-ear headphones competitors include Skull Candy, Sennheiser, Sony, Beats, and others.
Gaming
Competitors for our Gaming products include Razer USA Ltd., SteelSeries, and Turtle Beach.
Video Collaboration
Our competitors for Video Collaboration products include Cisco Systems, Inc., Polycom, Inc., and Avaya, Inc.
Logitech International S.A. | Fiscal 2016 Form 10-K | 19
Home
Remotes. Direct competitors in the remote control market include pro-installer-focused Universal Remote Control Inc., and new “DIY” entrants from Savant Systems and Ray Enterprises. Indirect competition exists in the form of low-end “replacement remotes” such as Sony, RCA, GE, pure app-based solutions for smartphones and other mobile devices such as Peel, as well as device and/or subscriber-specific solutions from TV makers such as Samsung and Vizio and MSOs such as Comcast and DirecTV.
Home Control. Competition in the home control market exists in form of home automation platforms such as Smart Things (owned by Samsung), Amazon with their Echo product, Nest (owned by Google), Wink and many other startups in the space. Many of these products and brands are partners with Logitech as well via integrations with Harmony remotes.
Creativity and Productivity
Pointing Devices. Microsoft Corporation is our main competitor. We also experience competition and pricing pressure from less-established brands, including house brands, which we believe have impacted our market share in some sales geographies.
Keyboards & Combo. Microsoft Corporation and Apple Inc. are our main competitors in our keyboard and combo product lines. We also experience competition and pricing pressure for keyboard and combos from less-established brands, including house brands.
Tablet & Other Accessories. Competitors in the tablet case market include Apple, Otter, Speck and a large number of small brands. Competitors in the tablet keyboard market are Apple, Zagg, Kensington, Belkin, Targus and other less-established brands. Although we are one of the leaders in the tablet keyboard market and continue to bring innovative offerings to the market, we expect the competition will increase.
PC Webcams. Our primary competitors for PC webcams are Microsoft and Hewlett Packard with various other manufacturers taking smaller market share. The worldwide market for consumer PC webcams has been declining, and as a result, fewer competitors have entered the market.
Our business depends in part on access to third-party platforms or technologies, and if the access is withdrawn, denied, or is not available on terms acceptable to us, or if the platforms or technologies change without notice to us, our business and operating results could be adversely affected.
Our peripherals business has historically been built largely around the PC platform, which over time became relatively open, and its inputs and operating system standardized. With the growth of mobile, tablet, gaming and other computer devices, the number of platforms has grown, and with it the complexity and increased need for us to have business and contractual relationships with the platform owners in order to produce products compatible with these platforms. Our product portfolio includes current and future products designed for use with third-party platforms or software, such as the Apple iPad, iPod and iPhone and Android phones and tablets. Our business in these categories relies on our access to the platforms of third parties, some of whom are our competitors. Platform owners that are competitors have a competitive advantage in designing products for their platforms and may produce peripherals or other products that work better, or are perceived to work better, than our products in connection with those platforms. As we expand the number of platforms and software applications with which our products are compatible, we may not be successful in launching products for those platforms or software applications, we may not be successful in establishing strong relationships with the new platform or software owners, or we may negatively impact our ability to develop and produce high-quality products on a timely basis for those platforms and software applications or we may otherwise adversely affect our relationships with existing platform or software owners.
Our access to third-party platforms may require paying a royalty, which lowers our product margins, or may otherwise be on terms that are not acceptable to us. In addition, the third-party platforms or technologies used to interact with our product portfolio can be delayed in production or can change without prior notice to us, which can result in our having excess inventory or lower margins.
Logitech International S.A. | Fiscal 2016 Form 10-K | 20
If we are unable to access third-party platforms or technologies, or if our access is withdrawn, denied, or is not available on terms acceptable to us, or if the platforms or technologies are delayed or change without notice to us, our business and operating results could be adversely affected.
If we do not accurately forecast market demand for our products, our business and operating results could be adversely affected.
We use our forecasts of product demand to make decisions regarding investments of our resources and production levels of our products. Although we receive forecasts from our customers, many are not obligated to purchase the forecasted demand. Also, actual sales volumes for individual products in our retail distribution channel can be volatile due to changes in consumer preferences and other reasons. In addition, our products have short product life cycles, so a failure to accurately predict high demand for a product can result in lost sales that we may not recover in subsequent periods, or higher product costs if we meet demand by paying higher costs for materials, production and delivery. We could also frustrate our customers and lose shelf space. Our failure to predict low demand for a product can result in excess inventory, lower cash flows and lower margins if we are required to reduce product prices in order to reduce inventories.
If our sales channel partners have excess inventory of our products or decide to decrease their inventories for any reason, they may decrease the amount of products they acquire in subsequent periods, causing disruption in our business and adversely affecting our forecasts and sales.
Over the past few years, we have expanded the types of products we sell, and the geographic markets in which we sell them. The changes in our product portfolio and the expansion of our sales markets have increased the difficulty of accurately forecasting product demand.
In addition, during fiscal year 2016 we increased the percentage of our products that we manufacture in our own facilities. This increases the inventory that we purchase and maintain to support such manufacturing. We are also utilizing sea shipments more extensively than air delivery, which will cause us to build and ship products to our distribution centers earlier and will also result in increases in inventory. These operational shifts increase the risk that we have excess or obsolete inventory if we do not accurately forecast product demand.
We have experienced large differences between our forecasts and actual demand for our products. We expect other differences between forecasts and actual demand to arise in the future. If we do not accurately predict product demand, our business and operating results could be adversely affected.
Our success largely depends on our ability to hire, retain, integrate and motivate sufficient numbers of qualified personnel, including senior management. Our strategy and our ability to innovate, design and produce new products, sell products, maintain operating margins and control expenses depend on key personnel that may be difficult to replace.
Our success depends on our ability to attract and retain highly skilled personnel, including senior management and international personnel. From time to time, we experience turnover in some of our senior management positions.
We compensate our employees through a combination of salary, bonuses, benefits and equity compensation. Recruiting and retaining skilled personnel, including software and hardware engineers, is highly competitive. If we fail to provide competitive compensation to our employees, it will be difficult to retain, hire and integrate qualified employees and contractors, and we may not be able to maintain and expand our business. If we do not retain our senior managers or other key employees for any reason, we risk losing institutional knowledge, experience, expertise and other benefits of continuity as well as the ability to attract and retain other key employees. In addition, we must carefully balance the size of our employee base with our current infrastructure, management resources and anticipated operating cash flows. If we are unable to manage the size of our employee base, particularly engineers, we may fail to develop and introduce new products successfully and in a cost-effective and timely manner. If our revenue growth or employee levels vary significantly, our operating cash flows and financial condition could be adversely affected. Volatility or lack of positive performance in our stock price, including declines in our stock prices in the past year, may also affect our ability to retain key employees, many of whom have been granted equity incentives. Logitech’s practice has been to provide equity incentives to its employees, but the number of shares available for equity grants is limited. We may find it difficult to provide competitive equity incentives, and our ability to hire, retain and motivate key personnel may suffer.
Logitech International S.A. | Fiscal 2016 Form 10-K | 21
Recently and in past years, we have initiated reductions in our workforce to align our employee base with our business strategy, our anticipated revenue base or with our areas of focus. We have also experienced turnover in our workforce. These reductions and turnover have resulted in reallocations of duties, which could result in employee uncertainty and discontent. Reductions in our workforce could make it difficult to attract, motivate and retain employees, which could adversely affect our business.
Our gross margins can vary significantly depending on multiple factors, which can result in unanticipated fluctuations in our operating results.
Our gross margins can vary due to consumer demand, competition, product life cycle, new product introductions, unit volumes, commodity and supply chain costs, geographic sales mix, currency exchange rates, and the complexity and functionality of new product innovations. In particular, if we are not able to introduce new products in a timely manner at the product cost we expect, or if consumer demand for our products is less than we anticipate, or if there are product pricing, marketing and other initiatives by our competitors to which we need to react or that are initiated by us to drive sales that lower our margins, then our overall gross margin will be less than we project.
In addition, our gross margins may vary significantly by product line, sales geography and customer type, as well as within product lines. When the mix of products sold shifts from higher margin product lines to lower margin product lines, to lower margin sales geographies, or to lower margin products within product lines, our overall gross margins and our profitability may be adversely affected.
As we expand within and into new product categories, our products in those categories may have lower gross margins than in our traditional product categories. Consumer demand in these product categories, based on style, color and other factors, tends to be less predictable and tends to vary more across geographic markets. As a result, we may face higher up-front investments, inventory costs associated with attempting to anticipate consumer preferences, and increased inventory write-offs. If we are unable to offset these potentially lower margins by enhancing the margins in our more traditional product categories, our profitability may be adversely affected.
The impact of these factors on gross margins can create unanticipated fluctuations in our operating results, which may cause volatility in the price of our shares.
As we continue our efforts to lower our costs and improve our operating leverage, we may or may not fully realize our goals.
Our turnaround strategy over the past three years has been based in part on simplifying the organization, reducing operating costs through global workforce reductions and a reduction in the complexity of our product portfolio, with the goal of better aligning costs with our current business. We restructured our business in fiscal years 2014 through 2016, and we may continue to divest or discontinue non-strategic product categories. During the third quarter of fiscal year 2016, we divested our Lifesize video conferencing business and completed our exit from the OEM business. In addition, we are continuing the rationalization of our general and administrative expense, infrastructure and indirect procurement to reduce operating expenses.
Our ability to achieve the desired and anticipated cost savings and other benefits from these simplification, cost-cutting and restructuring activities, and within our desired and expected timeframes, are subject to many estimates and assumptions, and the actual savings and timing for those savings may vary materially based on factors such as local labor regulations, negotiations with third parties, and operational requirements. These estimates and assumptions are also subject to significant economic, competitive and other uncertainties, some of which are beyond our control. There can be no assurance that we will fully realize the desired and anticipated benefits from these activities. To the extent that we are unable to improve our financial performance, further restructuring measures may be required in the future. Furthermore, we are expecting to be able to use the anticipated cost savings from these activities to fund and support our current growth opportunities and incremental investments for future growth. If the cost-savings do not materialize as anticipated, or within our expected timeframes, our ability to invest in growth may be limited and our business and operating results may be adversely affected.
As part of the restructuring plans, we reduced the size of our product portfolio and the assortment of similar products at similar price points within each product category over the past several fiscal years. While we are
Logitech International S.A. | Fiscal 2016 Form 10-K | 22
constantly replacing products and are dependent on the success of our new products, this product portfolio simplification has made us even more dependent on the success of the new products that we are introducing.
As we focus on growth opportunities, we are divesting or discontinuing non-strategic product categories and pursuing strategic acquisitions and investments, which, if unsuccessful, could have an adverse impact on our business.
We continue to review our product portfolio and update our non-strategic product categories and products. During the third quarter of fiscal year 2016, we divested our Lifesize video conferencing business and completed our exit from the OEM business. If we are unable to effect sales on favorable terms or if realignment is more costly or distracting than we expect or has a negative effect on our organization, employees and retention, then our business and operating results may be adversely affected. Discontinuing products with service components may also cause us to continue to incur expenses to maintain services within the product life cycle or to adversely affect our customer and consumer relationships and brand. In addition, discontinuing product categories, even categories that we consider non-strategic, reduces the size and diversification of our business and causes us to be more dependent on a smaller number of product categories.
As we attempt to grow our business in strategic product categories and emerging market geographies, we will consider growth through acquisition or investment. We will evaluate acquisition opportunities that could provide us with additional product or service offerings or with additional industry expertise, assets and capabilities. For example, we recently acquired Jaybird to expand into the wireless audio wearables market. Acquisitions could result in difficulties integrating acquired operations, products, technology, internal controls, personnel and management teams and result in the diversion of capital and management’s attention away from other business issues and opportunities. If we fail to successfully integrate acquisitions, our business could be harmed. Moreover, our acquisitions may not be successful in achieving our desired strategic objectives, which would also cause our business to suffer. Acquisitions can also lead to large non-cash charges that can have an adverse effect on our results of operations as a result of write-offs for items such as future impairments of intangible assets and goodwill or the recording of stock-based compensation. Several of our past acquisitions have not been successful and have led to impairment charges, including a $122.7 million and $214.5 million non-cash goodwill impairment charge in fiscal years 2015 and 2013, respectively, related to our Lifesize video conferencing business which is reported in discontinued operations. In addition, from time to time we make strategic venture investments in other companies that provide products and services that are complementary to ours. If these investments are unsuccessful, this could have an adverse impact on our results of operations, operating cash flows and financial condition.
We rely on third parties to sell and distribute our products, and we rely on their information to manage our business. Disruption of our relationship with these channel partners, changes in their business practices, their failure to provide timely and accurate information, changes in distribution partners, practices or models or conflicts among our channels of distribution could adversely affect our business, results of operations, operating cash flows and financial condition.
Our sales channel partners, the distributors and retailers who distribute and sell our products, also sell products offered by our competitors and, in the case of retailer house brands, may also be our competitors. If product competitors offer our sales channel partners more favorable terms, have more products available to meet their needs, or utilize the leverage of broader product lines sold through the channel, or if our retailer channel partners show preference for their own house brands, our sales channel partners may de-emphasize or decline to carry our products. In addition, certain of our sales channel partners could decide to de-emphasize the product categories that we offer in exchange for other product categories that they believe provide them with higher returns. If we are unable to maintain successful relationships with these sales channel partners or to maintain our distribution channels, our business will suffer.
As we expand into new product categories and markets in pursuit of growth, we will have to build relationships with new channel partners and adapt to new distribution and marketing models. These new partners, practices and models may require significant management attention and operational resources and may affect our accounting, including revenue recognition, gross margins, and the ability to make comparisons from period to period. Entrenched and more experienced competitors will make these transitions difficult. If we are unable to build successful distribution channels or successfully market our products in these new product categories, we may not be able to take advantage of the growth opportunities, and our business and our ability to effect a turnaround in our business could be adversely affected.
Logitech International S.A. | Fiscal 2016 Form 10-K | 23
We reserve for cooperative marketing arrangements, direct and indirect customer incentive programs and pricing programs with our sales channel partners. These reserves are based on judgments and estimates, using historical experience rates, inventory levels in distribution, current trends and other factors. There could be significant differences between the actual costs of such arrangements and programs and our estimates.
The impact of economic conditions, evolving consumer preferences, and purchasing patterns on our distribution partners, or competition between our sales channels, could result in sales channel disruption. For example, if sales at large retail stores are displaced as a result of bankruptcy, competition from Internet sales channels or otherwise, our product sales could be adversely affected. Any loss of a major partner or distribution channel or other channel disruption could make us more dependent on alternate channels, increase pricing and promotional pressures from other partners and distribution channels, increase our marketing costs, or adversely impact buying and inventory patterns, payment terms or other contractual terms.
We use retail sell-through data, which represents sales of our products by our direct retailer customers to consumers, and by our distributor customers to their customers, along with other metrics, to assess consumer demand for our products. Sell-through data is subject to limitations due to collection methods and the third-party nature of the data and thus may not be an accurate indicator of actual consumer demand for our products. In addition, the customers supplying sell-through data vary by geographic region and from period to period, but typically represent a majority of our retail sales. In addition, we rely on channel inventory data from our retailer and distributor customers. If we do not receive this information on a timely and accurate basis, or if we do not properly interpret this information, our results of operations and financial condition may be adversely affected.
Our principal manufacturing operations and third-party contract manufacturers are located in China and Southeast Asia, which exposes us to risks associated with doing business in that geographic area.
We produce approximately half of our products at facilities we own in China, and we are under progress to increase that percentage in the near future. The majority of our other production is performed by third-party contract manufacturers, including other design manufacturers, in China and Malaysia.
Our manufacturing operations in China could be adversely affected by changes in the interpretation and enforcement of legal standards, strains on China’s available labor pool, changes in labor costs and other employment dynamics, high turnover among Chinese employees, infrastructure issue, import export issue, currency transfer restriction, natural disasters, conflicts or disagreements between China and Taiwan or China and the United States, labor unrest, and other trade customs and practices that are dissimilar to those in the United States and Europe. Interpretation and enforcement of China’s laws and regulations continue to evolve and we expect differences in interpretation and enforcement to continue in the foreseeable future.
Our manufacturing operations at third-party contractors could be adversely affected by contractual disagreements, by labor unrest, by natural disasters, by strains on local communications, trade, and other infrastructures, by competition for the available labor pool or manufacturing capacity, by increasing labor and other costs, and by other trade customs and practices that are dissimilar to those in the United States and Europe.
Further, we may be exposed to fluctuations in the value of the local currency in the countries in which manufacturing occurs. Future appreciation of these local currencies could increase our component and other raw material costs. In addition, our labor costs could continue to rise as wage rates increase and the available labor pool declines. These conditions could adversely affect our financial results.
We purchase key components and products from a limited number of sources, and our business and operating results could be adversely affected if supply were delayed or constrained or if there were shortages of required components.
We purchase certain products and key components from a limited number of sources. If the supply of these products or key components, such as micro-controllers, and optical sensors, were to be delayed or constrained, or if one or more of our single-source suppliers goes out of business as a result of adverse global economic conditions or natural disasters, we might be unable to find a new supplier on acceptable terms, or at all, and our product shipments to our customers could be delayed, which could adversely affect our business, financial condition and operating results.
Logitech International S.A. | Fiscal 2016 Form 10-K | 24
Lead times for materials, components and products ordered by us or by our contract manufacturers can vary significantly and depend on factors such as contract terms, demand for a component, and supplier capacity. From time to time, we have experienced component shortages and extended lead times on semiconductors, such as micro-controllers and optical sensors, and base metals used in our products. Shortages or interruptions in the supply of components or subcontracted products, or our inability to procure these components or products from alternate sources at acceptable prices in a timely manner, could delay shipment of our products or increase our production costs, which could adversely affect our business and operating results.
Conflict minerals regulations are causing us to incur additional expenses, could limit the supply and increase the cost of certain metals used in manufacturing our products and could adversely affect the distribution and sales of our products.
As part of the Dodd-Frank Wall Street Reform and Consumer Protection Act, the SEC adopted disclosure requirements regarding the use of certain minerals, known as conflict minerals, which are mined from the Democratic Republic of Congo and adjoining countries, as well as procedures regarding a manufacturer’s efforts to identify and prevent the sourcing of such minerals and metals produced from those minerals. Additional reporting obligations are being considered by the European Union. The implementation of the existing U.S. requirements and any additional requirements in Europe could affect sourcing at competitive prices and availability in sufficient quantities of certain minerals used in the manufacture of our products. The number of suppliers who provide conflict-free minerals may be limited, and the implementation of these requirements may decrease the number of suppliers capable of supplying our needs for certain metals. In addition, there may be material costs associated with complying with the disclosure requirements, such as costs related to the due diligence process of determining the source of certain minerals used in our products, as well as costs of possible changes to products, processes, or sources of supply as a consequence of such verification activities. As our supply chain is complex and we use contract manufacturers for some of our products, we may not be able to sufficiently verify the origins of the relevant minerals used in our products through the due diligence procedures that we implement, which may adversely affect our reputation. We may also encounter challenges to satisfy those customers who require that all of the components of our products be certified as conflict-free, which could, if we are unable to satisfy their requirements or pass through any increased costs associated with meeting their requirements place us at a competitive disadvantage, adversely affect our business and operating results, or both. We filed our report for the calendar year 2014 with the SEC on May 29, 2015.
If we do not successfully coordinate the worldwide manufacturing and distribution of our products, we could lose sales.
Our business requires us to coordinate the manufacture and distribution of our products over much of the world. We rely on third parties to manufacture many of our products, manage centralized distribution centers, and transport our products. If we do not successfully coordinate the timely manufacturing and distribution of our products, we may have insufficient supply of products to meet customer demand, we could lose sales, we may experience a build-up in inventory, or we may incur additional costs.
By locating our manufacturing in China and Southeast Asia, we are reliant on third parties to get our products to distributors around the world. Transportation costs, fuel costs, labor unrest, natural disasters and other adverse effects on our ability, timing and cost of delivering products can increase our inventory, decrease our margins, adversely affect our relationships with distributors and other customers and otherwise adversely affect our results of operations and financial condition.
A significant portion of our quarterly retail orders and product deliveries generally occur in the last weeks of the fiscal quarter. This places pressure on our supply chain and could adversely affect our revenues and profitability if we are unable to successfully fulfill customer orders in the quarter.
Logitech International S.A. | Fiscal 2016 Form 10-K | 25
We conduct operations in a number of countries, and have invested significantly in growing our sales and marketing activities in China, and the effect of business, legal and political risks associated with international operations could adversely affect us.
We conduct operations in a number of countries, and have invested significantly in growing our personnel and sales and marketing activities in China and, to a lesser extent, other emerging markets. We may also increase our investments to grow sales in other emerging markets, such as Latin America and Eastern Europe. There are risks inherent in doing business in international markets, including:
• | Difficulties in staffing and managing international operations; |
• | Compliance with laws and regulations, including environmental, tax and anti-corruption laws, which vary from country to country and over time, increasing the costs of compliance and potential risks of non-compliance; |
• | Varying laws, regulations and other legal protections, uncertain and varying enforcement of those laws and regulations, dependence on local authorities, and the importance of local networks and relationships; |
• | Exposure to political and financial instability, especially with the uncertainty associated with the ongoing sovereign debt crisis in certain Euro zone countries, which may lead to currency exchange losses and collection difficulties or other losses; |
•Lack of infrastructure or services necessary or appropriate to support our products and services;
•Exposure to fluctuations in the value of local currencies;
• | Difficulties and increased costs in establishing sales and distribution channels in unfamiliar markets, with their own market characteristics and competition, including entrenched local competition; |
•Weak protection of our intellectual property rights;
•Higher credit risks;
•Changes in VAT (value-added tax) or VAT reimbursement;
•Imposition of currency exchange controls;
• | Import or export restrictions that could affect some of our products, including those with encryption technology; |
•Delays from customs brokers or government agencies; and
•A broad range of customs, consumer trends, and more.
Any of these risks could adversely affect our business, financial condition and operating results.
Sales growth in China is an important part of our expectations for our business. As a result, if Chinese economic, political or business conditions deteriorate, or if one or more of the risks described above materializes in China, our overall business and results of operations will be adversely affected.
Our financial performance is subject to risks associated with fluctuations in currency exchange rates.
A significant portion of our business is conducted in currencies other than the U.S. Dollars. Therefore, we face exposure to movements in currency exchange rates.
Our primary exposure to movements in currency exchange rates relates to non-U.S. Dollar denominated sales and operating expenses worldwide. For fiscal year 2016, approximately 48% of our revenue was in non-U.S. denominated currencies. Weakening of currencies relative to the U.S. Dollar adversely affects the U.S. Dollar value of our non-U.S. Dollar-denominated sales and earnings. If we raise international pricing to compensate, it could
Logitech International S.A. | Fiscal 2016 Form 10-K | 26
potentially reduce demand for our products, adversely affecting our sales and potentially having an adverse impact on our market share. Margins on sales of our products in non-U.S. Dollar denominated countries and on sales of products that include components obtained from suppliers in non-U.S. Dollar denominated countries could be adversely affected by currency exchange rate fluctuations. In some circumstances, for competitive or other reasons, we may decide not to raise local prices to fully offset the U.S. Dollar’s strengthening, which would adversely affect the U.S. Dollar value of our non-U.S. Dollar-denominated sales and earnings. Competitive conditions in the markets in which we operate may also limit our ability to increase prices in the event of fluctuations in currency exchange rates. Conversely, strengthening of currency rates may also increase our product component costs and other expenses denominated in those currencies, adversely affecting operating results. We further note that a larger portion of our sales than of our expenses are denominated in non-U.S. denominated currencies.
We use derivative instruments to hedge certain exposures to fluctuations in currency exchange rates. The use of such hedging activities may not offset any, or more than a portion, of the adverse financial effects of unfavorable movements in currency exchange rates over the limited time the hedges are in place and do not protect us from long term shifts in currency exchange rates.
As a result, fluctuations in currency exchange rates could adversely affect our business, operating results and financial condition. Moreover, these exposures may change over time.
As a company operating in many markets and jurisdictions and expanding into new growth categories, and as a Swiss, dual - listed company, we are subject to risks associated with new, existing and potential future laws and regulations.
Based on our current business model and as we expand into new markets and product categories, we must comply with a wide variety of laws, standards and other requirements governing, among other things, health and safety, hazardous materials usage, product-related energy consumption, packaging, recycling and environmental matters. Our products may be required to obtain regulatory approvals and satisfy other regulatory concerns in the various jurisdictions where they are manufactured, sold or both. These requirements create procurement and design challenges, which, among other things, require us to incur additional costs identifying suppliers and contract manufacturers who can provide or obtain compliant materials, parts and end products. Failure to comply with such requirements can subject us to liability, additional costs, and reputational harm and, in severe cases, force us to recall products or prevent us from selling our products in certain jurisdictions.
As a Swiss company with shares listed on both the SIX Swiss Exchange and the Nasdaq Global Select Market, we are also subject to both Swiss and United States corporate governance and securities laws and regulations. In addition to the extra costs and regulatory burdens of our dual regulatory obligations, the two regulatory regimes may not always be compatible and may impose disclosure obligations or operating restrictions on our business to which our competitors and other companies are not subject. For example, on January 1, 2014, subject to certain transitional provisions, the Swiss Federal Council Ordinance Against Excessive Compensation at Public Companies (the “Ordinance”) became effective in connection with the Minder initiative approved by Swiss voters during 2013. The Ordinance, among other things, (a) requires a binding shareholder “say on pay” vote with respect to the compensation of members of our executive management and Board of Directors, (b) generally prohibits the making of severance, advance, transaction premiums and similar payments to members of our executive management and Board of Directors, (c) imposes other restrictive compensation practices, and (d) requires that our articles of incorporation specify various compensation-related matters. In addition, during 2013, Swiss voters considered an initiative to limit pay for a chief executive officer to a multiple of no more than twelve times the salary of the lowest-paid employee. Although voters rejected that initiative, it did receive substantial voter support. The Ordinance, potential future initiatives relating to corporate governance or executive compensation, and Swiss voter sentiment in favor of such regulations may increase our non-operating costs and adversely affect our ability to attract and retain executive management and members of our Board of Directors.
As a result of changes in tax laws, treaties, rulings, regulations or agreements, or their interpretation, of Switzerland or any other country in which we operate, the loss of a major tax dispute or a successful challenge to our operating structure, intercompany pricing policies or the taxable presence of our key subsidiaries in certain countries, or other factors, our effective income tax rates may increase in the future, which could adversely affect our net income and cash flows.
We operate in multiple jurisdictions and our profits are taxed pursuant to the tax laws of these jurisdictions. Our effective income tax rate may be affected by changes in or interpretations of tax laws, treaties, rulings, regulations
Logitech International S.A. | Fiscal 2016 Form 10-K | 27
or agreements in any given jurisdiction, utilization of net operating loss and tax credit carryforwards, changes in geographical allocation of income and expense, and changes in management’s assessment of matters such as the realizability of deferred tax assets. In the past, we have experienced fluctuations in our effective income tax rate. Our effective income tax rate in a given fiscal year reflects a variety of factors that may not be present in the succeeding fiscal year or years. There is no assurance that our effective income tax rate will not change in future periods.
We are incorporated in the Canton of Vaud in Switzerland and our effective income tax rate benefits from a longstanding ruling from the Canton of Vaud. The tax rules in Switzerland are expected to change in response to certain guidance and demands from both the European Union and the Organization for Economic Co-operation and Development and that could have an adverse effect on our tax ruling and effective income tax rate. Switzerland’s implementation of any material change in tax laws or policies or its adoption of new interpretations of existing tax laws and rulings, or changes in our tax ruling from the Canton of Vaud, could result in a higher effective income tax rate on our worldwide earnings and such change could adversely affect our net income.
We file Swiss and foreign tax returns. We are frequently subject to tax audits, examinations and assessments in various jurisdictions. If any tax authority successfully challenges our operational structure, intercompany pricing policies or the taxable presence of our key subsidiaries in certain countries, if the terms of certain income tax treaties are interpreted in a manner that is adverse to our structure, or if we lose a material tax dispute in any country, our effective income tax rate could increase. A material assessment by a governing tax authority could adversely affect our profitability. If our effective income tax rate increases in future periods, our net income and cash flows could be adversely affected.
Claims by others that we infringe their proprietary technology could adversely affect our business.
We have been expanding the categories of products we sell, such as entering new markets and introducing products for tablets, other mobile devices, digital music, and video collaboration. We expect to continue to enter new categories and markets. As we do so, we face an increased risk that claims alleging we infringe the patent or other intellectual property rights of others, regardless of the merit of the claims, may increase in number and significance. Infringement claims against us may also increase as the functionality of video, voice, data and conferencing products begin to overlap. This risk is heightened by the increase in lawsuits brought by holders of patents that do not have an operating business or are attempting to license broad patent portfolios and by the increasing attempts by companies in the technology industries to enjoin their competitors from selling products that they claim infringe their intellectual property rights. Intellectual property lawsuits are subject to inherent uncertainties due to the complexity of the technical issues involved, and we cannot be certain that we will be successful in defending ourselves against intellectual property claims. A successful claimant could secure a judgment that requires us to pay substantial damages or prevents us from distributing certain products or performing certain services. We might also be required to seek a license for the use of such intellectual property, which may not be available on commercially acceptable terms or at all. Alternatively, we may be required to develop non-infringing technology, which could require significant effort and expense and may ultimately not be successful. Any claims or proceedings against us, whether meritorious or not, could be time consuming, result in costly litigation or the diversion of significant operational resources, or require us to enter into royalty or licensing agreements, any of which could materially and adversely affect our business and results of operations.
We may be unable to protect our proprietary rights. Unauthorized use of our technology may result in the development of products that compete with our products.
Our future success depends in part on our proprietary technology, technical know-how and other intellectual property. We rely on a combination of patent, trade secret, copyright, trademark and other intellectual property laws, and confidentiality procedures and contractual provisions such as nondisclosure terms and licenses, to protect our intellectual property.
We hold various United States patents and pending applications, together with corresponding patents and pending applications from other countries. It is possible that any patent owned by us will be invalidated, deemed unenforceable, circumvented or challenged, that the patent rights granted will not provide competitive advantages to us, or that any of our pending or future patent applications will not be granted. In addition, other intellectual property laws or our confidentiality procedures and contractual provisions may not adequately protect our intellectual property. Also, others may independently develop similar technology, duplicate our products, or design around our patents or other intellectual property rights. Unauthorized parties have copied and may in the future
Logitech International S.A. | Fiscal 2016 Form 10-K | 28
attempt to copy aspects of our products or to obtain and use information that we regard as proprietary. Any of these events could adversely affect our business, financial condition and operating results.
Product quality issues could adversely affect our reputation and could impact our operating results.
The market for our products is characterized by rapidly changing technology and evolving industry standards. To remain competitive, we must continually introduce new products and technologies. The products that we sell could contain defects in design or manufacture. Defects could also occur in the products or components that are supplied to us. There can be no assurance we will be able to detect and remedy all defects in the hardware and software we sell. Failure to do so could result in product recalls, product redesign efforts, lost revenue, loss of reputation, and significant warranty and other expenses to remedy.
Significant disruptions in, or breaches in security of, our websites or information technology systems could adversely affect our business.
As a consumer electronics company, our websites are an important presentation of our company, identity and brands and an important means of interaction with and source of information for consumers of our products. We also rely on our centralized information technology systems for product-related information and to store intellectual property, forecast our business, maintain financial records, manage operations and inventory, and operate other critical functions. We allocate significant resources to maintain our information technology systems and deploy network security, data encryption and other measures to protect against unauthorized access or misuse. Nevertheless, our websites and information technology systems are susceptible to damage, disruptions or shutdowns due to power outages, hardware failures, computer viruses, attacks by computer hackers, telecommunication failures, user error, malfeasance, catastrophes, system or software upgrades, integration or migration, or other foreseeable and unforeseen events. Breaches or disruptions of our websites or information technology systems could adversely affect our brands, reputation or consumer or investor perception of our company, business or products or result in disruptions of our operations, loss of intellectual property or, our customers’ or our business partners’ data, reduced value of our investments in our brands, design, research and development or engineering, or costs to address regulatory inquiries or actions or private litigation or to rebuild or restore our websites or information technology systems.
The collection, storage, transmission, use and distribution of user data could give rise to liabilities and additional costs of operation as a result of laws, governmental regulation and risks of security breaches.
In connection with certain of our products, we collect data related to our consumers. This information is increasingly subject to legislation and regulations in numerous jurisdictions around the world, and especially in Europe. Government actions are typically intended to protect the privacy and security of personal information and its collection, storage, transmission, use and distribution in or from the governing jurisdiction. In addition, because various jurisdictions have different laws and regulations concerning the use, storage and transmission of such information, we may face requirements that pose compliance challenges in existing markets as well as new international markets that we seek to enter. The collection of user data heightens the risk of security breaches related to our IT systems and the systems of third-party data storage and other service and IT providers. Such laws and regulations, and the variation between jurisdictions, as well as additional security measures and risk, could subject us to costs, liabilities or negative publicity that could adversely affect our business.
We recently upgraded our worldwide business application suite, and difficulties, distraction or disruptions may interrupt our normal operations and adversely affect our business and operating results.
During fiscal years 2014 and 2015, we devoted significant resources to the upgrade of our worldwide business application suite to Oracle’s version R12. We implemented that upgrade in fiscal year 2016 and will continue to review the success of that implementation during fiscal year 2017. As a result of our transition to the new business application suite, we may experience difficulties with our systems, management distraction, lack of visibility into our business operations and results, and significant business disruptions. Difficulties with our systems may interrupt our normal operations, including our enterprise resource planning, forecasting, demand planning, supply planning, intercompany processes, promotion management, internal financial controls, pricing, and our ability to provide quotes, process orders, ship products, provide services and support to our customers and consumers, bill and track our customers, fulfill contractual obligations, and otherwise run and track our business. For example, the transition has resulted in delays in processing customer claims for claims accruals. In addition, we may need to expend
Logitech International S.A. | Fiscal 2016 Form 10-K | 29
significant attention, time and resources to correct problems or find alternative sources for performing these functions. Any such difficulty or disruption may adversely affect our business and operating results.
Goodwill impairment charges could have an adverse effect on the results of our operations.
Goodwill associated with a number of previous acquisitions could result in impairment charges. The slowdown in the overall video conferencing industry together with the competitive environment in fiscal year 2013 resulted in a $214.5 million non-cash goodwill impairment charge in fiscal year 2013, which substantially impacted results of discontinued operations. We recorded an additional impairment charge of goodwill of $122.7 million related to our Lifesize video conferencing discontinued operations in fiscal year 2015, reducing its goodwill to zero, which substantially impacted results of discontinued operations again. If we divest or discontinue product categories or products that we previously acquired, or if the value of those parts of our business become impaired, we may need to evaluate the carrying value of our goodwill. Additional impairment charges could adversely affect our results of operations.
ITEM 1B. UNRESOLVED STAFF COMMENTS
None.
Logitech International S.A. | Fiscal 2016 Form 10-K | 30
ITEM 2. PROPERTIES
The table below represents our principal locations, their approximate square footage and their purposes as of March 31, 2016:
Location | Purpose | Approximate Square Footage | Ownership | ||||||
Americas: | |||||||||
Newark, California | Silicon valley campus, research and development, product marketing, sales management, technical support and administration | 127,000 | Leased | ||||||
Camas, Washington | Ultimate Ears Group | 44,700 | Leased | ||||||
Irvine, California | Ultimate Ears Group | 13,400 | Leased | ||||||
Olive Branch, Mississippi | Distribution center | 397,000 | Contracted | (1) | |||||
Mexico City, Mexico | Distribution center | 12,800 | Contracted | (1) | |||||
Montevideo, Uruguay | Distribution center | 25,800 | Contracted | (1) | |||||
Louveira, Brazil | Distribution center | 10,312 | Contracted | (1) | |||||
EMEA: | |||||||||
Lausanne, Switzerland | EPFL campus, research and development, product marketing, sales management, technical support and administration | 46,700 | Leased | ||||||
Cork, Ireland | Finance, administration, research and development and design | 18,400 | Leased | ||||||
Nijmegen, Netherlands | Finance, administration and distribution center support | 15,000 | Leased | ||||||
Oostrum, Netherlands | Distribution center | 155,600 | Contracted | (1) | |||||
Asia Pacific: | |||||||||
Suzhou, China | High-volume manufacturing and employee dormitory | 689,300 | Owned | ||||||
Suzhou, China | High-volume manufacturing | 14,300 | Leased | ||||||
Hsinchu, Taiwan | Mechanical engineering, new product launches, process engineering, commodities management, logistics, quality assurance and administration | 116,400 | Leased | ||||||
Hong Kong, China | Sales and marketing, research and development, administration and distribution center support | 15,300 | Leased | ||||||
Shanghai, China | Sales and marketing, finance | 16,900 | Leased | ||||||
Chennai, India | Digital Home Group engineering and quality assurance | 19,200 | Leased | ||||||
Tokyo, Japan | Sales and marketing | 10,100 | Leased | ||||||
Hong Kong, China | Distribution center | 40,000 | Contracted | (1) | |||||
Singapore, Singapore | Distribution center | 60,000 | Contracted | (1) | |||||
Tokyo, Japan | Distribution center | 27,000 | Contracted | (1) | |||||
Shenzhen, China | Distribution center | 32,000 | Contracted | (1) | |||||
Dayuan Township, Taiwan | Distribution center | 18,100 | Contracted | (1) | |||||
_______________________________________________________________________________
(1) | Contracted through a third-party warehouse management company. |
Logitech International S.A. | Fiscal 2016 Form 10-K | 31
Logitech also contracts with various distribution services throughout the world for additional warehouses in which we store inventory. We also have leased sales offices in approximately 60 locations and 40 countries, with various expiration dates from 2016 to 2020.
We believe that Logitech's manufacturing and distribution facilities are adequate for our ongoing needs and we continue to evaluate the need for facilities to meet current and anticipated future requirements.
ITEM 3. LEGAL PROCEEDINGS
From time-to-time we are involved in claims and legal proceedings that arise in the ordinary course of our business. We are currently subject to several such claims and a small number of legal proceedings. We believe that these matters lack merit and we intend to vigorously defend against them. Based on currently available information, we do not believe that resolution of pending matters will have a material adverse effect on our financial condition, cash flows or results of operations. However, litigation is subject to inherent uncertainties, and there can be no assurances that our defenses will be successful or that any such lawsuit or claim would not have a material adverse impact on our business, financial condition, cash flows and results of operations in a particular period. Any claims or proceedings against us, whether meritorious or not, can have an adverse impact because of defense costs, diversion of management and operational resources, negative publicity and other factors. Any failure to obtain necessary license or other rights, or litigation arising out of intellectual property claims, could adversely affect our business.
ITEM 4. MINE SAFETY DISCLOSURES
None.
Logitech International S.A. | Fiscal 2016 Form 10-K | 32
PART II
ITEM 5. MARKET FOR REGISTRANT'S COMMON EQUITY, RELATED STOCKHOLDER MATTERS AND ISSUER PURCHASES OF EQUITY SECURITIES
Logitech's shares are listed and traded on both the SIX Swiss Exchange, where the share price is denominated in Swiss francs, and on the Nasdaq Global Select Market, where the share price is denominated in U.S. Dollars. The trading symbol for Logitech shares is LOGN on the SIX Swiss Exchange and LOGI on Nasdaq. As of May 6, 2016, there were 173,106,620 shares issued (including 11,357,739 shares held as treasury stock) held by 13,813 holders of record, and the closing price of our shares was CHF 14.55 ($15.01 based on exchange rates on such date) per share on the SIX Swiss Exchange and $15.11 per share as reported by the Nasdaq Stock Market.
SIX Swiss Exchange
The following table sets forth certain historical share price information for our shares traded on the SIX Swiss Exchange, as reported by the SIX Swiss Exchange.
SIX Swiss Exchange | ||||||
High CHF | Low CHF | |||||
Fiscal Year Ended March 31, 2016 | ||||||
First quarter | 15.20 | 12.70 | ||||
Second quarter | 14.20 | 12.15 | ||||
Third quarter | 15.70 | 12.30 | ||||
Fourth quarter | 16.45 | 13.40 | ||||
Fiscal Year Ended March 31, 2015 | ||||||
First quarter | 13.80 | 11.00 | ||||
Second quarter | 13.95 | 11.15 | ||||
Third quarter | 14.60 | 10.75 | ||||
Fourth quarter | 14.25 | 11.60 | ||||
Logitech International S.A. | Fiscal 2016 Form 10-K | 33
Nasdaq Global Select Market
The following table sets forth certain historical share price information for our shares traded on the Nasdaq Global Select Market.
Nasdaq Global Select Market | ||||||||
High | Low | |||||||
Fiscal Year Ended March 31, 2016 | ||||||||
First quarter | $ | 16.25 | $ | 13.13 | ||||
Second quarter | 14.87 | 12.79 | ||||||
Third quarter | 15.73 | 12.58 | ||||||
Fourth quarter | 16.56 | 13.48 | ||||||
Fiscal Year Ended March 31, 2015 | ||||||||
First quarter | $ | 15.46 | $ | 12.34 | ||||
Second quarter | 15.35 | 12.56 | ||||||
Third quarter | 15.00 | 11.51 | ||||||
Fourth quarter | 15.21 | 12.50 | ||||||
Dividends
Under Swiss law, a corporation may only pay dividends upon a vote of its shareholders. This vote typically follows the recommendation of the corporation's Board of Directors. In March 2015, we announced a plan to pay $250.0 million in cumulative dividends for fiscal year 2015 through fiscal year 2017. On September 9, 2015, Logitech's shareholders approved a cash dividend payment of CHF 83.1 million out of retained earnings to Logitech shareholders who owned shares on September 21, 2015. Eligible shareholders were paid CHF 0.51 per share ($0.53 per share in U.S. Dollars), totaling $85.9 million in U.S. Dollars on September 22, 2015. On December 18, 2014, Logitech's shareholders approved a cash dividend payment of CHF 43.1 million out of retained earnings to Logitech shareholders who owned shares on December 29, 2014. Eligible shareholders were paid CHF 0.26 per share ($0.27 per share in U.S. Dollars), totaling $43.8 million in U.S. Dollars on December 30, 2014. On September 4, 2013, Logitech's shareholders approved a cash dividend payment of CHF 33.7 million out of retained earnings to Logitech shareholders who owned shares on September 16, 2013. Eligible shareholders were paid CHF 0.21 per share ($0.22 per share in U.S. Dollars), totaling $36.1 million in U.S. Dollars on September 17, 2013.
Dividends paid and similar cash or in-kind distributions made by Logitech to a holder of Logitech shares (including dividends or liquidation proceeds and stock dividends), other than distributions of qualifying additional paid-in-capital if it is available under the current Swiss tax regime, are subject to a Swiss federal anticipatory tax at a rate of 35%. The anticipatory tax must be withheld by Logitech from the gross distribution, and paid to the Swiss Federal Tax Administration.
A Swiss resident holder and beneficial owner of Logitech shares may qualify for a full refund of the Swiss anticipatory tax withheld from such dividends. A holder and beneficial owner of Logitech shares who is a non-resident of Switzerland, but a resident of a country that maintains a double tax treaty with Switzerland, may qualify for a full or partial refund of the Swiss anticipatory tax withheld from such dividends by virtue of the provisions of the applicable treaty between Switzerland and the country of residence of the holder and beneficial owner of the Logitech shares.
In accordance with the tax convention between the United States and the Swiss Confederation ("Treaty"), a mechanism is provided whereby a U.S. resident (as determined under the Treaty), and U.S. corporations, other than U.S. corporations having a "permanent establishment" or a fixed base, as defined in the Treaty, in Switzerland, generally can obtain a refund of the Swiss anticipatory tax withheld from dividends in respect of Logitech shares, to the extent that 15% of the gross dividend is withheld as final withholding tax (i.e. 20% of the gross dividend may generally be refunded). In specific cases, U.S. companies not having a "permanent establishment" or a fixed base in Switzerland owning at least 10% of Logitech registered shares may receive a refund of the Swiss anticipatory tax withheld from dividends to the extent it exceeds 5% of the gross dividend (i.e., 30% of the gross dividend may be refunded). To get the benefit of a refund, holders must beneficially own Logitech shares at the time such dividend becomes due.
Logitech International S.A. | Fiscal 2016 Form 10-K | 34
Share Repurchases
The following table presents certain information related to purchases made by Logitech of its equity securities under its publicly announced share buyback program (in thousands, except per share amounts):
Weighted Average Price Per Share | Amount Available for Repurchase | ||||||||||||
During Fiscal Year Ended | Shares Repurchased | CHF | USD | ||||||||||
March 31, 2014 | — | — | — | $ | 250,000 | ||||||||
March 31, 2015 | 115 | — | 14.43 | 248,337 | |||||||||
March 31, 2016 | 4,951 | 13.52 | 14.63 | 178,298 | |||||||||
5,066 | |||||||||||||
In fiscal year 2016, the following approved share buyback programs were in place:
Share Buyback Program | Shares | Approved Amounts | ||||
March 2014 | 17,311 | $ | 250,000 | |||
Logitech International S.A. | Fiscal 2016 Form 10-K | 35
Performance Graph
The information contained in the Performance Graph shall not be deemed to be "soliciting material" or "filed" with the SEC or subject to the liabilities of Section 18 of the Securities Exchange Act of 1934, as amended (the "Exchange Act"), except to the extent that we specifically incorporate it by reference into a document filed under the Securities Act of 1933, as amended (the "Securities Act"), or the Exchange Act.
The following graph compares the cumulative total stockholder return on our shares, the Nasdaq Composite Index, and the S&P 500 Information and Technology Index. The graph assumes that $100 was invested in our shares, the Nasdaq Composite Index and the S&P 500 Information and Technology Index on March 31, 2011, and calculates the annual return through March 31, 2016. The stock price performance on the following graph is not necessarily indicative of future stock price performance.
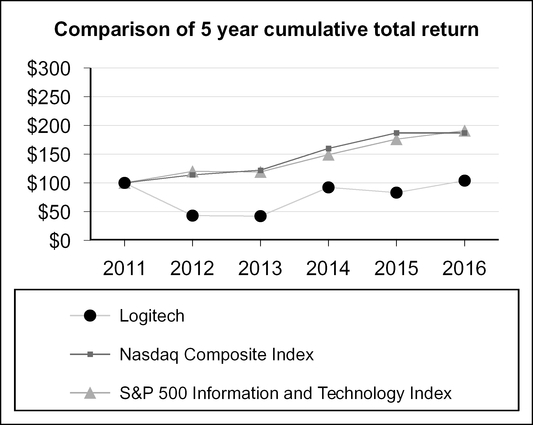
________________________________________
*$100 invested on March 31, 2011 in stock or index, including reinvestment of dividends.
Copyright© 2015 S&P, a division of The McGraw-Hill Companies Inc. All rights reserved.
March 31, | ||||||||||||||||||||||||
2011 | 2012 | 2013 | 2014 | 2015 | 2016 | |||||||||||||||||||
Logitech | $ | 100 | $ | 43 | $ | 42 | $ | 92 | $ | 83 | $ | 104 | ||||||||||||
Nasdaq Composite Index | $ | 100 | $ | 114 | $ | 122 | $ | 160 | $ | 187 | $ | 187 | ||||||||||||
S&P 500 Information and Technology Index | $ | 100 | $ | 120 | $ | 119 | $ | 149 | $ | 176 | $ | 191 | ||||||||||||
ITEM 6. Selected Financial Data
This financial data should be read in conjunction with Item 7, Management's Discussion and Analysis of Financial Condition and Results of Operations. These historical results are not necessarily indicative of the results to be expected in the future.
Logitech International S.A. | Fiscal 2016 Form 10-K | 36
Years ended March 31, | ||||||||||||||||||||
2016(2) | 2015(2) | 2014(2) | 2013(2) | 2012(2) | ||||||||||||||||
(unaudited) | (unaudited) | |||||||||||||||||||
(in thousands, except for per share amounts) | ||||||||||||||||||||
Consolidated statement of operations and cash flow data | ||||||||||||||||||||
Net sales | $ | 2,018,100 | $ | 2,004,908 | $ | 2,008,028 | $ | 1,962,237 | $ | 2,168,742 | ||||||||||
Cost of goods sold | 1,337,053 | 1,299,451 | 1,346,489 | 1,331,579 | 1,449,489 | |||||||||||||||
Gross profit | 681,047 | 705,457 | 661,539 | 630,658 | 719,253 | |||||||||||||||
Operating expenses: | ||||||||||||||||||||
Marketing and selling | 319,015 | 321,749 | 322,707 | 360,245 | 350,218 | |||||||||||||||
Research and development | 113,624 | 108,306 | 112,446 | 123,864 | 129,717 | |||||||||||||||
General and administrative | 101,548 | 125,995 | 112,689 | 108,480 | 101,621 | |||||||||||||||
Impairment of goodwill and other assets | — | — | — | 2,188 | — | |||||||||||||||
Restructuring charges (credits), net (1) | 17,802 | (4,777 | ) | 8,001 | 39,455 | — | ||||||||||||||
Total operating expenses | 551,989 | 551,273 | 555,843 | 634,232 | 581,556 | |||||||||||||||
Operating income (loss) | 129,058 | 154,184 | 105,696 | (3,574 | ) | 137,697 | ||||||||||||||
Interest income (expense), net | 790 | 1,197 | (431 | ) | 870 | 2,634 | ||||||||||||||
Other income (expense), net | 1,624 | (2,298 | ) | 2,039 | (2,139 | ) | 7,933 | |||||||||||||
Income (loss) from continuing operations before income taxes | 131,472 | 153,083 | 107,304 | (4,843 | ) | 148,264 | ||||||||||||||
Provision for (benefit from) income taxes | 3,110 | 4,654 | 1,313 | (26,376 | ) | 21,545 | ||||||||||||||
Net income from continuing operations | 128,362 | 148,429 | 105,991 | 21,533 | 126,719 | |||||||||||||||
Loss from discontinued operations, net of income taxes | (9,045 | ) | (139,146 | ) | (31,687 | ) | (249,051 | ) | (22,482 | ) | ||||||||||
Net income (loss) | 119,317 | 9,283 | 74,304 | (227,518 | ) | 104,237 | ||||||||||||||
Net income (loss) per share - basic: | ||||||||||||||||||||
Continuing operations | $ | 0.79 | $ | 0.91 | $ | 0.66 | $ | 0.14 | $ | 0.73 | ||||||||||
Discontinued operations | $ | (0.06 | ) | $ | (0.85 | ) | $ | (0.20 | ) | $ | (1.58 | ) | $ | (0.13 | ) | |||||
Net income (loss) per share - diluted | $ | 0.73 | $ | 0.06 | $ | 0.46 | $ | (1.44 | ) | $ | 0.60 | |||||||||
Income (loss) per share - diluted: | ||||||||||||||||||||
Continuing operations | $ | 0.77 | $ | 0.89 | $ | 0.65 | $ | 0.14 | $ | 0.72 | ||||||||||
Discontinued operations | $ | (0.05 | ) | $ | (0.83 | ) | $ | (0.19 | ) | $ | (1.57 | ) | $ | (0.13 | ) | |||||
Net income (loss) per share - diluted | $ | 0.72 | $ | 0.06 | $ | 0.46 | $ | (1.43 | ) | $ | 0.59 | |||||||||
Weighted average shares used to compute net income (loss) per share: | ||||||||||||||||||||
Basic | 163,296 | 163,536 | 160,619 | 158,468 | 174,648 | |||||||||||||||
Diluted | 165,792 | 166,174 | 162,526 | 159,445 | 175,591 | |||||||||||||||
Cash dividend per share | $ | 0.53 | $ | 0.27 | $ | 0.22 | $ | 0.85 | $ | — | ||||||||||
Net cash provided by operating activities | $ | 183,111 | $ | 178,632 | $ | 205,421 | $ | 122,389 | $ | 202,534 | ||||||||||
Net cash used in investing activities | $ | (60,690 | ) | $ | (48,289 | ) | $ | (46,803 | ) | $ | (57,723 | ) | $ | (57,602 | ) | |||||
March 31, | ||||||||||||||||||||
2016 | 2015 | 2014(3) | 2013(3) | 2012(3) | ||||||||||||||||
Consolidated balance sheet data | ||||||||||||||||||||
Cash and cash equivalents | $ | 519,195 | $ | 533,380 | $ | 467,518 | $ | 331,498 | $ | 474,961 | ||||||||||
Total assets | $ | 1,324,147 | $ | 1,426,680 | $ | 1,451,390 | $ | 1,382,333 | $ | 1,858,009 | ||||||||||
Total shareholders' equity | $ | 759,948 | $ | 758,134 | $ | 804,128 | $ | 721,953 | $ | 1,131,791 | ||||||||||
Logitech International S.A. | Fiscal 2016 Form 10-K | 37
_______________________________________________________________________________
(1) | During Fiscal year 2016, we incurred restructuring charges of $17.8 million related to the restructuring plan we implemented in fiscal 2016. The $4.8 million in restructuring credits during fiscal year 2015 were related to restructuring plans we implemented in fiscal year 2014. The $8.0 million and $39.5 million in restructuring costs during fiscal years 2014 and 2013 were related to restructuring plans we implemented in fiscal years 2014 and 2013. |
(2) | On December 28, 2015, we divested our Lifesize video conferencing business and, as a result, we have reflected the Lifesize video conferencing business as discontinued operations in our consolidated statements of operations and, as such, the results of that business have been excluded from all line items of statements of operations other than “Loss from discontinued operations, net of income taxes” for all periods presented. |
(3) | The above condensed consolidated cash and cash equivalents exclude Lifesize video conferencing business which is presented as discontinued operations. See Note 3, "Discontinued Operations" to our consolidated financial statements for additional information. |
Logitech International S.A. | Fiscal 2016 Form 10-K | 38
ITEM 7. MANAGEMENT'S DISCUSSION AND ANALYSIS OF FINANCIAL CONDITION AND RESULTS OF OPERATIONS
The following Management's Discussion and Analysis of Financial Condition and Results of Operations contains forward-looking statements that involve risks and uncertainties. Our actual results could differ materially from those anticipated in these statements as a result of certain factors, including those set forth above in Item 1A, Risk Factors, and below in Item 7A, Quantitative and Qualitative Disclosures about Market Risk. Please read the following discussion and analysis of our financial condition and results of operations together with our consolidated financial statements and related notes included under Item 8 of this Annual Report on Form 10-K.
Overview of Our Company
Logitech is a world leader in designing products that have an every day place in people's lives, connecting them to the digital experiences they care about. Over 30 years ago we started connecting people through computers, and now we are designing products that bring people together through music, gaming, video and computing.
We design, manufacture and market products that allow people to connect through music, gaming, video, computing, and other digital platforms. Our products participate in five large markets that all have growth potential: Music, Gaming, Video Collaboration, Home, and Creativity and Productivity.
We sell our products to a broad network of domestic and international customers, including direct sales to retailers, e-tailers, and indirect sales through distributors. Our worldwide retail network includes consumer electronics distributors, retailers, mass merchandisers, specialty electronics stores, computer and telecommunications stores, value-added resellers and online merchants.
We seek to fulfill the increasing demand for interfaces between people and the expanding digital world across multiple platforms and user environments. The interface evolves as platforms, user models and our target markets evolve. As access to digital information has expanded, we have extended our focus to mobile devices, the digital home, and the digital world. All of these platforms require interfaces that are customized according to how the devices are used. We believe that continued investment in product research and development is critical to creating the innovation required to strengthen our competitive advantage and to drive future sales growth. We are committed to identifying and meeting current and future consumer trends with new and improved product technologies, as well as leveraging the value of the Logitech brand from a competitive, channel partner, and consumer experience perspective.
We believe that innovation, design and product quality are important to gaining market acceptance and maintaining market leadership.
From time to time, we may seek to partner with, or acquire when appropriate, companies that have products, personnel, and technologies that complement our strategic direction. We continually review our product offerings and our strategic direction in light of our profitability targets, competitive conditions, changing consumer trends and the evolving nature of the interface between the consumer and the digital world.
In fiscal years prior to fiscal year 2016, we had two segments: Peripherals, including retail and OEM products; and Lifesize Video Conferencing. During fiscal year 2016, we divested the Lifesize Video Conferencing segment, and exited the OEM business. Our financial results treat the Lifesize segment as discontinued operations for all the periods presented in this Annual Report on Form 10-K. As a result, sales of products through our retail channels represented 96%, 94% and 93% of our net sales for the fiscal years 2016, 2015 and 2014, respectively.
On April 20, 2016, we acquired Jaybird LLC of Salt Lake City, Utah, ("Jaybird") for approximately $50 million in cash, with an additional earn-out of up to $45 million based on achievement of growth targets over two years. Jaybird is a leader in wireless audio wearables for sports and active lifestyles, and the acquisition of Jaybird expands our long-term growth potential in our Music market.
On December 28, 2015, we and Lifesize, Inc., a wholly owned subsidiary of Logitech which holds the assets of our Lifesize video conferencing business, entered into a stock purchase agreement with three venture capital firms. Immediately following the December 28, 2015 closing of the transaction, the venture capital firms held 62.5% of the outstanding shares of Lifesize, which resulted in a divestiture of the Lifesize video conferencing business by us. The historical results of operations and the financial position of Lifesize are included in the consolidated financial statements of Logitech and are reported as discontinued operations within this Annual Report on Form 10-K. Unless
Logitech International S.A. | Fiscal 2016 Form 10-K | 39
indicated otherwise, the information included in Item 7 relates to our continuing operations and historical financial information has been recast to conform to this new presentation within our financial statements.
We exited our OEM business during our fiscal quarter ended December 31, 2015. The results of our OEM business are included in our financial statements as part of continuing operations for the nine months ended December 31, 2015 and prior periods. There is no revenue and cost associated with this business in three months ended March 31, 2016, and we do not expect any in future periods.
Summary of Financial Results
Our total net sales for fiscal year 2016 increased 1% in comparison to fiscal year 2015 due to an increase in retail sales, partially offset by a decrease in OEM sales as a result of exiting the OEM business in the third quarter ended December 31, 2015.
Retail sales during fiscal year 2016 increased 3% compared to fiscal year 2015. Retail sales increased 3% and 10% in the Americas ("AMR") and Asia Pacific, respectively, partially offset by a decrease of 1% in EMEA.
Our gross margin for fiscal year 2016 decreased to 33.7%, compared to 35.2% for fiscal year 2015. The decrease in gross margin is primarily driven by the unfavorable fluctuations in currency exchange rates, partially offset by sales price increases and savings from supply chain efficiencies related to freight.
Operating expenses for fiscal year 2016 were 27.4% of net sales, compared to 27.5% for fiscal year 2015. The decrease was primarily due to the savings from general and administration expenses reduction related to the prior year's independent Audit committee investigation and related expenses, partially offset by the increase in research and development expense and restructuring costs related to our restructuring plan announced in April 2015.
Net income from continuing operations for fiscal year 2016 was $128.4 million, compared to $148.4 million for fiscal year 2015.
Trends in Our Business
In 2016, we announced our intention to focus on five large markets, or domains, collections of categories, going forward. Our strategy focuses on five large multi-category markets including Music, Gaming, Video Collaboration, Home and Creativity & Productivity. We see opportunities to deliver growth with products in all these markets.
We believe our future growth will be determined by our ability to rapidly create innovative products across multiple digital platforms, including gaming and digital music devices. The following discussion represents key trends specific to our market opportunities.
Trends Specific to Our Five Market Opportunities
Music: The music market grew during fiscal year 2016 driven by growing consumption of music through mobile devices such as smartphones and tablets. This market growth, together with our investments in the UE brand, our introduction of new products and our ability to gain market share during fiscal year 2016, has driven our growth in this market.
Gaming: The PC Gaming platform continues to show strong growth as online gaming and multi-platform experiences gain greater popularity and gaming content becomes increasingly more demanding. We believe Logitech is well positioned to benefit from the gaming market growth.
Video Collaboration: We are continuing our efforts to create and sell innovative products, including Video Collaboration products, to accommodate the increasing demand from medium sized meeting rooms to small sized rooms such as huddle rooms. During fiscal year 2016, we launched Logitech Group, a transformation in team collaboration that provides high-quality HD video conferencing for groups of up to 20 people and works with the video conferencing applications already in use. We will continue to invest in selected business specific products, targeted product marketing and sales channel development.
Home: This market increased in fiscal year 2016. We are continuing our efforts to sell our Harmony products in this market.
Creativity & Productivity: Although the consumer demand for PC peripherals is slowing, the installed base of PC users is large. We believe that innovative PC peripherals, such as our mice and keyboards, can renew the PC usage experience, providing growth opportunities. Smaller mobile computing devices, such as tablets with touch
Logitech International S.A. | Fiscal 2016 Form 10-K | 40
interfaces, have created new markets and usage models for peripherals and accessories. We offer a number of products to enhance the use of mobile devices, including keyboard folios for the iPad and iPad mini, and keyboard covers and folios for the iPad Air. However, we have seen the market decline through fiscal year 2016 for the iPad platform, which has impacted the sales of our tablet accessories.
Business Application Suite
In fiscal year 2016, we implemented the upgrade of our worldwide business application suite from Oracle version 11i to Oracle version R12. This upgrade created delays in our processing of customer claims related to cooperative marketing arrangements, direct and indirect customer incentive programs and pricing programs. While we are working on enhancing the operational efficiency of the claims processing module in our worldwide business application suite, this has resulted and it may continue to result in higher accruals and allowances for such programs.
Business Seasonality and Product Introductions
We have historically experienced higher net sales in its third fiscal quarter ending December 31, compared to other fiscal quarters in its fiscal year, due in part to seasonal holiday demand. Additionally, new product introductions can significantly impact net sales, product costs and operating expenses. Product introductions can also impact our net sales to its distribution channels as these channels are filled with new product inventory following a product introduction, and often channel inventory of an earlier model product declines as the next related major product launch approaches. Net sales can also be affected when consumers and distributors anticipate a product introduction. However, neither historical seasonal patterns nor historical patterns of product introductions should be considered reliable indicators of our future pattern of product introductions, future net sales or financial performance.
Critical Accounting Estimates
The preparation of financial statements and related disclosures in conformity with U.S. GAAP (Generally Accepted Accounting Principles in the United States of America) requires us to make judgments, estimates and assumptions that affect reported amounts of assets, liabilities, net sales and expenses, and the disclosure of contingent assets and liabilities.
We consider an accounting estimate critical if it: (i) requires management to make judgments and estimates about matters that are inherently uncertain; and (ii) is important to an understanding of our financial condition and operating results.
We base our estimates on historical experience and on various other assumptions we believe to be reasonable under the circumstances. Although these estimates are based on management's best knowledge of current events and actions that may impact us in the future, actual results could differ from those estimates. Management has discussed the development, selection and disclosure of these critical accounting estimates with the Audit Committee of the Board of Directors.
We believe the following accounting estimates are most critical to our business operations and to an understanding of our financial condition and results of operations, and reflect the more significant judgments and estimates used in the preparation of our consolidated financial statements.
Accruals for Customer Programs
We record accruals for cooperative marketing arrangements, customer incentive programs, pricing programs and product returns. An allowance against accounts receivable is recorded for accruals and program activity related to our direct customers and indirect customers who receive payments for program activity through our direct customers. A liability is recorded for accruals and program activity related to our indirect customers who receive payments directly and do not have a right of offset against a receivable balance. The estimated cost of these programs is usually recorded as a reduction of revenue. If we receive a separately identifiable benefit from the customer and can reasonably estimate the fair value of that benefit, such cost is reflected in operating expenses. Significant management judgment and estimates must be used to determine the cost of these programs in any accounting period.
Cooperative Marketing Arrangements. We enter into customer marketing programs with many of our distribution and retail customers, and with certain indirect partners, allowing customers to receive a credit equal to a set percentage of their purchases of our products, or a fixed dollar credit for various marketing programs. The objective of these arrangements is to encourage advertising and promotional events to increase sales of our
Logitech International S.A. | Fiscal 2016 Form 10-K | 41
products. Accruals for these marketing arrangements are recorded at the later of time of sale or time of commitment, based on negotiated terms, historical experience and inventory levels in the channel.
Customer Incentive Programs. Customer incentive programs include performance-based incentives and consumer rebates. We offer performance-based incentives to our distribution customers, retail customers and indirect partners based on pre-determined performance criteria. Accruals for performance-based incentives are recognized as a reduction of the sale price at the time of sale. Estimates of required accruals are determined based on negotiated terms, consideration of historical experience, anticipated volume of future purchases, and inventory levels in the channel. Consumer rebates are offered from time to time at our discretion for the primary benefit of end-users. Accruals for the estimated costs of consumer rebates and similar incentives are recorded at the later of time of sale or when the incentive is offered, based on the specific terms and conditions. Certain incentive programs, including consumer rebates, require management to estimate the number of customers who will actually redeem the incentive based on historical experience and the specific terms and conditions of particular programs.
Pricing Programs. We have agreements with certain customers that contain terms allowing price protection credits to be issued in the event of a subsequent price reduction. At our discretion, we also offer special pricing discounts to certain customers. Special pricing discounts are usually offered only for limited time periods or for sales of selected products to specific indirect partners. Our decision to make price reductions is influenced by product life cycle stage, market acceptance of products, the competitive environment, new product introductions and other factors. Accruals for estimated expected future pricing actions are recognized at the time of sale based on analysis of historical pricing actions by customer and by products, inventories owned by and located at distributors and retailers, current customer demand, current operating conditions, and other relevant customer and product information, such as stage of product life-cycle.
Returns. We grant limited rights to return products. Return rights vary by customer, and range from just the right to return defective product to stock rotation rights limited to a percentage of sales approved by management. Estimates of expected future product returns are recognized at the time of sale based on analyses of historical return trends by customer and by product, inventories owned by and located at distributors and retailers, current customer demand, current operating conditions, and other relevant customer and product information. Upon recognition, we reduce sales and cost of sales for the estimated return. Return trends are influenced by product life cycle status, new product introductions, market acceptance of products, sales levels, product sell-through, the type of customer, seasonality, product quality issues, competitive pressures, operational policies and procedures, and other factors. Return rates can fluctuate over time, but are sufficiently predictable to allow us to estimate expected future product returns.
We regularly evaluate the adequacy of our accruals for cooperative marketing arrangements, customer incentive programs, pricing programs and product returns. Future market conditions and product transitions may require us to take action to increase such programs. In addition, when the variables used to estimate these costs change, or if actual costs differ significantly from the estimates, we would be required to record incremental increases or reductions to revenue or operating expenses. If, at any future time, we become unable to reasonably estimate these costs, recognition of revenue might be deferred until products are sold to users, which would adversely impact revenue in the period of transition.
Inventory Valuation
We must order components for our products and build inventory in advance of customer orders. Further, our industry is characterized by rapid technological change, short-term customer commitments and rapid changes in demand.
We record inventories at the lower of cost or market value and record write-downs of inventories that are obsolete or in excess of anticipated demand or market value. A review of inventory is performed each fiscal quarter that considers factors including the marketability and product life cycle stage, product development plans, component cost trends, demand forecasts and current sales levels. Inventory on hand which is not expected to be sold or utilized is considered excess, and we recognize the write-down in cost of goods sold at the time of such determination. The write-down is determined by comparison of the replacement cost with the estimated selling price less any costs of completion and disposal (net realizable value) and the net realizable value less the normal profit margin. At the time of loss recognition, new cost basis per unit and lower-cost basis for that inventory are established and subsequent changes in facts and circumstances would not result in an increase in the cost basis. If there is an abrupt and substantial decline in demand for Logitech's products or an unanticipated change in technological or customer requirements, we may be required to record additional write-downs that could adversely affect gross margins in the period when the write-downs are recorded.
Logitech International S.A. | Fiscal 2016 Form 10-K | 42
Share-Based Compensation Expense
Share-based compensation expense includes compensation expense reduced for estimated forfeitures. The grant date fair value for stock options and stock purchase rights is estimated using the Black-Scholes-Merton option-pricing valuation model. The grant date fair value of RSUs (restricted stock units) that vest upon meeting certain market conditions is estimated using the Monte-Carlo simulation method. The grant date fair value of time-based RSUs and RSUs with performance conditions is calculated based on the closing market price on the date of grant, adjusted by estimated dividends yield prior to vesting.
Our estimates of share-based compensation expense require a number of complex and subjective assumptions including our stock price volatility, employee exercise patterns, future forfeitures, probability of achievement of the set performance conditions, dividend yield, related tax effects and the selection of an appropriate fair value model. We estimate expected share price volatility based on historical volatility using daily prices over the term of past options, RSUs or purchase offerings, as we consider historical share price volatility as most representative of future volatility. We estimate expected life based on historical settlement rates, which we believe are most representative of future exercise and post-vesting termination behaviors. We use historical data to estimate pre-vesting forfeitures, and we record share-based compensation expense only for those awards that are expected to vest. The dividend yield assumption is based on our history and expectations of future dividend payouts.
The assumptions used in calculating the fair value of share-based compensation expense and related tax effects represent our best estimates, but these estimates involve inherent uncertainties and the application of management judgment. As a result, if factors change and we use different assumptions, or if we decide to use a different valuation model, our share-based compensation expense could be materially different in the future from what we have recorded in the current period, which could materially affect our results of operations.
Accounting for Income Taxes
We operate in multiple jurisdictions and our profits are taxed pursuant to the tax laws of these jurisdictions. Our effective income tax rate may be affected by the changes in or interpretations of tax laws and tax agreements in any given jurisdiction, utilization of net operating loss and tax credit carryforwards, changes in geographical mix of income and expense, and changes in our assessment of matters such as the ability to realize deferred tax assets. As a result of these considerations, we must estimate income taxes in each of the jurisdictions in which we operate. This process involves estimating current tax exposure together with assessing temporary differences resulting from different treatment of items for tax and accounting purposes. These differences result in deferred tax assets and liabilities, which are included in the consolidated balance sheet.
We assess the likelihood that our deferred tax assets will be recovered from future taxable income, considering all available evidence such as historical levels of income, expectations and risks associated with estimates of future taxable income and ongoing prudent and feasible tax strategies. When we determine that it is not more likely than not that we will realize all or part of our deferred tax assets, an adjustment is charged to earnings in the period when such determination is made. Likewise, if we later determine that it is more likely than not that all or a part of our deferred tax assets would be realized, the previously provided valuation allowance would be reversed.
We make certain estimates and judgments about the application of tax laws, the expected resolution of uncertain tax positions and other matters surrounding the recognition and measurement of uncertain tax benefits. In the event that uncertain tax positions are resolved for amounts different than our estimates, or the related statutes of limitations expire without the assessment of additional income taxes, we will be required to adjust the amounts of the related assets and liabilities in the period in which such events occur. Such adjustments may have a material impact on our income tax provision and our results of operations.
Goodwill
We conduct a goodwill impairment analysis annually at December 31 or more frequently if indicators of impairment exist or if a decision is made to sell or exit a business. A significant amount of judgment is involved in determining if an indicator of impairment has occurred. Such indicators may include deterioration in general economic conditions, negative developments in equity and credit markets, adverse changes in the markets in which an entity operates, increases in input costs that have a negative effect on earnings and cash flows, a trend of negative or declining cash flows, a decline in actual or planned revenue or earnings compared with actual and projected results of relevant prior periods, or other relevant entity-specific events such as changes in management,
Logitech International S.A. | Fiscal 2016 Form 10-K | 43
key personnel, strategy or customers, contemplation of bankruptcy, or litigation. The fair value that could be realized in an actual transaction may differ from that used to evaluate the impairment of goodwill.
In reviewing goodwill for impairment, an entity has the option to first assess qualitative factors to determine whether the existence of events or circumstances leads to a determination that it is more likely than not (greater than 50%) that the estimated fair value of a reporting unit is less than its carrying amount. If an entity elects to perform a qualitative assessment and determines that an impairment is more likely than not, the entity is then required to perform the two-step quantitative impairment test; otherwise, no further analysis is required. An entity also may elect not to perform the qualitative assessment and, instead, proceed directly to the two-step quantitative impairment test. The ultimate outcome of the goodwill impairment review for a reporting unit should be the same whether an entity chooses to perform the qualitative assessment or proceeds directly to the two-step quantitative impairment test. Goodwill is allocated among and evaluated for impairment at the reporting unit level, which is defined as an operating segment or one level below an operating segment. We currently have only one reporting unit.
Annual Impairment analysis
We performed our annual impairment analysis of the goodwill at December 31, 2015 by performing a qualitative assessment and concluded that it was more likely than not that the fair value of the peripheral reporting unit exceeded its carrying amount. Refer to the Note 11 to the consolidated financial statements included in this Annual Report on Form 10-K for the disclosures.
Product Warranty Accrual
We estimate the cost of product warranties at the time the related revenue is recognized based on historical and projected warranty claim rates, historical and projected costs, and knowledge of specific product failures that are outside of our typical experience. Each fiscal quarter, we reevaluate estimates to assess the adequacy of recorded warranty liabilities considering the size of the installed base of products subject to warranty protection and adjust the amounts as necessary. If actual product failure rates or repair costs differ from estimates, revisions to the estimated warranty liabilities would be required and could materially affect our results of operations.
Adoption of New Accounting Pronouncements
In April 2014, the FASB issued ASU No. 2014-08, "Presentation of Financial Statements (Topic 205) and Property, Plant and Equipment (Topic 360): Reporting Discontinued Operations and Disclosures of Disposals of Components of an Entity". This new standard raises the threshold for a disposal to qualify as a discontinued operation and requires new disclosures of both discontinued operations and certain other disposals that do not meet the definition of a discontinued operation. The standard is effective prospectively for years beginning on or after December 15, 2014, with early application permitted. We adopted ASU No. 2014-08 on April 1, 2015 on a prospective basis and applied the guidance to our disposition of the Lifesize video conferencing business.
In November 2015, the FASB issued ASU No. 2015-17, “Income Taxes (Topic 740), Balance Sheet Classification of Deferred Taxes” ("ASU 2015-17"). The guidance eliminates the current requirement for an entity to separate deferred income tax liabilities and assets into current and non-current amounts in a classified balance sheet. Instead, the guidance requires deferred tax liabilities, deferred tax assets and valuation allowances be classified as non-current in a classified balance sheet. The ASU is effective for annual reporting periods beginning after December 15, 2016 and interim periods within those annual periods. Early adoption is permitted. We have early adopted the guidance in the fourth quarter of fiscal year 2016 on a prospective basis. Prior periods are therefore not adjusted.
Refer to the Note 2 to the consolidated financial statements included in this Annual Report on Form 10-K for recent accounting pronouncements to be adopted.
Logitech International S.A. | Fiscal 2016 Form 10-K | 44
Non-GAAP Measures
We refer to our net sales excluding the impact of currency exchange rate fluctuations as "constant dollar" sales. Constant dollar sales is a non-GAAP financial measure, which is information derived from consolidated financial information but not presented in our financial statements prepared in accordance with U.S. GAAP. Our management uses these non-GAAP measures in its financial and operational decision-making, and believes these non-GAAP measures, when considered in conjunction with the corresponding GAAP measures, facilitate a better understanding of changes in net sales. Percentage of constant dollar sales growth is calculated by translating prior period sales in each local currency at the current period’s average exchange rate for that currency and comparing that to current period sales. This non-GAAP financial measure is not intended to be considered in isolation from, or as a substitute for, a measure of financial performance prepared in accordance with GAAP. There are inherent limitations associated with the use of this non-GAAP financial measure as an analytical tool. In particular, this non-GAAP financial measure is not based on a comprehensive set of accounting rules or principles, may be different from non-GAAP financial measures used by other companies, and is not necessarily comparable to similarly-titled measures presented by other companies, limiting its usefulness for comparison purposes. Moreover, presentation of revenue on a constant currency basis is provided for year-over-year comparison purposes only, and investors should be cautioned that the effect of changing currency exchange rates has an actual effect on our operating results in U.S. Dollars.
Given our global sales presence and the reporting of our financial results in U.S. Dollars, our financial results for fiscal year 2016 were affected by significant shifts in currency exchange rates during fiscal year 2016. See “Results of Operations” beginning for information on the effect of currency exchange results on our net sales. If the U.S. Dollar appreciates in comparison to other currencies in future periods, this will affect our results of operations in future periods as well.
Results of Operations
Net Sales
Net sales by channel for fiscal years 2016, 2015 and 2014 were as follows (Dollars in thousands):
Years Ended March 31, | Change | |||||||||||||||||
2016 | 2015 | 2014 | 2016 vs. 2015 | 2015 vs. 2014 | ||||||||||||||
Retail | $ | 1,947,059 | $ | 1,887,446 | $ | 1,866,279 | 3 | % | 1 | % | ||||||||
OEM | 71,041 | 117,462 | 141,749 | (40 | ) | (17 | ) | |||||||||||
Total net sales | $ | 2,018,100 | $ | 2,004,908 | $ | 2,008,028 | 1 | — | ||||||||||
Retail:
During fiscal year 2016, retail sales increased 3%, in comparison to fiscal year 2015. If currency exchange rates had been constant in 2016 and 2015, our constant dollar retail sales would have increased 9%. The increase in sales was driven by double digit growth in Mobile Speakers, Gaming and Video Collaboration product categories.
During fiscal year 2015, retail sales increased 1%, compared to fiscal year 2014. If currency exchange rates had been constant in 2015 and 2014, our constant dollar retail sales would have increased 4%. The increase in retail sales is primarily due to triple-digit growth in Mobile Speakers and Video Collaboration product categories, and double-digit growth in Gaming product category, partially offset by declines in Audio-PC & Wearables, Tablet & Other Accessories, PC webcams and the other product categories, compared to fiscal year 2014.
OEM:
During fiscal year 2016, OEM sales decreased 40%, compared to fiscal year 2015. The decline was primarily due to the exit from our OEM business in December 2015, and there was no revenue during the quarter ended March 31, 2016.
During fiscal year 2015, OEM sales decreased 17% compared to fiscal year 2014.
Logitech International S.A. | Fiscal 2016 Form 10-K | 45
Sales Denominated in Other Currencies
Although our financial results are reported in U.S. Dollars, a portion of our sales were generated in currencies other than the U.S. Dollar, such as the Euro, Chinese Renminbi, Japanese Yen, Canadian Dollar, Taiwan Dollar, British Pound and Australian Dollar. During fiscal years 2016, 2015 and 2014, 48%, 47% and 48% of our net sales were denominated in currencies other than the U.S. Dollar, respectively.
Retail Sales by Region
The following table presents the change in retail sales by region for fiscal year 2016 compared with fiscal year 2015, and fiscal year 2015 compared with fiscal year 2014:
2016 vs. 2015 | 2015 vs. 2014 | |||||
Americas | 3 | % | 8 | % | ||
EMEA | (1 | ) | (7 | ) | ||
Asia Pacific | 10 | 2 | ||||
Americas
During fiscal year 2016, retail sales in Americas increased 3%, compared to fiscal year 2015. If currency exchange rates had been constant in 2016 and 2015, our constant dollar retail sales would have increased 5% in the Americas. This increase was led by double digit growth in the Video Collaboration product category mainly from the Webcam C930e, ConfereneceCam Connect, and PTZ Pro Camera, and double digit growth in the Mobile Speakers product category driven by the UE Boom 2 as well as the UE Megaboom.
During fiscal year 2015, retail sales in Americas increased 8%, compared to fiscal year 2014. If currency exchange rates had been constant in 2015 and 2014, our constant dollar retail sales would have increased 9% in the Americas. We achieved sales increases in all categories except Audio-PC & Wearables, PC webcams, and Tablets & Other Accessories. This increase was led by triple digit growth in Mobile Speakers mainly from UE BOOM and UE MEGABOOM, and triple digit growth in the Video Collaboration product category mainly from our ConferenceCam CC3000e and Webcam C930e.
EMEA
During fiscal year 2016, retail sales in EMEA decreased 1%, compared to fiscal year 2015. If currency exchange rates had been constant in 2016 and 2015, our constant dollar retail sales would have increased 9% in the EMEA region. Double digit growth in Gaming, Video Collaboration and Mobile Speakers product categories were offset by declines in all other product categories.
During fiscal year 2015, retail sales in EMEA decreased 7%, compared to fiscal year 2014. If currency exchange rates had been constant in 2015 and 2014, our constant dollar retail sales would have decreased 3% in the EMEA region. Retail sales decreased across all categories except Gaming, Mobile Speakers, Video Collaboration, Home Control and Keyboards and Combos product categories. The decline in sales was heavily impacted by market weakness in Russia and Ukraine. We achieved triple digit growth in the Video Collaboration product category, and double digit growth in both Mobile Speakers and Gaming product categories during fiscal year 2015 compared to fiscal year 2014.
Asia Pacific
During fiscal year 2016, retail sales in Asia Pacific increased 10%, compared to fiscal year 2015. If currency exchange rates had been constant in 2016 and 2015, our constant dollar retail sales would have increased 15% in the Asia Pacific region. We achieved double digit growth in Video Collaboration, PC Webcams, Mobile Speakers and Gaming product categories, partially offset by the decline in Tablets & Other Accessories and Home Control product categories.
During fiscal year 2015, retail sales in Asia Pacific increased 2%, compared to fiscal year 2014. If currency exchange rates had been constant in 2015 and 2014, our constant dollar retail sales would have increased 4% in the Asia Pacific region. We achieved triple digit growth in both Mobile Speakers and Video Collaboration product categories, partially offset by the decline in Tablets & Other Accessories, Audio - PC Wearables, and Other categories.
Logitech International S.A. | Fiscal 2016 Form 10-K | 46
Net Retail Sales by Product Categories
Net retail sales by product categories for fiscal years 2016, 2015 and 2014 were as follows (Dollars in thousands):
Years Ended March 31, | Change | |||||||||||||||||
2016 | 2015 | 2014 | 2016 vs. 2015 | 2015 vs. 2014 | ||||||||||||||
Mobile Speakers | $ | 229,718 | $ | 178,038 | $ | 87,414 | 29 | % | 104 | % | ||||||||
Audio-PC & Wearables | 196,013 | 213,496 | 250,037 | (8 | ) | (15 | ) | |||||||||||
Gaming | 245,101 | 211,911 | 186,926 | 16 | 13 | |||||||||||||
Video Collaboration | 89,322 | 62,215 | 29,058 | 44 | 114 | |||||||||||||
Home Control | 59,075 | 68,060 | 67,371 | (13 | ) | 1 | ||||||||||||
Pointing Devices | 492,543 | 487,210 | 506,884 | 1 | (4 | ) | ||||||||||||
Keyboards & Combos | 430,190 | 426,117 | 415,314 | 1 | 3 | |||||||||||||
Tablet & Other Accessories | 103,886 | 140,994 | 172,484 | (26 | ) | (18 | ) | |||||||||||
PC Webcams | 98,641 | 96,680 | 113,791 | 2 | (15 | ) | ||||||||||||
Other (1) | 2,570 | 2,725 | 37,000 | (6 | ) | (93 | ) | |||||||||||
Total net retail sales | $ | 1,947,059 | $ | 1,887,446 | $ | 1,866,279 | 3 | 1 | ||||||||||
__________________________________________
(1) | Other category includes products that we currently intend to transition out of, or have already transitioned out of, because they are no longer strategic to our business. |
Retail Sales by Product Categories:
Music market:
Mobile Speakers
Our Mobile Speakers category is made up entirely of bluetooth wireless speakers.
During fiscal year 2016, retail sales of Mobile Speakers increased 29%, compared to fiscal year 2015. The sales increased by double digits across all three regions, primarily due to strong demand of UE Boom 2, UE Megaboom and UE Roll bluetooth wireless speakers.
During fiscal year 2015, retail sales of Mobile Speakers increased 104%, compared to fiscal year 2014. The sales increased significantly across all three regions, with a triple digit growth in both Americas and Asia Pacific regions, primarily due to strong demand for the UE BOOM, and experienced triple digit growth in fiscal year 2015 compared to fiscal year 2014. The successful launch of UE MEGABOOM during the fourth quarter of fiscal year 2015 contributed 6% of total Mobile Speakers sales for fiscal year 2015.
Audio-PC & Wearables
Our Audio-PC & Wearables category comprises PC speakers, PC headsets, in-ear headphones and premium wireless audio wearables.
During fiscal year 2016, retail sales of Audio-PC & Wearables decreased 8%, compared to fiscal year 2015. The decrease was primarily due to decreases in sales in PC Speakers and PC Headsets, partially offset slightly by an increase in audio wearables. Retail sales of our headset products decreased 6%. Retail sales of our Wearables products increased 46%.
During fiscal year 2015, retail sales of Audio-PC & Wearables decreased 15%, compared to fiscal year 2014. The decrease was primarily due to decreases in PC Speaker retail sales, reflecting a category that appears to be in structural decline as music consumption continues to migrate to mobile platforms, which benefits our Mobile Speakers product category. Retail sales of our PC Headset products decreased 4%. Retail sales of our Wearables products declined 35%.
Logitech International S.A. | Fiscal 2016 Form 10-K | 47
Gaming market:
Gaming
Our Gaming category comprises gaming mice, keyboards, headsets, gamepads and steering wheels.
During fiscal year 2016, retail sales of Gaming increased 16%, compared to fiscal year 2015 with double digit growth for gaming keyboards, gaming headsets, and gaming steering wheels. Some of our top revenue generating products for the year include G29 Driving Force Racing Wheel, G920 Driving Force Wheel, G933 Artemis Spectrum, and the G910 Orion Spark gaming keyboard. New products made up 22% of total Gaming revenue for fiscal year 2016.
During fiscal year 2015, retail sales of Gaming increased 13%, compared to fiscal year 2014. This growth was primarily from gaming headsets and gaming mice due to the launch of our new gaming products, including mice, keyboards and headsets. New products made up 12% of total Gaming revenue for fiscal year 2015. Our top revenue-generating Gaming products included the Logitech G502 Proteus Core, the Logitech G27 Racing Wheel, the Logitech G930 Wireless Gaming Headset, and the G430 Cordless Mice.
Video Collaboration market:
Video Collaboration
Our Video Collaboration category primarily includes products which combine audio and video and other products that can connect small and medium sized user groups.
During fiscal year 2016, retail sales of Video Collaboration increased 44%, compared to fiscal year 2015. The sales increase in this category was primarily driven by the success of ConferenceCam Connect, PTZ Pro Camera, and Webcam C930e.
During fiscal year 2015, retail sales of Video Collaboration increased 114%, compared to fiscal year 2014. The sales increased significantly across all products in this category, primarily driven by the success of the Logitech ConferenceCam CC3000e and Logitech ConferenceCam C930e.
Home market:
Home Control
Our Home Control category includes our Harmony remotes and Harmony Home Control.
During fiscal year 2016, retail sales of Home Control decreased 13%, compared to fiscal year 2015. The decline was primarily driven by the sales decrease of our mid-range products. New products contributed 24% of total retail sales of Home Control for fiscal year 2016.
During fiscal year 2015, retail sales of Home Control increased 1%, compared to fiscal year 2014. The increase in Home Control was primarily concentrated in our mid-range and low-end products, partially offset by decreases in our high-end products. New products contributed 17% of total retail sales of Home Control for fiscal year 2015.
Creativity and Productivity market:
Pointing Devices
Our Pointing Devices category comprises PC and Mac-related mice, touchpads and presenters.
During fiscal year 2016, retail sales of Pointing Devices increased 1%, in comparison to fiscal year 2015. The growth in this category was driven by the MX Master Wireless Mouse. New products contributed approximately 8% of total retail sales of Pointing Devices for fiscal year 2016.
During fiscal year 2015, retail sales of Pointing Devices decreased 4%, compared to fiscal year 2014. The decrease in retail sales was primarily due to the continued weakness in the global PC market. The decrease was primarily from our high-end product offerings, which decreased 12%, followed by our low-end product offerings, which decreased 5%, partially offset by our mid-range product offerings, which increased 1%. Retail sales of corded mice decreased 4%, and retail sales of cordless mice decreased 5%.
Logitech International S.A. | Fiscal 2016 Form 10-K | 48
Keyboards & Combos
Our Keyboards & Combos category comprises PC keyboards and keyboard/mice combo products.
During fiscal year 2016, retail sales of Keyboards & Combos increased 1%, compared to fiscal year 2015. The sales increase was driven mainly by cordless keyboards which grew 17%. Our best selling products in this category include the Wireless MK270 and MK520 Wireless combos.
During fiscal year 2015, retail sales of Keyboards & Combos increased 3%, compared to fiscal year 2014. The sales increase was primarily due to sales increase in our corded and cordless combos. Retail sales of corded and cordless combos increased 19% and 6%, respectively. Our best selling products in this category were the Logitech Wireless MK270 and MK520 Wireless combos, which feature powerful and reliable wireless connections and plug-and-play simplicity. Retail sales of corded and cordless keyboards decreased 9% and 7%, respectively.
Tablet & Other Accessories
Our Tablet & Other Accessories category comprises keyboards and covers for tablets and smartphones as well as other accessories for mobile devices.
During fiscal year 2016, retail sales of Tablet & Other Accessories decreased 26%, compared to fiscal year 2015. The reduction in sales reflects the combination of a declining market for iPad shipments, partially offset by the new product introduction of Create backlit tablet keyboard case for iPad Pro.
During fiscal year 2015, retail sales of Tablet & Other Accessories decreased 18%, compared to fiscal year 2014. The reduction in sales, primarily from tablet keyboards, reflects the combination of a declining demand for the iPad tablet platform and increased competition, partially offset by sales growth with our tablet covers for the iPads.
PC Webcams
Our PC Webcams category comprises PC-based webcams targeted primarily at consumers.
During fiscal year 2016, retail sales of PC Webcams increased 2%, compared to fiscal year 2015. The growth was primarily driven by Asia Pacific, with sales nearly doubling.
During fiscal year 2015, retail sales of PC Webcams decreased 15%, compared to fiscal year 2014. The weak sales reflect the ongoing structural decline of the consumer webcam market.
Other:
This category comprises a variety of products that we currently intend to transition out of, or have already transitioned out of, because they are no longer strategic to our business. Products currently included in this category include TV camera, Digital Video Security, TV and home speakers, Google TV products, Keyboard/Desktop accessories, and music docks.
During fiscal year 2016, retail sales of this category decreased 6%, compared to fiscal year 2015. During fiscal year 2015, retail sales of this category decreased 93%, compared to fiscal year 2014.
Gross Profit
Gross profit for fiscal years 2016, 2015 and 2014 was as follows (Dollars in thousands):
Years Ended March 31, | Change | |||||||||||||||||
2016 | 2015 | 2014 | 2016 vs. 2015 | 2015 vs. 2014 | ||||||||||||||
Net sales | $ | 2,018,100 | $ | 2,004,908 | $ | 2,008,028 | 1 | % | — | % | ||||||||
Cost of goods sold | 1,337,053 | 1,299,451 | 1,346,489 | 3 | (3 | ) | ||||||||||||
Gross profit | $ | 681,047 | $ | 705,457 | $ | 661,539 | (3 | ) | 7 | |||||||||
Gross margin | 33.7 | % | 35.2 | % | 32.9 | % | ||||||||||||
Gross profit consists of net sales, less cost of goods sold, which includes materials, direct labor and related overhead costs, costs of manufacturing facilities, royalties, costs of purchasing components from outside suppliers, distribution costs, warranty costs, customer support, shipping and handling cost, outside processing costs, write-down of inventories and amortization of intangible assets.
Logitech International S.A. | Fiscal 2016 Form 10-K | 49
Gross margin is gross profit as a percentage of net sales. The decrease in gross margin during fiscal year 2016, compared to fiscal year 2015, is primarily driven by unfavorable fluctuations in currency exchange rates, partially offset by sales price increases and savings from supply chain efficiencies related to freight.
The increase in gross margin during fiscal year 2015, compared to fiscal year 2014, primarily resulted from an improvement attributable to cost reduction initiatives across the Pointing Devices, Keyboards & Combos and Mobile Speakers product categories, an improvement attributable to exiting non-strategic product categories, an improvement attributable to a $5.2 million discontinued products write-off in fiscal year 2014, and an improvement attributable to lower inventory reserves in fiscal year 2015 that were partially offset by a higher percentage of air shipments in fiscal year 2015.
Operating Expenses
Operating expenses for fiscal years 2016, 2015 and 2014 were as follows (Dollars in thousands):
Years Ended March 31, | Change | |||||||||||||||||
2016 | 2015 | 2014 | 2016 vs. 2015 | 2015 vs. 2014 | ||||||||||||||
Marketing and selling | $ | 319,015 | $ | 321,749 | $ | 322,707 | (1 | )% | — | % | ||||||||
% of net sales | 15.8 | % | 16.0 | % | 16.1 | % | ||||||||||||
Research and development | 113,624 | 108,306 | 112,446 | 5 | (4 | ) | ||||||||||||
% of net sales | 5.6 | % | 5.4 | % | 5.6 | % | ||||||||||||
General and administrative | 101,548 | 125,995 | 112,689 | (19 | ) | 12 | ||||||||||||
% of net sales | 5.0 | % | 6.3 | % | 5.6 | % | ||||||||||||
Restructuring charges (Credits), net | 17,802 | (4,777 | ) | 8,001 | (473 | ) | (160 | ) | ||||||||||
% of net sales | 0.9 | % | (0.2 | )% | 0.4 | % | ||||||||||||
Total operating expenses | $ | 551,989 | $551,273 | $ | 555,843 | — | (1 | ) | ||||||||||
% of net sales | 27.4 | % | 27.5 | % | 27.7 | % | ||||||||||||
Total operating expenses during fiscal year 2016 remained relatively flat, compared to fiscal year 2015, with increase in restructuring charges due to restructuring charges of $17.8 million in fiscal year 2016 compared to a restructuring credit of $4.8 million in fiscal year 2015, and increase in research and development expense partially offset by the decrease in general and administrative expense. Marketing and selling expenses were relatively flat.
The decrease in total operating expenses during fiscal year 2015, compared to fiscal year 2014, was mainly due to a restructuring credit of $4.8 million during fiscal year 2015 resulting from partial lease termination of our Silicon Valley campus, which was previously vacated and under a restructuring plan during fiscal year 2014, as opposed to a restructuring charge of $8.0 million during fiscal year 2014.
Marketing and Selling
Marketing and selling expenses consist of personnel and related overhead costs, corporate and product marketing, promotions, advertising, trade shows, customer and technical support and facilities costs.
During fiscal year 2016, marketing and selling expenses decreased by 1%, compared to fiscal year 2015. The decrease was primarily due to currency impact, offset by investments in growth markets.
During fiscal year 2015, marketing and selling expenses remained flat, compared to fiscal year 2014.
Research and Development
Research and development expenses consist of personnel and related overhead costs, contractors and outside consultants, supplies and materials, equipment depreciation and facilities costs, all associated with the design and development of new products and enhancements of existing products.
During fiscal year 2016, research and development expenses increased by 5%, compared to fiscal year 2015. The increase was primarily due to $4.6 million higher personnel-related expenses and $0.8 million higher consulting cost related to continuing investment in enhancement of existing products and development of new products.
Logitech International S.A. | Fiscal 2016 Form 10-K | 50
During fiscal year 2015, research and development expenses decreased 4%, compared to fiscal year 2014. The decrease was primarily due to a $1.5 million decrease in outsourcing research and development activities during fiscal year 2015, and $1.5 million savings from depreciation and amortization expense.
General and Administrative
General and administrative expenses consist primarily of personnel and related overhead and facilities costs for the finance, information systems, executives, human resources and legal functions.
During fiscal year 2016, general and administrative expenses decreased by 19%, compared to fiscal year 2015. The decrease was primarily due to reduction of $19.1 million related to the Audit Committee independent investigation and related expenses incurred in fiscal year 2015 and a $2.5 million decrease in personnel-related cost.
During fiscal year 2015, general and administrative expense increased 12% compared to fiscal year 2014. The increase was primarily due to $23.7 million in expense related to the Audit Committee independent investigation and related expenses, partially offset by infrastructure cost savings such as a $6.8 million decrease in information technology costs, including third party vendor cost, and a $5.2 million decrease in facility expense as a result of the consolidation of properties.
Restructuring Charges
The following table summarizes restructuring-related activities during the fiscal years 2016 and 2015 from continuing operations (in thousands):
Restructuring - Continuing Operations | ||||||||||||||||
Termination Benefits | Lease Exit Costs | Other | Total | |||||||||||||
Accrual balance at March 31, 2014 | $ | — | $ | 7,309 | $ | — | $ | 7,309 | ||||||||
Credits, net | — | (4,777 | ) | — | (4,777 | ) | ||||||||||
Cash payments | — | (1,578 | ) | — | (1,578 | ) | ||||||||||
Accrual balance at March 31, 2015 | — | 954 | — | 954 | ||||||||||||
Charges, net | 17,280 | 337 | 185 | 17,802 | ||||||||||||
Cash payments | (11,373 | ) | (1,166 | ) | (185 | ) | (12,724 | ) | ||||||||
Accrual balance at March 31, 2016 | $ | 5,907 | $ | 125 | $ | — | $ | 6,032 | ||||||||
The following table summarizes restructuring-related activities during the fiscal years 2016 and 2015 from discontinued operations (in thousands):
Restructuring - Discontinued Operations | ||||||||||||||||
Termination Benefits | Lease Exit Costs | Other | Total | |||||||||||||
Accrual balance at March 31, 2014 | $ | 142 | $ | 110 | $ | — | $ | 252 | ||||||||
Charges | (86 | ) | (25 | ) | — | (111 | ) | |||||||||
Cash payments | (56 | ) | — | — | (56 | ) | ||||||||||
Accrual balance at March 31, 2015 | — | 85 | — | 85 | ||||||||||||
Charges, net | 7,095 | — | 805 | 7,900 | ||||||||||||
Cash payments | (6,460 | ) | (14 | ) | (805 | ) | (7,279 | ) | ||||||||
Adjustment as a result of disposition of discontinued operations | (267 | ) | (71 | ) | — | (338 | ) | |||||||||
Accrual balance at March 31, 2016 | $ | 368 | $ | — | $ | — | $ | 368 | ||||||||
During the first quarter of fiscal year 2016, we implemented a restructuring plan to exit the OEM business, reorganize Lifesize to sharpen its focus on its cloud-based offering, and streamline our overall cost structure, including overhead and infrastructure cost reductions with a targeted resource realignment. Restructuring charges incurred during the year ended March 31, 2016 under this plan primarily consisted of severance and other ongoing
Logitech International S.A. | Fiscal 2016 Form 10-K | 51
and one-time termination benefits. Charges and other costs related to the workforce reduction and structure realignment are presented as restructuring charges in the Consolidated Statements of Operations. On a total company basis, including the Lifesize video conferencing business as reported in discontinued operations, we have incurred $25.5 million under this restructuring plan, including $24.4 million for cash severance and other personnel costs. We have paid $19.0 million as of March 31, 2016, on a total company basis. We substantially completed this restructuring plan by the fourth quarter of fiscal year 2016, subject to the payment of accrued balance as noted above.
During the fourth quarter of fiscal year 2013, we implemented a restructuring plan to align its organization to its strategic priorities of increasing focus on mobility products, improving profitability in PC-related products and enhancing global operational efficiencies. As part of this restructuring plan, we reduced our worldwide non-direct labor workforce. Restructuring charges under this plan primarily consisted of severance and other one-time termination benefits. During fiscal year 2015, we recorded a $4.9 million restructuring credit on a total company basis, primarily as a result of partial termination of our lease agreement for the Silicon Valley campus, which was previously vacated under the restructuring plan during fiscal year 2014. We substantially completed this restructuring plan by the fourth quarter of fiscal year 2014.
Interest Income (Expense), Net
Interest income and expense for fiscal years 2016, 2015 and 2014 were as follows (in thousands):
Years Ended March 31, | ||||||||||||
2016 | 2015 | 2014 | ||||||||||
Interest income | $ | 790 | $ | 1,197 | $ | 1,797 | ||||||
Interest expense | — | — | (2,228 | ) | ||||||||
$ | 790 | $ | 1,197 | $ | (431 | ) | ||||||
Interest expense decreased during fiscal year 2015, compared to fiscal year 2014. The decrease was primarily due to the termination of our $250 million Senior Revolving Credit Facility during fiscal year 2014. There were no new borrowings since then.
Other Income (Expense), Net
Other income and expense for fiscal years 2016, 2015 and 2014 were as follows (in thousands):
Years Ended March 31, | ||||||||||||
2016 | 2015 | 2014 | ||||||||||
Investment income (loss) related to deferred compensation plan | $ | (364 | ) | $ | 1,055 | $ | 1,487 | |||||
Impairment of investments | — | (2,298 | ) | (624 | ) | |||||||
Currency exchange gain (loss), net | 2,110 | (1,175 | ) | (62 | ) | |||||||
Other | (122 | ) | 120 | 1,238 | ||||||||
$ | 1,624 | $ | (2,298 | ) | $ | 2,039 | ||||||
Investment income (loss) for fiscal years 2016, 2015 and 2014 represents earnings, gains, and losses on trading investments related to a deferred compensation plan offered by one of our subsidiaries.
The $2.3 million and $0.6 million investment impairment charges in fiscal years 2015 and 2014, respectively, primarily resulted from the write-down of investments in privately-held companies.
Currency exchange gains or losses relate to balances denominated in currencies other than the functional currency in our subsidiaries, as well as to the sale of currencies, and to gains or losses recognized on foreign currency exchange forward contracts. We do not speculate in currency positions, but we are alert to opportunities to maximize foreign exchange gains and minimize foreign currency exchange losses.
Logitech International S.A. | Fiscal 2016 Form 10-K | 52
Provision for Income Taxes
The provision for income taxes and the effective income tax rate for fiscal years 2016, 2015 and 2014 were as follows (in thousands):
Years Ended March 31, | ||||||||||||
2016 | 2015 | 2014 | ||||||||||
Provision for income taxes | $ | 3,110 | $ | 4,654 | $ | 1,313 | ||||||
Effective income tax rate | 2.4 | % | 3.0 | % | 1.2 | % | ||||||
The changes in the effective income tax rate between fiscal years 2016 and 2015 and between fiscal years 2015 and 2014 were primarily due to the mix of income and losses in the various tax jurisdictions in which we operate. Further, there was a tax benefit of $16.1 million in fiscal year 2016 related to the reversal of uncertain tax positions resulting from the expiration of the statutes of limitations. In fiscal year 2015, there was a tax benefit of $15.4 million related to the reversal of uncertain tax positions resulting from the expiration of the statutes of limitations and the closure of tax examination in the State of California of the United States. In fiscal year 2014, there was a tax benefit of $14.3 million related to the reversal of uncertain tax positions resulting from the expiration of the statutes of limitations.
On December 18, 2015, the enactment of the Protecting Americans from Tax Hikes Act of 2015 in the United States extended the federal research and development tax credit permanently which had previously expired on December 31, 2014. The provision for income taxes for fiscal year ended March 31, 2016 reflected a $1.5 million tax benefit as a result of the extension of the tax credit.
As of March 31, 2016 and March 31, 2015, the total amounts of unrecognized tax benefits due to uncertain tax positions were $69.9 million and $79.0 million, respectively, all of which would affect the effective income tax rates if recognized.
As of March 31, 2016, we had $59.7 million in non-current income taxes payable and $0.1 million in current income taxes payable, including interest and penalties, related to our income tax liability for uncertain tax positions. As of March 31, 2015, we had $72.1 million in non-current income taxes payable and $0.1 million in current income taxes payable. We continue to recognize interest and penalties related to unrecognized tax positions in income tax expense. We recognized $0.3 million, $0.8 million and $1.1 million in interest and penalties in income tax expense during fiscal years 2016, 2015 and 2014, respectively. As of March 31, 2016, 2015 and 2014, we had $3.6 million, $4.9 million and $5.6 million of accrued interest and penalties related to uncertain tax positions, respectively.
We file Swiss and foreign tax returns. We received final tax assessments in Switzerland through fiscal year 2013. For other foreign jurisdictions such as the United States, we are generally not subject to tax examinations for years prior to fiscal year 2012. We are under examination and have received assessment notices in foreign tax jurisdictions. If the examinations are resolved unfavorably, there is a possibility they may have a material negative impact on our results of operations.
Liquidity and Capital Resources
Cash Balances, Available Borrowings, and Capital Resources
At March 31, 2016, we had cash and cash equivalents of $519.2 million, compared with $533.4 million at March 31, 2015. Our cash and cash equivalents consist of bank demand deposits and short-term time deposits of which 74% is held by our Swiss-based entities and 17% is held by our subsidiaries in Hong Kong and China. We do not expect to incur any material adverse tax impact except for what has been recognized or be significantly inhibited by any country in which we do business from the repatriation of funds to Switzerland, our home domicile.
At March 31, 2016, our working capital was $511.3 million, compared with working capital of $563.8 million at March 31, 2015, excluding working capital from discontinued operations. The decrease in working capital over the prior year was primarily due to lower balances of cash and cash equivalents, inventories, accounts receivables, net, and deferred tax assets which were reclassified to non-current assets as of March 31, 2016 pursuant to the adoption of ASU 2015-17, partially offset by lower accounts payable at March 31, 2016.
During fiscal year 2016, we generated $183.1 million cash from operating activities. Our main sources of operating cash flows were from net income after adding back non-cash expenses of depreciation, amortization, and share-based compensation expense, and from decrease in inventories and accounts receivable, net, partially offset
Logitech International S.A. | Fiscal 2016 Form 10-K | 53
by decrease in accounts payable and a decrease in accrued and other liabilities. Net cash used in investing activities was $60.7 million, primarily for purchase of property, plant, and equipment of $56.6 million, and investments in privately held companies of $2.4 million, and payments for divestiture of discontinued operations net of cash sold of $1.4 million. Net cash used in financing activities was $141.7 million, primarily for the $85.9 million cash dividends paid during the year, $70.4 million purchase of treasury shares and $7.2 million tax withholdings related to net share settlements of restricted stock units, partially offset by $19.8 million proceeds received from the sale of shares upon exercise of options and purchase rights.
We had several uncommitted, unsecured bank lines of credit aggregating to $45.7 million as of March 31, 2016. There are no financial covenants under these lines of credit with which we must comply. As of March 31, 2016, we had outstanding bank guarantees of $19.7 million under these lines of credit. There are no financial covenants under these credit lines.
The following table summarizes our Consolidated Statements of Cash Flows (in thousands):
Years Ended March 31, | ||||||||||||
2016 | 2015 | 2014 | ||||||||||
Net cash provided by operating activities | $ | 183,111 | $ | 178,632 | $ | 205,421 | ||||||
Net cash used in investing activities | (60,690 | ) | (48,289 | ) | (46,803 | ) | ||||||
Net cash used in financing activities | (141,669 | ) | (48,854 | ) | (22,681 | ) | ||||||
Effect of exchange rate changes on cash and cash equivalents | 1,405 | (13,863 | ) | (349 | ) | |||||||
Net increase (decrease) in cash and cash equivalents | $ | (17,843 | ) | $ | 67,626 | $ | 135,588 | |||||
The following amounts reflected in the table above are from discontinued operations: | ||||||||||||
Depreciation | $ | 2,207 | $ | 2,562 | $ | 3,402 | ||||||
Amortization of other intangible assets | $ | 1,438 | $ | 7,598 | $ | 15,369 | ||||||
Share-based compensation | $ | 332 | $ | 1,634 | $ | 2,318 | ||||||
Purchases of property, plant and equipment | $ | 1,431 | $ | 3,598 | $ | 4,233 | ||||||
Cash and cash equivalents, beginning of the period | $ | 3,659 | $ | 1,894 | $ | 2,326 | ||||||
Cash and cash equivalents, end of the period | $ | — | $ | 3,659 | $ | 1,894 | ||||||
Cash Flow from Operating Activities
The following table presents selected financial information and statistics for fiscal years 2016, 2015 and 2014 (dollars in thousands):
March 31, | ||||||||||||
2016 | 2015 | 2014 | ||||||||||
Accounts receivable, net | $ | 142,778 | $ | 167,196 | $ | 166,877 | ||||||
Inventories | 228,786 | 255,980 | 212,599 | |||||||||
Days sales in accounts receivable ("DSO")(Days)(1) | 30 | 34 | 33 | |||||||||
Inventory turnover ("ITO")(x)(2) | 5.0 | 4.7 | 6.0 | |||||||||
______________________________
(1) | DSO is determined using ending accounts receivable as of the most recent quarter-end and net sales for the most recent quarter. |
(2) | ITO is determined using ending inventories and annualized cost of goods sold (based on the most recent quarterly cost of goods sold). |
Inventory turnover as of March 31, 2016 increased compared to March 31, 2015. The increase was primarily due to our exit from the OEM business at the end of the quarter ended December 31, 2015 and with no OEM inventories as of March 31, 2016.
Logitech International S.A. | Fiscal 2016 Form 10-K | 54
Inventory turnover as of March 31, 2015 decreased compared to March 31, 2014. The decrease was primarily due to higher inventory levels due to the port strike on the west coast of the United States and change in shipping strategy from air to ocean during the fourth quarter of fiscal year 2015.
If we are not successful in launching and phasing in our new products launched during the current fiscal year, or we are not able to sell the new products at the prices planned, it could have a material impact on our revenue, gross profit margin, operating results including operating cash flow, and inventory turnover in the future.
Cash Flow from Investing Activities
The following table presents cash flow from investing activities for fiscal years 2016, 2015 and 2014 (dollars in thousands):
Years Ended March 31, | ||||||||||||
2016 | 2015 | 2014 | ||||||||||
Purchases of property, plant and equipment | $ | (56,615 | ) | $ | (45,253 | ) | $ | (46,658 | ) | |||
Investment in privately held companies | (2,419 | ) | (2,550 | ) | (300 | ) | ||||||
Payments for divestiture of discontinued operations, net of cash sold | (1,395 | ) | — | — | ||||||||
Changes in restricted cash | (715 | ) | — | — | ||||||||
Acquisitions, net of cash acquired | — | (926 | ) | (650 | ) | |||||||
Proceeds from return of investment from strategic investments | — | — | 261 | |||||||||
Purchase of trading investments | (9,619 | ) | (5,034 | ) | (8,450 | ) | ||||||
Proceeds from sales of trading investments | 10,073 | 5,474 | 8,994 | |||||||||
$ | (60,690 | ) | $ | (48,289 | ) | $ | (46,803 | ) | ||||
Our expenditures for property, plant and equipment during fiscal year 2016, 2015 and 2014 were primarily for leasehold improvements, computer hardware and software, tooling and equipment.
Our expenditures for property, plant and equipment increased during fiscal year 2016, compared to fiscal year 2015, mainly due to the building of production lines to accommodate the in-house manufacturing of certain products compared with purchase from third parties in the prior period to align with our goal to achieve cost savings. During fiscal year 2015, purchases of property, plant and equipment remained relatively stable compared to fiscal year 2014.
During fiscal year 2016, we made a $1.5 million strategic investment in one privately held company and $0.9 million investment in a limited partnership with a private investment fund. During fiscal year 2015, we made a $2.6 million strategic investment in one privately held company and acquired one privately held company for $0.9 million. During fiscal year 2014, we acquired one privately held company for $0.7 million.
During fiscal year 2016, the net payments for divestiture of discontinued operations were $1.4 million, and there was $0.7 million for cash outflow to an escrow account for purchase of a domain name.
The purchases and sales of trading investments during fiscal years 2016, 2015 and 2014 represent mutual fund activity directed by participants in a deferred compensation plan offered by one of our subsidiaries. The mutual funds are held by a Rabbi Trust.
Logitech International S.A. | Fiscal 2016 Form 10-K | 55
Cash Flow from Financing Activities
The following table presents cash flow from financing activities for fiscal years 2016, 2015 and 2014 (dollars in thousands):
Years Ended March 31, | ||||||||||||
2016 | 2015 | 2014 | ||||||||||
Payment of cash dividends | $ | (85,915 | ) | $ | (43,767 | ) | $ | (36,123 | ) | |||
Purchases of treasury shares | (70,358 | ) | (1,663 | ) | — | |||||||
Contingent consideration related to prior acquisition | — | (100 | ) | — | ||||||||
Repurchase of ESPP awards | — | (1,078 | ) | — | ||||||||
Proceeds from sales of shares upon exercise of options and purchase rights | 19,767 | 4,138 | 16,914 | |||||||||
Tax withholdings related to net share settlements of restricted stock units | (7,247 | ) | (9,215 | ) | (5,718 | ) | ||||||
Excess tax benefits from share-based compensation | 2,084 | 2,831 | 2,246 | |||||||||
$ | (141,669 | ) | $ | (48,854 | ) | $ | (22,681 | ) | ||||
Translation effect of exchange rate changes on cash and cash equivalents
During fiscal year 2016, there was a $1.4 million currency translation exchange rate effect on cash and cash equivalents, compared to a $13.9 million currency translation exchange rate effect during fiscal year 2015, and a $0.3 million currency translation exchange rate effect during fiscal year 2014. Higher currency translation exchange effect during fiscal year 2015 was primarily due to the 22% weakening of the Euro versus the U.S Dollar during fiscal year 2015, which had an adverse impact on our cash and cash equivalents balances in subsidiaries with functional currency as Euro.
Cash Outlook
Our principal sources of liquidity are our cash and cash equivalents, cash flow generated from operations and, to a much lesser extent, capital markets and borrowings. Our future working capital requirements and capital expenditures may increase to support investment in product innovations and growth opportunities, or to acquire or invest in complementary businesses, products, services, and technologies.
In March 2015, we announced a plan to pay $250 million in cumulative dividends for fiscal year 2015 through fiscal year 2017. During fiscal year 2016, we paid a cash dividend of CHF 83.1 million (U.S. Dollar amount of $85.9 million) out of retained earnings. During fiscal year 2015, we paid a cash dividend of CHF 43.1 million (U.S. Dollar amount of $43.8 million) out of retained earnings.
In March 2014, our Board of Directors approved a share buyback program, which authorizes us to invest up to $250.0 million to purchase our own shares. Our share buyback program provides us with the opportunity to make repurchases during periods of favorable market conditions and is expected to remain in effect for a period of three years. Shares may be repurchased from time to time on the open market, through block trades or otherwise. Purchases may be started or stopped at any time without prior notice depending on market conditions and other factors. During fiscal years 2016 and 2015, 5.0 million and 0.1 million shares were repurchased for $70.4 million and $1.7 million, respectively, under this program.
On April 12, 2016, Logitech Europe S.A., one of our wholly-owned subsidiaries, JayBird, LLC, a Utah limited liability company (“Jaybird”), the unit holders of Jaybird and Judd Armstrong (as the Sellers’ Representative under the Securities Purchase Agreement) entered into a securities purchase agreement. On April 20, 2016, we acquired all of the equity interests of Jaybird in exchange for approximately $50 million in cash, with the potential of an additional earn-out of up to $45 million based on achievement of net revenue growth targets over two years.
Our other contractual obligations and commitments that require cash are described in the following sections.
For over ten years, we have generated positive cash flows from our operating activities, including cash from operations of $183.1 million, $178.6 million and $205.4 million during fiscal years 2016, 2015, and 2014, respectively. If we do not generate sufficient operating cash flows to support our operations and future planned cash requirements, our operations could be harmed and our access to credit facilities could be restricted or eliminated.
Logitech International S.A. | Fiscal 2016 Form 10-K | 56
However, we believe that the trend of our historical cash flow generation, our projections of future operations and our available cash balances will provide sufficient liquidity to fund our operations for at least the next 12 months.
Contractual Obligations and Commitments
The following table summarizes our contractual obligations and commitments as of March 31, 2016 (in thousands):
Payments Due by Period | ||||||||||||||||||||
March 31, 2016 | <1 year | 1-3 years | 4-5 years | >5 years | ||||||||||||||||
Inventory commitments | $ | 158,063 | $ | 158,063 | $ | — | $ | — | $ | — | ||||||||||
Capital commitments | 6,188 | 6,188 | — | — | — | |||||||||||||||
Expected contribution to employee benefit plan | 4,881 | 4,881 | * | * | * | |||||||||||||||
Operating leases obligations | 31,974 | 7,558 | 10,254 | 7,623 | 6,539 | |||||||||||||||
$ | 201,106 | $ | 176,690 | $ | 10,254 | $ | 7,623 | $ | 6,539 | |||||||||||
* Employee Benefit Plan Obligation: Commitments under the retirement plans relate to expected contributions to be made to our defined benefit plans for the next year only. We fund our pension plans so that we meet at least the minimum contribution requirements, as established by local government, funding and taxing authorities. Expected contributions and payments to our defined benefit pension plans and non-retirement post-employment benefit plans beyond one year are excluded from the contractual obligations table because they are dependent on numerous factors that may result in a wide range of outcomes and thus are impractical to estimate. For more information on our defined benefit pension plans and non-retirement post-employment benefit plans, see Note 5 to the Consolidated Financial Statements in Item 8, which is incorporated herein by reference.
Operating Leases Obligation
We lease facilities under operating leases, certain of which require us to pay property taxes, insurance and maintenance costs. Operating leases for facilities are generally renewable at our option and usually include escalation clauses linked to inflation. The remaining terms on our non-cancelable operating leases expire in various years through 2030.
Commitment for Acquisition
On April 20, 2016 we acquired Jaybird LLC of Salt Lake City, Utah, ("Jaybird") for approximately $50 million in cash, with an additional earn-out of up to $45 million based on achievement of growth targets over two years.
Purchase Commitments
As of March 31, 2016, we have fixed purchase commitments of $158.1 million for inventory purchases made in the normal course of business to original design manufacturers, contract manufacturers and other suppliers, the majority of which are expected to be fulfilled during the first quarter of fiscal year 2017. We recorded a liability for firm, non-cancelable, and unhedged inventory purchase commitments in excess of anticipated demand or market value consistent with our valuation of excess and obsolete inventory. As of March 31, 2016, the liability for these purchase commitments was $8.5 million and is recorded in accrued and other current liabilities and is not included in the preceding table. We have fixed purchase commitments of $6.2 million for capital expenditures, primarily related to commitments for tooling, computer hardware and leasehold improvements. We expect to continue making capital expenditures in the future to support product development activities and ongoing and expanded operations as well as aligning our inventory strategy to transition from ODM to in-house production. Although open purchase commitments are considered enforceable and legally binding, the terms generally allow us the option to reschedule and adjust our requirements based on business needs prior to delivery of goods.
Income Taxes Payable
As of March 31, 2016, we had $59.7 million in non-current income taxes payable and $0.1 million in current income taxes payable, including interest and penalties, related to our income tax liability for uncertain tax positions. At this time, we are unable to make a reasonably reliable estimate of the timing of payments in
Logitech International S.A. | Fiscal 2016 Form 10-K | 57
individual years in connection with these tax liabilities; therefore, such amounts are not included in the above contractual obligation table.
Off-Balance Sheet Arrangements
We have not entered into any transactions with unconsolidated entities whereby we have financial guarantees, subordinated retained interests, derivative instruments or other contingent arrangements that expose us to material continuing risks, contingent liabilities, or any other obligation under a variable interest in an unconsolidated entity that provides financing, liquidity, market risk or credit risk support to us.
Investment Commitments
During 2015, we entered into a limited partnership agreement with a private investment fund specialized in early-stage start-up consumer hardware electronics companies and committed a capital contribution of $4.0 million over the life of the fund. As of March 31, 2016, $3.1 million of the committed capital contribution has not yet been called by the fund.
Settlement
In April 2016, we entered into a settlement with the SEC related to the accounting for Revue inventory valuation reserves that resulted in the restatement described in the Fiscal Year 2014 Annual Report on Form 10-K, revision to our consolidated financial statements concerning warranty accruals and amortization of intangible assets presented in our Amended Annual Report on Form 10-K/A, filed on August 7, 2013, and our transactions with a distributor for fiscal year 2007 through fiscal year 2009. We entered into the settlement without admitting or denying the findings of the SEC’s investigation and paid a civil penalty of $7.5 million. We made an accrual of the same amount in our consolidated financial statements as of March 31, 2016. This amount was paid in April 2016.
Guarantees
Logitech Europe S.A. guaranteed payments of third-party contract manufacturers' purchase obligations. As of March 31, 2016, the maximum amount of this guarantee was $3.8 million, of which $1.0 million of guaranteed purchase obligations were outstanding.
Indemnifications
We indemnify certain of our suppliers and customers for losses arising from matters such as intellectual property disputes and product safety defects, subject to certain restrictions. The scope of these indemnities varies, but in some instances, includes indemnification for damages and expenses, including reasonable attorneys' fees. As of March 31, 2016, no amounts have been accrued for indemnification provisions. We do not believe, based on historical experience and information currently available, that it is probable that any material amounts will be required to be paid under our indemnification arrangements.
We also indemnify our current and former directors and certain of our current and former officers. Certain costs incurred for providing such indemnification may be recoverable under various insurance policies. We are unable to reasonably estimate the maximum amount that could be payable under these arrangements because these exposures are not capped, the obligations are conditional in nature, and the facts and circumstances involved in any situation that might arise are variable.
The Stock Purchase Agreement that we entered into in connection with the investment by three venture capital firms in Lifesize, Inc. contains representations, warranties and covenants of Logitech and Lifesize, Inc. to the Venture Investors. Subject to certain limitations, we have agreed to indemnify the Venture Investors and certain persons related to the Venture Investors for certain losses resulting from breaches of or inaccuracies in such representations, warranties and covenants as well as certain other obligations, including third party expenses, restructuring costs and pre-closing tax obligations of Lifesize.
ITEM 7A. QUANTITATIVE AND QUALITATIVE DISCLOSURES ABOUT MARKET RISK
Market Risk
Market risk represents the potential for loss due to adverse changes in the fair value of financial instruments. As a global concern, we face exposure to adverse movements in currency exchange rates and interest rates. These exposures may change over time as business practices evolve and could have a material adverse impact on our financial results.
Logitech International S.A. | Fiscal 2016 Form 10-K | 58
Currency Exchange Rates
We report our results in U.S. Dollars. Changes in currency exchange rates compared to the U.S. Dollar can have a material impact on our results when the financial statements of our non-U.S. subsidiaries are translated into U.S. Dollars. The functional currency of our operations is primarily the U.S. Dollar. Certain operations use the Swiss Franc, or the local currency of the country as their functional currencies. Accordingly, unrealized currency gains or losses resulting from the translation of net assets or liabilities denominated in other currencies to the U.S. Dollar are accumulated in the cumulative translation adjustment component of other comprehensive income (loss) in shareholders' equity.
We are exposed to currency exchange rate risk as we transact business in multiple currencies, including exposure related to anticipated sales, anticipated purchases and assets and liabilities denominated in currencies other than the U.S. Dollar. We transact business in over 30 currencies worldwide, of which the most significant to operations are the Euro, Chinese Renminbi, Australian Dollar, Taiwanese Dollar, British Pound, Canadian Dollar, Japanese Yen and Mexican Peso. For example, for the year ended March 31, 2016, approximately 48% of our sales were in non-U.S. denominated currencies, with 25% of our net sales denominated in Euro. The mix of our cost of goods sold and operating expenses by currency are significantly different from the mix of our sales, with a larger portion denominated in U.S. Dollar and less denominated in Euro and other currencies. A strengthening U.S. Dollar has more unfavorable impact on our sales than the favorable impact on our operating expense, resulting in an adverse impact on our operating results. As a result, a strengthening U.S. Dollar has an adverse impact on our operating results. If the U.S. Dollar remains at its current strong levels in comparison to other currencies, this will affect our results of operations in future periods as well. The table below provides information about our underlying transactions that are sensitive to currency exchange rate changes, primarily assets and liabilities denominated in currencies other than the base currency, where the net exposure is greater than $0.5 million as of March 31, 2016. The table also presents the U.S. Dollar impact on earnings of a 10% appreciation and a 10% depreciation of the base currency as compared with the transaction currency (in thousands):
March 31, 2016 | ||||||||||||||
Currency | Net Exposed Long (Short) Currency | Currency Exchange Gain (Loss) from 10% Change in Base Currency | ||||||||||||
Base Currency | Transaction Currency | Position | Appreciation | Depreciation | ||||||||||
U.S. Dollar | Japanese Yen | $ | 14,487 | $ | (1,317 | ) | $ | 1,610 | ||||||
U.S. Dollar | Mexican Peso | 13,431 | (1,221 | ) | 1,492 | |||||||||
U.S. Dollar | Canadian Dollar | 12,670 | (1,152 | ) | 1,408 | |||||||||
U.S. Dollar | Australian Dollar | 10,588 | (963 | ) | 1,176 | |||||||||
U.S. Dollar | Indian Rupee | 1,275 | (116 | ) | 142 | |||||||||
U.S. Dollar | Russian Ruble | 543 | (49 | ) | 60 | |||||||||
U.S. Dollar | Korean Wan | (799 | ) | 73 | (89 | ) | ||||||||
U.S. Dollar | Chinese Renminbi | (3,452 | ) | 314 | (384 | ) | ||||||||
U.S. Dollar | Singapore Dollar | (5,570 | ) | 506 | (619 | ) | ||||||||
U.S. Dollar | Taiwanese Dollar | (14,242 | ) | 1,295 | (1,582 | ) | ||||||||
Euro | British Pound | 3,780 | (344 | ) | 420 | |||||||||
Euro | Turkish Lira | 2,001 | (182 | ) | 222 | |||||||||
Euro | U.S. Dollar | 1,768 | (161 | ) | 196 | |||||||||
Euro | Croatian Kuna | 640 | (58 | ) | 71 | |||||||||
Euro | Swedish Krona | (1,168 | ) | 106 | (130 | ) | ||||||||
Swiss Franc | British Pound | (758 | ) | 69 | (84 | ) | ||||||||
$ | 35,194 | $ | (3,200 | ) | $ | 3,909 | ||||||||
Long currency positions represent net assets being held in the transaction currency while short currency positions represent net liabilities being held in the transaction currency.
Our principal manufacturing operations are located in China, with much of our component and raw material costs transacted in CNY. As of March 31, 2016, net liabilities held in Chinese Renminbi (CNY) totaled $3.5 million.
Logitech International S.A. | Fiscal 2016 Form 10-K | 59
Derivatives
We enter into foreign exchange forward contracts to hedge against exposure to changes in currency exchange rates related to its subsidiaries' forecasted inventory purchases. We have one entity with a Euro functional currency that purchases inventory in U.S. Dollars. The primary risk managed by using derivative instruments is the currency exchange rate risk. We have designated these derivatives as cash flow hedges. These hedging contracts mature within four months, and are denominated in the same currency as the underlying transactions. Gains and losses in the fair value of the effective portion of the hedges are deferred as a component of accumulated other comprehensive loss until the hedged inventory purchases are sold, at which time the gains or losses are reclassified to cost of goods sold. We assess the effectiveness of the hedges by comparing changes in the spot rate of the currency underlying the forward contract with changes in the spot rate of the currency in which the forecasted transaction will be consummated. If the underlying transaction being hedged fails to occur or if a portion of the hedge does not generate offsetting changes in the currency exposure of forecasted inventory purchases, we immediately recognize the gain or loss on the associated financial instrument in other income (expense), net. Such gains and losses were not material during fiscal years 2016, 2015 and 2014. Cash flows from such hedges are classified as operating activities in the Consolidated Statements of Cash Flows. As of March 31, 2016 and 2015, the notional amounts of foreign exchange forward contracts outstanding related to forecasted inventory purchases were $39.8 million and $43.5 million, respectively. Deferred realized loss of $0.6 million are recorded in accumulated other comprehensive loss as of March 31, 2016, and are expected to be reclassified to cost of goods sold when the related inventory is sold. Deferred unrealized loss of $1.1 million related to open cash flow hedges are also recorded in accumulated other comprehensive loss as of March 31, 2016 and these forward contracts will be revalued in future periods until the related inventory is sold, at which time the resulting gains or losses will be reclassified to cost of goods sold.
We also enter into foreign exchange forward and swap contracts to reduce the short-term effects of currency fluctuations on certain currency receivables or payables. These forward contracts generally mature within one month. The primary risk managed by using forward and swap contracts is the currency exchange rate risk. The gains or losses on these foreign exchange contracts are recognized in earnings based on the changes in fair value. Cash flows from these contracts are classified as operating activities in the consolidated statements of cash flows.
The notional amounts of foreign exchange forward and swap contracts outstanding as of March 31, 2016 and 2015 relating to foreign currency receivables or payables were $63.7 million and $61.7 million, respectively. Open forward and swap contracts as of March 31, 2016 and 2015 consisted of contracts in Taiwanese Dollars, Australian Dollars, Mexican Pesos, Japanese Yen and British Pounds to be settled at future dates at pre-determined exchange rates.
Interest Rates
Changes in interest rates could impact our future interest income on our cash equivalents and investment securities. We prepared a sensitivity analysis of our interest rate exposures to assess the impact of hypothetical changes in interest rates. Based on the results of this analysis, a 100 basis point decrease or increase in interest rates from the March 31, 2016 and March 31, 2015 period end rates would not have a material effect on our results of operations or cash flows.
ITEM 8. FINANCIAL STATEMENTS AND SUPPLEMENTARY DATA
Logitech's financial statements and supplementary data required by this item are set forth as a separate section of this Annual Report on Form 10-K. See Item 15 (a) for a listing of financial statements and supplementary data provided in the section titled "Financial Statements and Supplementary Data."
ITEM 9. CHANGES IN AND DISAGREEMENTS WITH ACCOUNTANTS ON ACCOUNTING AND FINANCIAL DISCLOSURE
Not applicable.
ITEM 9A. CONTROLS AND PROCEDURES
Evaluation of Disclosure Controls and Procedures
The Company conducted an evaluation of the effectiveness of the design and operation of its disclosure controls and procedures (as defined in Rules 13a-15(e) and 15d-15(e) under the Securities Exchange Act of 1934,
Logitech International S.A. | Fiscal 2016 Form 10-K | 60
as amended (the “Exchange Act”)) (“Disclosure Controls”) as of the end of the period covered by this Annual Report on Form 10-K (this “Report”) required by Exchange Act Rules 13a-15(b) or 15d-15(b). The controls evaluation was conducted under the supervision and with the participation of the Company’s management, including the Company’s Chief Executive Officer (“CEO”) and Chief Financial Officer (“CFO”). Based on this evaluation, the CEO and CFO have concluded that as of the end of the period covered by this Report the Company’s Disclosure Controls were effective at a reasonable assurance level.
Attached as exhibits to this Report are certifications of the CEO and CFO, which are required in accordance with Rule 13a-14 of the Exchange Act. This Controls and Procedures section includes the information concerning the controls evaluation referred to in the certifications, and it should be read in conjunction with the certifications for a more complete understanding of the topics presented.
Definition of Disclosure Controls
Disclosure Controls are controls and procedures designed to reasonably assure that information required to be disclosed in the Company’s reports filed under the Exchange Act, such as this Report, is recorded, processed, summarized and reported within the time periods specified in the SEC’s rules and forms. Disclosure Controls are also designed to reasonably assure that such information is accumulated and communicated to the Company’s management, including the CEO and CFO, as appropriate to allow timely decisions regarding required disclosure. The Company’s Disclosure Controls include components of its internal control over financial reporting, which consists of control processes designed to provide reasonable assurance regarding the reliability of its financial reporting and the preparation of financial statements in accordance with generally accepted accounting principles in the United States. To the extent that components of the Company’s internal control over financial reporting are included within its Disclosure Controls, they are included in the scope of the Company’s annual controls evaluation.
Management's Report on Internal Control over Financial Reporting
The Company’s management is responsible for establishing and maintaining adequate internal control over financial reporting as defined in Rules 13a-15(f) and 15d-15(f) under the Exchange Act. Under the supervision and with the participation of the Company’s management, including the CEO and CFO, the Company conducted an evaluation of the effectiveness of its internal control over financial reporting based on criteria established in the framework in Internal Control—Integrated Framework (2013) issued by the Committee of Sponsoring Organizations of the Treadway Commission. Based on this evaluation, the Company’s management concluded that the Company’s internal control over financial reporting was effective as of March 31, 2016.
The effectiveness of the Company’s internal control over financial reporting as of March 31, 2016 has been audited by KPMG LLP, an independent registered public accounting firm, as stated in their report which appears in Item 8, “Financial Statements and Supplementary Data” in this Annual Report on Form 10-K.
Changes in Internal Controls over Financial Reporting:
There were no changes in the Company’s internal control over financial reporting that occurred during the fourth quarter of fiscal year 2016 that have materially affected, or are reasonably likely to materially affect, the Company’s internal control over financial reporting.
Limitations on the Effectiveness of Controls
The Company's management, including the Chief Executive Officer and Chief Financial Officer, does not expect that the Company's disclosure controls and procedures or internal control over financial reporting will prevent all errors and all fraud. Internal control over financial reporting, no matter how well designed and operated, can provide only reasonable, not absolute, assurance that the objectives will be met. Because of the inherent limitations in internal control over financial reporting, no evaluation of controls can provide absolute assurance that all control issues and instances of fraud, if any, within the Company have been detected. These inherent limitations include the realities that judgments in decision making can be faulty and that breakdowns can occur because of simple error or mistake. Controls can also be circumvented by the individual acts of some persons, by collusion of two or more people, or by management override of the controls. The design of any system of controls is based in part on certain assumptions about the likelihood of future events, and there can be no assurance that any design will succeed in achieving its stated goals under all potential future conditions. Over time, controls may become inadequate because of changes in conditions or deterioration in the degree of compliance with policies or
Logitech International S.A. | Fiscal 2016 Form 10-K | 61
procedures. Because of the inherent limitations in a cost-effective control system, misstatements due to error or fraud may occur and not be detected.
ITEM 9B. OTHER INFORMATION
None.
Logitech International S.A. | Fiscal 2016 Form 10-K | 62
PART III
ITEM 10. DIRECTORS, EXECUTIVE OFFICERS AND CORPORATE GOVERNANCE
Information regarding our executive officers is incorporated herein by reference to Part I, Item 1, above.
Other information required by this Item may be found in the definitive Proxy Statement for the 2016 Annual Meeting of Shareholders and is incorporated herein by reference. The definitive Proxy Statement will be filed with the Commission within 120 days after our fiscal year end of March 31, 2016 (the "Proxy Statement").
The Company's code of ethics policy entitled, "Logitech Code of Conduct" covers members of the Company's board of directors, the principal executive officer, principal financial and accounting officer and other executive officers as well as all other employees.
The code of ethics addresses, among other things, the following items:
• | Honest and ethical conduct, including the ethical handling of actual or apparent conflicts of interest between personal and professional relationships; |
• | Full, fair, accurate, timely, and understandable disclosure in reports and documents that we file with, or submit to, the Commission and in other public communications made by us; |
• | Compliance with applicable governmental laws, rules and regulations; |
• | The prompt internal reporting to an appropriate person or persons identified in the code of violations of any of the provisions described above; and |
• | Accountability for adherence to the code. |
Any amendments or waivers of the code of ethics for members of the Company's board of directors or executive officers will be disclosed in the investor relations section of the Company's Web site within four business days following the date of the amendment or waiver. During fiscal year 2016, the Company updated and revised its code of ethics. The new code was posted to the investor relations section of the Company's website.
Logitech's code of ethics is available on the Company's Web site at www.logitech.com, and for no charge, a copy of the Company's code of ethics can be requested via the following address or phone number:
Logitech
Investor Relations
7700 Gateway Boulevard
Newark, CA 94560 USA
Main 510-795-8500
ITEM 11. EXECUTIVE COMPENSATION
The information required by this item may be found in the Proxy Statement for the 2016 Annual Meeting of Shareholders and is incorporated herein by reference.
ITEM 12. SECURITY OWNERSHIP OF CERTAIN BENEFICIAL OWNERS AND MANAGEMENT AND RELATED STOCKHOLDER MATTERS
The information required by this item may be found in the Proxy Statement for the 2016 Annual Meeting of Shareholders and is incorporated herein by reference.
ITEM 13. CERTAIN RELATIONSHIPS AND RELATED TRANSACTIONS, AND DIRECTOR INDEPENDENCE
The information required by this item may be found in the Proxy Statement for the 2016 Annual Meeting of Shareholders and is incorporated herein by reference.
ITEM 14. PRINCIPAL ACCOUNTANT FEES AND SERVICES
The information required by this item may be found in the Proxy Statement for the 2016 Annual Meeting of Shareholders and is incorporated herein by reference.
Logitech International S.A. | Fiscal 2016 Form 10-K | 63
ITEM 15. EXHIBITS AND FINANCIAL STATEMENT SCHEDULES
(a) | The following documents are filed as part of this Annual Report on Form 10-K: |
1. Financial Statements and Supplementary Data
Financial Statements:
Report of Independent Registered Public Accounting Firm - KPMG LLP
Report of Independent Registered Public Accounting Firm - PricewaterhouseCoopers LLP
Consolidated Statements of Operations—Years Ended March 31, 2016, 2015 and 2014
Consolidated Statements of Comprehensive Income (Loss)—Years Ended March 31, 2016, 2015 and 2014
Consolidated Balance Sheets—March 31, 2016 and 2015
Consolidated Statements of Cash Flows—Years Ended March 31, 2016, 2015 and 2014
Consolidated Statements of Changes in Shareholders' Equity—Years Ended March 31, 2016, 2015 and 2014
Notes to Consolidated Financial Statements
Supplementary Data:
Unaudited Quarterly Financial Data
2. Financial Statement Schedule
Schedule II—Valuation and Qualifying Accounts
3. Exhibits
Logitech International S.A. | Fiscal 2016 Form 10-K | 64
Index to Exhibits
Incorporated by Reference | ||||||||||||||
Exhibit No. | Exhibit | Form | File No. | Filing Date | Exhibit No. | Filed Herewith | ||||||||
2.1 | Agreement and Plan of Merger, dated as of November 10, 2009, as amended by the First Amendment to Agreement and Plan of Merger, entered into as of November 16, 2009, both by and among Logitech Inc., Agora Acquisition Corporation, Lifesize Communications, Inc., Shareholder Representative Services LLC, as stockholder representative, and U.S. Bank National Association, as escrow agent. | 8-K | 0-29174 | 12/14/2009 | 2.1 | |||||||||
2.2 | *** | Securities Purchase Agreement, dated as of April 12, 2016, by and among Logitech Europe S.A., JayBird, LLC, the unitholders of JayBird, LLC, and Judd Armstrong (as the sellers' representative) | X | |||||||||||
3.1 | Articles of Incorporation of Logitech International S.A., as amended | 10-Q | 0-29174 | 1/27/2015 | 3.1 | |||||||||
3.2 | Organizational Regulations of Logitech International S.A., as amended | 10-K | 0-29174 | 6/1/2009 | 3.2 | |||||||||
10.1 | ** | 1996 Stock Plan, as amended | S-8 | 333-100854 | 5/27/2003 | 4.2 | ||||||||
10.2 | ** | Logitech International S.A. 2006 Stock Incentive Plan, as amended and restated effective September 5, 2012 | DEFA14A | 0-29174 | 8/10/2012 | App. A | ||||||||
10.3 | ** | Representative form of Performance Restricted Stock Unit agreement (executives) under the Logitech International S.A. 2006 Stock Incentive Plan for grants in 2008 to 2010 | 10-K | 0-29174 | 6/1/2009 | 10.3 | ||||||||
10.4 | ** | Logitech Inc. Management Deferred Compensation Plan | 10-Q | 0-29174 | 11/4/2008 | 10.1 | ||||||||
10.5 | ** | 1996 Employee Share Purchase Plan (U.S.), as amended and restated | DEFA14A | 0-29174 | 7/23/2013 | App. A | ||||||||
10.6 | ** | 2006 Employee Share Purchase Plan (Non-U.S.), as amended and restated | DEFA14A | 0-29174 | 7/23/2013 | App. B | ||||||||
10.7 | ** | Form of Director and Officer Indemnification Agreement with Logitech International S.A. | 20-F | 0-29174 | 5/21/2003 | 4.1 | ||||||||
10.8 | ** | Form of Director and Officer Indemnification Agreement with Logitech Inc. | 20-F | 0-29174 | 5/21/2003 | 4.2 | ||||||||
10.9 | ** | Logitech Management Performance Bonus Plan, as amended and restated | DEFA14A | 0-29174 | 7/23/2013 | App. C | ||||||||
10.10 | ** | Employment agreement dated January 28, 2008 between Logitech Inc. and Guerrino De Luca | 10-K | 0-29174 | 5/30/2008 | 10.1 | ||||||||
10.11 | ** | Representative form of stock option agreement (non-executive board members) under the Logitech International S.A. 2006 Stock Incentive Plan | 10-Q | 0-29174 | 11/4/2009 | 10.1 | ||||||||
10.12 | ** | Representative form of stock option agreement (employees) under the Logitech International S.A. 2006 Stock Incentive Plan | 10-Q | 0-29174 | 11/4/2009 | 10.2 | ||||||||
Logitech International S.A. | Fiscal 2016 Form 10-K | 65
10.13 | ** | Representative form of restricted stock unit agreement (non-executive board members) under the Logitech International S.A. 2006 Stock Incentive Plan | 10-Q | 0-29174 | 11/4/2009 | 10.3 | ||||||||
10.14 | ** | Representative form of restricted stock unit agreement (executives) under the Logitech International S.A. 2006 Stock Incentive Plan | 10-Q | 0-29174 | 11/4/2009 | 10.4 | ||||||||
10.15 | ** | Representative form of Performance Restricted Stock Unit agreement (executives) under the Logitech International S.A. 2006 Stock Incentive Plan for grants in 2011 | 10-K | 0-29174 | 5/27/2011 | 10.3 | ||||||||
10.16 | ** | 2012 Stock Inducement Equity Plan | S-8 | 333-180726 | 4/13/2012 | 10.1 | ||||||||
10.17 | ** | Representative form of stock option agreement under the 2012 Stock Inducement Equity Plan | S-8 | 333-180726 | 4/13/2012 | 10.2 | ||||||||
10.18 | ** | Representative form of restricted stock unit agreement under the 2012 Stock Inducement Equity Plan | S-8 | 333-180726 | 4/13/2012 | 10.3 | ||||||||
10.19 | ** | Representative form of restricted stock unit agreement (executives and other employees) under the Logitech International S.A. 2006 Stock Incentive Plan for grants starting in 2013 | 10-Q | 0-29174 | 2/5/2013 | 10.1 | ||||||||
10.20 | ** | Representative form of performance stock option agreement (executives and other employees) under the Logitech International S.A. 2006 Stock Incentive Plan | 10-Q | 0-29174 | 2/5/2013 | 10.2 | ||||||||
10.21 | ** | Representative form of performance restricted stock unit agreement (non-executive employees) under the Logitech International S.A. 2006 Stock Incentive Plan | 10-Q | 0-29174 | 2/5/2013 | 10.3 | ||||||||
10.22 | ** | Representative form of performance share unit agreement (executives and other employees) under the Logitech International S.A. 2006 Stock Incentive Plan for grants starting in April 2013 | 10-K | 0-29174 | 5/30/2013 | 10.4 | ||||||||
10.23 | ** | Form of restricted stock unit agreement for new hire grants to Vincent Pilette on September 15, 2013 under the Logitech International S.A. 2006 Stock Incentive Plan | 10-Q | 0-29174 | 11/5/2013 | 10.2 | ||||||||
10.24 | ** | Form of performance share unit agreement for new hire grants to Vincent Pilette on September 15, 2013 under the Logitech International S.A. 2006 Stock Incentive Plan | 10-Q | 0-29174 | 11/5/2013 | 10.3 | ||||||||
10.25 | ** | Form of restricted stock unit agreement for grant to Guerrino De Luca on October 15, 2013 under the Logitech International S.A. 2006 Stock Incentive Plan | 10-Q | 0-29174 | 11/5/2013 | 10.4 | ||||||||
10.26 | ** | Employment Agreement between Logitech Inc. and Bracken Darrel, dated as of December 18, 2015 | 10-Q | 0-29174 | 1/22/2016 | 10.1 | ||||||||
10.27 | ** | Employment Agreement between Logitech Inc. and Vincent Pilette, dated as of December 18, 2015 | 10-Q | 0-29174 | 1/22/2016 | 10.2 | ||||||||
10.28 | ** | Employment Agreement between Logitech Inc. and L. Joseph Sullivan, dated as of December 18, 2015 | 10-Q | 0-29174 | 1/22/2016 | 10.3 | ||||||||
10.29 | ** | Employment Contract between Logitech Inc. and Marcel Stolk, dated as of December 18, 2015 | 10-Q | 0-29174 | 1/22/2016 | 10.4 | ||||||||
Logitech International S.A. | Fiscal 2016 Form 10-K | 66
10.30 | Series B Preferred Stock Purchase Agreement, dated as of December 28, 2015, by and between Logitech International S.A., Lifesize, Inc., and Investors associated with Redpoint Ventures, Sutter Hill Ventures and Meritech Capital Partners. | 10-Q | 0-29174 | 1/22/2016 | 10.5 | |||||||||
10.31 | ** | Representative form of restricted stock unit agreement (executives and other employees) under the Logitech International S.A. 2006 Stock Incentive Plan | X | |||||||||||
10.32 | ** | Representative form of performance share unit agreement (executives and other employees) under the Logitech International S.A. 2006 Stock Incentive Plan | X | |||||||||||
21.1 | List of subsidiaries of Logitech International S.A. | X | ||||||||||||
23.1.1 | Consent of Independent Registered Public Accounting Firm - KPMG LLP | X | ||||||||||||
23.1.2 | Consent of Independent Registered Public Accounting Firm - PricewaterhouseCoopers LLP | X | ||||||||||||
24.1 | Power of Attorney (incorporated by reference to the signature page of this Annual Report on Form 10-K) | X | ||||||||||||
31.1 | Certification by Chief Financial Officer pursuant to section 302 of the Sarbanes-Oxley Act of 2002 | X | ||||||||||||
31.2 | Certification by Chief Executive Officer pursuant to section 302 of the Sarbanes-Oxley Act of 2002 | X | ||||||||||||
32.1 | * | Certification by Chief Executive Officer and Chief Financial Officer pursuant to section 906 of the Sarbanes-Oxley Act of 2002 | X | |||||||||||
101.INS | XBRL Instance Document | X | ||||||||||||
101.SCH | XBRL Taxonomy Extension Schema Document | X | ||||||||||||
101.CAL | XBRL Taxonomy Extension Calculation Linkbase Document | X | ||||||||||||
101.DEF | XBRL Taxonomy Extension Definition Linkbase Document | X | ||||||||||||
101.LAB | XBRL Taxonomy Extension Label Linkbase Document | X | ||||||||||||
101.PRE | XBRL Taxonomy Extension Presentation Linkbase Document | X | ||||||||||||
_______________________________________________________________________________
* This exhibit is furnished herewith, but not deemed "filed" for purposes of Section 18 of the Securities Exchange Act of 1934, as amended, or otherwise subject to liability under that section. Such certification will not be deemed to be incorporated by reference into any filing under the Securities Act or the Exchange Act, except to the extent that we explicitly incorporate it by reference.
** Indicates management compensatory plan, contract or arrangement.
***Confidential treatment has been requested for certain provisions omitted from this exhibit pursuant to Rule 406 promulgated under the Securities Act of 1933, as amended. The omitted information has been filed separately with the Securities and Exchange Commission.
Logitech International S.A. | Fiscal 2016 Form 10-K | 67
SIGNATURES
Pursuant to the requirements of Section 13 or 15(d) of the Securities Exchange Act of 1934, the Registrant has duly caused this Report to be signed on its behalf by the undersigned, thereunto duly authorized.
LOGITECH INTERNATIONAL S.A. | ||
/s/ BRACKEN DARRELL | ||
Bracken Darrell President and Chief Executive Officer | ||
/s/ VINCENT PILETTE | ||
Vincent Pilette Chief Financial Officer | ||
May 23, 2016 | ||
Logitech International S.A. | Fiscal 2016 Form 10-K | 68
POWER OF ATTORNEY
KNOW ALL PERSONS BY THESE PRESENTS, that each person whose signature appears below constitutes and appoints Bracken Darrell and Vincent Pilette, jointly and severally, his or her attorney-in-fact, with the power of substitution, for him or her in any and all capacities, to sign any amendments to this Annual Report on Form 10-K and to file the same, with exhibits thereto and other documents in connection therewith, with the Securities and Exchange Commission, hereby ratifying and confirming all that each of said attorneys-in-fact, or his or her substitute or substitutes, may do or cause to be done by virtue hereof.
Pursuant to the requirements of the Securities Exchange Act of 1934, this Annual Report on Form 10-K has been signed below by the following persons on behalf of the Registrant and in the capacities and on the dates indicated.
Signature | Title | Date | ||
/s/ GUERRINO DE LUCA Guerrino De Luca | Chairman of the Board | May 23, 2016 | ||
/s/ BRACKEN DARRELL Bracken Darrell | President and Chief Executive Officer | May 23, 2016 | ||
/s/ VINCENT PILETTE Vincent Pilette | Chief Financial Officer (Principal Financial Officer and Principal Accounting Officer) | May 23, 2016 | ||
/s/ DIDIER HIRSCH Didier Hirsch | Director | May 23, 2016 | ||
/s/ DIMITRI PANAYOTOPOULOS Dimitri Panayotopoulos | Director | May 23, 2016 | ||
/s/ EDOUARD BUGNION Edouard Bugnion | Director | May 23, 2016 | ||
/s/ KEE-LOCK CHUA Kee-Lock Chua | Director | May 23, 2016 | ||
/s/ LUNG YEH Lung Yeh | Director | May 23, 2016 | ||
/s/ NEIL HUNT Neil Hunt | Director | May 23, 2016 | ||
/s/ SALLY DAVIS Sally Davis | Director | May 23, 2016 | ||
/s/ SUE GOVE Sue Gove | Director | May 23, 2016 | ||
Logitech International S.A. | Fiscal 2016 Form 10-K | 69
INDEX TO CONSOLIDATED FINANCIAL STATEMENTS
Page | |
INDEX TO SUPPLEMENTARY DATA | |
Logitech International S.A. | Fiscal 2016 Form 10-K | 70
REPORT OF INDEPENDENT REGISTERED PUBLIC ACCOUNTING FIRM
The Board of Directors and Stockholders
Logitech International S.A.:
We have audited the accompanying consolidated balance sheets of Logitech International S.A. and subsidiaries (the Company) as of March 31, 2016 and 2015, and the related consolidated statements of operations, comprehensive income (loss), stockholders’ equity, and cash flows for each of the years in the two-year period ended March 31, 2016. In connection with our audits of the consolidated financial statements, we also have audited the related financial statement schedule listed in the accompanying index for each of the years in the two-year period ended March 31, 2016. We also have audited the Company’s internal control over financial reporting as of March 31, 2016, based on criteria established in Internal Control - Integrated Framework (2013) issued by the Committee of Sponsoring Organizations of the Treadway Commission (COSO). Logitech International S.A.’s management is responsible for these consolidated financial statements, for maintaining effective internal control over financial reporting, and for its assessment of the effectiveness of internal control over financial reporting, included in the accompanying Management’s Report on Internal Control over Financial Reporting included in Item 9A. Our responsibility is to express an opinion on these consolidated financial statements and an opinion on the Company’s internal control over financial reporting based on our audits. The accompanying consolidated financial statements and financial statement schedule of Logitech International S.A., and subsidiaries for the year ended March 31, 2014, were audited by other auditors whose report thereon dated November 13, 2014, expressed an unqualified opinion on those consolidated financial statements and financial statement schedule, before the effects of the retrospective adjustments described in Note 3 to the consolidated financial statements.
We conducted our audits in accordance with the standards of the Public Company Accounting Oversight Board (United States). Those standards require that we plan and perform the audits to obtain reasonable assurance about whether the financial statements are free of material misstatement and whether effective internal control over financial reporting was maintained in all material respects. Our audits of the consolidated financial statements included examining, on a test basis, evidence supporting the amounts and disclosures in the financial statements, assessing the accounting principles used and significant estimates made by management, and evaluating the overall financial statement presentation. Our audit of internal control over financial reporting included obtaining an understanding of internal control over financial reporting, assessing the risk that a material weakness exists, and testing and evaluating the design and operating effectiveness of internal control based on the assessed risk. Our audits also included performing such other procedures as we considered necessary in the circumstances. We believe that our audits provide a reasonable basis for our opinions.
A company’s internal control over financial reporting is a process designed to provide reasonable assurance regarding the reliability of financial reporting and the preparation of financial statements for external purposes in accordance with generally accepted accounting principles. A company’s internal control over financial reporting includes those policies and procedures that (1) pertain to the maintenance of records that, in reasonable detail, accurately and fairly reflect the transactions and dispositions of the assets of the Company; (2) provide reasonable assurance that transactions are recorded as necessary to permit preparation of financial statements in accordance with generally accepted accounting principles, and that receipts and expenditures of the Company are being made only in accordance with authorizations of management and directors of the Company; and (3) provide reasonable assurance regarding prevention or timely detection of unauthorized acquisition, use, or disposition of the Company’s assets that could have a material effect on the financial statements.
Because of its inherent limitations, internal control over financial reporting may not prevent or detect misstatements. Also, projections of any evaluation of effectiveness to future periods are subject to the risk that controls may become inadequate because of changes in conditions, or that the degree of compliance with the policies or procedures may deteriorate.
In our opinion, the consolidated financial statements referred to above present fairly, in all material respects, the financial position of Logitech International S.A. and subsidiaries as of March 31, 2016 ad 2015, and the results of their operations and their cash flows for each of the years in the two-year period ended March 31, 2016, and the related financial statement schedule, in conformity with U.S. generally accepted accounting principles. Also in our opinion, Logitech International S.A. maintained, in all material respects, effective internal control over financial reporting as of March 31, 2016, based on criteria established in Internal Control - Integrated Framework (2013) issued by COSO.
Logitech International S.A. | Fiscal 2016 Form 10-K | 71
We also have audited the retrospective adjustments described in Note 3 that were applied to the accompanying 2014 consolidated financial statements and the related financial statement schedule to present the operations of the Video Conferencing segment as discontinued operations. In our opinion, such adjustments are appropriate and have been properly applied. We were not engaged to audit, review, or apply any procedures to the 2014 consolidated financial statements of the Company other than with respect to the retrospective adjustments, and accordingly, we do not express an opinion or any other form of assurance on the 2014 consolidated financial statements taken as a whole.
/s/ KPMG LLP
Santa Clara, California
May 23, 2016
Logitech International S.A. | Fiscal 2016 Form 10-K | 72
REPORT OF INDEPENDENT REGISTERED PUBLIC ACCOUNTING FIRM
To the Shareholders of Logitech International S.A.:
In our opinion, the consolidated statements of operations, of comprehensive income and of cash flows for the year ended March 31, 2014, before the effects of the adjustments to retrospectively reflect the discontinued operations described in Note 3, present fairly, in all material respects, the results of operations and cash flows of Logitech International S.A. and its subsidiaries for the year ended March 31, 2014, in conformity with accounting principles generally accepted in the United States of America (the 2014 financial statements before the effects of the adjustments discussed in Note 3 are not presented herein). In addition, in our opinion, the financial statement schedule, before the effects of the adjustments described above, for the year ended March 31, 2014 presents fairly, in all material respects, the information set forth therein when read in conjunction with the related consolidated financial statements. These financial statements and financial statement schedule are the responsibility of the Company's management. Our responsibility is to express an opinion on these financial statements and financial statement schedule based on our audit. We conducted our audit, before the effects of the adjustments described above, of these statements in accordance with the standards of the Public Company Accounting Oversight Board (United States). Those standards require that we plan and perform the audit to obtain reasonable assurance about whether the financial statements are free of material misstatement. An audit includes examining, on a test basis, evidence supporting the amounts and disclosures in the financial statements, assessing the accounting principles used and significant estimates made by management, and evaluating the overall financial statement presentation. We believe that our audit provides a reasonable basis for our opinion.
We were not engaged to audit, review, or apply any procedures to the adjustments to retrospectively reflect the discontinued operations described in Note 3 and accordingly, we do not express an opinion or any other form of assurance about whether such adjustments are appropriate and have been properly applied. Those adjustments were audited by other auditors.
/s/ PricewaterhouseCoopers LLP
San Jose, California
November 13, 2014
Logitech International S.A. | Fiscal 2016 Form 10-K | 73
LOGITECH INTERNATIONAL S.A.
CONSOLIDATED STATEMENTS OF OPERATIONS
(In thousands, except per share amounts)
Years Ended March 31, | ||||||||||||
2016 | 2015 | 2014 | ||||||||||
Net sales | $ | 2,018,100 | $ | 2,004,908 | $ | 2,008,028 | ||||||
Cost of goods sold | 1,337,053 | 1,299,451 | 1,346,489 | |||||||||
Gross profit | 681,047 | 705,457 | 661,539 | |||||||||
Operating expenses: | ||||||||||||
Marketing and selling | 319,015 | 321,749 | 322,707 | |||||||||
Research and development | 113,624 | 108,306 | 112,446 | |||||||||
General and administrative | 101,548 | 125,995 | 112,689 | |||||||||
Restructuring charges (credits), net | 17,802 | (4,777 | ) | 8,001 | ||||||||
Total operating expenses | 551,989 | 551,273 | 555,843 | |||||||||
Operating income | 129,058 | 154,184 | 105,696 | |||||||||
Interest income (expense), net | 790 | 1,197 | (431 | ) | ||||||||
Other income (expense), net | 1,624 | (2,298 | ) | 2,039 | ||||||||
Income from continuing operations before income taxes | 131,472 | 153,083 | 107,304 | |||||||||
Provision for income taxes | 3,110 | 4,654 | 1,313 | |||||||||
Net income from continuing operations | $ | 128,362 | $ | 148,429 | $ | 105,991 | ||||||
Loss from discontinued operations, net of income taxes | (9,045 | ) | (139,146 | ) | (31,687 | ) | ||||||
Net income | $ | 119,317 | $ | 9,283 | $ | 74,304 | ||||||
Net income (loss) per share - basic: | ||||||||||||
Continuing operations | $ | 0.79 | $ | 0.91 | $ | 0.66 | ||||||
Discontinued operations | (0.06 | ) | (0.85 | ) | (0.20 | ) | ||||||
Net income per share - basic | $ | 0.73 | $ | 0.06 | $ | 0.46 | ||||||
Net income (loss) per share - diluted: | ||||||||||||
Continuing operations | $ | 0.77 | $ | 0.89 | $ | 0.65 | ||||||
Discontinued operations | (0.05 | ) | (0.83 | ) | (0.19 | ) | ||||||
Net income per share - diluted | $ | 0.72 | $ | 0.06 | $ | 0.46 | ||||||
Weighted average shares used to compute net income (loss) per share: | ||||||||||||
Basic | 163,296 | 163,536 | 160,619 | |||||||||
Diluted | 165,792 | 166,174 | 162,526 | |||||||||
Cash dividends per share | $ | 0.53 | $ | 0.27 | $ | 0.22 | ||||||
The accompanying notes are an integral part of these consolidated financial statements.
Logitech International S.A. | Fiscal 2016 Form 10-K | 74
LOGITECH INTERNATIONAL S.A.
CONSOLIDATED STATEMENTS OF COMPREHENSIVE INCOME (LOSS)
(In thousands)
Years Ended March 31, | ||||||||||||
2016 | 2015 | 2014 | ||||||||||
Net income | $ | 119,317 | $ | 9,283 | $ | 74,304 | ||||||
Other comprehensive income (loss): | ||||||||||||
Currency translation gain (loss): | ||||||||||||
Currency translation gain (loss), net of taxes | 2,273 | (19,054 | ) | 2,119 | ||||||||
Reclassification of currency translation loss (gain) included in other income (expense), net | 3,913 | (171 | ) | 665 | ||||||||
Defined benefit plans: | ||||||||||||
Net gain (loss) and prior service credits (costs), net of taxes | (837 | ) | (12,998 | ) | 5,551 | |||||||
Reclassification of amortization included in operating expenses | 1,630 | 322 | 2,017 | |||||||||
Hedging gain (loss): | ||||||||||||
Deferred hedging gain (loss), net of taxes | (2,431 | ) | 8,971 | (3,497 | ) | |||||||
Reclassification of hedging loss (gain) included in cost of goods sold | (3,296 | ) | (4,505 | ) | 2,472 | |||||||
Other comprehensive income (loss) | 1,252 | (27,435 | ) | 9,327 | ||||||||
Total comprehensive income (loss) | $ | 120,569 | $ | (18,152 | ) | $ | 83,631 | |||||
The accompanying notes are an integral part of these consolidated financial statements.
Logitech International S.A. | Fiscal 2016 Form 10-K | 75
LOGITECH INTERNATIONAL S.A.
CONSOLIDATED BALANCE SHEETS
(In thousands, except per share amounts)
March 31, | ||||||||
2016 | 2015 | |||||||
Assets | ||||||||
Current assets: | ||||||||
Cash and cash equivalents | $ | 519,195 | $ | 533,380 | ||||
Accounts receivable, net | 142,778 | 167,196 | ||||||
Inventories | 228,786 | 255,980 | ||||||
Other current assets | 35,488 | 63,362 | ||||||
Current assets of discontinued operations | — | 32,102 | ||||||
Total current assets | 926,247 | 1,052,020 | ||||||
Non-current assets: | ||||||||
Property, plant and equipment, net | 92,860 | 86,478 | ||||||
Goodwill | 218,224 | 218,213 | ||||||
Other assets | 86,816 | 62,333 | ||||||
Long-term assets of discontinued operations | — | 7,636 | ||||||
Total assets | $ | 1,324,147 | $ | 1,426,680 | ||||
Liabilities and Shareholders' Equity | ||||||||
Current liabilities: | ||||||||
Accounts payable | $ | 241,166 | $ | 292,797 | ||||
Accrued and other current liabilities | 173,764 | 163,344 | ||||||
Current liabilities of discontinued operations | — | 38,766 | ||||||
Total current liabilities | 414,930 | 494,907 | ||||||
Non-current liabilities: | ||||||||
Income taxes payable | 59,734 | 72,107 | ||||||
Other non-current liabilities | 89,535 | 91,195 | ||||||
Long-term liabilities of discontinued operations | — | 10,337 | ||||||
Total liabilities | 564,199 | 668,546 | ||||||
Commitments and contingencies (Note 13) | ||||||||
Shareholders' equity: | ||||||||
Registered shares, CHF 0.25 par value: | 30,148 | 30,148 | ||||||
Issued and authorized shares—173,106 at March 31, 2016 and 2015 | ||||||||
Conditionally authorized shares—50,000 at March 31, 2016 and 2015 | ||||||||
Additional paid-in capital | 6,616 | — | ||||||
Less shares in treasury, at cost—10,697 at March 31, 2016 and 8,625 at March 31, 2015 | (128,407 | ) | (88,951 | ) | ||||
Retained earnings | 963,576 | 930,174 | ||||||
Accumulated other comprehensive loss | (111,985 | ) | (113,237 | ) | ||||
Total shareholders' equity | 759,948 | 758,134 | ||||||
Total liabilities and shareholders' equity | $ | 1,324,147 | $ | 1,426,680 | ||||
The accompanying notes are an integral part of these consolidated financial statements.
Logitech International S.A. | Fiscal 2016 Form 10-K | 76
LOGITECH INTERNATIONAL S.A.
CONSOLIDATED STATEMENTS OF CASH FLOWS
(In thousands)
Years Ended March 31, | ||||||||||||
2016 | 2015 | 2014 | ||||||||||
Cash flows from operating activities: | ||||||||||||
Net income | $ | 119,317 | $ | 9,283 | $ | 74,304 | ||||||
Adjustments to reconcile net income to net cash provided by operating activities: | ||||||||||||
Depreciation | 51,108 | 41,304 | 48,967 | |||||||||
Amortization of other intangible assets | 1,885 | 8,361 | 17,771 | |||||||||
Share-based compensation expense | 27,351 | 25,825 | 25,546 | |||||||||
Impairment of goodwill and other assets | — | 122,734 | — | |||||||||
Impairment of investments | — | 2,298 | 624 | |||||||||
Equity in net income of equity method investees | (469 | ) | — | — | ||||||||
Loss (gain) on disposal of property, plant and equipment | — | (44 | ) | 4,411 | ||||||||
Net gain on divestiture of discontinued operations | (13,684 | ) | — | — | ||||||||
Excess tax benefits from share-based compensation | (2,084 | ) | (2,831 | ) | (2,246 | ) | ||||||
Deferred income taxes | 6,604 | 2,240 | (4,828 | ) | ||||||||
Changes in assets and liabilities, net of acquisitions: | ||||||||||||
Accounts receivable, net | 25,513 | (8,018 | ) | (219 | ) | |||||||
Inventories | 31,966 | (60,510 | ) | 49,471 | ||||||||
Other assets | (1,975 | ) | (4,284 | ) | (1,388 | ) | ||||||
Accounts payable | (58,104 | ) | 60,413 | (21,322 | ) | |||||||
Accrued and other liabilities | (4,317 | ) | (18,139 | ) | 14,330 | |||||||
Net cash provided by operating activities | 183,111 | 178,632 | 205,421 | |||||||||
Cash flows from investing activities: | ||||||||||||
Purchases of property, plant and equipment | (56,615 | ) | (45,253 | ) | (46,658 | ) | ||||||
Investment in privately held companies | (2,419 | ) | (2,550 | ) | (300 | ) | ||||||
Payments for divestiture of discontinued operations, net of cash sold | (1,395 | ) | — | — | ||||||||
Changes in restricted cash | (715 | ) | — | — | ||||||||
Acquisitions, net of cash acquired | — | (926 | ) | (650 | ) | |||||||
Proceeds from return of investment from strategic investments | — | — | 261 | |||||||||
Purchase of trading investments | (9,619 | ) | (5,034 | ) | (8,450 | ) | ||||||
Proceeds from sales of trading investments | 10,073 | 5,474 | 8,994 | |||||||||
Net cash used in investing activities | (60,690 | ) | (48,289 | ) | (46,803 | ) | ||||||
Cash flows from financing activities: | ||||||||||||
Payment of cash dividends | (85,915 | ) | (43,767 | ) | (36,123 | ) | ||||||
Purchases of treasury shares | (70,358 | ) | (1,663 | ) | — | |||||||
Contingent consideration related to prior acquisition | — | (100 | ) | — | ||||||||
Repurchase of ESPP awards | — | (1,078 | ) | — | ||||||||
Proceeds from sales of shares upon exercise of options and purchase rights | 19,767 | 4,138 | 16,914 | |||||||||
Tax withholdings related to net share settlements of restricted stock units | (7,247 | ) | (9,215 | ) | (5,718 | ) | ||||||
Excess tax benefits from share-based compensation | 2,084 | 2,831 | 2,246 | |||||||||
Net cash used in financing activities | (141,669 | ) | (48,854 | ) | (22,681 | ) | ||||||
Effect of exchange rate changes on cash and cash equivalents | 1,405 | (13,863 | ) | (349 | ) | |||||||
Net increase (decrease) in cash and cash equivalents | (17,843 | ) | 67,626 | 135,588 | ||||||||
Cash and cash equivalents at beginning of period | 537,038 | 469,412 | 333,824 | |||||||||
Cash and cash equivalents at end of period | $ | 519,195 | $ | 537,038 | $ | 469,412 | ||||||
Supplementary Cash Flow Disclosures: | ||||||||||||
Non-cash investing activities: | ||||||||||||
Property, plant and equipment purchased during the period and included in period end liability accounts | $ | 4,958 | $ | 5,242 | $ | 5,204 | ||||||
Fair value of retained cost method investment as a result of divestiture of discontinued operations | $ | 5,591 | $ | — | $ | — | ||||||
Logitech International S.A. | Fiscal 2016 Form 10-K | 77
Supplemental cash flow information: | ||||||||||||
Interest paid | $ | — | $ | — | $ | 1,080 | ||||||
Income taxes paid, net | $ | 11,499 | $ | 10,838 | $ | 9,189 | ||||||
The following amounts reflected in the consolidated statements of cash flows are included in discontinued operations: | ||||||||||||
Depreciation | $ | 2,207 | $ | 2,562 | $ | 3,402 | ||||||
Amortization of other intangible assets | $ | 1,438 | $ | 7,598 | $ | 15,369 | ||||||
Share-based compensation | $ | 332 | $ | 1,634 | $ | 2,318 | ||||||
Purchases of property, plant and equipment | $ | 1,431 | $ | 3,598 | $ | 4,233 | ||||||
Cash and cash equivalents, beginning of the period | $ | 3,659 | $ | 1,894 | $ | 2,326 | ||||||
Cash and cash equivalents, end of the period | $ | — | $ | 3,659 | $ | 1,894 | ||||||
The accompanying notes are an integral part of these consolidated financial statements.
Logitech International S.A. | Fiscal 2016 Form 10-K | 78
LOGITECH INTERNATIONAL S.A.
CONSOLIDATED STATEMENTS OF CHANGES IN SHAREHOLDERS' EQUITY
(In thousands)
Registered shares | Additional paid-in capital | Treasury shares | Retained earnings | Accumulated other comprehensive loss | |||||||||||||||||||||||||
Shares | Amount | Shares | Amount | Total | |||||||||||||||||||||||||
March 31, 2013 | 173,106 | $ | 30,148 | $ | — | 13,855 | $ | (179,990 | ) | $ | 966,924 | $ | (95,129 | ) | $ | 721,953 | |||||||||||||
Total comprehensive income | — | — | — | — | — | 74,304 | 9,327 | 83,631 | |||||||||||||||||||||
Tax effects from share-based awards | — | — | (2,046 | ) | — | — | — | — | (2,046 | ) | |||||||||||||||||||
Sale of shares upon exercise of options and purchase rights | — | — | 339 | (2,601 | ) | 45,388 | (28,813 | ) | — | 16,914 | |||||||||||||||||||
Issuance of shares upon vesting of restricted stock units | — | — | (23,810 | ) | (1,048 | ) | 18,092 | — | — | (5,718 | ) | ||||||||||||||||||
Share-based compensation expense | — | — | 25,517 | — | — | — | — | 25,517 | |||||||||||||||||||||
Cash dividends | — | — | — | — | — | (36,123 | ) | — | (36,123 | ) | |||||||||||||||||||
March 31, 2014 | 173,106 | $ | 30,148 | $ | — | 10,206 | $ | (116,510 | ) | $ | 976,292 | $ | (85,802 | ) | $ | 804,128 | |||||||||||||
Total comprehensive income (loss) | — | — | — | — | — | 9,283 | (27,435 | ) | (18,152 | ) | |||||||||||||||||||
Purchase of treasury shares | — | — | — | 115 | (1,663 | ) | — | — | (1,663 | ) | |||||||||||||||||||
Tax effects from share-based awards | — | — | (2,200 | ) | — | — | — | — | (2,200 | ) | |||||||||||||||||||
Sale of shares upon exercise of options and purchase rights | — | — | (2,367 | ) | (390 | ) | 6,505 | — | — | 4,138 | |||||||||||||||||||
Issuance of shares upon vesting of restricted stock units | — | — | (20,298 | ) | (1,306 | ) | 22,717 | (11,634 | ) | — | (9,215 | ) | |||||||||||||||||
Share-based compensation expense | — | — | 25,943 | — | — | — | — | 25,943 | |||||||||||||||||||||
Repurchase of ESPP awards | — | — | (1,078 | ) | — | — | — | — | (1,078 | ) | |||||||||||||||||||
Cash dividends | — | — | — | — | — | (43,767 | ) | — | (43,767 | ) | |||||||||||||||||||
March 31, 2015 | 173,106 | $ | 30,148 | $ | — | 8,625 | $ | (88,951 | ) | $ | 930,174 | $ | (113,237 | ) | $ | 758,134 | |||||||||||||
Total comprehensive income | — | — | — | — | — | 119,317 | 1,252 | 120,569 | |||||||||||||||||||||
Purchase of treasury shares | — | — | — | 4,951 | (70,358 | ) | — | — | (70,358 | ) | |||||||||||||||||||
Tax effects from share-based awards | — | — | (2,353 | ) | — | — | — | — | (2,353 | ) | |||||||||||||||||||
Sale of shares upon exercise of options and purchase rights | — | — | (737 | ) | (1,812 | ) | 20,504 | — | — | 19,767 | |||||||||||||||||||
Issuance of shares upon vesting of restricted stock units | — | — | (17,645 | ) | (1,067 | ) | 10,398 | — | (7,247 | ) | |||||||||||||||||||
Share-based compensation expense | — | — | 27,351 | — | — | — | — | 27,351 | |||||||||||||||||||||
Cash dividends | — | — | — | — | — | (85,915 | ) | — | (85,915 | ) | |||||||||||||||||||
March 31, 2016 | 173,106 | $ | 30,148 | $ | 6,616 | 10,697 | $ | (128,407 | ) | $ | 963,576 | $ | (111,985 | ) | $ | 759,948 | |||||||||||||
The accompanying notes are an integral part of these consolidated financial statements.
Logitech International S.A. | Fiscal 2016 Form 10-K | 79
LOGITECH INTERNATIONAL S.A.
NOTES TO CONSOLIDATED FINANCIAL STATEMENTS
Note 1—The Company
Logitech International S.A, together with its consolidated subsidiaries, ("Logitech" or the "Company") designs, manufactures and markets products that allow people to connect through music, gaming, video, computing, and other digital platforms.
The Company sells its products to a broad network of domestic and international customers, including direct sales to retailers and indirect sales through distributors.
Logitech was founded in Switzerland in 1981 and Logitech International S.A. has been the parent holding company of Logitech since 1988. Logitech International S.A. is a Swiss holding company with its registered office in Apples, Switzerland, which conducts its business through subsidiaries in Americas, Europe, Middle East, Africa ("EMEA") and Asia Pacific. Shares of Logitech International S.A. are listed on both the SIX Swiss Exchange under the trading symbol LOGN and the Nasdaq Global Select Market under the trading symbol LOGI.
Note 2—Summary of Significant Accounting Policies
Basis of Presentation
The consolidated financial statements include the accounts of Logitech and its subsidiaries. All intercompany balances and transactions have been eliminated. The consolidated financial statements are presented in accordance with U.S. GAAP (accounting principles generally accepted in the United States of America).
During the third quarter of fiscal year 2016, the Company's Board of Directors approved a plan to divest the Lifesize video conferencing business. On December 28, 2015, the Company and Lifesize, Inc., a wholly owned subsidiary of the Company (“Lifesize”) which holds the assets of the Company’s Lifesize video conferencing business, entered into a stock purchase agreement (the “Stock Purchase Agreement”) with three venture capital firms. Immediately following the December 28, 2015 closing of the transactions contemplated by the Stock Purchase Agreement, the venture capital firms held 62.5% of the outstanding shares of Lifesize, which resulted in a divestiture of the Lifesize video conferencing business by the Company. The disposition of the Lifesize video conferencing business was completed during the fourth quarter of fiscal year 2016, and represents a strategic shift that has a major effect on the Company's operations and financial results. As a result, the Company has classified the results of Lifesize video conferencing business as discontinued operations in its consolidated statements of operations for all periods presented. Additionally, the related assets and liabilities associated with the discontinued operations are classified separately on its consolidated balance sheets for the comparative periods presented herein.
Unless indicated otherwise, the information in the Notes to the consolidated financial statements relates to the Company's continuing operations and does not include results of Lifesize video conferencing business, which is classified as discontinued operations. See "Note 3 - Discontinued Operations" for more information.
Fiscal Year
The Company's fiscal year ends on March 31. Interim quarters are thirteen-week periods, each ending on a Friday of each quarter. For purposes of presentation, the Company has indicated its quarterly periods ending on the last day of the calendar quarter.
Use of Estimates
The preparation of financial statements in conformity with U.S. GAAP requires management to make judgments, estimates and assumptions that affect the amounts reported in the consolidated financial statements. Management bases its estimates on historical experience and various other assumptions believed to be reasonable. Examples of significant estimates and assumptions made by management involve the fair value of goodwill, warranty liabilities, accruals for discretionary customer programs, sales return reserves, allowance for doubtful accounts, inventory valuation, restructuring charges, contingent liabilities, share-based compensation expense, uncertain tax positions, and valuation allowances for deferred tax assets. Although these estimates are based on management’s best knowledge of current events and actions that may impact the Company in the future, actual results could differ materially from those estimates.
Logitech International S.A. | Fiscal 2016 Form 10-K | 80
Foreign Currencies
The functional currency of the Company's operations is primarily the U.S. Dollar. Certain operations use the Euro, Chinese Renminbi, Swiss Franc, or other local currencies as their functional currencies. The financial statements of the Company's subsidiaries whose functional currency is other than the U.S. Dollar are translated to U.S. Dollars using period-end rates of exchange for assets and liabilities and monthly average rates for net sales, income and expenses. Cumulative translation gains and losses are included as a component of shareholders' equity in accumulated other comprehensive loss. Gains and losses arising from transactions denominated in currencies other than a subsidiary's functional currency are reported in other income (expense), net in the consolidated statements of operations.
Revenue Recognition
Revenue is recognized when all of the following criteria are met:
• | Evidence of an arrangement between the Company and the customer exists; |
• | Delivery has occurred and title and risk of loss has transferred to the customer; |
• | The price of the product is fixed or determinable; and |
• | Collectability of the receivable is reasonably assured. |
For sales of most hardware peripherals products and hardware bundled with software essential to its functionality, these criteria are met at the time delivery has occurred and title and risk of loss have transferred to the customer.
Revenues from sales to distributors and authorized resellers are recognized upon shipment net of estimated product returns and expected payments for cooperative marketing arrangements, customer incentive programs and pricing programs. The estimated cost of these programs is recorded as a reduction of sales or as an operating expense, if the Company receives a separately identifiable benefit from the customer and can reasonably estimate the fair value of that benefit. Significant management judgment and estimates are used to determine the cost of these programs in any accounting period.
The Company enters into cooperative marketing arrangements with many of its distribution and retail customers, and with certain indirect partners, allowing customers to receive a credit equal to a set percentage of their purchases of the Company's products, or a fixed dollar credit for various marketing programs. The objective of these arrangements is to encourage advertising and promotional events to increase sales of the Company's products. Accruals for these marketing arrangements are recorded at the later of time of sale or time of commitment, based on negotiated terms, historical experience and inventory levels in the channel.
Customer incentive programs include consumer rebate and performance-based incentives. The Company offers performance-based incentives to its distribution customers, retail customers and indirect partners based on pre-determined performance criteria. Accruals for performance-based incentives are recognized as a reduction of the sale price at the time of sale. Estimates of required accruals are determined based on negotiated terms, consideration of historical experience, anticipated volume of future purchases, and inventory levels in the channel. Consumer rebates are offered from time to time at the Company's discretion for the primary benefit of end-users. Accruals for the estimated costs of consumer rebates and similar incentives are recorded at the later of time of sale or when the incentive is offered, based on the specific terms and conditions. Certain incentive programs, including consumer rebates, require management to estimate the number of customers who will actually redeem the incentive based on historical experience and the specific terms and conditions of particular programs.
The Company has agreements with certain of its customers that contain terms allowing price protection credits to be issued in the event of a subsequent price reduction. At management's discretion, the Company also offers special pricing discounts to certain customers. Special pricing discounts are usually offered only for limited time periods or for sales of selected products to specific indirect partners. Management's decision to make price reductions is influenced by product life cycle stage, market acceptance of products, the competitive environment, new product introductions and other factors. Accruals for estimated expected future pricing actions are recognized at the time of sale based on analyses of historical pricing actions by customer and by products, inventories owned by and located at distributors and retailers, current customer demand, current operating conditions, and other relevant customer and product information, such as stage of product life-cycle.
The Company grants limited rights to return products. Return rights vary by customer, and range from just the right to return defective product to stock rotation rights limited to a percentage of sales approved by management. Estimates of expected future product returns are recognized at the time of sale based on analyses of historical
Logitech International S.A. | Fiscal 2016 Form 10-K | 81
return trends by customer and by product, inventories owned by and located at distributors and retailers, current customer demand, current operating conditions, and other relevant customer and product information. Upon recognition, the Company reduces sales and cost of sales for the estimated return. Return trends are influenced by product life cycle status, new product introductions, market acceptance of products, sales levels, product sell-through, the type of customer, seasonality, product quality issues, competitive pressures, operational policies and procedures, and other factors.
Return rates can fluctuate over time, but are sufficiently predictable to allow the Company to estimate expected future product returns.
The Company regularly evaluates the adequacy of its estimates for cooperative marketing arrangements, customer incentive programs and pricing programs, and product returns. Future market conditions and product transitions may require the Company to take action to change such programs. In addition, when the variables used to estimate these costs change, or if actual costs differ significantly from the estimates, the Company would be required to record incremental increases or reductions to sales, cost of goods sold or operating expenses. If, at any future time, the Company becomes unable to reasonably estimate these costs, recognition of revenue might be deferred until products are sold to users, which would adversely impact sales in the period of transition.
Shipping and Handling Costs
The Company's shipping and handling costs are included in cost of sales in the consolidated statements of operations for all periods presented.
Research and Development Costs
Costs related to research, design and development of products, which consist primarily of personnel, product design and infrastructure expenses, are charged to research and development expense as they are incurred.
Advertising Costs
Advertising costs are expensed as incurred. Advertising costs are recorded as either a marketing and selling expense or a deduction from revenue. Advertising costs paid or reimbursed by the Company to direct or indirect customers must have an identifiable benefit and an estimable fair value in order to be classified as an operating expense. If these criteria are not met, the cost is classified as a reduction of revenue. Advertising costs during fiscal years 2016, 2015 and 2014 were $181.7 million, $165.7 million and $156.8 million, respectively.
Cash Equivalents
The Company considers all highly liquid instruments purchased with an original maturity of three months or less to be cash equivalents. Cash equivalents are carried at cost, which approximates fair value.
All of the Company's bank time deposits have an original maturity of three months or less and are classified as cash equivalents and are recorded at cost, which approximates fair value.
Concentration of Credit Risk
Financial instruments that potentially subject the Company to concentrations of credit risk consist principally of cash and cash equivalents and accounts receivable. The Company maintains cash and cash equivalents with various financial institutions to limit exposure with any one financial institution, but is exposed to credit risk in the event of default by financial institutions to the extent that cash balances with individual financial institutions are in excess of amounts that are insured.
The Company sells to large distributors and retailers and, as a result, maintains individually significant receivable balances with such customers. In fiscal years 2016, 2015 and 2014, one customer represented 14%, 15% and 15% of the Company's total net sales. In fiscal year 2016, another customer accounted for 10% of the Company's net sales. No other customer represented more than 10% of the Company's total net sales during fiscal years 2016, 2015 or 2014. As of March 31, 2016 and 2015, one customer represented 15% and 13% of total accounts receivable, respectively. Typical payment terms require customers to pay for product sales generally within 30 to 60 days; however terms may vary by customer type, by country and by selling season. Extended payment terms are sometimes offered to a limited number of customers during the second and third fiscal quarters. The Company does not modify payment terms on existing receivables.
The Company manages its accounts receivable credit risk through ongoing credit evaluation of its customers' financial condition. The Company generally does not require collateral from its customers.
Logitech International S.A. | Fiscal 2016 Form 10-K | 82
Allowances for Doubtful Accounts
Allowances for doubtful accounts are maintained for estimated losses resulting from the inability of the Company's customers to make required payments. The allowances are based on the Company's regular assessment of the credit worthiness and financial condition of specific customers, as well as its historical experience with bad debts and customer deductions, receivables aging, current economic trends, geographic or country-specific risks and the financial condition of its distribution channels.
Inventories
Inventories are stated at the lower of cost or market. Costs are computed under the standard cost method, which approximates actual costs determined on the first-in, first-out basis. The Company records write-downs of inventories which are obsolete or in excess of anticipated demand or market value based on a consideration of marketability and product life cycle stage, product development plans, component cost trends, demand forecasts, historical net sales, and assumptions about future demand and market conditions.
As of March 31, 2016 and 2015, the Company also recorded a liability of $8.5 million and $9.8 million, respectively, arising from firm, non-cancelable, and unhedged inventory purchase commitments in excess of anticipated demand or market value consistent with its valuation of excess and obsolete inventory. Such liability is included in accrued and other current liabilities.
Property, Plant and Equipment
Property, plant and equipment are stated at cost. Additions and improvements are capitalized, and maintenance and repairs are expensed as incurred. The Company capitalizes the cost of software developed for internal use in connection with major projects. Costs incurred during the feasibility stage are expensed, whereas direct costs incurred during the application development stage are capitalized.
Depreciation is provided using the straight-line method. Plant and buildings are depreciated over estimated useful lives from ten to twenty-five years, equipment over useful lives from three to five years, internal-use software development over useful lives of three to seven years and leasehold improvements over the lesser of the useful life of the improvement or the term of the lease.
When property and equipment is retired or otherwise disposed of, the cost and accumulated depreciation are relieved from the accounts and the net gain or loss is included in operating expenses.
Valuation of Long-Lived Assets
The Company reviews long-lived assets, such as property and equipment, and finite-lived intangible assets, for impairment whenever events indicate that the carrying amounts might not be recoverable. Recoverability of property and equipment, and other finite-lived intangible asset is measured by comparing the projected undiscounted net cash flows associated with those assets to their carrying values. If an asset is considered impaired, it is written down to fair value, which is determined based on the asset's projected discounted cash flows or appraised value, depending on the nature of the asset. For purposes of recognition of an impairment for assets held for use, the Company groups assets and liabilities at the lowest level for which cash flows are separately identifiable.
Goodwill and Other Intangible Assets
The Company's intangible assets principally include goodwill, acquired technology, trademarks, and customer contracts. Other intangible assets with finite lives, which include acquired technology, trademarks and customer contracts, and other are recorded at cost and amortized using the straight-line method over their useful lives ranging from one year to ten years. Intangible assets with indefinite lives, which include only goodwill, are recorded at cost and evaluated at least annually for impairment.
Logitech International S.A. | Fiscal 2016 Form 10-K | 83
Goodwill represents the excess of the purchase price over the fair value of the net tangible and identifiable intangible assets acquired in each business combination. The Company conducts a goodwill impairment analysis annually at December 31 or more frequently if indicators of impairment exist or if a decision is made to sell or exit a business. A significant amount of judgment is involved in determining if an indicator of impairment has occurred. Such indicators may include deterioration in general economic conditions, negative developments in equity and credit markets, adverse changes in the markets in which an entity operates, increases in input costs that have a negative effect on earnings and cash flows, or a trend of negative or declining cash flows over multiple periods, among others. The fair value that could be realized in an actual transaction may differ from that used to evaluate the impairment of goodwill.
In reviewing goodwill for impairment, an entity has the option to first assess qualitative factors to determine whether the existence of events or circumstances leads to a determination that it is more likely than not (greater than 50%) that the estimated fair value of a reporting unit is less than its carrying amount. If an entity elects to perform a qualitative assessment and determines that an impairment is more likely than not, the entity is then required to perform the two-step quantitative impairment test, otherwise no further analysis is required. An entity also may elect not to perform the qualitative assessment and, instead, proceed directly to the two-step quantitative impairment test. The ultimate outcome of the goodwill impairment review for a reporting unit should be the same whether an entity chooses to perform the qualitative assessment or proceeds directly to the two-step quantitative impairment test.
Long-lived intangible assets are tested for recoverability whenever events or changes in circumstances indicate that their carrying amounts may not be recoverable.
Income Taxes
The Company provides for income taxes using the asset and liability method, which requires that deferred tax assets and liabilities be recognized for the expected future tax consequences of temporary differences resulting from differing treatment of items for tax and accounting purposes. In estimating future tax consequences, expected future events are taken into consideration, with the exception of potential tax law or tax rate changes.
The Company's assessment of uncertain tax positions requires that management makes estimates and judgments about the application of tax law, the expected resolution of uncertain tax positions and other matters. In the event that uncertain tax positions are resolved for amounts different than the Company's estimates, or the related statutes of limitations expire without the assessment of additional income taxes, the Company will be required to adjust the amounts of the related assets and liabilities in the period in which such events occur. Such adjustments may have a material impact on the Company's income tax provision and its results of operations.
Fair Value of Financial Instruments
The carrying value of certain of the Company's financial instruments, including cash equivalents, accounts receivable and accounts payable approximates fair value due to their short maturities.
The Company's investment securities portfolio consists of bank time deposits with an original maturity of three months or less and marketable securities (money market and mutual funds) related to a deferred compensation plan.
The Company's trading investments related to the deferred compensation plan are reported at fair value based on quoted market prices. The marketable securities related to the deferred compensation plan are classified as non-current trading investments, as they are intended to fund the deferred compensation plan long-term liability. Since participants in the deferred compensation plan may select the mutual funds in which their compensation deferrals are invested within the confines of the Rabbi Trust which holds the marketable securities, the Company has designated these marketable securities as trading investments, although there is no intent to actively buy and sell securities within the objective of generating profits on short-term differences in market prices. These securities are recorded at fair value based on quoted market prices. Earnings, gains and losses on trading investments are included in other income (expense), net.
The Company also holds investments in equity and other securities that are accounted for as either cost or equity method investments, which are classified as other assets. The cost method investment is initially recognized at fair value, which represents a Level 3 valuation as the assumptions used in valuing this investment were not directly or indirectly observable. The Company reviews the fair value of its non-marketable investments on a regular basis to determine whether the investments in these companies are other-than-temporarily impaired. The Company
Logitech International S.A. | Fiscal 2016 Form 10-K | 84
considers investee financial performance and other information received from the investee companies, as well as any other available estimates of the fair value of the investee companies in its review. If the Company determines the carrying value of an investment exceeds its fair value, and that difference is other than temporary, the Company writes down the value of the investment to its fair value. The fair value of cost investments is not adjusted if there are no identified adverse events or changes in circumstances that may have a material effect on the fair value of the investments.
Net Income (Loss) per Share
Basic net income (loss) per share is computed by dividing net income (loss) by the weighted average outstanding shares. Diluted net income (loss) per share is computed using the weighted average outstanding shares and dilutive share equivalents. Dilutive share equivalents consist of share-based awards, including stock options, purchase rights under employee share purchase plan, and restricted stock units ("RSUs").
The dilutive effect of in-the-money share-based compensation awards is calculated based on the average share price for each fiscal period using the treasury stock method, which assumes that the amount used to repurchase shares includes the amount the employee must pay for exercising share-based awards, the amount of compensation cost not yet recognized for future service, and the amount of tax impact that would be recorded in additional paid-in capital when the award becomes deductible. The dilutive securities are excluded from the computation of diluted net loss per share from continuing operations as their effect would be anti-dilutive.
Share-Based Compensation Expense
Share-based compensation expense includes compensation expense, reduced for estimated forfeitures, for share-based awards granted based on the grant date fair value. The grant date fair value for stock options and stock purchase rights is estimated using the Black-Scholes-Merton option-pricing valuation model. The grant date fair value of RSUs which vest upon meeting certain market conditions is estimated using the Monte-Carlo simulation method. The grant date fair value of time-based and performance-based RSUs is calculated based on the market price on the date of grant, adjusted by estimated dividends yield prior to vesting. With respect to awards with service conditions only, compensation expense is recognized ratably over the vesting period of the awards.
Excess tax benefits resulting from share-based awards are classified as cash flows from financing activities in the consolidated statements of cash flows. Excess tax benefits are realized tax benefits from tax deductions for exercised options and vested RSUs in excess of the deferred tax asset attributable to share-based compensation costs for such share-based awards.
The Company will recognize a benefit from share-based compensation in additional paid-in capital only if an incremental tax benefit is realized after all other available tax attributes have been utilized.
Product Warranty Accrual
The Company estimates cost of product warranties at the time the related revenue is recognized based on historical and projected warranty claim rates, historical and projected costs, and knowledge of specific product failures that are outside of the Company's typical experience. Each quarter, the Company reevaluates estimates to assess the adequacy of recorded warranty liabilities considering the size of the installed base of products subject to warranty protection and adjusts the amounts as necessary. If actual product failure rates or repair costs differ from estimates, revisions to the estimated warranty liabilities would be required and could materially affect the Company's results of operations.
Comprehensive Income (Loss)
Comprehensive income (loss) is defined as the total change in shareholders' equity during the period other than from transactions with shareholders. Comprehensive income (loss) consists of net income (loss) and other comprehensive income (loss). Other comprehensive income (loss) is comprised of currency translation adjustments from those entities not using the U.S. Dollar as their functional currency, unrealized gains and losses on marketable equity securities, net deferred gains and losses and prior service costs and credits for defined benefit pension plans, and net deferred gains and losses on hedging activity.
Logitech International S.A. | Fiscal 2016 Form 10-K | 85
Treasury Shares
The Company periodically repurchases shares in the market at fair value. Treasury shares repurchased are recorded at cost as a reduction of total shareholders' equity. Treasury shares held may be reissued to satisfy the exercise of employee stock options and purchase rights, the vesting of restricted stock units, and acquisitions, or may be cancelled with shareholder approval. Treasury shares that are reissued are accounted for using the first-in, first-out basis.
Derivative Financial Instruments
The Company enters into foreign exchange forward contracts to reduce the short-term effects of currency fluctuations on certain foreign currency receivables or payables and to hedge against exposure to changes in currency exchange rates related to its subsidiaries' forecasted inventory purchases. These forward contracts generally mature within four months.
Gains and losses for changes in the fair value of the effective portion of the Company's forward contracts related to forecasted inventory purchases are deferred as a component of accumulated other comprehensive income (loss) until the hedged inventory purchases are sold, at which time the gains or losses are reclassified to cost of goods sold. Gains or losses for changes in the fair value on forward contracts that offset translation losses or gains on foreign currency receivables or payables are recognized immediately and included in other income (expense), net.
Restructuring Charges
The Company's restructuring charges consist of employee severance, one-time termination benefits and ongoing benefits related to the reduction of its workforce, lease exit costs, and other costs. Liabilities for costs associated with a restructuring activity are measured at fair value and are recognized when the liability is incurred, as opposed to when management commits to a restructuring plan. One-time termination benefits are expensed at the date the entity notifies the employee, unless the employee must provide future service, in which case the benefits are expensed ratably over the future service period. Ongoing benefits are expensed when restructuring activities are probable and the benefit amounts are estimable. Costs to terminate a lease before the end of its term are recognized when the property is vacated. Other costs primarily consist of legal, consulting, and other costs related to employee terminations are expensed when incurred. Termination benefits are calculated based on regional benefit practices and local statutory requirements.
Segments
ASC 280, Segment Reporting, establishes standards for reporting information about operating segments. Operating segments are defined as components of an enterprise about which separate financial information is available that is evaluated regularly by the chief operating decision maker, or decision making group, in deciding how to allocate resources and in assessing performance. The guidance defines reportable segments as operating segments that meet certain quantitative thresholds. As a result of the disposition of the Lifesize video conferencing business on December 28, 2015 described above, the composition of the Company's previously reported segments changed significantly, such that the remaining peripheral segment is the only segment reported in continuing operations.
Recent Accounting Pronouncements
In April 2014, the FASB issued ASU No. 2014-08, "Presentation of Financial Statements (Topic 205) and Property, Plant and Equipment (Topic 360): Reporting Discontinued Operations and Disclosures of Disposals of Components of an Entity". This new standard raises the threshold for a disposal to qualify as a discontinued operation and requires new disclosures of both discontinued operations and certain other disposals that do not meet the definition of a discontinued operation. The standard is effective prospectively for years beginning on or after December 15, 2014, with early application permitted. The Company adopted ASU No. 2014-08 on April 1, 2015 on a prospective basis and applied the guidance to its disposition of the Lifesize video conferencing business.
In May 2014, the FASB issued ASU No. 2014-9, "Revenue from Contracts with Customers (Topic 606)," ("ASU 2014-9"). ASU 2014-9 outlines a new, single comprehensive model for entities to use in accounting for revenue arising from contracts with customers and supersedes most current revenue recognition guidance, including industry-specific guidance. Under the new model, recognition of revenue occurs when a customer obtains control of promised goods or services in an amount that reflects the consideration to which the entity expects to be entitled in exchange for those goods or services. In addition, the new standard requires that reporting companies disclose the
Logitech International S.A. | Fiscal 2016 Form 10-K | 86
nature, amount, timing, and uncertainty of revenue and cash flows arising from contracts with customers. ASU 2014-09 was originally to be effective for the Company on April 1, 2017. In July 2015, the FASB affirmed a one-year deferral of the effective date of the new revenue standard. The new standard will become effective for the Company on April 1, 2018. Early application is permitted but not before the original effective date of annual periods beginning after December 15, 2016. The new standard is required to be applied retrospectively to each prior reporting period presented or retrospectively with the cumulative effect of initially applying it recognized at the date of initial application. The Company has not yet selected a transition method nor has it determined whether it will early adopt this guidance or the impact of the new standard on its consolidated financial statements.
In July 2015, the FASB issued ASU No. 2015-11, "Simplifying the Measurement of Inventory (Topic 330)", ("ASU 2015-11"). Topic 330, Inventory, currently requires an entity to measure inventory at the lower of cost or market, with market value represented by replacement cost, net realizable value or net realizable value less a normal profit margin. The amendments in ASU 2015-11 require an entity to measure inventory at the lower of cost or net realizable value. ASU 2015-11 is effective in the first quarter of fiscal year 2018 for the Company, with early adoption permitted. The Company does not expect to early adopt this guidance and does not expect the adoption of this guidance to have a material impact on its consolidated financial statements.
In November 2015, FASB issued ASU No. 2015-17, “Income Taxes (Topic 740), Balance Sheet Classification of Deferred Taxes” ("ASU 2015-17"). The guidance eliminates the current requirement for an entity to separate deferred income tax liabilities and assets into current and non-current amounts in a classified balance sheet. Instead, the guidance requires deferred tax liabilities, deferred tax assets and valuation allowances be classified as non-current in a classified balance sheet. The ASU is effective for annual reporting periods beginning after December 15, 2016 and interim periods within those annual periods. Early adoption is permitted. The Company has early adopted the guidance in the fourth quarter of fiscal year 2016 on a prospective basis. Prior periods are therefore not adjusted.
In January 2016, FASB issued ASU 2016-01 “Financial Instruments- Recognition and Measurement of Financial Assets and Financial Liabilities (Subtopic 825-10)”, which amends certain aspects of recognition, measurement, presentation and disclosure of financial instruments, including the requirement to measure certain equity investments at fair value with changes in fair value recognized in net income. This guidance is effective for fiscal years beginning after December 15, 2017, including interim periods within those fiscal years. The Company does not expect to early adopt this guidance and does not believe that the adoption of this guidance will have a material impact on its consolidated financial statements.
In February 2016, the FASB issued ASU 2016-02 "Leases (Topic 842)", which requires the recognition of lease assets and lease liabilities arising from operating leases in the statement of financial position. This guidance is effective for fiscal years beginning after December 15, 2018, including interim periods within those fiscal years. The Company is evaluating the full effect that ASU 2016-02 will have on its consolidated financial statements and will adopt the standard effective April 1, 2019.
In March 2016, the FASB issued ASU 2016-09 "Compensation-Stock Compensation (Topic 718): Improvements to Employee Share-Based Payment Accounting". The amendment simplifies several aspects of the accounting for share-based payments, including immediate recognition of all excess tax benefits and deficiencies in the income statement, changing the threshold to qualify for equity classification up to the employees' maximum statutory tax rates, allowing an entity-wide accounting policy election to either estimate the number of awards that are expected to vest or account for forfeitures as they occur, and clarifying the classification on the statement of cash flows for the excess tax benefit and employee taxes paid when an employer withholds shares for tax-withholding purposes. ASU 2016-09 is effective for annual periods beginning after December 15, 2016, and interim periods within those annual periods. Early adoption is permitted in any interim or annual period. The Company is evaluating the effect that ASU 2016-09 will have on its consolidated financial statements and the timing of the adoption of this standard.
Note 3 - Discontinued Operations
During the third quarter of fiscal year 2016, the Company's Board of Directors approved a plan to divest the Lifesize video conferencing business. On December 28, 2015 during the fourth quarter of fiscal year 2016, Logitech International S.A. (the "Company"), and Lifesize, Inc., a wholly owned subsidiary of the Company (“Lifesize”) which holds the assets of the Company’s video conferencing reportable segment, entered into a stock purchase agreement (the “Stock Purchase Agreement”) with entities affiliated with three venture capital investment firms (the
Logitech International S.A. | Fiscal 2016 Form 10-K | 87
"Venture Investors"). Pursuant to the terms of the Stock Purchase Agreement, the Company sold 2,500,000 shares of Series B Preferred Stock of Lifesize to the Venture Investors for cash proceeds of $2,500,000 and retained 12,000,000 non-voting shares of Series A Preferred Stock of Lifesize. The shares of Series A Preferred Stock of Lifesize retained by the Company represent 37.5% of the shares outstanding immediately after the closing of the transactions contemplated by the Stock Purchase Agreement (the “Closing”). Lifesize also issued 17,500,000 shares of Series B Preferred Stock to the Venture Investors for cash proceeds of $17,500,000. The shares of Series B Preferred Stock held by the Venture Investors represent 62.5% of the shares outstanding immediately after the Closing. In addition, Lifesize has reserved 8,000,000 shares of common stock for issuance pursuant to a stock plan to be adopted by Lifesize following the Closing (the “Employee Pool”), none of which are issued or outstanding at the Closing. Post the divestiture, continuing involvement with the discontinued operations includes certain customary services and support which are expected to be provided to Lifesize during the transition period from December 28, 2015 until approximately the end of the third quarter of fiscal year 2017.
The Company has classified the results of its Lifesize video conferencing business as discontinued operations in its consolidated statement of operations for all periods presented since the disposition of the Lifesize video conferencing business represents a strategic shift as that has a major effect on the Company's operations and financial results. Additionally, the related assets and liabilities associated with the discontinued operations are classified separately in the assets and liability on its consolidated balance sheets for all periods presented. Evaluating whether the disposal of the business represents a strategic shift requires the Company's judgment. Also, evaluating whether the strategic shift will have a "major effect" on the Company's operations and financial results requires assessing not only quantitative factors but also the magnitude of qualitative factors.
The retained Series A Preferred Stock gives the Company no voting rights or any other significant influence over the disposed Lifesize video conferencing business, and therefore is accounted for as a cost method investment which is initially recognized at fair value of $5.6 million at the date of disposition of Lifesize Video Conferencing business. The fair value was determined by using the option pricing methodology with reference to the price of Lifesize’s Series B Preferred Stock paid by Venture Investors. The fair value of the Company’s investment in Series A Preferred Stock is classified as Level 3 as application of the option pricing methodology requires use of significant unobservable inputs including asset volatility of 50%, expected term to exit of three years, and lack of marketability discount of 27%.
Discontinued operations include results of the Lifesize video conferencing business. Discontinued operations also include other costs incurred by Logitech to effect the divestiture of the Lifesize video conferencing business. These costs include transaction charges, advisory and consulting fees and restructuring cost related to the Lifesize video conferencing business.
Logitech International S.A. | Fiscal 2016 Form 10-K | 88
The following table presents financial results of the video conferencing classified as discontinued operations (in thousands):
Years Ended March 31, | ||||||||||||
2016 | 2015 | 2014 | ||||||||||
Net sales | $ | 65,554 | $ | 109,039 | $ | 120,684 | ||||||
Cost of goods sold | 24,951 | 40,299 | 54,355 | |||||||||
Gross profit | 40,603 | 68,740 | 66,329 | |||||||||
Operating expenses: | ||||||||||||
Marketing and selling | 32,260 | 56,856 | 57,040 | |||||||||
Research and development | 16,526 | 22,706 | 26,939 | |||||||||
General and administrative | 5,254 | 5,439 | 6,251 | |||||||||
Impairment of goodwill (#) | — | 122,734 | — | |||||||||
Restructuring charges (credits), net | 7,900 | (111 | ) | 5,810 | ||||||||
Operating expenses | 61,940 | 207,624 | 96,040 | |||||||||
Operating loss from discontinued operations | (21,337 | ) | (138,884 | ) | (29,711 | ) | ||||||
Interest expense and other, net | 205 | 426 | 11 | |||||||||
Gain on disposal of discontinued operations | 13,684 | — | — | |||||||||
Loss from discontinued operations before income taxes | (7,858 | ) | (139,310 | ) | (29,722 | ) | ||||||
Provision for (benefit from) income taxes | 1,187 | (164 | ) | 1,965 | ||||||||
Net loss from discontinued operations | $ | (9,045 | ) | $ | (139,146 | ) | $ | (31,687 | ) | |||
(#) The Company recognized $122.7 million impairment of goodwill in its discontinued operations as result of its impairment analysis as of March 31, 2015. Refer to the Company's Annual Report on Form 10-K for fiscal year 2015.
Logitech International S.A. | Fiscal 2016 Form 10-K | 89
The following table presents the aggregate carrying amounts of the major classes of assets and liabilities removed from the consolidated balance sheet immediately before the disposition and assets liabilities of discontinued operations as of March 31, 2015 (in thousands):
Immediately before the disposition | March 31, 2015 | |||||||
Carrying amounts of assets included as part of discontinued operations: | ||||||||
Cash and cash equivalents | $ | 3,895 | $ | 3,659 | ||||
Accounts receivable, net | 10,360 | 12,627 | ||||||
Inventories | 12,708 | 14,749 | ||||||
Other current assets | 1,930 | 1,067 | ||||||
Total current assets | 28,893 | 32,102 | ||||||
Property, plant and equipment, net | 3,962 | 5,115 | ||||||
Other assets | 1,125 | 2,521 | ||||||
Total non-current assets | 5,087 | 7,636 | ||||||
Total assets classified as assets from discontinued operations on the consolidated balance sheets | $ | 33,980 | $ | 39,738 | ||||
Carrying amounts of liabilities included as part of discontinued operations: | ||||||||
Accounts payable | $ | 2,382 | $ | 7,198 | ||||
Accrued and other current liabilities | 31,664 | 31,568 | ||||||
Total current liabilities | 34,046 | 38,766 | ||||||
Non-current liabilities | 9,915 | 10,337 | ||||||
Total liabilities classified as liabilities from discontinued operations on the consolidated balance sheets | $ | 43,961 | $ | 49,103 | ||||
The Company recognized a gain on its divestiture of Lifesize video conferencing business as follows (in thousands):
Year Ended | ||||
March 31, 2016 | ||||
Proceeds received from disposition of discontinued operations | $ | 2,500 | ||
Fair value of retained cost method investment as a result of divestiture of discontinued operations | 5,591 | |||
Net liabilities of discontinued operations disposed | 9,981 | |||
Currency translation loss released due to disposition of discontinued operations (1) | (3,913 | ) | ||
Transaction related costs | (475 | ) | ||
Gain on disposal of discontinued operations (2) | $ | 13,684 | ||
(1) | Currency translation loss recognized as a result of substantial liquidation of a subsidiary using non-USD functional currency, which is part of discontinued operations |
(2) | Gain on disposal of discontinued operation was included in loss from discontinued operations, net of income taxes, in the Company's consolidated statement of operations |
Logitech International S.A. | Fiscal 2016 Form 10-K | 90
Note 4—Net Income (Loss) per Share
The computations of basic and diluted net income (loss) per share for the Company were as follows (in thousands except per share amounts):
Years Ended March 31, | ||||||||||||
2016 | 2015 | 2014 | ||||||||||
Net Income (loss): | ||||||||||||
Continuing operations | $ | 128,362 | $ | 148,429 | $ | 105,991 | ||||||
Discontinued operations | (9,045 | ) | (139,146 | ) | (31,687 | ) | ||||||
Net income | $ | 119,317 | $ | 9,283 | $ | 74,304 | ||||||
Shares used in net income (loss) per share computation: | ||||||||||||
Weighted average shares outstanding - basic | 163,296 | 163,536 | 160,619 | |||||||||
Effect of potentially dilutive equivalent shares | 2,496 | 2,638 | 1,907 | |||||||||
Weighted average shares outstanding - diluted | 165,792 | 166,174 | 162,526 | |||||||||
Net income (loss) per share - basic: | ||||||||||||
Continuing operations | $ | 0.79 | $ | 0.91 | $ | 0.66 | ||||||
Discontinued operations | $ | (0.06 | ) | $ | (0.85 | ) | $ | (0.20 | ) | |||
Net income per share - basic | $ | 0.73 | $ | 0.06 | $ | 0.46 | ||||||
Net income (loss) per share - diluted: | ||||||||||||
Continuing operations | $ | 0.77 | $ | 0.89 | $ | 0.65 | ||||||
Discontinued operations | $ | (0.05 | ) | $ | (0.83 | ) | $ | (0.19 | ) | |||
Net income per share - diluted | $ | 0.72 | $ | 0.06 | $ | 0.46 | ||||||
During fiscal years 2016, 2015 and 2014, 5.2 million, 9.0 million and 15.1 million share equivalents attributable to outstanding stock options, RSUs and ESPP were excluded from the calculation of diluted net income (loss) per share because the combined exercise price, average unamortized fair value and assumed tax benefits upon exercise of these options and ESPP or vesting of RSUs were greater than the average market price of the Company's shares, and therefore their inclusion would have been anti-dilutive.
Note 5—Employee Benefit Plans
Employee Share Purchase Plans and Stock Incentive Plans
As of March 31, 2016, the Company offers the 2006 ESPP (2006 Employee Share Purchase Plan (Non-U.S.)), the 1996 ESPP (1996 Employee Share Purchase Plan (U.S.)), the 2006 Plan (2006 Stock Incentive Plan) and the 2012 Plan (2012 Stock Inducement Equity Plan). Shares issued to employees as a result of purchases or exercises under these plans are generally issued from shares held in treasury stock.
Logitech International S.A. | Fiscal 2016 Form 10-K | 91
The following table summarizes share-based compensation expense and related tax benefit recognized for fiscal years 2016, 2015 and 2014 (in thousands):
Years Ended March 31, | ||||||||||||
2016 | 2015 | 2014 | ||||||||||
Cost of goods sold | $ | 2,340 | $ | 2,474 | $ | 2,518 | ||||||
Marketing and selling | 9,273 | 8,570 | 7,848 | |||||||||
Research and development | 3,046 | 2,381 | 2,811 | |||||||||
General and administrative | 12,353 | 10,766 | 10,051 | |||||||||
Restructuring | 7 | — | — | |||||||||
Total share-based compensation expense | 27,019 | 24,191 | 23,228 | |||||||||
Income tax benefit | (6,297 | ) | (4,814 | ) | (4,447 | ) | ||||||
Total share-based compensation expense, net of income tax | $ | 20,722 | $ | 19,377 | $ | 18,781 | ||||||
As of March 31, 2016, 2015 and 2014, the Company capitalized $0.5 million, $0.5 million and $0.4 million, respectively, of stock-based compensation expenses as inventory.
The following table summarizes total unamortized share-based compensation expense and the remaining months over which such expense is expected to be recognized, on a weighted-average basis by type of grant (in thousands, except number of months):
March 31, 2016 | ||||||
Unamortized Expense | Remaining Months | |||||
Stock options and ESPP | $ | 964 | 4 | |||
Time-based RSUs | 25,734 | 22 | ||||
Market-based and performance-based RSUs | 9,529 | 18 | ||||
$ | 36,227 | |||||
Under the 1996 ESPP and 2006 ESPP plans, eligible employees may purchase shares at the lower of 85% of the fair market value at the beginning or the end of each offering period, which is generally six months. Subject to continued participation in these plans, purchase agreements are automatically executed at the end of each offering period. An aggregate of 29 million shares was reserved for issuance under the 1996 and 2006 ESPP plans. As of March 31, 2016, a total of 7.2 million shares were available for issuance under these plans. The Company was not current with its periodic reports required to be filed with the SEC and was therefore unable to issue any shares under its Registration Statements on Form S-8 from July 31, 2014 to November 26, 2014. Given the proximity of the unavailability of those registration statements and the end of the then-current ESPP offering period, on July 31, 2014, the Compensation Committee authorized the termination of the then-current ESPP offering period and a one-time payment to each participant in an amount equal to the fifteen percent (15%) discount at which shares would otherwise have been repurchased pursuant to the then-current period of the ESPPs. This one-time payment aggregating to $1.1 million was accounted for as a repurchase of equity awards that reduced additional paid-in capital, resulting in no additional compensation cost. A new ESPP offering period of seven months was initiated on January 1, 2015, which ended on July 31, 2015. Subsequent to that, the offering periods have returned to standard six months.
The 2006 Plan provides for the grant to eligible employees and non-employee directors of stock options, stock appreciation rights, restricted stock and RSUs. Awards under the 2006 Plan may be conditioned on continued employment, the passage of time or the satisfaction of performance and market vesting criteria. The 2006 Plan had an expiration date of June 16, 2016 until September 5, 2012 when shareholder approved the amendment of the 2006 Plan to eliminate the expiration date. All stock options under this plan have terms not exceeding ten years and are issued at exercise prices not less than the fair market value on the date of grant.
Time-based RSUs granted to employees under the 2006 Plan generally vest in four equal annual installments on the grant date anniversary. Time-based RSUs granted to non-executive board members under the 2006 Plan vest in one annual installment on the grant date anniversary. Performance-based RSUs granted under the 2006
Logitech International S.A. | Fiscal 2016 Form 10-K | 92
plan vest contingent upon the achievement of pre-determined financial metrics. The performance period for performance-based RSUs granted in fiscal year 2015 is three years. Market-based options granted under the 2006 Plan vest upon meeting certain share price performance criteria. Market-based RSUs granted under the 2006 Plan vest at the end of the performance period upon meeting certain share price performance criteria measured against market conditions. The performance period is four years for market-based options granted in fiscal year 2013. The performance period is three years for market-based RSU granted in fiscal years 2016, 2015 and 2014. An aggregate of 24.8 million shares was reserved for issuance under the 2006 Plan. As of March 31, 2016, a total of 7.8 million shares were available for issuance under this plan.
Under the 2012 Plan, stock options and RSUs may be granted to eligible employees to serve as inducement material to enter into employment with the Company. Awards under the 2012 Plan may be conditioned on continued employment, the passage of time or the satisfaction of market stock performance criteria, based on individual written employment offer letter. The 2012 Plan has an expiration date of March 28, 2022. Premium-priced stock options granted under the 2012 Plan vest in full if and only when Logitech's average closing share price, over a consecutive ninety-day trading period, meets or exceeds the exercise price of each of the three tranches of the grant. An aggregate of 1.8 million shares was reserved for issuance under the 2012 Plan. As of March 31, 2016, no shares were available for issuance under this plan.
The estimates of share-based compensation expense require a number of complex and subjective assumptions including stock price volatility, employee exercise patterns, future forfeitures, probability of achievement of the set performance condition, dividend yield, related tax effects and the selection of an appropriate fair value model.
The grant date fair value of the awards using the Black-Scholes-Merton option-pricing valuation model and Monte-Carlo simulation method are determined applying the following assumptions and values:
Employee Stock Purchase Plans | Years Ended March 31, | |||||||||||
2016 | 2015 | 2014 | ||||||||||
Dividend yield | 3.47 | % | 1.97 | % | 0.43 | % | ||||||
Risk-free interest rate | 0.29 | % | 0.14 | % | 0.07 | % | ||||||
Expected volatility | 26 | % | 30 | % | 36 | % | ||||||
Expected life (years) | 0.5 | 0.6 | 0.5 | |||||||||
Weighted average fair value | $ | 3.29 | $ | 3.18 | $ | 2.46 | ||||||
Market-based RSUs | Years Ended March 31, | ||||||||
2016 | 2015 | 2014 | |||||||
Dividend yield | 3.78 | % | 1.86 | % | 0.75 | % | |||
Risk-free interest rate | 0.84 | % | 0.83 | % | 1.09 | % | |||
Expected volatility | 38 | % | 46 | % | 46 | % | |||
Expected life (years) | 3.0 | 3.0 | 2.9 | ||||||
The dividend yield assumption is based on the Company's future expectations of dividend payouts. The unvested RSUs or unexercised options are not eligible for these dividends. The expected life is based on historical settlement rates, which the Company believes are most representative of future exercise and post-vesting termination behaviors, or the purchase offerings periods expected to remain outstanding, or the derived period based on the expected stock performance for market-based awards. Expected volatility is based on historical volatility using the Company's daily closing prices, or including the volatility of components of the NASDAQ 100 index for market-based RSUs, over the expected life. The Company considers the historical price volatility of its shares as most representative of future volatility. The risk-free interest rate assumptions are based upon the implied yield of U.S. Treasury zero-coupon issues appropriate for the expected life of the Company's share-based awards.
The Company estimates awards forfeitures at the time of grant and revises those estimates in subsequent periods if actual forfeitures differ from those estimates. The Company uses historical data to estimate pre-vesting option and RSU forfeitures and records share-based compensation expense only for those awards that are expected to vest.
Logitech International S.A. | Fiscal 2016 Form 10-K | 93
The Company estimates the probability and timing of the achievement of the set performance condition at the time of the grant based on the historical financial performance and the financial forecast in the remaining performance contingency period and reassesses the probability in subsequent periods when actual results or new information become available.
A summary of the Company's stock option activities under all stock plans for fiscal years 2016, 2015 and 2014 is as follows (including discontinued operations for all the periods presented):
Number of Shares | Weighted-Average Exercise Price | Weighted-Average Remaining Contractual Term | Aggregate Intrinsic Value | ||||||||||
(In thousands) | (Years) | (In thousands) | |||||||||||
Outstanding, March 31, 2013 | 13,684 | ||||||||||||
Granted | — | ||||||||||||
Exercised | (551 | ) | $ | 2,045 | |||||||||
Cancelled or expired | (3,317 | ) | |||||||||||
Outstanding, March 31, 2014 | 9,816 | ||||||||||||
Granted | — | ||||||||||||
Exercised | (390 | ) | $ | 1,505 | |||||||||
Cancelled or expired | (1,550 | ) | |||||||||||
Outstanding, March 31, 2015 | 7,876 | $ | 18 | ||||||||||
Granted | — | $ | — | ||||||||||
Exercised | (746 | ) | $ | 10 | $ | 4,026 | |||||||
Cancelled or expired | (1,796 | ) | $ | 20 | |||||||||
Outstanding, March 31, 2016 | 5,334 | $ | 18 | 4.0 | $ | 12,436 | |||||||
Vested and expected to vest, March 31, 2016 | 4,004 | $ | 19 | 3.2 | $ | 8,119 | |||||||
Vested and exercisable, March 31, 2016 | 3,879 | $ | 20 | 3.1 | $ | 7,134 | |||||||
The options outstanding as of March 31, 2016 above includes 1.3 million shares of unvested market-based awards. The number of shares expected to vest for market-based awards is calculated assuming March 31, 2016 were the end of the performance contingency period.
As of March 31, 2016, the exercise price of outstanding options ranged from $1 to $40 per option.
The tax benefit realized for the tax deduction from options exercised during the fiscal years 2016, 2015 and 2014 was $1.2 million, $0.5 million and $0.5 million, respectively.
Logitech International S.A. | Fiscal 2016 Form 10-K | 94
A summary of the Company's time-based, market-based, and performance-based RSU activities for fiscal years 2016, 2015 and 2014 is as follows (including discontinued operations for all the periods presented):
Number of Shares | Weighted-Average Grant Date Fair Value | Weighted-Average Remaining Vesting Period | Aggregate Fair Value | ||||||||||
(In thousands) | (Years) | (In thousands) | |||||||||||
Outstanding, March 31, 2013 | 4,642 | $ | 10 | ||||||||||
Granted—time-based | 3,104 | $ | 11 | ||||||||||
Granted—market-based | 1,060 | $ | 8 | ||||||||||
Vested | (1,560 | ) | $ | 9 | $ | 17,810 | |||||||
Cancelled or expired | (1,158 | ) | $ | 15 | |||||||||
Outstanding, March 31, 2014 | 6,088 | $ | 10 | ||||||||||
Granted—time-based | 1,332 | $ | 13 | ||||||||||
Granted—market-based | 523 | $ | 13 | ||||||||||
Granted - performance-based | 55 | $ | 12 | ||||||||||
Vested | (1,949 | ) | $ | 10 | $ | 27,844 | |||||||
Cancelled or expired | (1,110 | ) | $ | 11 | |||||||||
Outstanding, March 31, 2015 | 4,939 | $ | 11 | ||||||||||
Granted—time-based | 2,247 | $ | 13 | ||||||||||
Granted—market-based | 356 | $ | 14 | ||||||||||
Granted - performance-based | 356 | $ | 13 | ||||||||||
Vested | (1,557 | ) | $ | 10 | $ | 22,823 | |||||||
Cancelled or expired | (820 | ) | $ | 12 | |||||||||
Outstanding, March 31, 2016 | 5,521 | $ | 12 | 1.5 | $ | 87,837 | |||||||
Expected to vest, March 31, 2016 | 4,687 | $ | 12 | 1.2 | $ | 74,352 | |||||||
The RSU outstanding as of March 31, 2016 above includes 1.7 million shares of market-based and performance-based shares. The number of shares expected to vest for these awards is calculated assuming March 31, 2016 were the end of the performance contingency period. The number of shares of common stock for market-based awards to be received at vesting will range from zero percent to 150 percent of the target number of stock units based on the Company's total stockholder return (“TSR”) relative to the performance of companies in the NASDAQ-100 Index for each measurement period, generally over a three year period. The Company presents shares granted at 100 percent of target of the number of stock units that may potentially vest.
The tax benefit realized for the tax deduction from RSUs that vested during the fiscal years 2016, 2015 and 2014 was $5.1 million, $6.9 million and $4.7 million, respectively.
Defined Contribution Plans
Certain of the Company's subsidiaries have defined contribution employee benefit plans covering all or a portion of their employees. Contributions to these plans are discretionary for certain plans and are based on specified or statutory requirements for others. The charges to expense for these plans for fiscal years 2016, 2015 and 2014, were $6.8 million, $5.5 million and $6.3 million, respectively.
Defined Benefit Plans
Certain of the Company's subsidiaries sponsor defined benefit pension plans or non-retirement post-employment benefits covering substantially all of their employees. Benefits are provided based on employees' years of service and earnings, or in accordance with applicable employee benefit regulations. The Company's practice is to fund amounts sufficient to meet the requirements set forth in the applicable employee benefit and tax regulations.
The Company recognizes the overfunded or underfunded status of defined benefit pension plans and non-retirement post-employment benefit obligations as an asset or liability in its consolidated balance sheets, and recognizes changes in the funded status of defined benefit pension plans in the year in which the changes occur
Logitech International S.A. | Fiscal 2016 Form 10-K | 95
through accumulated other comprehensive income (loss), which is a component of shareholders' equity. Each plan's assets and benefit obligations are remeasured as of March 31 each year.
Except for the balance as of March 31, 2016, all the amounts in this "Defined Benefit Plans" section include activities from both continuing and discontinued operations for all the periods presented, and the amounts from discontinued operations are not material for all the periods presented.
The net periodic benefit cost of the defined benefit pension plans and the non-retirement post-employment benefit obligations for fiscal years 2016, 2015 and 2014 was as follows (in thousands):
Years Ended March 31, | ||||||||||||
2016 | 2015 | 2014 | ||||||||||
Service costs | $ | 10,117 | $ | 7,646 | $ | 8,591 | ||||||
Interest costs | 1,147 | 1,970 | 1,794 | |||||||||
Expected return on plan assets | (1,657 | ) | (2,084 | ) | (1,727 | ) | ||||||
Amortization: | ||||||||||||
Net transition obligation | 4 | 4 | 4 | |||||||||
Net prior service costs (credit) recognized | (124 | ) | (45 | ) | 210 | |||||||
Net actuarial loss recognized | 1,854 | 301 | 592 | |||||||||
Settlement and curtailment | — | (13 | ) | 769 | ||||||||
$ | 11,341 | $ | 7,779 | $ | 10,233 | |||||||
The changes in projected benefit obligations for fiscal years 2016 and 2015 were as follows (in thousands):
Years Ended March 31, | ||||||||
2016 | 2015 | |||||||
Projected benefit obligations, beginning of the year | $ | 113,323 | $ | 102,383 | ||||
Service costs | 10,117 | 7,646 | ||||||
Interest costs | 1,147 | 1,970 | ||||||
Plan participant contributions | 2,990 | 2,914 | ||||||
Actuarial (gains) losses | (2,496 | ) | 16,768 | |||||
Benefits paid | (5,277 | ) | (5,307 | ) | ||||
Plan amendment related to statutory change | — | (3,936 | ) | |||||
Settlement and curtailment | — | (157 | ) | |||||
Administrative expense paid | — | (160 | ) | |||||
Currency exchange rate changes | 669 | (8,798 | ) | |||||
Projected benefit obligations, end of the year | $ | 120,473 | $ | 113,323 | ||||
The accumulated benefit obligation for all defined benefit pension plans as of March 31, 2016 and 2015 was $99.5 million and $92.0 million, respectively.
Logitech International S.A. | Fiscal 2016 Form 10-K | 96
The following table presents the changes in the fair value of defined benefit pension plan assets for fiscal years 2016 and 2015 (in thousands):
Years Ended March 31, | ||||||||
2016 | 2015 | |||||||
Fair value of plan assets, beginning of the year | $ | 60,910 | $ | 63,384 | ||||
Actual return on plan assets | (1,160 | ) | 136 | |||||
Employer contributions | 7,171 | 5,731 | ||||||
Plan participant contributions | 2,990 | 2,914 | ||||||
Benefits paid | (5,277 | ) | (5,307 | ) | ||||
Settlement and curtailment | — | (157 | ) | |||||
Administrative expenses paid | — | (160 | ) | |||||
Currency exchange rate changes | 645 | (5,631 | ) | |||||
Fair value of plan assets, end of the year | $ | 65,279 | $ | 60,910 | ||||
The Company's investment objectives are to ensure that the assets of its defined benefit plans are invested to provide an optimal rate of investment return on the total investment portfolio, consistent with the assumption of a reasonable risk level, and to ensure that pension funds are available to meet the plans' benefit obligations as they become due. The Company believes that a well-diversified investment portfolio will result in the highest attainable investment return with an acceptable level of overall risk. Investment strategies and allocation decisions are also governed by applicable governmental regulatory agencies. The Company's investment strategy with respect to its largest defined benefit plan, which is available only to Swiss employees, is to invest in the following allocation ranges starting from January 2015: 20-55% for equities, 25-65% for bonds, and 0-20% for cash and cash equivalents. The Company also can invest in real estate funds, commodity funds, and hedge funds depend upon economic conditions.
The following tables present the fair value of the defined benefit pension plan assets by major categories and by levels within the fair value hierarchy as of March 31, 2016 and 2015 (in thousands):
March 31, | ||||||||||||||||||||||||||||||||
2016 | 2015 | |||||||||||||||||||||||||||||||
Level 1 | Level 2 | Level 3 | Total | Level 1 | Level 2 | Level 3 | Total | |||||||||||||||||||||||||
Cash | $ | 9,268 | $ | 47 | $ | — | $ | 9,315 | $ | 7,958 | $ | 46 | $ | — | $ | 8,004 | ||||||||||||||||
Equity securities | 18,640 | — | — | 18,640 | 20,476 | — | — | 20,476 | ||||||||||||||||||||||||
Debt securities | 21,781 | — | — | 21,781 | 20,357 | — | — | 20,357 | ||||||||||||||||||||||||
Swiss real estate funds | 9,622 | — | — | 9,622 | 8,586 | — | — | 8,586 | ||||||||||||||||||||||||
Hedge funds | — | 3,492 | — | 3,492 | — | 3,251 | — | 3,251 | ||||||||||||||||||||||||
Insurance contracts | — | 94 | — | 94 | — | 114 | — | 114 | ||||||||||||||||||||||||
Other | 2,195 | 140 | — | 2,335 | 28 | 94 | — | 122 | ||||||||||||||||||||||||
$ | 61,506 | $ | 3,773 | $ | — | $ | 65,279 | $ | 57,405 | $ | 3,505 | $ | — | $ | 60,910 | |||||||||||||||||
The funded status of the plans was as follows (in thousands):
Years Ended March 31, | ||||||||
2016 | 2015 | |||||||
Fair value of plan assets | $ | 65,279 | $ | 60,910 | ||||
Less: Projected benefit obligations | 120,473 | 113,323 | ||||||
Under funded status | $ | (55,194 | ) | $ | (52,413 | ) | ||
Logitech International S.A. | Fiscal 2016 Form 10-K | 97
Amounts recognized on the balance sheet for the plans were as follows (in thousands):
March 31, | ||||||||
2016 | 2015 | |||||||
Current liabilities | $ | (1,285 | ) | $ | (1,232 | ) | ||
Non-current liabilities | (53,909 | ) | (51,181 | ) | ||||
Net liabilities | $ | (55,194 | ) | $ | (52,413 | ) | ||
Amounts recognized in accumulated other comprehensive loss related to defined benefit pension plans were as follows (in thousands):
March 31, | ||||||||||||
2016 | 2015 | 2014 | ||||||||||
Net prior service costs (credits) | $ | 1,613 | $ | 1,672 | $ | (2,149 | ) | |||||
Net actuarial loss | (27,612 | ) | (28,751 | ) | (12,319 | ) | ||||||
Net transition obligation | (4 | ) | (8 | ) | (12 | ) | ||||||
Accumulated other comprehensive loss | (26,003 | ) | (27,087 | ) | (14,480 | ) | ||||||
Deferred tax benefit | (168 | ) | 123 | 192 | ||||||||
Accumulated other comprehensive loss, net of tax | $ | (26,171 | ) | $ | (26,964 | ) | $ | (14,288 | ) | |||
The following table presents the amounts included in accumulated other comprehensive loss as of March 31, 2016, which are expected to be recognized as a component of net periodic benefit cost in fiscal year 2017 (in thousands):
Year Ending March 31, 2017 | ||||
Amortization of net transition obligation | $ | 4 | ||
Amortization of net prior service credits | (128 | ) | ||
Amortization of net actuarial loss | 1,650 | |||
$ | 1,526 | |||
The Company reassesses its benefit plan assumptions on a regular basis. The actuarial assumptions for the defined benefit plans for fiscal years 2016 and 2015 were as follows:
Years Ended March 31, | ||||
2016 | 2015 | |||
Benefit Obligations: | ||||
Discount rate | 0.5%-8.00% | 0.75%-7.75% | ||
Estimated rate of compensation increase | 2.50%-10.00% | 2.50%-8.00% | ||
Periodic Costs: | ||||
Discount rate | 0.75%-7.75% | 1.50%-9.25% | ||
Estimated rate of compensation increase | 0.0%-8.00% | 2.50%-8.00% | ||
Expected average rate of return on plan assets | 1.00%-2.75% | 0.75%-3.50% | ||
The discount rate is estimated based on corporate bond yields or securities of similar quality in the respective country, with a duration approximating the period over which the benefit obligations are expected to be paid. The Company bases the compensation increase assumptions on historical experience and future expectations. The expected average rate of return for the Company's defined benefit pension plans represents the average rate of return expected to be earned on plan assets over the period that the benefit obligations are expected to be paid, based on government bond notes in the respective country, adjusted for corporate risk premiums as appropriate.
Logitech International S.A. | Fiscal 2016 Form 10-K | 98
The following table reflects the benefit payments that the Company expects the plans to pay in the periods noted (in thousands):
Years Ending March 31, | ||||
2017 | $ | 4,751 | ||
2018 | 4,954 | |||
2019 | 5,307 | |||
2020 | 6,026 | |||
2021 | 5,241 | |||
2022-2026 | 29,520 | |||
$ | 55,799 | |||
The Company expects to contribute $4.9 million to its defined benefit pension plans during fiscal year 2017.
Deferred Compensation Plan
One of the Company's subsidiaries offers a deferred compensation plan that permits eligible employees to make 100% vested salary and incentive compensation deferrals within established limits. The Company does not make contributions to the plan.
The deferred compensation plan's assets consist of marketable securities and are included in other assets on the consolidated balance sheets. The marketable securities are classified as trading investments and were recorded at a fair value of $14.8 million and $17.2 million as of March 31, 2016 and 2015, respectively, based on quoted market prices. The Company also had $14.8 million and $17.2 million deferred compensation liability as of March 31, 2016 and 2015, respectively. Earnings, gains and losses on trading investments are included in other income (expense), net and corresponding changes in deferred compensation liability are included in operating expenses and cost of goods sold.
Note 6—Interest and Other Income (Expense), net
Interest income (expense), net comprises of the following (in thousands):
Years Ended March 31, | ||||||||||||
2016 | 2015 | 2014 | ||||||||||
Interest income | $ | 790 | $ | 1,197 | $ | 1,797 | ||||||
Interest expense | — | — | (2,228 | ) | ||||||||
Interest income (expense), net | $ | 790 | $ | 1,197 | $ | (431 | ) | |||||
Other income (expense), net comprises of the following (in thousands):
Years Ended March 31, | ||||||||||||
2016 | 2015 | 2014 | ||||||||||
Investment income (loss) related to deferred compensation plan | $ | (364 | ) | $ | 1,055 | $ | 1,487 | |||||
Impairment of investments | — | (2,298 | ) | (624 | ) | |||||||
Currency exchange gain (loss), net | 2,110 | (1,175 | ) | (62 | ) | |||||||
Other | (122 | ) | 120 | 1,238 | ||||||||
Other income (expense), net | $ | 1,624 | $ | (2,298 | ) | $ | 2,039 | |||||
Logitech International S.A. | Fiscal 2016 Form 10-K | 99
Note 7—Income Taxes
The Company is incorporated in Switzerland but operates in various countries with differing tax laws and rates. Further, a portion of the Company's income (loss) before taxes and the provision for (benefit from) income taxes is generated outside of Switzerland.
Income from continuing operations before income taxes for the fiscal years 2016, 2015 and 2014 is summarized as follows (in thousands):
Years Ended March 31, | ||||||||||||
2016 | 2015 | 2014 | ||||||||||
Swiss | $ | 80,572 | $ | 119,460 | $ | 62,544 | ||||||
Non-Swiss | 50,900 | 33,623 | 44,760 | |||||||||
Income before taxes | $ | 131,472 | $ | 153,083 | $ | 107,304 | ||||||
The provision for (benefit from) income taxes is summarized as follows (in thousands):
Years Ended March 31, | ||||||||||||
2016 | 2015 | 2014 | ||||||||||
Current: | ||||||||||||
Swiss | $ | 1,668 | $ | 1,152 | $ | 814 | ||||||
Non-Swiss | (2,582 | ) | 579 | 6,219 | ||||||||
Deferred: | ||||||||||||
Non-Swiss | 4,024 | 2,923 | (5,720 | ) | ||||||||
Provision for income taxes | $ | 3,110 | $ | 4,654 | $ | 1,313 | ||||||
The difference between the provision for income taxes and the expected tax provision at the statutory income tax rate of 8.5% is reconciled below (in thousands):
Years Ended March 31, | ||||||||||||
2016 | 2015 | 2014 | ||||||||||
Expected tax provision at statutory income tax rates | $ | 11,175 | $ | 13,012 | $ | 9,121 | ||||||
Income taxes at different rates | (2,713 | ) | (4,299 | ) | (2,523 | ) | ||||||
Research and development tax credits | (1,619 | ) | (1,120 | ) | (1,229 | ) | ||||||
Executive compensation | 864 | 1,557 | — | |||||||||
Stock-based compensation | 1,446 | 2,261 | 1,608 | |||||||||
Valuation allowance | 947 | 764 | 182 | |||||||||
Restructuring charges / (credits) | 1,514 | (415 | ) | 1,174 | ||||||||
Tax reserves (releases), net | (8,761 | ) | (6,912 | ) | (6,209 | ) | ||||||
Audit settlement | — | (837 | ) | (400 | ) | |||||||
Other, net | 257 | 643 | (411 | ) | ||||||||
Provision for income taxes | $ | 3,110 | $ | 4,654 | $ | 1,313 | ||||||
On December 18, 2015, the enactment of the Protecting Americans from Tax Hikes Act of 2015 in the United States extended the federal research and development tax credit permanently which had previously expired on December 31, 2014. The provision for income taxes for fiscal year ended March 31, 2016 reflected a $1.5 million tax benefit as a result of the extension of the tax credit.
Logitech International S.A. | Fiscal 2016 Form 10-K | 100
Deferred income tax assets and liabilities consist of the following (in thousands):
March 31, | ||||||||
2016 | 2015 | |||||||
Deferred tax assets: | ||||||||
Net operating loss carryforwards | $ | 7,136 | $ | 8,372 | ||||
Tax credit carryforwards | 2,981 | 2,739 | ||||||
Accruals | 36,365 | 44,363 | ||||||
Depreciation and amortization | 4,059 | 4,396 | ||||||
Share-based compensation | 12,890 | 14,183 | ||||||
Gross deferred tax assets | 63,431 | 74,053 | ||||||
Valuation allowance | (5,338 | ) | (5,590 | ) | ||||
Gross deferred tax assets after valuation allowance | 58,093 | 68,463 | ||||||
Deferred tax liabilities: | ||||||||
Acquired intangible assets and other | (3,550 | ) | (3,299 | ) | ||||
Gross deferred tax liabilities | (3,550 | ) | (3,299 | ) | ||||
Deferred tax assets, net | $ | 54,543 | $ | 65,164 | ||||
Management regularly assesses the ability to realize deferred tax assets recorded in the Company's entities based upon the weight of available evidence, including such factors as recent earnings history and expected future taxable income. In the event that the Company changes its determination as to the amount of deferred tax assets that can be realized, the Company will adjust its valuation allowance with a corresponding impact to the provision for income taxes in the period in which such determination is made.
The Company had a valuation allowance of $5.3 million at March 31, 2016, decreased from $5.6 million at March 31, 2015 primarily due to $1.3 million increase in valuation allowance for deferred tax assets in the state of California of the United States which was offset by $1.5 million decrease in valuation allowance due to the expiration of capital loss carryforwards in the United States. The Company had a valuation allowance of $4.9 million as of March 31, 2016 against deferred tax assets in the state of California of the United States. The remaining valuation allowance primarily represents $0.4 million for various tax credit carryforwards. The Company determined that it is more likely than not that the Company would not generate sufficient taxable income in the future to utilize such deferred tax assets.
Deferred tax assets relating to tax benefits of employee stock grants have been reduced to reflect settlement activity in fiscal years 2016 and 2015. Settlement activity of grants in fiscal years 2016 and 2015 resulted in a "shortfall" in which tax deductions were less than previously recorded share-based compensation expense. The Company recorded a shortfall to equity of $2.3 million and $1.8 million, respectively, in fiscal years 2016 and 2015.
As of March 31, 2016, the Company had foreign net operating loss and tax credit carryforwards for income tax purposes of $203.5 million and $43.8 million, respectively, of which $146.0 million of the net operating loss carryforwards and $26.6 million of the tax credit carryforwards, if realized, will be credited to equity since they have not met the applicable realization criteria. Unused net operating loss carryforwards will expire at various dates in fiscal years 2017 to 2036. Certain net operating loss carryforwards in the United States relate to acquisitions and, as a result, are limited in the amount that can be utilized in any one year. The tax credit carryforwards will begin to expire in fiscal year 2019.
Swiss income taxes and non-Swiss withholding taxes associated with the repatriation of earnings or for other temporary differences related to investments in non-Swiss subsidiaries have not been provided for, as the Company intends to reinvest the earnings of such subsidiaries indefinitely or the Company has concluded that no additional tax liability would arise on the distribution of such earnings. If these earnings were distributed to Switzerland in the form of dividends or otherwise, or if the shares of the relevant non-Swiss subsidiaries were sold or otherwise transferred, the Company may be subject to additional Swiss income taxes and non-Swiss withholding taxes. As of March 31, 2016, the cumulative amount of unremitted earnings of non-Swiss subsidiaries for which no income taxes have been provided is approximately $157.5 million. The amount of unrecognized deferred income tax liability related to these earnings is estimated to be approximately $5.2 million.
Logitech International S.A. | Fiscal 2016 Form 10-K | 101
The Company follows a two-step approach in recognizing and measuring uncertain tax positions. The first step is to evaluate the tax position for recognition by determining if the weight of available evidence indicates that it is more likely than not that the position will be sustained on audit, including resolution of related appeals or litigation processes, if any. The second step is to measure the tax benefit as the largest amount that is more than 50% likely of being realized upon ultimate settlement.
As of March 31, 2016 and March 31, 2015, the total amount of unrecognized tax benefits due to uncertain tax positions was $69.9 million and $79.0 million, respectively, all of which would affect the effective income tax rate if recognized.
As of March 31, 2016, the Company had $59.7 million in non-current income taxes payable and $0.1 million in current income taxes payable, including interest and penalties, related to the Company's income tax liability for uncertain tax positions. As of March 31, 2015, the Company had $72.1 million in non-current income taxes payable and $0.1 million in current income taxes payable.
The aggregate changes in gross unrecognized tax benefits in fiscal years 2016, 2015 and 2014 were as follows (in thousands):
March 31, 2013 | $ | 95,698 | ||
Lapse of statute of limitations | (12,514 | ) | ||
Settlements with tax authorities | (100 | ) | ||
Decreases in balances related to tax positions taken during prior years | (778 | ) | ||
Increases in balances related to tax positions taken during the year | 8,740 | |||
March 31, 2014 | $ | 91,046 | ||
Lapse of statute of limitations | (14,071 | ) | ||
Settlements with tax authorities | (2,160 | ) | ||
Decreases in balances related to tax positions taken during prior years | (3,544 | ) | ||
Increases in balances related to tax positions taken during the year | 7,752 | |||
March 31, 2015 | $ | 79,023 | ||
Lapse of statute of limitations | (15,518 | ) | ||
Settlements with tax authorities | — | |||
Decreases in balances related to tax positions taken during prior years | (1,502 | ) | ||
Increases in balances related to tax positions taken during the year | 7,876 | |||
March 31, 2016 | $ | 69,879 | ||
The Company recognizes interest and penalties related to unrecognized tax positions in income tax expense. The Company recognized $0.3 million, $0.8 million and $1.1 million in interest and penalties in income tax expense during fiscal years 2016, 2015 and 2014, respectively. As of March 31, 2016, 2015 and 2014, the Company had $3.6 million, $4.9 million and $5.6 million of accrued interest and penalties related to uncertain tax positions, respectively.
The Company files Swiss and foreign tax returns. The Company received final tax assessments in Switzerland through fiscal year 2013. For other foreign jurisdictions such as the United States, the Company is generally not subject to tax examinations for years prior to fiscal year 2012. The Company is under examination and has received assessment notices in foreign tax jurisdictions. If the examinations are resolved unfavorably, there is a possibility they may have a material negative impact on its results of operations.
Although the Company has adequately provided for uncertain tax positions, the provisions on these positions may change as revised estimates are made or the underlying matters are settled or otherwise resolved. During the next 12 months, it is reasonably possible that the amount of unrecognized tax benefits could increase or decrease significantly due to changes in tax law in various jurisdictions, new tax audits and changes in the U.S. Dollar as compared to other currencies. Excluding these factors, uncertain tax positions may decrease by as much as $15.0 million primarily from the lapse of the statutes of limitations in various jurisdictions during the next 12 months.
Logitech International S.A. | Fiscal 2016 Form 10-K | 102
Note 8—Balance Sheet Components
The following table presents the components of certain balance sheet asset amounts as of March 31, 2016 and 2015 (in thousands):
March 31, | ||||||||
2016 | 2015 | |||||||
Accounts receivable: | ||||||||
Accounts receivable | $ | 332,553 | $ | 328,373 | ||||
Allowance for doubtful accounts | (667 | ) | (707 | ) | ||||
Allowance for sales returns | (18,526 | ) | (17,236 | ) | ||||
Allowance for cooperative marketing arrangements (*) | (28,157 | ) | (24,919 | ) | ||||
Allowance for customer incentive programs (*) | (60,872 | ) | (47,364 | ) | ||||
Allowance for pricing programs (*) | (81,553 | ) | (70,951 | ) | ||||
$ | 142,778 | $ | 167,196 | |||||
Inventories: | ||||||||
Raw materials | $ | 48,489 | $ | 36,044 | ||||
Finished goods | 180,297 | 219,936 | ||||||
$ | 228,786 | $ | 255,980 | |||||
Other current assets: | ||||||||
Income tax and value-added tax receivables | $ | 22,572 | $ | 19,318 | ||||
Deferred tax assets (**) | — | 27,790 | ||||||
Prepaid expenses and other assets | 12,916 | 16,254 | ||||||
$ | 35,488 | $ | 63,362 | |||||
Property, plant and equipment, net: | ||||||||
Plant, buildings and improvements | $ | 62,150 | $ | 60,205 | ||||
Equipment | 166,371 | 132,907 | ||||||
Computer equipment | 36,018 | 32,178 | ||||||
Software | 97,201 | 76,184 | ||||||
361,740 | 301,474 | |||||||
Less accumulated depreciation and amortization | (278,352 | ) | (246,084 | ) | ||||
83,388 | 55,390 | |||||||
Construction-in-process | 6,771 | 28,341 | ||||||
Land | 2,701 | 2,747 | ||||||
$ | 92,860 | $ | 86,478 | |||||
Other assets: | ||||||||
Deferred tax assets (**) | $ | 56,208 | $ | 39,310 | ||||
Trading investments for deferred compensation plan | 14,836 | 17,237 | ||||||
Investment in privately held companies | 9,247 | 768 | ||||||
Other assets | 6,525 | 5,018 | ||||||
$ | 86,816 | $ | 62,333 | |||||
Logitech International S.A. | Fiscal 2016 Form 10-K | 103
The following table presents the components of certain balance sheet liability amounts as of March 31, 2016 and 2015 (in thousands):
March 31, | ||||||||
2016 | 2015 | |||||||
Accrued and other current liabilities: | ||||||||
Accrued personnel expenses | $ | 46,025 | $ | 46,022 | ||||
Indirect customer incentive programs (*) | 28,721 | 19,730 | ||||||
Warranty accrual | 11,880 | 12,630 | ||||||
Employee benefit plan obligation | 1,285 | 1,219 | ||||||
Income taxes payable | 1,553 | 5,759 | ||||||
Other liabilities | 84,300 | 77,984 | ||||||
$ | 173,764 | $ | 163,344 | |||||
Non-current liabilities: | ||||||||
Warranty accrual | $ | 8,500 | $ | 9,080 | ||||
Obligation for deferred compensation plan | 14,836 | 17,237 | ||||||
Employee benefit plan obligation | 53,909 | 51,081 | ||||||
Deferred tax liability (**) | 1,665 | 1,936 | ||||||
Other liabilities | 10,625 | 11,861 | ||||||
$ | 89,535 | $ | 91,195 | |||||
(*) | The increase in the allowances for cooperative marketing arrangements, customer incentive programs, pricing programs, and accrued liabilities for indirect customer incentive programs is primarily due to increases in retail sales, timing of claims processed, and increases in the marketing activities, partially offset by price increases. |
(**) Includes reclassifications of deferred tax assets and liabilities related to ASU 2015-17 “Income Taxes (Topic 740): Balance Sheet Classification of Deferred Taxes".
Logitech International S.A. | Fiscal 2016 Form 10-K | 104
Note 9—Fair Value Measurements
The Company considers fair value as the exchange price that would be received for an asset or paid to transfer a liability (an exit price) in the principal or most advantageous market for the asset or liability in an orderly transaction between market participants at the measurement date. The Company utilizes the following three-level fair value hierarchy to establish the priorities of the inputs used to measure fair value:
• | Level 1—Quoted prices in active markets for identical assets or liabilities. |
• | Level 2—Observable inputs other than quoted market prices included in Level 1, such as quoted prices for similar assets and liabilities in active markets; quoted prices for identical or similar assets and liabilities in markets that are not active; or other inputs that are observable or can be corroborated by observable market data. |
• | Level 3—Unobservable inputs that are supported by little or no market activity and that are significant to the fair value of the assets or liabilities. This includes certain pricing models, discounted cash flow methodologies and similar techniques that use significant unobservable inputs. |
The following table presents the Company's financial assets and liabilities, that were accounted for at fair value on a recurring basis, excluding assets related to the Company's defined benefit pension plans, classified by the level within the fair value hierarchy (in thousands):
March 31, 2016 | March 31, 2015 | |||||||||||||||
Level 1 | Level 2 | Level 1 | Level 2 | |||||||||||||
Cash equivalents: | ||||||||||||||||
Cash equivalents | $ | 10,000 | $ | — | $ | 264,647 | $ | — | ||||||||
$ | 10,000 | $ | — | $ | 264,647 | $ | — | |||||||||
Trading investments for deferred compensation plan: | ||||||||||||||||
Money market funds | $ | 3,467 | $ | — | $ | 2,936 | $ | — | ||||||||
Mutual funds | 11,369 | — | 14,301 | — | ||||||||||||
$ | 14,836 | $ | — | $ | 17,237 | $ | — | |||||||||
Foreign exchange derivative assets | $ | — | $ | 10 | $ | — | $ | 2,080 | ||||||||
Foreign exchange derivative liabilities | $ | — | $ | 1,132 | $ | — | $ | 75 | ||||||||
Investment Securities
The marketable securities for the Company's deferred compensation plan are recorded at a fair value of $14.8 million and $17.2 million as of March 31, 2016 and 2015, respectively, based on quoted market prices. Quoted market prices are observable inputs that are classified as Level 1 within the fair value hierarchy. Unrealized trading gains related to trading securities for the fiscal years 2016, 2015 and 2014 were not significant and are included in other income (expense), net.
Assets Measured at Fair Value on a Nonrecurring Basis
The Company’s non-marketable cost method investments, and non-financial assets, such as intangible assets and property, plant and equipment, are recorded at fair value only upon initial recognition or if an impairment is recognized. A summary of the valuation methodologies for assets and liabilities measured on a nonrecurring basis is as follows:
Non-marketable cost method investments. These investments are classified as Level 3 due to the absence of quoted market prices, the inherent lack of liquidity, and the fact that inputs used to measure fair value are unobservable and require management's judgment. When certain events or circumstances indicate that impairment may exist, the Company revalues the investments using various assumptions, including the financial metrics and ratios of comparable public companies. There were no significant impairments during the years ended March 31, 2016 or 2015.
Included in non-marketable investments primarily is the Company’s investment in Series A Preferred Stock of Lifesize recorded at the estimated fair value of $5.6 million on the date of Lifesize divestiture. Refer to Note 3
Logitech International S.A. | Fiscal 2016 Form 10-K | 105
"Discontinued Operations" to Consolidated Financial Statements for the valuation approach and significant inputs and assumptions.
The aggregate recorded amount of cost method investments included in other assets at March 31, 2016 and March 31, 2015 was $7.4 million and $0.3 million, respectively.
Non-Financial Assets. Goodwill, intangible assets, and property, plant and equipment, are not required to be measured at fair value on a recurring basis. However, if certain triggering events occur (or tested at least annually for goodwill) such that a non-financial instrument is required to be evaluated for impairment and an impairment is recorded to reduce the non-financial instrument's carrying value to the fair value as a result of such triggering events, the non-financial assets and liabilities are measured at fair value for the period such triggering events occur. See Note 2 herein, for additional information about how the Company tests various asset classes for impairment.
Note 10—Derivative Financial Instruments
The following table presents the fair values of the Company's derivative instruments as of March 31, 2016 and 2015 (in thousands):
Derivatives | ||||||||||||||||
Asset | Liability | |||||||||||||||
March 31, | March 31, | |||||||||||||||
2016 | 2015 | 2016 | 2015 | |||||||||||||
Designated as hedging instruments: | ||||||||||||||||
Cash flow hedges | $ | 10 | $ | 2,080 | $ | 1,038 | $ | — | ||||||||
Not designated as hedging instruments: | ||||||||||||||||
Foreign exchange contracts | — | — | 94 | 75 | ||||||||||||
$ | 10 | $ | 2,080 | $ | 1,132 | $ | 75 | |||||||||
Under certain agreements with the respective counterparties to the Company's derivative contracts, subject to applicable requirements, the Company is allowed to net settle transactions of the same type with a single net amount payable by one party to the other. However, the Company presents its derivative assets and derivative liabilities on a gross basis in other current assets or accrued and other current liabilities on the Consolidated Balance Sheets as of March 31, 2016 and 2015.
The following table presents the amounts of gains and losses on the Company's derivative instruments for fiscal years 2016, 2015 and 2014 and their locations on its consolidated statements of operations and consolidated statements of comprehensive income (loss) (in thousands):
Amount of Gain (Loss) Deferred as a Component of Accumulated Other Comprehensive Loss After Reclassification to Costs of Goods Sold | Amount of Loss (Gain) Reclassified from Accumulated Other Comprehensive Loss to Costs of Goods Sold | Amount of Gain (Loss) Immediately Recognized in Other Income (Expense), Net | |||||||||||||||||||||||||||||||||
2016 | 2015 | 2014 | 2016 | 2015 | 2014 | 2016 | 2015 | 2014 | |||||||||||||||||||||||||||
Designated as hedging instruments: | |||||||||||||||||||||||||||||||||||
Cash flow hedges | $ | (5,727 | ) | $ | 4,466 | $ | (1,025 | ) | $ | (3,296 | ) | $ | (4,505 | ) | $ | 2,472 | $ | 292 | $ | 20 | $ | (126 | ) | ||||||||||||
Not designated as hedging instruments: | |||||||||||||||||||||||||||||||||||
Foreign exchange contracts | — | — | — | — | — | — | (781 | ) | 2,479 | 824 | |||||||||||||||||||||||||
$ | (5,727 | ) | $ | 4,466 | $ | (1,025 | ) | $ | (3,296 | ) | $ | (4,505 | ) | $ | 2,472 | $ | (489 | ) | $ | 2,499 | $ | 698 | |||||||||||||
Cash Flow Hedges: The Company enters into foreign exchange forward contracts to hedge against exposure to changes in currency exchange rates related to its subsidiaries' forecasted inventory purchases. The Company has one entity with a Euro functional currency that purchases inventory in U.S. Dollars. The primary risk managed by using
Logitech International S.A. | Fiscal 2016 Form 10-K | 106
derivative instruments is the currency exchange rate risk. The Company has designated these derivatives as cash flow hedges. These hedging contracts mature within four months, and are denominated in the same currency as the underlying transactions. Gains and losses in the fair value of the effective portion of the hedges are deferred as a component of accumulated other comprehensive loss until the hedged inventory purchases are sold, at which time the gains or losses are reclassified to cost of goods sold. The Company assesses the effectiveness of the hedges by comparing changes in the spot rate of the currency underlying the forward contract with changes in the spot rate of the currency in which the forecasted transaction will be consummated. If the underlying transaction being hedged fails to occur or if a portion of the hedge does not generate offsetting changes in the currency exposure of forecasted inventory purchases, the Company immediately recognizes the gain or loss on the associated financial instrument in other income (expense), net. Such gains and losses were not material during fiscal years 2016, 2015 and 2014. Cash flows from such hedges are classified as operating activities in the Consolidated Statements of Cash Flows. As of March 31, 2016, and 2015, the notional amounts of foreign exchange forward contracts outstanding related to forecasted inventory purchases were $39.8 million and $43.5 million, respectively. The Company estimates that $1.8 million of net losses related to its cash flow hedges included in accumulated other comprehensive loss as of March 31, 2016 will be reclassified into earnings within the next 12 months.
Other Derivatives: The Company also enters into foreign exchange forward and swap contracts to reduce the short-term effects of currency fluctuations on certain foreign currency receivables or payables. These forward and swap contracts generally mature within one month. The primary risk managed by using forward and swap contracts is the currency exchange rate risk. The gains or losses on foreign exchange forward contracts are recognized in other income (expense), net based on the changes in fair value.
The notional amounts of foreign exchange forward and swap contracts outstanding as of March 31, 2016 and 2015 relating to foreign currency receivables or payables were $63.7 million and $61.7 million, respectively. Open forward and swap contracts as of March 31, 2016 and 2015 consisted of contracts in Taiwanese Dollars, Australian Dollars, Mexican Pesos, Japanese Yen and British Pounds to be settled at future dates at pre-determined exchange rates.
The fair value of all foreign exchange forward and swap contracts is determined based on observable market transactions of spot currency rates and forward rates. Cash flows from these contracts are classified as operating activities in the Consolidated Statements of Cash Flows.
Note 11—Goodwill and Other Intangible Assets
As of December 31, 2015 and March 31, 2015, all of the Company's goodwill is related to the peripherals reporting unit. The Company performed its annual impairment analysis of the goodwill at December 31, 2015 by performing a qualitative assessment and concluded that it was more likely than not that the fair value of its peripherals reporting unit exceeded its carrying amount. In assessing the qualitative factors, the Company considered the impact of these key factors: change in industry and competitive environment, growth in market capitalization to $2.5 billion as of December 31, 2015 from $2.3 billion as of December 31, 2014, and budgeted-to-actual revenue performance for the twelve months ended December 31, 2015. There have been no significant events or circumstances affecting the valuation of goodwill subsequent to the annual impairment test.
The following table summarizes the activity in the Company's goodwill balance during fiscal years 2016 and 2015 (in thousands):
Years Ended March 31, | ||||||||
2016 | 2015 | |||||||
Beginning of the period | $ | 218,213 | $ | 219,415 | ||||
Acquisitions | — | 988 | ||||||
Currency exchange rate impact and other | 11 | (2,190 | ) | |||||
End of the period | $ | 218,224 | $ | 218,213 | ||||
The Company's acquired other intangible assets are not material as of March 31, 2016 and 2015. There is no addition or disposition of acquired other intangible assets during the years ended March 31, 2016 and 2015.
For fiscal years 2016, 2015 and 2014, amortization expense for other intangible assets was $0.4 million, $0.8 million and $2.4 million, respectively. There was no future amortization expense related to the intangible asset as of March 31, 2016.
Logitech International S.A. | Fiscal 2016 Form 10-K | 107
Note 12—Financing Arrangements
The Company had several uncommitted, unsecured bank lines of credit aggregating $45.7 million as of March 31, 2016. There are no financial covenants under these lines of credit with which the Company must comply. As of March 31, 2016, the Company had outstanding bank guarantees of $19.7 million under these lines of credit. There was no borrowing outstanding under the line of credit as of March 31, 2016 or March 31, 2015.
Note 13—Commitments and Contingencies
Operating Leases
The Company leases facilities under operating leases, certain of which require it to pay property taxes, insurance and maintenance costs. Operating leases for facilities are generally renewable at the Company's option and usually include escalation clauses linked to inflation. Future minimum annual rentals under non-cancelable operating leases at March 31, 2016 are as follows (in thousands):
Years Ending March 31, | ||||
2017 | $ | 7,558 | ||
2018 | 5,411 | |||
2019 | 4,843 | |||
2020 | 4,433 | |||
2021 | 3,190 | |||
Thereafter | 6,539 | |||
$ | 31,974 | |||
Rent expense for fiscal years 2016, 2015 and 2014 was $10.0 million, $9.6 million and $12.7 million, respectively.
In connection with its leased facilities, the Company recognized a liability for asset retirement obligations for 2016 and 2015 representing the present value of estimated remediation costs to be incurred at lease expiration. The liabilities for asset retirement obligations were not material as of March 31, 2016 and 2015.
Product Warranties
All of the Company's Peripherals products are covered by warranty to be free from defects in material and workmanship for periods ranging from one year to five years. For products launched prior to April 1, 2014, the standard warranty period was up to five years. Starting from April 1, 2014, the standard warranty for all new products launched was changed to two years from date of purchase for European Countries and generally one year from date of purchase for all other countries. At the time of sale, the Company accrues a warranty liability for estimated costs to provide products, parts or services to repair or replace products in satisfaction of the warranty obligation. The Company's estimate of costs to fulfill its warranty obligations is based on historical experience and expectations of future conditions. When the Company experiences changes in warranty claim activity or costs associated with fulfilling those claims, the warranty liability is adjusted accordingly.
Changes in the Company's warranty liability for fiscal years 2016 and 2015 were as follows (in thousands):
Years Ended March 31, | ||||||||
2016 | 2015 | |||||||
Beginning of the period | $ | 21,710 | $ | 24,380 | ||||
Provision | 9,772 | 10,958 | ||||||
Settlements | (11,339 | ) | (12,027 | ) | ||||
Currency translation | 237 | (1,601 | ) | |||||
End of the period | $ | 20,380 | $ | 21,710 | ||||
Investment Commitments
During 2015, the Company entered into a limited partnership agreement for a private investment fund specialized in early-stage start-up consumer hardware electronics companies and committed to a capital contribution of $4.0 million over the life of the fund. The Company has invested $0.9 million as of March 31, 2016, which is classified as other
Logitech International S.A. | Fiscal 2016 Form 10-K | 108
assets on the consolidated balance sheet. As of March 31, 2016, $3.1 million capital contribution has not yet been called upon by the fund.
Other Contingencies
In April 2016, the Company entered into a settlement with the Securities and Exchange Commission (“SEC”) related to the accounting for Revue inventory valuation reserves that resulted in the restatement described in the Fiscal Year 2014 Annual Report on Form 10-K, revision to its consolidated financial statements concerning warranty accruals and amortization of intangible assets presented in its Amended Annual Report on Form 10-K/A, filed on August 7, 2013, and its transactions with a distributor for Fiscal Year 2007 through Fiscal Year 2009. The Company entered into the settlement without admitting or denying the findings of the SEC’s investigation and paid a civil penalty of $7.5 million. This amount was paid in April 2016. The Company made an accrual of the same amount in its consolidated financial statements as of March 31, 2016.
Guarantees
Logitech Europe S.A. guaranteed payments of two third-party contract manufacturers' purchase obligations. As of March 31, 2016, the maximum amount of this guarantee was $3.8 million, of which $1.0 million of guaranteed purchase obligations was outstanding.
Indemnifications
The Company indemnifies certain of its suppliers and customers for losses arising from matters such as intellectual property disputes and product safety defects, subject to certain restrictions. The scope of these indemnities varies, but in some instances, includes indemnification for damages and expenses, including reasonable attorneys' fees. As of March 31, 2016, no amounts have been accrued for these indemnification provisions. The Company does not believe, based on historical experience and information currently available, that it is probable that any material amounts will be required to be paid under its indemnification arrangements.
The Company also indemnifies its current and former directors and certain of its current and former officers. Certain costs incurred for providing such indemnification may be recoverable under various insurance policies. The Company is unable to reasonably estimate the maximum amount that could be payable under these arrangements because these exposures are not limited, the obligations are conditional in nature and the facts and circumstances involved in any situation that might arise are variable.
The Stock Purchase Agreement that the Company entered into in connection with the investment by three venture capital firms in Lifesize, Inc. contains representations, warranties and covenants of Logitech and Lifesize, Inc. to the Venture Investors. Subject to certain limitations, the Company has agreed to indemnify the Venture Investors and certain persons related to the Venture Investors for certain losses resulting from breaches of or inaccuracies in such representations, warranties and covenants as well as certain other obligations, including third party expenses, restructuring costs and pre-closing tax obligations of Lifesize.
Legal Proceedings
From time to time the Company is involved in claims and legal proceedings which arise in the ordinary course of its business. The Company is currently subject to several such claims and a small number of legal proceedings. The Company believes that these matters lack merit and intends to vigorously defend against them. Based on currently available information, the Company does not believe that resolution of pending matters will have a material adverse effect on its financial position, cash flows or results of operations. However, litigation is subject to inherent uncertainties, and there can be no assurances that the Company's defenses will be successful or that any such lawsuit or claim would not have a material adverse impact on the Company's business, financial position, cash flows or results of operations in a particular period. Any claims or proceedings against the Company, whether meritorious or not, can have an adverse impact because of defense costs, diversion of management and operational resources, negative publicity and other factors. Any failure to obtain necessary license or other rights, or litigation arising out of intellectual property claims, could adversely affect the Company's business.
Note 14—Shareholders' Equity
Share Capital
The Company's nominal share capital is CHF 43,276,655, consisting of 173,106,620 shares with a par value of CHF 0.25 each, all of which were issued and 10,697,117 of which were held in treasury shares as of March 31, 2016.
Logitech International S.A. | Fiscal 2016 Form 10-K | 109
In September 2008, the Company's shareholders approved an amendment to reserve conditional capital of 25,000,000 shares for potential issuance on the exercise of rights granted under the Company's employee equity incentive plans. The shareholders also approved the creation of conditional capital representing the issuance of up to 25,000,000 shares to cover any conversion rights under a future convertible bond issuance. This conditional capital was created in order to provide financing flexibility for future expansion, investments or acquisitions.
Dividends
Pursuant to Swiss corporate law, Logitech International S.A. may only pay dividends in Swiss Francs. The payment of dividends is limited to certain amounts of unappropriated retained earnings (CHF 653.4 million or $680.5 million based on the exchange rate at March 31, 2016) and is subject to shareholder approval. In March 2015, the Company announced a plan to pay $250.0 million in cumulative dividends for fiscal year 2015 through fiscal year 2017. In September 2015, the Company declared and paid cash dividends of CHF 0.51 (USD equivalent of $0.53) per common share, totaling approximately $85.9 million, on the Company’s outstanding common stock. In December 2014, Logitech's shareholders approved a cash dividend payment of CHF 43.1 million out of retained earnings to Logitech shareholders. Eligible shareholders were paid CHF 0.26 per share ($0.27 per share in U.S. Dollars), totaling $43.8 million in U.S. Dollars in December 2014. In September 2013, Logitech's shareholders approved a cash dividend payment of CHF 33.7 million out of retained earnings to Logitech's shareholders. Eligible shareholders were paid CHF 0.21 per share ($0.22 per share in U.S. Dollars), totaling $36.1 million in U.S. Dollars in September 2013.
Legal Reserves
Under Swiss corporate law, a minimum of 5% of the Company's annual net income must be retained in a legal reserve until this legal reserve equals 20% of the Company's issued and outstanding aggregate par value per share capital. These legal reserves represent an appropriation of retained earnings that are not available for distribution and totaled $10.0 million at March 31, 2016 (based on the exchange rate at March 31, 2016).
Share Repurchases
In March 2014, the Company's Board of Directors approved the 2014 share buyback program, which authorizes the Company to use up to $250.0 million to purchase its own shares. The Company's share buyback program is expected to remain in effect for a period of three years. Shares may be repurchased from time to time on the open market, through block trades or otherwise. Purchases may be started or stopped at any time without prior notice depending on market conditions and other factors.
A summary of the approved and active share buyback program is shown in the following table (in thousands, excluding transaction costs):
Approved | Repurchased | |||||||||||||
Share Buyback Program | Shares | Amounts | Shares | Amounts | ||||||||||
March 2014 | 17,311 | $ | 250,000 | 5,066 | $ | 71,702 | ||||||||
During fiscal years 2016 and 2015, 5.0 million and 0.1 million shares were repurchased for $70.4 million and $1.7 million, respectively. There were no share repurchases during fiscal year 2014.
Logitech International S.A. | Fiscal 2016 Form 10-K | 110
Accumulated Other Comprehensive Loss
The components of accumulated other comprehensive loss were as follows (in thousands):
Accumulated Other Comprehensive Income (Loss) | ||||||||||||||||
Cumulative Translation Adjustment (1) | Defined Benefit Plans(1) | Deferred Hedging Gains (Losses) | Total | |||||||||||||
March 31, 2015 | $ | (90,224 | ) | $ | (26,964 | ) | $ | 3,951 | $ | (113,237 | ) | |||||
Other comprehensive income (loss) | 6,186 | 793 | (5,727 | ) | 1,252 | |||||||||||
March 31, 2016 | $ | (84,038 | ) | $ | (26,171 | ) | $ | (1,776 | ) | $ | (111,985 | ) | ||||
_______________________________________
(1) Tax effect was not significant as of March 31, 2016 or 2015.
Note 15—Segment Information
As discussed in "Note 2 — Summary of Significant Accounting Policies", the Company's Peripherals segment remains as the sole reporting segment reported in continuing operations.
The Company's Peripherals segment continues to design, manufacture and markets products that allow people to connect through music, gaming, video, computing, and other digital platforms. Operating performance measures for Peripherals reports directly to the Company's Chief Executive Officer (“CEO”), who is considered to be the Company’s Chief Operating Decision Maker (“CODM”). The CEO periodically reviews information such as net sales and operating income (loss) to make business decisions. These operating performance measures do not include restructuring charges (credits), net, share-based compensation expense and amortization of intangible assets.
Net sales by product categories and sales channels, excluding intercompany transactions, were as follows (in thousands):
Years Ended March 31, | ||||||||||||
2016 | 2015 | 2014 | ||||||||||
Mobile Speakers | 229,718 | 178,038 | 87,414 | |||||||||
Audio-PC & Wearables | 196,013 | 213,496 | 250,037 | |||||||||
Gaming | 245,101 | 211,911 | 186,926 | |||||||||
Video Collaboration | 89,322 | 62,215 | 29,058 | |||||||||
Home Control | 59,075 | 68,060 | 67,371 | |||||||||
Pointing Devices | 492,543 | 487,210 | 506,884 | |||||||||
Keyboards & Combos | 430,190 | 426,117 | 415,314 | |||||||||
Tablet & Other Accessories | 103,886 | 140,994 | 172,484 | |||||||||
PC Webcams | 98,641 | 96,680 | 113,791 | |||||||||
Other (1) | 2,570 | 2,725 | 37,000 | |||||||||
Total net retail sales | 1,947,059 | 1,887,446 | 1,866,279 | |||||||||
OEM | 71,041 | 117,462 | 141,749 | |||||||||
Total net sales | $ | 2,018,100 | $ | 2,004,908 | $ | 2,008,028 | ||||||
(1) | Other category includes products that the Company currently intends to transition out of, or have already transitioned out of, because they are no longer strategic to the Company's business. |
Net sales to unaffiliated customers by geographic region for fiscal years 2016, 2015 and 2014 (based on the customers' location) were as follows (in thousands):
Logitech International S.A. | Fiscal 2016 Form 10-K | 111
Years Ended March 31, | ||||||||||||
2016 | 2015 | 2014 | ||||||||||
Americas | $ | 881,379 | $ | 864,761 | $ | 799,431 | ||||||
EMEA | 645,694 | 670,890 | 724,671 | |||||||||
Asia Pacific | 491,027 | 469,257 | 483,926 | |||||||||
$ | 2,018,100 | $ | 2,004,908 | $ | 2,008,028 | |||||||
The United States represented 38%, 36% and 34% of net sales for the fiscal years 2016, 2015 and 2014, respectively. No other single country represented more than 10% of net sales during these periods. Revenues from net sales to customers in Switzerland, the Company's home domicile, represented 2% of net sales for each of fiscal years 2016, 2015 and 2014.
Geographic long-lived assets information, primarily fixed assets, are reported below based on the location of the asset (in thousands):
March 31, | ||||||||
2016 | 2015 | |||||||
Americas | $ | 40,221 | $ | 44,263 | ||||
EMEA | 3,194 | 3,473 | ||||||
Asia Pacific | 49,445 | 38,742 | ||||||
$ | 92,860 | $ | 86,478 | |||||
Long-lived assets in the United States and China were $40.0 million and $44.5 million at March 31, 2016, respectively, and $44.3 million and $33.4 million at March 31, 2015, respectively. No other countries represented more than 10% of the Company's total consolidated long-lived assets at March 31, 2016 or 2015. Long-lived assets in Switzerland, the Company's home domicile, were $1.7 million and $1.5 million at March 31, 2016 and 2015, respectively.
Note 16—Restructuring
During the first quarter of fiscal year 2016, the Company implemented a restructuring plan to exit the OEM business, reorganize Lifesize to sharpen its focus on its cloud-based offering, and streamline the Company's overall cost structure, overhead and infrastructure cost reductions with a targeted resource realignment. Restructuring charges incurred during the year ended March 31, 2016 under this plan primarily consisted of severance and other ongoing and one-time termination benefits. Charges and other costs related to the workforce reduction and structure realignment are presented as restructuring charges in the Consolidated Statements of Operations. On a total company basis, including the Lifesize video conferencing business as reported in discontinued operations, the Company has incurred $25.5 million under this restructuring plan, including $24.4 million for cash severance and other personnel costs. The Company substantially completed this restructuring plan by the fourth quarter of fiscal year 2016.
During the fourth quarter of fiscal year 2013, the Company implemented a restructuring plan to align its organization to its strategic priorities of increasing focus on mobility products, improving profitability in PC-related products and enhancing global operational efficiencies. As part of this restructuring plan, the Company reduced its worldwide non-direct labor workforce. Restructuring charges under this plan primarily consisted of severance and other one-time termination benefits. During fiscal year 2015, the Company recorded a $4.9 million restructuring credit, on a total company basis, primarily as a result of partial termination of its lease agreement for the Silicon Valley campus, which was previously vacated and under the restructuring plan during fiscal year 2014. The Company substantially completed this restructuring plan by the fourth quarter of fiscal year 2014.
Logitech International S.A. | Fiscal 2016 Form 10-K | 112
The following table summarizes restructuring related activities during fiscal year 2016 and 2015 from continuing operations (in thousands):
Restructuring - Continuing Operations | |||||||||||||||||
Termination Benefits | Lease Exit Costs | Other | Total | ||||||||||||||
Accrual balance at March 31, 2014 | $ | — | $ | 7,309 | $ | — | $ | 7,309 | |||||||||
Credits, net | — | (4,777 | ) | — | (4,777 | ) | |||||||||||
Cash payments | — | (1,578 | ) | — | (1,578 | ) | |||||||||||
Accrual balance at March 31, 2015 | — | 954 | — | 954 | |||||||||||||
Charges, net | 17,280 | 337 | 185 | 17,802 | |||||||||||||
Cash payments | (11,373 | ) | (1,166 | ) | (185 | ) | (12,724 | ) | |||||||||
Accrual balance at March 31, 2016 | $ | 5,907 | $ | 125 | $ | — | $ | 6,032 | * | ||||||||
*This balance is included in accrued and other current liabilities on the Company’s consolidated balance sheets.
The following tables summarize restructuring related activities during fiscal year 2016 and 2015 from discontinued operations (in thousands):
Restructuring - Discontinued Operations | |||||||||||||||||
Termination Benefits | Lease Exit Costs | Other | Total | ||||||||||||||
Accrual balance at March 31, 2014 | $ | 142 | $ | 110 | $ | — | $ | 252 | |||||||||
Charges | (86 | ) | (25 | ) | — | (111 | ) | ||||||||||
Cash payments | (56 | ) | — | — | (56 | ) | |||||||||||
Accrual balance at March 31, 2015 | — | 85 | — | 85 | |||||||||||||
Charges, net | 7,095 | — | 805 | 7,900 | |||||||||||||
Cash payments | (6,460 | ) | (14 | ) | (805 | ) | (7,279 | ) | |||||||||
Adjustment as a result of disposition of discontinued operations | (267 | ) | (71 | ) | — | (338 | ) | ||||||||||
Accrual balance at March 31, 2016 | $ | 368 | $ | — | $ | — | $ | 368 | * | ||||||||
*This balance is included in accrued and other current liabilities in continuing operations as of March 31, 2016, as it's expected to be paid by the continuing operations pursuant to the transaction occurred on December 28, 2015 (See Note 3).
Note 17—Subsequent Events
On April 20, 2016, the Company acquired Jaybird LLC of Salt Lake City, Utah, for approximately $50 million in cash, with an additional earn-out of up to $45 million based on achievement of growth targets over the next two years. The Company is still in the process of preparing the initial accounting of the transaction and expects to establish a preliminary purchase price allocation with respect to this transaction by the end of the first quarter of fiscal year 2017.
Logitech International S.A. | Fiscal 2016 Form 10-K | 113
LOGITECH INTERNATIONAL S.A.
SUPPLEMENTARY DATA
QUARTERLY FINANCIAL DATA
(unaudited)
The following table contains selected unaudited quarterly financial data for fiscal years 2016 and 2015 (in thousands, except per share amounts):
Year ended March 31, 2016 (3) | Year ended March 31, 2015 (3) | ||||||||||||||||||||||||||||||
Q1 (2) | Q2 (2) | Q3 (2) | Q4 (2) | Q1 | Q2 | Q3 | Q4 (1) | ||||||||||||||||||||||||
Net sales | $ | 447,686 | $ | 518,494 | $ | 621,079 | $ | 430,841 | $ | 456,446 | $ | 501,857 | $ | 604,322 | $ | 442,283 | |||||||||||||||
Cost of goods sold | 289,753 | 345,977 | 412,582 | 288,741 | 291,641 | 315,486 | 391,715 | 300,609 | |||||||||||||||||||||||
Gross profit | 157,933 | 172,517 | 208,497 | 142,100 | 164,805 | 186,371 | 212,607 | 141,674 | |||||||||||||||||||||||
Operating expenses: | |||||||||||||||||||||||||||||||
Marketing and selling | 75,796 | 78,833 | 87,295 | 77,091 | 77,178 | 81,439 | 87,486 | 75,646 | |||||||||||||||||||||||
Research and development | 28,170 | 28,893 | 29,273 | 27,288 | 25,737 | 26,875 | 27,397 | 28,297 | |||||||||||||||||||||||
General and administrative | 28,812 | 25,074 | 24,080 | 23,582 | 35,251 | 33,339 | 28,172 | 29,233 | |||||||||||||||||||||||
Restructuring charges (credits), net | 11,538 | 3,146 | (666 | ) | 3,784 | (35 | ) | — | — | (4,742 | ) | ||||||||||||||||||||
Total operating expenses | 144,316 | 135,946 | 139,982 | 131,745 | 138,131 | 141,653 | 143,055 | 128,434 | |||||||||||||||||||||||
Operating income | 13,617 | 36,571 | 68,515 | 10,355 | 26,674 | 44,718 | 69,552 | 13,240 | |||||||||||||||||||||||
Interest income, net | 255 | 189 | 105 | 241 | 251 | 349 | 224 | 373 | |||||||||||||||||||||||
Other income (expense), net | (1,019 | ) | (737 | ) | 862 | 2,518 | (171 | ) | (843 | ) | (2,688 | ) | 1,404 | ||||||||||||||||||
Income from continuing operations before income taxes | 12,853 | 36,023 | 69,482 | 13,114 | 26,754 | 44,224 | 67,088 | 15,017 | |||||||||||||||||||||||
Provision for (benefit from) income taxes | (7 | ) | 5,571 | 1,442 | (3,896 | ) | 2,769 | 5,016 | 670 | (3,801 | ) | ||||||||||||||||||||
Net Income from continuing operations | 12,860 | 30,452 | 68,040 | 17,010 | 23,985 | 39,208 | 66,418 | 18,818 | |||||||||||||||||||||||
Income (loss) from discontinued operations, net of income taxes | (5,423 | ) | (12,355 | ) | (2,954 | ) | 11,687 | (4,310 | ) | (3,117 | ) | (3,634 | ) | (128,085 | ) | ||||||||||||||||
Net income (loss) | $ | 7,437 | $ | 18,097 | $ | 65,086 | $ | 28,697 | $ | 19,675 | $ | 36,091 | $ | 62,784 | $ | (109,267 | ) | ||||||||||||||
Net income (loss) per share - Basic: | |||||||||||||||||||||||||||||||
Continuing operations | $ | 0.08 | $ | 0.19 | $ | 0.42 | $ | 0.10 | $ | 0.15 | $ | 0.24 | $ | 0.41 | $ | 0.11 | |||||||||||||||
Discontinued operations | $ | (0.03 | ) | $ | (0.08 | ) | $ | (0.02 | ) | $ | 0.08 | $ | (0.03 | ) | $ | (0.02 | ) | $ | (0.03 | ) | $ | (0.77 | ) | ||||||||
Net income (loss) per share - basic | $ | 0.05 | $ | 0.11 | $ | 0.40 | $ | 0.18 | $ | 0.12 | $ | 0.22 | $ | 0.38 | $ | (0.66 | ) | ||||||||||||||
Net income (loss) per share - Diluted: | |||||||||||||||||||||||||||||||
Continuing operations | $ | 0.08 | $ | 0.18 | $ | 0.41 | $ | 0.10 | $ | 0.14 | $ | 0.24 | $ | 0.40 | $ | 0.11 | |||||||||||||||
Discontinued operations | $ | (0.04 | ) | $ | (0.07 | ) | $ | (0.02 | ) | $ | 0.07 | $ | (0.02 | ) | $ | (0.02 | ) | $ | (0.02 | ) | $ | (0.77 | ) | ||||||||
Net income (loss) per share - diluted | $ | 0.04 | $ | 0.11 | $ | 0.39 | $ | 0.17 | $ | 0.12 | $ | 0.22 | $ | 0.38 | $ | (0.66 | ) | ||||||||||||||
Shares used to compute net income (loss) per share: | |||||||||||||||||||||||||||||||
Basic | 164,431 | 163,515 | 162,669 | 162,671 | 163,012 | 163,230 | 163,533 | 164,319 | |||||||||||||||||||||||
Diluted | 166,895 | 165,841 | 165,168 | 165,365 | 165,833 | 166,065 | 166,321 | 166,424 | |||||||||||||||||||||||
______________________________
Logitech International S.A. | Fiscal 2016 Form 10-K | 114
(1) | The Company recognized $4.7 million restructuring credits as result of partial termination of its lease agreement for Silicon Valley campus, which was previously vacated and under a restructuring plan during fiscal 2014. |
(2) | During Fiscal year 2016, the Company incurred restructuring charges of $17.8 million related to the restructuring plan implemented in fiscal 2016. The $4.8 million in restructuring credits during fiscal year 2015 were related to restructuring plans the Company implemented in fiscal year 2014. |
(3) | On December 28, 2015, the Company divested its Lifesize video conferencing business and, as a result, the Company reflected the Lifesize video conferencing business as discontinued operations in the consolidated statements of operations and, as such, the results of that business have been excluded from all line items other than “Loss from discontinued operations, net of income taxes” for all periods presented. |
Logitech International S.A. | Fiscal 2016 Form 10-K | 115
Schedule II
LOGITECH INTERNATIONAL S.A.
VALUATION AND QUALIFYING ACCOUNTS
For the Fiscal Years Ended March 31, 2016, 2015 and 2014 (in thousands)
The Company's Schedule II includes valuation and qualifying accounts related to allowances for doubtful accounts, sales returns, cooperative marketing arrangements, customer incentive programs, and pricing programs, for direct customers and tax valuation allowances. The Company also has sales incentive programs for indirect customers with whom it does not have a direct sales and receivable relationship. These programs are recorded as accrued liabilities and are not considered valuation or qualifying accounts.
Balance at Beginning of Year | Charged (Credited) to Statement of Operations | Claims and Adjustments Applied Against Allowances | Balance at End of Year | |||||||||||||
Allowance for doubtful accounts: | ||||||||||||||||
2016 | $ | 707 | $ | 71 | $ | (111 | ) | $ | 667 | |||||||
2015 | $ | 1,297 | $ | (334 | ) | $ | (256 | ) | $ | 707 | ||||||
2014 | $ | 1,724 | $ | 670 | $ | (1,097 | ) | $ | 1,297 | |||||||
Allowance for sales returns: | ||||||||||||||||
2016 | $ | 17,236 | $ | 66,935 | $ | (65,645 | ) | $ | 18,526 | |||||||
2015 | $ | 18,503 | $ | 66,785 | $ | (68,052 | ) | $ | 17,236 | |||||||
2014 | $ | 20,284 | $ | 60,113 | $ | (61,894 | ) | $ | 18,503 | |||||||
Allowances for cooperative marketing arrangements: | ||||||||||||||||
2016 | $ | 24,919 | $ | 131,410 | $ | (128,172 | ) | $ | 28,157 | |||||||
2015 | $ | 23,255 | $ | 113,610 | $ | (111,946 | ) | $ | 24,919 | |||||||
2014 | $ | 23,186 | $ | 100,005 | $ | (99,936 | ) | $ | 23,255 | |||||||
Allowances for customer incentive programs: | ||||||||||||||||
2016 | $ | 47,364 | $ | 164,307 | $ | (150,799 | ) | $ | 60,872 | |||||||
2015 | $ | 40,205 | $ | 142,413 | $ | (135,254 | ) | $ | 47,364 | |||||||
2014 | $ | 41,554 | $ | 104,719 | $ | (106,068 | ) | $ | 40,205 | |||||||
Allowances for pricing programs: | ||||||||||||||||
2016 | $ | 70,951 | $ | 260,698 | $ | (250,096 | ) | $ | 81,553 | |||||||
2015 | $ | 68,798 | $ | 246,780 | $ | (244,627 | ) | $ | 70,951 | |||||||
2014 | $ | 54,931 | $ | 217,967 | $ | (204,100 | ) | $ | 68,798 | |||||||
Tax valuation allowances: | ||||||||||||||||
2016 | $ | 5,590 | $ | 1,255 | $ | (1,507 | ) | $ | 5,338 | |||||||
2015 | $ | 4,872 | $ | 995 | $ | (277 | ) | $ | 5,590 | |||||||
2014 | $ | 6,014 | $ | 515 | $ | (1,657 | ) | $ | 4,872 | |||||||
Logitech International S.A. | Fiscal 2016 Form 10-K | 116