Attached files
| file | filename |
|---|---|
| 8-K - 8-K - Your Community Bankshares, Inc. | a16-11812_28k.htm |
Exhibit 99.1
“Achieving Financial Goals with Exceptional People and Exceptional Service” 2016 Annual Meeting of Shareholders Company Update May 17, 2016 - 9:00 a.m. Your Community Bankshares, Inc. A NASDAQ Traded Company - Symbol YCB
Safe Harbor Statement for Forward-Looking Statements This investor presentation may contain forward-looking statements within the meaning of the federal securities laws. We intend such forward-looking statements to be covered by the safe harbor provisions for forward-looking statements contained in the federal securities laws. These statements are not historical facts, but rather statements based on our current expectations regarding our business strategies and their intended results and our future performance. Forward-looking statements are preceded by terms such as “expects,” “believes,” “anticipates,” “intends,” “may,” “could,” “should” and similar expressions. Forward-looking statements are not guarantees of future performance. Numerous risks and uncertainties could cause or contribute to our actual results, performance, and achievements to be materially different from those expressed or implied by the forward-looking statements. Factors that may cause or contribute to these differences include, without limitation, general economic conditions, including changes in market interest rates and changes in monetary and fiscal policies of the federal government; legislative and regulatory changes; competitive conditions in the banking markets served by our subsidiaries; the adequacy of the allowance for losses on loans and the level of future provisions for losses on loans; costs of integrating acquired operations and realizing benefits of the acquisition and other factors disclosed periodically in our filings with the Securities and Exchange Commission. Because of the significant risk s and uncertainties inherent in forward-looking statements, readers should not place undue reliance on them, whether included in this report or made elsewhere from time to time by us or on our behalf. Our forward-looking statements are made as of the date of the presentation and we assume no obligation to update any forward-looking statements or the reasons why actual results could differ from those contained in such forward-looking statements. Page|2
Agenda Changes in Company Structure Selected Financial Data Stock Price Performance 2016 Corporate Outlook Page 3
Changes in Company Structure Completed merger with FFKY on January 1, 2015 Total Assets increased from $889 million at 12/31/14 to $1.6 billion at 03/31/15 Acquired 15 net Financial Centers (Closed two overlapping Your Community Bank FC’s in Bardstown) Hired Ken Dozer as Market President Merged Scott Country State Bank into YCB Changed Name from Community Bank Shares of Indiana, Inc (CBIN) to Your Community Bankshares, Inc. (YCB) Page 4

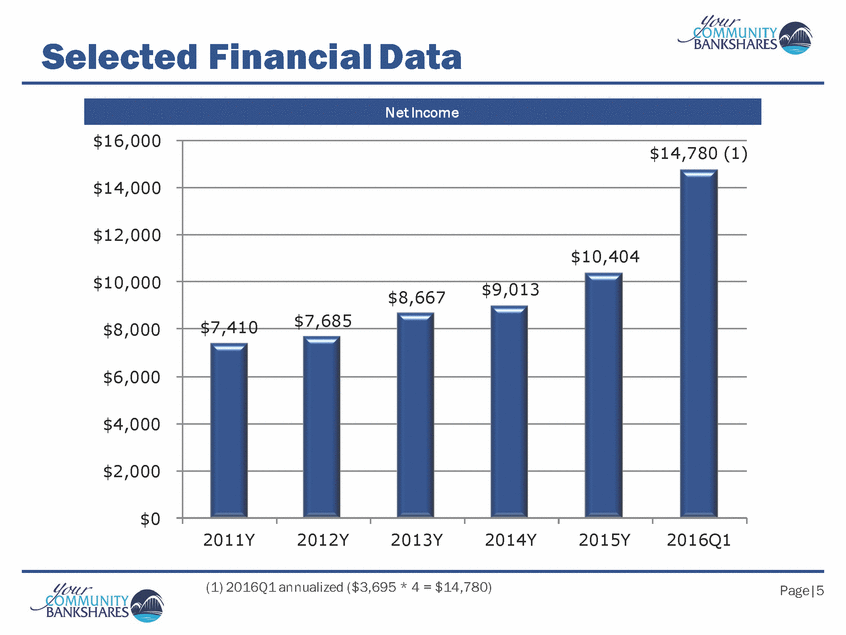
Selected Financial Data Net Income 2011Y 2012Y 2013Y 2014Y 2015Y 2016Q1 $16,000 $14,000 $12,000 $10,000 $8,000 $6,000 $4,000 $2,000 $0 $7,410 $7,685, $8,667 $9,013 $10,404 $14,780 (1) (1) 2016 Q1 annialized ($3,695 * 4 = $14,780) Page|5
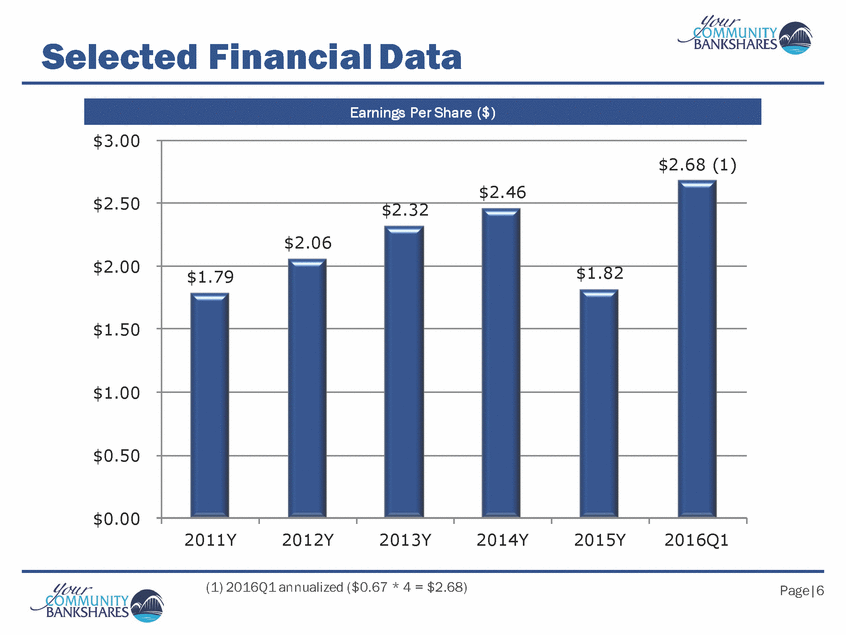
Selected Financial Data Earnings Per Share ($) $3.00 $2.50 $2.00 $1.50 $1.00 $0.50 $0.00 $1.79 $2.06 $2.32 $2.46 $1.82 $2.68 (1) 2011Y 2012Y 2013Y 2014Y 2015Y 2016Q1 (1) 2016Q1 annaualized ($0.67 * 4 = $2.68) Page 6
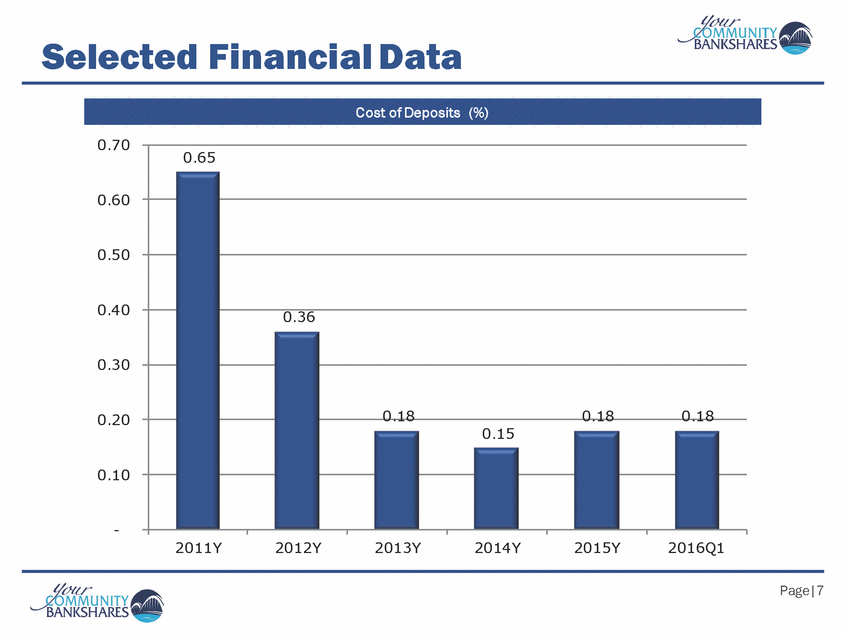
Selected Financial Data 0.70 0.65 0.60 0.50 0.40 0.36 0.30 0.18 0.18 0.18 0.20 0.15 0.10 - 2011Y 2012Y 2013Y 2014Y 2015Y 2016Q1 Page|7 Cost of Deposits (%)
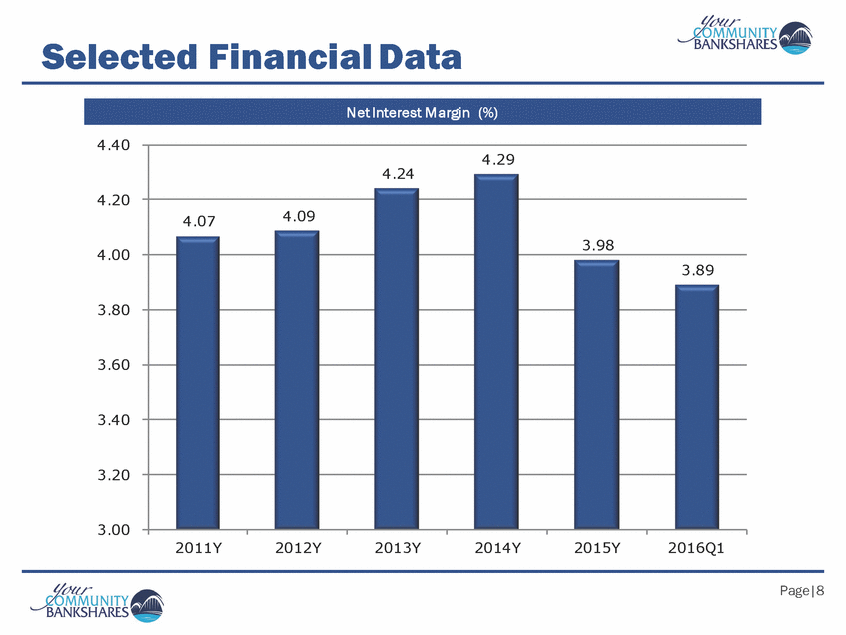
Selected Financial Data 4.40 4.29 4.20 4.09 4.07 3.98 4.00 3.89 3.80 3.60 3.40 3.20 3.00 2011Y 2012Y 2013Y 2014Y 2015Y 2016Q1 Page|8 4.24 Net Interest Margin (%)
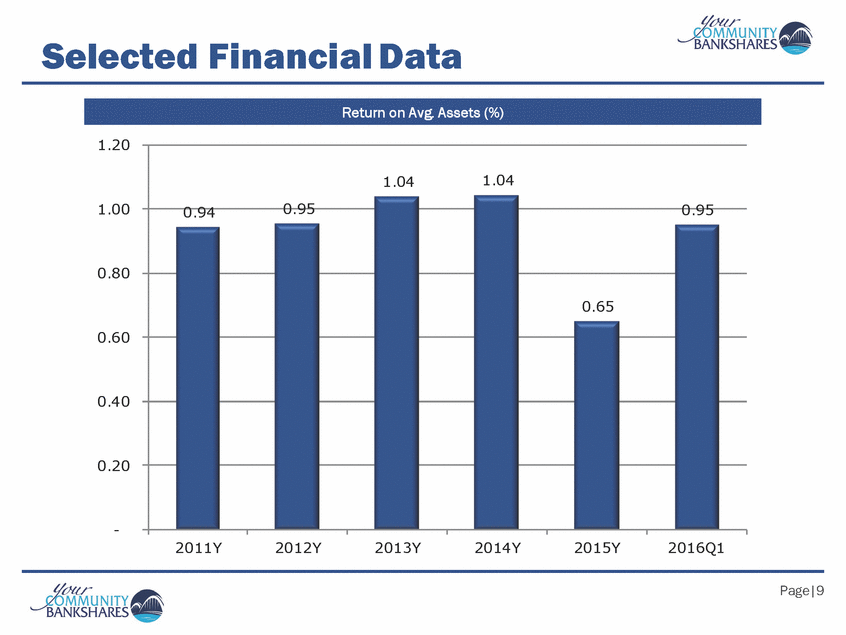
Selected Financial Data 1.20 1.00 0.95 0.94 0.80 0.65 0.60 0.40 0.20 - 2011Y 2012Y 2013Y 2014Y 2015Y 2016Q1 Page|9 1.041.04 0.95 Return on Avg. Assets (%)
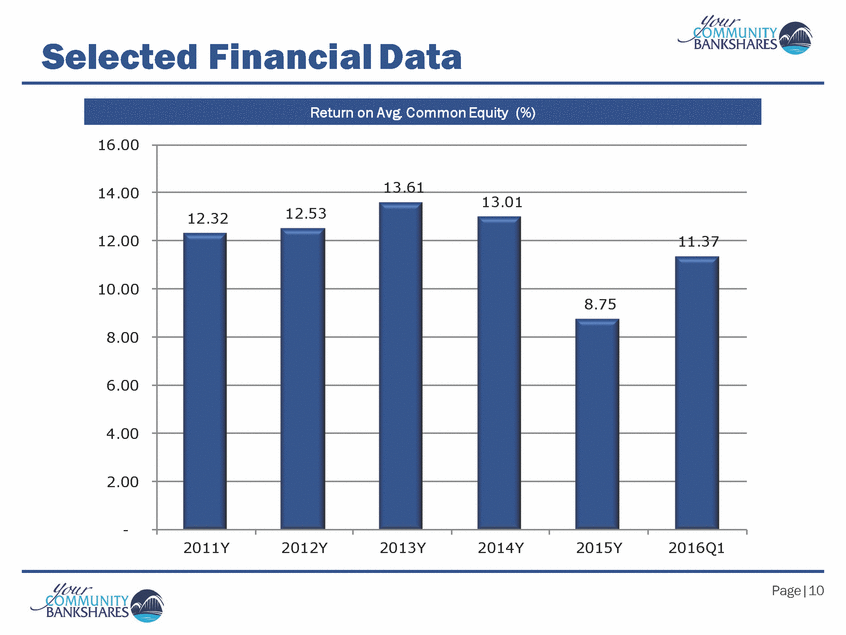
Selected Financial Data Return on Avg Common Equity (%) 16.00 14.00 12.00 10.00 8.00 6.00 4.00 2.00 - 12.32 12.53 13.61 13.01 8.75 11.37 2011Y 2012Y 2013Y 2014Y 2015Y 2016Q1 Page 10
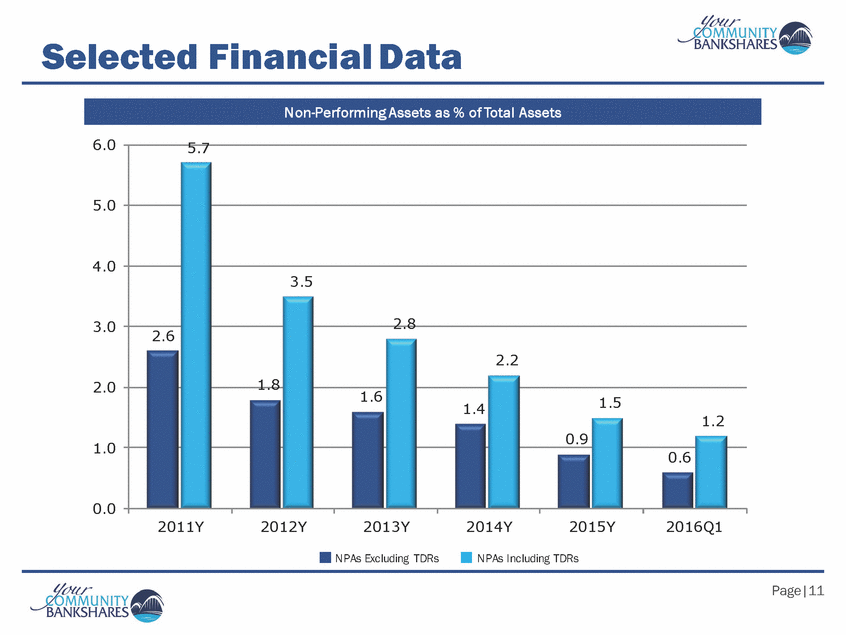
Selected Finanical Data Non-Performing Assets as % of Total Assets 6.0 5.0 4.0 3.0 2.0 1.0 2.6 5.7 1.8 3.5 1.6 2.8 1.4 2.2 0.9 1.5 0.6 1.2 2011Y 2012Y 2013Y 2014Y 2015Y 2016Q1 NPAs Excluding TDRs NPAs Including TDRs Page 111
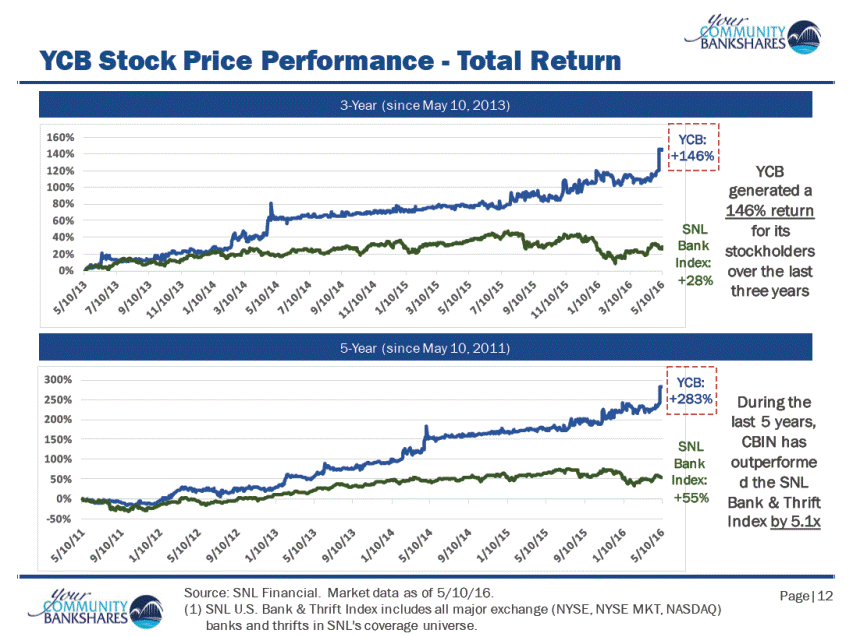
YCN Stock Price Performance - Total Return Source SNL Financial Market data as of 5/10/16. (1) SNL U.S. Bank & Thrift Index includes all major exchange (NYSE MKT, NASDAQ) bank and thrifts in SML’s coverage universe. page 12
2016 Corporate Outlook Prepare Regulatory Filings for Merger with WesBanco, Inc. Shareholder Meeting to approve Merger in late summer/early fall Merger Finalized in 4 -6 Months Data Conversion within 3 -6 months of Merger Date Local Leadership to remain in place Page 13

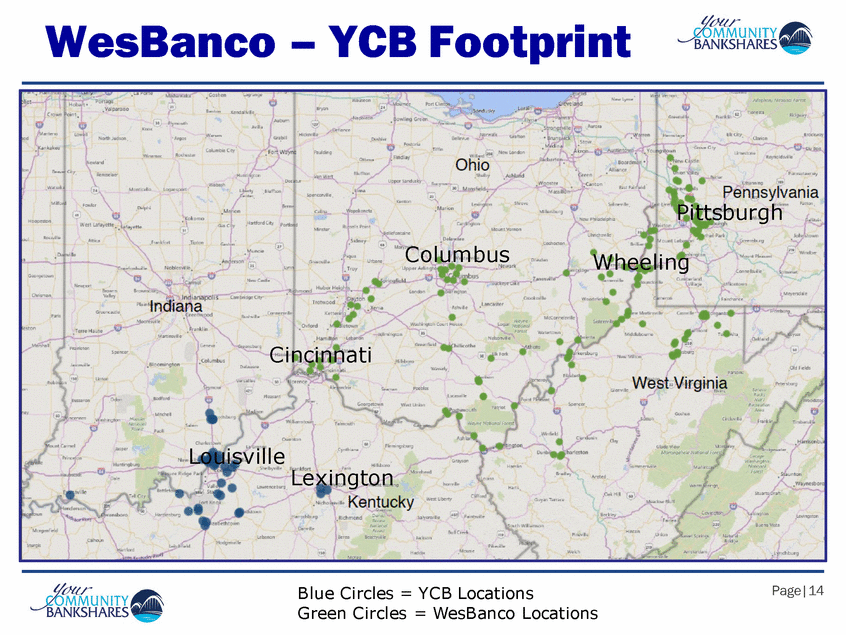
WesBanco - YCB Footprint Blue Circles = YCB Locations Green Circles = WesBanco Locations Page 14
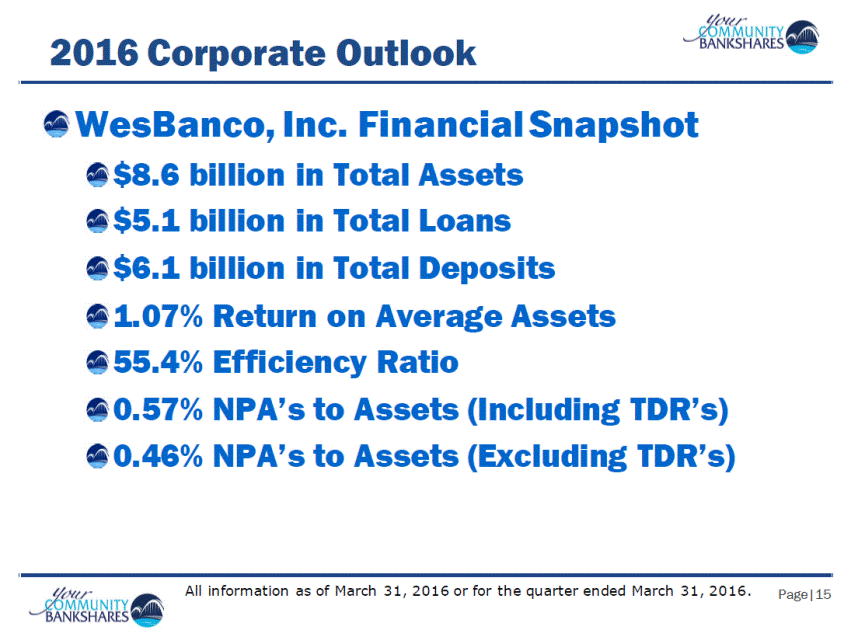
2016 Corporate Outlook Wesbanco, Inc. Financial Snapshot $8.6 billion in Total Assets $5.1 billion in Total Loans $6.1 billion in Total Deposits 1.07% Return on Average Assets 55.4% Efficiency Ratio 0.57% NPA’s to Assets (Including TDR’s) 0.46% NPA’s to Assets (Excluding TRD’s) All Information as of March 31, 2016 or for the quarter ended March 31, 2016. Page 15
Thank you. Any Questions? Page 16