Attached files
| file | filename |
|---|---|
| 8-K - 8-K - FIRST BUSINESS FINANCIAL SERVICES, INC. | a051916form8-k.htm |

ANNUAL SHAREHOLDER MEETING

Forward-Looking Statements 2 When used in this presentation, and in any other oral statements made with the approval of an authorized executive officer, the words or phrases “may,” “could,” “should,” “hope,” “might,” “believe,” “expect,” “plan,” “assume,” “intend,” “estimate,” “anticipate,” “project,” “likely,” or similar expressions are intended to identify “forward-looking statements” within the meaning of such term in the Private Securities Litigation Reform Act of 1995. Such statements are subject to risks and uncertainties, including among other things: (i) Competitive pressures among depository and other financial institutions nationally and in our market areas may increase significantly. (ii) Adverse changes in the economy or business conditions, either nationally or in our market areas, could increase credit-related losses and expenses and/or limit growth. (iii) Increases in defaults by borrowers and other delinquencies could result in increases in our provision for losses on loans and related expenses. (iv) Our inability to manage growth effectively, including the successful expansion of our customer support, administrative infrastructure and internal management systems, could adversely affect our results of operations and prospects. (v) Fluctuations in interest rates and market prices could reduce our net interest margin and asset valuations and increase our expenses. (vi) The consequences of continued bank acquisitions and mergers in our market areas, resulting in fewer but much larger and financially stronger competitors, could increase competition for financial services to our detriment. (vii) Changes in legislative or regulatory requirements applicable to us and our subsidiaries could increase costs, limit certain operations and adversely affect results of operations. (viii) Changes in tax requirements, including tax rate changes, new tax laws and revised tax law interpretations may increase our tax expense or adversely affect our customers' businesses. (ix) System failure or breaches of our network security, including with respect to our internet banking activities, could subject us to increased operating costs and other liabilities. These risks could cause actual results to differ materially from what FBIZ has anticipated or projected. These risk factors and uncertainties should be carefully considered by our shareholders and potential investors. See Item 1A “RISK FACTORS” in our Annual Report on Form 10-K for the year ended December 31, 2015, as well as elsewhere in our other documents filed with the Securities and Exchange Commission, for discussion relating to risk factors impacting FBIZ. Investors should not place undue reliance on any such forward-looking statement, which speaks only as of the date on which it was made. The factors described within the filings could affect our financial performance and could cause actual results for future periods to differ materially from any opinions or statements expressed with respect to future periods. Where any such forward-looking statement includes a statement of the assumptions or bases underlying such forward-looking statement, FBIZ cautions that, while its management believes such assumptions or bases are reasonable and are made in good faith, assumed facts or bases can vary from actual results, and the differences between assumed facts or bases and actual results can be material, depending on the circumstances. Where, in any forward- looking statement, an expectation or belief is expressed as to future results, such expectation or belief is expressed in good faith and believed to have a reasonable basis, but there can be no assurance that the statement of expectation or belief will be achieved or accomplished. FBIZ does not intend to, and specifically disclaims any obligation to, update any forward-looking statements.

FINANCIAL RESULTS

Balance Sheet Full Year 2015 As of December 31, 2015 2014 $ Change % Change (Dollars in thousands) Assets Cash and cash equivalents $ 113,564 $ 103,237 $ 10,327 10.0 % Investment securities 177,830 186,261 (8,431) (4.5)% Loans held for sale 2,702 1,340 1,362 101.6 % Loans and leases receivable, net 1,414,649 1,265,098 149,551 11.8 % Cash surrender value of bank-owned life insurance 28,298 27,314 984 3.6 % Goodwill & other intangible assets 12,493 11,944 549 4.6 % Accrued interest receivable & other assets 32,545 33,311 (766) (2.3)% Total assets $ 1,782,081 $ 1,628,505 $ 153,576 9.4 % Liabilities & Stockholders' Equity Deposits $ 1,577,231 $ 1,438,268 $ 138,963 9.7 % Borrowed funds 34,740 33,451 1,289 3.9 % Other liabilities 19,278 19,038 240 1.3 % Total liabilities 1,631,249 1,490,757 140,492 9.4 % Total stockholders' equity 150,832 137,748 13,084 9.5 % Total liabilities & stockholders' equity $ 1,782,081 $ 1,628,505 $ 153,576 9.4 % 4

Income Statement Full Year 2015 For the Year Ended December 31,2015 2014 $ Change % Change (Dollars in thousands, except per share amounts) Net Interest Income: Net interest income $ 58,640 $ 46,130 $ 12,510 27.1% Provision for loan & lease losses 3,386 1,236 2,150 173.9% Net interest income after provision for loan and lease losses 55,254 44,894 10,360 23.1% Non-Interest Income: Trust & investment services fee income 4,954 4,434 520 11.7% Gain on sale of SBA loans 3,999 318 3,681 1,157.5% Service charges on deposit 2,812 2,469 343 13.9% Loan fees 2,187 1,577 610 38.7% Increase in cash surrender values of bank-owned life insurance 960 862 98 11.4% Gain on sale of residential mortgage loans 729 74 655 885.1% Other 1,370 369 1,001 271.3% Total non-interest income 17,011 10,103 6,908 68.4% Non-Interest Expense: Compensation 28,543 21,477 7,066 32.9% Other 18,831 12,298 6,533 53.1% Total non-interest expense 47,374 33,775 13,599 40.3% Income before income tax expense 24,891 21,222 3,669 17.3% Income tax expense 8,377 7,083 1,294 18.3% Net income $ 16,514 $ 14,139 $ 2,375 16.8% Diluted EPS $ 1.90 $ 1.75 $ 0.15 8.6% Note: 2014 results include only two months of contribution from Alterra Bank 5
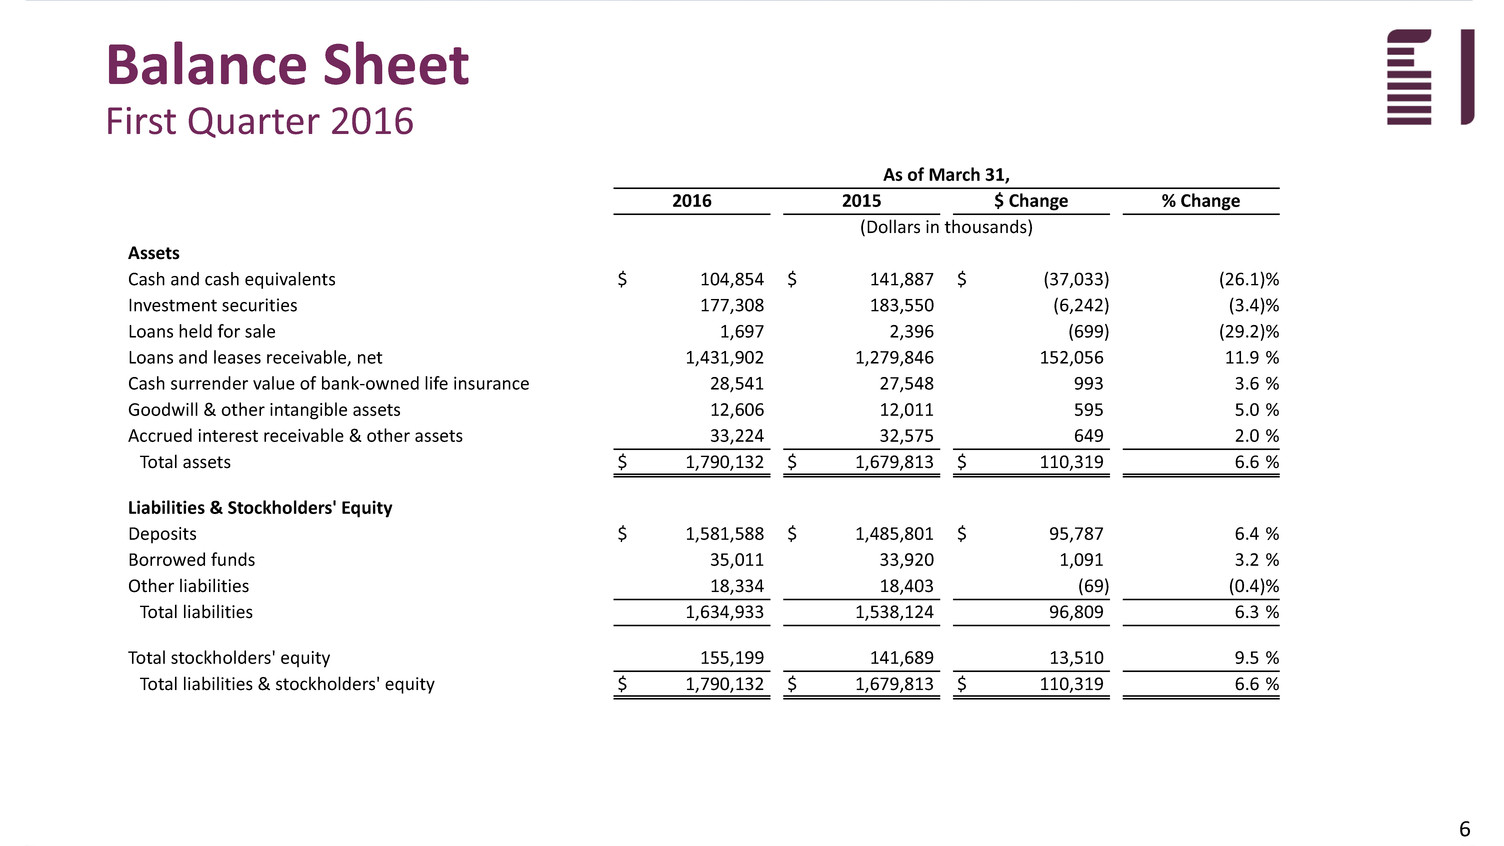
Balance Sheet First Quarter 2016 As of March 31, 2016 2015 $ Change % Change (Dollars in thousands) Assets Cash and cash equivalents $ 104,854 $ 141,887 $ (37,033) (26.1)% Investment securities 177,308 183,550 (6,242) (3.4)% Loans held for sale 1,697 2,396 (699) (29.2)% Loans and leases receivable, net 1,431,902 1,279,846 152,056 11.9 % Cash surrender value of bank-owned life insurance 28,541 27,548 993 3.6 % Goodwill & other intangible assets 12,606 12,011 595 5.0 % Accrued interest receivable & other assets 33,224 32,575 649 2.0 % Total assets $ 1,790,132 $ 1,679,813 $ 110,319 6.6 % Liabilities & Stockholders' Equity Deposits $ 1,581,588 $ 1,485,801 $ 95,787 6.4 % Borrowed funds 35,011 33,920 1,091 3.2 % Other liabilities 18,334 18,403 (69) (0.4)% Total liabilities 1,634,933 1,538,124 96,809 6.3 % Total stockholders' equity 155,199 141,689 13,510 9.5 % Total liabilities & stockholders' equity $ 1,790,132 $ 1,679,813 $ 110,319 6.6 % 6
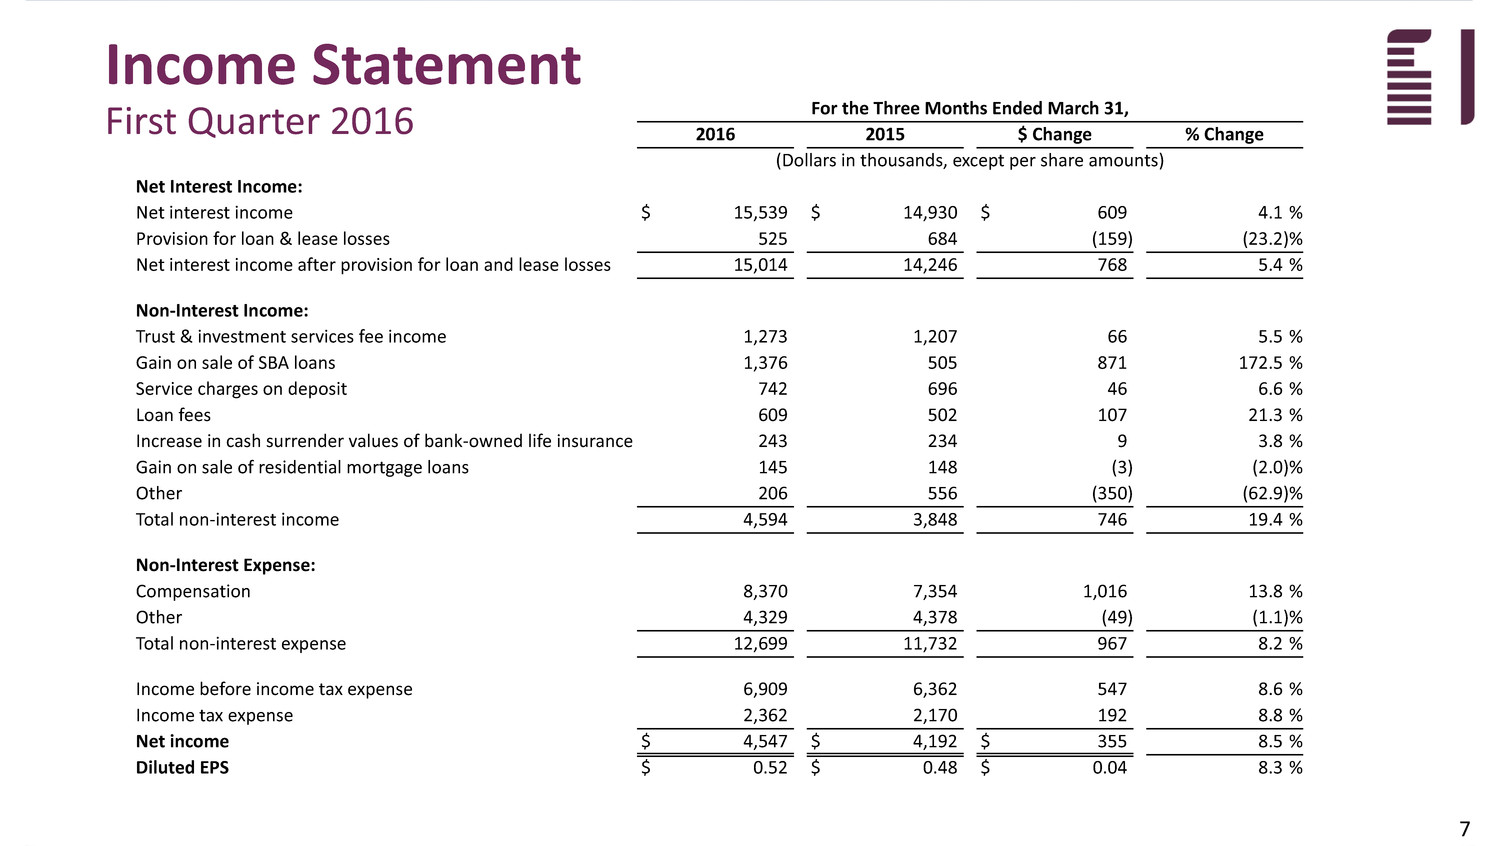
Income Statement First Quarter 2016 For the Three Months Ended March 31,2016 2015 $ Change % Change (Dollars in thousands, except per share amounts) Net Interest Income: Net interest income $ 15,539 $ 14,930 $ 609 4.1 % Provision for loan & lease losses 525 684 (159) (23.2)% Net interest income after provision for loan and lease losses 15,014 14,246 768 5.4 % Non-Interest Income: Trust & investment services fee income 1,273 1,207 66 5.5 % Gain on sale of SBA loans 1,376 505 871 172.5 % Service charges on deposit 742 696 46 6.6 % Loan fees 609 502 107 21.3 % Increase in cash surrender values of bank-owned life insurance 243 234 9 3.8 % Gain on sale of residential mortgage loans 145 148 (3) (2.0)% Other 206 556 (350) (62.9)% Total non-interest income 4,594 3,848 746 19.4 % Non-Interest Expense: Compensation 8,370 7,354 1,016 13.8 % Other 4,329 4,378 (49) (1.1)% Total non-interest expense 12,699 11,732 967 8.2 % Income before income tax expense 6,909 6,362 547 8.6 % Income tax expense 2,362 2,170 192 8.8 % Net income $ 4,547 $ 4,192 $ 355 8.5 % Diluted EPS $ 0.52 $ 0.48 $ 0.04 8.3 % 7

ANNUAL MEETING PRESENTATION May 2016

COMPANY OVERVIEW

• Experienced leadership • Entrepreneurial management style • Insider ownership of 8%2 • Business-focused model • Client relationship focus with high touch service • Niche acquisitions complement core strategic focus on organic growth Headquarters: Madison, WI Mission: Build long-term shareholder value as an entrepreneurial financial services provider to businesses, executives and high net worth individuals 1. Consists of all on-balance sheet assets for First Business Financial Services, Inc. on a consolidated basis. 2. Data as of March 16, 2016. Insider ownership consists of shares beneficially owned by directors and executive officers. Company Profile FBIZ BANKING1 $1.8 Billion IN TOTAL ASSETS FBIZ TRUST $1.1 Billion IN ASSETS UNDER MANAGEMENT & ADMINISTRATION 10
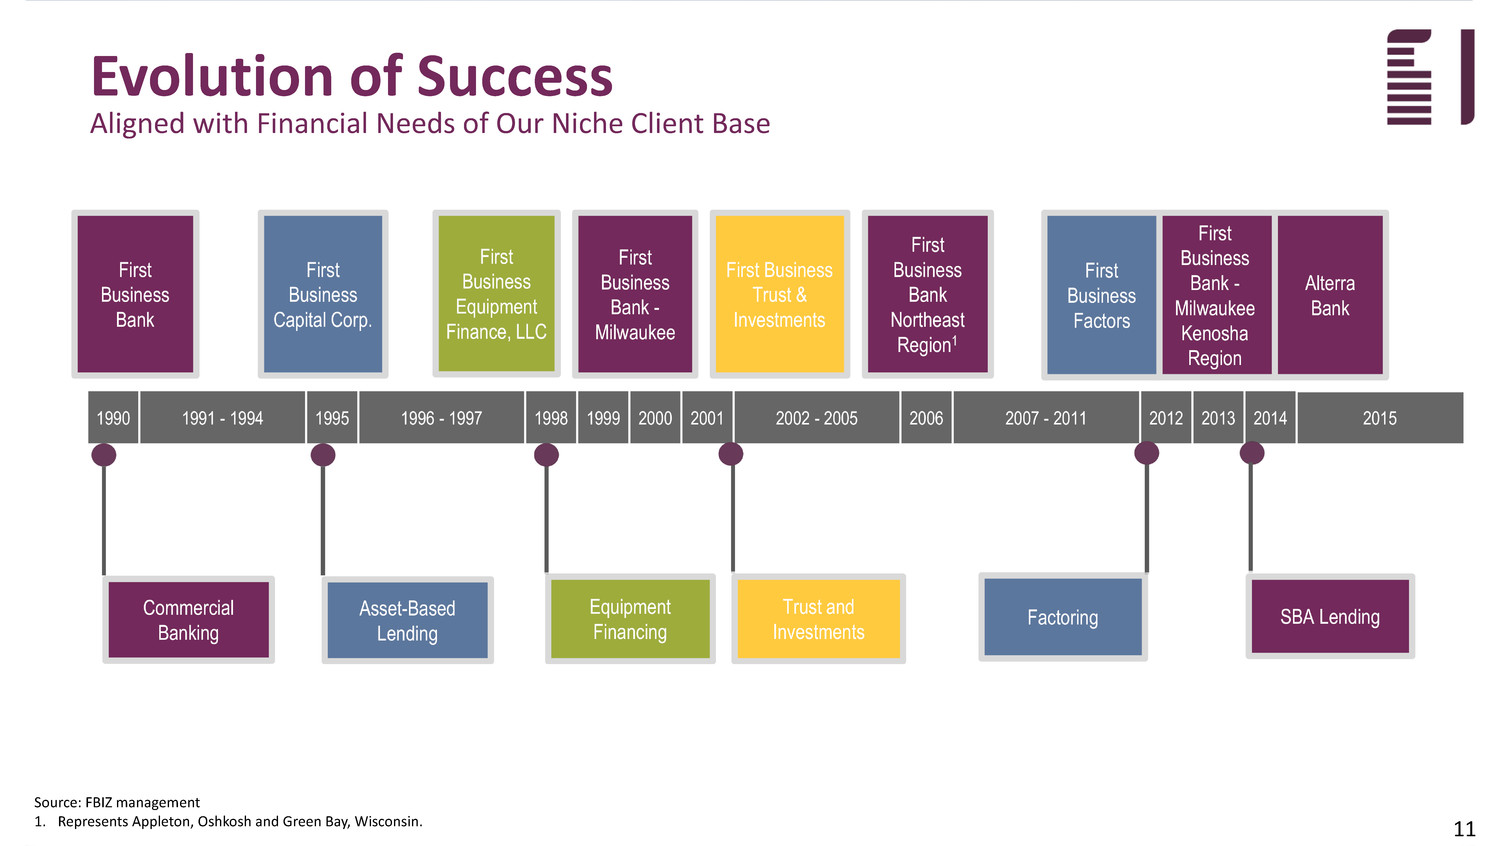
Source: FBIZ management 1. Represents Appleton, Oshkosh and Green Bay, Wisconsin. Evolution of Success Aligned with Financial Needs of Our Niche Client Base Aligned with Financial Needs of Our Niche Client Base 11
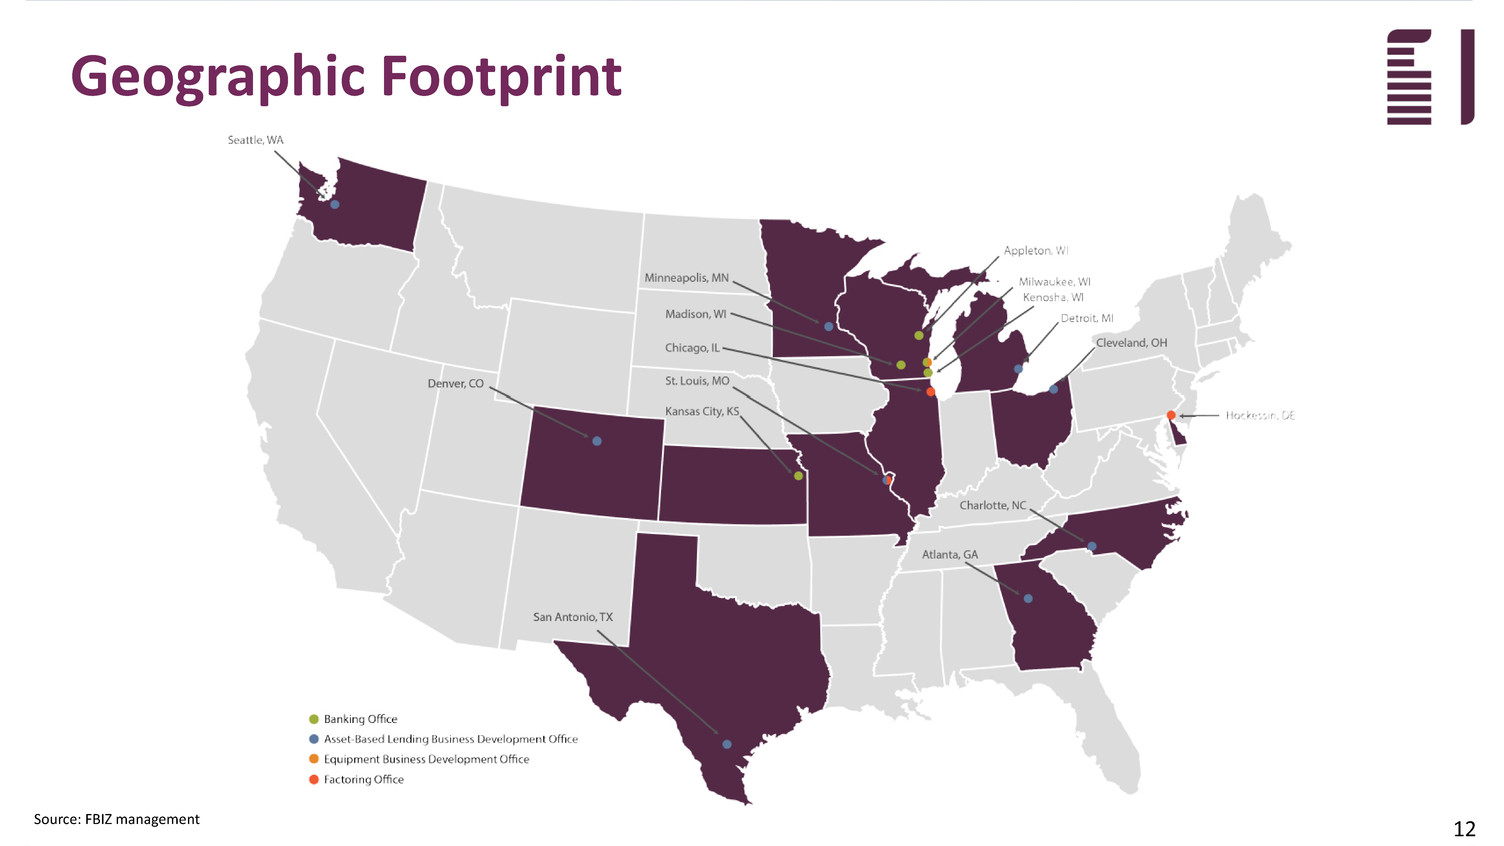
Source: FBIZ management Geographic Footprint 12
RECORD OF STRONG EXECUTION

Record of Strong Execution Key Objectives ACHIEVE • +1% ROA • +12% ROE • ABOVE MARKET GROWTH 14 DRIVE TOP LINE REVENUE GROWTH STRENGTHEN IN-MARKET DEPOSIT MIX GENERATE CONSISTENT, STRONG PROFITABILITY DELIVER EPS GROWTH
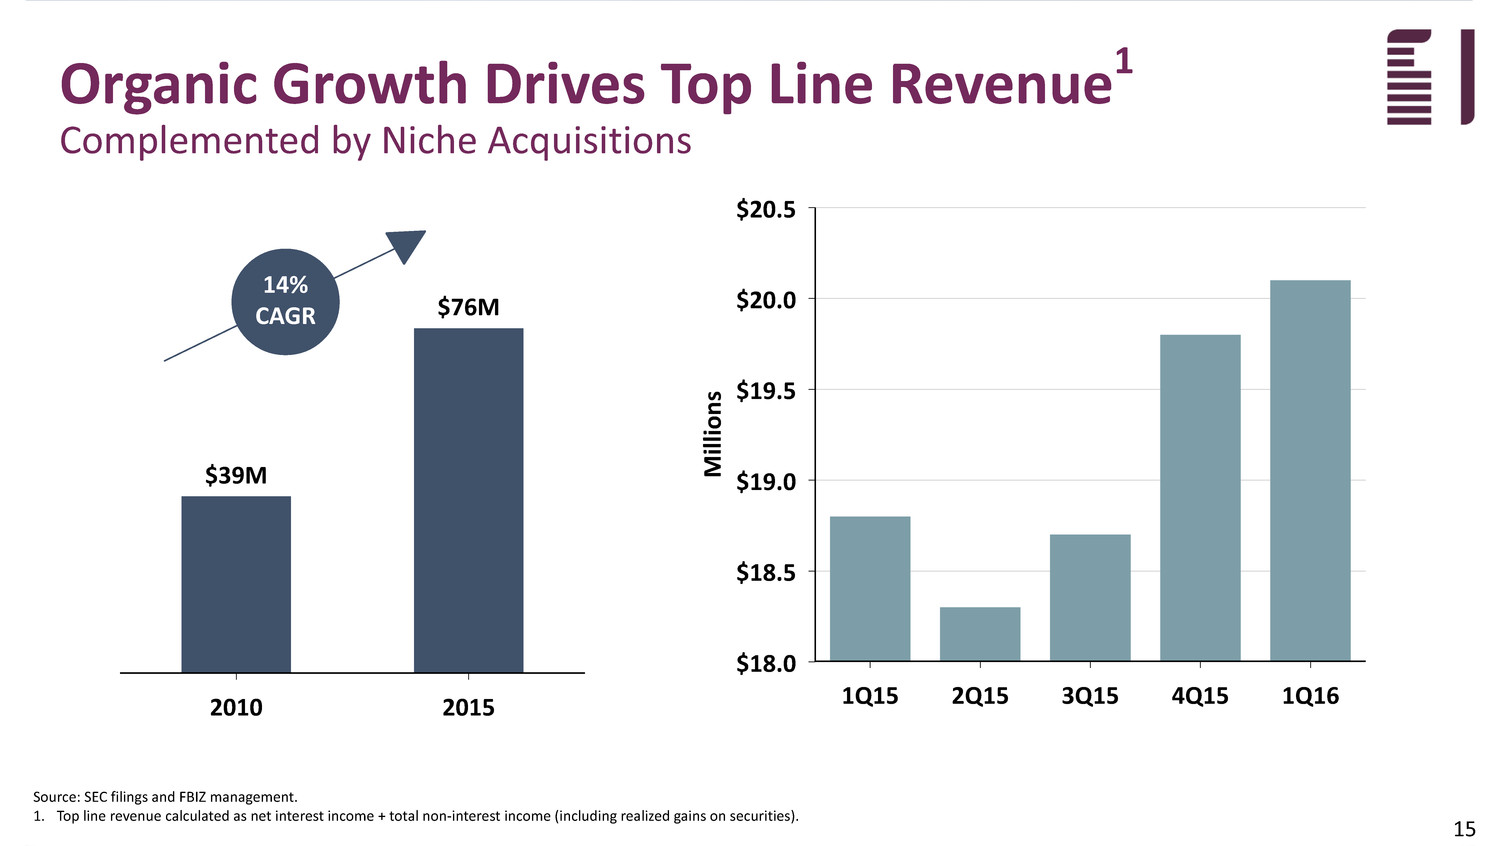
Organic Growth Drives Top Line Revenue1 Complemented by Niche Acquisitions $20.5 $20.0 $19.5 $19.0 $18.5 $18.0 M ill io ns 1Q15 2Q15 3Q15 4Q15 1Q16 Source: SEC filings and FBIZ management. 1. Top line revenue calculated as net interest income + total non-interest income (including realized gains on securities). 2010 2015 $39M $76M 14% CAGR 15

2010 2015 $133M $397M Strengthen In-market Deposit Mix Focus on Transaction Accounts to Reduce Cost of Funds $1,800 $1,500 $1,200 $900 $600 $300 $0 M ill io ns 1.00% 0.80% 0.60% 0.40% 0.20% 0.00% 1Q15 2Q15 3Q15 4Q15 1Q16 Source: SEC filings. Deposit mix represents quarterly average balance data. CAGR is calculated using period-end balances. 1. Transaction accounts include interest-bearing DDA, non-interest-bearing DDA and NOW accounts. 2. Wholesale deposits include brokered deposits and deposits gathered through internet listing services. 3. Non-transaction accounts include in-market CDs and money market accounts. 4. "Cost of Total Deposits" and "Cost of In-Market Deposits" are non-GAAP measures. See appendix for non-GAAP reconciliation schedules. Transaction Accounts1 Non- Transaction Accounts3 NIB Transaction Accounts IB Transaction Accounts ____ Cost of Total Deposits4 24% CAGR ____ Cost of In-Market Deposits4 Wholesale Deposits2 16

Return on Assets Generate Consistent, Strong Profitability Efficient Operating Model Drives Bottom Line 1.20% 1.00% 0.80% 0.60% 0.40% 0.20% 0.00% Re tu rn on As se ts 18.00% 15.00% 12.00% 9.00% 6.00% 3.00% 0.00% Re tu rn on Eq ui ty 1Q15 2Q15 3Q15 4Q15 1Q16 Source: SEC filings and FBIZ management. Return on Equity Goal- - - - - - Goal- - - - - - Net Interest Margin 4.50% 4.25% 4.00% 3.75% 3.50% 3.25% 3.00% 2.75% 2.50% 1Q15 2Q15 3Q15 4Q15 1Q16 Net Interest Margin Goal- - - - - - 17
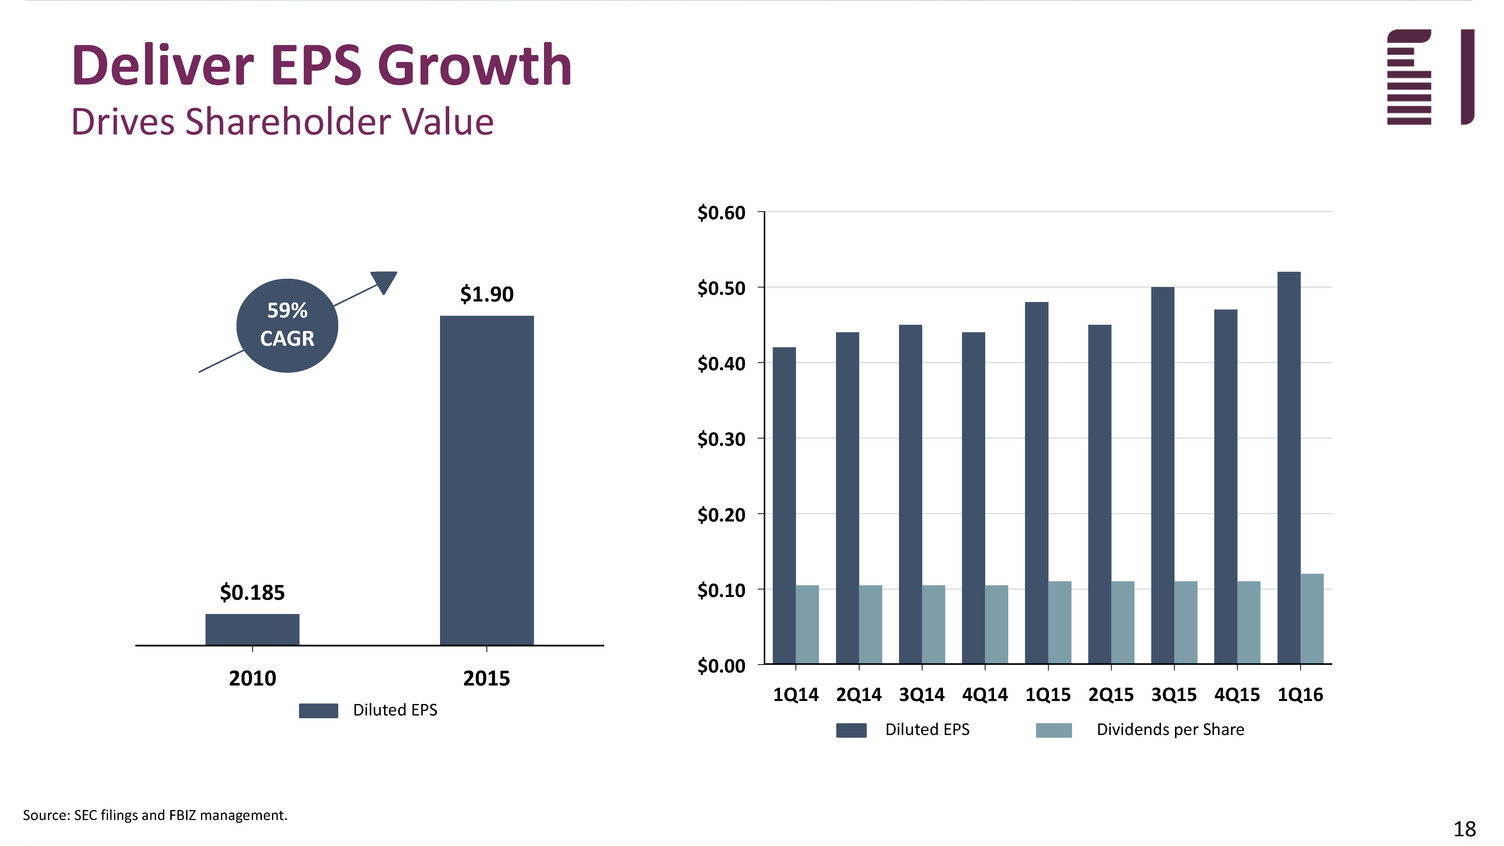
Deliver EPS Growth Drives Shareholder Value $0.60 $0.50 $0.40 $0.30 $0.20 $0.10 $0.00 1Q14 2Q14 3Q14 4Q14 1Q15 2Q15 3Q15 4Q15 1Q16 Source: SEC filings and FBIZ management. 2010 2015 $0.185 $1.90 59% CAGR Diluted EPS Dividends per Share Diluted EPS 18

UNIQUE COMPETITIVE ADVANTAGES

Unique Competitive Advantages Key Themes SUCCESSFUL NICHE COMMUNITY BUSINESS BANK 20 Efficient Operating Model Efficient Funding Strategy Superior Talent with Business Expertise Superior Credit Quality Client-Centric Focus with High Touch Service

FBIZ Efficient Operating Model 62% EFFICIENCY RATIO HIGH EFFICIENCY "BUSINESS BANK" OPERATING MODEL • Limited branch network • Invest in technology • Products tailored to serve businesses and their owners FBIZ All BHCs Total Loans Outstanding per FTE $8,000 $7,000 $6,000 $5,000 $4,000 $3,000 $2,000 $1,000 $0 Th ou sa nd s 4Q14 1Q15 2Q15 3Q15 4Q15 1Q16 Deposits Per Location $700 $600 $500 $400 $300 $200 $100 $0 M ill io ns 2010 2011 2012 2013 2014 2015 Source: SNL Financial and FBIZ management. All BHCs group comprised of all BHCs, excluding FBIZ. "Efficiency Ratio" is a non-GAAP measure. Efficiency ratio is for the period ended 12/31/15 and 03/31/16 for All BHCs and FBIZ, respectively. See the Appendix for non-GAAP reconciliations. All Bank Depositories group comprised of all FDIC-insured banks & thrifts that are required to complete the annual FDIC Summary of Deposits (SOD) survey. Data is from the most recent survey completed as of 06/30/15. All Bank Depositories FBIZ 21 All BHCs 70% EFFICIENCY RATIO

Efficient Funding Strategy Mitigates Interest Rate Risk In-Market Deposits Wholesale Deposits Targeted Operating Range 100% 90% 80% 70% 60% 50% 40% 30% 20% 10% 0% 1Q15 2Q15 3Q15 4Q15 1Q16 Source: SEC filings. Represents quarterly average data. 1. Weighted average original maturity of wholesale deposits outstanding as of March 31, 2016. • Continue to leverage commercial relationships to attract in-market transaction deposits • Maintain wholesale deposits within Board- monitored limits – Match-funding fixed-rate term loans with wholesale deposits locks in interest rate spread – WAOM1 = 4.27 years – Long-term wholesale deposits more reasonably priced than some in-market CD rates – Limited depositor put rights – As of 03/31/16, contingent funding plan utilizing on-balance-sheet liquidity could replace more than two years of wholesale deposit maturities, if necessary – Targeted operating range of in-market deposits to total deposits is 60%-70% ------------------------------------------------------------------------------ ------------------------------------------------------------------------------ 22
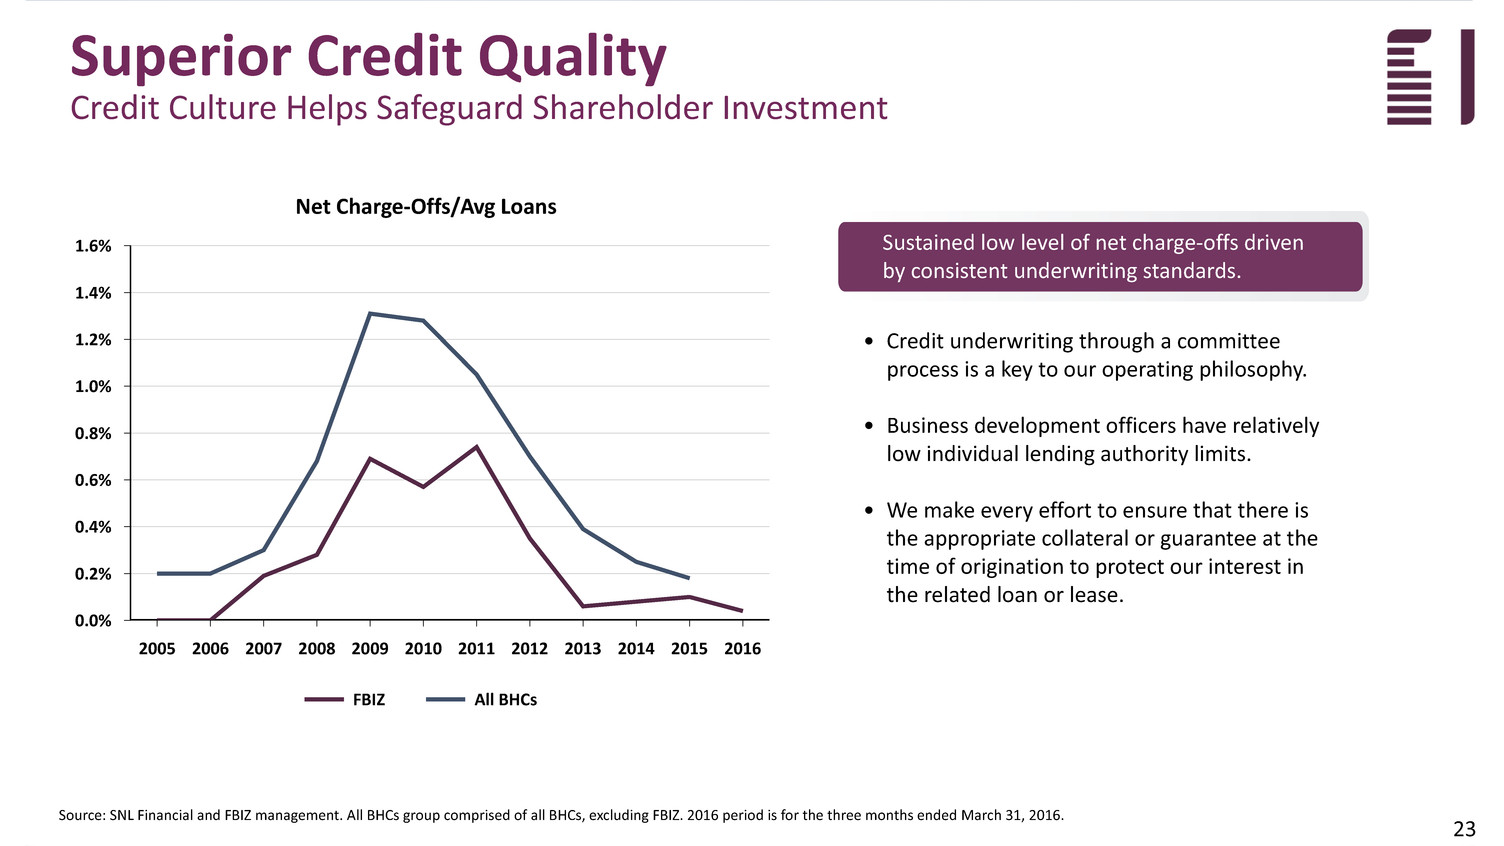
Superior Credit Quality Credit Culture Helps Safeguard Shareholder Investment 23 FBIZ All BHCs NPAs/Total Assets 2.0 1.8 1.6 1.4 1.2 1.0 0.8 0.6 4Q14 1Q15 2Q15 3Q15 4Q15 1Q16 FBIZ All BHCs Loans 30-89 Days Past Due/Total Loans 0.8 0.7 0.6 0.5 0.4 0.3 0.2 0.1 0.0 4Q14 1Q15 2Q15 3Q15 4Q15 1Q16 FBIZ All BHCs Net Charge-Offs/Avg Loans 1.6% 1.4% 1.2% 1.0% 0.8% 0.6% 0.4% 0.2% 0.0% 2005 2006 2007 2008 2009 2010 2011 2012 2013 2014 2015 2016 Source: SNL Financial and FBIZ management. All BHCs group comprised of all BHCs, excluding FBIZ. 2016 period is for the three months ended March 31, 2016. • Credit underwriting through a committee process is a key to our operating philosophy. • Business development officers have relatively low individual lending authority limits. • We make every effort to ensure that there is the appropriate collateral or guarantee at the time of origination to protect our interest in the related loan or lease. Sustained low level of net charge-offs driven by consistent underwriting standards.

Client-Centric Focus with High Touch Service 24

Source: 2015 client satisfaction survey results compiled by Moses Altsech, Ph.D. - Executive Training & Consulting 25 Superior Talent with Business Expertise Engaged Employees = Happy Clients

FOCUSED STRATEGIC OBJECTIVES

Focused Strategic Objectives LONG-TERM FUTURE SUCCESS 27 Opportunistically Invest to Support Organic Growth Complement Organic Growth with Niche Acquisitions Diversify Revenue Streams Increase Fee Income Generating Services

Opportunistically Invest to Support Organic Growth Investing for the Future FOUNDATION FOR SCALABLE FRANCHISE 28 Investments in Technology Investments in Talent Conversion to industry leading CRM in 2015 Leverage BI suite in 2016 to enhance budget/forecast process and create additional operational efficiencies Opportunistically add new local BDOs and evaluate additional lift outs Key operational hires to align support with production hires = COO added April 2016 Expand marketing/sales automation in 2016 Data warehouse/BI implementation in 2015
Complement Organic Growth with Niche Acquisitions ORGANIC GROWTH REMAINS THE FOUNDATION FOR THE FUTURE HOWEVER, OUR SUCCESS CREATES OPPORTUNITIES FOR ACQUISITIONS SPECIALTY FINANCE REGISTERED INVESTMENT ADVISORY FIRMS BUSINESS-FOCUSED COMMUNITY BANKS 29
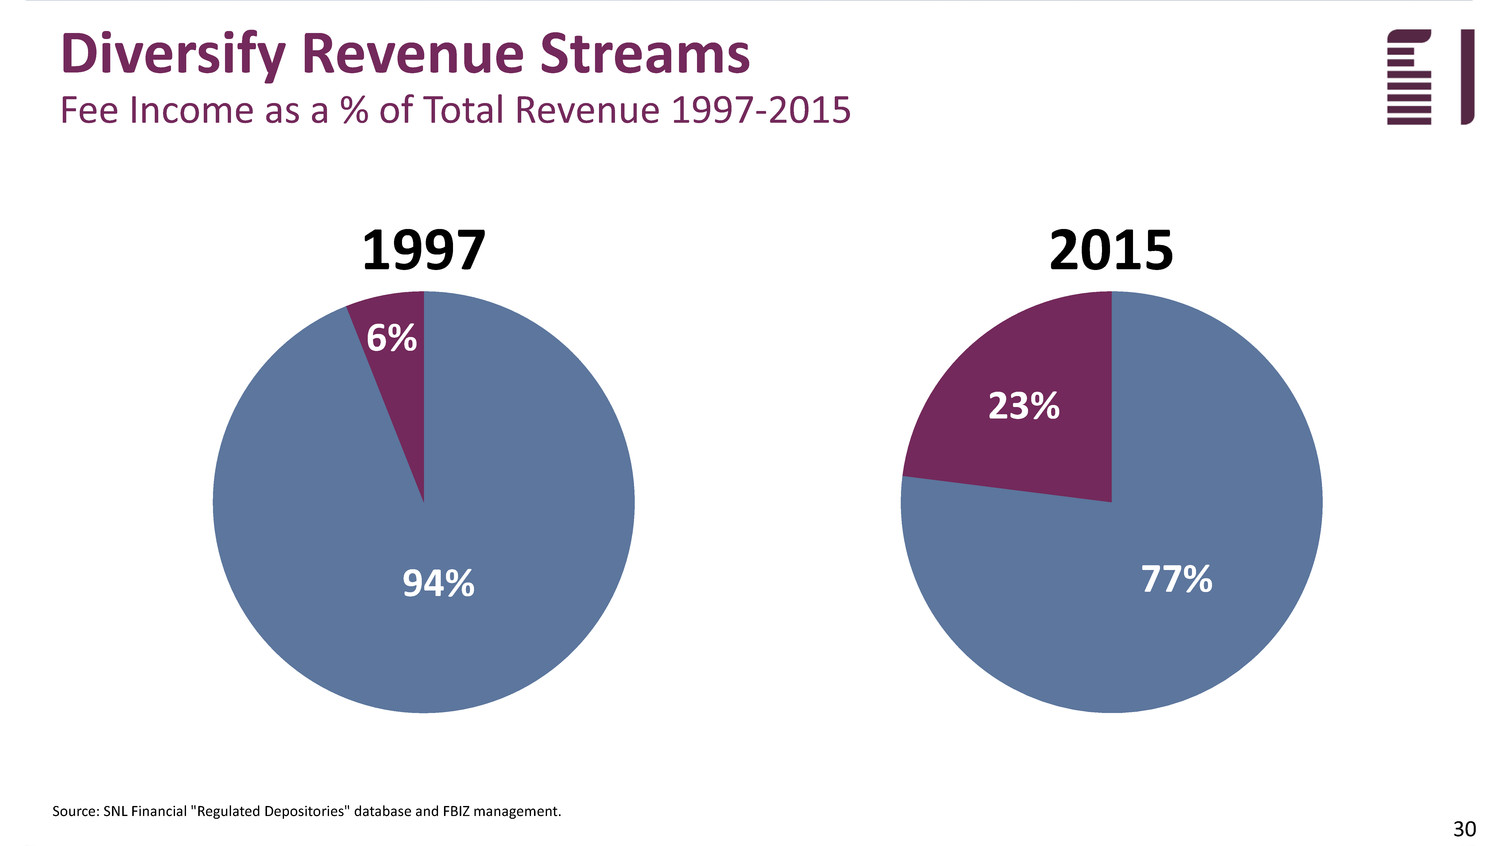
Diversify Revenue Streams Fee Income as a % of Total Revenue 1997-2015 30 1997 94% 6% 2015 77% 23% Source: SNL Financial "Regulated Depositories" database and FBIZ management.
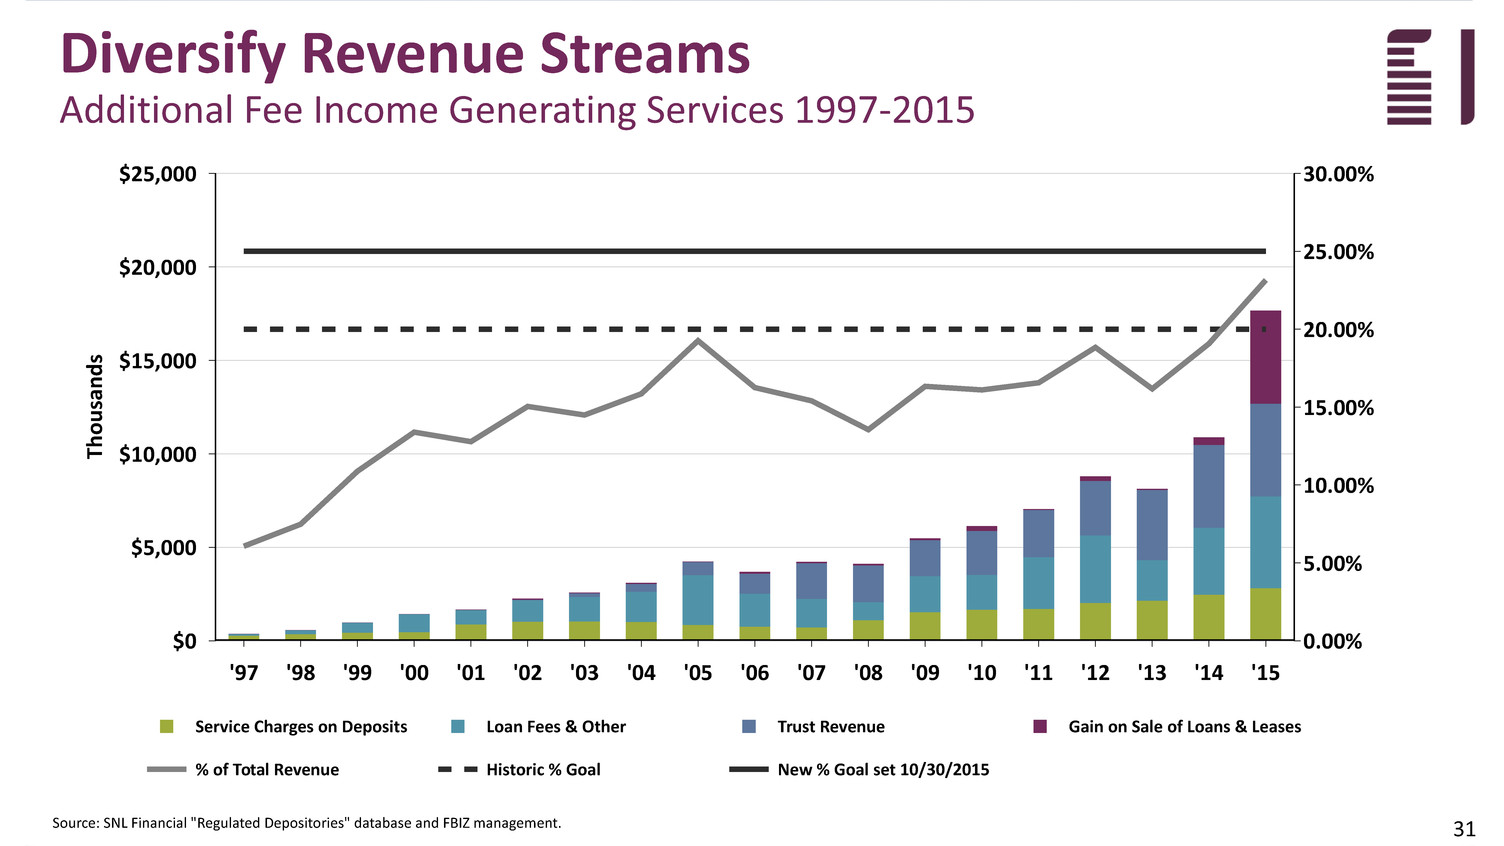
Diversify Revenue Streams Additional Fee Income Generating Services 1997-2015 31 Service Charges on Deposits Loan fees & other Trust Revenue Gain on Sale of Loans & Leases 25,000 20,000 15,000 10,000 5,000 0 $ (M ill io ns ) 1997 1998 1999 2000 2001 2002 2003 2004 2005 2006 2007 2008 2009 2010 2011 2012 2013 2014 2015 Period Ending 1997 73.2% 26.8% 2015 15.9% 27.8% 28.0% 28.2% Service Charges on Deposits Loan Fees & Other Trust Revenue Gain on Sale of Loans & Leases % of Total Revenue Historic % Goal New % Goal set 10/30/2015 $25,000 $20,000 $15,000 $10,000 $5,000 $0 Th ou sa nd s 30.00% 25.00% 20.00% 15.00% 10.00% 5.00% 0.00% '97 '98 '99 '00 '01 '02 '03 '04 '05 '06 '07 '08 '09 '10 '11 '12 '13 '14 '15 Source: SNL Financial "Regulated Depositories" database and FBIZ management.
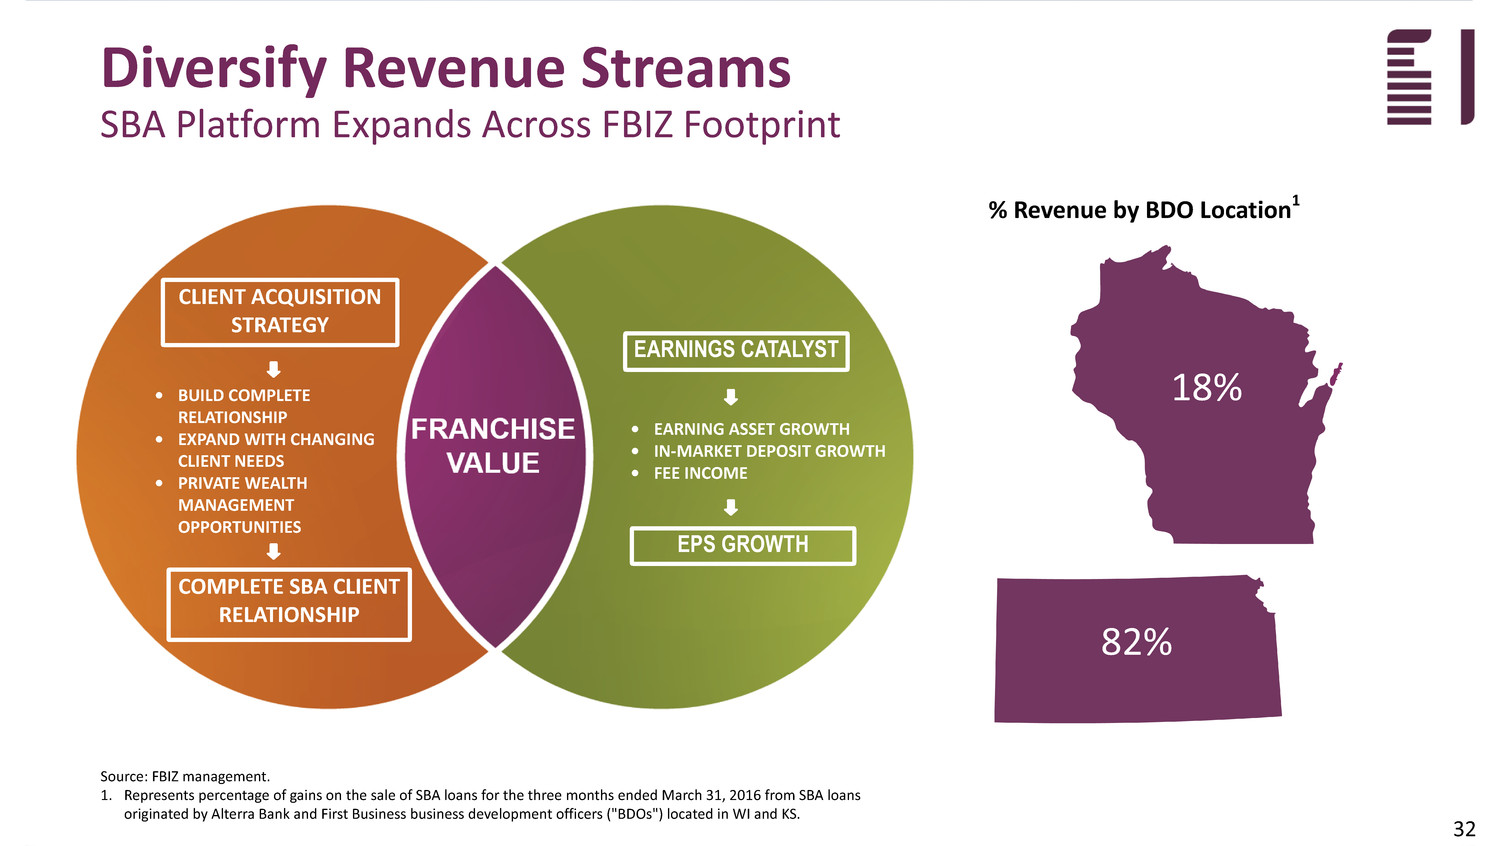
Diversify Revenue Streams SBA Platform Expands Across FBIZ Footprint CLIENT ACQUISITION STRATEGY • EARNING ASSET GROWTH • IN-MARKET DEPOSIT GROWTH • FEE INCOME • BUILD COMPLETE RELATIONSHIP • EXPAND WITH CHANGING CLIENT NEEDS • PRIVATE WEALTH MANAGEMENT OPPORTUNITIES COMPLETE SBA CLIENT RELATIONSHIP EPS GROWTH EARNINGS CATALYST 32 18% 82% % Revenue by BDO Location1 Source: FBIZ management. 1. Represents percentage of gains on the sale of SBA loans for the three months ended March 31, 2016 from SBA loans originated by Alterra Bank and First Business business development officers ("BDOs") located in WI and KS.

Commercial Real Estate - Non-Owner Occupied Commercial and Industrial Commercial Real Estate - Owner Occupied Asset-Based Lending Construction Multi-family Land Development 1-4 Family SBA Direct Financing Leases All Other Loans Factoring Diversify Revenue Streams Loan and Lease Ending Balance Composition as of December 31, 2015 Source: SEC filings and FBIZ management. ($000) December 31, 2015 % of Total Commercial and Industrial $ 257,707 18% Commercial Real Estate - Owner Occupied 167,214 12% Commercial Real Estate - Non-Owner Occupied 434,246 30% Construction 100,625 7% Land Development 59,779 4% Multi-family 80,254 6% 1-4 Family 51,607 4% SBA 51,598 4% Asset-Based Lending 162,676 11% Factoring 12,246 1% Direct Financing Leases 31,093 2% All Other Loans 24,133 2% Total Loans and Leases 1,433,178 100% Deferred Loan Fees 1,062 Total Gross Loans and Leases $ 1,432,116 Commercial Real Estate - Owner Occupied 33
INVESTMENT PERFORMANCE

FBIZ Valuation - Price Appreciation Source: SNL Financial 35
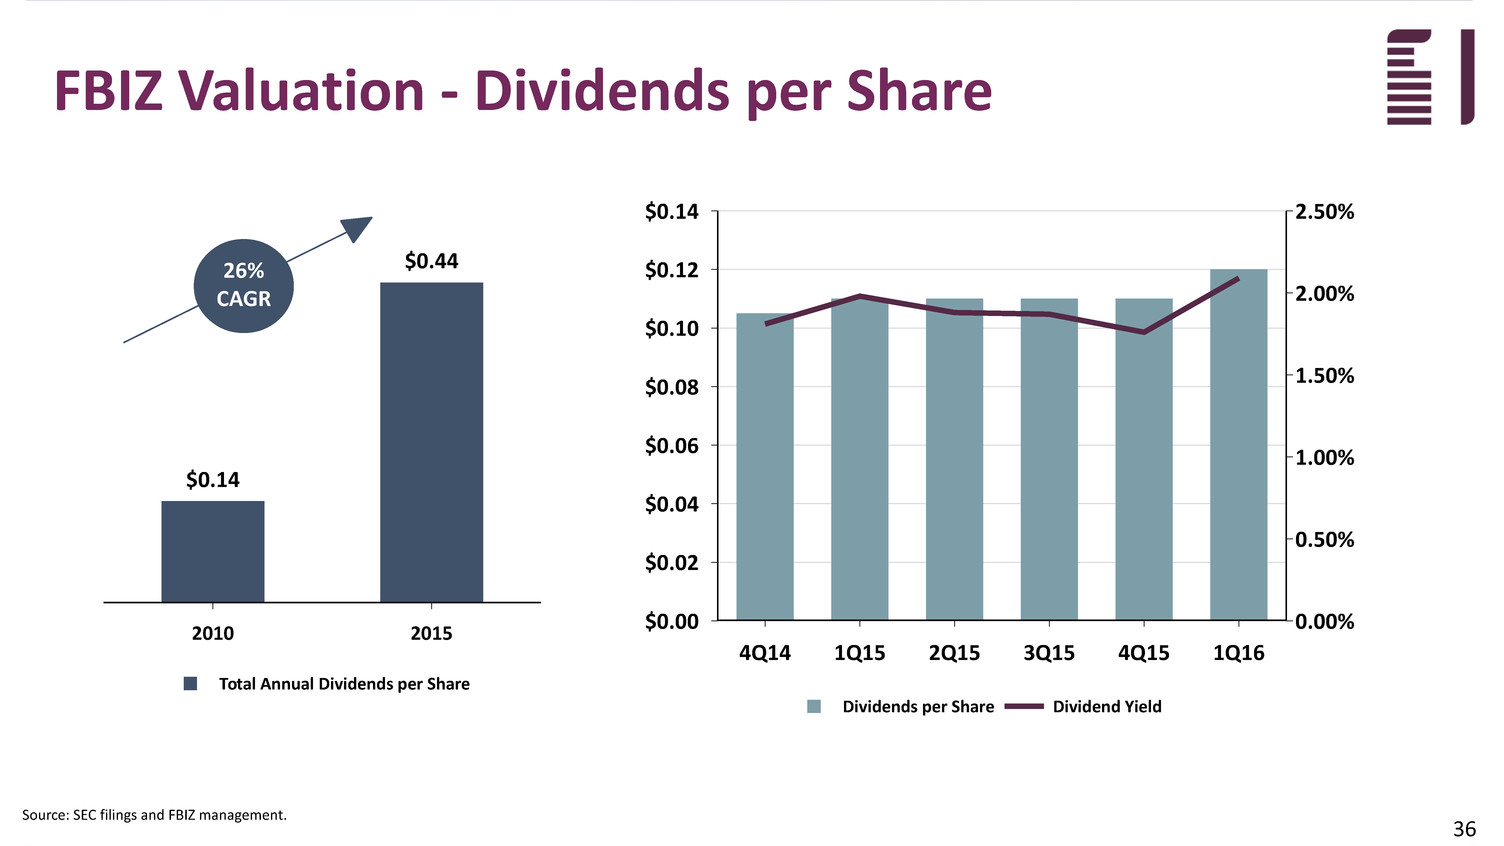
FBIZ Valuation - Dividends per Share Dividends per Share Dividend Yield $0.14 $0.12 $0.10 $0.08 $0.06 $0.04 $0.02 $0.00 2.50% 2.00% 1.50% 1.00% 0.50% 0.00% 4Q14 1Q15 2Q15 3Q15 4Q15 1Q16 Source: SEC filings and FBIZ management. Total Annual Dividends per Share 2010 2015 $0.14 $0.4426% CAGR 36

37 FBIZ Valuation - Original Shareholder Return

38 FBIZ Valuation - Original Shareholder Return Source: FBIZ management. $22.00 investment in 1990 for 1 share of FBIZ stock

39 FBIZ Valuation - Original Shareholder Return Source: FBIZ management. $22.00 investment in 1990 for 1 share of FBIZ stock $23.35 in cash dividends received life-to-date

40 FBIZ Valuation - Original Shareholder Return Source: FBIZ management. $22.00 investment in 1990 for 1 share of FBIZ stock Stock dividends in '97, '99, '01 and '15 = 1 share is now 9.24 shares $23.35 in cash dividends received life-to-date

41 FBIZ Valuation - Original Shareholder Return $22.00 investment in 1990 for 1 share of FBIZ stock Stock dividends in '97, '99, '01 and '15 = 1 share is now 9.24 shares $23.35 in cash dividends received life-to-date 9.24 shares x $23.931 = $221.11 Source: FBIZ management. 1. Represents stock price of $23.93 as of market close on May 12, 2016.

QUESTIONS?
APPENDIX SUPPLEMENTAL DATA & NON-GAAP RECONCILIATIONS
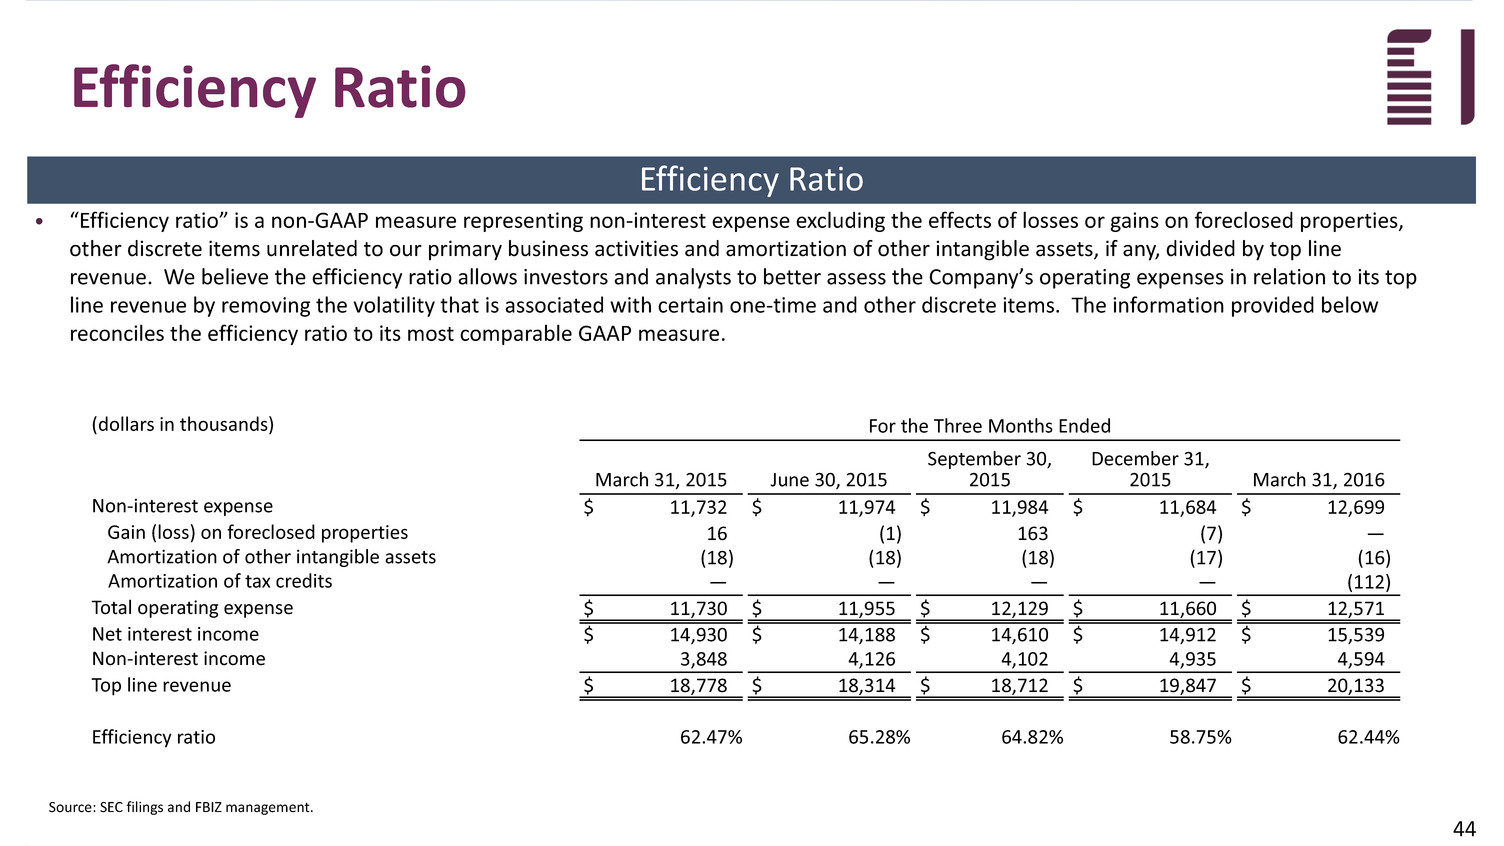
Source: SEC filings and FBIZ management. Efficiency Ratio • “Efficiency ratio” is a non-GAAP measure representing non-interest expense excluding the effects of losses or gains on foreclosed properties, other discrete items unrelated to our primary business activities and amortization of other intangible assets, if any, divided by top line revenue. We believe the efficiency ratio allows investors and analysts to better assess the Company’s operating expenses in relation to its top line revenue by removing the volatility that is associated with certain one-time and other discrete items. The information provided below reconciles the efficiency ratio to its most comparable GAAP measure. (dollars in thousands) Non-interest expense Gain (loss) on foreclosed properties Amortization of other intangible assets Amortization of tax credits Total operating expense Net interest income Non-interest income Top line revenue Efficiency ratio Efficiency Ratio For the Three Months Ended March 31, 2015 June 30, 2015 September 30, 2015 December 31, 2015 March 31, 2016 $ 11,732 $ 11,974 $ 11,984 $ 11,684 $ 12,699 16 (1) 163 (7) — (18) (18) (18) (17) (16) — — — — (112) $ 11,730 $ 11,955 $ 12,129 $ 11,660 $ 12,571 $ 14,930 $ 14,188 $ 14,610 $ 14,912 $ 15,539 3,848 4,126 4,102 4,935 4,594 $ 18,778 $ 18,314 $ 18,712 $ 19,847 $ 20,133 62.47% 65.28% 64.82% 58.75% 62.44% 44

Source: SEC filings and FBIZ management. Cost of Total Deposits • ‘‘Cost of Total Deposits’’ is defined as total interest expense on deposits divided by total average deposits. "Cost of Total In-Market Deposits" is defined as total interest expense on in-market deposits divided by total average in-market deposits. In-market deposits equal total deposits less wholesale deposits. We believe that these measures are important to many investors in the marketplace who are interested in the trends in our deposit funding costs. Deposit Cost (dollars in thousands) For the Three Months Ended March 31, 2015 June 30, 2015 September 30, 2015 December 31, 2015 March 31, 2016 Interest expense on in-market interest-bearing deposits 1,131 1,123 1,117 1,082 1,067 Average in-market interest-bearing deposits 857,576 821,969 828,029 831,093 882,318 Average in-market non-interest-bearing deposits 200,274 205,508 213,712 227,965 228,294 Total average in-market deposits 1,057,850 1,027,477 1,041,741 1,059,058 1,110,612 Cost of total in-market deposits 0.43% 0.44% 0.43% 0.41% 0.38% (dollars in thousands) For the Three Months Ended March 31, 2015 June 30, 2015 September 30, 2015 December 31, 2015 March 31, 2016 Interest expense on total interest-bearing deposits $ 2,569 $ 2,593 $ 2,785 $ 2,930 $ 3,053 Average interest-bearing deposits 1,281,748 1,250,049 1,294,545 1,313,351 1,379,592 Average non-interest-bearing deposits 200,274 205,508 213,712 227,965 228,294 Total average deposits $ 1,482,022 $ 1,455,557 $ 1,508,257 $ 1,541,316 $ 1,607,886 Cost of total deposits 0.69% 0.71% 0.74% 0.76% 0.76% 45

