Attached files
| file | filename |
|---|---|
| 8-K - 8-K - SANFILIPPO JOHN B & SON INC | d182784d8k.htm |
 JBSS
INVESTOR PRESENTATION
May 2016 1 NASDAQ - JBSS Exhibit 99.1 |
 Some
of the statements in this presentation and any statements by management
constitute “forward-looking statements” about John B. Sanfilippo &
Son, Inc. Such statements include, in particular, statements about our
plans, strategies, business prospects, changes and trends in our
business and the markets in which we operate. In some cases, you can
identify forward-looking statements by the use of words such as
“may,” “will,” “could,” “would,”
“should,” “expect,” “plan,” “anticipate,” “intend,” “believe,” “estimate,” “forecast,” “predict,” “propose,” “potential” or “continue” or the
negative of those terms or other comparable terminology. These
statements represent our present expectations or beliefs concerning
future events and are not guarantees. Such statements speak only as of
the date they are made, and we do not undertake any obligation to update
any forward-looking statement. We caution that forward-looking
statements are qualified by important factors, risks and uncertainties
that could cause actual results to differ materially from those in the forward- looking statements. Our periodic reports filed with the Securities and Exchange
Commission, including our Forms 10-K and 10-Q and any amendments thereto,
describe some of these factors, risks and uncertainties.
Forward-Looking Statements
2 |
 • One of the largest nut processors in the world with fiscal 2015 annual net sales in
excess of $887 million
•
State-of-the-art nut processing capabilities, including what we believe is
the single largest nut processing facility in the world
•
A North American market leader in every major selling channel – from consumer and commercial ingredient customers to contract manufacturing customers • Dual consumer strategy of branded nut and dried fruit programs (Fisher, Orchard
Valley Harvest) as well as private brands • Commodity procurement expertise with buyers averaging over 20+ years experience • A category leader in packaging and product innovation • Vertically integrated nut processing operation for pecans, peanuts and walnuts 3 Who is JBSS? |
 We Are Experts In Every Nut Type
% of total gross sales
* Other consists of trail and snack mixes
which include nut products
Full assortment of nut types
Full variety of value-added products
Wide variety of dried fruit and other
snack products
Customized, unique product formulas
Fiscal Year 2015
23.4% 12.7% 12.0% 13.7% 11.0% 22.0% 5.2% ALMOND PECAN SNACK AND TRAIL MIXES PEANUT WALNUT CASHEW &MIXED NUT ALL OTHER 4 |
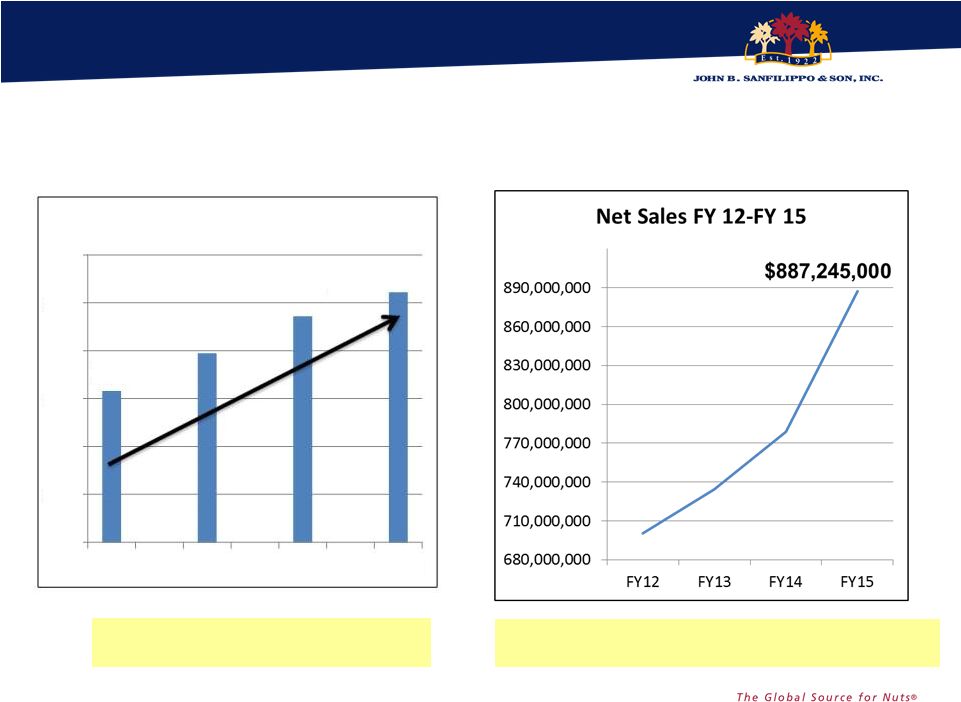 Consistent success over past 4 fiscal years
Diluted EPS improvement of 65% from
FY12 to FY15 5 Net Sales increased by 27% over FY14 to a record $887.2 million $ $ 1.58 1.98 2.36 2.61 0 0.5 1 1.5 2 2.5 3 FY12 FY13 FY14 FY15 Diluted EPS FY 12-FY 15 |
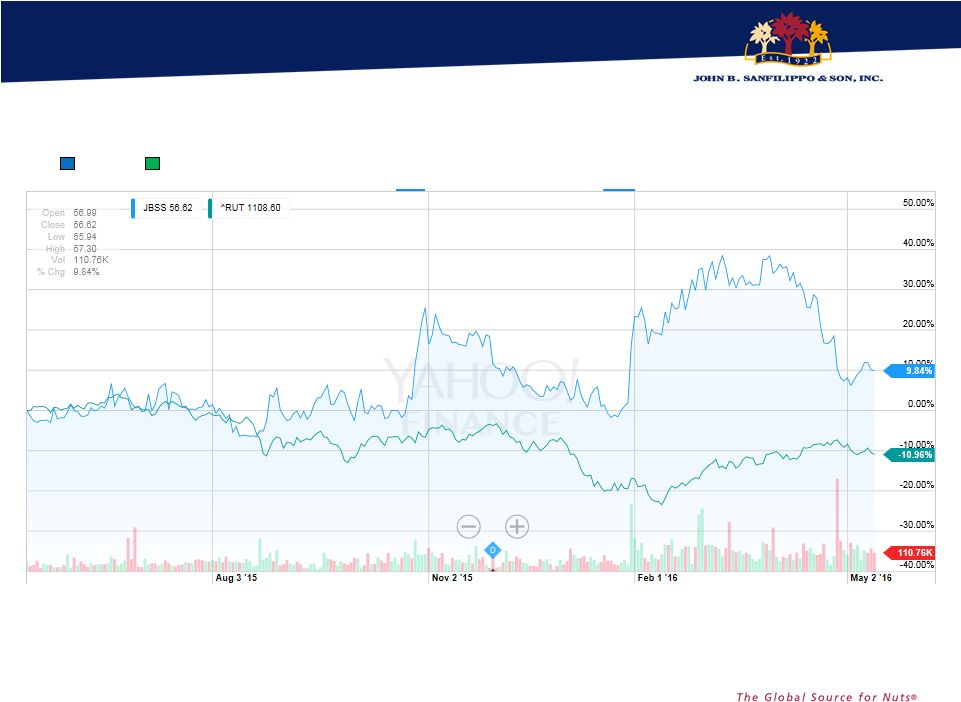 Continuing to Create Shareholder Value
6 Outperformed the Russell 2000 Index by over 20%! JBSS Russell 2000 Stock Price $50.03 05/13/2015 Stock Price $56.62 05/12/2016 |
 Vision To be the global source for nuts, committed to quality, expertise and innovation that delivers an unmatched experience to our customer and consumer Core Values Integrity People Investment Customer Driven Quality Innovation Execution Continuous Improvement Safety Resource Conservation 7 |
 FY 2015 Strategy Update
8 |
 9 |
 Fisher recipe nuts increased market share by +2.2 points*. Fisher snack nuts market share growth in high franchise Midwest. Orchard Valley Harvest expanded
distribution and increased velocity resulting in
double- digit revenue growth over FY 2014.
FY 2015 Accomplishments
10 *Source: IRI: Total Nut Category – Multi Outlet Geography Fiscal Year Ending 6/28/15 |
 11 Leveraged our innovation capabilities to launch 15 new items for our key contract manufacturing customers. Optimized Food Service and Industrial ingredient customer and product portfolios. Expanded Fisher brand awareness in the Commercial Ingredients channel. FY 2015 Accomplishments |
 12 Nut Category Review |
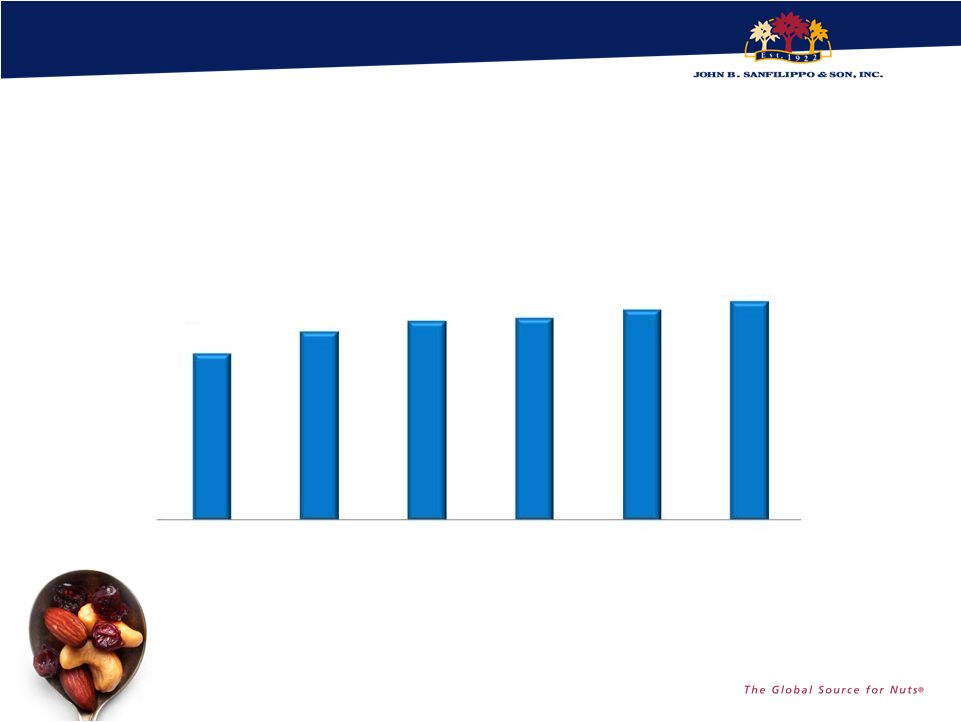 Steady
Increase in Nut Retail Prices Since FY 2011
Time Periods: to FY 11 Year Ending 7/3/11 to FY 2016 YTD Q3 data ending
3/27/16 13
+32% Since FY 2011 $4.63 $5.24 $5.54 $5.62 $5.85 $6.09 FY 2011 FY 2012 FY 2013 FY 2014 FY 2015 FY 2016 YTD Q3 Price Per Pound Source: IRI: Total Nut Category – Multi Outlet Geography |
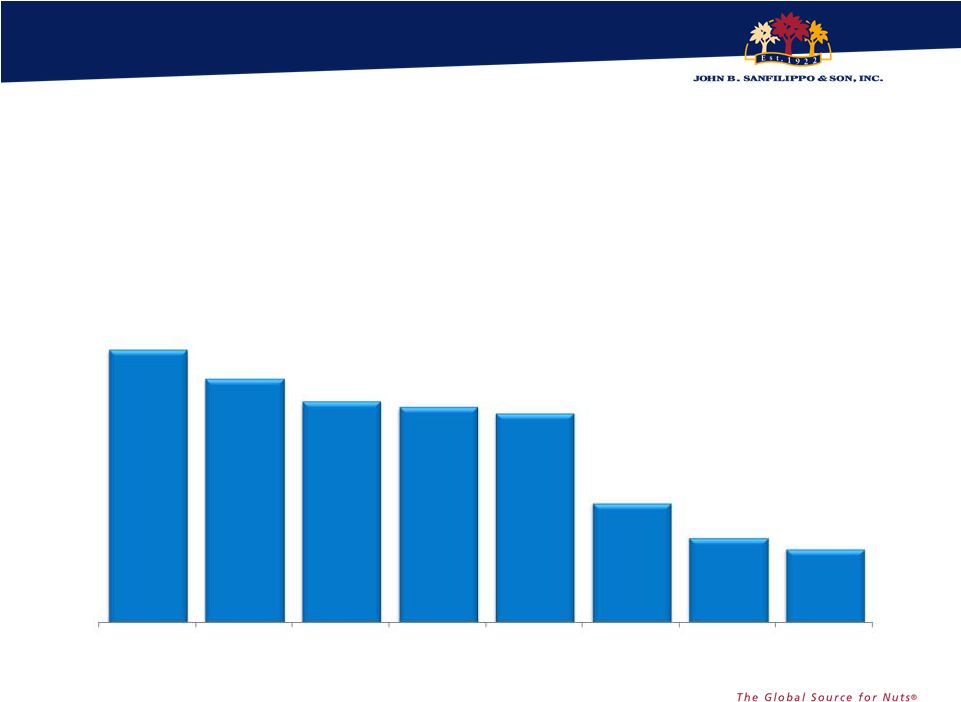 Retail
Prices Up Across Most Major Nut Types over the Last 4 Years
14 48.0% 43.0% 39.0% 38.0% 37.0% 21.0% 15.0% 13.0% % Increase in Price Per Pound Over the Past 4 Years ALMOND PISTACHIO MIXED NUTS CASHEW WALNUT MACADAMIA NUT PEANUT PECAN Source: IRI: Total Nut Category – Multi Outlet Geography Time Periods: to FY 11 Year Ending 7/3/11 to FY 2016 YTD Q3 data ending 3/27/16
|
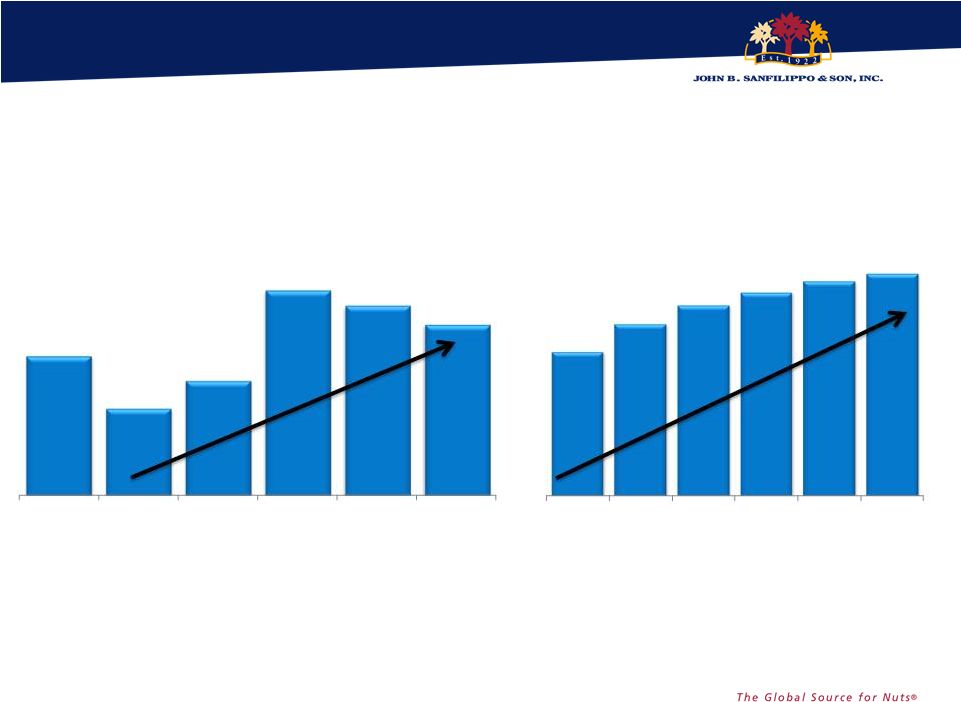 Steady
Category Growth 15
4,749 5,284 5,636 5,885 6,092 6,248 FY 2011 FY 2012 FY 2013 FY 2014 FY 2015 52 Wks Ending 3/27/16 Category $ Sales (M) 1,025 1,008 1,017 1,046 1,041 1,035 FY 2011 FY 2012 FY 2013 FY 2014 FY 2015 52 Wks Ending 3/27/16 Category Pound Sales (M) Source: IRI: Total Nut Category – Multi Outlet Geography Time Periods: to FY 11 Year Ending 7/3/11 to 52 weeks Ending 3/27/16 |
 JBSS
Sales Channel Updates
16 |
 $529 Fiscal 2015 Net Sales $887 Million Business Channel Diversification (Millions of $) $36 $207 $115 Commercial Ingredients 23% Contract Pkg. 13% Consumer 60% Export 4% 17 |
 Fiscal 2015 Net Sales $529 Million Consumer 60% vs. FY ‘14 FY 2015 Consumer Channel 16.7% 18 |
 Fiscal 2015 Net Sales $207 Million FY 2015 Commercial Ingredients Channel vs. FY ‘14 19 Commercial Ingredients 23% 7.3% |
 FY 2015
Contract Packaging Channel Fiscal 2015 Net Sales $115
Million 20
17.0% vs. FY '14 Contract Packaging 13% |
 FY 2015
Export Channel Fiscal 2015 Net Sales $36
Million 21
Export 4% 6.0% vs. FY ‘14 |
 FY 2015
Financial Milestones
22 |
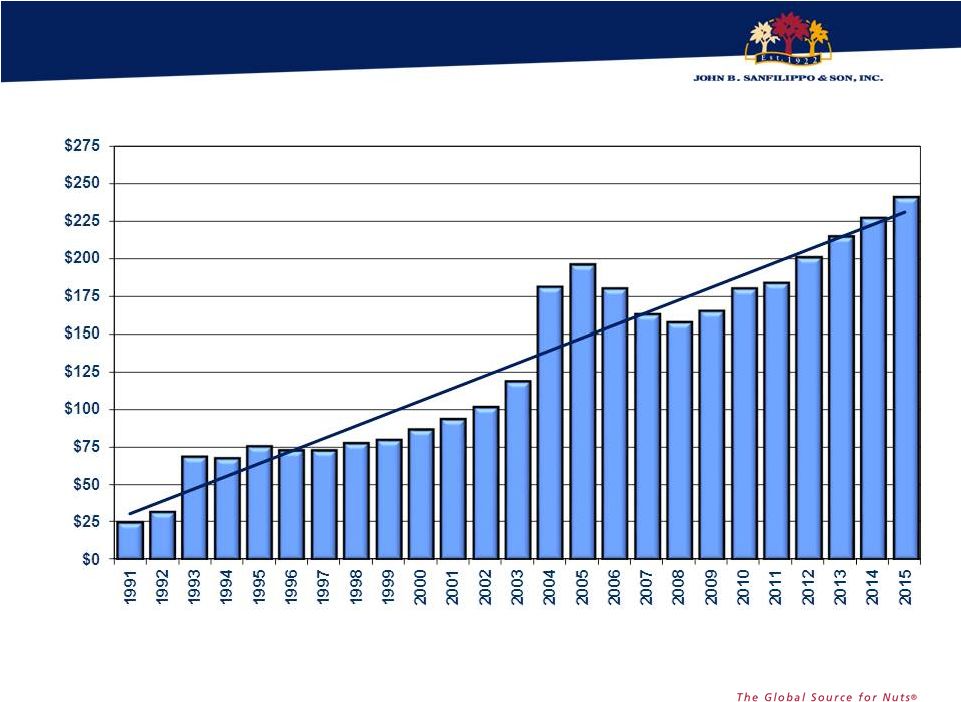 JBSS Stockholders’ Equity FYs 1991- 2015 23 In millions of $ |
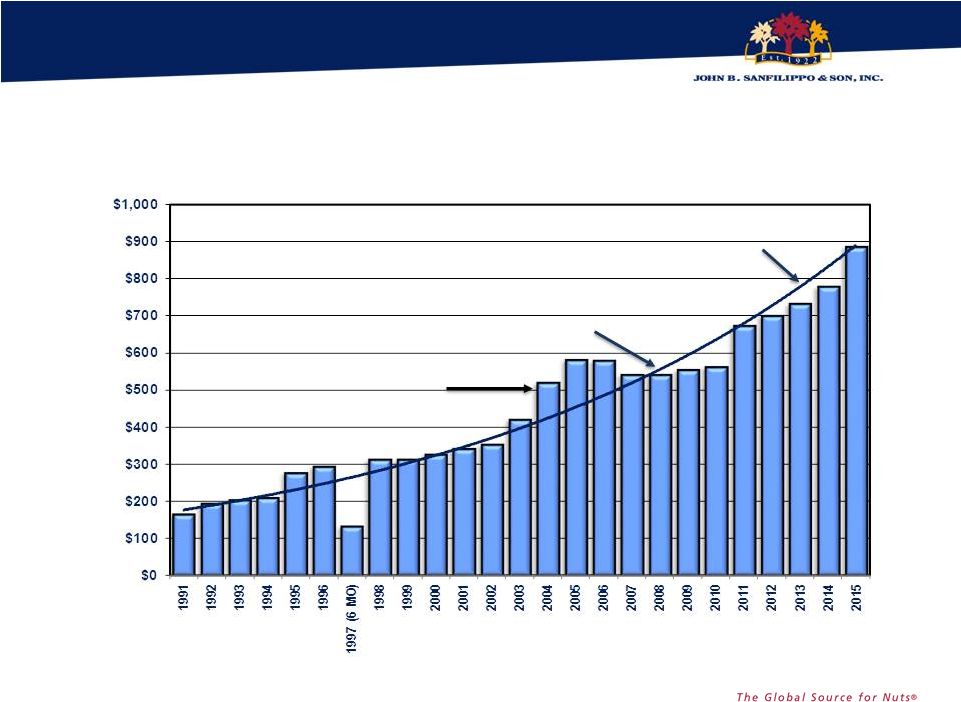 JBSS Net Sales FYs 1991- 2015 24 Increased pound volume and prices De-emphasized Industrial Sales, Lower Prices Low Carb Diet Run Up $887 million In millions of $ |
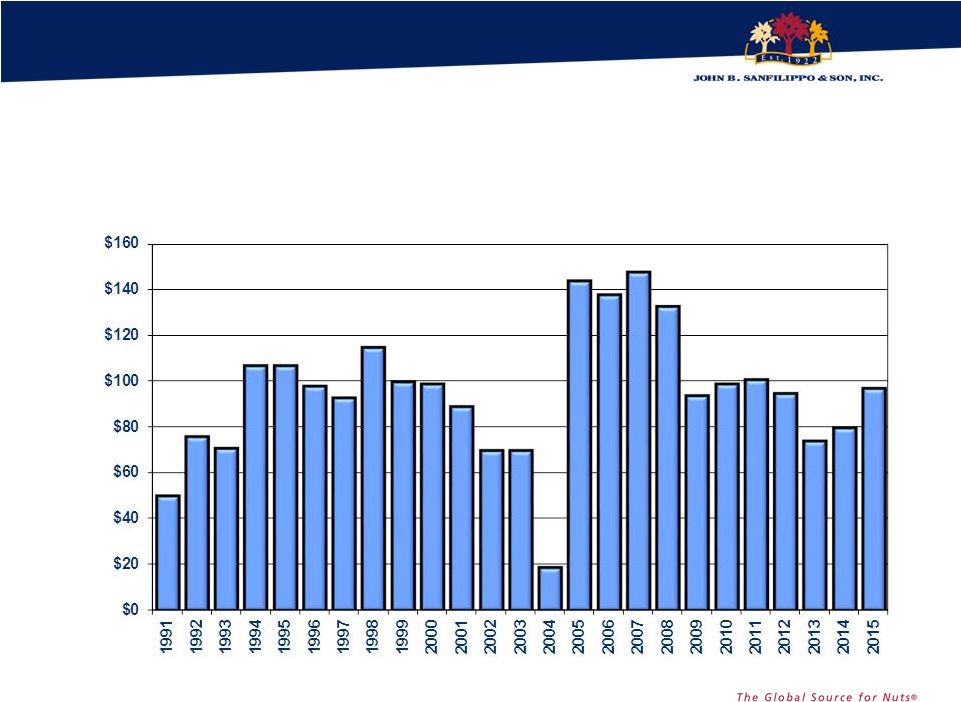 JBSS
Total Outstanding Debt FYs 1991- 2015
25 In millions of $ |
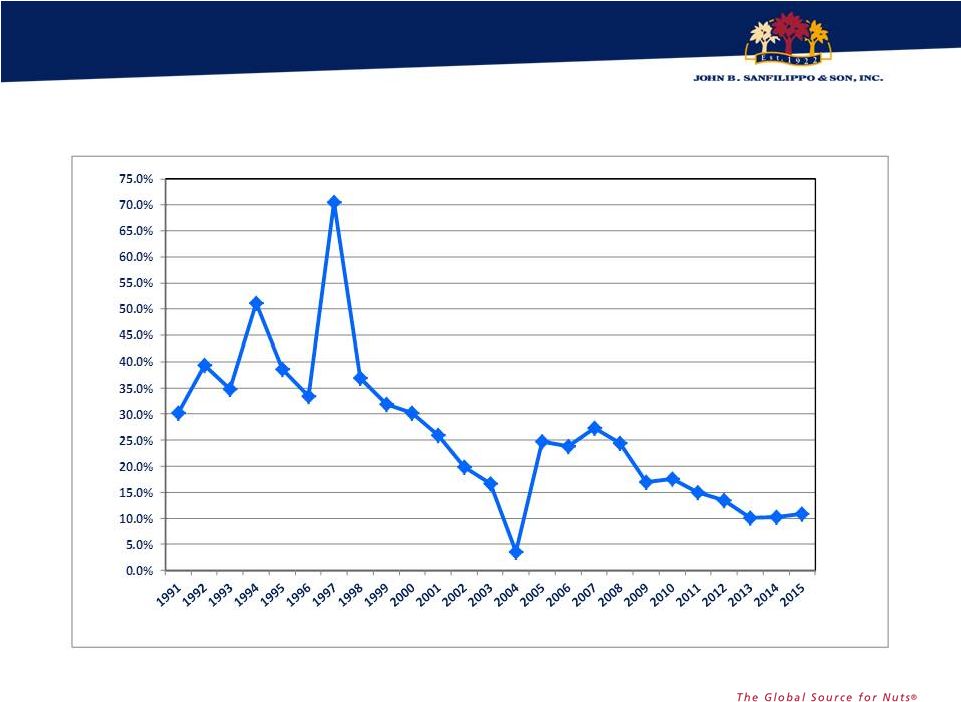 JBSS
Total Outstanding Debt As % of Net Sales FYs 1991 –
2015 26 |
 EBITDA EBITDA consists of earnings before interest, taxes, depreciation, amortization and noncontrolling interest. EBITDA is not a measurement of financial performance under accounting principles generally accepted in the United States of America ("GAAP"), and does not represent cash flow from operations. EBITDA is presented solely as a supplemental disclosure because management believes that it is important in evaluating JBSS's financial performance and market valuation. In conformity with Regulation G, a reconciliation of EBITDA to the most directly comparable financial measures calculated and presented in accordance with GAAP is presented in the following slide. 27 |
 Reconciliation of Net Income (Loss) to EBITDA
(In $,000's) FY2005 FY2006 FY2007 FY2008 FY2009 FY2010 FY2011 FY2012 FY2013 FY2014 FY2015 NET INCOME (LOSS) 14,499 (16,721) (13,577) (5,957) 6,917 14,425 2,835 17,122 21,760 26,287 29,305 INTEREST EXPENSE 3,998 6,516 9,347 10,502 7,646 5,653 6,444 5,364 4,754 4,354 3,966 INCOME TAX (BENEFIT) EXPENSE 9,269 (8,689) (7,520) (897) (259) 8,447 (49) 9,099 13,536 13,545 15,559 DEPRECIATION/ AMORTIZATION 10,501 10,000 13,584 15,742 15,922 15,825 16,968 17,117 16,717 16,278 16,284 EBITDA 38,267 (8,894) 1,834 19,390 30,226 44,350 26,198 48,702 56,767 60,464 65,114 NET SALES 581,729 579,564 540,858 541,771 553,846 561,633 674,212 700,575 734,334 778,622 887,245 EBITDA MARGIN (% OF NET SALES) 6.6% -1.5% 0.3% 3.6% 5.5% 7.9% 3.9% 7.0% 7.7% 7.8% 7.3% POUNDS SOLD (000’s) 278,741 248,137 246,142 221,958 217,465 224,302 232,746 212,553 221,762 240,417 253,514 EBITDA PER POUND SOLD 0.137 (0.036) 0.007 0.087 0.139 0.198 0.113 0.229 0.256 0.252 0.257 28 |
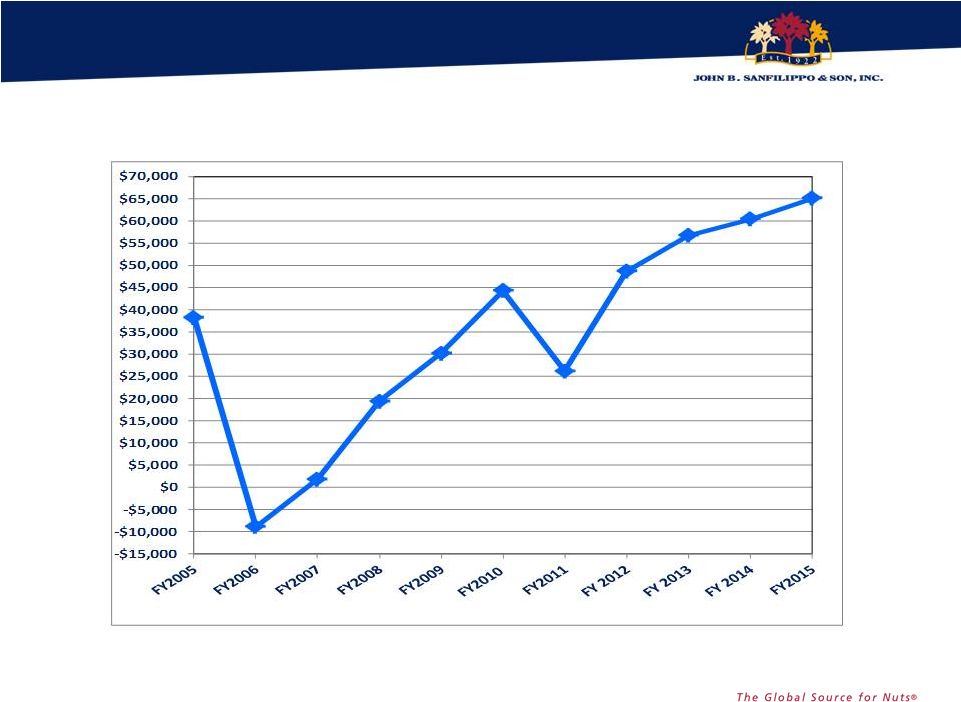 EBITDA* * EBITDA is a non-GAAP measure. See slide entitled “Reconciliation of Net Income (Loss) to EBITDA” for
reconciliation to GAAP measure
29 |
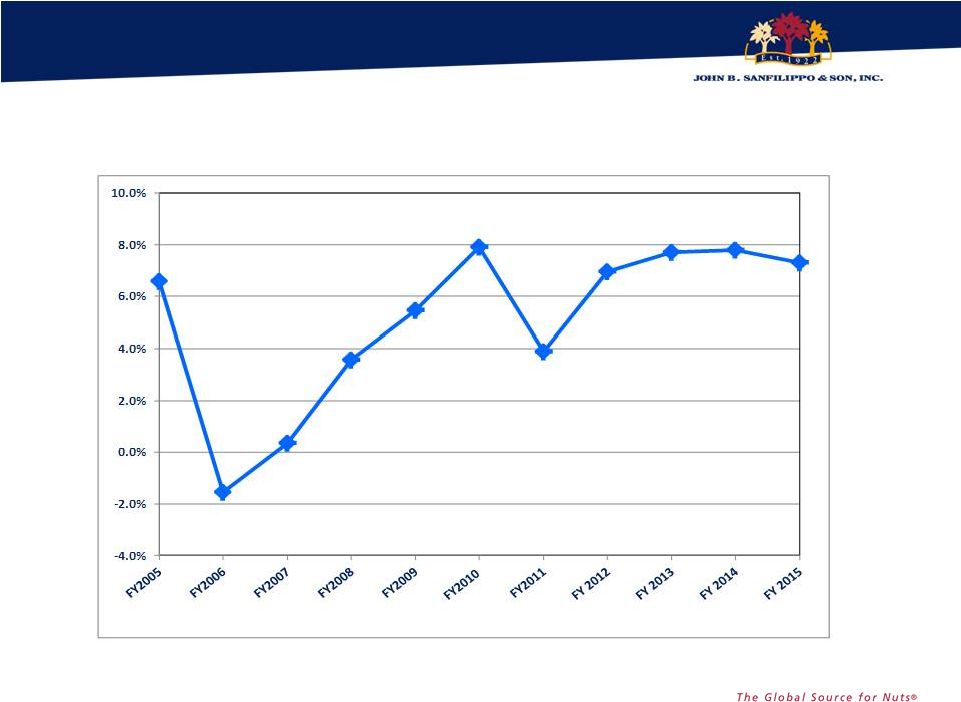 EBITDA*
Margin (% of Net Sales) * EBITDA is a non-GAAP measure. See
slide entitled “Reconciliation of Net Income (Loss) to EBITDA” for reconciliation to GAAP measure 30 |
 31 |
 Highlights: Q3 2016 vs. Q3 2015
(in $000’s except EPS)
32 $ CHANGE % CHANGE NET SALES $6,346 3.0% SALES VOLUME (LBS.) 3,583 6.0% GROSS PROFIT $4,196 14.1% NET INCOME $3,440 52.8% EARNINGS PER SHARE $0.31 53.4% OPERATING CASH FLOWS $5,540 11.9% TOTAL DEBT $22,850 20.6% |
 Highlights: Q3 YTD 2016 vs. Q3 YTD 2015
(in $000’s except EPS)
33 $ CHANGE % CHANGE NET SALES $54,715 8.2% SALES VOLUME (LBS.) 10,100 5.3% GROSS PROFIT $6,093 6.2% NET INCOME $2,282 11.0% EARNINGS PER SHARE $0.18 9.7% OPERATING CASH FLOWS $49,459 > 100% TOTAL DEBT $22,850 20.6% |
 FY 2015
Brand Marketing Overview
34 |
 Recipe
Nuts Snack Nuts
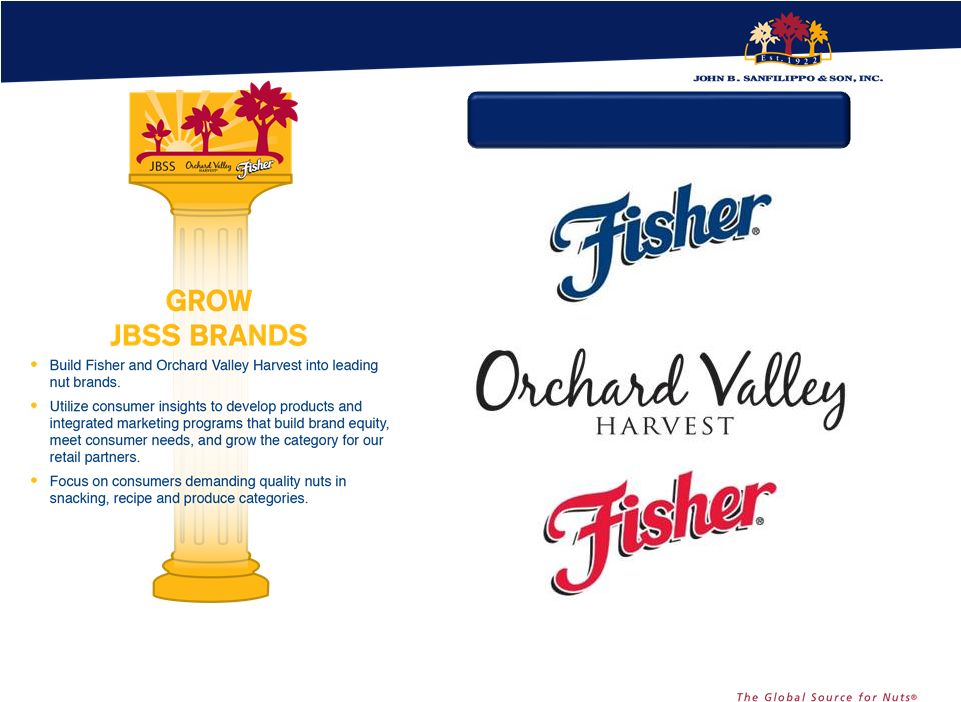
Grow Brands 35 |
 Strong
Growth on the Fisher brand in FY15 Total Fisher Brand Growth FY15
vs. FY14 +8%
+14% Recipe Nuts Snack Nuts POUND SALES DOLLAR SALES 36 Source: JBSS shipment data |
 Recipe
Nuts 37 |
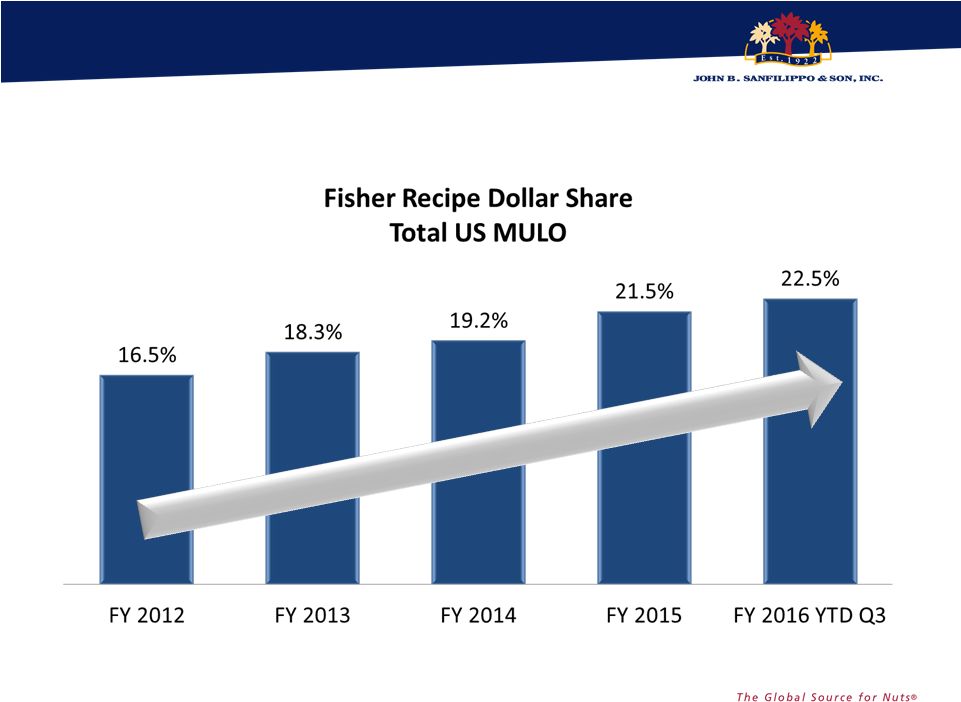 Fisher Recipe has Grown Market
Share 38 Source: IRI: Total Recipe Nut Category – Multi Outlet Geography – FY 2016 YTD Q3 Data Ending 3/27/16 |
 Strong, Sustained Growth for Fisher Recipe for
4+ Fiscal Years
39 Source: IRI: Total Recipe Nut Category – Multi Outlet Geography – FY 2016 YTD Q3 Data Ending 3/27/16 9.7% 20.5% 12.8% 15.4% 9.1% FY 2012 FY 2013 FY 2014 FY 2015 FY 2016 YTD Q3 Fisher Recipe Dollar Sales % Change vs. Previous Year Total US MULO |
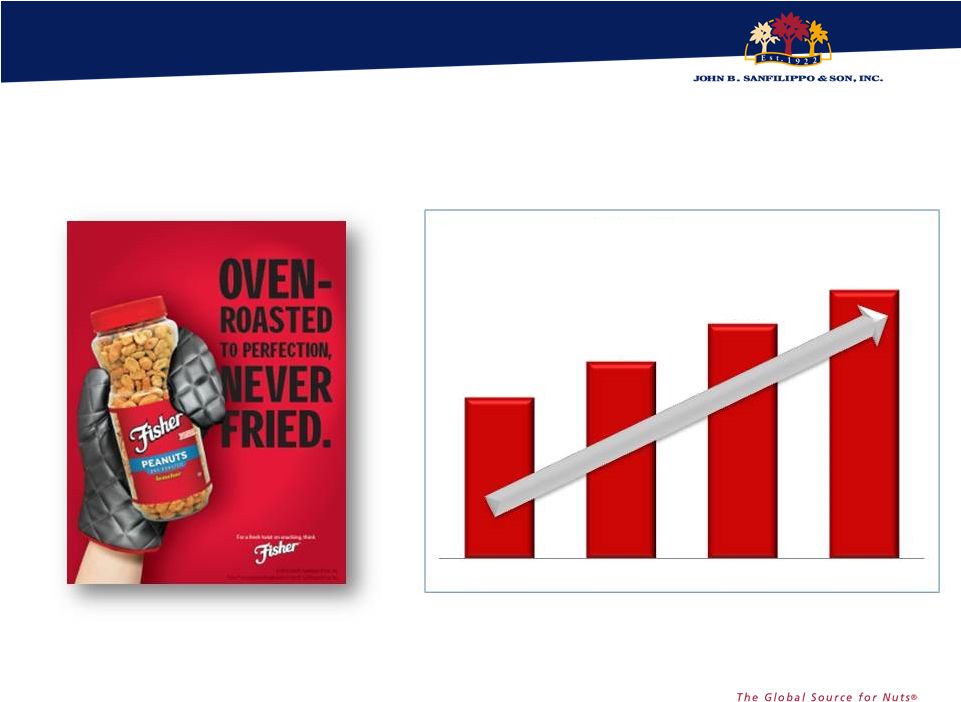
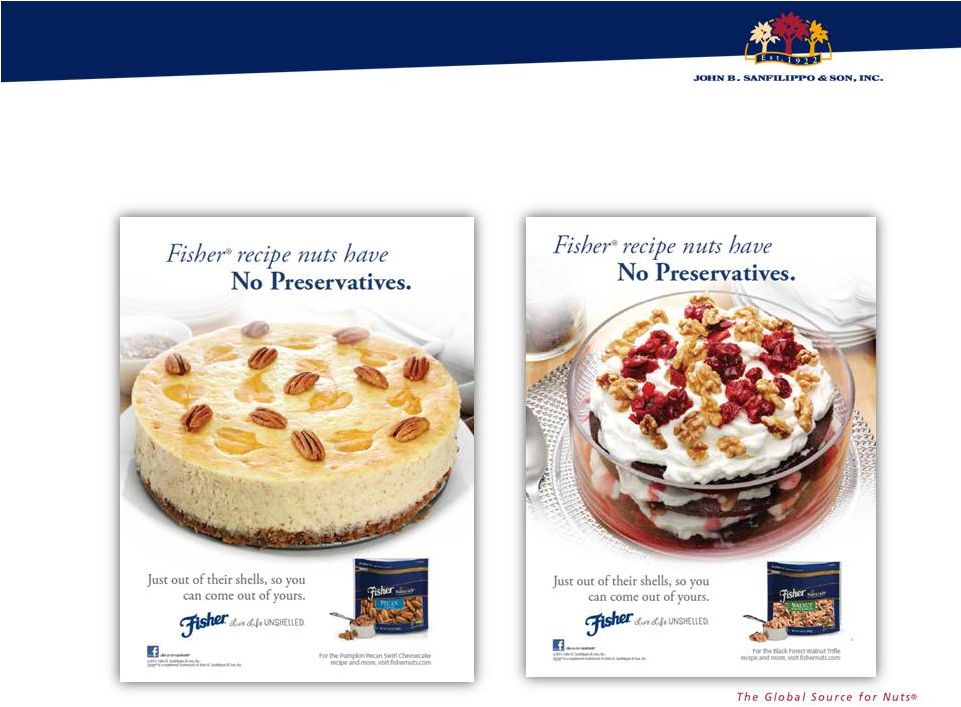 “No Preservatives” Message Key Driver
for Share Growth 40 |
 Continue
to Build Fisher Brand Equity with Food Network Sponsorship
41 |
 Integrated Marketing Key to
Building Brand Equity 42 Website Social Media Public Relations Food Network Email |
 Building
Brand Presence and Equity “Away From
Home” 43
Merchandised Foodservice Location |
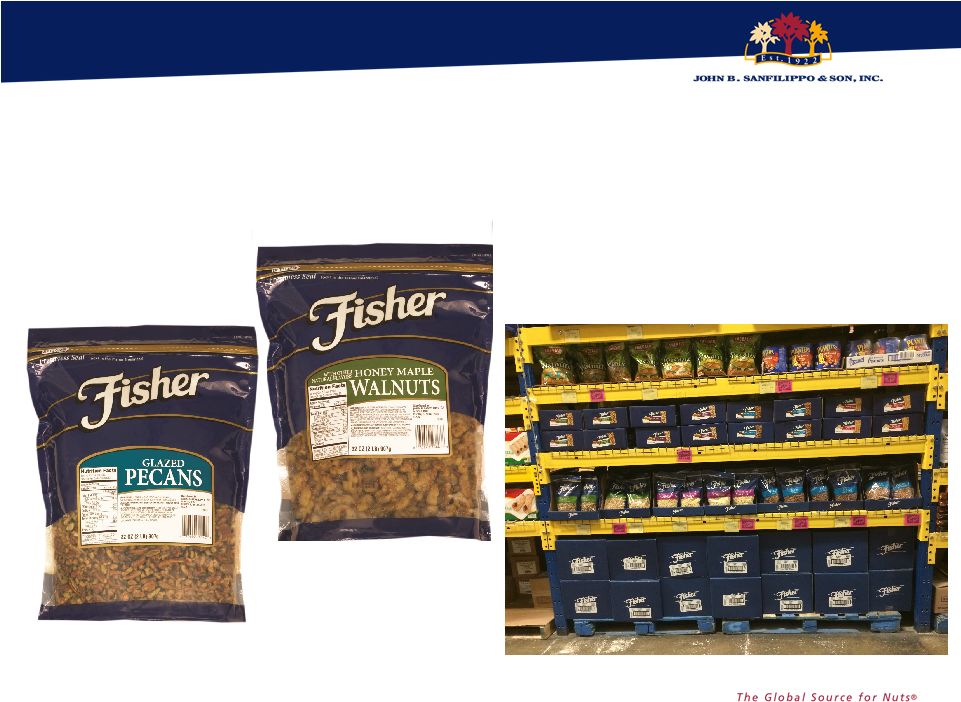
 Snack
Nuts 44 |
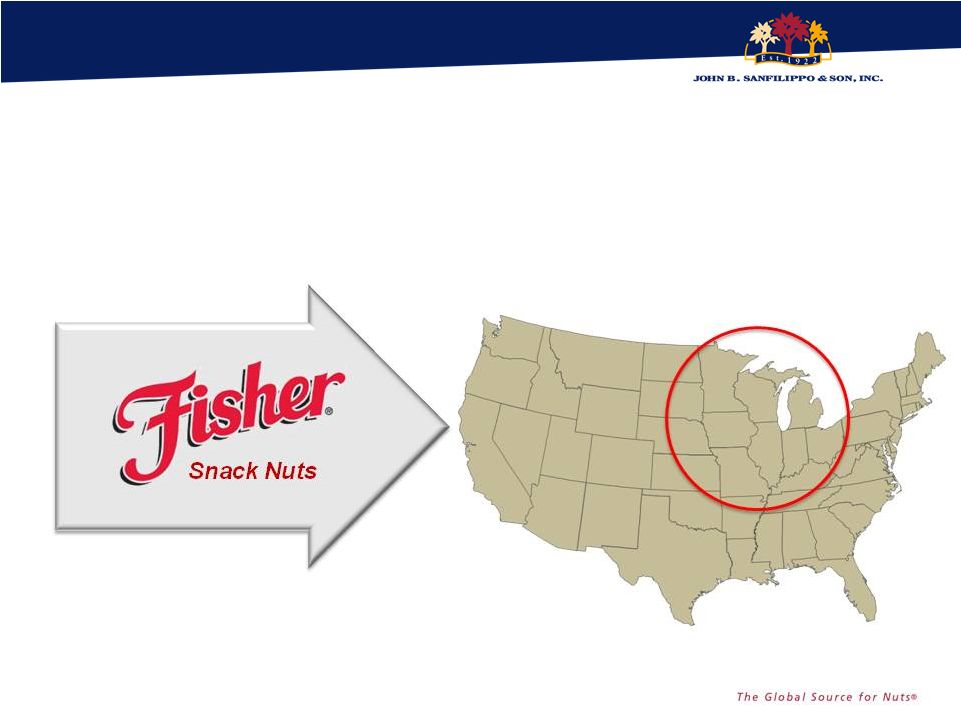 Fisher
Snack Nut Strategy Focuses on Midwest High Franchise Markets
45 |
 We Are
Growing our Pound Share in High Franchise Markets
46 2.2% 3.1% 3.5% 4.0% 4.7% FY 2012 FY 2013 FY 2014 FY 2015 FY 2016 YTD Q3 Fisher Snack Nuts Pound Share (High Franchise Markets) Snack Nuts Source: IRI: Total Snack Nut Category – Core Franchise (Minneapolis, Milwaukee, Chicago and St. Louis
Multi Outlet Geography – FY 2016 YTD Q3 Data Ending 3/27/16 |
 Driving
Results on our Core Dry Roast Peanut Business
47 535,681 652,052 777,756 888,805 FY2013 FY2014 FY2015 CY 2015 Pound Sales – Fisher Dry Roast Peanuts Source: IRI: Total Snack Nut Category – Core Geography MULO Chicago,
Milwaukee, Minneapolis, and St. Louis – Calendar 2015 Ending
12/27/15 |
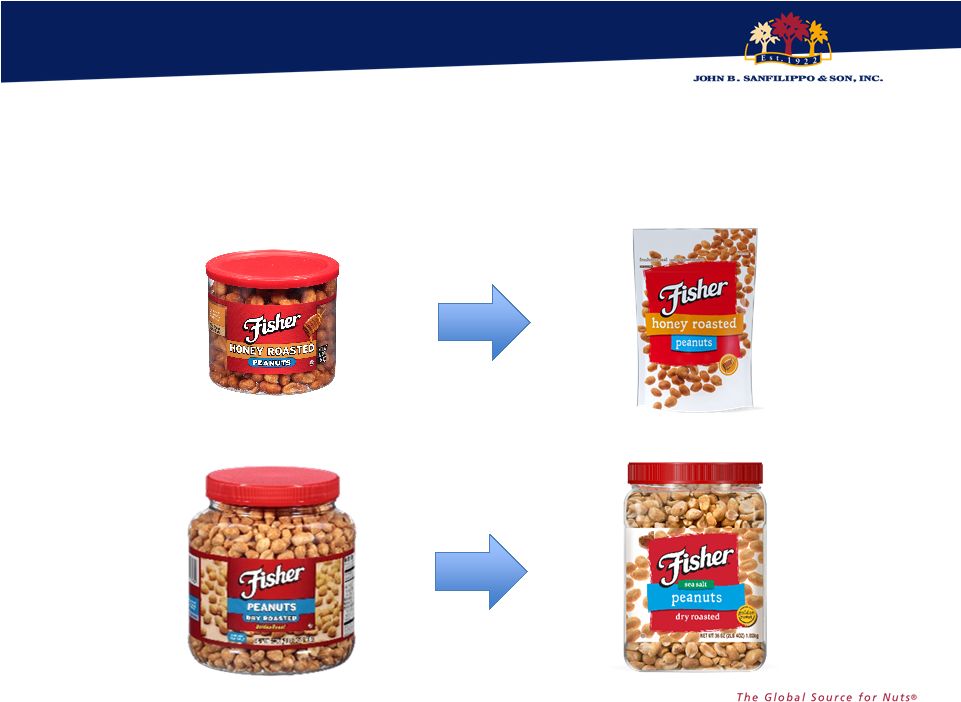 New Look
for Fisher Snack Nuts 48 |
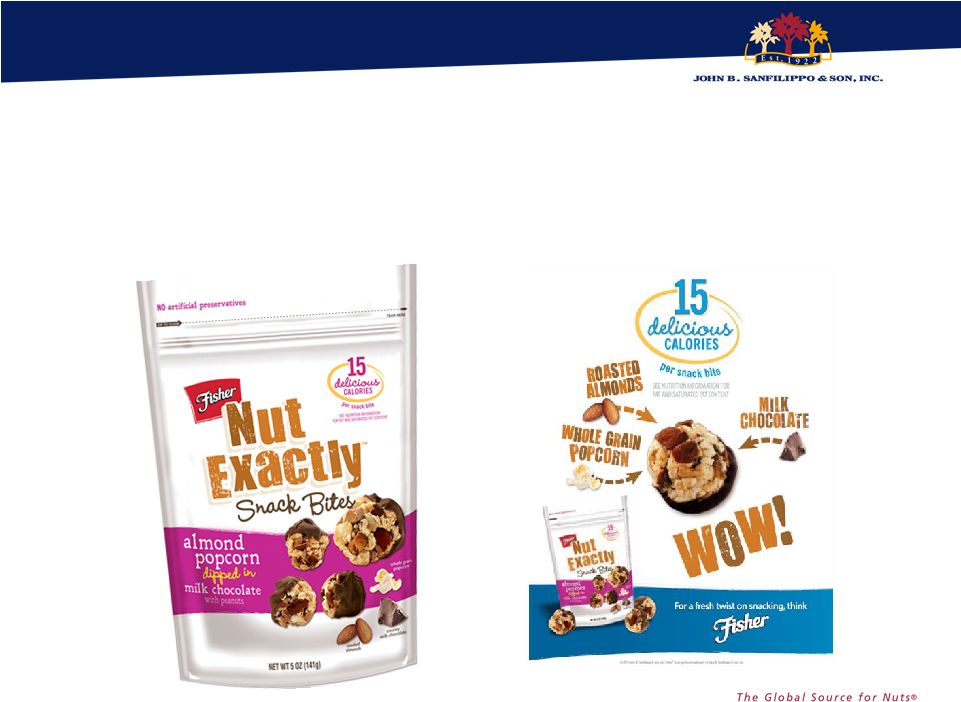 A Snack
Bite Combining Consumer Favorites
49 |
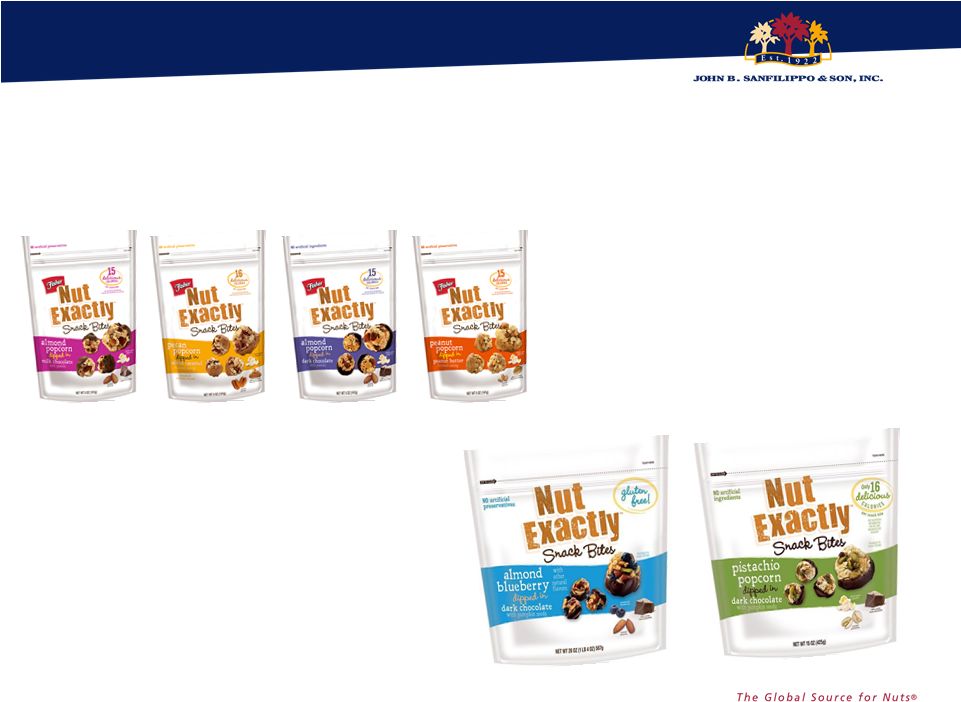 Introducing Fisher Nut Exactly
50 4 Great Popcorn Varieties for Grocery Channel Unique Varieties for the Club Channel |
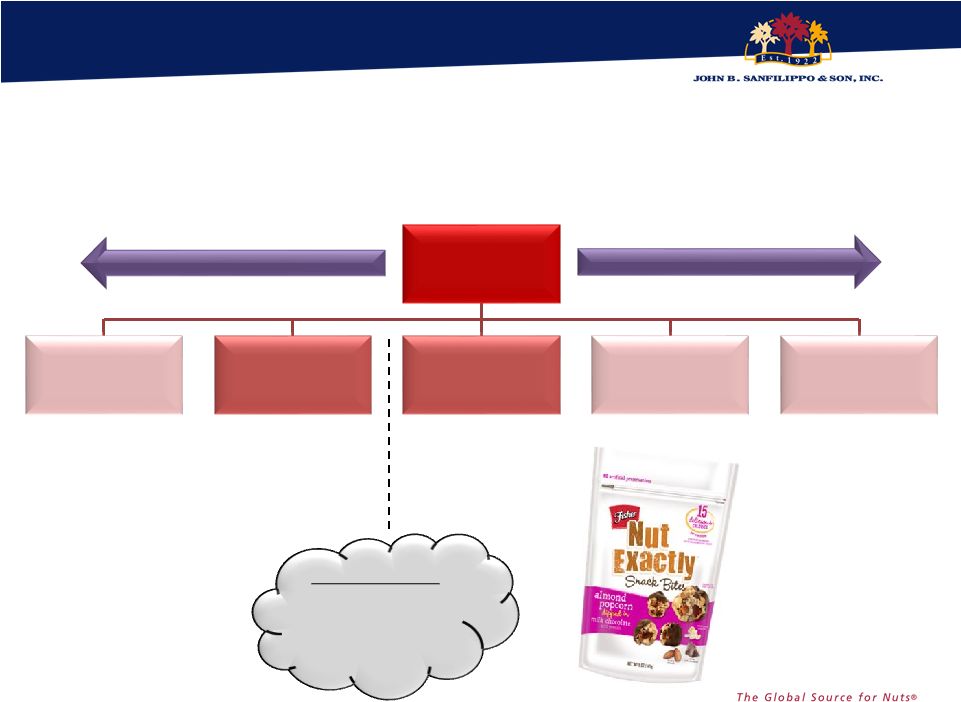 Meeting
Needs of the Snack Consumer Snacking
Yogurt/Veggies Popcorn Nuts Chips Candy Bars New Segment: Lighter than nuts, more substantial than popcorn Indulgent Healthier 51 |
 Retailers Like our New Snacking
Concept Too 52 |
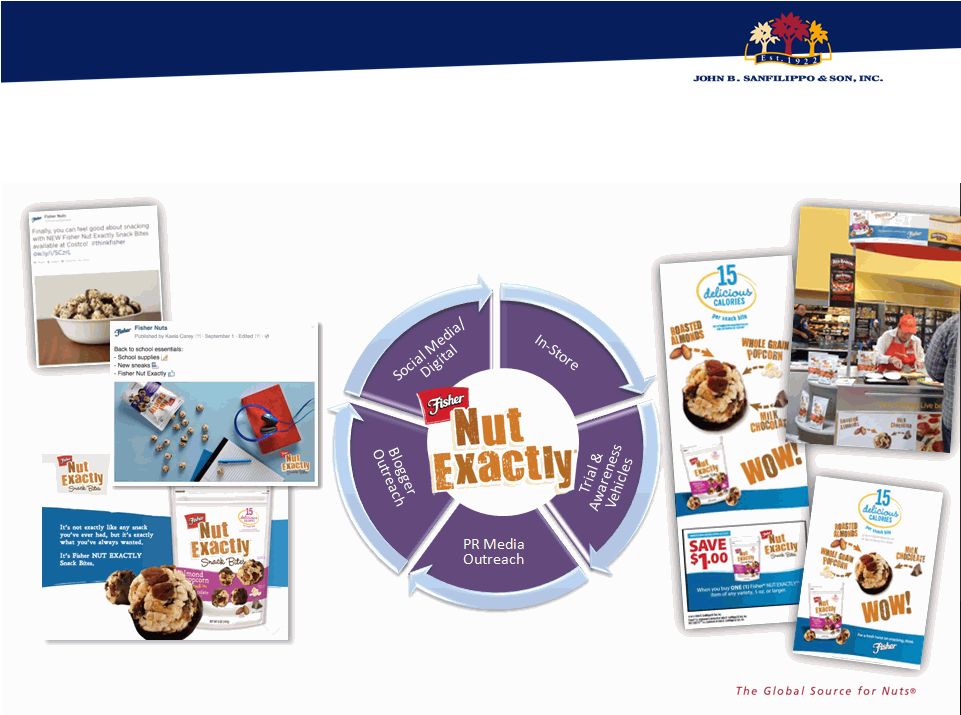 Marketing Support is Designed to Build
Consumer Awareness and Drive Trial
53 |
 Pure
and Simple Goodness 54 |
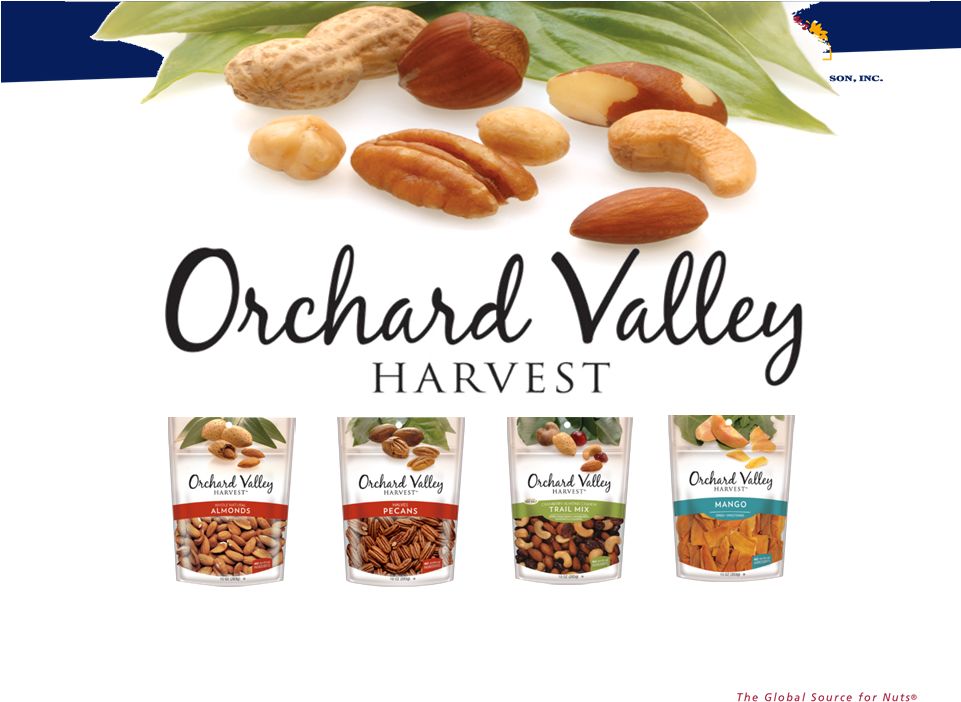
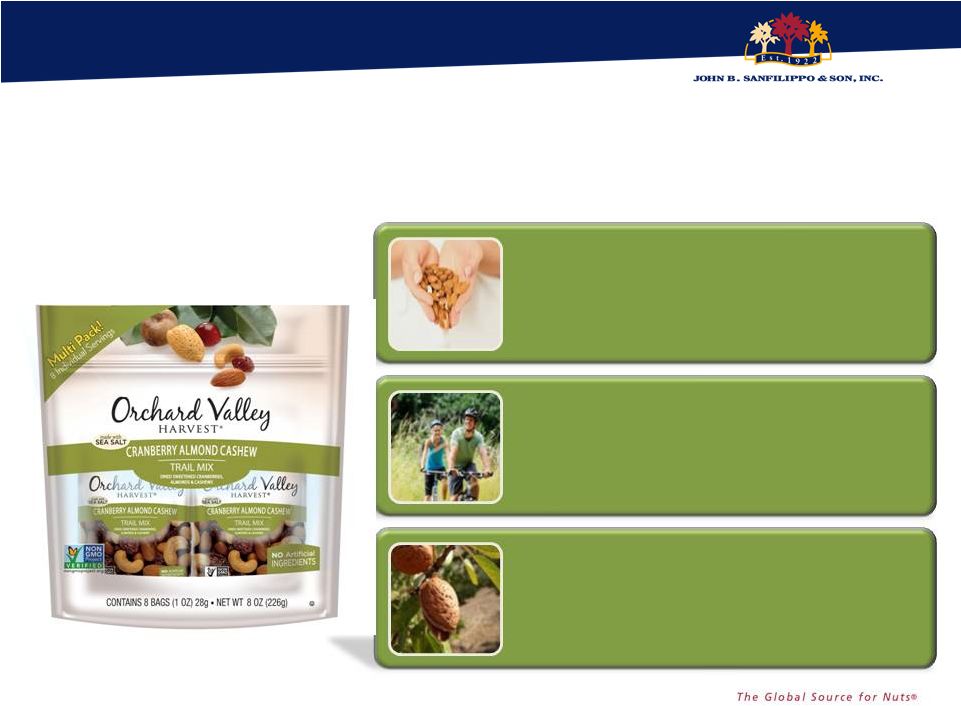 55 Our Orchard Valley Harvest Brand is On-Trend with Today’s Consumer Pure & Simple Goodness Supports a healthy lifestyle Close to the earth |
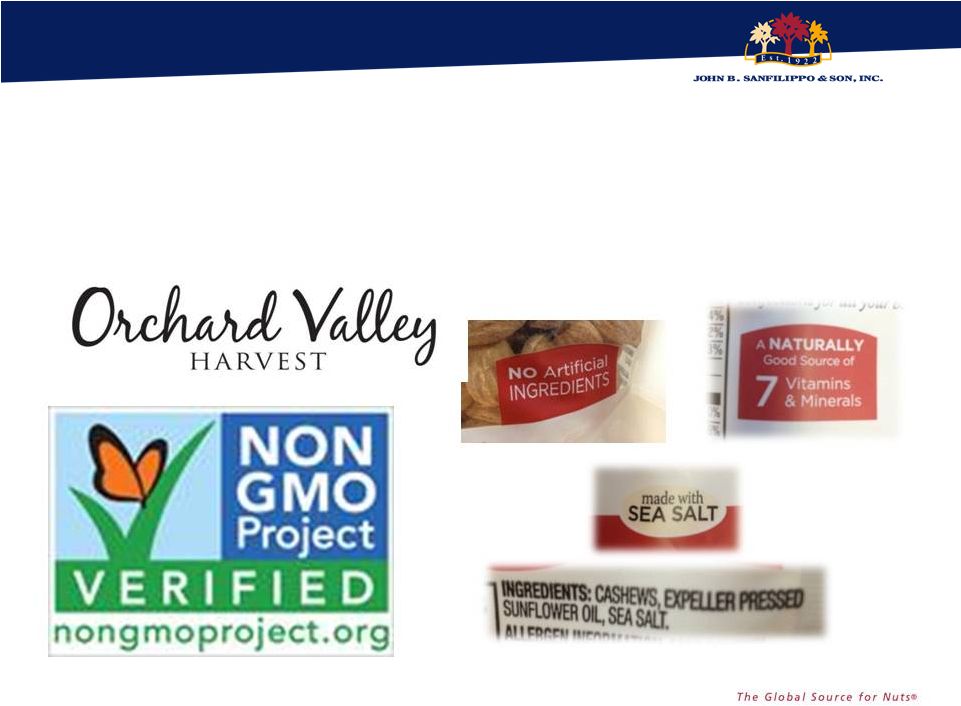 The
Brand Consumers Trust for Pure & Simple Goodness
56 |
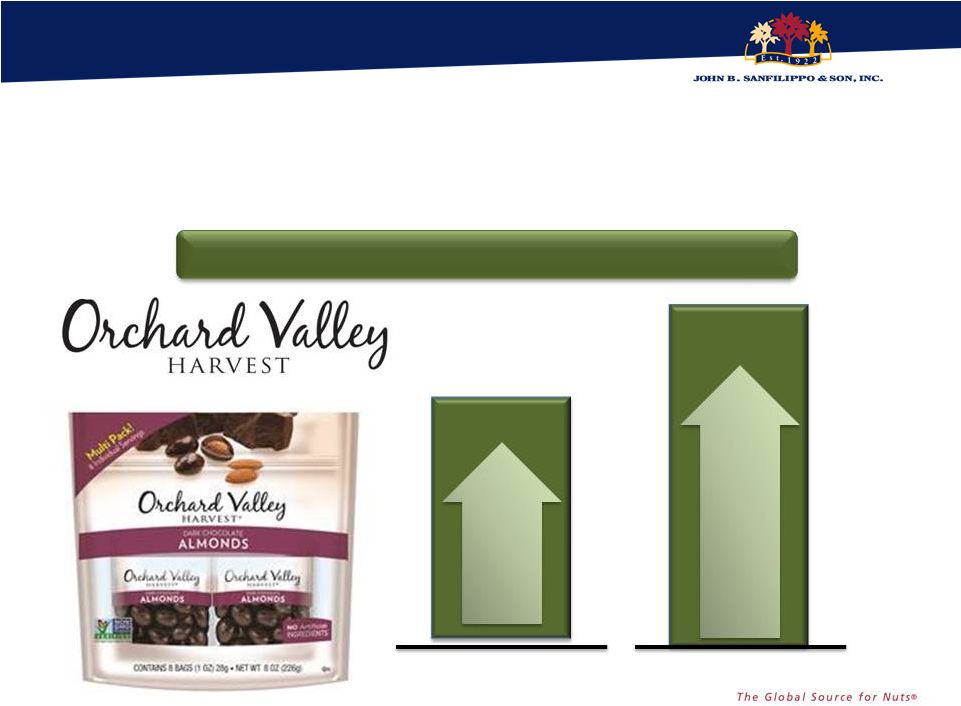 Strong
Growth on Orchard Valley Harvest
POUND SALES DOLLAR SALES 57 Source: JBSS shipment data Orchard Valley Harvest Growth FY15 vs. FY14 +34% +48% |
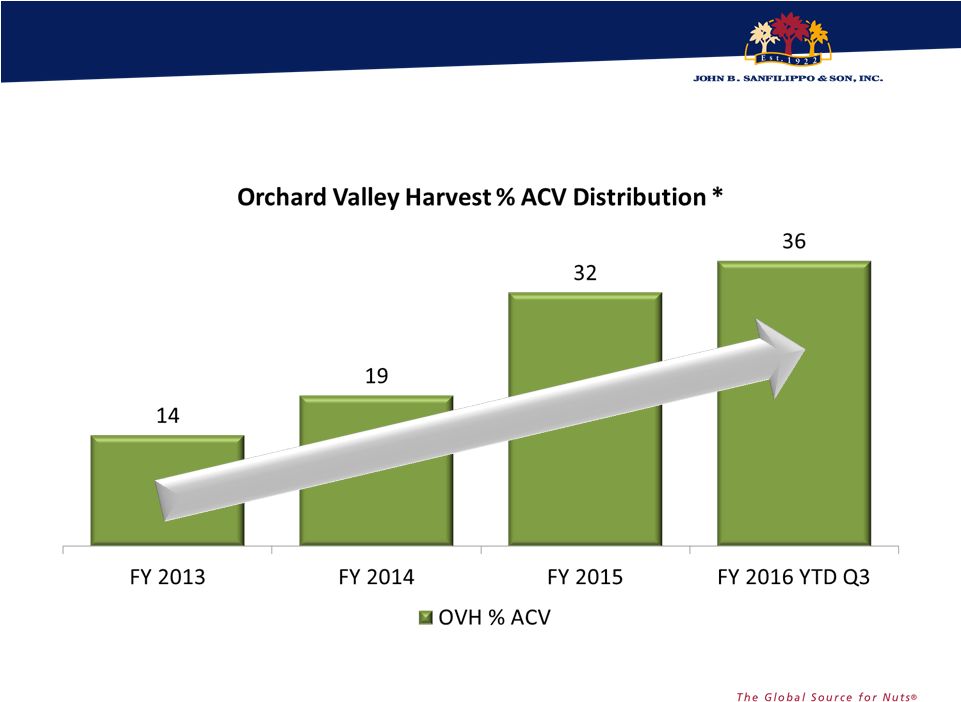 58 Strong Distribution Gains Source: IRI: Ttl Produce Nut Category – Total US MULO Geography– FY 2016 YTD Q3 Data Ending 3/27/16 *Note: % ACV refers to % “All Commodity Volume” as measured by IRI
|
 Source: The Hartman Group : Eating Occasions, Compass 2012
The Hartman Group: Reimagining Health and
Wellness, 2013 Snacking accounts for
over 53% of all eating
occasions in the U.S.
38% of consumers snack
several times per day
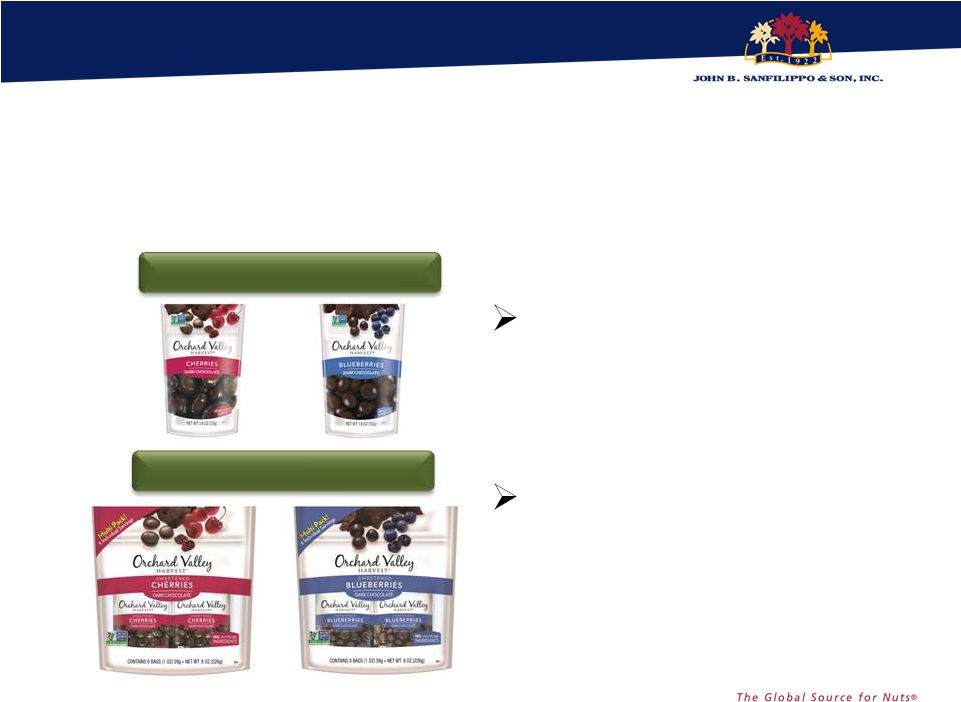
59 We continue to expand our portfolio to address consumer demand for on-the-go Goodness Multi-Packs Grab ‘n Go Mini’s |
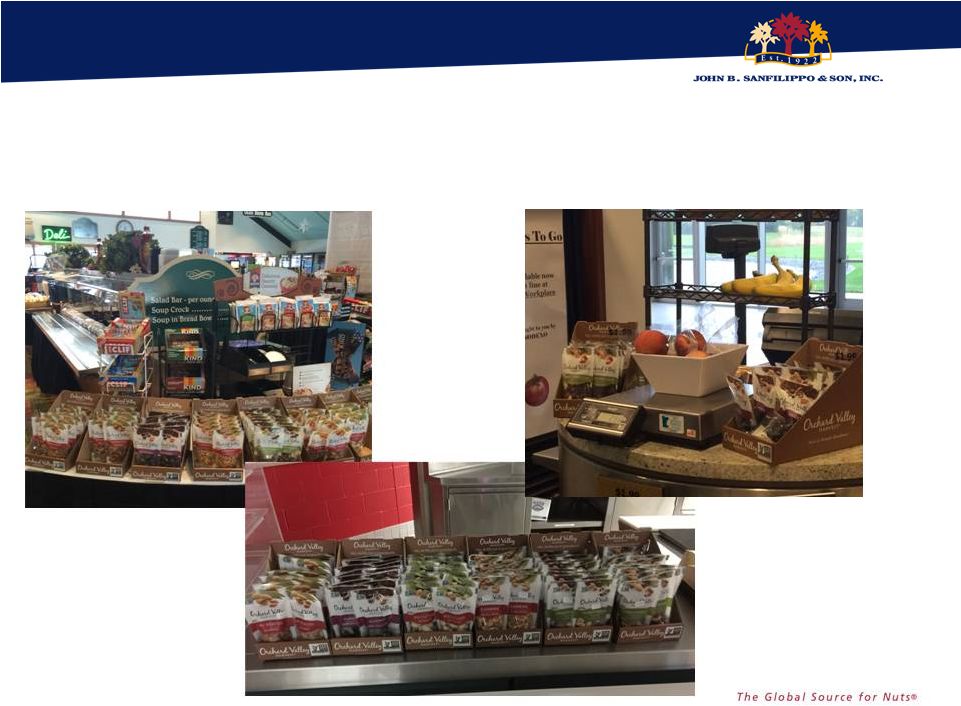 Expanding to Front of House Foodservice
Locations 60 University Setting Sodexho B&I Location Michigan Ski Resort |
 61 Impactful Marketing Support |
 Thank
You! 62 |