Attached files
| file | filename |
|---|---|
| 8-K - FORM 8-K - FEDERAL SIGNAL CORP /DE/ | form8-k20160518.htm |
Disciplined Growth Investor Presentation May 2016 Exhibit 99.1
Safe Harbor Statement 2 This presentation contains unaudited financial information and forward-looking statements. Statements that are not historical are forward-looking statements and may contain words such as “may,” “will,” “believe,” “expect,” “anticipate,” “intend,” “plan,” “project,” “estimate,” and “objective” or similar terminology, concerning the Company’s future financial performance, business strategy, plans, goals and objectives. These expressions are intended to identify forward-looking statements within the meaning of the Private Securities Litigation Reform Act of 1995. Forward-looking statements include information concerning the Company’s possible or assumed future performance or results of operations and are not guarantees. While these statements are based on assumptions and judgments that management has made in light of industry experience as well as perceptions of historical trends, current conditions, expected future developments and other factors believed to be appropriate under the circumstances, they are subject to risks, uncertainties and other factors that may cause the Company’s actual results, performance or achievements to be materially different. Such risks and uncertainties include, but are not limited to, economic conditions, product and price competition, supplier and raw material prices, foreign currency exchange rate changes, interest rate changes, increased legal expenses and litigation, legal and regulatory developments and other risks and uncertainties described under Item 1A, Risk Factors, in the Company’s Annual Report on Form 10-K and in other filings with the Securities and Exchange Commission (“SEC”). Such forward-looking statements are made as of the date hereof and we undertake no obligation to update these forward-looking statements regardless of new developments or otherwise. This presentation also contains certain measures that are not in accordance with U.S. generally accepted accounting principles (“GAAP”). The non-GAAP financial information presented herein should be considered supplemental to, and not a substitute for, or superior to, financial measures calculated in accordance with GAAP. The Company has provided this supplemental information to investors, analysts and other interested parties to enable them to perform additional analyses of operating results, to illustrate the results of operations giving effect to the non-GAAP adjustments shown in the reconciliations, and to provide an additional measure of performance which management considers in operating the business. A reconciliation of these items to the most comparable GAAP measures is provided in our filings with the SEC and in the Appendix to this presentation.
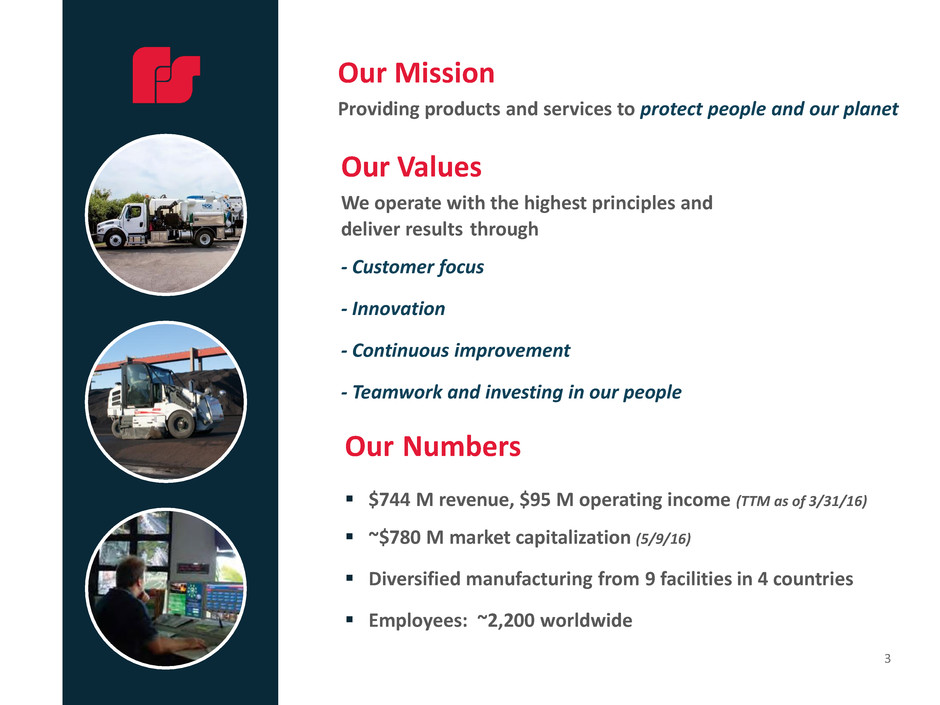
3 Our Mission Providing products and services to protect people and our planet Our Values We operate with the highest principles and deliver results through - Customer focus - Innovation - Continuous improvement - Teamwork and investing in our people Our Numbers $744 M revenue, $95 M operating income (TTM as of 3/31/16) ~$780 M market capitalization (5/9/16) Diversified manufacturing from 9 facilities in 4 countries Employees: ~2,200 worldwide
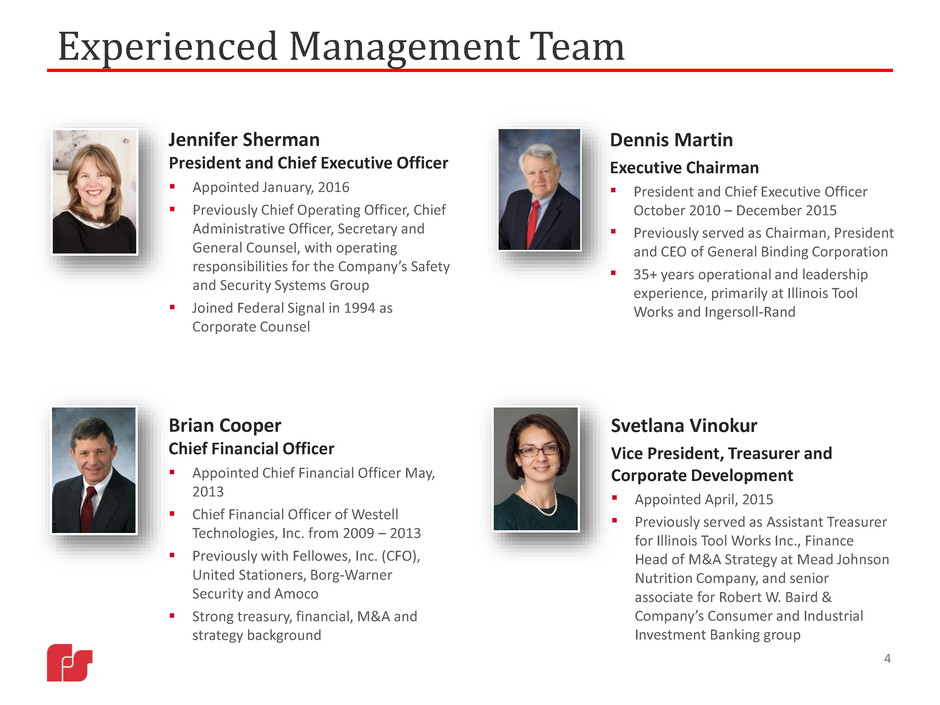
Experienced Management Team Dennis Martin Executive Chairman President and Chief Executive Officer October 2010 – December 2015 Previously served as Chairman, President and CEO of General Binding Corporation 35+ years operational and leadership experience, primarily at Illinois Tool Works and Ingersoll-Rand 4 Brian Cooper Chief Financial Officer Appointed Chief Financial Officer May, 2013 Chief Financial Officer of Westell Technologies, Inc. from 2009 – 2013 Previously with Fellowes, Inc. (CFO), United Stationers, Borg-Warner Security and Amoco Strong treasury, financial, M&A and strategy background Jennifer Sherman President and Chief Executive Officer Appointed January, 2016 Previously Chief Operating Officer, Chief Administrative Officer, Secretary and General Counsel, with operating responsibilities for the Company’s Safety and Security Systems Group Joined Federal Signal in 1994 as Corporate Counsel Svetlana Vinokur Vice President, Treasurer and Corporate Development Appointed April, 2015 Previously served as Assistant Treasurer for Illinois Tool Works Inc., Finance Head of M&A Strategy at Mead Johnson Nutrition Company, and senior associate for Robert W. Baird & Company’s Consumer and Industrial Investment Banking group
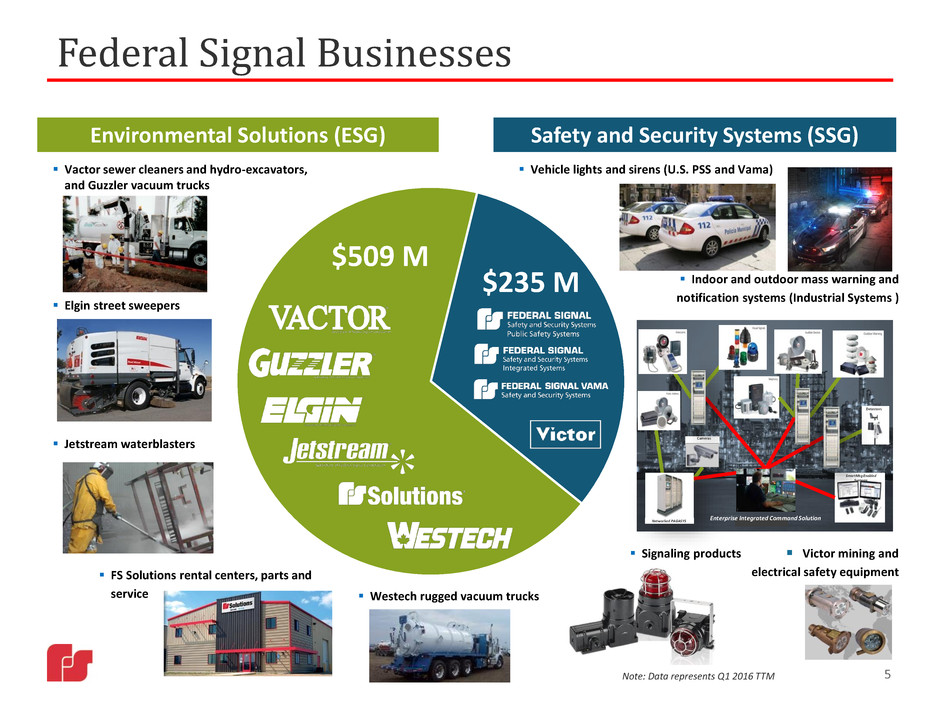
Federal Signal Businesses Environmental Solutions (ESG) Vactor sewer cleaners and hydro-excavators, and Guzzler vacuum trucks Elgin street sweepers Jetstream waterblasters Safety and Security Systems (SSG) Vehicle lights and sirens (U.S. PSS and Vama) Indoor and outdoor mass warning and notification systems (Industrial Systems ) Signaling products Victor mining and electrical safety equipment SmartMsg Enabled Systems Enterprise Integrated Command Solution Sensors/ Detectors Cameras Networked PAGASYS Rack $509 M Westech rugged vacuum trucks $235 M 5Note: Data represents Q1 2016 TTM FS Solutions rental centers, parts and service
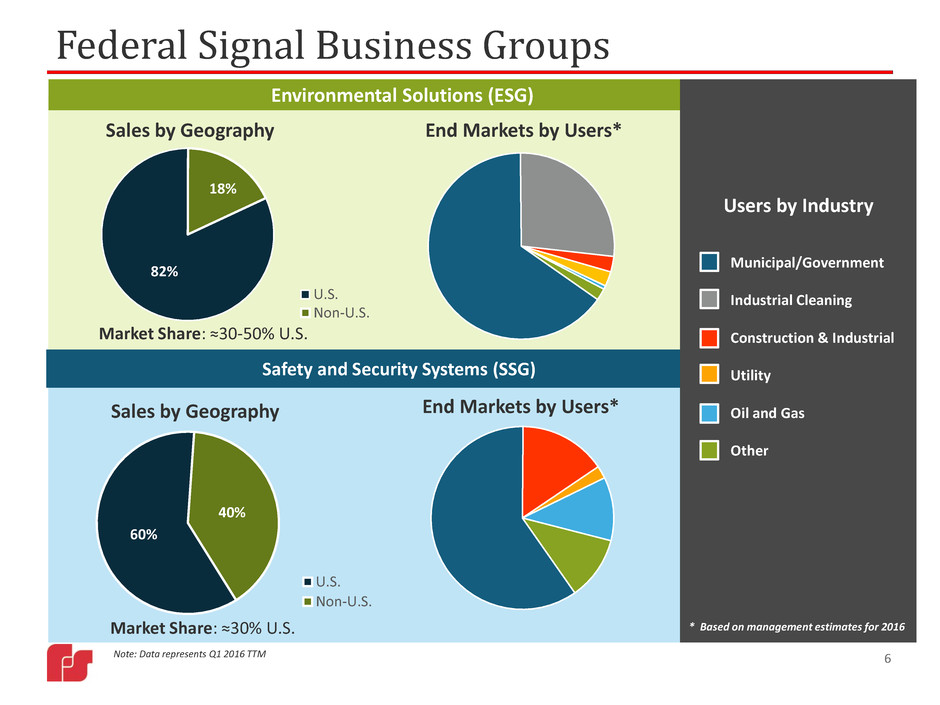
6 Environmental Solutions (ESG) Market Share: ≈30-50% U.S. 82% 18% Sales by Geography U.S. Non-U.S. Federal Signal Business Groups Note: Data represents Q1 2016 TTM End Markets by Users* 60% 40% Sales by Geography U.S. Non-U.S. Safety and Security Systems (SSG) Market Share: ≈30% U.S. End Markets by Users* Users by Industry Municipal/Government Industrial Cleaning Construction & Industrial Utility Oil and Gas Other * Based on management estimates for 2016
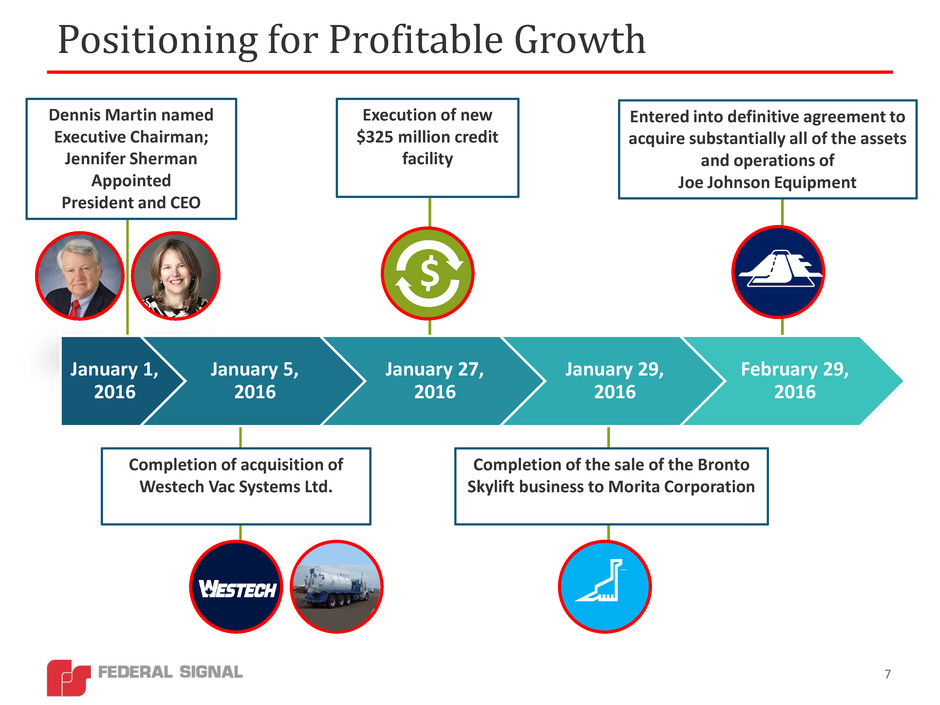
Positioning for Profitable Growth Dennis Martin named Executive Chairman; Jennifer Sherman Appointed President and CEO Completion of acquisition of Westech Vac Systems Ltd. Entered into definitive agreement to acquire substantially all of the assets and operations of Joe Johnson Equipment Execution of new $325 million credit facility Completion of the sale of the Bronto Skylift business to Morita Corporation $ January 1, 2016 January 5, 2016 January 27, 2016 January 29, 2016 February 29, 2016 7
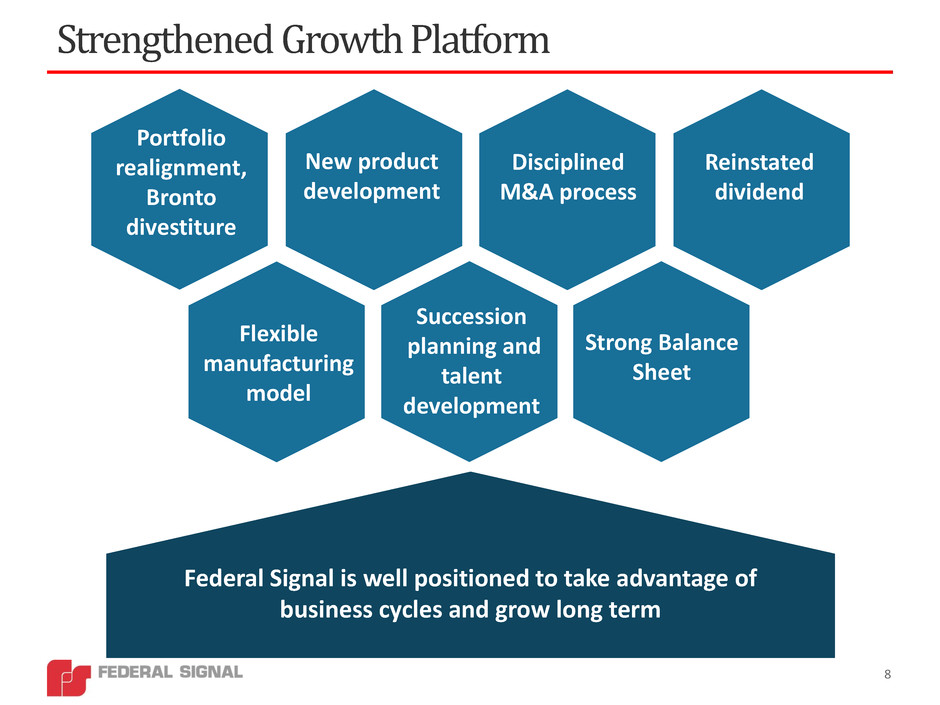
Strengthened Growth Platform Federal Signal is well positioned to take advantage of business cycles and grow long term Succession planning and talent development Flexible manufacturing model New product development Portfolio realignment, Bronto divestiture Reinstated dividend Disciplined M&A process Strong Balance Sheet 8
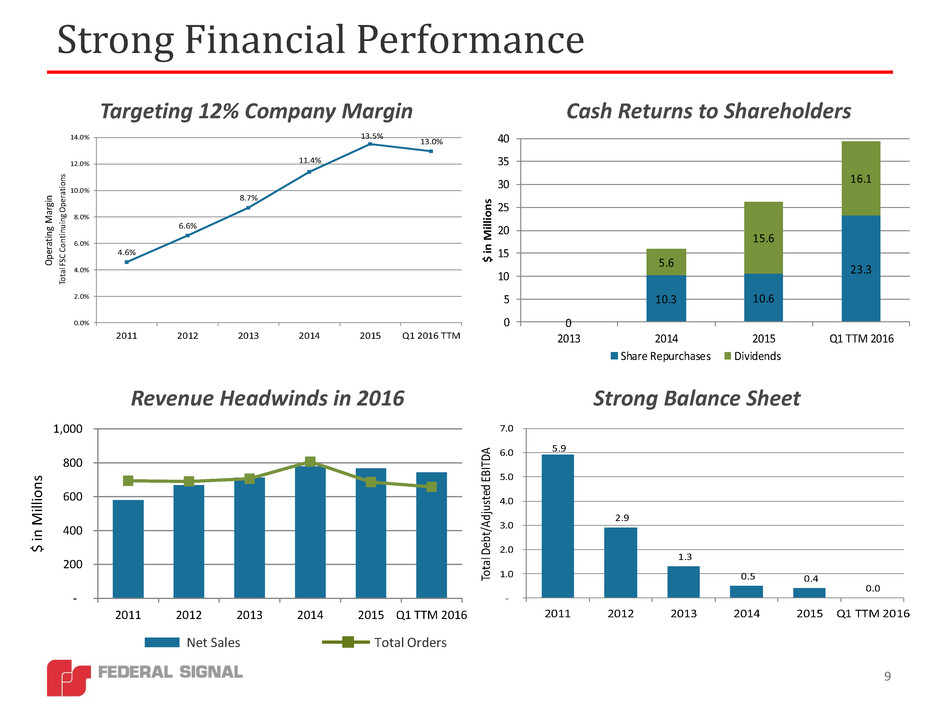
- 200 400 600 800 1,000 2011 2012 2013 2014 2015 Q1 TTM 2016 $ in M illi o n s Strong Financial Performance 9 Targeting 12% Company Margin Cash Returns to Shareholders Revenue Headwinds in 2016 Strong Balance Sheet 4.6% 6.6% 8.7% 11.4% 13.5% 13.0% 0.0% 2.0% 4.0% 6.0% 8.0% 10.0% 12.0% 14.0% 2011 2012 2013 2014 2015 Q1 2016 TTM Op era tin g M arg in Tot al F SC Co nti nu ing Op era tio ns 5.9 2.9 1.3 0.5 0.4 0.0 - 1.0 2.0 3.0 4.0 5.0 6.0 7.0 2011 2012 2013 2014 2015 Q1 TTM 2016 Tot al D ebt /Ad jus ted EB ITD A Net Sales Total Orders 0 10.3 10.6 23.3 5.6 15.6 16.1 0 5 10 15 20 25 30 35 40 2013 2014 2015 Q1 TTM 2016 $ i n M illi on s Share Repurchases Dividends
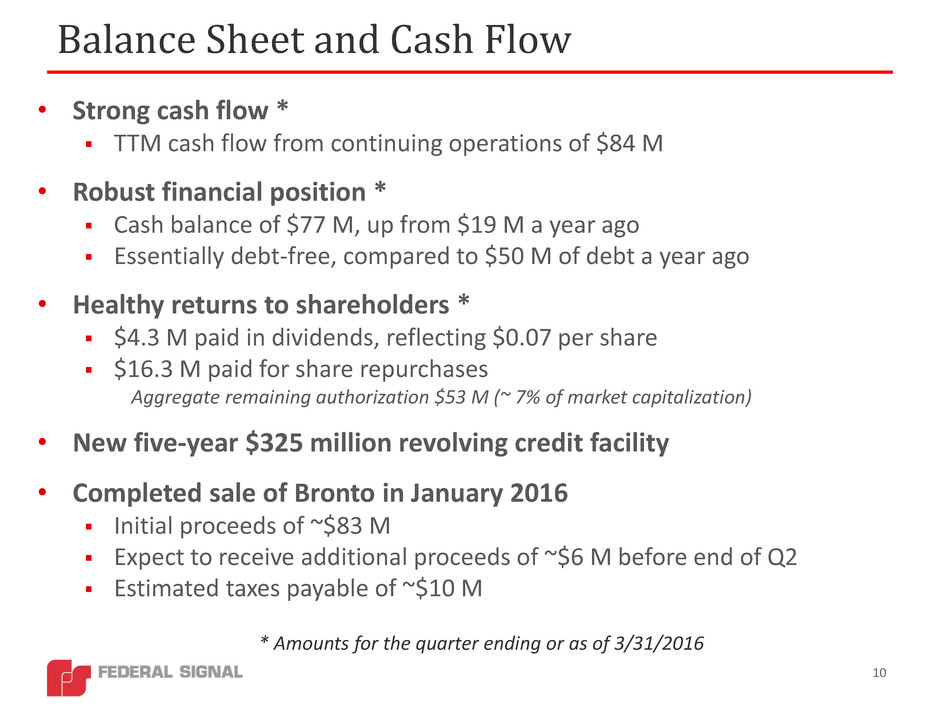
• Strong cash flow * TTM cash flow from continuing operations of $84 M • Robust financial position * Cash balance of $77 M, up from $19 M a year ago Essentially debt-free, compared to $50 M of debt a year ago • Healthy returns to shareholders * $4.3 M paid in dividends, reflecting $0.07 per share $16.3 M paid for share repurchases Aggregate remaining authorization $53 M (~ 7% of market capitalization) • New five-year $325 million revolving credit facility • Completed sale of Bronto in January 2016 Initial proceeds of ~$83 M Expect to receive additional proceeds of ~$6 M before end of Q2 Estimated taxes payable of ~$10 M 10 Balance Sheet and Cash Flow * Amounts for the quarter ending or as of 3/31/2016
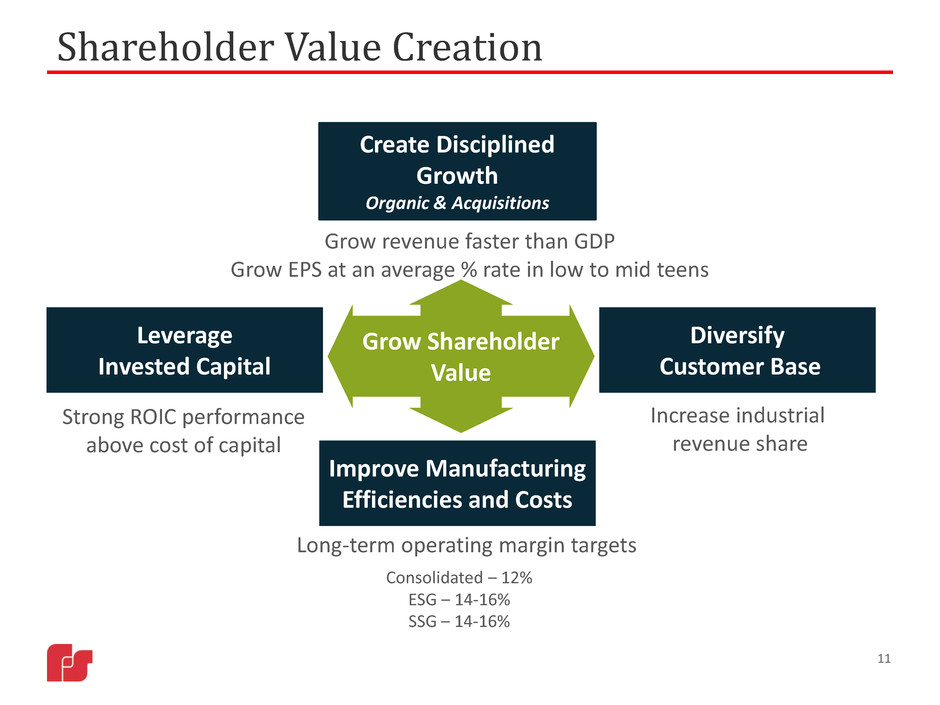
11 Shareholder Value Creation Create Disciplined Growth Organic & Acquisitions Diversify Customer Base Leverage Invested Capital Improve Manufacturing Efficiencies and Costs Long-term operating margin targets Grow revenue faster than GDP Grow EPS at an average % rate in low to mid teens Increase industrial revenue share Strong ROIC performance above cost of capital Grow Shareholder Value Consolidated ‒ 12% ESG ‒ 14-16% SSG ‒ 14-16%
• Continue our focus on refreshing products and developing new product opportunities • Continue investing in sales resources to capture new market opportunities and offset soft markets • Closely monitor our costs and performance metrics against our targets • Complete the acquisition of Joe Johnson Equipment and smoothly integrate to capture its value • Maintain our disciplined development of additional acquisition opportunities • Continue developing our people and building a solid bench to support our growth 2016 Priorities 12
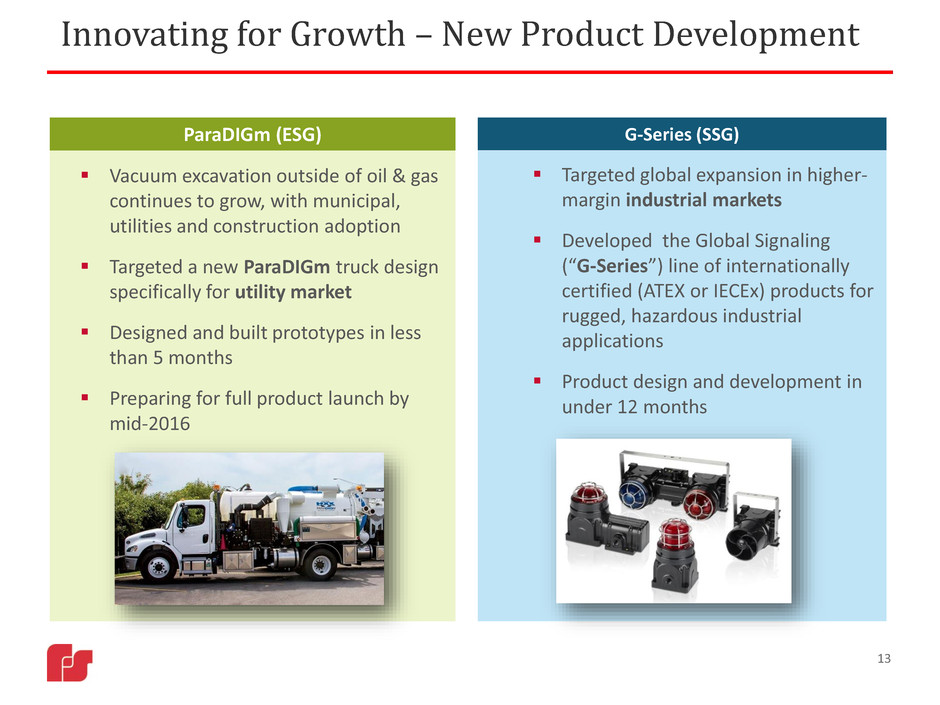
13 Innovating for Growth – New Product Development ParaDIGm (ESG) G-Series (SSG) Targeted global expansion in higher- margin industrial markets Developed the Global Signaling (“G-Series”) line of internationally certified (ATEX or IECEx) products for rugged, hazardous industrial applications Product design and development in under 12 months Vacuum excavation outside of oil & gas continues to grow, with municipal, utilities and construction adoption Targeted a new ParaDIGm truck design specifically for utility market Designed and built prototypes in less than 5 months Preparing for full product launch by mid-2016
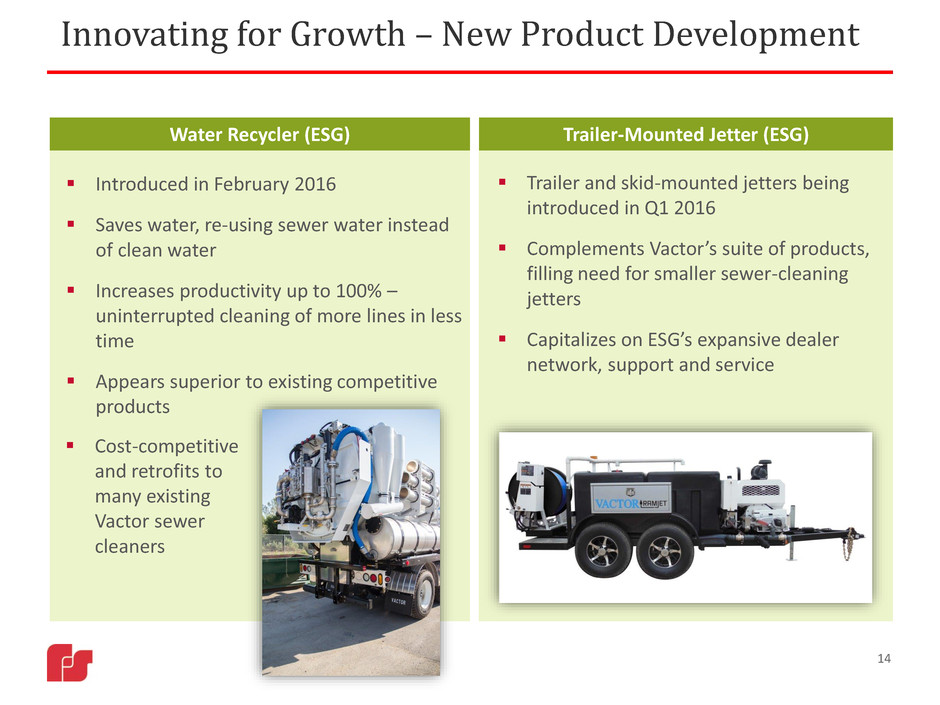
14 Innovating for Growth – New Product Development Water Recycler (ESG) Introduced in February 2016 Saves water, re-using sewer water instead of clean water Increases productivity up to 100% – uninterrupted cleaning of more lines in less time Appears superior to existing competitive products Trailer-Mounted Jetter (ESG) Trailer and skid-mounted jetters being introduced in Q1 2016 Complements Vactor’s suite of products, filling need for smaller sewer-cleaning jetters Capitalizes on ESG’s expansive dealer network, support and service Cost-competitive and retrofits to many existing Vactor sewer cleaners
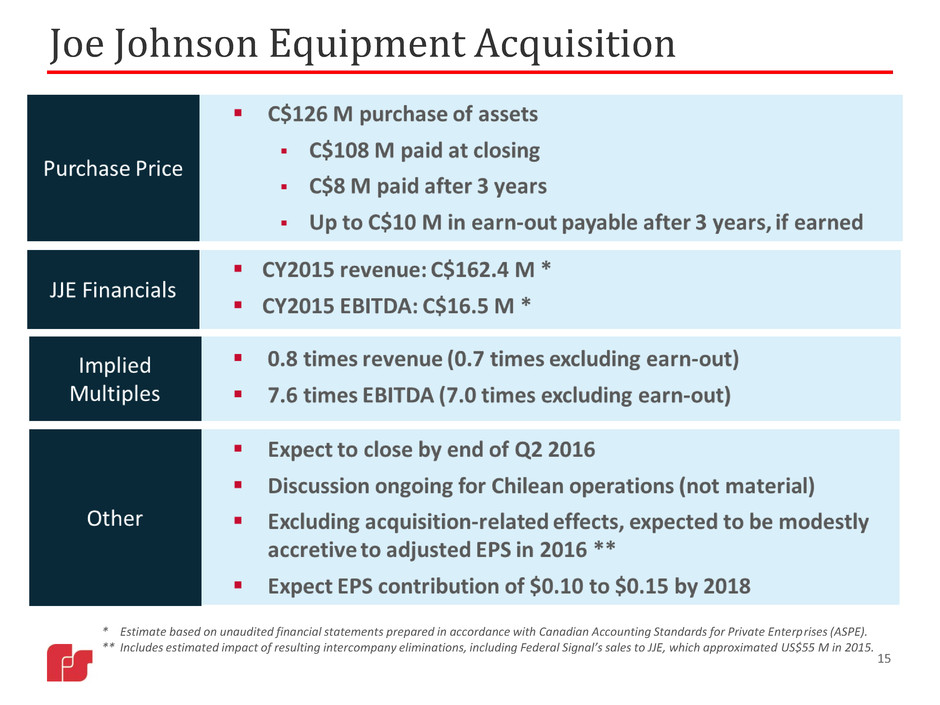
15 Joe Johnson Equipment Acquisition * Estimate based on unaudited financial statements prepared in accordance with Canadian Accounting Standards for Private Enterprises (ASPE). ** Includes estimated impact of resulting intercompany eliminations, including Federal Signal’s sales to JJE, which approximated US$55 M in 2015.
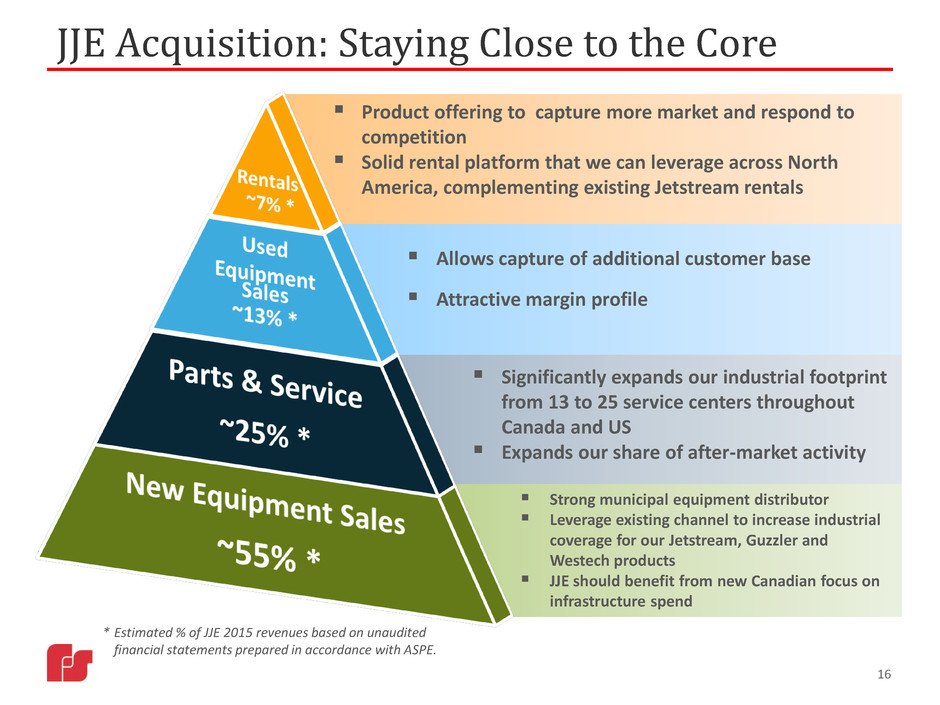
JJE Acquisition: Staying Close to the Core Significantly expands our industrial footprint from 13 to 25 service centers throughout Canada and US Expands our share of after-market activity Allows capture of additional customer base Attractive margin profile Product offering to capture more market and respond to competition Solid rental platform that we can leverage across North America, complementing existing Jetstream rentals Strong municipal equipment distributor Leverage existing channel to increase industrial coverage for our Jetstream, Guzzler and Westech products JJE should benefit from new Canadian focus on infrastructure spend 16 * Estimated % of JJE 2015 revenues based on unaudited financial statements prepared in accordance with ASPE.
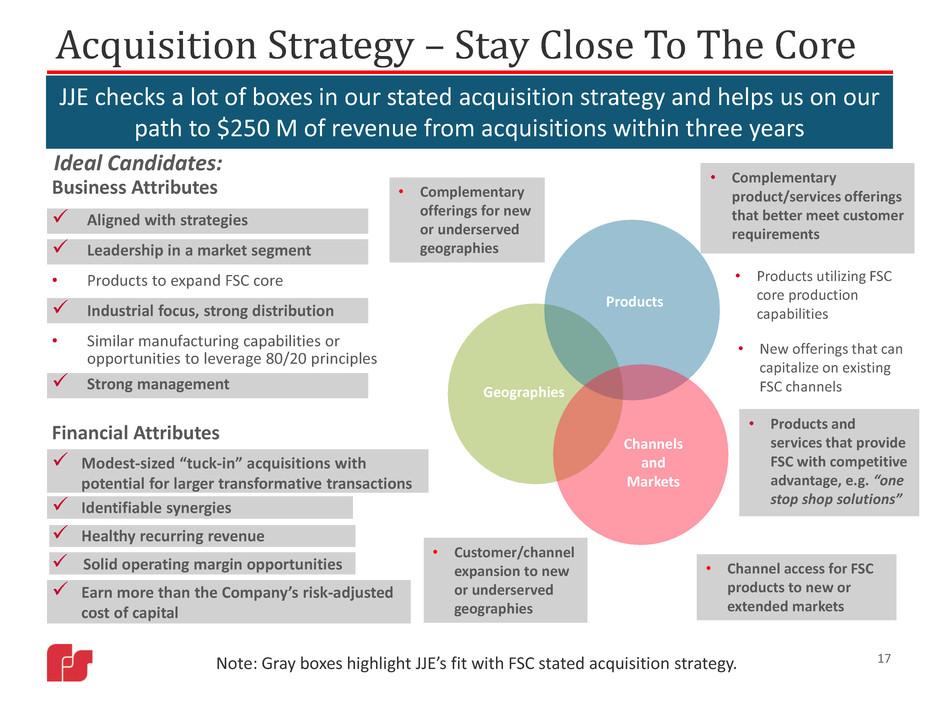
Financial Attributes Modest-sized “tuck-in” acquisitions with potential for larger transformative transactions Identifiable synergies Healthy recurring revenue Solid operating margin opportunities Earn more than the Company’s risk-adjusted cost of capital Business Attributes Aligned with strategies Leadership in a market segment • Products to expand FSC core Industrial focus, strong distribution • Similar manufacturing capabilities or opportunities to leverage 80/20 principles Strong management 17 Acquisition Strategy – Stay Close To The Core • Complementary product/services offerings that better meet customer requirements • Channel access for FSC products to new or extended markets • Complementary offerings for new or underserved geographies Geographies Products Channels and Markets • Customer/channel expansion to new or underserved geographies Ideal Candidates: JJE checks a lot of boxes in our stated acquisition strategy and helps us on our path to $250 M of revenue from acquisitions within three years • New offerings that can capitalize on existing FSC channels • Products utilizing FSC core production capabilities • Products and services that provide FSC with competitive advantage, e.g. “one stop shop solutions” Note: Gray boxes highlight JJE’s fit with FSC stated acquisition strategy.
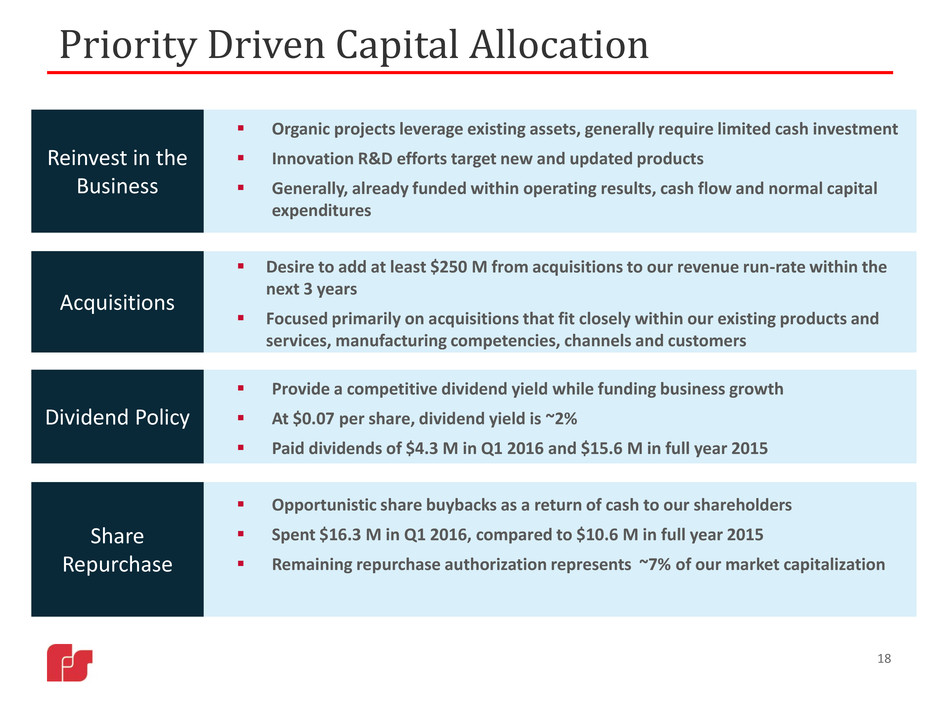
Priority Driven Capital Allocation Organic projects leverage existing assets, generally require limited cash investment Innovation R&D efforts target new and updated products Generally, already funded within operating results, cash flow and normal capital expenditures Desire to add at least $250 M from acquisitions to our revenue run-rate within the next 3 years Focused primarily on acquisitions that fit closely within our existing products and services, manufacturing competencies, channels and customers Opportunistic share buybacks as a return of cash to our shareholders Spent $16.3 M in Q1 2016, compared to $10.6 M in full year 2015 Remaining repurchase authorization represents ~7% of our market capitalization Reinvest in the Business Dividend Policy Share Repurchase Acquisitions Provide a competitive dividend yield while funding business growth At $0.07 per share, dividend yield is ~2% Paid dividends of $4.3 M in Q1 2016 and $15.6 M in full year 2015 18
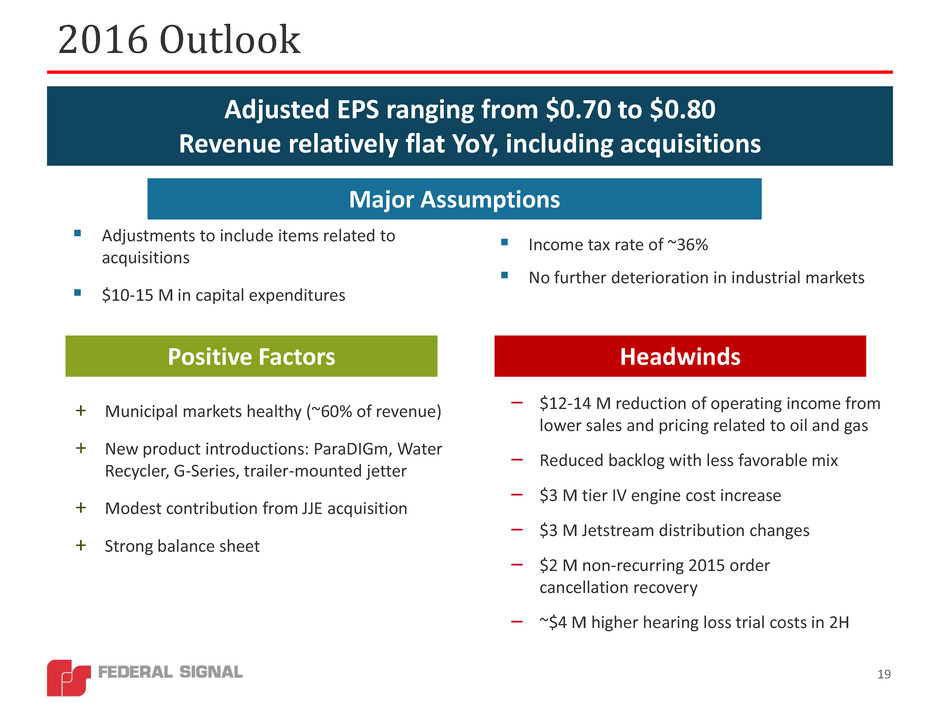
+ Municipal markets healthy (~60% of revenue) + New product introductions: ParaDIGm, Water Recycler, G-Series, trailer-mounted jetter + Modest contribution from JJE acquisition + Strong balance sheet Adjustments to include items related to acquisitions $10-15 M in capital expenditures 2016 Outlook Adjusted EPS ranging from $0.70 to $0.80 Revenue relatively flat YoY, including acquisitions – $12-14 M reduction of operating income from lower sales and pricing related to oil and gas – Reduced backlog with less favorable mix – $3 M tier IV engine cost increase – $3 M Jetstream distribution changes – $2 M non-recurring 2015 order cancellation recovery – ~$4 M higher hearing loss trial costs in 2H Major Assumptions Positive Factors Headwinds 19 Income tax rate of ~36% No further deterioration in industrial markets
20 Protecting People And Our Planet
Appendix • Group and Corporate Results • Consolidated Historical Financial Performance • Adjusted EPS • Total Debt to Adjusted EBITDA • Operating Margins • Estimated Global Sales • Company Products (Pictured) • Joe Johnson Equipment (JJE) Background • Investor Information 21
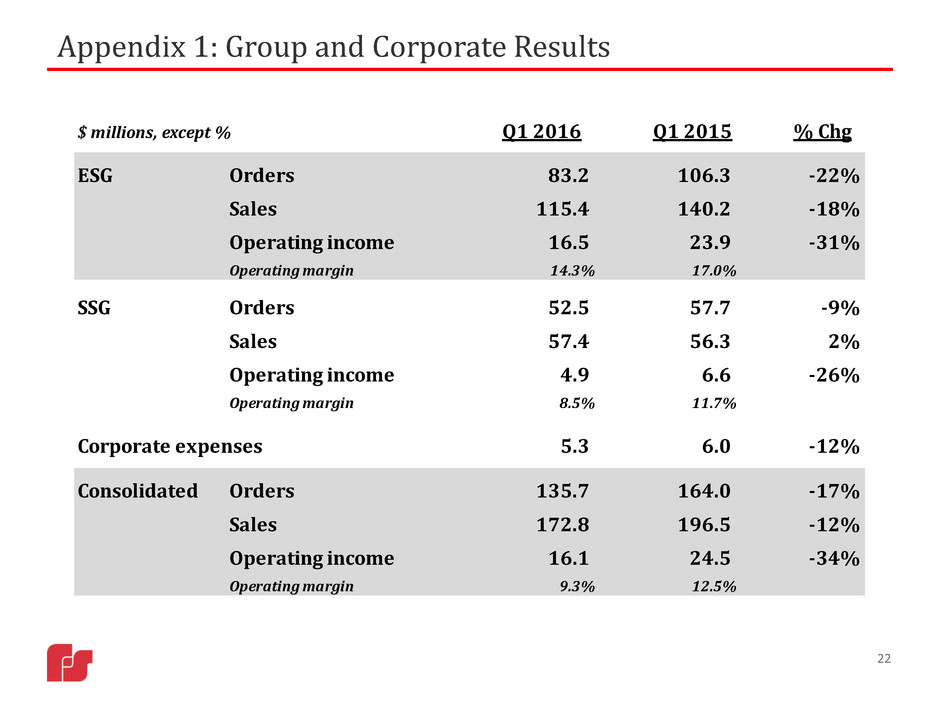
22 Appendix 1: Group and Corporate Results $ millions, except % Q1 2016 Q1 2015 % Chg ESG Orders 83.2 106.3 -22% Sales 115.4 140.2 -18% Operating income 16.5 23.9 -31% Operating margin 14.3% 17.0% SSG Orders 52.5 57.7 -9% Sales 57.4 56.3 2% Operating income 4.9 6.6 -26% Operating margin 8.5% 11.7% Corporate expenses 5.3 6.0 -12% Consolidated Orders 135.7 164.0 -17% Sales 172.8 196.5 -12% Operating income 16.1 24.5 -34% Operating margin 9.3% 12.5%
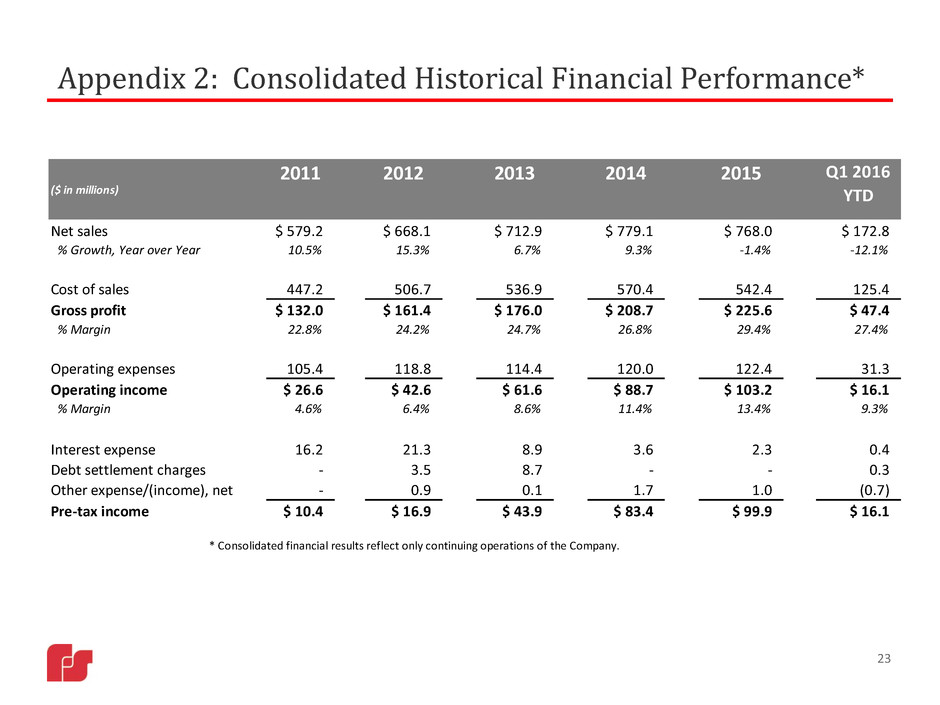
Appendix 2: Consolidated Historical Financial Performance* 23 ($ in millions) 2011 2012 2013 2014 2015 Q1 2016 YTD Net sales $ 579.2 $ 668.1 $ 712.9 $ 779.1 $ 768.0 $ 172.8 % Growth, Year over Year 10.5% 15.3% 6.7% 9.3% -1.4% -12.1% Cost of sales 447.2 506.7 536.9 570.4 542.4 125.4 Gross profit $ 132.0 $ 161.4 $ 176.0 $ 208.7 $ 225.6 $ 47.4 % Margin 22.8% 24.2% 24.7% 26.8% 29.4% 27.4% Operating expenses 105.4 118.8 114.4 120.0 122.4 31.3 Operating income $ 26.6 $ 42.6 $ 61.6 $ 88.7 $ 103.2 $ 16.1 % Margin 4.6% 6.4% 8.6% 11.4% 13.4% 9.3% I terest expense 16.2 21.3 8.9 3.6 2.3 0.4 Debt settlement charges - 3.5 8.7 - - 0.3 Other expense/(income), net - 0.9 0.1 1.7 1.0 (0.7) Pre-tax income $ 10.4 $ 16.9 $ 43.9 $ 83.4 $ 99.9 $ 16.1 * Consolidated financial results reflect only continuing operations of the Company.
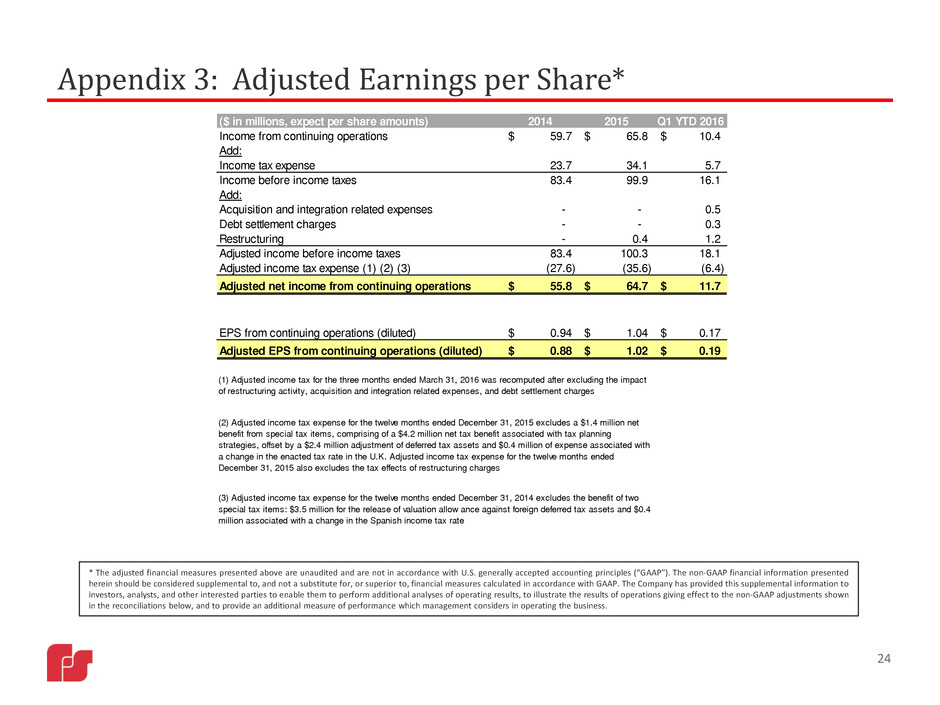
Appendix 3: Adjusted Earnings per Share* * The adjusted financial measures presented above are unaudited and are not in accordance with U.S. generally accepted accounting principles (“GAAP”). The non-GAAP financial information presented herein should be considered supplemental to, and not a substitute for, or superior to, financial measures calculated in accordance with GAAP. The Company has provided this supplemental information to investors, analysts, and other interested parties to enable them to perform additional analyses of operating results, to illustrate the results of operations giving effect to the non-GAAP adjustments shown in the reconciliations below, and to provide an additional measure of performance which management considers in operating the business. 24 ($ in millions, expect per share amounts) 2014 2015 Q1 YTD 2016 Income from continuing operations 59.7$ 65.8$ 10.4$ Add: Income tax expense 23.7 34.1 5.7 Income before income taxes 83.4 99.9 16.1 Add: Acquisition and integration related expenses - - 0.5 Debt settlement charges - - 0.3 Restructuring - 0.4 1.2 Adjusted income before income taxes 83.4 100.3 18.1 Adjusted income tax expense (1) (2) (3) (27.6) (35.6) (6.4) Adjusted net income from continuing operations 55.8$ 64.7$ 11.7$ EPS from continuing operations (diluted) 0.94$ 1.04$ 0.17$ Adjusted EPS from continuing operations (diluted) 0.88$ 1.02$ 0.19$ (2) Adjusted income tax expense for the twelve months ended December 31, 2015 excludes a $1.4 million net benefit from special tax items, comprising of a $4.2 million net tax benefit associated with tax planning strategies, offset by a $2.4 million adjustment of deferred tax assets and $0.4 million of expense associated with a change in the enacted tax rate in the U.K. Adjusted income tax expense for the twelve months ended December 31, 2015 also excludes the tax effects of restructuring charges (3) Adjusted income tax expense for the twelve months ended December 31, 2014 excludes the benefit of two special tax items: $3.5 million for the release of valuation allow ance against foreign deferred tax assets and $0.4 million associated with a change in the Spanish income tax rate (1) Adjusted income tax for the three months ended March 31, 2016 was recomputed after excluding the impact of restructuring activity, acquisition and integration related expenses, and debt settlement charges
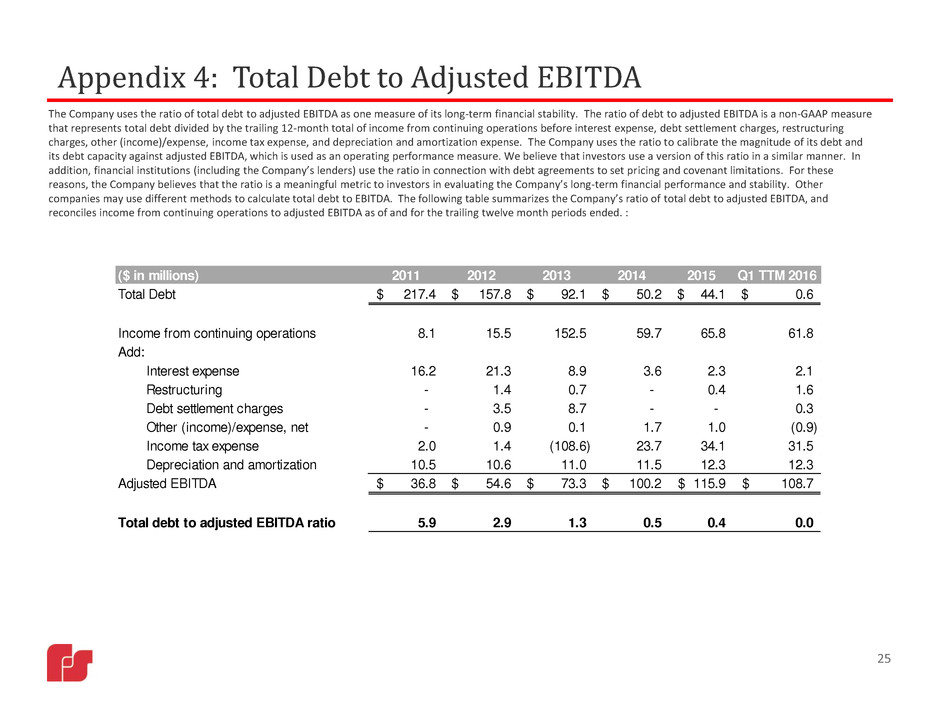
Appendix 4: Total Debt to Adjusted EBITDA The Company uses the ratio of total debt to adjusted EBITDA as one measure of its long-term financial stability. The ratio of debt to adjusted EBITDA is a non-GAAP measure that represents total debt divided by the trailing 12-month total of income from continuing operations before interest expense, debt settlement charges, restructuring charges, other (income)/expense, income tax expense, and depreciation and amortization expense. The Company uses the ratio to calibrate the magnitude of its debt and its debt capacity against adjusted EBITDA, which is used as an operating performance measure. We believe that investors use a version of this ratio in a similar manner. In addition, financial institutions (including the Company’s lenders) use the ratio in connection with debt agreements to set pricing and covenant limitations. For these reasons, the Company believes that the ratio is a meaningful metric to investors in evaluating the Company’s long-term financial performance and stability. Other companies may use different methods to calculate total debt to EBITDA. The following table summarizes the Company’s ratio of total debt to adjusted EBITDA, and reconciles income from continuing operations to adjusted EBITDA as of and for the trailing twelve month periods ended. : 25 ($ in millions) 2011 2012 2013 2014 2015 Q1 TTM 2016 Total Debt 217.4$ 157.8$ 92.1$ 50.2$ 44.1$ 0.6$ Income from continuing operations 8.1 15.5 152.5 59.7 65.8 61.8 Add: Interest expense 16.2 21.3 8.9 3.6 2.3 2.1 R s ruc uri g - 1.4 0.7 - 0.4 1.6 D bt ttl ment charges - 3.5 8.7 - - 0.3 Other (income)/expense, net - 0.9 0.1 1.7 1.0 (0.9) Income tax expense 2.0 1.4 (108.6) 23.7 34.1 31.5 Depreciation and amortization 10.5 10.6 11.0 11.5 12.3 12.3 Adjusted EBITDA 36.8$ 54.6$ 73.3$ 100.2$ 115.9$ 108.7$ Total debt to adjusted EBITDA ratio 5.9 2.9 1.3 0.5 0.4 0.0
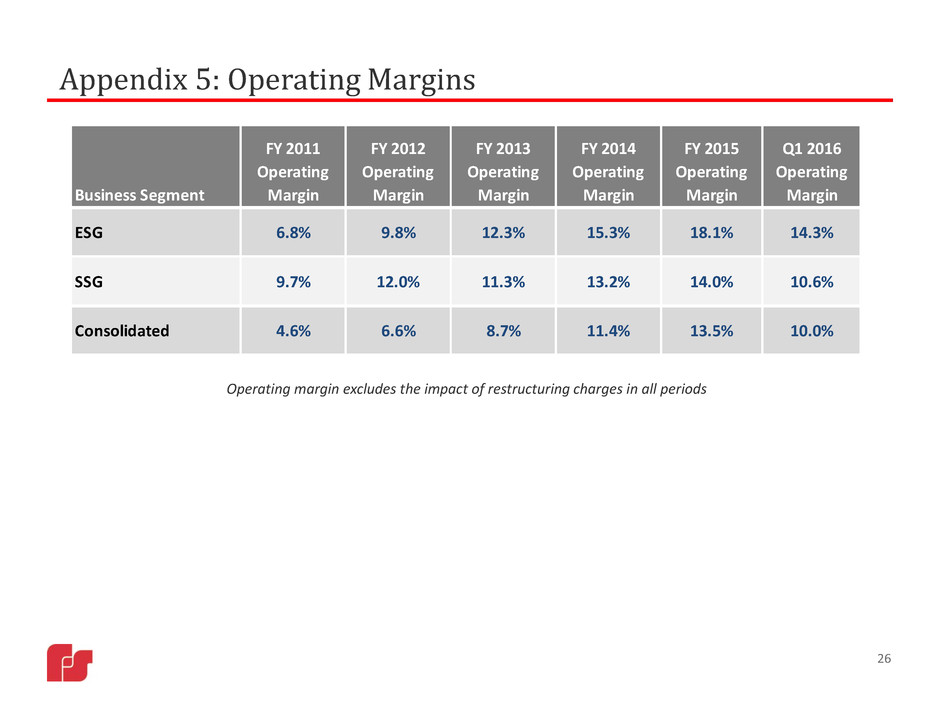
Appendix 5: Operating Margins 26 Operating margin excludes the impact of restructuring charges in all periods Business Segment FY 2011 Operating Margin FY 2012 Operating Margin FY 2013 Operating Margin FY 2014 Operating Margin FY 2015 Operating Margin Q1 2016 Operating Margin ESG 6.8% 9.8% 12.3% 15.3% 18.1% 14.3% SSG 9.7% 12.0% 11.3% 13.2% 14.0% 10.6% Consolidated 4.6% 6.6% 8.7% 11.4% 13.5% 10.0%
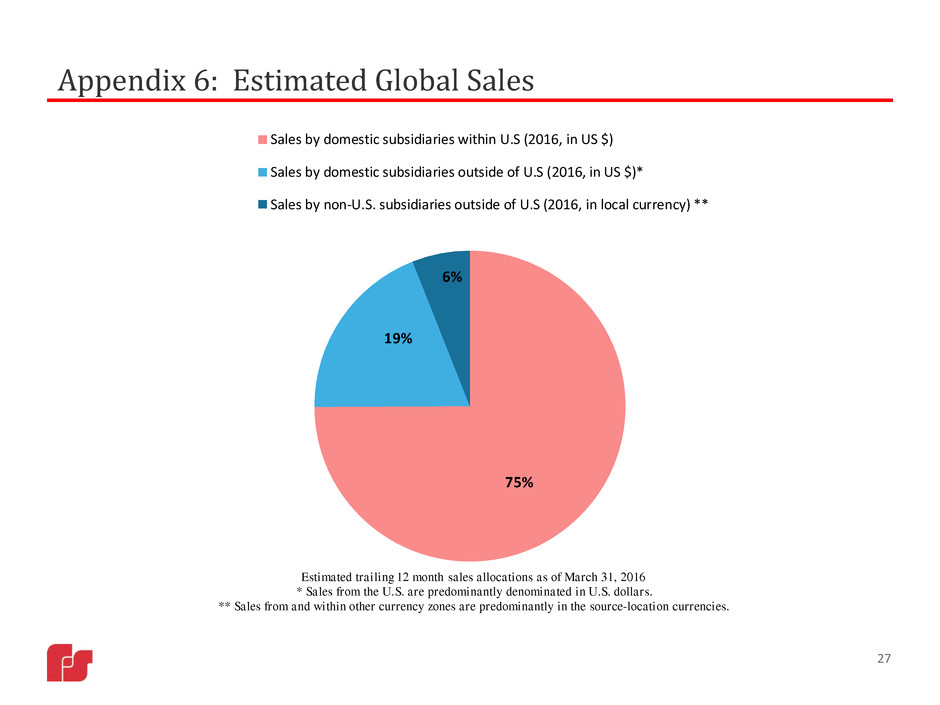
Appendix 6: Estimated Global Sales 27 75% 19% 6% Sales by domestic subsidiaries within U.S (2016, in US $) Sales by domestic subsidiaries outside of U.S (2016, in US $)* Sales by non-U.S. subsidiaries outside of U.S (2016, in local currency) ** Estimated trailing 12 month sales allocations as of March 31, 2016 * Sales from the U.S. are predominantly denominated in U.S. dollars. ** Sales from and within other currency zones are predominantly in the source-location currencies.
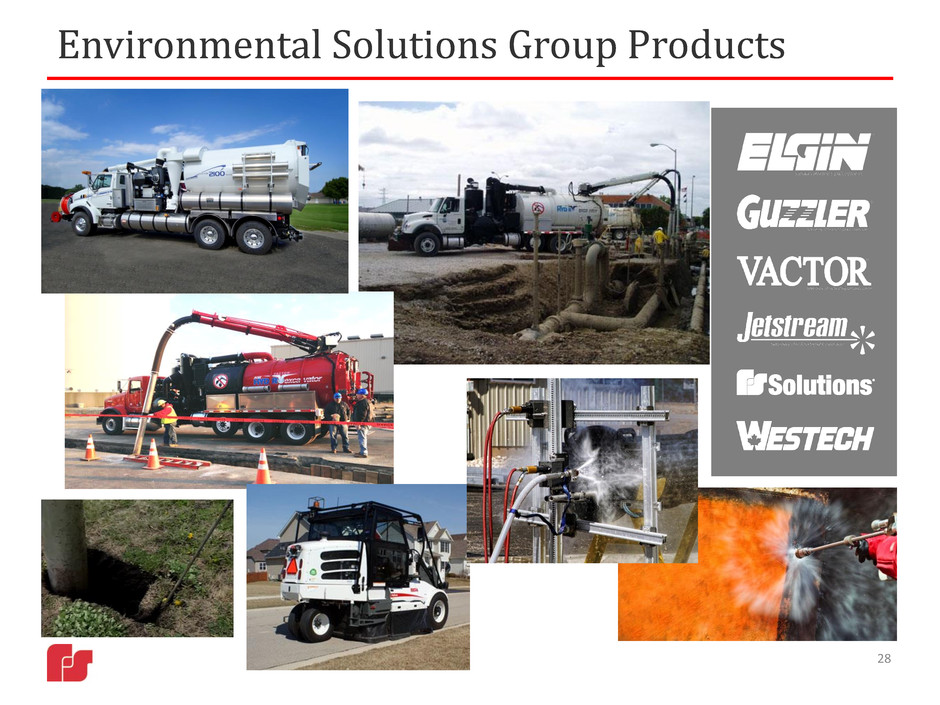
Environmental Solutions Group Products 28
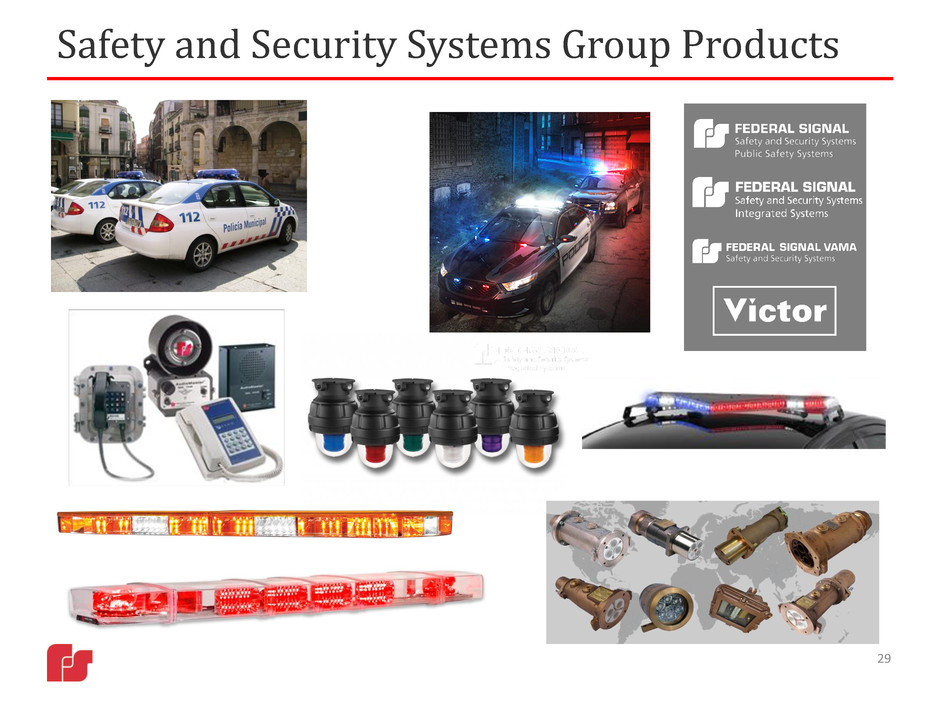
Safety and Security Systems Group Products 29
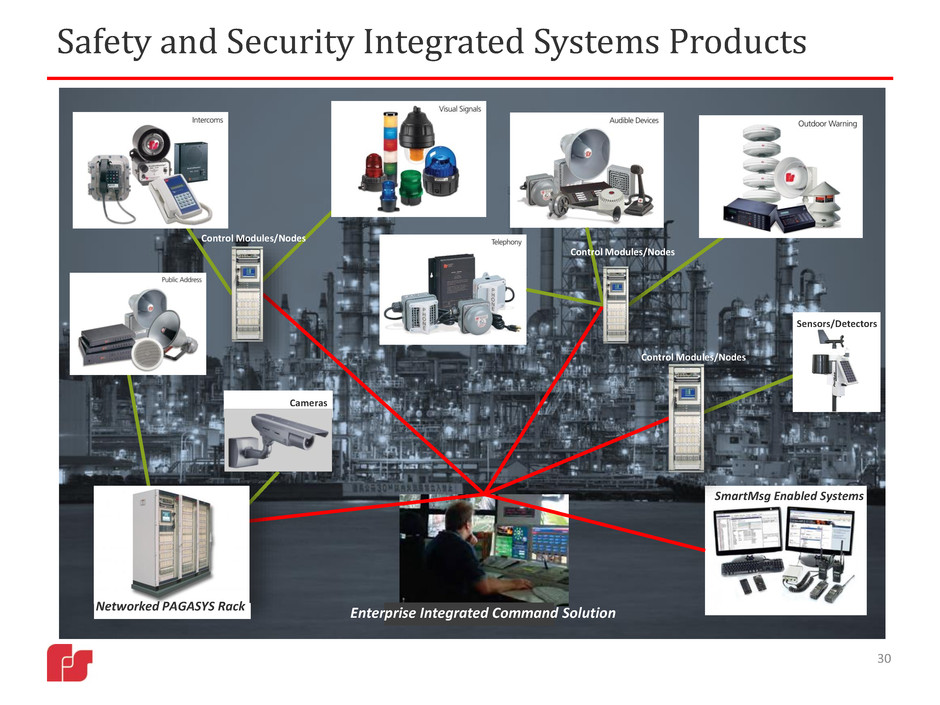
Safety and Security Integrated Systems Products SmartMsg Enabled Systems Enterprise Integrated Command Solution Sensors/Detectors Cameras Networked PAGASYS Rack Control Modules/Nodes Control Modules/Nodes Control Modules/Nodes 30
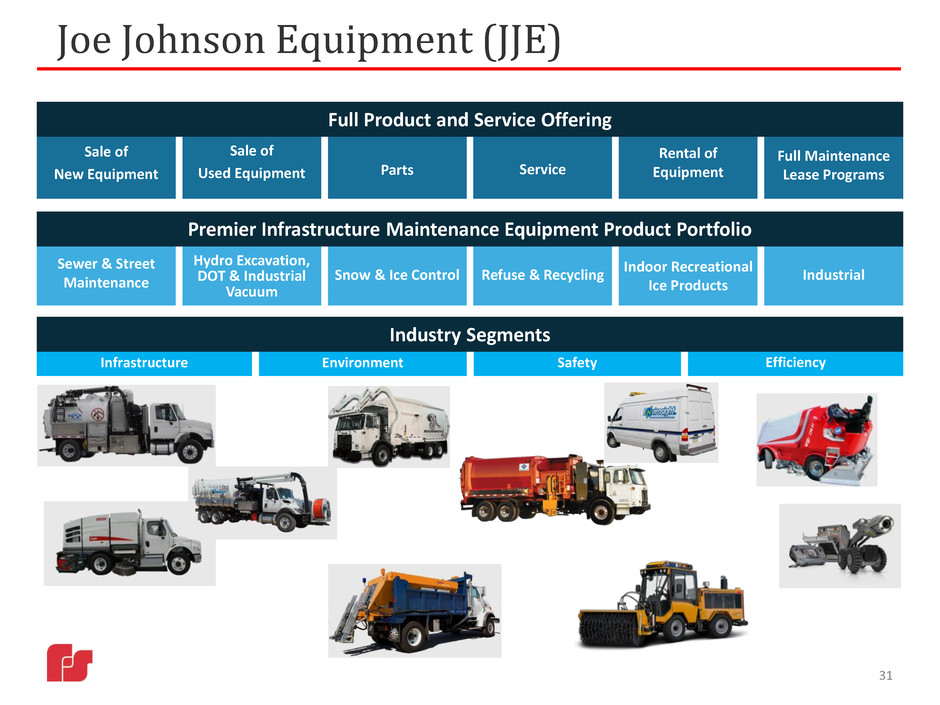
Rental of Equipment Sewer & Street Maintenance Hydro Excavation, DOT & Industrial Vacuum Snow & Ice Control Refuse & Recycling Indoor Recreational Ice Products Industrial Service Sale of New Equipment Sale of Used Equipment Parts Full Maintenance Lease Programs Premier Infrastructure Maintenance Equipment Product Portfolio Infrastructure EfficiencyEnvironment Safety Joe Johnson Equipment (JJE) Full Product and Service Offering Industry Segments 31
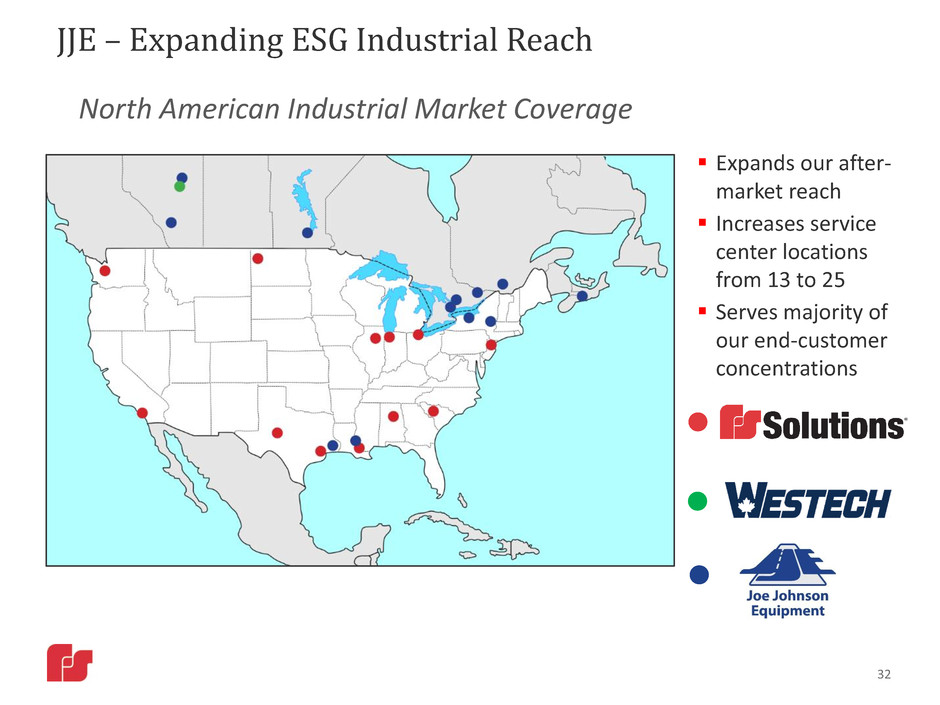
JJE – Expanding ESG Industrial Reach North American Industrial Market Coverage 32 Expands our after- market reach Increases service center locations from 13 to 25 Serves majority of our end-customer concentrations
Investor Information 33 Stock Ticker NYSE: FSS Website www.federalsignal.com/investors Headquarters 1415 W. 22nd Street, Suite 1100 Oak Brook, IL 60523 Investor Relations Contacts: Telephone: 630-954-2000 Brian Cooper BCooper@federalsignal.com SVP, Chief Financial Officer Svetlana Vinokur SVinokur@federalsignal.com VP, Treasurer and Corporate Development
