Attached files
| file | filename |
|---|---|
| 8-K - 8-K - Conifer Holdings, Inc. | a8-k2016annualmeetingslide.htm |

Annual Meeting May 18, 2016
1 SAFE HARBOR STATEMENT This presentation contains “forward-looking” statements within the meaning of Section 27A of the Securities Act of 1933, as amended, and Section 21E of the Securities Exchange Act of 1934, as amended, that are based on our management’s beliefs and assumptions and on information currently available to management. These forward-looking statements include, without limitation, statements regarding our industry, business strategy, plans, goals and expectations concerning our market position, product expansion, future operations, margins, profitability, future efficiencies, and other financial and operating information. When used in this discussion, the words “may,” “believes,” “intends,” “seeks,” “anticipates,” “plans,” “estimates,” “expects,” “should,” “assumes,” “continues,” “potential,” “could,” “will,” “future” and the negative of these or similar terms and phrases are intended to identify forward-looking statements. Forward-looking statements involve known and unknown risks, uncertainties, inherent risks and other factors that may cause our actual results, performance or achievements to be materially different from any future results, performance or achievements expressed or implied by the forward-looking statements. Forward-looking statements represent our management’s beliefs and assumptions only as of the date of this presentation. Our actual future results may be materially different from what we expect due to factors largely outside our control, including the occurrence of severe weather conditions and other catastrophes, the cyclical nature of the insurance industry, future actions by regulators, our ability to obtain reinsurance coverage at reasonable rates and the effects of competition. These and other risks and uncertainties associated with our business are described under the heading “Risk Factors” in our Annual Report on Form 10-K for the year ended December 31, 2015, which should be read in conjunction with this presentation. The company and subsidiaries operate in a dynamic business environment, and therefore the risks identified are not meant to be exhaustive. Risk factors change and new risks emerge frequently. Except as required by law, we assume no obligation to update these forward-looking statements publicly, or to update the reasons actual results could differ materially from those anticipated in the forward-looking statements, even if new information becomes available in the future. 1
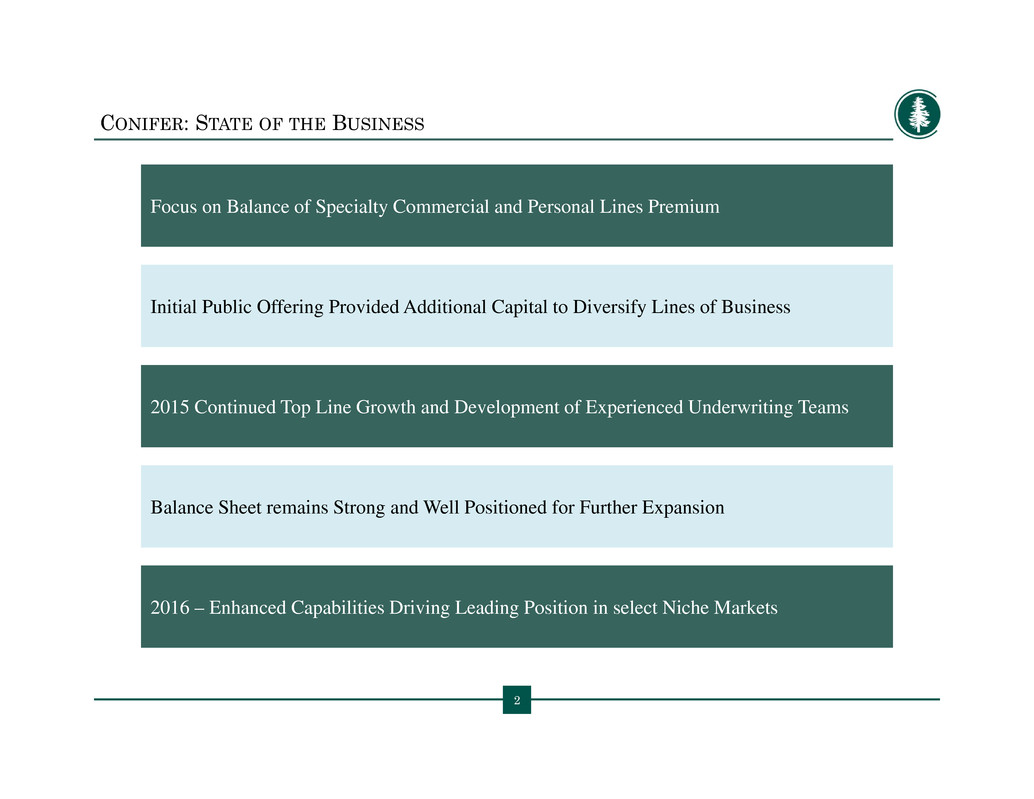
CONIFER: STATE OF THE BUSINESS 2 Focus on Balance of Specialty Commercial and Personal Lines Premium Initial Public Offering Provided Additional Capital to Diversify Lines of Business 2015 Continued Top Line Growth and Development of Experienced Underwriting Teams Balance Sheet remains Strong and Well Positioned for Further Expansion 2016 – Enhanced Capabilities Driving Leading Position in select Niche Markets
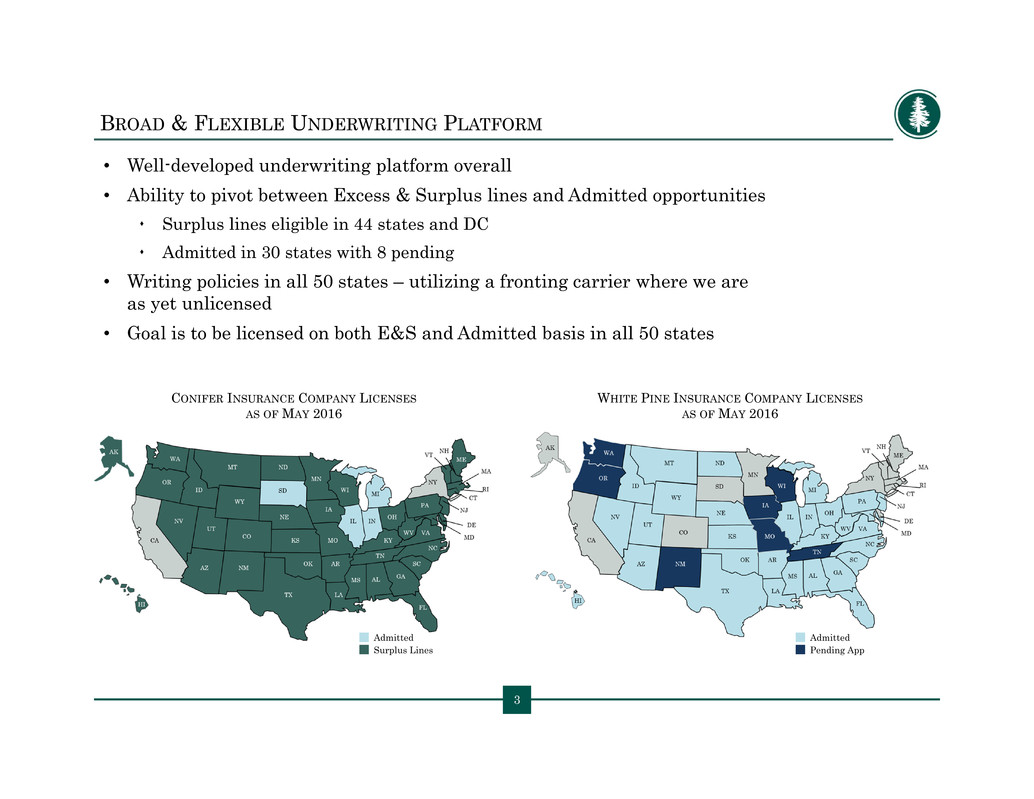
3 BROAD & FLEXIBLE UNDERWRITING PLATFORM • Well-developed underwriting platform overall • Ability to pivot between Excess & Surplus lines and Admitted opportunities Surplus lines eligible in 44 states and DC Admitted in 30 states with 8 pending • Writing policies in all 50 states – utilizing a fronting carrier where we are as yet unlicensed • Goal is to be licensed on both E&S and Admitted basis in all 50 states 3 CONIFER INSURANCE COMPANY LICENSES AS OF MAY 2016 Admitted Surplus Lines WHITE PINE INSURANCE COMPANY LICENSES AS OF MAY 2016 Admitted Pending App
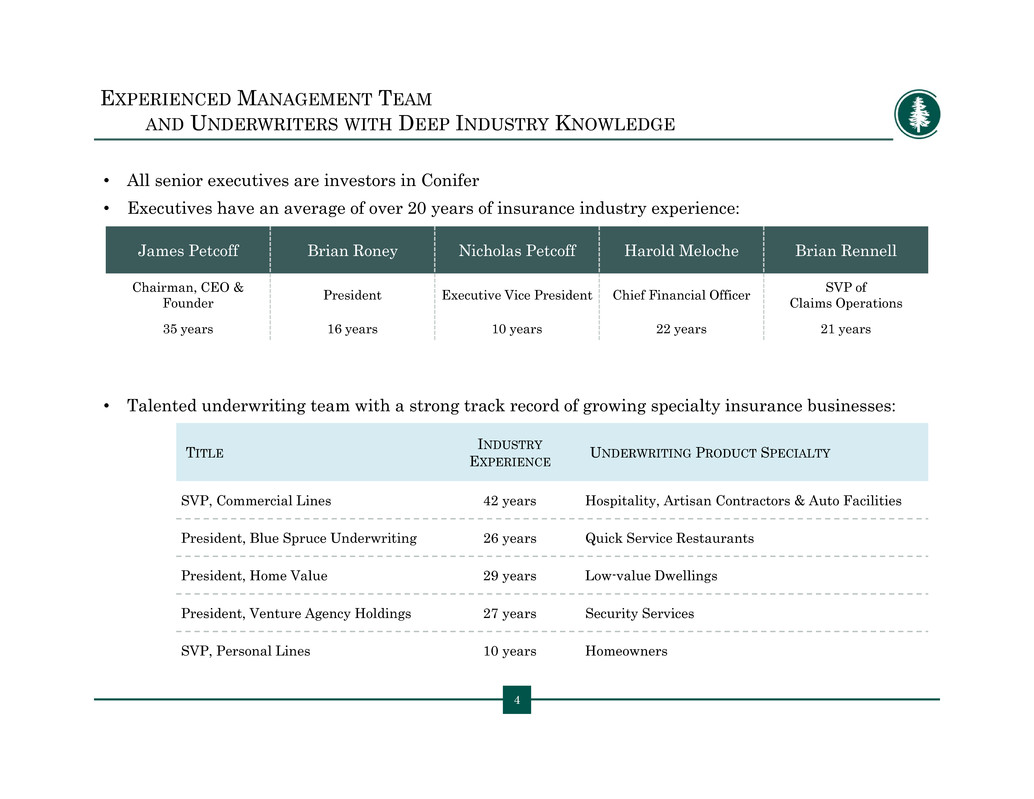
4 EXPERIENCED MANAGEMENT TEAM AND UNDERWRITERS WITH DEEP INDUSTRY KNOWLEDGE • All senior executives are investors in Conifer • Executives have an average of over 20 years of insurance industry experience: • Talented underwriting team with a strong track record of growing specialty insurance businesses: 4 James Petcoff Brian Roney Nicholas Petcoff Harold Meloche Brian Rennell Chairman, CEO & Founder President Executive Vice President Chief Financial Officer SVP of Claims Operations 35 years 16 years 10 years 22 years 21 years TITLE INDUSTRY EXPERIENCE UNDERWRITING PRODUCT SPECIALTY SVP, Commercial Lines 42 years Hospitality, Artisan Contractors & Auto Facilities President, Blue Spruce Underwriting 26 years Quick Service Restaurants President, Home Value 29 years Low-value Dwellings President, Venture Agency Holdings 27 years Security Services SVP, Personal Lines 10 years Homeowners
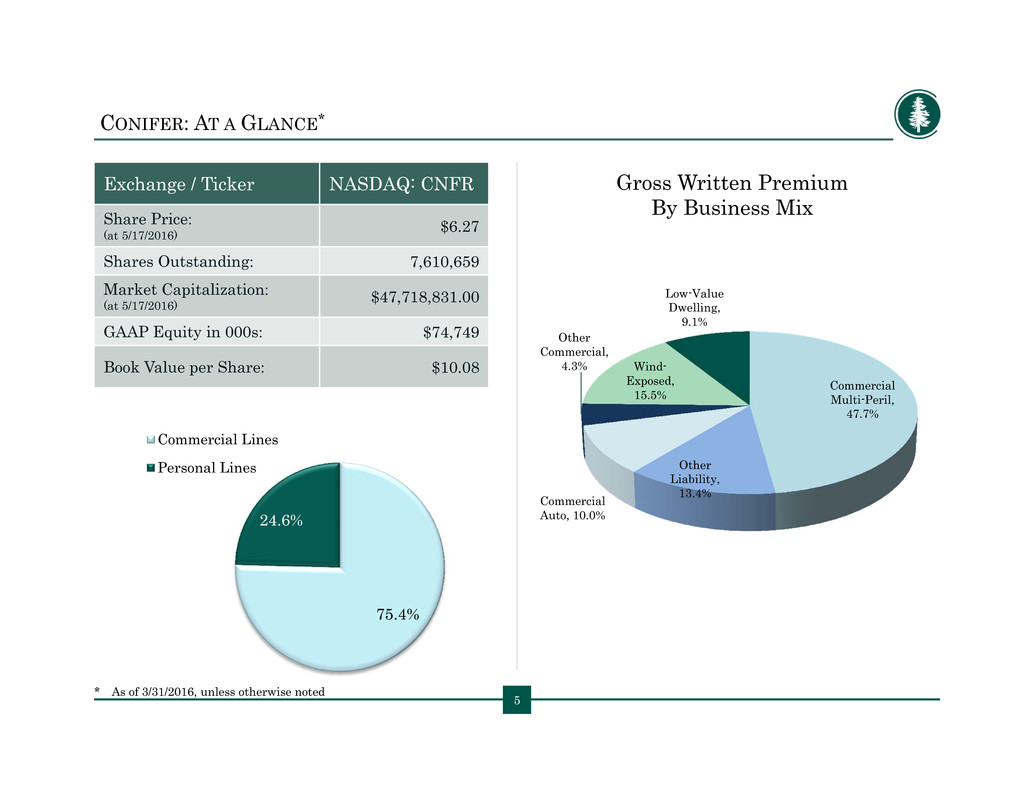
CONIFER: AT A GLANCE* 5 75.4% 24.6% Commercial Lines Personal Lines Commercial Multi-Peril, 47.7% Other Liability, 13.4% Commercial Auto, 10.0% Other Commercial, 4.3% Wind- Exposed, 15.5% Low-Value Dwelling, 9.1% Gross Written Premium By Business Mix * As of 3/31/2016, unless otherwise noted Exchange / Ticker NASDAQ: CNFR Share Price: (at 5/17/2016) $6.27 Shares Outstanding: 7,610,659 Market Capitalization: (at 5/17/2016) $47,718,831.00 GAAP Equity in 000s: $74,749 Book Value per Share: $10.08
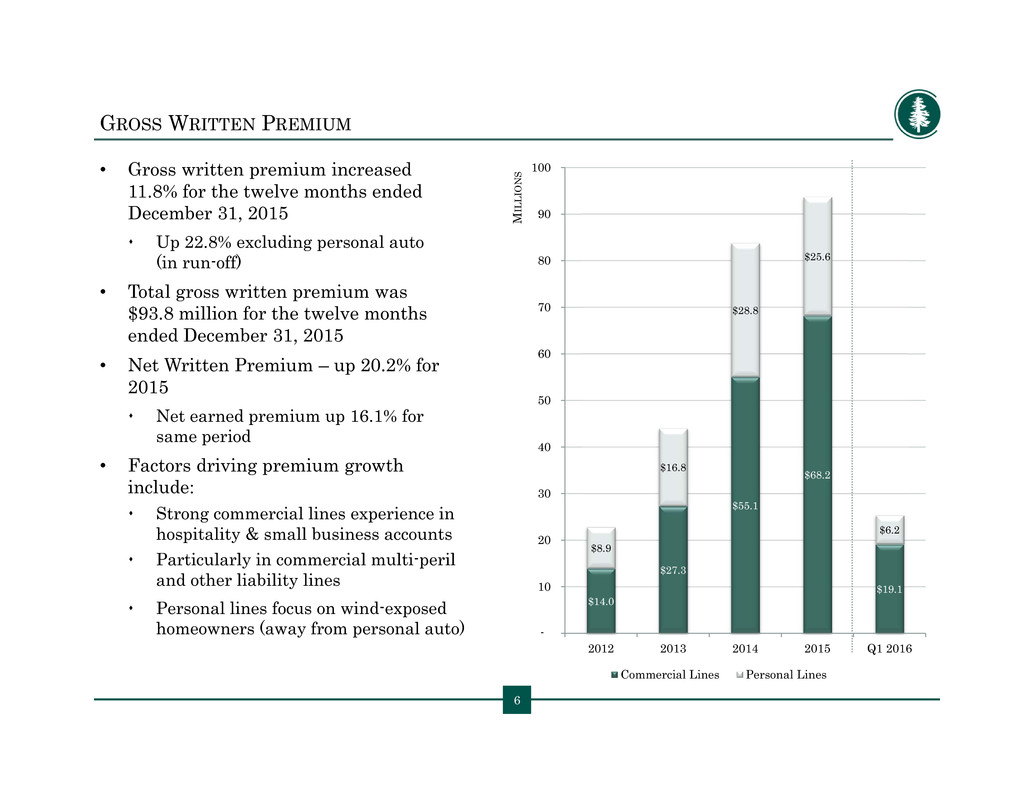
GROSS WRITTEN PREMIUM • Gross written premium increased 11.8% for the twelve months ended December 31, 2015 Up 22.8% excluding personal auto (in run-off) • Total gross written premium was $93.8 million for the twelve months ended December 31, 2015 • Net Written Premium – up 20.2% for 2015 Net earned premium up 16.1% for same period • Factors driving premium growth include: Strong commercial lines experience in hospitality & small business accounts Particularly in commercial multi-peril and other liability lines Personal lines focus on wind-exposed homeowners (away from personal auto) 6 $14.0 $27.3 $55.1 $68.2 $19.1 $8.9 $16.8 $28.8 $25.6 $6.2 - 10 20 30 40 50 60 70 80 90 100 2012 2013 2014 2015 Q1 2016 M I L L I O N S Commercial Lines Personal Lines
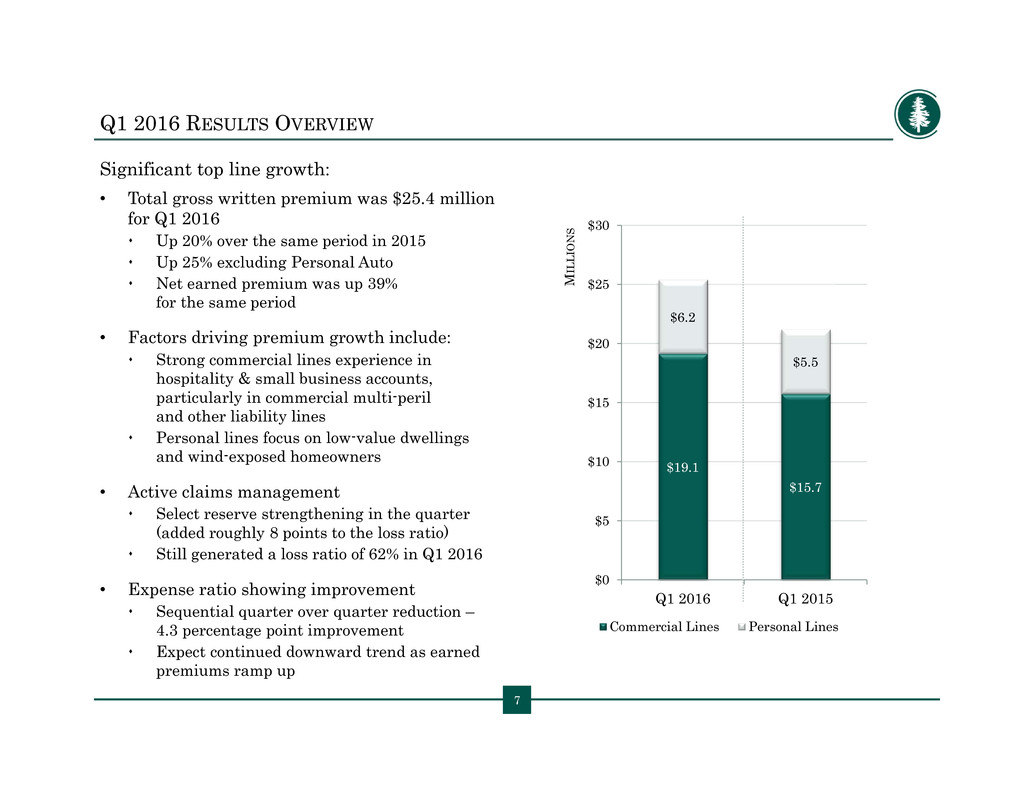
$19.1 $15.7 $6.2 $5.5 $0 $5 $10 $15 $20 $25 $30 Q1 2016 Q1 2015 M I L L I O N S Commercial Lines Personal Lines Q1 2016 RESULTS OVERVIEW Significant top line growth: • Total gross written premium was $25.4 million for Q1 2016 Up 20% over the same period in 2015 Up 25% excluding Personal Auto Net earned premium was up 39% for the same period • Factors driving premium growth include: Strong commercial lines experience in hospitality & small business accounts, particularly in commercial multi-peril and other liability lines Personal lines focus on low-value dwellings and wind-exposed homeowners • Active claims management Select reserve strengthening in the quarter (added roughly 8 points to the loss ratio) Still generated a loss ratio of 62% in Q1 2016 • Expense ratio showing improvement Sequential quarter over quarter reduction – 4.3 percentage point improvement Expect continued downward trend as earned premiums ramp up 7
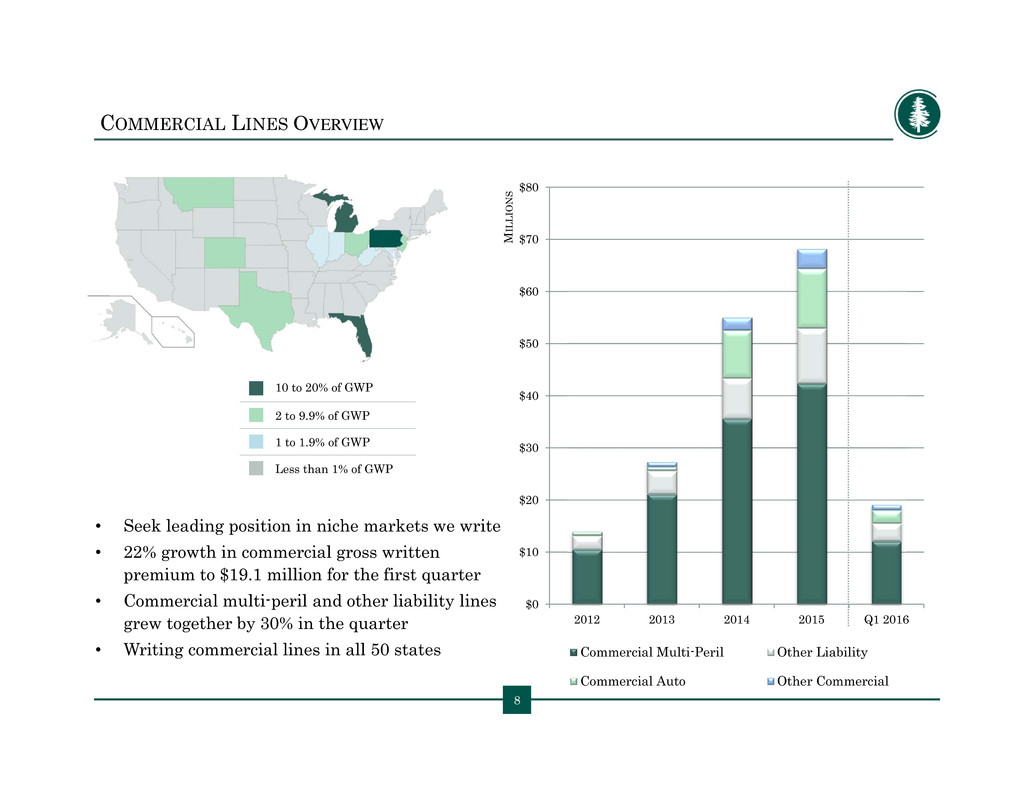
$0 $10 $20 $30 $40 $50 $60 $70 $80 2012 2013 2014 2015 Q1 2016 M I L L I O N S Commercial Multi-Peril Other Liability Commercial Auto Other Commercial COMMERCIAL LINES OVERVIEW • Seek leading position in niche markets we write • 22% growth in commercial gross written premium to $19.1 million for the first quarter • Commercial multi-peril and other liability lines grew together by 30% in the quarter • Writing commercial lines in all 50 states 8 10 to 20% of GWP 2 to 9.9% of GWP 1 to 1.9% of GWP Less than 1% of GWP

$0 $5 $10 $15 $20 $25 $30 $35 2012 2013 2014 2015 Q1 2016 M I L L I O N S Low-value Dwelling Wind-exposed Personal Auto (run-off) • In continuing lines, gross written premium was up 34% during the first quarter • Increase in wind-exposed homeowners focusing on coastal exposures in Florida, Hawaii and Texas • Low-value dwelling ramp up primarily in southern states, such as Texas and northern Louisiana PERSONAL LINES: LOW-VALUE DWELLING & WIND-EXPOSED HOMEOWNERS ($ in thousands) Q1 2016 Top Five States Texas $ 3,075 48.7% Florida 1,128 17.9% Indiana 953 15.1& Hawaii 847 13.4% Illinois 214 3.4% All Other 98 1.5% Total $ 6,315 100.0 % 9
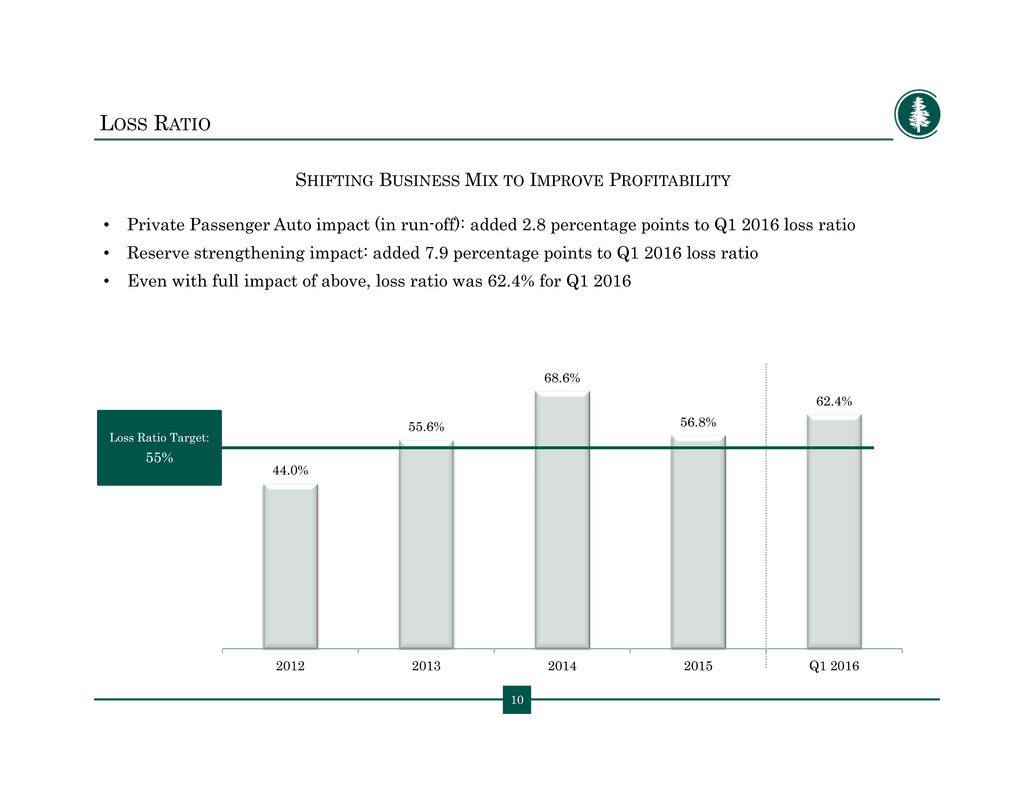
10 SHIFTING BUSINESS MIX TO IMPROVE PROFITABILITY • Private Passenger Auto impact (in run-off): added 2.8 percentage points to Q1 2016 loss ratio • Reserve strengthening impact: added 7.9 percentage points to Q1 2016 loss ratio • Even with full impact of above, loss ratio was 62.4% for Q1 2016 44.0% 55.6% 68.6% 56.8% 62.4% 2012 2013 2014 2015 Q1 2016 LOSS RATIO 10 Loss Ratio Target: 55%
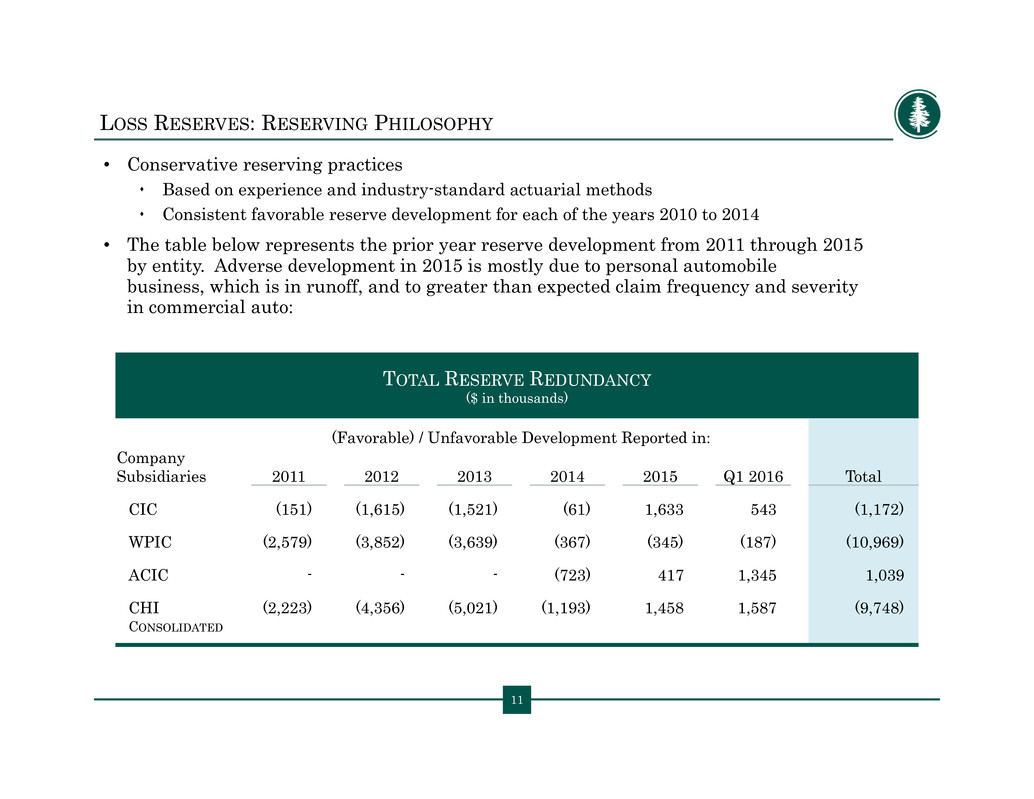
11 LOSS RESERVES: RESERVING PHILOSOPHY • Conservative reserving practices Based on experience and industry-standard actuarial methods Consistent favorable reserve development for each of the years 2010 to 2014 • The table below represents the prior year reserve development from 2011 through 2015 by entity. Adverse development in 2015 is mostly due to personal automobile business, which is in runoff, and to greater than expected claim frequency and severity in commercial auto: TOTAL RESERVE REDUNDANCY ($ in thousands) (Favorable) / Unfavorable Development Reported in: Company Subsidiaries 2011 2012 2013 2014 2015 Q1 2016 Total CIC (151) (1,615) (1,521) (61) 1,633 543 (1,172) WPIC (2,579) (3,852) (3,639) (367) (345) (187) (10,969) ACIC - - - (723) 417 1,345 1,039 CHI (2,223) (4,356) (5,021) (1,193) 1,458 1,587 (9,748) CONSOLIDATED

12 EXPENSE RATIO: TRENDING DOWNWARD • Total expense ratio of 49.8% in the Q1 2016 – versus 54.1% in Q4 2015 • Sequential expense ratio improvement quarter to quarter – 4.3 percentage points • Factors driving expense ratio: Added experienced underwriting teams in 2015 – for both commercial and personal lines Quota share reinsurance impact compared to first quarter in 2015 Additional infrastructure associated with being a public company • Expect continuing downward trend as earned premiums grow – quarter to quarter 12 64.8% 59.1% 45.2% 45.3% 49.8% 2012 2013 2014 2015 Q1 2016 EXPENSE RATIO

13 CONSERVATIVE INVESTMENT STRATEGY • Investment philosophy is to maintain a highly liquid portfolio of investment-grade fixed income securities • Total cash & investment securities of $135M at March 31, 2016: Average duration: 3.1 years Average tax-equivalent yield: ~2% Average credit quality: AA FIXED INCOME PORTFOLIO CREDIT RATING ($ in thousands) March 31, 2016 Fair Value % of Total AAA $ 31,823 28% AA 41,556 36% A 24,585 22% BBB 15,760 14% TOTAL FIXED INCOME INVESTMENTS $ 114,565 100% 5% 13% 33% 41% 4% 5% PORTFOLIO ALLOCATION U.S. Government Obligations State & Local Governments Corporate Debt Commercial Mortgage & Asset-Backed Securities Equity Securities Short-Term Investments

CONIFER: FOCUSED ON EXECUTION THROUGHOUT REMAINDER OF 2016 14 Balance of Commercial & Personal Specialty Products to Drive Growth in Underserved Niche Markets Leverage Strong Balance Sheet and expect to benefit from Improved Capital Position following 2015 IPO Management focused on Disciplined Underwriting and Conservative Expense Rationalization to Drive Bottom Line Results 2015 Investment in Underwriting Teams & Expanded Infrastructure Platform Expected to Produce Profitable Growth in 2016 and Beyond
