Attached files
| file | filename |
|---|---|
| 8-K - FORM 8-K - CHAMPIONS ONCOLOGY, INC. | v440424_8k.htm |
Exhibit 99.1
1 Investor Presentation May 2016
2 Notice of Forward Looking Statements Thispresentationcontainscertain“forward-lookingstatements,”whichincludeinformationrelatingtofutureevents, future financial performance, strategies, expectations, competitive environment, regulation, and availability of resources. These forward-looking statements include, without limitation, statements regarding projections, predictions,expectations,estimates,orforecastsastoourbusiness,financialandoperationalresults,andfuture economic performance; and statements of management’s goals and objectives and other similar expressions concerningmattersthatarenothistoricalfacts. Forward-looking statements should not be read as a guarantee of future performance or results, and will not necessarily be accurate indications of the times at, or by,which such performance or results will be achieved. Forward-looking statements are based on information available at the time those statements are made or management’s good faith belief as of that time with respect to future events, and are subject to risks and uncertaintiesthatcouldcauseactualperformanceorresultstodiffermateriallyfromthoseexpressedinorsuggested bytheforward-lookingstatements. Forward-lookingstatementsspeakonlyasofthedatethestatementsaremade.Factorsthatcouldcauseactual results to differ from those discussed in the forward-looking statements include, but are not limited to, those describedthe“RiskFactors”sectionofourAnnualReportonForm10-KforthefiscalyearendedApril30,2015,as updatedinoursubsequentreportsfiledwiththeSEC,includingreportsonForm10-Q.Youshouldnotputundue relianceonanyforward-lookingstatements.Weassumenoobligationtoupdateforward-lookingstatementstoreflect actualresults,changesinassumptions,orchangesinotherfactorsaffectingforward-lookinginformation,exceptto the extent required by applicable securities laws. If we do update one or more forward-looking statements, no inference should be drawn that we will make additional updates with respect to those or other forward-looking statements.
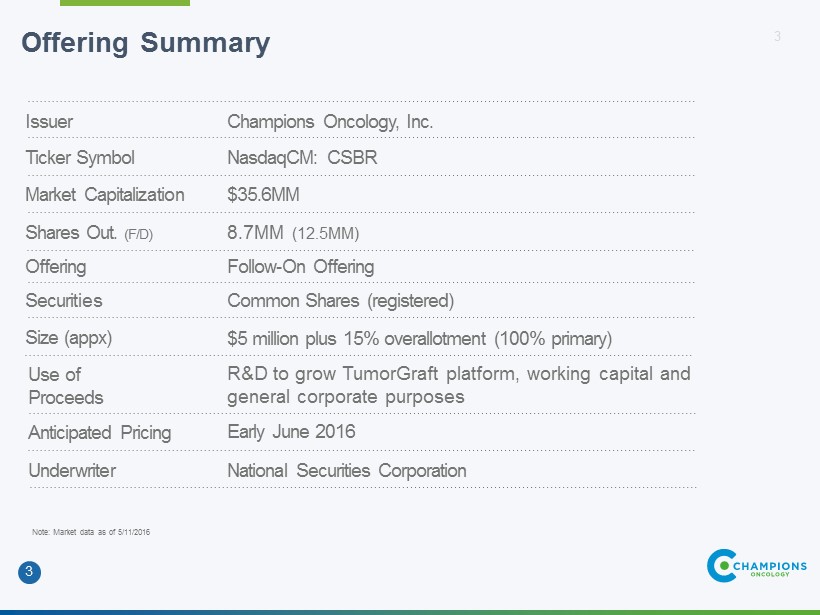
3 Offering Summary 3 Note: Market data as of 5/11/2016 Issuer Champions Oncology, Inc. Securities Common Shares (registered) Useof Proceeds R&D to grow TumorGraft platform, working capital and general corporate purposes Underwriter NationalSecuritiesCorporation Anticipated Pricing Early June 2016 TickerSymbol NasdaqCM: CSBR Market Capitalization $35.6MM Shares Out. (F/D) 8.7MM (12.5MM) Offering Follow-OnOffering Size (appx) $5million plus 15% overallotment (100% primary)
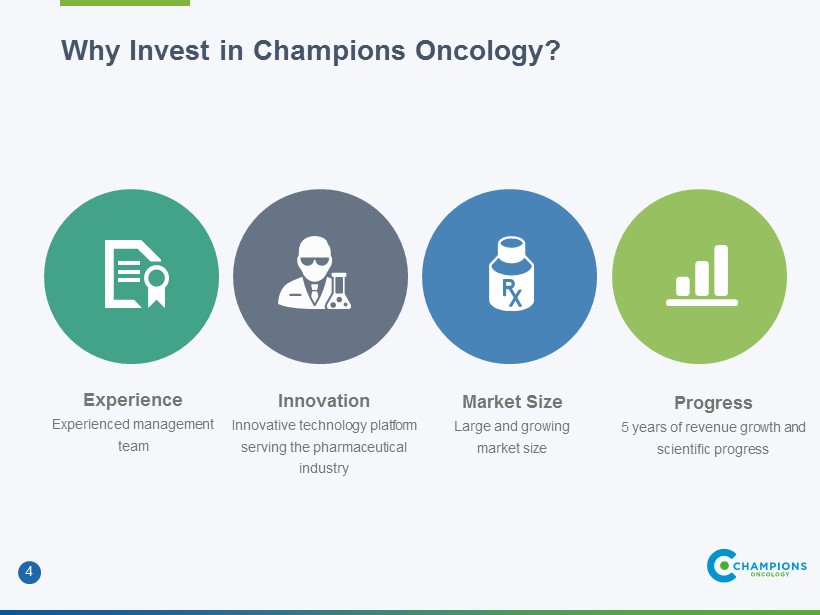
4 Why Invest in Champions Oncology? Innovation Innovative technology platform serving the pharmaceutical industry Market Size Large and growing market size Experience Experienced management team Progress 5 years of revenue growth and scientific progress
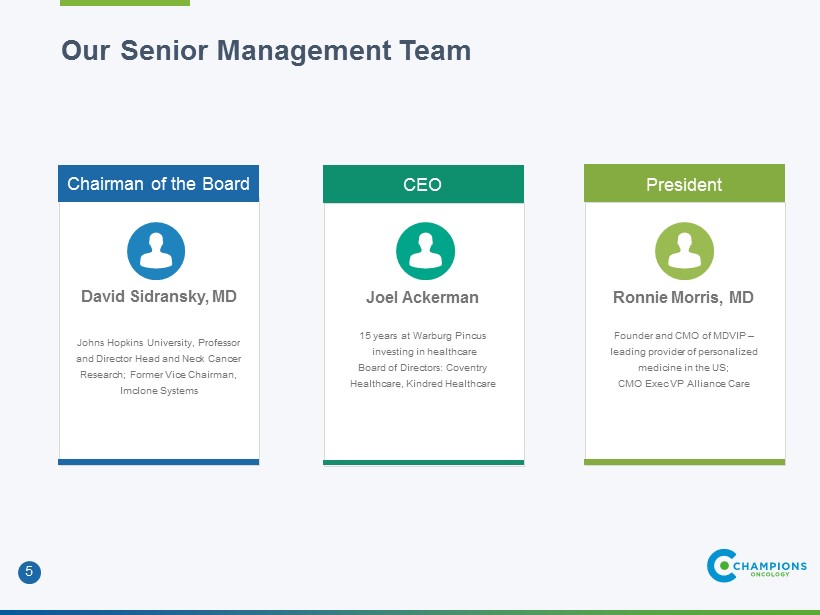
5 Our Senior Management Team Joel Ackerman 15 years at Warburg Pincus investing in healthcare Board of Directors: Coventry Healthcare, Kindred Healthcare CEO David Sidransky, MD Johns Hopkins University, Professor and Director Head and Neck Cancer Research; Former Vice Chairman, Imclone Systems Chairman of the Board Ronnie Morris, MD Founder and CMO of MDVIP – leading provider of personalized medicine in the US; CMO Exec VP Alliance Care President

6 The Problem with Oncology Drugs Despite Advances, Response Rates Remain Low Skyrocketing R&D Costs Failure Rates Remain High Unsustainable Increases in Oncology Drug Costs $1.2 billion average capital outlay per approved biopharmaceutical Average monthly cost of more than $11,000 for new cancer drugs 0% 20% 40% 60% 1 2 3 Line Therapy R e s p o n s e R a t e s 93% failure rate in clinical trials
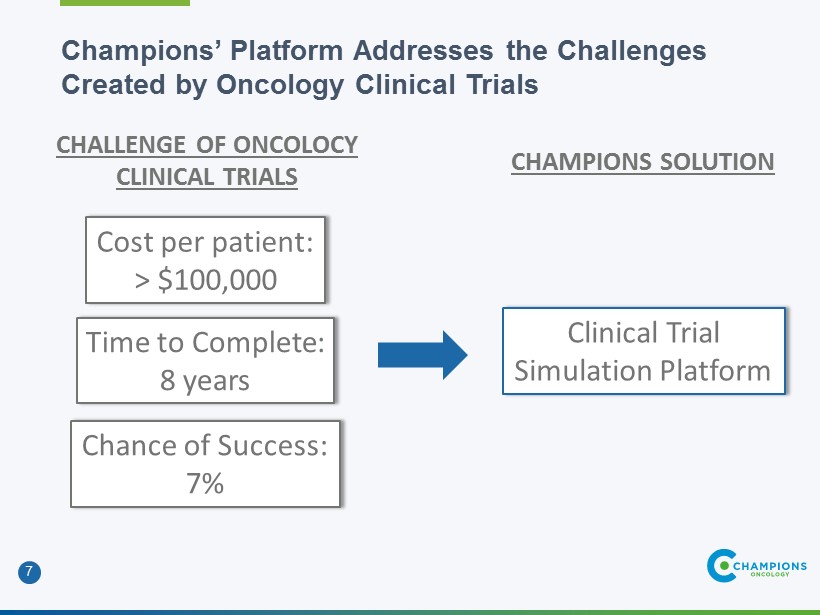
7 Champions’ Platform Addresses the Challenges Created by Oncology Clinical Trials Cost per patient: > $100,000 Time to Complete: 8 years CHALLENGE OF ONCOLOCY CLINICAL TRIALS Clinical Trial Simulation Platform CHAMPIONS SOLUTION Chance of Success: 7%
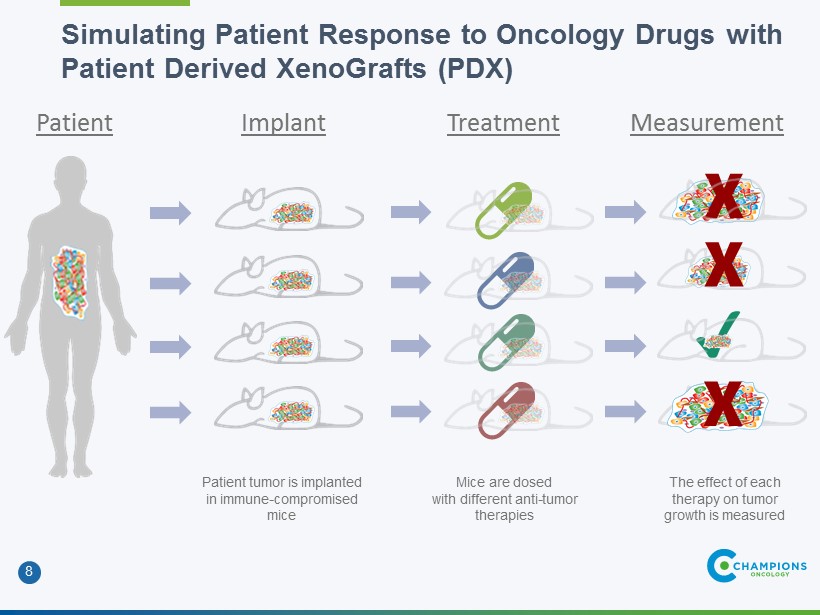
8 ? Simulating Patient Response to Oncology Drugs with Patient Derived XenoGrafts (PDX) Mice are dosed with different anti-tumor therapies Patient tumor is implanted in immune-compromised mice The effect of each therapy on tumor growth is measured ? ? ? Patient Implant Treatment Measurement

9 The Predictive Power of PDX A growing body of evidence demonstrates positive predictive value for Champions TumorGraft® PDX models. Clinical Accuracy Measures Result 95% Cl Positive Predictive Value (PPV) 87%(80/92) 77% -93% Negative Predictive Value (NPV) 94%(32/34) 79% -99% Source: 126 TumorGraft-clinical response correlations from 90 patients, as of January 2016
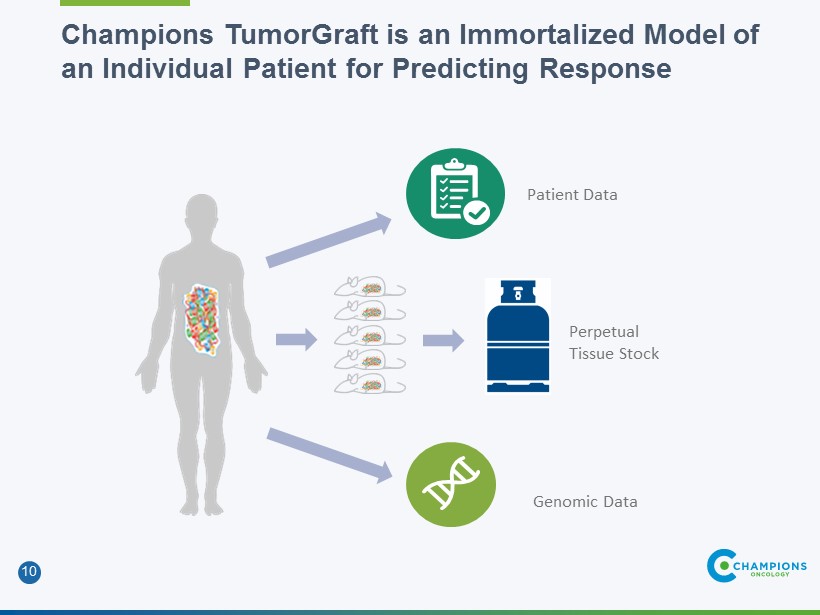
10 Champions TumorGraft is an Immortalized Model of an Individual Patient for Predicting Response Patient Data Perpetual Tissue Stock Genomic Data
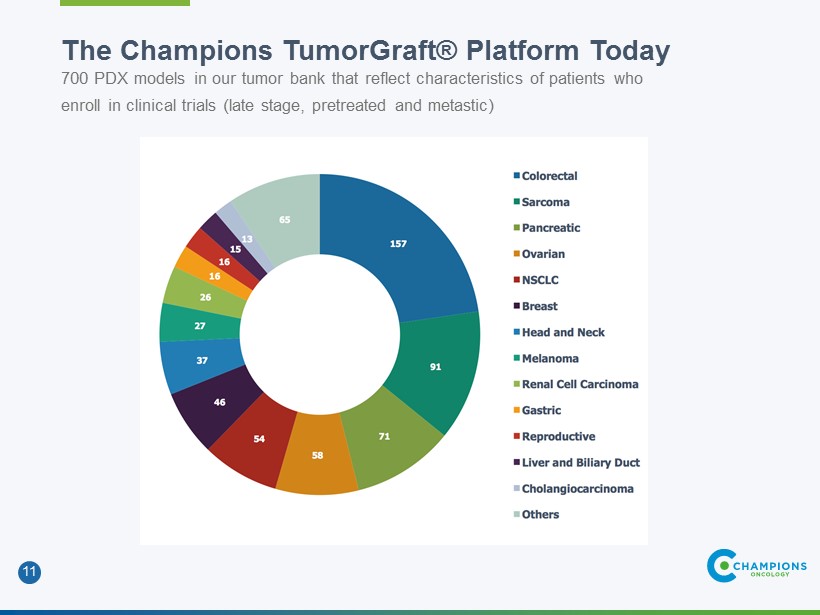
11 The Champions TumorGraft® Platform Today 700 PDX models in our tumor bank that reflect characteristics of patients who enroll in clinical trials (late stage, pretreated and metastic)

12 The Value of Patient Derived Xenografts Economics 90%+ lower costs than a human clinical trial PDX Repeatability Same patient can be run with multiple drugs for head-to-head comparisons Speed 6 months to study completion versus 2-3 years for human trial Predictability 90%+ accuracy in predicting human response
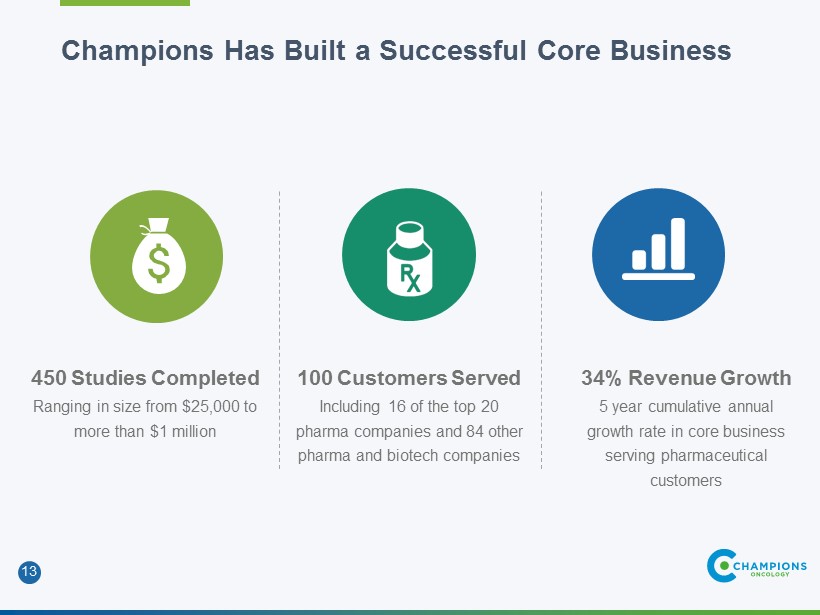
13 Champions Has Built a Successful Core Business 450 Studies Completed Ranging in size from $25,000 to more than $1 million 100 Customers Served Including 16 of the top 20 pharma companies and 84 other pharma and biotech companies 34% Revenue Growth 5 year cumulative annual growth rate in core business serving pharmaceutical customers
14 Three Strategies for Accelerating Revenue Growth Immune Oncology Grow the Platform Innovative Study Designs
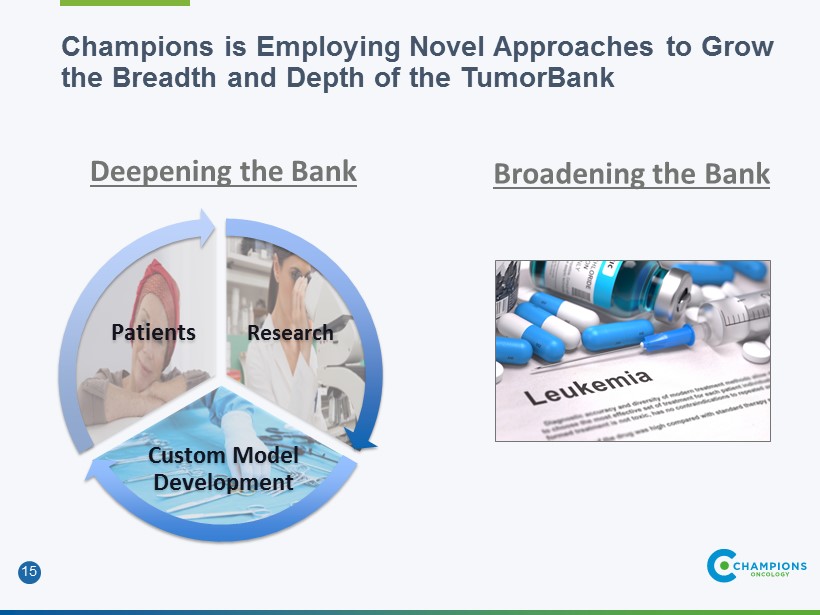
15 Champions is Employing Novel Approaches to Grow the Breadth and Depth of the TumorBank Deepening the Bank Research Custom Model Development Patients Broadening the Bank
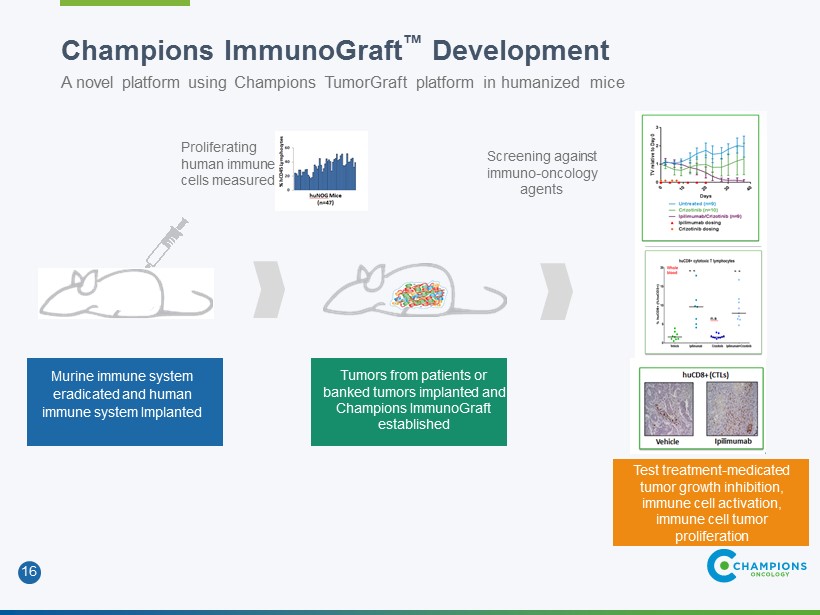
16 Champions ImmunoGraft ™ Development A novel platform using Champions TumorGraft platform in humanized mice Proliferating human immune cells measured Screening against immuno-oncology agents Murine immune system eradicated and human immune system Implanted Tumors from patients or banked tumors implanted and Champions ImmunoGraft established Test treatment-medicated tumor growth inhibition, immune cell activation, immune cell tumor proliferation
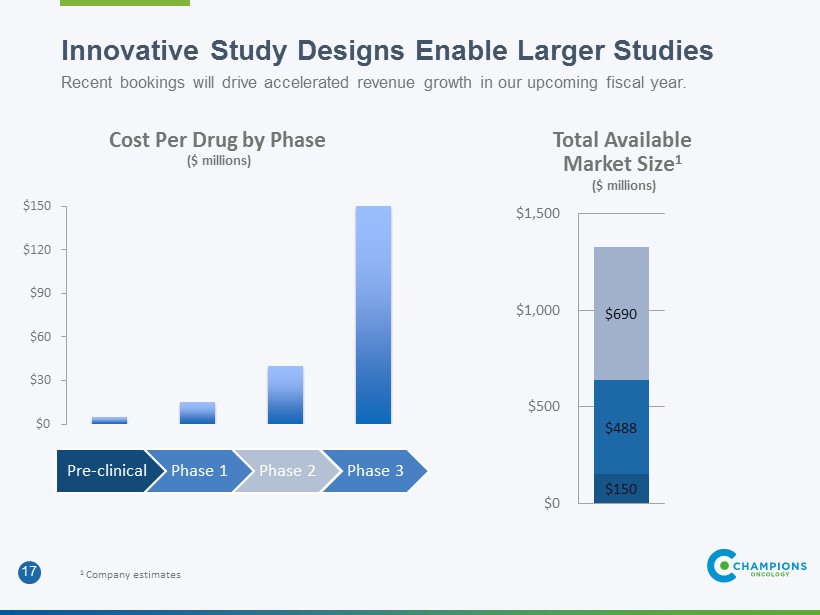
17 Pre-clinical Phase 1 Phase 2 Phase 3 $0 $30 $60 $90 $120 $150 Cost Per Drug by Phase ($ millions) $150 $488 $690 $0 $500 $1,000 $1,500 Total Available Market Size 1 ($ millions) 1 Company estimates Innovative Study Designs Enable Larger Studies Recent bookings will drive accelerated revenue growth in our upcoming fiscal year.
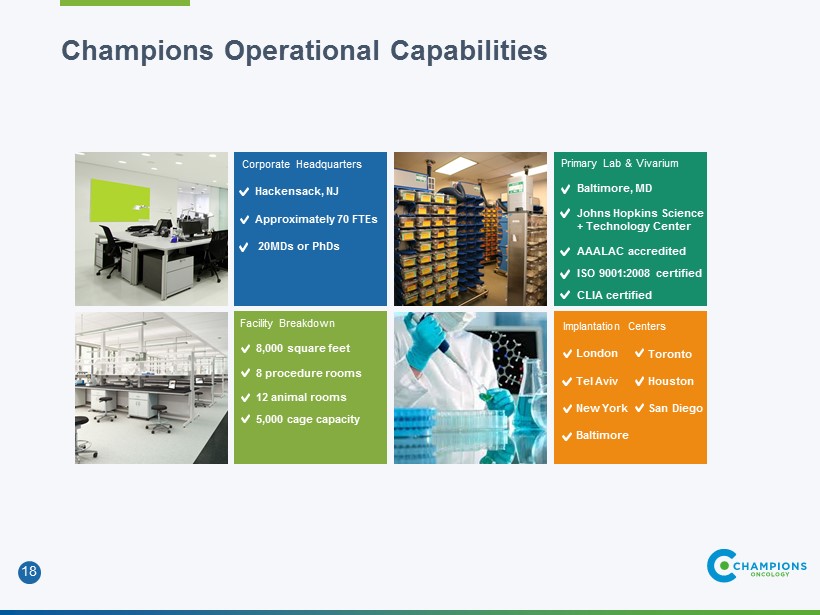
18 Champions Operational Capabilities Corporate Headquarters Hackensack, NJ Approximately 70 FTEs 20MDs or PhDs Primary Lab & Vivarium Baltimore, MD Johns Hopkins Science + Technology Center AAALAC accredited ISO 9001:2008 certified CLIA certified Facility Breakdown 8,000 square feet 8 procedure rooms 12 animal rooms 5,000 cage capacity Implantation Centers London Tel Aviv New York Baltimore Toronto Houston San Diego
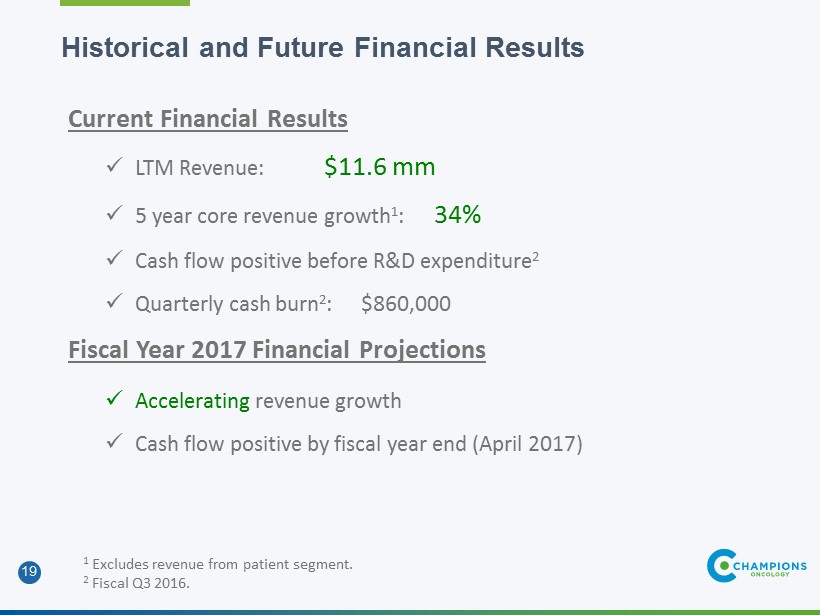
19 Historical and Future Financial Results Current Financial Results x LTM Revenue: $11.6 mm x 5 year core revenue growth 1 : 34% x Cash flow positive before R&D expenditure 2 x Quarterly cash burn 2 : $860,000 Fiscal Year 2017 Financial Projections x Acceleratingrevenue growth x Cash flow positive by fiscal year end (April 2017) 1 Excludes revenue from patient segment. 2 Fiscal Q3 2016.
20 Upcoming Milestones Strategic Commercial Partnerships Sponsored R&D Collaborations New Product Introductions
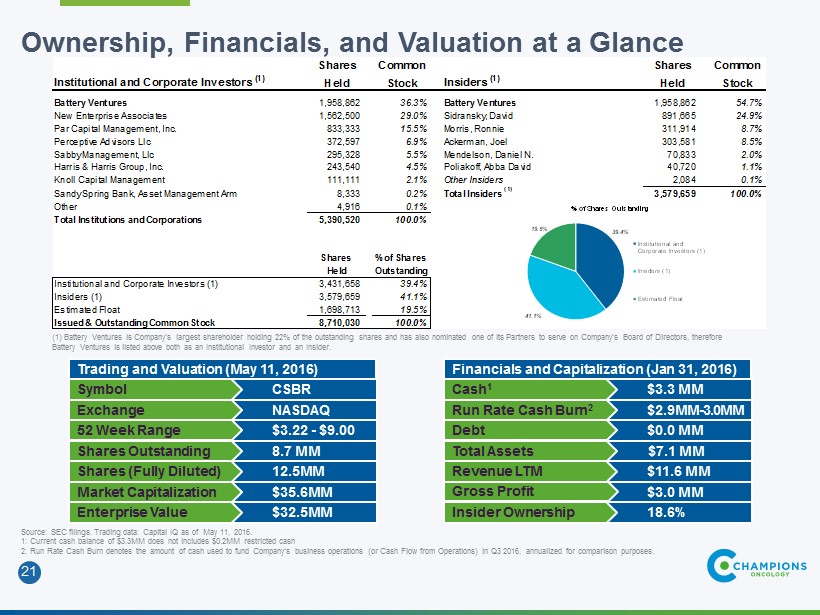
21 Shares Common Shares Common Institutional and Corporate Investors (1) Held Stock Insiders (1) Held Stock Battery Ventures 1,958,862 36.3% Battery Ventures 1,958,862 54.7% New Enterprise Associates 1,562,500 29.0% Sidransky, David 891,665 24.9% Par Capital Management, Inc. 833,333 15.5% Morris, Ronnie 311,914 8.7% Perceptive Advisors Llc 372,597 6.9% Ackerman, Joel 303,581 8.5% Sabby Management, Llc 295,328 5.5% Mendelson, Daniel N. 70,833 2.0% Harris & Harris Group, Inc. 243,540 4.5% Poliakoff, Abba David 40,720 1.1% Knoll Capital Management 111,111 2.1% Other Insiders 2,084 0.1% Sandy Spring Bank, Asset Management Arm 8,333 0.2% Total Insiders (1) 3,579,659 100.0% Other 4,916 0.1% Total Institutions and Corporations 5,390,520 100.0% Shares % of Shares Held Outstanding Institutional and Corporate Investors (1) 3,431,658 39.4% Insiders (1) 3,579,659 41.1% Estimated Float 1,698,713 19.5% Issued & Outstanding Common Stock 8,710,030 100.0% Ownership, Financials, and Valuation at a Glance Source: SEC filings. Trading data: Capital IQ as of May 11, 2016. 1: Current cash balance of $3.3MM does not includes $0.2MM restricted cash 2: Run Rate Cash Burn denotes the amount of cash used to fund Company’s business operations (or Cash Flow from Operations) in Q32016, annualized for comparison purposes. $35.6MMMarket Capitalization 8.7 MMShares Outstanding CSBRSymbol NASDAQExchange $3.22 -$9.00 52 Week Range 12.5MMShares (Fully Diluted) Trading and Valuation (May 11, 2016) $32.5MMEnterprise Value $0.0 MM $7.1 MM $11.6 MMRevenue LTM $3.3 MMCash 1 Total Assets Debt $2.9MM-3.0MMRun Rate Cash Burn 2 Financials and Capitalization (Jan 31, 2016) $3.0 MM Gross Profit 18.6%Insider Ownership 39.4% 41.1% 19.5% % of Shares Outstanding Institutional and Corporate Investors (1) Insiders (1) Estimated Float (1) BatteryVentures is Company’s largest shareholder holding 22% of the outstanding shares and has also nominated one of its Partners to serve on Company’s Board of Directors, therefore Battery Ventures is listed above both as an Institutional Investor and an Insider.
22 CHAMPIONS ONCOLOGY One University Plaza | Suite 307 Hackensack, NJ OUR EMAIL sforeman@championsoncology.com OUR PHONE 201.808.8400 OUR WEBSITE www.championsoncology.com