Attached files
| file | filename |
|---|---|
| 8-K - FORM 8-K - ANI PHARMACEUTICALS INC | v440301_8k.htm |
| EX-99.1 - EXHIBIT 99.1 - ANI PHARMACEUTICALS INC | v440301_ex99-1.htm |
Exhibit 99.2

A Specialty Pharmaceutical Company NASDAQ: ANIP GENERIC AND BRANDED PRESCRIPTION DRUG PRODUCTS Corporate Presentation May 2016
Forward - Looking Statements To the extent any statements made in this presentation deal with information that is not historical, these are forward - looking statements within the meaning of the Private Securities Litigation Reform Act of 1995. Such statements include, but are not limited to, statements about price increases, the Company’s future operations, products financial position, operating results and prospects , the Company’s pipeline or potential markets therefore, and other statements that are not historical in nature, particularly those that utilize terminology such as “anticipates,” “will,” “expects,” “plans,” “potential,” “future,” “believes,” “intends,” “continue,” other words of similar meaning, derivations of such words and the use of future dates. Uncertainties and risks may cause the Company’s actual results to be materially different than those expressed in or implied by such forward - looking statements. Uncertainties and risks include, but are not limited to, the risk that the Company may face with respect to importing raw materials; increased competition; acquisitions; contract manufacturing arrangements; delays or failure in obtaining product approval from the U.S. Food and Drug Administration; general business and economic conditions; market trends; products development; regulatory and other approvals and marketing. More detailed information on these and additional factors that could affect the Company’s actual results are described in the Company’s filings with the Securities and Exchange Commission, including its most recent annual report on Form 10 - K and quarterly reports on Form 10 - Q, as well as its proxy statement. All forward - looking statements in this presentation speak only as of the date of this presentation and are based on the Company’s current beliefs, assumptions, and expectations. The Company undertakes no obligation to update or revise any forward - looking statement, whether as a result of new information, future events or otherwise. 2

3 ANI Mission Statement ANI Pharmaceuticals is an integrated specialty pharmaceutical company developing, manufacturing and marketing branded and generic prescription pharmaceuticals. We focus on niche and high barrier to entry opportunities including controlled substances, anti - cancer (oncolytics), hormones and steroids, and complex formulations.

ANI Senior Management Team 4 At ANI Since Yrs Industry Experience Arthur Przybyl President and CEO 2009 25+ Stephen Carey VP and CFO 2016 20+ Robert Schrepfer VP of Bus. Development 2013 15 Jim Marken VP of Operations 2007 20+ David Sullivan VP of Quality Operations 2014 20

ANI Overview – Positioned for Growth ANI Today ▪ Current business – For the quarter ended March 31, 2016: $20.6 million total net revenues □ $13.3 million Generic Rx product revenues □ $5.6 million Brand Rx product revenues □ $1.7 million c ontract manufacturing/services revenues □ Growth of 9% quarter/quarter ▪ Guidance for 2016 (1) – Net revenues of $119 million to $134 million – Adjusted non - GAAP EBITDA (2) of $55 million to $63 million – Adjusted non - GAAP net income per diluted share (2) of $3.54 to $3.91 ▪ 81 products in development; total current market $4.1 billion (3) (1) May 5, 2016 press release (2) See Appendix A for US GAAP reconciliations (3) Based on Company estimates, and recent IMS and NSP Audit data 5

ANI Financial Highlights 6 First Quarter 2016 Results ($ in millions) Quarter ended March 31, 2016 March 31, 2015 % Growth Net revenues $ 20.6 $ 18.8 9 % Adjusted non - GAAP EBITDA (1) $ 11.4 $ 11.5 - (1) Please see Appendix A for US GAAP reconciliation 2015 Results ($ in millions) Year ended December 31, 2015 December 31, 2014 % Growth Net Revenues $ 76.3 $ 56.0 36% Adjusted non - GAAP EBITDA (1) $ 43.5 $ 27.3 59%
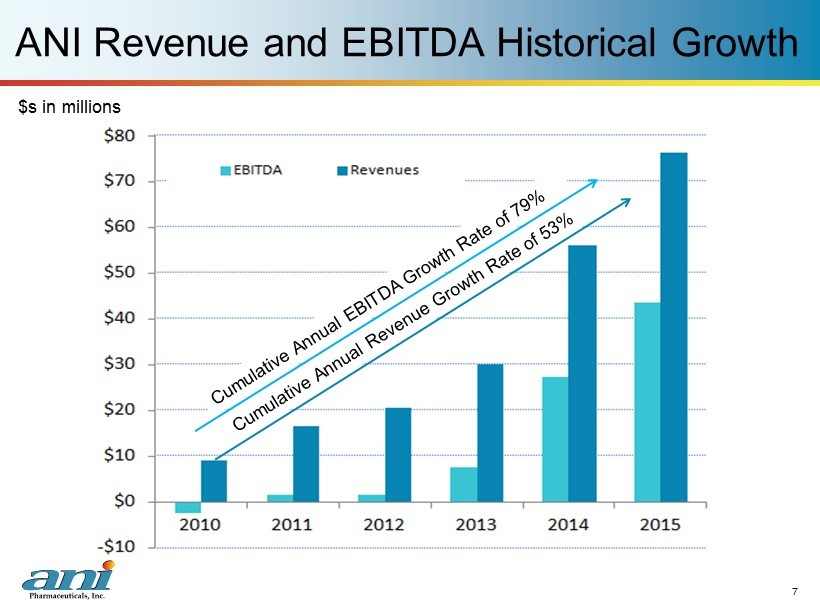
ANI Revenue and EBITDA Historical Growth 7 $s in millions

8 Sales and Marketing Overview
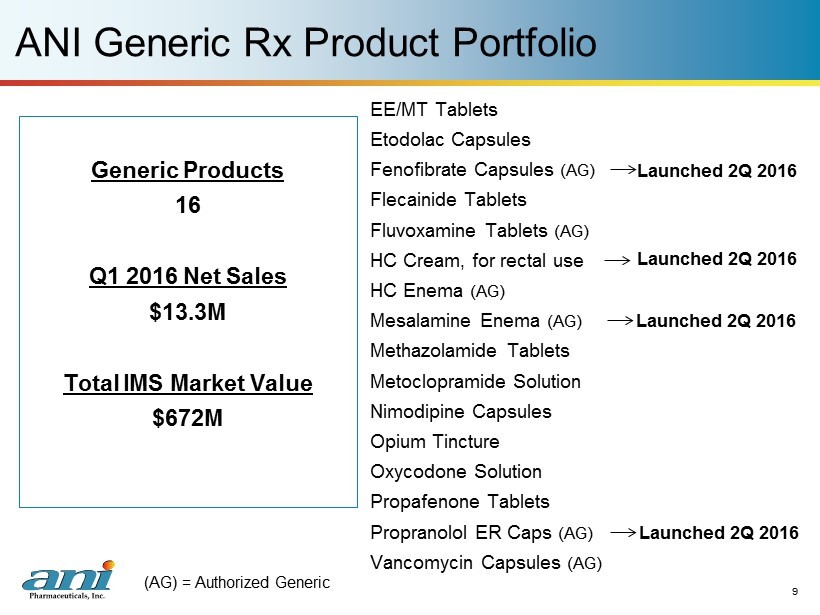
ANI Generic Rx Product Portfolio EE/MT Tablets Etodolac Capsules Fenofibrate Capsules (AG) Flecainide Tablets Fluvoxamine Tablets (AG) HC Cream, for rectal use HC Enema (AG) Mesalamine Enema (AG) Methazolamide Tablets Metoclopramide Solution Nimodipine Capsules Opium Tincture Oxycodone Solution Propafenone Tablets Propranolol ER Caps (AG) Vancomycin Capsules (AG) 9 Generic Products 16 Q1 2016 Net Sales $13.3M Total IMS Market Value $672M (AG) = Authorized Generic Launched 2Q 2016 Launched 2Q 2016 Launched 2Q 2016 Launched 2Q 2016

ANI Brand Rx Product Portfolio 10 Lithobid ® Tablets Bipolar Disorder Vancocin ® Capsules C. difficile - Associated Diarrhea Cortenema ® U lcerative Colitis Reglan ® Gastroesophageal Reflux Q1 2016 Net Sales: $5.6M Inderal ® LA Hypertension Launched April 2016
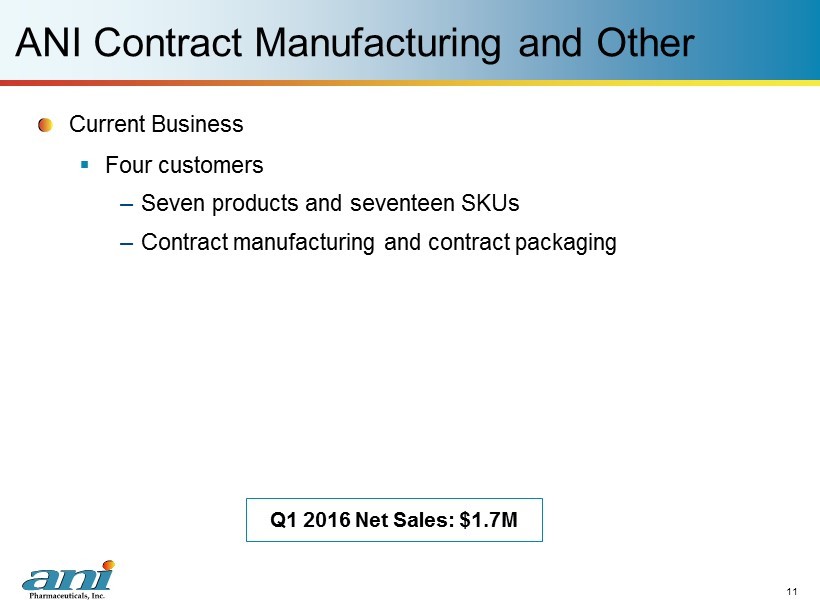
ANI Contract Manufacturing and Other 11 Current Business ▪ Four customers – Seven products and seventeen SKUs – Contract manufacturing and contract packaging Q1 2016 Net Sales: $1.7M

12 Business Development / Product Development Overview
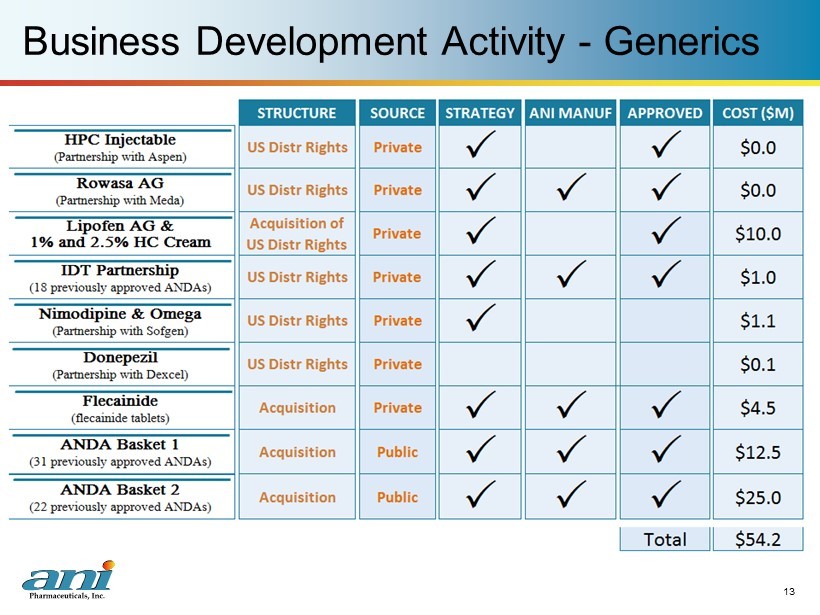
Business Development Activity - Generics 13
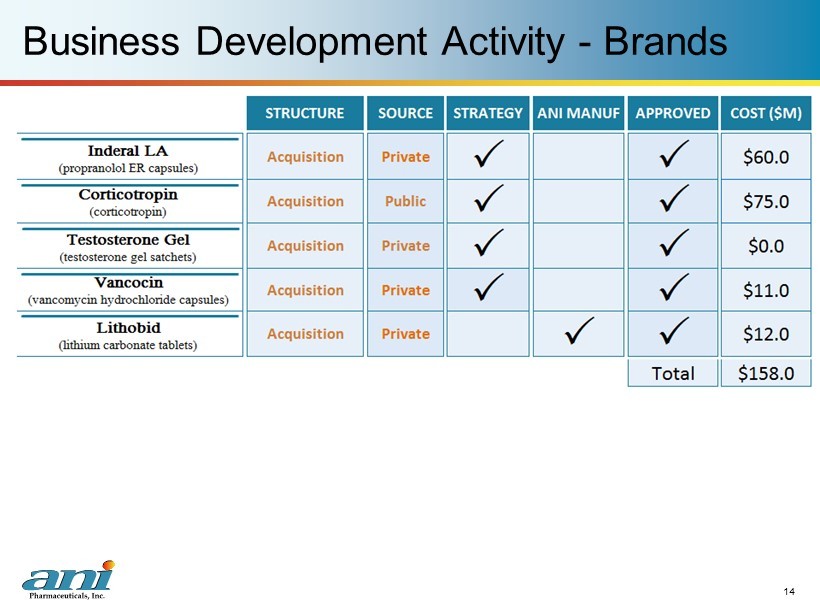
Business Development Activity - Brands 14

15 ANI Product Development Pipeline 81 p roducts in development, total combined current market: $4.1 billion (1) ▪ 55 products were acquired and of those, ANI believes 48 can be commercialized based on either a CBE - 30 or PAS ▪ New product introductions: (1) Based on Company estimates, and recent IMS and NSP Audit data (2) FDA’s Revised Target Action Date, per FDA communications Product Total Annual Market Size (1) Estimated Launch FDA Status Oxycodone capsules $7.5M June 2016 Approved Anti - cancer drug Undisclosed June 2016 ANDA Hydroxyprogesterone Caproate Injection NA June 2016 Approved Donepezil $ 41M Q3 2016 Approved Anti - infective $78M Q3 2016 CBE - 30 Three IDT products $86M Q3 2016/ Q4 2016 CBE - 30s Three C - II products (TADs (2) 1/2/2017 & 2/15/17 ) $39M Q1 2017 ANDAs

16 Manufacturing Overview

17 ANI Manufacturing – Main Street Facility Location: Baudette , Minnesota ▪ 52,000 square feet of manufacturing , packaging, and warehouse facilities ▪ Rx solutions , suspensions , topicals , tablets , and capsules ▪ DEA - licensed for Schedule II controlled substances ▪ 17,000 square feet of laboratory space for product development and analytical testing

18 ANI Manufacturing – IDC Road Facility Location: Baudette, Minnesota ▪ Fully - contained h igh potency facility with capabilities to manufacture h ormone , steroid , and oncolytic products ▪ 47,000 square feet of manufacturing and packaging, and warehouse facilities ▪ 100 nano - gram per eight - hour weighted average maximum exposure limit to ensure employee safety ▪ DEA Schedule IIIN capability

ANI Summary ANI is an integrated specialty generic pharmaceutical firm with: ▪ Profitable base business generating organic growth – 2016 Annual guidance (1) □ Net revenues of $119 million to $134 million □ Adjusted non - GAAP EBITDA (2) of $55 million to $63 million □ Adjusted non - GAAP Net Income Per Diluted Share (2) of $3.54 to $3.91 ▪ Strong capital position ▪ Experienced management team ANI is focused on: ▪ Partnerships/strategic alliances ▪ Accretive acquisitions ▪ Internal product development 19 (1) May 5, 2016 press release (2) See Appendix A for US GAAP reconciliations

20 Appendix A
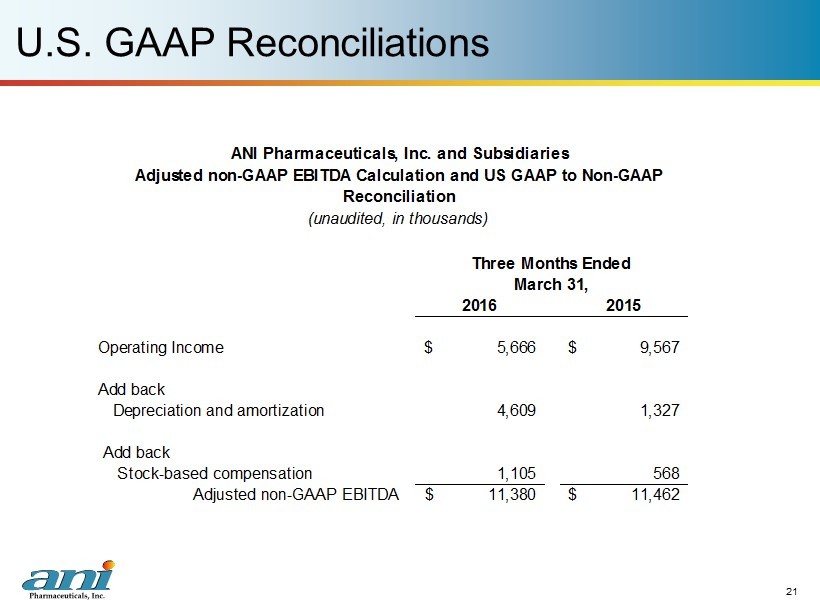
U.S. GAAP Reconciliations 21 2016 2015 Operating Income 5,666$ 9,567$ Add back Depreciation and amortization 4,609 1,327 Add back Stock-based compensation 1,105 568 Adjusted non-GAAP EBITDA 11,380$ 11,462$ ANI Pharmaceuticals, Inc. and Subsidiaries Adjusted non-GAAP EBITDA Calculation and US GAAP to Non-GAAP Reconciliation (unaudited, in thousands) Three Months Ended March 31,

U.S. GAAP Reconciliations 22 2016 2015 Net Income 1,346$ 4,369 Add back Tax provision 1,540 2,541 Depreciation and amortization expense 4,609 1,327 Non-cash interest expense 1,725 1,683 Stock-based compensation 1,105 568 Excess of Fair Value over Cost of Acquired Inventory - - Less Current portion of tax provision (1,620) (2,238) Adjusted non-GAAP Net Income 8,705$ 8,250$ Diluted Weighted-Average Shares Outstanding 11,489 11,562 Adjusted non-GAAP Net Income Per Diluted Share 0.76$ 0.71$ ANI Pharmaceuticals, Inc. and Subsidiaries Adjusted non-GAAP Net Income and Adjusted non-GAAP Net Income per Diluted Share Reconciliation (unaudited, in thousands, except per share amounts) Three Months Ended March 31,

U.S. GAAP Reconciliations 23 2015 2014 Operating Income $32,700 $20,006 Add back Depreciation and amortization 6,900 3,878 Add back Stock-based compensation 3,856 3,423 Adjusted non-GAAP EBITDA $43,456 $27,307 ANI Pharmaceuticals, Inc. and Subsidiaries Adjusted non-GAAP EBITDA Calculation and US GAAP to Non-GAAP Reconciliation (unaudited, in thousands) Year ended December 31,
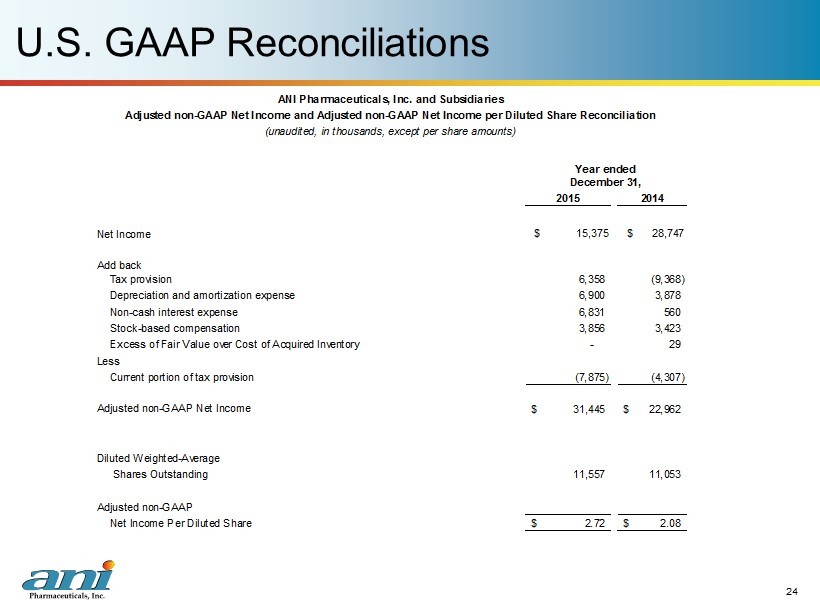
U.S. GAAP Reconciliations 24 2015 2014 Net Income $ 15,375 $ 28,747 Add back Tax provision 6,358 (9,368) Depreciation and amortization expense 6,900 3,878 Non-cash interest expense 6,831 560 Stock-based compensation 3,856 3,423 Excess of Fair Value over Cost of Acquired Inventory - 29 Less Current portion of tax provision (7,875) (4,307) Adjusted non-GAAP Net Income 31,445$ 22,962$ Diluted Weighted-Average Shares Outstanding 11,557 11,053 Adjusted non-GAAP Net Income Per Diluted Share 2.72$ 2.08$ Year ended December 31, ANI Pharmaceuticals, Inc. and Subsidiaries Adjusted non-GAAP Net Income and Adjusted non-GAAP Net Income per Diluted Share Reconciliation (unaudited, in thousands, except per share amounts)