Attached files
| file | filename |
|---|---|
| 8-K - 8-K - WABASH NATIONAL Corp | v440069_8k.htm |
Exhibit 99.1

WABASH NATIONAL CORPORATION Investor Update May 2016

2 This presentation contains certain forward - looking statements, as defined by the Private Securities Litigation Reform Act of 1995. All statements other than historical facts are forward - looking statements, including without limit, those regarding shipment outlook, Operating EBITDA, backlog, demand level expectations, profitability and earnings capacity, adjusted earnings per share guidance, margin opportunities, and potential benefits of any recent acquisitions. Any forward - looking statements are subject to certain risks and uncertainties that could cause actual results to differ materially from those implied by the forward - looking statements. Without limit, these risks and uncertainties include economic conditions, increased competition, dependence on new management, reliance on certain customers and corporate partnerships, shortages and costs of raw materials, manufacturing capacity and cost containment risks, dependence on industry trends, access to capital, acceptance of products, and government regulation. You should review and consider the various disclosures made by the Company in this presentation and in its reports to its stockholders and periodic reports on Forms 10 - K and 10 - Q. We cannot give assurance that the expectations reflected in our forward - looking statements will prove to be correct. Our actual results could differ materially from those anticipated in these forward - looking statements. All written and oral forward - looking statements attributable to us are expressly qualified in their entirety by the factors we disclose that could cause our actual results to differ materially from our expectations. S AFE H ARBOR S TATEMENT © 2016 Wabash National, L.P. All rights reserved. Wabash®, Wabash National®, DuraPlate®, DuraPlate AeroSkirt®, Walker, Brenner® and Beall® are marks owned by Wabash National, L. P. Transcraft® and Benson® are marks owned by Transcraft Corporation.

3 2007 2015 TTM ▪ Gross Margin 8.3% 15.0% 16.0% ▪ Operating Margin 2.4% 8.9% 9.9% ▪ Earnings up 187% since 2007 ($0.52/ sh in ‘07. to $1.49/sh. in ‘15) ▪ Strong free cash flow with > 100% cash conversion ▪ TTM ROIC 21.8% as of 3/31/2016 ▪ $338M of liquidity or 17% of revenue as of 3/31/2016 ▪ 0.5x net leverage as of 3/31/2016 ▪ Significant capacity to fund future growth W ABASH N ATIONAL – C ASE FOR I NVESTMENT New Markets. New Innovation. New Growth. Disciplined Balance Sheet Management Margin Expansion Strong Earnings, Cash Generation & ROIC Balanced Capital Allocation ▪ $66M of shares repurchased in ’15 & ‘16 and an additional $94M approved for additional repurchases in 2016 and 2017 ▪ $25 – $30M of CapEx planned for 2016 ▪ $64M allocated for debt reduction in 2015 and 2016
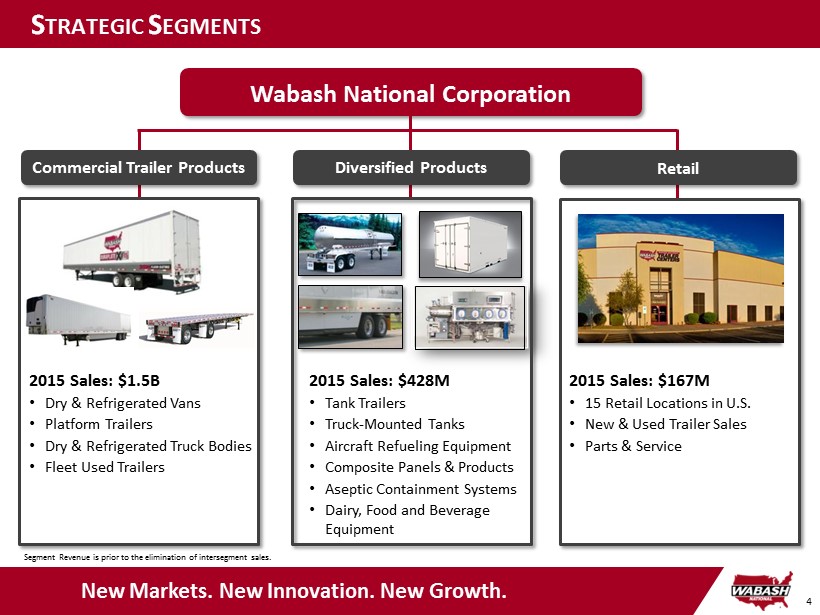
4 S TRATEGIC S EGMENTS Wabash National Corporation Commercial Trailer Products 2015 Sales: $1.5B • Dry & Refrigerated Vans • Platform Trailers • Dry & Refrigerated Truck Bodies • Fleet Used Trailers Diversified Products 2015 Sales: $428M • Tank Trailers • Truck - Mounted Tanks • Aircraft Refueling Equipment • Composite Panels & Products • Aseptic Containment Systems • Dairy, Food and Beverage Equipment New Markets. New Innovation. New Growth. Retail 2015 Sales: $167M • 15 Retail Locations in U.S. • New & Used Trailer Sales • Parts & Service Segment Revenue is prior to the elimination of intersegment sales.
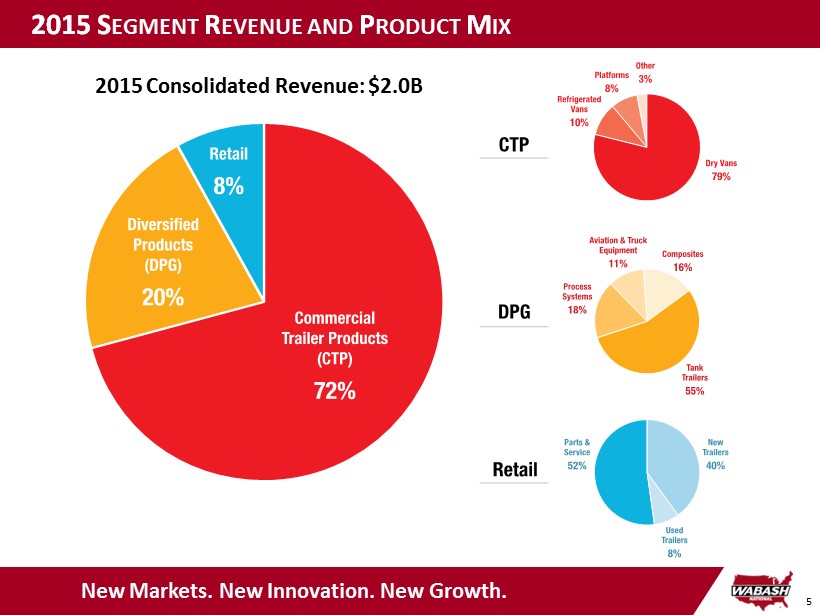
5 2015 S EGMENT R EVENUE AND P RODUCT M IX New Markets. New Innovation. New Growth. 2015 Consolidated Revenue: $2.0B
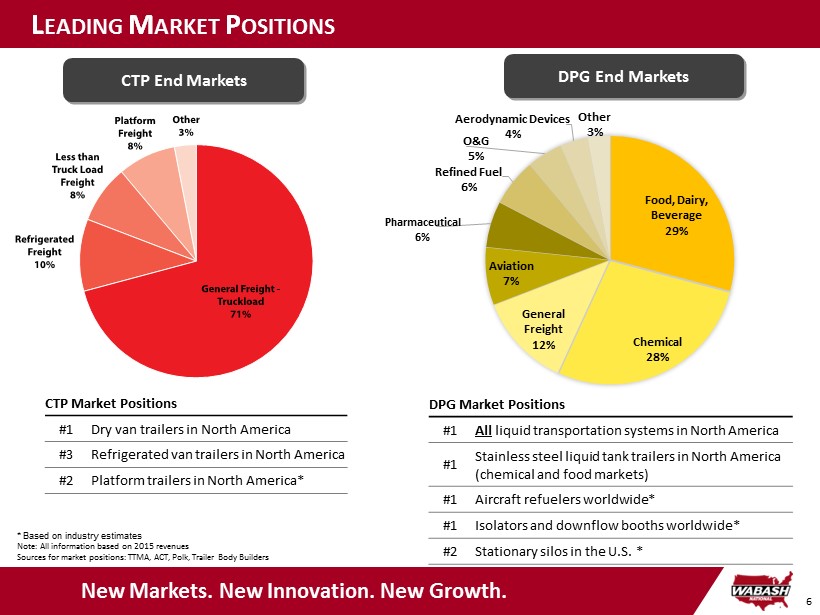
6 L EADING M ARKET P OSITIONS DPG End Markets CTP End Markets DPG Market Positions #1 All liquid transportation systems in North America #1 Stainless steel liquid tank trailers in North America (chemical and food markets) #1 Aircraft refuelers worldwide* #1 Isolators and downflow booths worldwide * #2 Stationary silos in the U.S. * * Based on industry estimates Note: All information based on 2015 revenues Sources for market positions: TTMA, ACT, Polk, Trailer Body Builders CTP Market Positions #1 Dry van trailers in North America #3 Refrigerated van trailers in North America #2 Platform trailers in North America* New Markets. New Innovation. New Growth. Food, Dairy, Beverage 29% Chemical 28% General Freight 12% Aviation 7% Pharmaceutical 6% Refined Fuel 6% O&G 5% Aerodynamic Devices 4% Other 3%
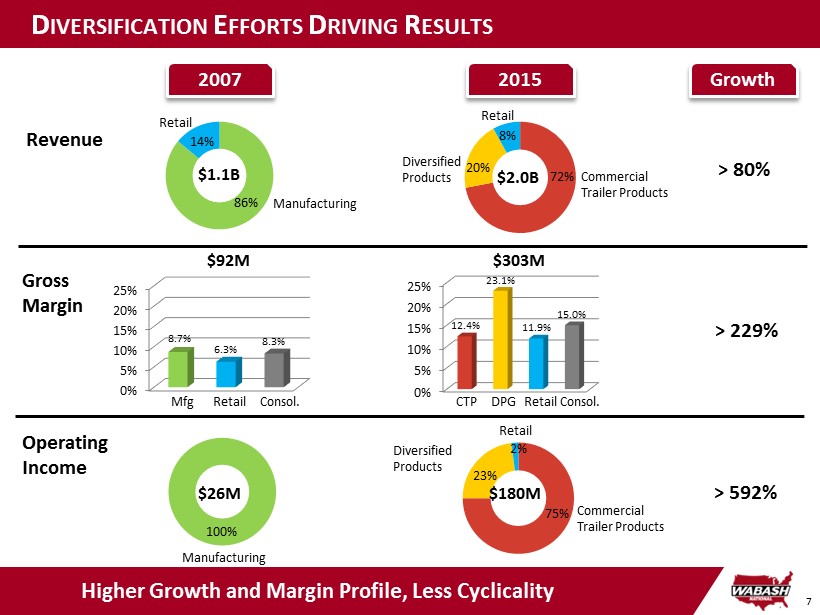
7 2007 Higher Growth and Margin Profile, Less Cyclicality 2015 D IVERSIFICATION E FFORTS D RIVING R ESULTS Revenue Manufacturing Retail 14% 86% 20% Commercial Trailer Products Diversified Products Retail 72% 8% Operating Income Manufacturing Retail Diversified Products Commercial Trailer Products 23% 2% 75% Gross Margin 0% 5% 10% 15% 20% 25% 12.4% 23.1% 11.9% 15.0% CTP Retail Consol. DPG 0% 5% 10% 15% 20% 25% 8.7% 6.3% 8.3% Mfg Retail Consol. $1.1B $2.0B $92M $303M 100% $26M $180M Growth > 80% > 229% > 592%
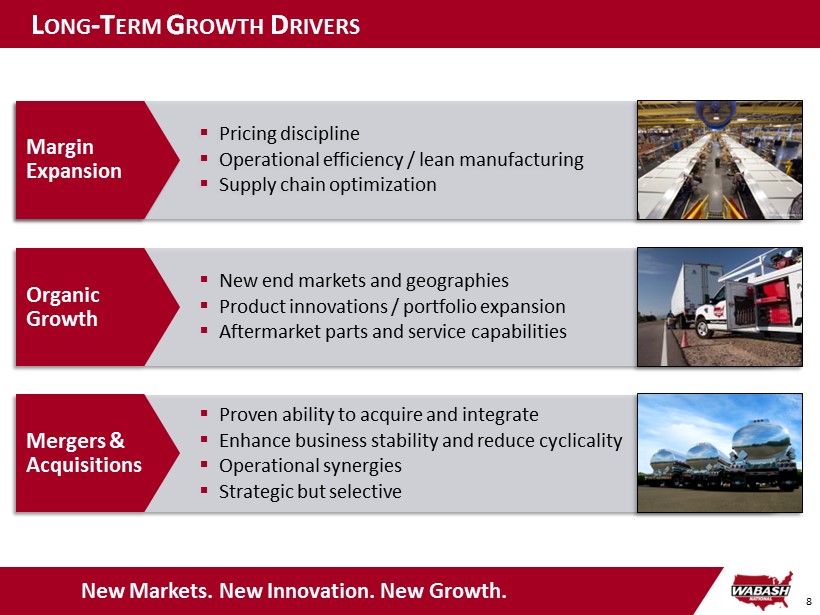
8 L ONG - T ERM G ROWTH D RIVERS ▪ Pricing discipline ▪ Operational efficiency / lean manufacturing ▪ Supply chain optimization Margin Expansion ▪ New end markets and geographies ▪ Product innovations / portfolio expansion ▪ Aftermarket parts and service capabilities Organic Growth ▪ Proven ability to acquire and integrate ▪ Enhance business stability and reduce cyclicality ▪ Operational synergies ▪ Strategic but selective Mergers & Acquisitions New Markets. New Innovation. New Growth.
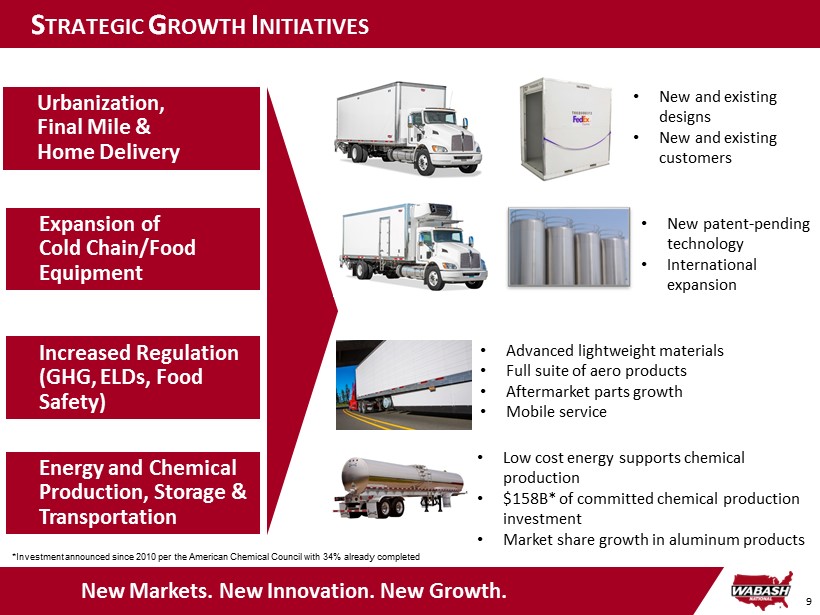
9 S TRATEGIC G ROWTH I NITIATIVES New Markets. New Innovation. New Growth. Urbanization, Final Mile & Home Delivery Energy and Chemical Production, Storage & Transportation Expansion of Cold Chain/Food Equipment Increased Regulation (GHG, ELDs, Food Safety) • Advanced lightweight materials • Full suite of aero products • Aftermarket parts growth • Mobile service • Low cost energy supports chemical production • $158B* of committed chemical production investment • Market share growth in aluminum products • New and existing designs • New and existing customers • New patent - pending technology • International expansion *Investment announced since 2010 per the American Chemical Council with 34% already completed
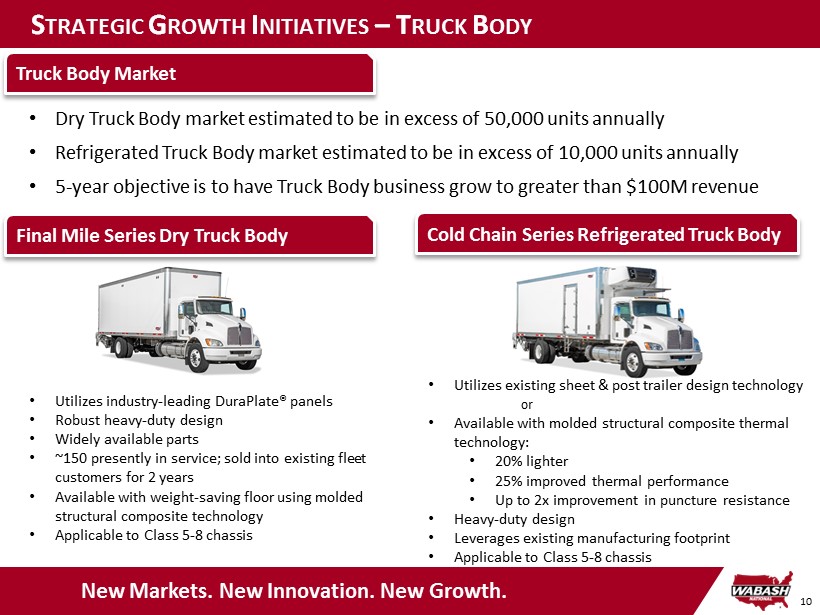
10 S TRATEGIC G ROWTH I NITIATIVES – T RUCK B ODY New Markets. New Innovation. New Growth. • Dry Truck Body market estimated to be in excess of 50,000 units annually • Refrigerated Truck Body market estimated to be in excess of 10,000 units annually • 5 - year objective is to have Truck Body business grow to greater than $100M revenue • Utilizes industry - leading DuraPlate ® panels • Robust heavy - duty design • Widely available parts • ~150 presently in service; sold into existing fleet customers for 2 years • Available with weight - saving floor using molded structural composite technology • Applicable to Class 5 - 8 chassis • Utilizes existing sheet & post trailer design technology or • Available with molded structural composite thermal technology: • 20% lighter • 25% improved thermal performance • Up to 2x improvement in puncture resistance • Heavy - duty design • Leverages existing manufacturing footprint • Applicable to Class 5 - 8 chassis Truck Body Market Final Mile Series Dry Truck Body Cold Chain Series Refrigerated Truck Body

WABASH NATIONAL CORPORATION Market Conditions & Outlook
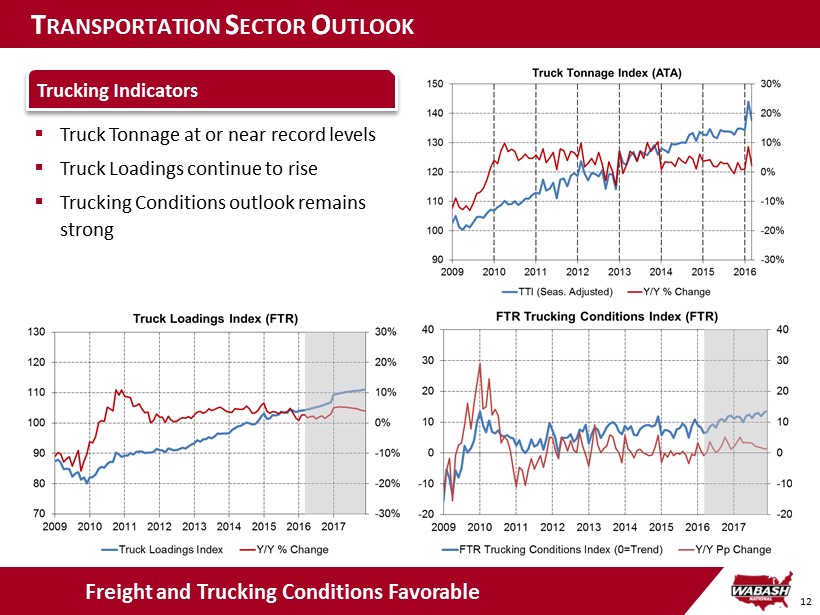
12 T RANSPORTATION S ECTOR O UTLOOK Strong demand above replacement levels ▪ Truck Tonnage at or near record levels ▪ Truck Loadings continue to rise ▪ Trucking Conditions outlook remains strong Freight and Trucking Conditions Favorable Trucking Indicators
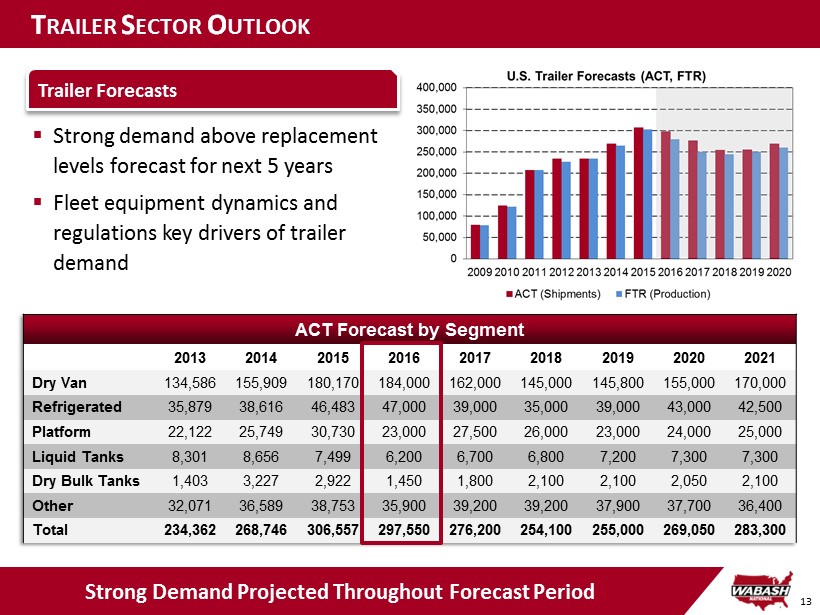
13 ACT Forecast by Segment 2013 2014 2015 2016 2017 2018 2019 2020 2021 Dry Van 134,586 155,909 180,170 184,000 162,000 145,000 145,800 155,000 170,000 Refrigerated 35,879 38,616 46,483 47,000 39,000 35,000 39,000 43,000 42,500 Platform 22,122 25,749 30,730 23,000 27,500 26,000 23,000 24,000 25,000 Liquid Tanks 8,301 8,656 7,499 6,200 6,700 6,800 7,200 7,300 7,300 Dry Bulk Tanks 1,403 3,227 2,922 1,450 1,800 2,100 2,100 2,050 2,100 Other 32,071 36,589 38,753 35,900 39,200 39,200 37,900 37,700 36,400 Total 234,362 268,746 306,557 297,550 276,200 254,100 255,000 269,050 283,300 T RAILER S ECTOR O UTLOOK Strong demand above replacement levels Strong Demand Projected Throughout Forecast Period ▪ Strong demand above replacement levels forecast for next 5 years ▪ Fleet equipment dynamics and regulations key drivers of trailer demand Trailer Forecasts

14 T RAILER D EMAND D RIVERS Strong demand above replacement levels Fleet Dynamics and Regulations Driving Trailer Demand Fleet Equipment Dynamics ▪ 3+ years of significant underbuy (2008 – 2010) ▪ Trailer age expected to return to 2007 level in 2017 ▪ Trailer population expected to return to 2007 level in 2018 ▪ Continued access to financing ▪ Electronic Logging Devices (ELDs) ▪ Greenhouse Gas (GHG) regulations for trailers ▪ Hours of Service (HOS) ▪ Compliance, Safety, Accountability (CSA) Regulatory
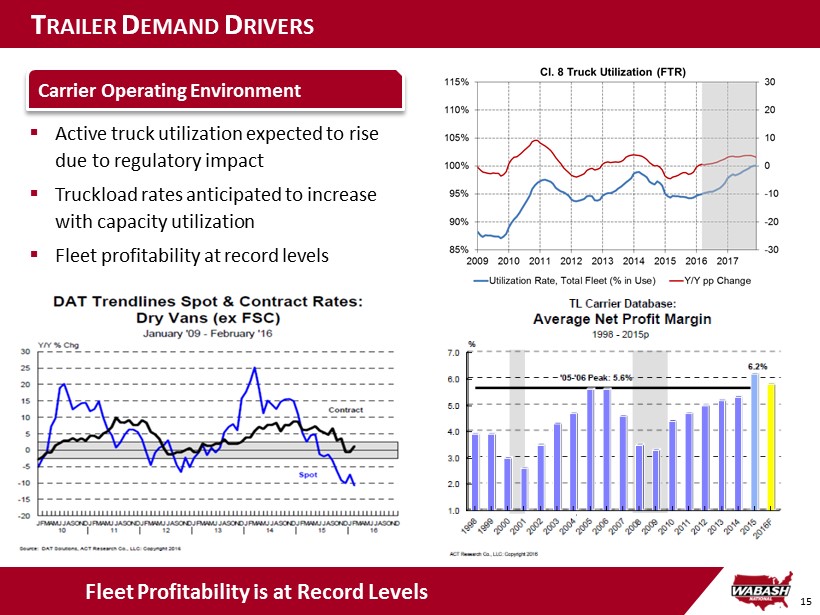
15 T RAILER D EMAND D RIVERS Fleet Profitability is at Record Levels ▪ Active truck utilization expected to rise due to regulatory impact ▪ Truckload rates anticipated to increase with capacity utilization ▪ Fleet profitability at record levels Carrier Operating Environment
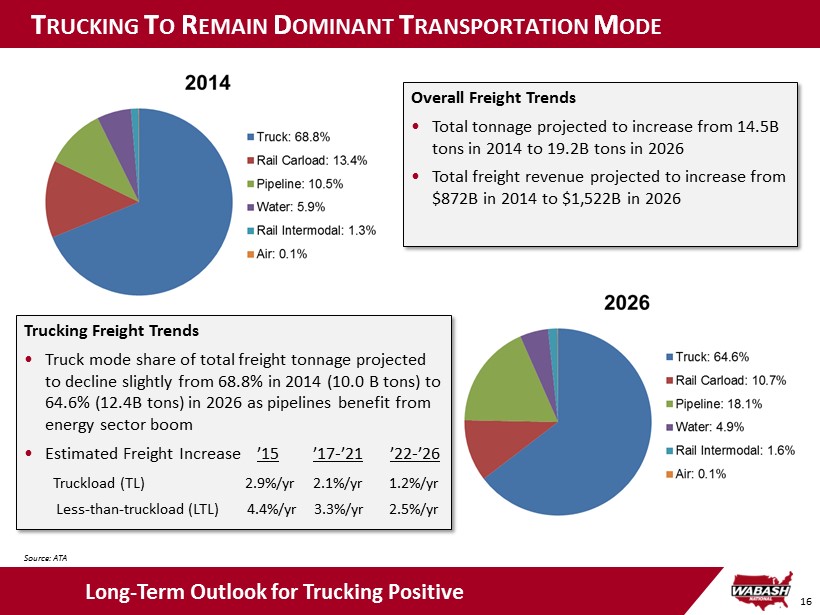
16 C OMMERCIAL T RAILER P RODUCTS T RUCKING T O R EMAIN D OMINANT T RANSPORTATION M ODE Long - Term Outlook for Trucking Positive Overall Freight Trends • Total tonnage projected to increase from 14.5B tons in 2014 to 19.2B tons in 2026 • Total freight revenue projected to increase from $872B in 2014 to $1,522B in 2026 Trucking Freight Trends • Truck mode share of total freight tonnage projected to decline slightly from 68.8% in 2014 (10.0 B tons) to 64.6% (12.4B tons) in 2026 as pipelines benefit from energy sector boom • Estimated Freight Increase ’15 ’17 - ’21 ’22 - ’26 Truckload (TL) 2.9%/yr 2.1%/yr 1.2%/yr Less - than - truckload (LTL) 4.4%/yr 3.3%/yr 2.5%/yr Source: ATA
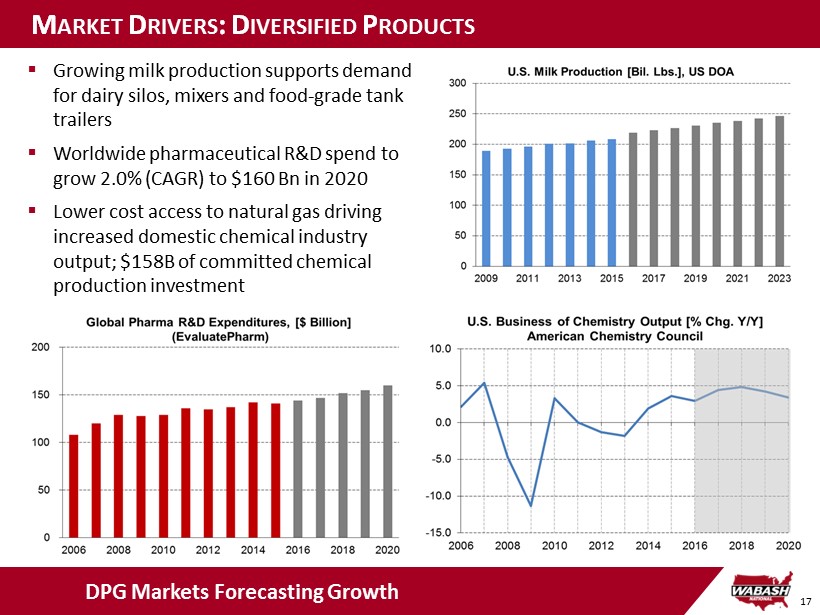
17 M ARKET D RIVERS : D IVERSIFIED P RODUCTS DPG Markets Forecasting Growth ▪ Growing milk production supports demand for dairy silos, mixers and food - grade tank trailers ▪ Worldwide pharmaceutical R&D spend to grow 2.0% (CAGR) to $160 Bn in 2020 ▪ Lower cost access to natural gas driving increased domestic chemical industry output; $158B of committed chemical production investment

18 M ARKET D RIVERS : D IVERSIFIED P RODUCTS ▪ Projected growth in Truck Body market drives DuraPlate® panel sales growth ▪ CARB and GHG requirements continue to drive demand for aerodynamic products ▪ Housing starts support moving and storage activity and demand for portable storage containers ▪ Aviation expected to grow at healthy rates, driving aviation fuel equipment demand DPG Markets Forecasting Growth
WABASH NATIONAL CORPORATION Long - Term Objectives
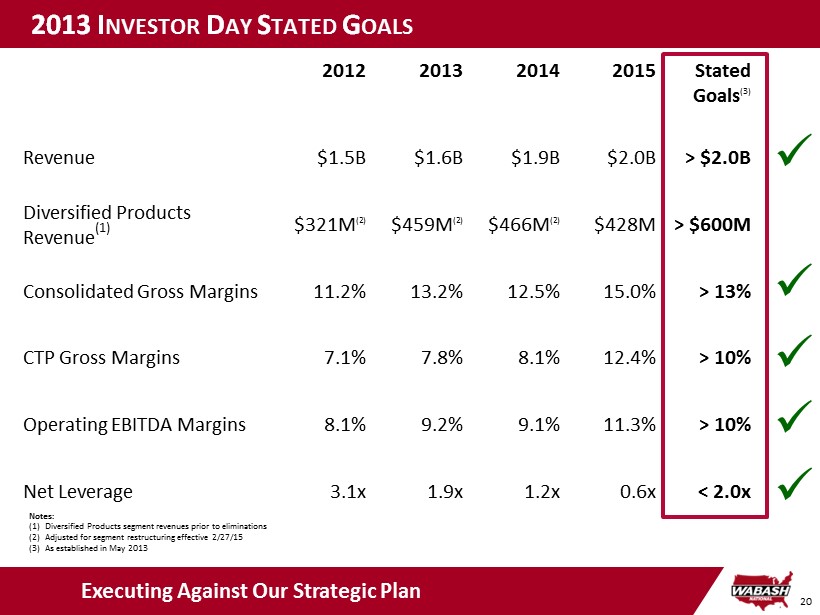
20 2013 I NVESTOR D AY S TATED G OALS 2012 2013 2014 2015 Stated Goals (3) Revenue $1.5B $1.6B $1.9B $2.0B > $ 2.0B Diversified Products Revenue (1) $321M (2) $459M (2) $466M (2) $428M > $600M Consolidated Gross Margins 11.2% 13.2% 12.5% 15.0% > 13% CTP Gross Margins 7.1% 7.8% 8.1% 12.4% > 10% Operating EBITDA Margins 8.1% 9.2% 9.1% 11.3% > 10% Net Leverage 3.1x 1.9x 1.2x 0.6x < 2.0x Executing Against Our Strategic Plan x x x x x Notes: (1) Diversified Products segment revenues prior to eliminations (2) Adjusted for segment restructuring effective 2/27/15 (3) As established in May 2013

21 2020 G OALS 2014 2015 Consolidated Revenue $1.9B $2.0B Consolidated Operating Margin 6.6% 8.9% EPS Growth $0.89 $1.49 ROIC (1) 12.5% 19.5% Notes: (1) ROIC = Net Operating Profit After Tax/Invested Capital Promises Delivered – Accelerating Diversification Strategy 2020 Goals > $3.0B > 10% > 20% > $2.50

WABASH NATIONAL CORPORATION Financial Overview

23 2016 FY O UTLOOK Key Financial Metrics 2015 FY Results 2016 FY Outlook Shipments 64,700 Units 60 - 62,000 Units Revenue $2.03B Flattish to down slightly GM% 15.0% No Guidance OM% 8.9% No Guidance SGA% 5.0% ~5.0% CapEx $21M $25 - 30M Tax Rate 36.1% 36 - 37% NWC % of Revenue Adjusted EPS 10.9% $1.49 In Line with 2015 $1.65 - $1.75
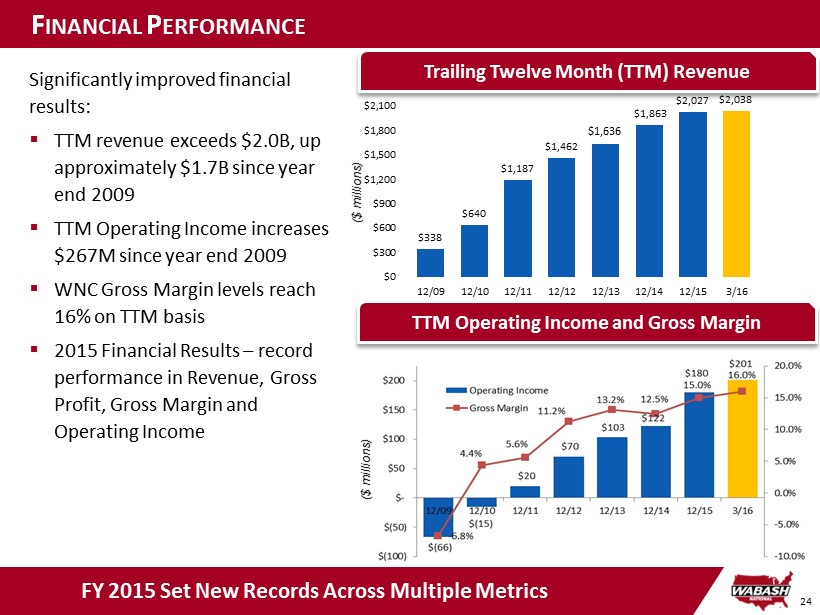
24 $338 $640 $1,187 $1,462 $1,636 $1,863 $2,027 $2,038 $0 $300 $600 $900 $1,200 $1,500 $1,800 $2,100 12/09 12/10 12/11 12/12 12/13 12/14 12/15 3/16 ($ millions) F INANCIAL P ERFORMANCE Trailing Twelve Month (TTM) Revenue FY 2015 Set New Records Across Multiple Metrics ($ millions) Significantly improved financial results: ▪ TTM revenue exceeds $2.0B, up approximately $1.7B since year end 2009 ▪ TTM Operating Income increases $267M since year end 2009 ▪ WNC Gross Margin levels reach 16% on TTM basis ▪ 2015 Financial Results – record performance in Revenue, Gross Profit, Gross Margin and Operating Income TTM Operating Income and Gross Margin
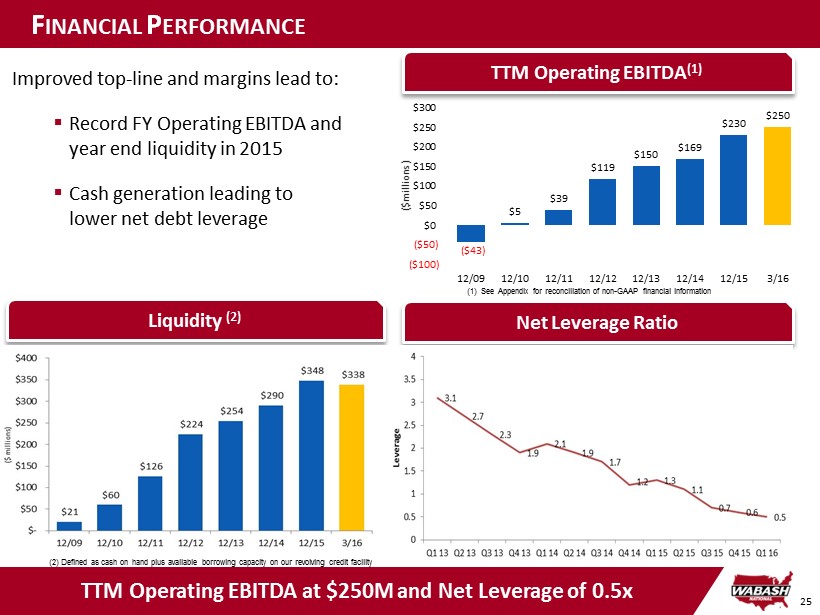
25 F INANCIAL P ERFORMANCE TTM Operating EBITDA at $250M and Net Leverage of 0.5x Net Leverage Ratio Improved top - line and margins lead to: ▪ Record FY Operating EBITDA and year end liquidity in 2015 ▪ Cash generation leading to lower net debt leverage ($43) $5 $39 $119 $150 $169 $230 $250 ($100) ($50) $0 $50 $100 $150 $200 $250 $300 12/09 12/10 12/11 12/12 12/13 12/14 12/15 3/16 ($millions) (1) See Appendix for reconciliation of non - GAAP financial information TTM Operating EBITDA (1) Liquidity (2) (2) Defined as cash on hand plus available borrowing capacity on our revolving credit facility
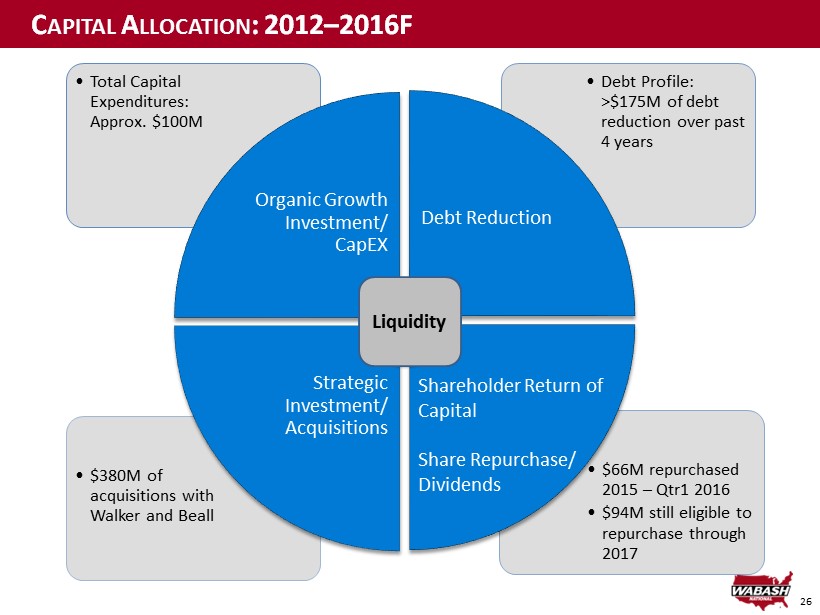
26 • $66M repurchased 2015 – Qtr1 2016 • $94M still eligible to repurchase through 2017 • $380M of acquisitions with Walker and Beall • Debt Profile: >$175M of debt reduction over past 4 years • Total Capital Expenditures: Approx. $100M Organic Growth Investment/ CapEX Debt Reduction Strategic Investment/ Acquisitions Liquidity C APITAL A LLOCATION : 2012 – 2016F Shareholder Return of Capital Share Repurchase/ Dividends

27 S TRATEGIC A CQUISITIONS 1. Value - added, engineered products and services, where we can provide value - added customer solutions 2. Operating Margin levels > 10% 3. Strong management teams that are a cultural fit 4. Aligned with core competencies in purchasing, operations, distribution and product development 5. Diversified growth markets (end markets or geographies) and less cyclical industries » Tank Trailers » Process Systems » Aviation & Truck Equipment Transformative Acquisition Platform Expanding Acquisition » Aluminum 406 » Dry Bulk Tanks 2012 & 2013 Future Investment Criteria Growth Through Acquisition Remains a Strategic Component
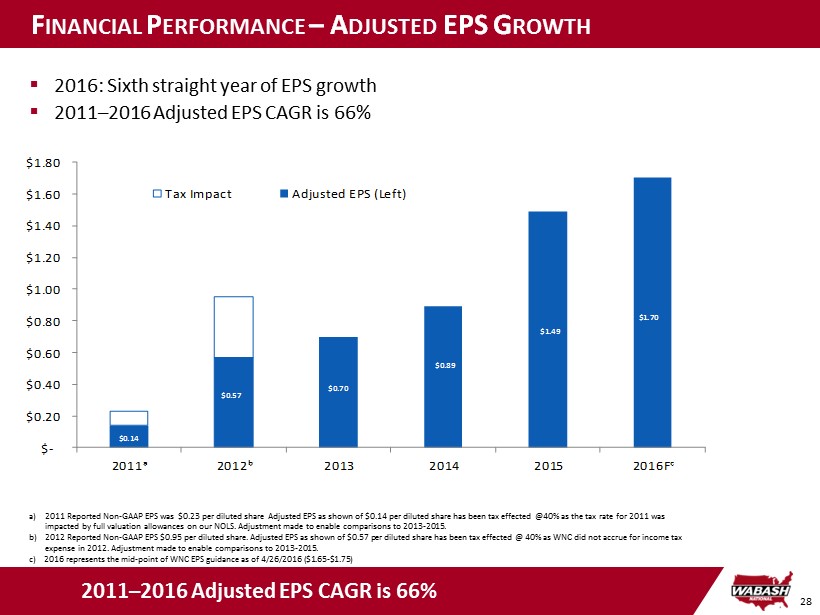
28 F INANCIAL P ERFORMANCE – A DJUSTED EPS G ROWTH 2011 – 2016 Adjusted EPS CAGR is 66% a) 2011 Reported Non - GAAP EPS was $0.23 per diluted share Adjusted EPS as shown of $ 0.14 per diluted share has been tax effected @40% as the tax rate for 2011 was impacted by full valuation allowances on our NOLS. Adjustment made to enable comparisons to 2013 - 2015. b) 2012 Reported Non - GAAP EPS $0.95 per diluted share. Adjusted EPS as shown of $0.57 per diluted share has been tax effected @ 40% as WNC did not accrue for income tax expense in 2012. Adjustment made to enable comparisons to 2013 - 2015. c) 2016 represents the mid - point of WNC EPS guidance as of 4/26/2016 ($1.65 - $1.75) ▪ 2016: Sixth straight year of EPS growth ▪ 2011 – 2016 Adjusted EPS CAGR is 66% $0.14 $0.57 $0.70 $0.89 $1.49 $1.70 $- $0.20 $0.40 $0.60 $0.80 $1.00 $1.20 $1.40 $1.60 $1.80 2011ᵃ 2012ᵇ 2013 2014 2015 2016F ᶜ Tax Impact Adjusted EPS (Left)
WABASH NATIONAL CORPORATION Appendix
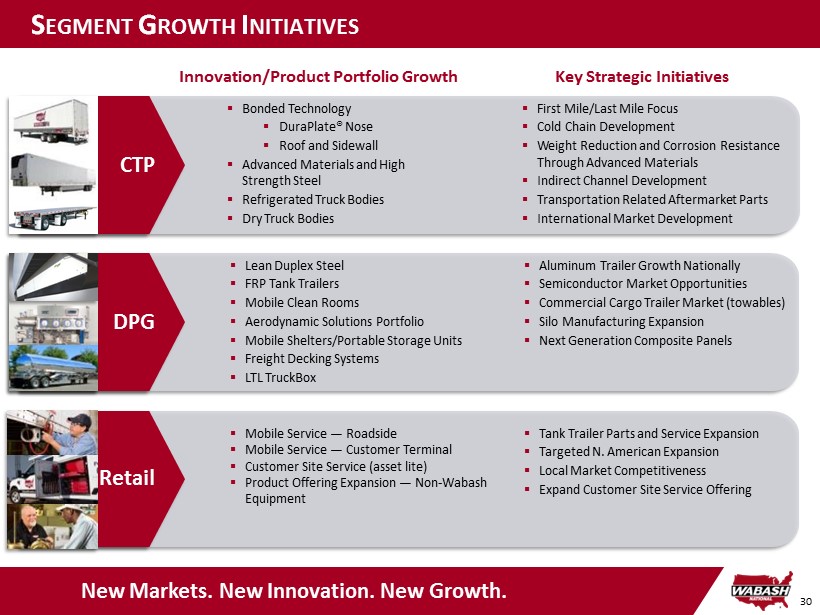
30 S EGMENT G ROWTH I NITIATIVES New Markets. New Innovation. New Growth. CTP DPG Retail ▪ Bonded Technology ▪ DuraPlate ® Nose ▪ Roof and Sidewall ▪ Advanced Materials and High Strength Steel ▪ Refrigerated Truck Bodies ▪ Dry Truck Bodies ▪ First Mile/Last Mile Focus ▪ Cold Chain Development ▪ Weight Reduction and Corrosion Resistance Through Advanced Materials ▪ Indirect Channel Development ▪ Transportation Related Aftermarket Parts ▪ International Market Development Innovation/Product Portfolio Growth Key Strategic Initiatives ▪ Lean Duplex Steel ▪ FRP Tank Trailers ▪ Mobile Clean Rooms ▪ Aerodynamic Solutions Portfolio ▪ Mobile Shelters/Portable Storage Units ▪ Freight Decking Systems ▪ LTL TruckBox ▪ Aluminum Trailer Growth Nationally ▪ Semiconductor Market Opportunities ▪ Commercial Cargo Trailer Market (towables) ▪ Silo Manufacturing Expansion ▪ Next Generation Composite Panels ▪ Mobile Service — Roadside ▪ Mobile Service — Customer Terminal ▪ Customer Site Service (asset lite) ▪ Product Offering Expansion — Non - Wabash Equipment ▪ Tank Trailer Parts and Service Expansion ▪ Targeted N. American Expansion ▪ Local Market Competitiveness ▪ Expand Customer Site Service Offering
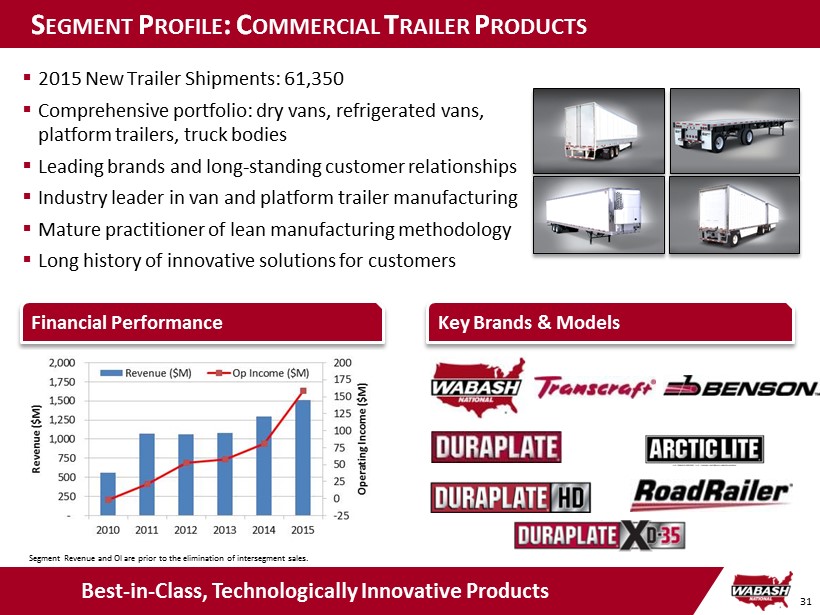
31 Best - in - Class, Technologically Innovative Products Financial Performance ▪ 2015 New Trailer Shipments: 61,350 ▪ Comprehensive portfolio: dry vans, refrigerated vans, platform trailers, truck bodies ▪ Leading brands and long - standing customer relationships ▪ Industry leader in van and platform trailer manufacturing ▪ Mature practitioner of lean manufacturing methodology ▪ Long history of innovative solutions for customers S EGMENT P ROFILE : C OMMERCIAL T RAILER P RODUCTS Segment Revenue and OI are prior to the elimination of intersegment sales. Key Brands & Models
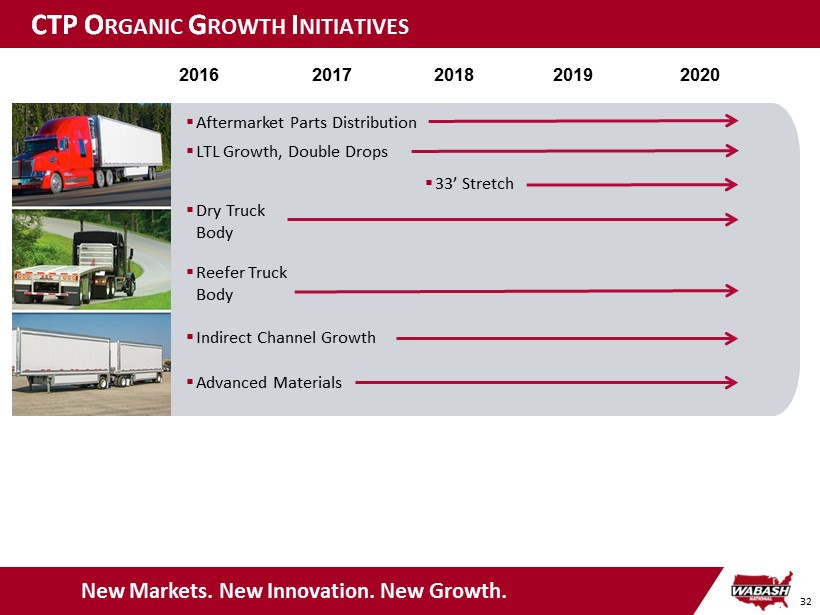
32 CTP O RGANIC G ROWTH I NITIATIVES New Markets. New Innovation. New Growth. 2016 2017 2018 2019 2020 ▪ Aftermarket Parts Distribution ▪ LTL Growth, Double Drops ▪ Reefer Truck Body ▪ Indirect Channel Growth ▪ Dry Truck Body ▪ 33’ Stretch ▪ Advanced Materials
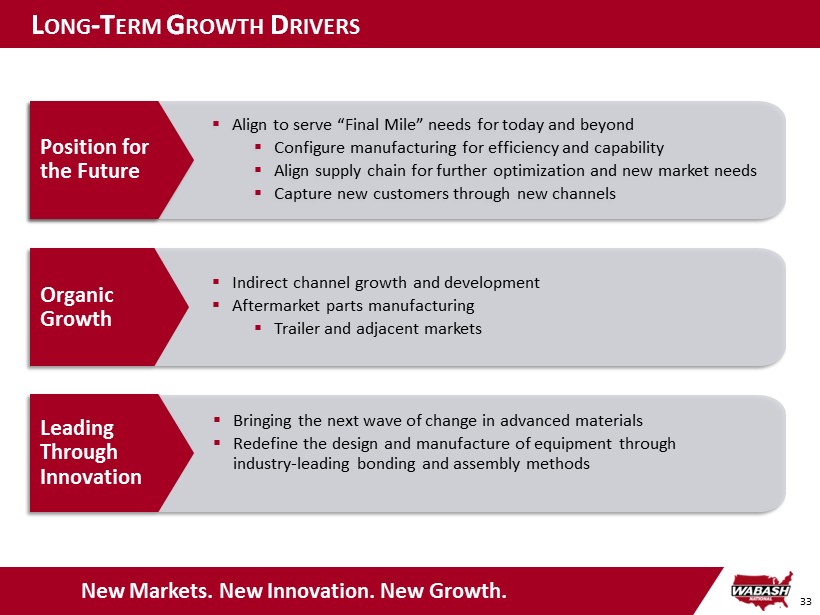
33 L ONG - T ERM G ROWTH D RIVERS New Markets. New Innovation. New Growth. ▪ Align to serve “Final Mile” needs for today and beyond ▪ Configure manufacturing for efficiency and capability ▪ Align supply chain for further optimization and new market needs ▪ Capture new customers through new channels Position for the Future ▪ Indirect channel growth and development ▪ Aftermarket parts manufacturing ▪ Trailer and adjacent markets Organic Growth ▪ Bringing the next wave of change in advanced materials ▪ Redefine the design and manufacture of equipment through industry - leading bonding and assembly methods Leading Through Innovation

34 Diverse Products and End Markets Financial Performance Key Brands ▪ Divisions: Tank Trailers, Aviation & Truck Equipment, Process Systems, and Composites ▪ Diverse portfolio of products serving a variety of customers and attractive end markets ▪ Leading brands and long - standing relationships with blue - chip customer base ▪ Higher growth and higher margin businesses ▪ Stable, strong cash flow profile S EGMENT P ROFILE : D IVERSIFIED P RODUCTS Segment Revenue and OI are prior to the elimination of intersegment sales.

35 O RGANIZATIONAL S TRUCTURE AND BRANDS Composites Tank Trailers Aviation & Truck Equip. Process Systems Wabash National Corporation Commercial Trailer Products Diversified Products Retail Strategically Focused & Rationalized Brands
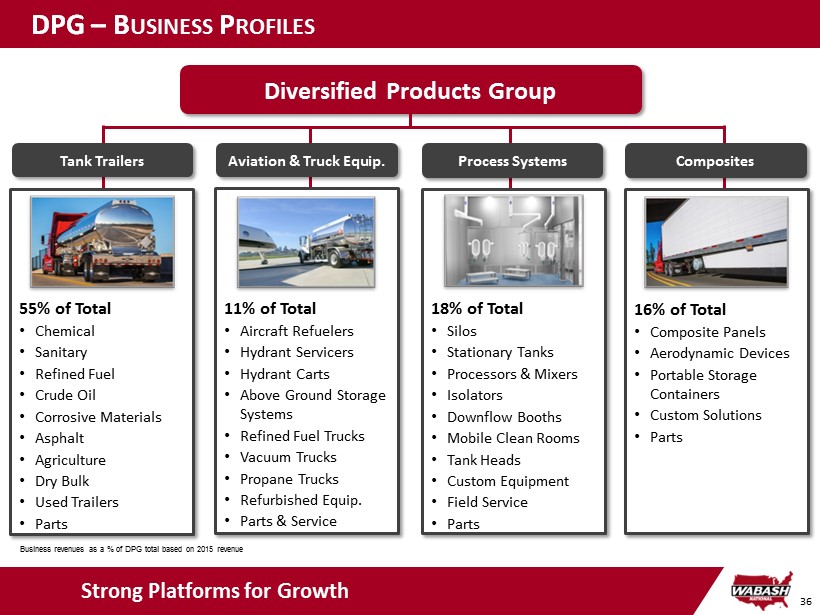
36 Strong Platforms for Growth DPG – B USINESS P ROFILES Diversified Products Group Tank Trailers 55% of Total • Chemical • Sanitary • Refined Fuel • Crude Oil • Corrosive Materials • Asphalt • Agriculture • Dry Bulk • Used Trailers • Parts Aviation & Truck Equip. Process Systems Composites 11% of Total • Aircraft Refuelers • Hydrant Servicers • Hydrant Carts • Above Ground Storage Systems • Refined Fuel Trucks • Vacuum Trucks • Propane Trucks • Refurbished Equip. • Parts & Service 16% of Total • Composite Panels • Aerodynamic Devices • Portable Storage Containers • Custom Solutions • Parts 18% of Total • Silos • Stationary Tanks • Processors & Mixers • Isolators • Downflow Booths • Mobile Clean Rooms • Tank Heads • Custom Equipment • Field Service • Parts Business revenues as a % of DPG total based on 2015 revenue

37 Sanitary Trailer Refined Fuel Truck Processor Downflow Booth Isolator Aircraft Refueler Dry Bulk Sand Trailer Vertical Silos Above Ground Storage Tanks Mobile Clean Room Hydrant Cart FRP Corrosives Trailer Lift & Hoist Vacuum Truck Refined Fuel Truck & Pull Chemical Trailer Truck Body Panels AeroSkirt ® Truckbox Deck Systems Portable Storage Container DPG – P RODUCT O VERVIEW Tank Trailers Aviation & Truck Equip. Process Systems Composites

38 DPG O RGANIC G ROWTH I NITIATIVES New Markets. New Innovation. New Growth. ▪ Aluminum Trailer Growth Nationally ▪ MCR Product Line Expansion ▪ Aerodynamic Products Portfolio Growth ▪ LTL Truck Boxes ▪ Mexico Silo Growth ▪ Custom Tank Container Solutions ▪ Energy Related Products ▪ Custom Cargo Boxes ▪ Processing Equipment (Food, Dairy, Pharma) ▪ Next Generation Composite Panels 2016 2017 2018 2019 2020
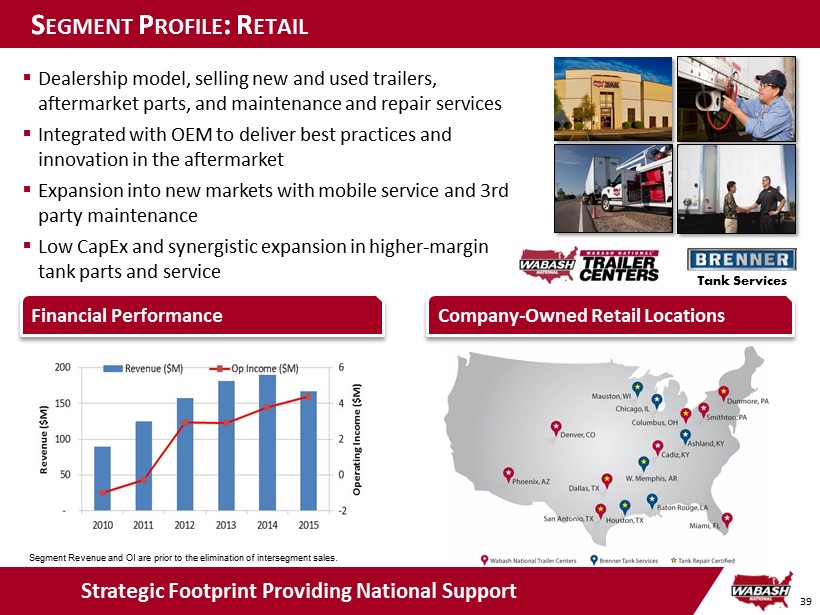
39 Company - Owned Retail Locations Strategic Footprint Providing National Support Financial Performance ▪ Dealership model, selling new and used trailers, aftermarket parts, and maintenance and repair services ▪ Integrated with OEM to deliver best practices and innovation in the aftermarket ▪ Expansion into new markets with mobile service and 3rd party maintenance ▪ Low CapEx and synergistic expansion in higher - margin tank parts and service S EGMENT P ROFILE : R ETAIL Tank Services Segment Revenue and OI are prior to the elimination of intersegment sales.
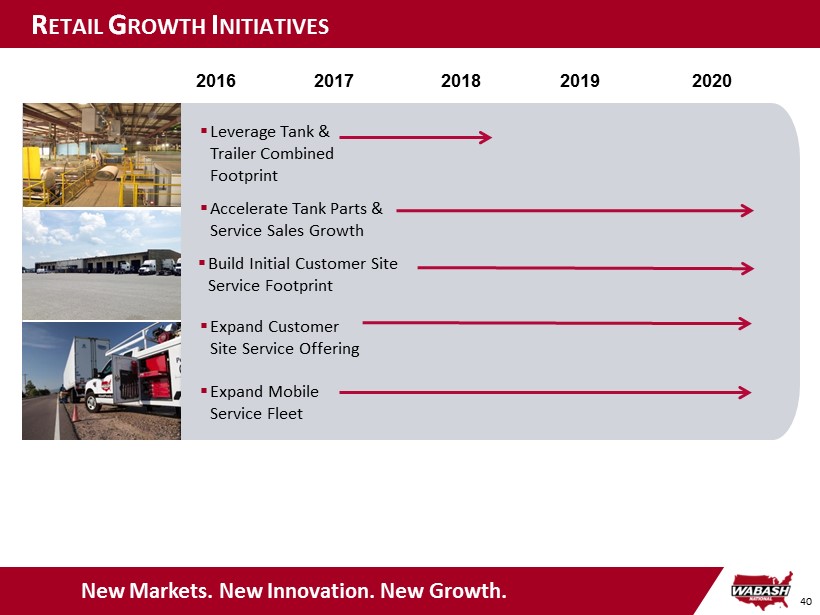
40 R ETAIL G ROWTH I NITIATIVES New Markets. New Innovation. New Growth. ▪ Build Initial Customer Site Service Footprint ▪ Leverage Tank & Trailer Combined Footprint ▪ Expand Mobile Service Fleet ▪ Accelerate Tank Parts & Service Sales Growth ▪ Expand Customer Site Service Offering 2016 2017 2018 2019 2020
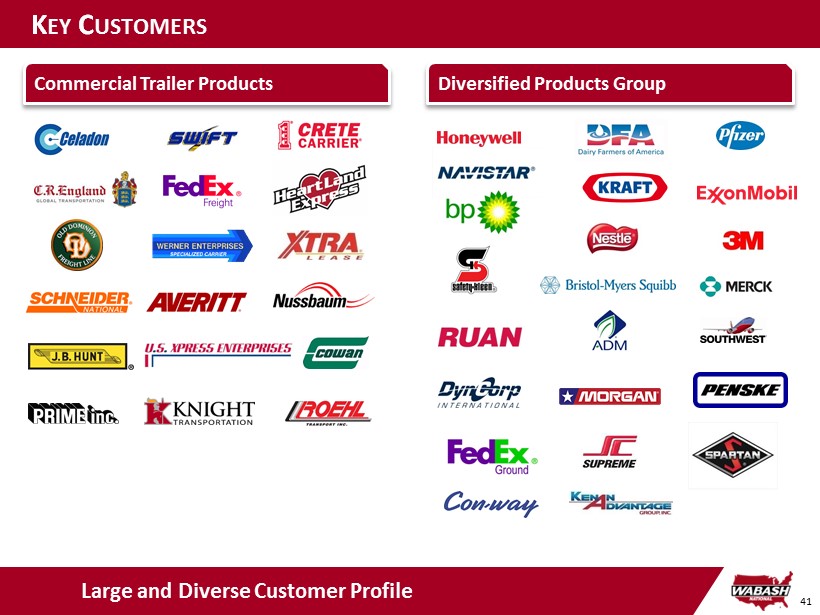
41 K EY C USTOMERS Large and Diverse Customer Profile Commercial Trailer Products Diversified Products Group

42 C ONSOLIDATED I NCOME S TATEMENT New Markets. New Innovation. New Growth. ($ in thousands, except per share amounts) 2009 2010 2011 2012 2013 2014 2015 Q1 2016 Net sales 337,840$ 640,372$ 1,187,244$ 1,461,854$ 1,635,686$ 1,863,315$ 2,027,489$ 447,676$ Cost of sales 360,750 612,289 1,120,524 1,298,031 1,420,563 1,630,681 1,724,046 368,150 Gross profit (22,910)$ 28,083$ 66,720$ 163,823$ 215,123$ 232,634$ 303,443$ 79,526$ % of sales -6.8% 4.4% 5.6% 11.2% 13.2% 12.5% 15.0% 17.8% General and administrative expenses 29,033 29,876 30,994 44,751 58,666 61,694 73,495 19,392 % of sales 8.6% 4.7% 2.6% 3.1% 3.6% 3.3% 3.6% 4.3% Selling expenses 11,176 10,669 12,981 23,589 30,597 26,676 27,233 6,961 % of sales 3.3% 1.7% 1.1% 1.6% 1.9% 1.4% 1.3% 1.6% Amortization of intangibles 2,955 2,955 2,955 10,590 21,786 21,878 21,259 4,988 % of sales 0.9% 0.5% 0.2% 0.7% 1.3% 1.2% 1.0% 1.1% Other operating expenses - - - 14,409 883 - 1,087 - % of sales 0.0% 0.0% 0.0% 1.0% 0.1% 0.0% 0.1% 0.0% - - - - - - (Loss) Income from operations (66,074)$ (15,417)$ 19,790$ 70,484$ 103,191$ 122,386$ 180,369$ 48,185$ % of sales -19.6% -2.4% 1.7% 4.8% 6.3% 6.6% 8.9% 10.8% Other income (expense) Increase in fair value of warrant (33,447) (121,587) - - - - - - Interest expense (4,379) (4,140) (4,136) (21,724) (26,308) (22,165) (19,548) (4,095) Other, net (866) (667) (441) (97) 740 (1,759) 2,490 (398) (Loss) Income before income taxes (104,766)$ (141,811)$ 15,213$ 48,663$ 77,623$ 98,462$ 163,311$ 43,692$ Income tax (benefit) expense (3,001) (51) 171 (56,968) 31,094 37,532 59,022 16,168 Net (loss) income (101,765)$ (141,760)$ 15,042$ 105,631$ 46,529$ 60,930$ 104,289$ 27,524$ Preferred stock dividends and early extinguishment 3,320$ 25,454$ -$ -$ -$ -$ -$ -$ Net (loss) income applicable to common stockholders (105,085)$ (167,214)$ 15,042$ 105,631$ 46,529$ 60,930$ 104,289$ 27,524$ Diluted net (loss) income per share (3.48)$ (3.36)$ 0.22$ 1.53$ 0.67$ 0.85$ 1.50$ 0.42$
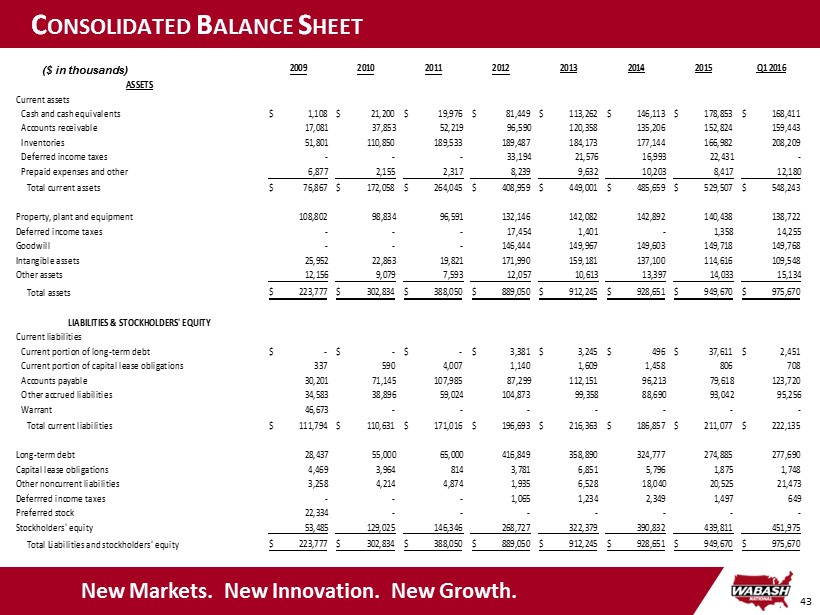
43 C ONSOLIDATED B ALANCE S HEET New Markets. New Innovation. New Growth. ($ in thousands) 2009 2010 2011 2012 2013 2014 2015 Q1 2016 ASSETS Current assets Cash and cash equivalents 1,108$ 21,200$ 19,976$ 81,449$ 113,262$ 146,113$ 178,853$ 168,411$ Accounts receivable 17,081 37,853 52,219 96,590 120,358 135,206 152,824 159,443 Inventories 51,801 110,850 189,533 189,487 184,173 177,144 166,982 208,209 Deferred income taxes - - - 33,194 21,576 16,993 22,431 - Prepaid expenses and other 6,877 2,155 2,317 8,239 9,632 10,203 8,417 12,180 Total current assets 76,867$ 172,058$ 264,045$ 408,959$ 449,001$ 485,659$ 529,507$ 548,243$ Property, plant and equipment 108,802 98,834 96,591 132,146 142,082 142,892 140,438 138,722 Deferred income taxes - - - 17,454 1,401 - 1,358 14,255 Goodwill - - - 146,444 149,967 149,603 149,718 149,768 Intangible assets 25,952 22,863 19,821 171,990 159,181 137,100 114,616 109,548 Other assets 12,156 9,079 7,593 12,057 10,613 13,397 14,033 15,134 Total assets 223,777$ 302,834$ 388,050$ 889,050$ 912,245$ 928,651$ 949,670$ 975,670$ LIABILITIES & STOCKHOLDERS' EQUITY Current liabilities Current portion of long-term debt -$ -$ -$ 3,381$ 3,245$ 496$ 37,611$ 2,451$ Current portion of capital lease obligations 337 590 4,007 1,140 1,609 1,458 806 708 Accounts payable 30,201 71,145 107,985 87,299 112,151 96,213 79,618 123,720 Other accrued liabilities 34,583 38,896 59,024 104,873 99,358 88,690 93,042 95,256 Warrant 46,673 - - - - - - - Total current liabilities 111,794$ 110,631$ 171,016$ 196,693$ 216,363$ 186,857$ 211,077$ 222,135$ Long-term debt 28,437 55,000 65,000 416,849 358,890 324,777 274,885 277,690 Capital lease obligations 4,469 3,964 814 3,781 6,851 5,796 1,875 1,748 Other noncurrent liabilities 3,258 4,214 4,874 1,935 6,528 18,040 20,525 21,473 Deferrred income taxes - - - 1,065 1,234 2,349 1,497 649 Preferred stock 22,334 - - - - - - - Stockholders' equity 53,485 129,025 146,346 268,727 322,379 390,832 439,811 451,975 Total Liabilities and stockholders' equity 223,777$ 302,834$ 388,050$ 889,050$ 912,245$ 928,651$ 949,670$ 975,670$

44 C ONSOLIDATED C ASH F LOWS New Markets. New Innovation. New Growth. ($ in thousands) 2009 2010 2011 2012 2013 2014 2015 Q1 2016 Cash flows from operating activities Net (loss) income (101,765)$ (141,760)$ 15,042$ 105,631$ 46,529$ 60,930$ 104,289$ 27,524$ Adjustments to reconcile net (loss) income to net cash (used in) provided by operating activities Depreciation 16,630 13,900 12,636 14,975 16,550 16,951 16,739 4,176 Amortization of intangibles 2,955 2,955 2,955 10,590 21,786 21,878 21,259 4,988 Net (gain) loss on the sale of assets (55) 431 (9) 203 140 13 (8,299) - Loss on debt extinguishment 303 - 668 - 1,889 1,042 5,808 487 Deferred income taxes - - - (55,292) 30,089 16,573 (7,749) 7,595 Excess tax benefits from stock-based compensation - - - - - - - (1,090) Increase in fair value of warrant 33,447 121,587 - - - - - - Stock-based compensation 3,382 3,489 3,398 5,149 7,480 7,833 10,010 2,470 Non-cash interest expense - - - 2,972 4,643 4,840 5,222 948 Impairment of intangibles - - - - - - 1,087 - Changes in operating assets and liabilities Accounts receivable 20,845 (20,772) (14,366) 1,180 (23,691) (14,848) (17,618) (6,619) Inventories 41,095 (59,062) (78,683) 41,696 6,260 3,116 10,162 (41,227) Prepaid expenses and other (1,570) 3,024 (162) 736 (3,893) (571) 1,786 (3,763) Accounts payable and accrued liabilities (22,666) 45,251 56,968 (48,777) 18,082 (26,787) (12,243) 46,316 Other, net 420 650 386 (3,046) 2,805 1,665 1,342 1,099 Net cash (used in) provided by operating activities (6,979)$ (30,307)$ (1,167)$ 76,017$ 128,669$ 92,635$ 131,795$ 42,904$ Cash flows from investing activities Capital expenditures (981) (1,782) (7,264) (14,916) (18,352) (19,957) (20,847) (2,976) Acquisition, net of cash acquired - - - (364,012) (15,985) - - - Proceeds from the sale of property, plant and equipment 300 1,813 17 607 305 87 13,203 - Other - - - (2,500) 2,500 4,113 - - Net cash (used in) provided by investing activities (681)$ 31$ (7,247)$ (380,821)$ (31,532)$ (15,757)$ (7,644)$ (2,976)$ Cash flows from financing activities Proceeds from issuance of common stock, net of expenses - 71,948 (155) - - - - - Proceeds from exercise of stock options - 504 538 354 600 1,921 2,012 192 Excess tax benefits from stock-based compensation - - - - - 1,090 Borrowings under revolving credit facilities 276,853 712,491 848,705 206,015 1,166 806 1,134 175 Payments under revolving credit facilities (328,424) (685,928) (838,705) (271,015) (1,166) (806) (1,134) (175) Principal payments under capital lease obligations (334) (352) (671) (1,629) (1,700) (1,898) (4,201) (225) Principal payments under term loan credit facility - - - (2,250) (62,827) (42,078) (194,291) (482) Principal payments under industrial revenue bond - - - - (381) (475) (496) (127) Stock repurchase (35) (384) (533) (564) (35) (1,497) (61,757) (8,757) Proceeds from issuance of convertible senior notes - - - 145,500 - - - - Proceeds from issuance of term loan credit facility, net of issuance costs - - - 292,500 - - 192,845 - Convertible notes repurchase - - - - - - (22,936) (42,061) Proceeds from issuance of preferred stock and warrant 35,000 - - - - - - - Payments under redemption of preferred stock - (47,791) - - - - - - (1,420) - (1,989) (5,134) (981) - (2,587) - - - - 2,500 - - - - (2,638) (120) - - - - - - Net cash (used in) provided by financing activities (20,998)$ 50,368$ 7,190$ 366,277$ (65,324)$ (44,027)$ (91,411)$ (50,370)$ Net (decrease) increase in cash and cash equivalents (28,658)$ 20,092$ (1,224)$ 61,473$ 31,813$ 32,851$ 32,740$ (10,442)$ Cash and cash equivalents at beginning of period 29,766 1,108 21,200 19,976 81,449 113,262 146,113 178,853 Cash and cash equivalents at end of period 1,108$ 21,200$ 19,976$ 81,449$ 113,262$ 146,113$ 178,853$ 168,411$ Preferred stock issuance costs paid Debt amendment and issuance costs paid Proceeds from issuance of industrial revenue bond
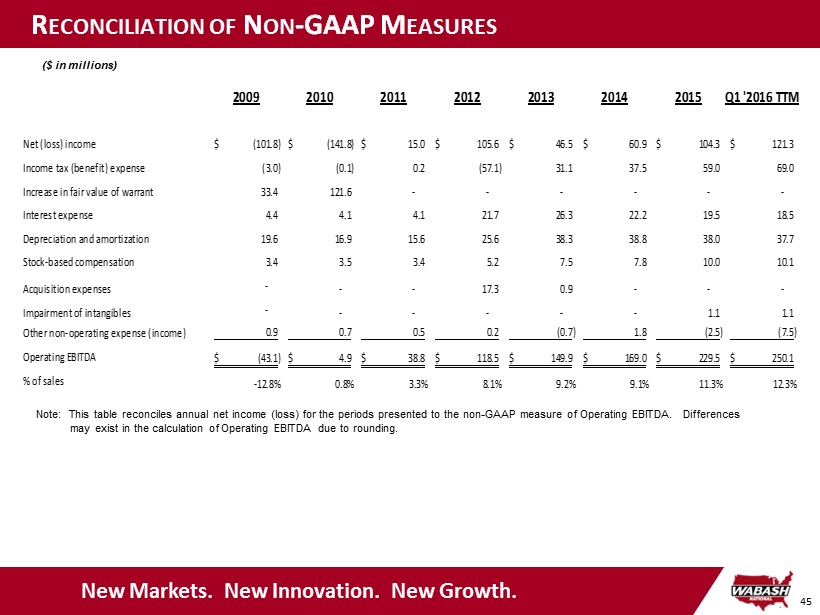
45 R ECONCILIATION OF N ON - GAAP M EASURES New Markets. New Innovation. New Growth. ($ in millions) Note: This table reconciles annual net income (loss) for the periods presented to the non - GAAP measure of Operating EBITDA. Di fferences may exist in the calculation of Operating EBITDA due to rounding. 2009 2010 2011 2012 2013 2014 2015 Q1 '2016 TTM Net (loss) income (101.8)$ (141.8)$ 15.0$ 105.6$ 46.5$ 60.9$ 104.3$ 121.3$ Income tax (benefit) expense (3.0) (0.1) 0.2 (57.1) 31.1 37.5 59.0 69.0 Increase in fair value of warrant 33.4 121.6 - - - - - - Interest expense 4.4 4.1 4.1 21.7 26.3 22.2 19.5 18.5 Depreciation and amortization 19.6 16.9 15.6 25.6 38.3 38.8 38.0 37.7 Stock-based compensation 3.4 3.5 3.4 5.2 7.5 7.8 10.0 10.1 Acquisition expenses - - - 17.3 0.9 - - - Impairment of intangibles - - - - - - 1.1 1.1 Other non-operating expense (income) 0.9 0.7 0.5 0.2 (0.7) 1.8 (2.5) (7.5) Operating EBITDA (43.1)$ 4.9$ 38.8$ 118.5$ 149.9$ 169.0$ 229.5$ 250.1$ % of sales -12.8% 0.8% 3.3% 8.1% 9.2% 9.1% 11.3% 12.3%
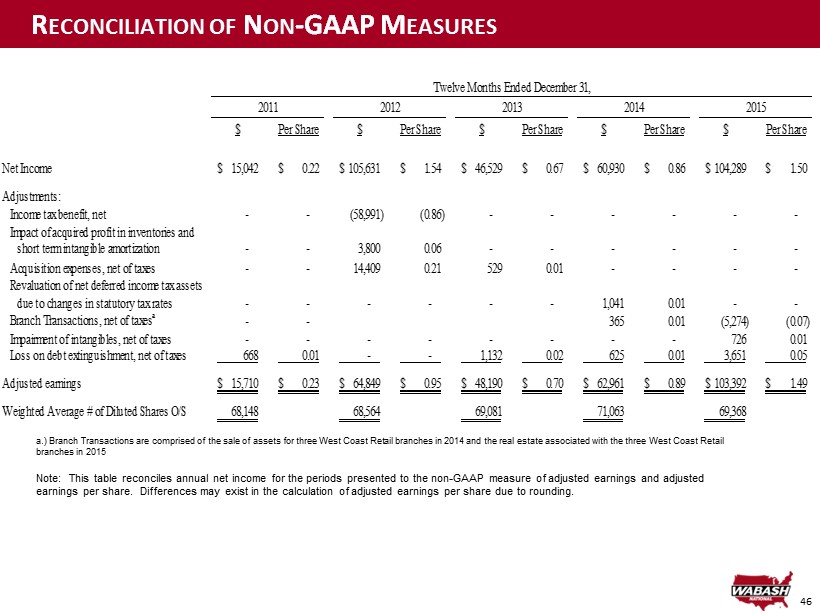
46 R ECONCILIATION OF N ON - GAAP M EASURES a.) Branch Transactions are comprised of the sale of assets for three West Coast Retail branches in 2014 and the real estate ass ociated with the three West Coast Retail branches in 2015 Note: This table reconciles annual net income for the periods presented to the non - GAAP measure of adjusted earnings and adjust ed earnings per share. Differences may exist in the calculation of adjusted earnings per share due to rounding. $ Per Share $ Per Share $ Per Share $ Per Share $ Per Share Net Income 15,042$ 0.22$ 105,631$ 1.54$ 46,529$ 0.67$ 60,930$ 0.86$ 104,289$ 1.50$ Adjustments: Income tax benefit, net - - (58,991) (0.86) - - - - - - Impact of acquired profit in inventories and short term intangible amortization - - 3,800 0.06 - - - - - - Acquisition expenses, net of taxes - - 14,409 0.21 529 0.01 - - - - Revaluation of net deferred income tax assets due to changes in statutory tax rates - - - - - - 1,041 0.01 - - Branch Transactions, net of taxes a - - 365 0.01 (5,274) (0.07) Impairment of intangibles, net of taxes - - - - - - - - 726 0.01 Loss on debt extinguishment, net of taxes 668 0.01 - - 1,132 0.02 625 0.01 3,651 0.05 Adjusted earnings 15,710$ 0.23$ 64,849$ 0.95$ 48,190$ 0.70$ 62,961$ 0.89$ 103,392$ 1.49$ Weighted Average # of Diluted Shares O/S 68,148 68,564 69,081 71,063 69,368 Twelve Months Ended December 31, 2014 20152011 2012 2013
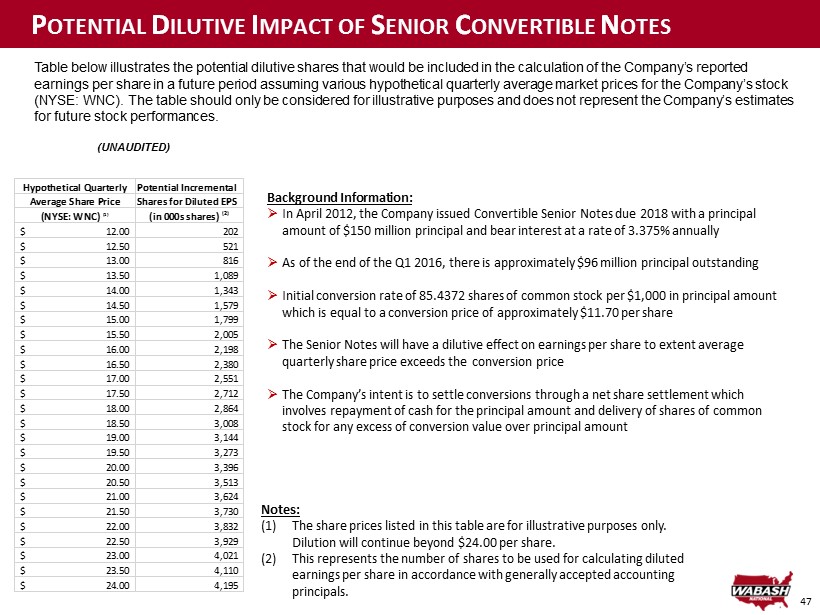
47 P OTENTIAL D ILUTIVE I MPACT OF S ENIOR C ONVERTIBLE N OTES (UNAUDITED) Table below illustrates the potential dilutive shares that would be included in the calculation of the Company’s reported earnings per share in a future period assuming various hypothetical quarterly average market prices for the Company’s stock (NYSE: WNC). The table should only be considered for illustrative purposes and does not represent the Company’s estimates for future stock performances. Notes: (1) The share prices listed in this table are for illustrative purposes only. Dilution will continue beyond $24.00 per share. (2) This represents the number of shares to be used for calculating diluted earnings per share in accordance with generally accepted accounting principals. Background Information: » In April 2012, the Company issued Convertible Senior Notes due 2018 with a principal amount of $150 million principal and bear interest at a rate of 3.375% annually » As of the end of the Q1 2016, there is approximately $96 million principal outstanding » Initial conversion rate of 85.4372 shares of common stock per $1,000 in principal amount which is equal to a conversion price of approximately $11.70 per share » The Senior Notes will have a dilutive effect on earnings per share to extent average quarterly share price exceeds the conversion price » The Company’s intent is to settle conversions through a net share settlement which involves repayment of cash for the principal amount and delivery of shares of common stock for any excess of conversion value over principal amount Hypothetical Quarterly Potential Incremental Average Share Price Shares for Diluted EPS (NYSE: WNC) (1) (in 000s shares) (2) 12.00$ 202 12.50$ 521 13.00$ 816 13.50$ 1,089 14.00$ 1,343 14.50$ 1,579 15.00$ 1,799 15.50$ 2,005 16.00$ 2,198 16.50$ 2,380 17.00$ 2,551 17.50$ 2,712 18.00$ 2,864 18.50$ 3,008 19.00$ 3,144 19.50$ 3,273 20.00$ 3,396 20.50$ 3,513 21.00$ 3,624 21.50$ 3,730 22.00$ 3,832 22.50$ 3,929 23.00$ 4,021 23.50$ 4,110 24.00$ 4,195