Attached files
| file | filename |
|---|---|
| 8-K - 8-K - CITIZENS FINANCIAL GROUP INC/RI | d136330d8k.htm |
  Barclays Americas Select Franchise Conference 2016
May 2016 Bruce Van Saun, Chairman and Chief Executive Officer Exhibit 99.1 |
 Important Information and GAAP/Non-GAAP Information
1 This document contains forward-looking statements within the Private Securities Litigation Reform Act of 1995. Any statement that does not describe historical or current facts is a forward-looking statement. These statements often include the words “believes,” “expects,” “anticipates,” “estimates,” “intends,” “plans,” “goals,” “targets,” “initiatives,” “potentially,” “probably,” “projects,” “outlook” or similar expressions or future conditional verbs such as “may,” “will,” “should,” “would,” and “could.” Forward-looking statements are based upon the current beliefs and expectations of management, and on information currently available to management. Our statements speak as of the date hereof, and we do not assume any obligation to update these statements or to update the reasons why actual results could differ from those contained in such statements in light of new information or future events. We caution you, therefore, against relying on any of these forward-looking statements. They are neither statements of historical fact nor guarantees or assurances of future performance. While there is no assurance that any list of risks and uncertainties or risk factors is complete, important factors that could cause actual results to differ materially from those in the forward-looking statements include the following, without limitation: negative economic conditions that adversely affect the general economy, housing prices, the job market, consumer confidence and spending habits which may affect, among other things, the level of nonperforming assets, charge-offs and provision expense; the rate of growth in the economy and employment levels, as well as general business and economic conditions; our ability to implement our strategic plan, including the cost savings and efficiency components, and achieve our indicative performance targets; our ability to remedy regulatory deficiencies and meet supervisory requirements and expectations; liabilities and business restrictions resulting from litigation and regulatory investigations; our capital and liquidity requirements (including under regulatory capital standards, such as the Basel III capital standards) and our ability to generate capital internally or raise capital on favorable terms; the effect of the current low interest rate environment or changes in interest rates on our net interest income, net interest margin and our mortgage originations, mortgage servicing rights and mortgages held for sale; changes in interest rates and market liquidity, as well as the magnitude of such changes, which may reduce interest margins, impact funding sources and affect the ability to originate and distribute financial products in the primary and secondary markets; the effect of changes in the level of checking or savings account deposits on our funding costs and net interest margin; financial services reform and other current, pending or future legislation or regulation that could have a negative effect on our revenue and businesses, including the Dodd-Frank Act and other legislation and regulation relating to bank products and services; a failure in or breach of our operational or security systems or infrastructure, or those of our third party vendors or other service providers, including as a result of cyber attacks; management’s ability to identify and manage these and other risks; and any failure by us to replicate or replace, successfully, certain functions, systems and infrastructure provided by The Royal Bank of Scotland Group plc (RBS). In addition to the above factors, we also caution that the amount and timing of any future common stock dividends or share repurchases will depend on our financial condition, earnings, cash needs, regulatory constraints, capital requirements (including requirements of our subsidiaries), and any other factors that our board of directors deems relevant in making such a determination. Therefore, there can be no assurance that we will pay any dividends to holders of our common stock, or as to the amount of any such dividends. More information about factors that could cause actual results to differ materially from those described in the forward-looking statements can be found under “Risk Factors” in Part I, Item 1A in our Annual Report on Form 10-K for the year ended December 31, 2015, filed with the United States Securities and Exchange Commission on February 26, 2016. Note: Percentage changes, per share amounts, and ratios presented in this document are calculated using whole dollars. Non-GAAP Financial Measures This document contains non-GAAP financial measures. The below presents reconciliations of certain non-GAAP measures. These reconciliations exclude restructuring charges and/or special items, which are usually included, where applicable, in the financial results presented in accordance with GAAP. Restructuring charges and special items include expenses related to our efforts to improve processes and enhance efficiencies, as well as rebranding, separation from RBS and regulatory expenses. The non-GAAP measures include "total revenue", "core revenue", "noninterest income", "core noninterest income", "noninterest expense", "core noninterest expense", "net interest income", "core net interest income", "net income", "core net income", "net income available to common stockholders", "core net income available to common stockholders", "net income per average common share", "return on average total assets" and "core return on average total assets". In addition, we present computations for "tangible book value per common share", "return on average tangible common equity", "core return on average tangible common equity", "efficiency ratio", "core efficiency ratio", "core net interest margin", "operating leverage", "core operating leverage" and "pro forma Basel III fully phased-in common equity tier 1 capital" as part of our non-GAAP measures. We believe these non-GAAP measures provide useful information to investors because these are among the measures used by our management team to evaluate our operating performance and make day-to-day operating decisions. In addition, we believe restructuring charges and special items in any period do not reflect the operational performance of the business in that period and, accordingly, it is useful to consider these line items with and without restructuring charges and special items. We believe this presentation also increases comparability of period-to-period results. We also consider pro forma capital ratios defined by banking regulators but not effective at each period end to be non-GAAP financial measures. Since analysts and banking regulators may assess our capital adequacy using these pro forma ratios, we believe they are useful to provide investors the ability to assess our capital adequacy on the same basis. Other companies may use similarly titled non-GAAP financial measures that are calculated differently from the way we calculate such measures. Accordingly, our non-GAAP financial measures may not be comparable to similar measures used by other companies. We caution investors not to place undue reliance on such non-GAAP measures, but instead to consider them with the most directly comparable GAAP measure. Non-GAAP financial measures have limitations as analytical tools, and should not be considered in isolation, or as a substitute for our results as reported under GAAP. |
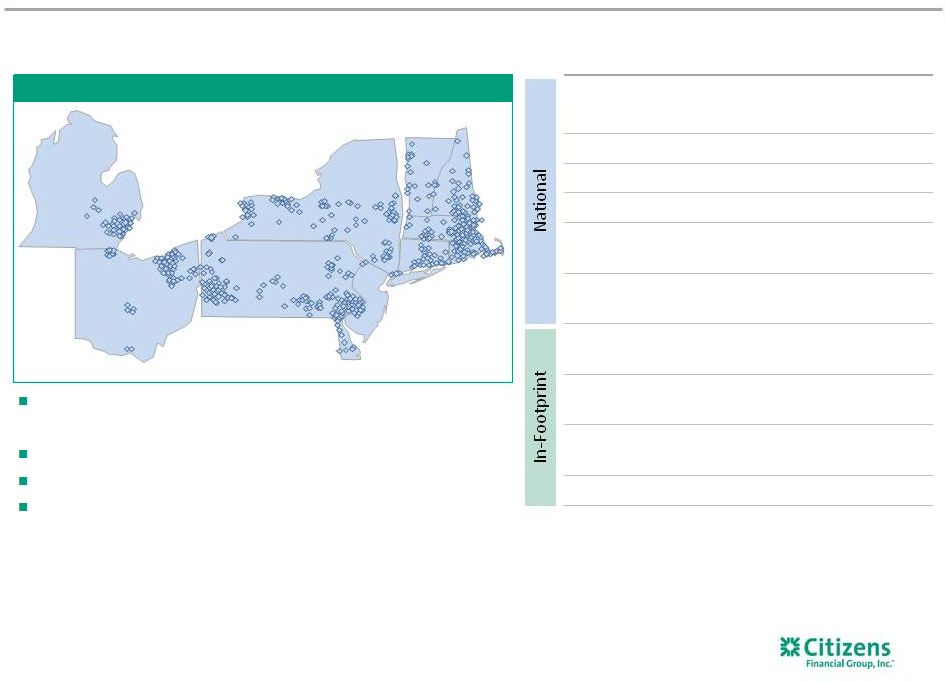 Dimension (2) Rank (3) Assets: $140.1 billion #13 Loans: $101.0 billion #11 Deposits: $102.6 billion #13 Branches: 1,200 #11 ATM network: 3,200 #7 Lead/joint lead bookrunner #9 (4) Mortgage: $13.3 billion #15 nationally (7) Student: $5.0 billion Top 4 rank nationally (5) Deposits: $102.6 billion Top 5 rank: 9/10 markets (1) HELOC: $14.9 billion Top 5 rank: 9/9 markets (6) Middle market lending #5 (8) Source: SNL Financial, unless otherwise noted. 1) Updated annually, as of 6/30/2015, excludes non-retail branches and banks with limited retail operations. 2) Data as of 3/31/2016, unless otherwise noted. 3) Ranking based on 12/31/2015 data, unless otherwise noted; excludes non-retail depository institutions, includes U.S. subsidiaries of foreign banks. 4) Thomson Reuters LPC, FY 2015 and 1Q16 ranking based on number of deals for Overall Middle Market (defined as Borrower Revenues < $500MM and Deal Size < $500MM). 5) CFG estimate, based on published company reports, where available, private student loan origination data as of 12/31/2015. 6) According to Equifax; origination volume as of 4Q15 7) According to IMF Retail Originators Bank Only ranking; reflects CFG organic origination volume as of 4Q15. 8) Based on market penetration, according to Greenwich Associates 4Q15 rolling four-quarter data (Citizens – Footprint - $25-500MM). Leading deposit market share of 10.7% in top 10 MSAs – #2 deposit market share in New England Relatively diverse economies/affluent demographics Serve 5 million+ individuals, institutions and companies ~17,900 colleagues Retail presence in 11 states Top 5 deposit market share in 9 of 10 largest MSAs Buffalo, NY: #5 Albany, NY: #2 Pittsburgh, PA: #2 Cleveland, OH: #3 Manchester, NH: #1 Boston, MA: #2 Rochester, NY: #4 Philadelphia, PA: #4 Detroit, MI: #8 Providence, RI: #1 Solid franchise with leading positions in attractive markets 2 (1) (1) (1) |
 Robust product offerings and balanced business mix
Commercial Consumer Corporate Banking Commercial Real Estate Franchise Finance Asset Finance PE/Sponsor Finance Healthcare/Technology/ Oil & Gas/Not-for-Profit verticals Capital Markets Global Markets Treasury Solutions Commercial Deposit Services Retail Deposit Services Mobile/Online Banking Credit/Debit Card Wealth Management Home Equity loans/lines Mortgage Auto Education Finance Business Banking Consumer Commercial Deep client relationships + Extensive product set Commercial Consumer Targeting 50/50 Mix Period-end loans and leases (1) $99 billion 1Q16 $74 billion 2009 Drive cross-sell and wallet share 1) Reflects loans and leases and loans and leases held for sale in our operating segments (Consumer and Commercial Banking). Excludes loans
held in Other/Non-core loans. Non-core assets are
primarily loans inconsistent with our strategic goals, generally as a result of geographic location, industry, product type or risk level. 3 |
 We
have added real talent… starting to see the benefits Board
Date
joined Key experience Anthony Di Iorio January 2014 Former CFO Deutsche Bank AG, Former Director RBS Group plc Mark Casady June 2014 Chairman and CEO, LPL Financial Holdings, Inc. Lee Higdon August 2014 Former Vice Chairman Salomon Brothers, Past President Connecticut College, Chairman
HealthSouth Corporation and Lead Director Eaton Vance Corporation
Christine Cumming
October 2015
Former First Vice President and COO, New York Federal Reserve
Leadership member Title Date joined Key experience Eric Aboaf Chief Financial Officer April 2015 Treasurer, Citigroup Don McCree Vice Chairman and Head of Commercial Banking September 2015 CEO of Corporate Banking and Treasury Services, JPMorgan Chase & Co. John Bahnken Head of Wealth October 2015 Senior Executive Vice President, Wealth Management Group, Bank of the West/BNP Paribas Group; formerly Bank of America Steve Gannon General Counsel August 2014 Deputy General Counsel, Capital One Financial Corporation Beth Johnson Chief Marketing Officer and Head of Consumer Strategy October 2013 Partner, Bain & Co. Chris Nard Head of Mortgage Banking October 2015 Chairman and CEO, Republic Mortgage Insurance Company Simon Griffiths Head of Consumer Distribution October 2015 Managing Director of Retail Network, Santander National Head of Branch Administration, JPMorgan Chase & Co. Malcolm Griggs Chief Credit Officer December 2014 Head of Business Risk and Controls, Citigroup Formerly Chief Risk Officer, Fifth Third Bancorp 4 |
 Aspire to be a top-performing regional bank, delivering well for all
stakeholders Colleagues
Regulators Investors Communities & Society Customer-centric culture 5 Customers |
 Our strategy to achieve this is
to: Offer our customers a differentiated customer experience through the quality of our colleagues, products and services – Foster a culture around customer-centricity, commitment to excellence, leadership, teamwork and
integrity Build a great brand that invokes trust from our customers and reinforces our value
proposition –
Consumer: Simple. Clear. Personal.
– Commercial: Thought Leadership Strive to deliver attractive risk-adjusted returns by making good capital and resource allocation decisions, being good stewards of our resources, and rigorously evaluating our execution
Operate with a strong balance sheet with
regards to capital, liquidity and funding, coupled with a well-
defined and prudent risk appetite
Maintain a balanced business mix between
Commercial Banking and Consumer Banking Position the bank as a ‘community leader’ that makes a positive impact on the communities and local economies we serve Our objective is to be a top-performing regional bank that delivers well for our stakeholders
Our vision is to deliver the best possible banking experience
6 Our vision and strategy |
 Reenergize Household growth
Reposition Auto
Grow Education Finance/
Installment loans
Expand Business Banking
Expand Mortgage
Expand Wealth
Build out Mid-Corporate &
Specialty verticals
Continued development of
Capital & Global Markets
Build out Treasury Solutions
Grow Franchise Finance
Grow core Commercial Banking -
e.g. CRE, Middle Market
Target 6 -
8% average loan
growth Target Basel III common equity tier 1 ratio of 11.2-11.5% by year end 2016 On track to deliver $90-115 million of pre-tax benefit from TOP II program by end of 2016 Continue prudent and high- return technology investment Continued CCAR progress Regulatory issue remediation Improved corporate governance Enhanced risk framework New Vision & Credo Organization Health Index / Leadership standards Continue to uptier talent Improved Consumer Bank Continued Commercial Banking Momentum Balance Sheet Growth/Optimization Capital Mix Normalization Enhanced Efficiency & Infrastructure Embed Robust Risk/Regulatory Framework High-Performing, Customer- Centric Culture 1) “Tapping our Potential” Phase II revenue and efficiency initiatives launched Mid-2015.
We have developed specific initiatives to support our strategy
(1) 7 |
 Broad set of opportunities identified
Developing program targets and timing
Program is focused on
efficiencies, balance sheet
management, cross-sell and tax rate. Have developed continuous improvement mindset: TOP Programs TOP I TOP II Initial thoughts on TOP III Expenses Salaries and benefits: Market alignment of benefits, organizational redesign and reduction in FTEs Occupancy: Branch
optimization, surplus office
exit Other: Expand
technology outsourcing model, vendor
consolidation, IT application
consolidation, strengthened
sourcing, travel and A/V and
enhance loss collection
Revenue Revenue enhancements: Consumer distribution channel effectiveness Commercial and Consumer cross-sell Pricing:
Improve customer pricing methodology to better align with competitive landscape Expense Efficiency:
Operations transformation and vendor management Launched first half 2014 Achieved $200 million annual cost saves by end of 2015 Launched mid 2015 On track to deliver $90-115 million annual pre-tax benefit by end of 2016 Tapping Our Potential (TOP) programs driving revenue growth and expense efficiencies
~$120 million ~$20 million ~$60 million $20-25 million $30-40 million $40-50 million 8 |
 We
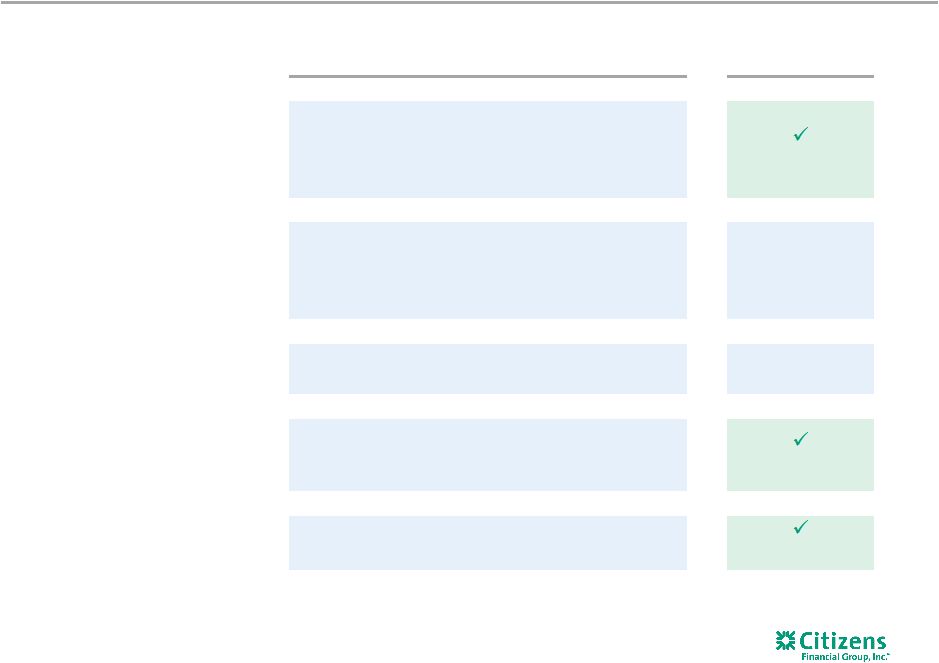
are broadly executing well, and our performance is improving Key
elements of ’13-’16 plan Status
Grow balance sheet,
net interest income
Consumer: Auto,
Student, Mortgage on track Commercial: Middle Market, Mid-corporate & Specialty Verticals, CRE, Franchise Finance Grow fee business, noninterest income Consumer: Wealth, Mortgage, Business Banking, Household Growth behind in select areas but TOP II offsetting Commercial: Treasury Solutions, Capital Markets Maintain asset sensitivity, benefit from higher rates Forward curve with Fed funds rate at 175 bps by YE2016 behind Tightly manage expense base, deliver positive operating leverage $200 million cost save program, Tech spend catch-up on track Manage capital ratios back to peer levels Target ~11% CET1 (stage I), peer-like mix of total capital on track 9 |
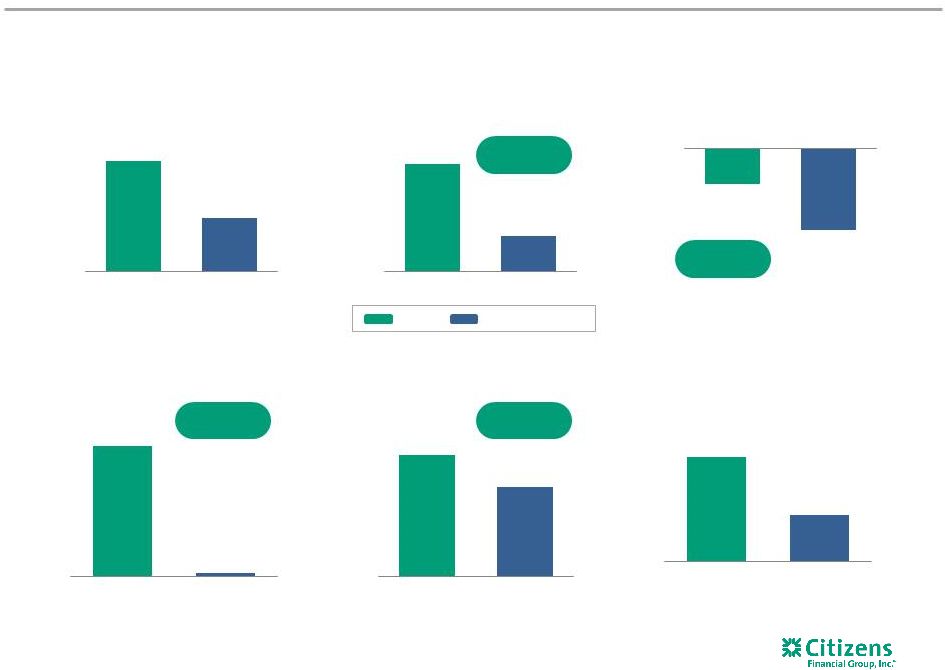 Delivered attractive balance sheet and revenue growth in 2015
CFG Peer average 4.1% 3.0% 3.9% 0.1% 3.9% 1.3% 8% 4% CFG Peer average Strong loan growth (Average total loan growth) A scaled platform well-positioned to drive value Source: SNL Financial and Company filings. Peers include CMA, BBT, FITB, KEY, MTB, PNC, RF, STI and USB.
1) Non-GAAP item. See Appendix for a reconciliation of non-GAAP items. Core CFG results exclude, as applicable, restructuring
charges and special items and securities gains. FY14 results
exclude, as applicable, the following estimated impacts of the Chicago Divestiture: $26 million net interest income, $24 million noninterest income, $42 million noninterest expense, net interest margin ~-1 bp. 2Q14 results also exclude $288 million Chicago Divestiture gain, and $9
million FFELP sale gain, 1Q15 excludes gain on sale
of mortgage portfolio of $10 million.
Peer results adjusted for similar unusual or special revenue, expense and
acquisition items. 2)
Peer data as of most recent 10-Q filing. Peer estimates based on public
disclosures and utilizes 200 basis point gradual increase above 12-month forward curve except PNC, which is based on a 100 basis point gradual increase and STI, which is based on 200 basis point shock. PNC and STI excluded from
peer median. 264 bps
above peers Growing revenues faster (Core revenue growth ) Lower NIM compression (Core net interest margin change ) 9 bps above peers Asset-sensitive balance sheet (200 bps gradual increase over forward curve ) Peer data as of most recent 10Q filing (7) bps (16) bps Robust NII growth (Core net interest income growth ) 379 bps above peers Core fee income growth (Core noninterest income growth ) 108 bps above peers 6.1% 2.7% CFG Peer median Peer median FY15 vs. FY14 10 CFG Peer average (1) (1) (2) (1) (1) |
 With continued focus on expense control and improving returns
11 Well-controlled expenses (Core noninterest expense change) Improving returns as assets grow (Core return on average total assets change) Return on equity (Core return on average tangible common equity change) 187 bps above peers 61 bps (12) bps 3 bps (126) bps 15 bps above peers Efficiency improvement (Core efficiency ratio change) (3.7)% 108 bps 307 bps better than peers 224 bps better than peers Accelerating profitability (Core net income available to common stockholders change) Source: SNL Financial and Company filings. Peers include CMA, BBT, FITB, KEY, MTB, PNC, RF, STI and USB.
1) Non-GAAP item. See Appendix for a reconciliation of non-GAAP items. Core CFG results exclude, as applicable, restructuring
charges and special items, and securities gains. FY14 results
exclude, as applicable, the following estimated impacts of the Chicago Divestiture: $26 million net interest income, $24 million noninterest income, $42 million noninterest expense. 2Q14 results also exclude $288 million Chicago Divestiture gain, and $9 million FFELP sale gain, 1Q15 excludes gain on sale of
mortgage portfolio of $10 million. Peer results adjusted
for similar unusual or special revenue, expense and acquisition items. 1,382 bps above peers CFG Peer average (199) bps 10.1% Strong operating leverage (YoY Core operating leverage ) (182) bps 305 bps 487 bps better than peers FY15 vs. FY14 (1) (1) (1) (1) (1) (1) 3.1% 0.9% |
 Our plan has clear objectives for each stakeholder
12 Achieve current targets, then raise the bar Strive for consistency in performance, limit tail risk Target attractive high pay-out ratio; steady and growing dividend Investors Customers Colleagues Community Regulators Continue to improve customer satisfaction Top 10 in JD Power for Consumer segment Top performer in RM quality, value of ideas in Commercial Gain market share in targeted businesses within Consumer & Commercial
Achieve top-quartile Organizational Health rating
Continue to develop talent and enhance culture
Achieve heightened volunteer and financial giving aspirations
Use our position to improve the well-being of the communities we
serve Achieve and sustain heightened standards across broad
regulatory agenda and earn the respect of our
regulators Good progress made in 2015;
will continue to raise our performance in 2016
|
 Generated 7% 1Q16 YoY average loan growth, with strength in both commercial
and consumer NII up 8% YoY and 4% QoQ
Loan yields improved 12 bps and deposit costs flat from 4Q15
Consumer Banking initiatives — 1% household growth YoY led by strong checking engagement, continued growth in student; regaining momentum in Wealth; stabilizing Mortgage Commercial Banking initiatives — Strong loan growth, up 9% YoY; Treasury Solutions fees up 20% YoY; Capital Markets fees rebounded from market weakness in 4Q15
On track to deliver $90-115 million of pre-tax benefit from TOP II in
2016 1Q16 highlights
13 1) Non-GAAP item. Where there is a reference to an “Adjusted” result in a paragraph, all measures which follow that
“Adjusted” result are also “Adjusted” and exclude restructuring charges and special items as applicable. There were no net restructuring charges and special items recorded in 1Q16 or 4Q15. Improving profitability and returns Strong capital, liquidity and funding Excellent credit quality and progress on risk management Continued progress on strategic growth, efficiency and balance sheet optimization initiatives Robust capital levels with a common equity tier 1 ratio of 11.6% 1Q16 average deposits increased $6.3 billion, or 7% vs. 1Q15; loan-to-deposit ratio of 99%
Repurchased $125 million of sub-debt and issued $750 million of senior
notes Announced increase in quarterly dividend of 20% to 12¢/common share to holders of record on May 4, 2016 Provision expense was stable with 4Q15; rose from 1Q15 levels, which included higher commercial recoveries
NPLs to total loans and leases of 1.07% remained stable with 4Q15 and improved
from 1.20% in 1Q15 despite oil & gas downgrades
Transferred $373 million of consumer real estate TDRs to held for sale in
advance of a targeted June/July sale Allowance coverage of NPLs
113% vs. 115% in 4Q15 and 106% in 1Q15 GAAP diluted EPS of $0.41
up 8% from 1Q15 and up 5% from Adjusted diluted EPS Adjusted (1) operating leverage of 3% YoY NIM improved 9 bps to 2.86% from 2.77% in 1Q15 and 4Q15 ROTCE and efficiency ratio stable with 4Q15 (1) (1) |
 Key messages 14 We have the foundation for a great franchise, and are executing a comprehensive plan to tap full potential
1Q16 was another good quarter for Citizens
Financial results continue to improve and meet expectations
Good progress on strategic initiatives, mindset of ‘continuous
improvement’ Balance sheet management showing results (NIM,
loan growth, TDR sale, sub-debt repurchase, dividend
increase) Tangible book value
(1) per share continues to grow; $25.21 at quarter-end 2016 will continue to see a focus on execution Comprehensive plan to deliver well for all stakeholders Key to financial results is to grow the balance sheet smartly, execute build-out of fee businesses and
continue to deliver positive operating leverage
Will seek more efficiencies to offset fee sluggishness
Capital and credit position remains strong
Peer-leading CET1 ratio permits both strong loan growth and returns to
shareholders Credit metrics remain robust; oil and gas exposure
modest and well-reserved 1)
Non-GAAP item. See Appendix for a reconciliation of non-GAAP items.
|
 15 Appendix |
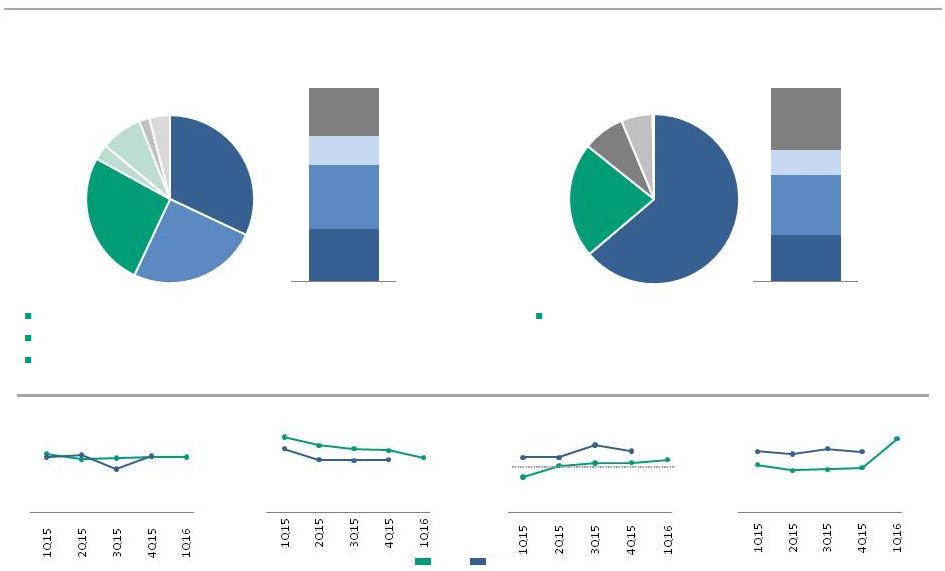
 $1,202 $1,201 $1,201 $1,216 $1,224 106% 114% 116% 115% 113% 1Q15 2Q15 3Q15 4Q15 1Q16 Allowance for loan and lease losses NPL coverage ratio 1.27% 1.24% 1.23% 1.23% 1.21% Allowance to loan coverage ratio Overall credit quality remains solid with charge offs and NPLs relatively stable
Net charge-offs of $83 million, or 0.33% of average loans and leases
increased modestly from 4Q15;
Commercial NCOs beginning to normalize but retail NCOs decreased linked
quarter, in part due to seasonality
Up 10 bps from 1Q15, which included an unusually high $28 million of
commercial recoveries
NPLs to total loans and leases remained stable at 1.07% as an increase in
commercial NPLs was largely offset by reduction in
retail Oil & gas portfolio NPLs up $210 million
TDR transaction and reclassification of GSE-guaranteed loans reduced NPLs
by $97 million and $77 million, respectively
Provision for credit losses of $91 million stable with 4Q15
Reserve increase related to the oil & gas portfolio was partially offset
by the benefit related to the planned TDR transaction as well as
improvement in retail Strong credit quality trends
continue 16
Highlights 1) Allowance for loan and lease losses to nonperforming loans and leases. $s in millions Net charge-offs (recoveries) Provision for credit losses, charge-offs, NPLs NPLs to loans and leases NPLs Allowance for loan and lease losses (1) ($22) $7 $5 ($3) $9 $69 $68 $66 $73 $67 $7 $3 $4 $7 $7 $54 $78 $75 $77 $83 0.23% 0.33% 0.31% 0.31% 0.33% 1Q15 2Q15 3Q15 4Q15 1Q16 Commercial Retail SBO Net c/o ratio 1.20% 1.09% 1.06% 1.07% 1.07% $54 $78 $75 $77 $83 $58 $77 $76 $91 $91 $1.1B $1.1B $1.0B $1.1B $1.1B 1Q15 2Q15 3Q15 4Q15 1Q16 Net charge-offs Provision for credit losses |
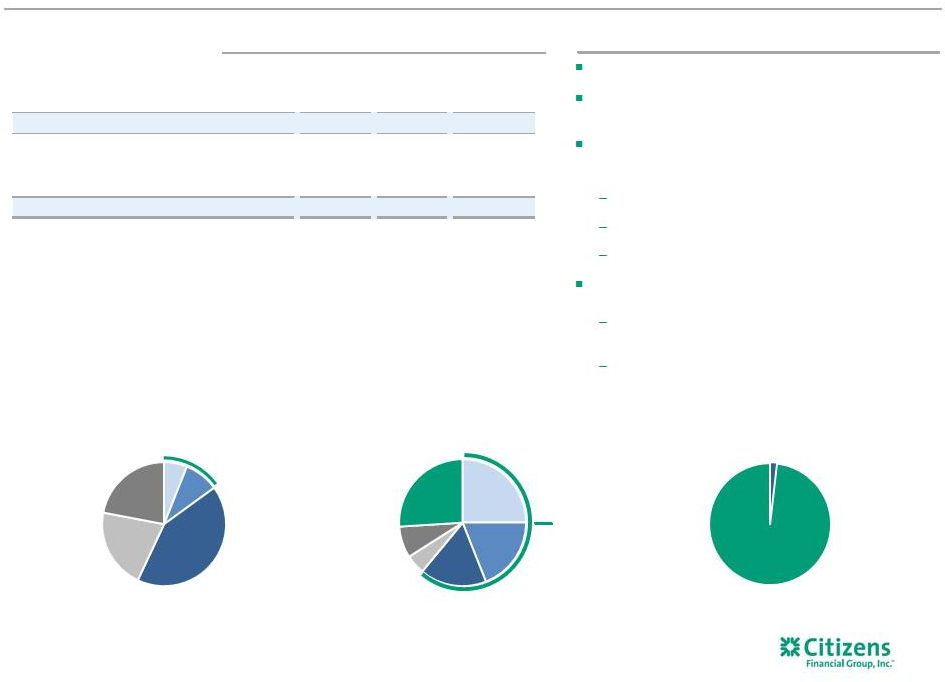
 32% 25% 26% 3% 8% 2% 4% 64% 22% 8% 6% 0.3% $53.0 billion 1Q16 retail portfolio (1) Source: SNL Financial and Company filings. Peers include CMA, BBT, FITB, KEY, MTB, PNC, RF, STI and USB.
1) Includes loans and leases (other than loans held for sale) from our Other portfolio allocated by product class according to our risk
management system. 2)
Includes owner-occupied commercial real estate.
3) Portfolio balances as of March 31, 2016. FICO score, LTV ratio, loan term, lien position, risk rating, property type, industry sector and
geographic stratifications as of February 29, 2016, as applicable.
4) Includes core and non-core loans. 5) Periods prior to 1Q16 include Nonaccrual loans plus 90+ days past due and still accruing loans as a % of total. 1Q16 includes Nonaccrual loans (excluding FDIC “covered” loans and loans guaranteed by the U.S. government) as a % of total. 6) Product view. Regulatory reporting basis. Includes non-core loans, which total 1% of Commercial loans.
7) Product view. Regulatory reporting basis. Includes core and non-core loans. Periods prior to 1Q16 include Nonaccrual loans plus 90+
days past due and still-accruing loans as a % of total. 1Q16 includes Nonaccrual loans (excluding FDIC “covered” loans and loans guaranteed by the U.S. government) as a % of total. 8) Footprint defined as 11-state branch footprint (CT, DE, MA, MI, NH, NJ, NY, OH, PA, RI & VT) and contiguous states where CFG
maintains offices (IL, IN, KY, MD & ME). $48.0
billion 1Q16 commercial portfolio
(2) Mid-Atlantic Midwest New England (2) Leases C&I CRE Mid-Atlantic Midwest New England 17 Diversified and granular loan mix Weighted-average FICO score of 756 86% collateralized (3) 69% of the consumer real estate portfolio is secured by a 1 lien (3) Highly granular, diversified portfolio with an average loan balance of less
than $10 million across the C&I, CRE and Leasing portfolios
Home Equity Indirect Auto Residential Mortgage Education Finance Credit Cards Other Non-Core Business Banking Retail NCO% (4) Retail NPL% (5) Commercial NPL% (7) Commercial NCO% (6) Non-Core 31% 13% 31% 25% Out of footprint (8) 25% 15% 33% 27% CFG vs. Peers 0.6% 0.5% 0.5% 0.6% 0.6% 0.6% 0.6% 0.4% 0.6% 1.7% 1.6% 1.5% 1.5% 1.3% 1.5% 1.3% 1.3% 1.3% 0.1% 0.1% 0.3% 0.2% -0.1% 0.0% 0.0% 0.0% 0.1% 0.6% 0.5% 0.6% 0.6% 0.4% 0.3% 0.3% 0.3% 0.8% Out of footprint (8) (3) st CFG Peers |
 25% 19% 17% 5% 8% 26% 1.8% 98.2% 6% 9% 42% 21% 22% Oil & Gas portfolio overview Well-diversified portfolio with ~100 clients Includes $339 million of corporate aircraft leases arising from Asset Finance $200 million of loans across seven credits moved to nonperforming status in 1Q16 following new regulatory guidance related to multi-tiered structures All loans current, still paying No charge-offs have been recorded No second lien positions Oil and gas portfolio loan loss reserves of $61 million as of 3/31/16 Reserves to total loans of more price-sensitive portfolios now at 6.3% (3) No E&P customers have filed bankruptcy 18 Highlights Total loans outstanding Oil & Gas All other loans 1) Includes Downstream, Integrated and Midstream sub-categories. 2) Portfolio balances as of March 31, 2016. FICO score, LTV ratio, loan term, lien position, risk rating, property type, industry sector and
geographic stratifications as of February 29, 2016 as applicable.
3) Reserves /(More price-sensitive Oil & Gas portfolio outstandings - leases secured by aircraft ($135 million)). AAA to A- BBB+ to BBB- BB+ to BB- B+ to B B- and lower 15% investment grade ~$1.1 billion more sensitive to declining oil prices Midstream Integrated Downstream Reserve-Based Lending (RBL) Upstream, Non-RBL Oil Field Services Oil & Gas portfolio by Sub-sector Oil & Gas portfolio by Investment grade-equivalent risk rating (2) 1Q16 Oil & Gas Outstandings $s in millions Total O/S Utilized % Criticized % Nonaccrual status Less price-sensitive total 706 $ 64% 0% 0 $
Upstream 314 82% Oilfield Services 344 67% RBL 457 63% More price-sensitive total 1,115 69% 49% 210 Total Oil & Gas
1,821 $ 67% 30% 210 $ (1) |
 Non-GAAP reconciliation table
19 (Excluding restructuring charges and special items) $s in millions, except per share data FOR THE YEAR ENDED DECEMBER 31, 2015 2014 2015 Change from 2014 CORE net interest income, excluding special items: Net interest income (GAAP) $3,402 $3,301 Less: Special items - - REPORTED NON-GAAP net interest income, excluding special items 3,402 3,301 Less: Estimated - Chicago Adjustment - 26 CORE net interest income, excluding special items $3,402 $3,275 3.9 % CORE noninterest income, excluding special items: Noninterest income (GAAP) $1,422 $1,678 Less: Special items - 288 REPORTED NON-GAAP noninterest income, excluding special items 1,422 1,390 Less: Securities Gains 29 28 Less: FFELP sale gain - 9 Less: Mortgage portfolio 10 - Less: Estimated - Chicago Adjustment - 24 CORE noninterest income, excluding special items $1,383 $1,329 4.1 % CORE total revenue, excluding special items: Total revenue (GAAP) A $4,824 $4,979 Less: Special items - 288 REPORTED NON-GAAP total revenues, excluding special items B 4,824 4,691 Less: Securities Gains 29 28 Less: FFELP sale gain - 9 Less: Mortgage portfolio 10 - Less: Estimated - Chicago Adjustment - Net interest income - 26 Less: Estimated - Chicago Adjustment - Noninterest income - 24 CORE total revenue, excluding special items C $4,785 $4,604 3.9 % CORE noninterest expense, excluding restructuring charges and special items:
Noninterest expense (GAAP)
D $3,259 $3,392 Less: Restructuring charges and special items 50 169 REPORTED NON-GAAP Noninterest expense, excluding restructuring charges and special items
E 3,209 3,223 Less: Estimated - Chicago Adjustment - 42 CORE Noninterest expense, excluding restructuring charges and special items
F $3,209 $3,181 0.9 % CORE Efficiency ratio: Efficiency ratio (non-GAAP) D/A 68 % 68 % REPORTED NON-GAAP Efficiency ratio, excluding restructuring charges and special items
E/B 67 % 69 % CORE- Efficiency ratio, excluding restructuring charges and special items F/C 67 % 69 % (199) bps |
 20 (Excluding restructuring charges and special items) $s in millions, except per share data Non-GAAP reconciliation table FOR THE YEAR ENDED DECEMBER 31, 2015 2014 2015 Change from 2014 CORE net income, excluding restructuring charges and special items: Net income (GAAP) G $840 $865 Add: Restructuring charges and special items, net of income tax expense (benefit)
31 (75) REPORTED NON-GAAP net Income, excluding restructuring charges and special items
871 790 Add: CORE restructuring charges and special items, net of income tax expense (benefit)
(27) (30) CORE net income, excluding restructuring charges and special items H $844 $760 11.1 % Effective Tax Rate (GAAP) 33.52% 31.80% CORE net income available to common stockholders, excluding restructuring charges and special items:
Net income available to common stockholders (GAAP)
I $833 $865 Add: Restructuring charges and special items, net of income tax expense (benefit)
31 (75) REPORTED NON-GAAP net income available to common stockholders, excluding restructuring charges and special items
864 790 Add: CORE restructuring charges and special items, net of income tax expense (benefit)
(27) (30) CORE net income available to common stockholders, excluding restructuring charges and special items
J $837 $760 10.1 % Return on average tangible common equity and return on average tangible common equity, excluding restructuring charges and special
items: Average common equity (GAAP)
$19,354 $19,399 Less: Average goodwill (GAAP) 6,876 6,876 Less: Average other intangibles (GAAP) 4 7 Add: Average deferred tax liabilities related to goodwill (GAAP) 445 377 Average tangible common equity (non-GAAP) K $12,919 $12,893 Return on average tangible common equity (non-GAAP) I/K 6.45 % 6.71 % REPORTED NON-GAAP Return on average tangible common equity, excluding restructuring charges and special items
6.69 % 6.13 % Core - Return on average tangible common equity, excluding restructuring charges and special items
J/K 6.48 % 5.87 % 61 bps Return on average total assets, excluding restructuring charges and special items:
Average total assets (GAAP)
L $135,070 $127,624 Return on average total assets (GAAP) G/L 0.62 % 0.68 % Core - Return on average total assets H/L 0.63 % 0.60 % 3 bps Operating leverage: Total revenue (GAAP) A $4,824 $4,979 (3.11)% Noninterest expense (GAAP) D $3,259 $3,392 (3.92)% Operating leverage (non-GAAP) 81 bps Operating leverage, excluding restructuring charges and special items: Total revenue, excluding restructuring charges and special items (non-GAAP)
B $4,824 $4,691 2.84% Less: Noninterest expense, excluding restructuring charges and special items (non-GAAP)
E $3,209 $3,223 (0.43)% Operating leverage, excluding restructuring charges and special items: (non-GAAP)
327 bps CORE Operating leverage, excluding restructuring charges and special items:
Total revenue, excluding restructuring charges and special items
(non-GAAP) C
$4,785 $4,604 3.93% Less: Noninterest expense, excluding restructuring charges and special items (non-GAAP)
F $3,209 $3,181 0.88 % CORE Operating leverage, excluding restructuring charges and special items: (non-GAAP)
305 bps |
 Non-GAAP reconciliation table
21 (Excluding Chicago Divestiture) $s in millions 2015 2014 Core net interest margin, excluding Chicago adjustment: Average interest earning assets (GAAP) $122,950 $116,187 Less: Estimated - Chicago adjustment - 516 Earning assets M $122,950 $115,671 Earning asset yield N 3.12% 3.14% Calculated interest income (GAAP) $3,854 $3,664 Less: Estimated - Chicago adjustment - 21 Interest income excluding Chicago adjustment (non-GAAP) O $3,854 $3,643 Total Interest-bearing liabilities balance (GAAP) $86,256 $79,609 Less: Estimated - Chicago adjustment - 1,960 Less: Estimated replacement funding - deposits - (1,442) Interest-bearing liabilities P $86,256 $79,091 Interest-bearing liabilities rate Q 0.52% 0.46% Calculated interest expense (GAAP) $452 $363 Add: Estimated - Chicago adjustment $0 $5 Interest expense excluding Chicago adjustment (non-GAAP) R $452 $368 Net interest income excluding Chicago adjustment (non-GAAP) S=O-R $3,402 $3,275 Core net interest margin, excluding Chicago adjustment (non-GAAP) ((M*N)-(P*Q))/M 2.75% 2.82% (7) bps FOR THE YEAR ENDED DECEMBER 31, 2015 Change from 2014 |
 Non-GAAP reconciliation table
22 (Excluding restructuring charges and special items) $s in millions, except per share data 2016 2015 2016 Change from 2015 Total revenue, excluding special items: Total revenue (GAAP) T $1,234 $1,183 Less: Special items - - Total revenues, excluding special items (non-GAAP) U $1,234 $1,183 4.3 % Noninterest expense, excluding restructuring charges and special items: Noninterest expense (GAAP) V $811 $810 Less: Restructuring charges and special items — 10 Noninterest expense, excluding restructuring charges and special items (non-GAAP)
W $811 $800 1.4 % Efficiency ratio: Efficiency ratio (non-GAAP) V/T 66 % 68 % Efficiency ratio, excluding restructuring charges and special items (non-GAAP)
W/U 66 % 68 % (199) bps Operating leverage: Total revenue (GAAP) T $1,234 $1,183 4% Noninterest expense (GAAP) V $811 $810 0% Operating leverage (non-GAAP) 4% Operating leverage, excluding restructuring charges and special items: Total revenue, excluding restructuring charges and special items (non-GAAP)
U $1,234 $1,183 4% Less: Noninterest expense, excluding restructuring charges and special items (non-GAAP)
W $811 $800 1% Operating leverage, excluding restructuring charges and special items: (non-GAAP)
3% Net income, excluding restructuring charges and special items: Net income (GAAP) X $223 $209 Add: Restructuring charges and special items, net of income tax expense — 6 Net income, excluding restructuring charges and special items (non-GAAP)
Y $223 $215 3.7 % Net income available to common stockholders, excluding restructuring charges and special items:
Net income available to common stockholders (GAAP)
Z $216 $209 Add: Restructuring charges and special items, net of income tax expense - 6 Net income available to common stockholders, excluding restructuring charges and special items (non-GAAP)
AA $216 $215 0.5 % Net income per average common share - basic and diluted, excluding restructuring charges and special items: Average common shares outstanding - basic (GAAP) BB 528,070,648 546,291,363 Average common shares outstanding - diluted (GAAP) CC 530,446,188 549,798,717 Net income available to common stockholders (GAAP) Z 216 209 Net income per average common share - basic (GAAP) Z/BB 0.41 0.38 8 % Net income per average common share - diluted (GAAP) Z/CC 0.41 0.38 8 % Net income available to common stockholders, excluding restructuring charges and special items (non-GAAP)
AA 216 215 Net income per average common share - basic, excluding restructuring charges and special items (non-GAAP) AA/BB 0.41 0.39 5 % Net income per average common share - diluted, excluding restructuring charges and special items (non-GAAP) AA/CC 0.41 0.39 5 % Return on average tangible common equity and return on average tangible common equity, excluding restructuring charges and special
items: Average common equity (GAAP)
$19,567 $19,407 Less: Average goodwill (GAAP) 6,876 6,876 Less: Average other intangibles (GAAP) 3 5 Add: Average deferred tax liabilities related to goodwill (GAAP) 481 422 Average tangible common equity (non-GAAP) DD $13,169 $12,948 Return on average tangible common equity (non-GAAP) Z/DD 6.61 % 6.53 % Return on average tangible common equity, excluding restructuring charges and special items (non-GAAP)
AA/DD 6.61 % 6.73 % (12) bps Tangible book value per common share: Common shares - at end of period (GAAP) EE 528,933,727 Stockholders' equity (GAAP) $19,718 Less: Goodwill (GAAP) 6,876 Less: Other intangible assets (GAAP) 3 Add: Deferred tax liabilities related to goodwill (GAAP) 494 Tangible common equity (non-GAAP) FF $13,333 Tangible book value per common share (non-GAAP) FF/EE $25.21 FOR THE QUARTER ENDED MARCH 31, |
 23 |