Attached files
| file | filename |
|---|---|
| 8-K - 8-K - NORTHERN TRUST CORP | barclaysconference8-k.htm |

1 northerntrust.com | © Northern Trust 2016 Barclays Americas Select Franchise Conference 2016 NORTHERN TRUST CORPORATION S. Biff Bowman Executive Vice President & Chief Financial Officer The Langham Hotel London 17 May 2016 EXHIBIT 99.1

2 northerntrust.com | © Northern Trust 2016 FORWARD-LOOKING STATEMENTS This presentation may include statements which constitute “forward-looking statements” within the meaning of the safe harbor provisions of the Private Securities Litigation Reform Act of 1995. Forward-looking statements are identified typically by words or phrases such as “believe,” “expect,” “anticipate,” “intend,” “estimate,” “project,” “likely,” “plan,” “goal,” “target,” “strategy,” and similar expressions or future or conditional verbs such as “may,” “will,” “should,” “would,” and “could”. Forward-looking statements include statements, other than those related to historical facts, that relate to Northern Trust’s financial results and outlook, capital adequacy, dividend policy, anticipated expense levels, spending related to technology and regulatory initiatives, risk management policies, contingent liabilities, strategic initiatives, industry trends, and expectations regarding the impact of recent legislation. These statements are based on Northern Trust’s current beliefs and expectations of future events or future results, and involve risks and uncertainties that are difficult to predict and subject to change. These statements are also based on assumptions about many important factors, including the factors discussed in Northern Trust’s most recent annual report on Form 10-K and other filings with the U.S. Securities and Exchange Commission, all of which are available on Northern Trust’s website. We caution you not to place undue reliance on any forward-looking statement as actual results may differ materially from those expressed or implied by forward-looking statements. Northern Trust assumes no obligation to update its forward-looking statements.

3 northerntrust.com | © Northern Trust 2016 CLIENT-CENTRIC, FOCUSED BUSINESS MODEL Pensions Sovereign entities Fund managers Foundations & endowments Insurance companies Individuals Families Family offices Foundations Endowments Privately held businesses Institutional Clients Personal Clients Asset Management $900 billion in AUM Asset Servicing $6.2 trillion in AUC Banking $118 billion in assets As of March 31, 2016

4 northerntrust.com | © Northern Trust 2016 WEALTH MANAGEMENT A full array of goals driven wealth management solutions for individuals, families and private businesses. Investment Management • Goals Driven Investing • Brokerage services Wealth Planning • Financial planning • Family education and governance • Tax and wealth transfer strategies • Philanthropy • Business owner services Trust & Estate Services • Wealth transfer planning • Custom trust solutions • Trust administration • Estate settlement services • Guardianship services Banking • Private banking • Business banking

5 northerntrust.com | © Northern Trust 2016 CORPORATE & INSTITUTIONAL SERVICES Delivering asset servicing and asset management solutions to institutional clients globally. • Fund accounting • Transfer agency • Corporate secretarial/trustee • Valuations • Investment operations outsourcing • Safekeeping • Settlement • Derivatives processing • Benefit payments • Income collection • Corporate actions • Tax reclamation • Global index management • Quantitative active • Fundamental active • Target date • Multi-manager • Exchange traded funds • Hedge funds • Private equity • Investment outsourcing • Liability-driven investing • Investment accounting • Reporting and valuation • Performance analytics • Risk monitoring and reporting • Trade execution analysis • Data warehouse • Cross-border pooling • Trade execution • Cash management • Transition management • Securities lending • Foreign exchange • Commission management • Passive currency overlay Administration Processing Reporting Enhancement Management

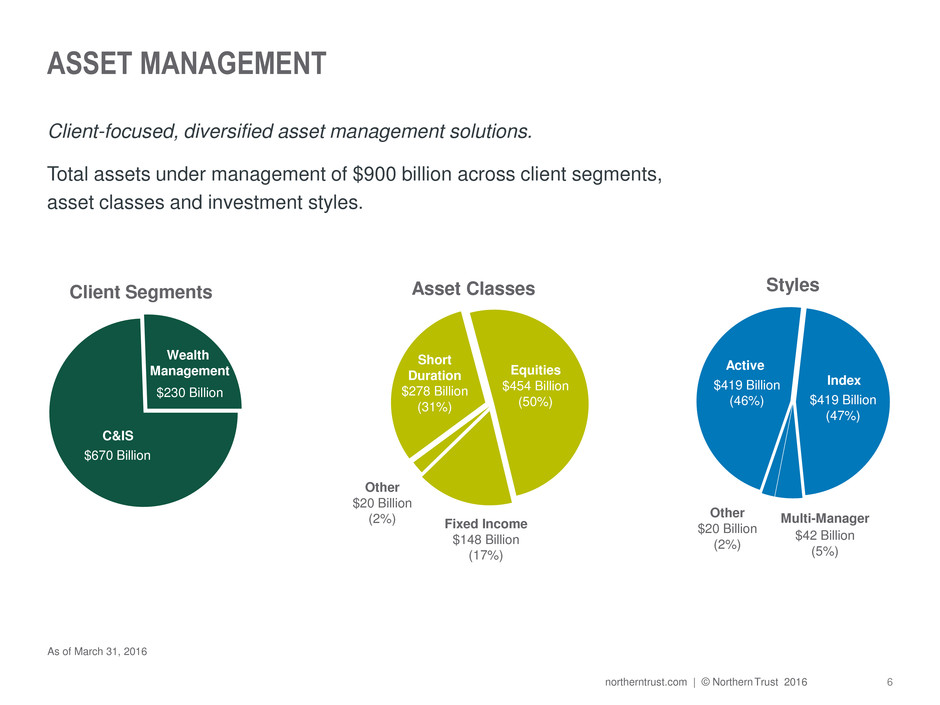
6 northerntrust.com | © Northern Trust 2016 Asset Classes Equities $454 Billion (50%) Fixed Income $148 Billion (17%) Short Duration $278 Billion (31%) Other $20 Billion (2%) Client Segments $670 Billion C&IS $230 Billion Wealth Management Styles $42 Billion (5%) $419 Billion (46%) Active $419 Billion (47%) Index Multi-Manager Other $20 Billion (2%) ASSET MANAGEMENT Total assets under management of $900 billion across client segments, asset classes and investment styles. Client-focused, diversified asset management solutions. As of March 31, 2016

7 northerntrust.com | © Northern Trust 2016 POSITIONED FOR CONTINUED SUCCESS Favorable secular trends align well with Northern Trust’s business model. Secular Trends Global wealth creation and increasing complexity Globalization and cross-border investing Back and middle office outsourcing for investment managers Increased regulation facing clients Evolving investor preferences Passive management Engineered equity Alternatives Accelerating demand for solutions-based technology

8 northerntrust.com | © Northern Trust 2016 FOCUSED ON ATTRACTIVE MARKETS The personal and institutional markets are large and growing. Global Personal Financial Wealth $US Trillion $145 $189 $19 $33 2014 2019E Households with >$20m CAGR: 5.5% 11.1% Sources: BCG Global Wealth 2015, Cerulli Associates Global Markets 2015, The City UK, eVestment, PWC, ETFGI, Ernst & Young and internal estimates Global Institutional Assets $US Trillion $38 $31 $29 $17 $7 $3 $161 $50 $40 $35 $20 $10 $6 2015 2019E Total $125 Retirement Funds Mutual/ Collective Funds Insurance Assets Sovereign Wealth Funds Alternatives ETFs CAGR: 6.5%

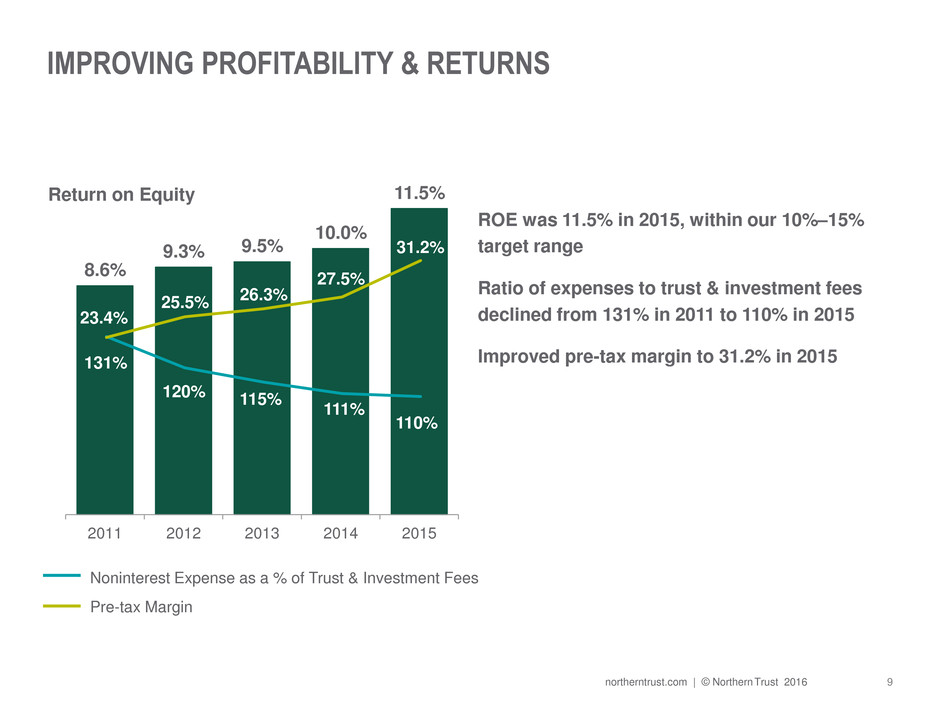
9 northerntrust.com | © Northern Trust 2016 IMPROVING PROFITABILITY & RETURNS ROE was 11.5% in 2015, within our 10%–15% target range Ratio of expenses to trust & investment fees declined from 131% in 2011 to 110% in 2015 Improved pre-tax margin to 31.2% in 2015 8.6% 9.3% 9.5% 10.0% 11.5% 2011 2012 2013 2014 2015 Pre-tax Margin 131% 120% 115% 111% 110% Noninterest Expense as a % of Trust & Investment Fees Return on Equity 23.4% 25.5% 26.3% 27.5% 31.2%

10 northerntrust.com | © Northern Trust 2016 RETURNING CAPITAL TO SHAREHOLDERS • Declared $333.1 million in common stock dividends in 2015 — $83.9 million in 1Q 2016 • Repurchased $496.9 million of our common stock in 2015 — $140.3 million in 1Q 2016 • Remaining capacity to repurchase up to $145 million of common stock through June 2016 under our 2015 Capital Plan • Submitted 2016 Capital Plan on April 5, 2016 $0.25 $0.28 $0.28 $0.28 $0.28 $0.30 $0.31 $0.33 $0.36 2007 2008 2009 2010 2011 2012 2013 2014 2015 Quarterly Dividend Paid per Common Share1 1Dividends shown represent the dividend in the 4th quarter of each year.

11 northerntrust.com | © Northern Trust 2016 CONSISTENTLY STRONG AND FOCUSED Long-term success through a focused strategy. • Market Leader in Focused Businesses • A History of Organic Growth • Distinctive Financial Strength • Proven Record of Managing for Long-term Growth and Profitability

12 northerntrust.com | © Northern Trust 2016
