Attached files
| file | filename |
|---|---|
| 8-K - 8-K - INVESTOR PRESENTATION (MAY 2016) - MOSAIC CO | a8-kinvestorpresentationma.htm |

The Mosaic Company Second Quarter 2016

This document contains forward-looking statements within the meaning of the Private Securities Litigation Reform Act of 1995. Such statements include, but are not limited to, statements about the Wa’ad Al Shamal Phosphate Company (also known as MWSPC) and other proposed or pending future transactions or strategic plans and other statements about future financial and operating results. Such statements are based upon the current beliefs and expectations of The Mosaic Company’s management and are subject to significant risks and uncertainties. These risks and uncertainties include but are not limited to risks and uncertainties arising from the ability of MWSPC to obtain additional planned funding in acceptable amounts and upon acceptable terms, the timely development and commencement of operations of production facilities in the Kingdom of Saudi Arabia, the future success of current plans for MWSPC and any future changes in those plans; difficulties with realization of the benefits of our long term natural gas based pricing ammonia supply agreement with CF Industries, Inc., including the risk that the cost savings initially anticipated from the agreement may not be fully realized over its term or that the price of natural gas or ammonia during the term are at levels at which the pricing is disadvantageous to Mosaic; customer defaults; the effects of Mosaic’s decisions to exit business operations or locations; the predictability and volatility of, and customer expectations about, agriculture, fertilizer, raw material, energy and transportation markets that are subject to competitive and other pressures and economic and credit market conditions; the level of inventories in the distribution channels for crop nutrients; the effect of future product innovations or development of new technologies on demand for our products; changes in foreign currency and exchange rates; international trade risks and other risks associated with Mosaic’s international operations and those of joint ventures in which Mosaic participates, including the risk that protests against natural resource companies in Peru extend to or impact the Miski Mayo mine; changes in government policy; changes in environmental and other governmental regulation, including expansion of the types and extent of water resources regulated under federal law, greenhouse gas regulation, implementation of numeric water quality standards for the discharge of nutrients into Florida waterways or efforts to reduce the flow of excess nutrients into the Mississippi River basin, the Gulf of Mexico or elsewhere; further developments in judicial or administrative proceedings, or complaints that Mosaic’s operations are adversely impacting nearby farms, business operations or properties; difficulties or delays in receiving, increased costs of or challenges to necessary governmental permits or approvals or increased financial assurance requirements; resolution of global tax audit activity; the effectiveness of Mosaic’s processes for managing its strategic priorities; adverse weather conditions affecting operations in Central Florida, the Mississippi River basin, the Gulf Coast of the United States or Canada, and including potential hurricanes, excess heat, cold, snow, rainfall or drought; actual costs of various items differing from management’s current estimates, including, among others, asset retirement, environmental remediation, reclamation or other environmental regulation, Canadian resources taxes and royalties, or the costs of the MWSPC, its existing or future funding and Mosaic’s commitments in support of such funding; reduction of Mosaic’s available cash and liquidity, and increased leverage, due to its use of cash and/or available debt capacity to fund financial assurance requirements and strategic investments; brine inflows at Mosaic’s Esterhazy, Saskatchewan, potash mine or other potash shaft mines; other accidents and disruptions involving Mosaic’s operations, including potential mine fires, floods, explosions, seismic events or releases of hazardous or volatile chemicals; and risks associated with cyber security, including reputational loss, as well as other risks and uncertainties reported from time to time in The Mosaic Company’s reports filed with the Securities and Exchange Commission. Actual results may differ from those set forth in the forward-looking statements. Safe Harbor Statement 2

Agriculture: Declining Farm Income Source: USDA 3 0 20 40 60 80 100 120 140 160 80 82 84 86 88 90 92 94 96 98 00 02 04 06 08 10 12 14 16F Bil $ U.S. Net Cash Income Source: USDA • Net Cash Income is the sum of crop and livestock receipts, direct government payments and other farm-related income (e.g. custom harvesting services), minus cash expenses, including rent. • This metric is used to benchmark the short term financial health of the U.S. farm sector.

Crop Nutrient Affordability a Significant Tailwind for Farmers Based on actual market prices Less A ffordable M ore A ffordable 4 0.50 0.75 1.00 1.25 1.50 1.75 05 06 07 08 09 10 11 12 13 14 15 16 Plant Nutrient Affordability Plant Nutrient Price Index / Crop Price Index Affordability Metric Average Source: Weekly Price Publications, CME, USDA, AAPFCO, Mosaic

Macro: Brazil Economy Main concern: ongoing credit issues Source: Mosaic 5 10 14 18 22 26 30 34 38 4 6 8 10 12 14 16 18 Jan-05 Jan-07 Jan-09 Jan-11 Jan-13 Jan-15 Reais Bu US$ Bu Source: CME and Forex Soybean Prices Monthly Average of Front Month Contract US$ Bu Reais Bu

Macro: Good Demand for P & K 6 Demand Is Not the Problem 65-66 30 35 40 45 50 55 60 65 70 00 01 02 03 04 05 06 07 08 09 10 11 12 13 14 15E 16F Global Phosphate ShipmentsMMT Product DAP/MAP/NPS*/TSP Source: CRU and Mosaic * NPS products containing 45 or more combined units of N and P2O5 59-60 25 30 35 40 45 50 55 60 65 00 01 02 03 04 05 06 07 08 09 10 11 12 13 14 15E 16F Global Potash ShipmentsMil Tonnes KCl Source: CRU and Mosaic
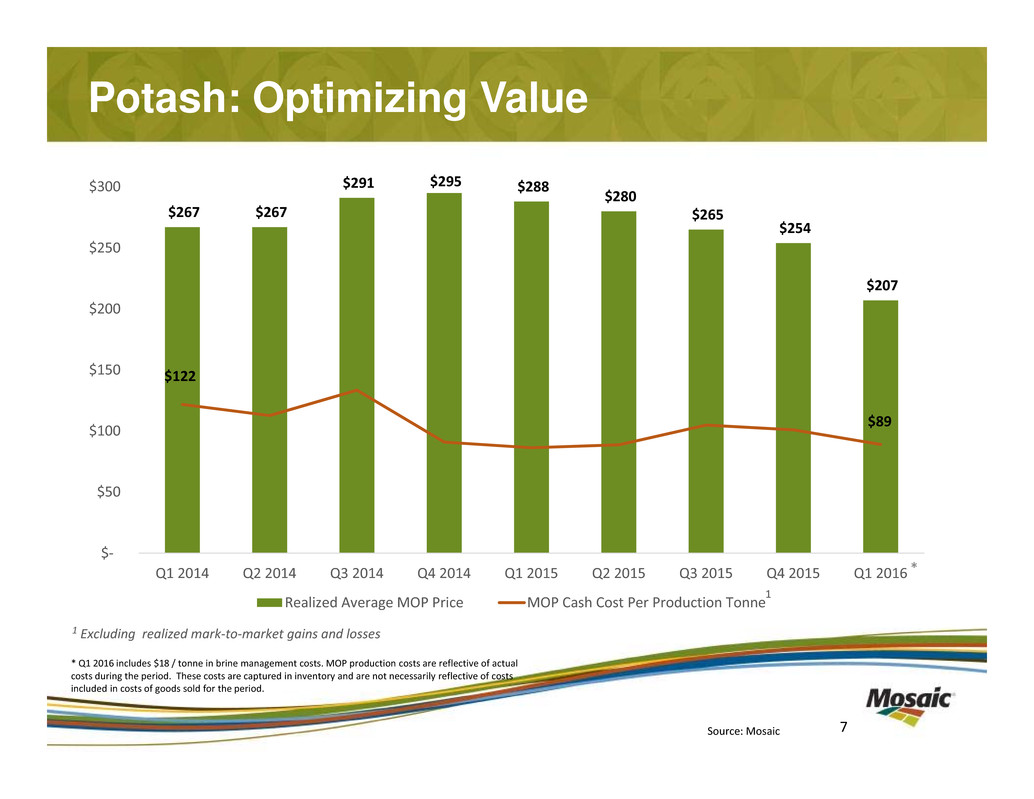
Potash: Optimizing Value 7Source: Mosaic $267 $267 $291 $295 $288 $280 $265 $254 $207 $122 $89 $‐ $50 $100 $150 $200 $250 $300 Q1 2014 Q2 2014 Q3 2014 Q4 2014 Q1 2015 Q2 2015 Q3 2015 Q4 2015 Q1 2016 Realized Average MOP Price MOP Cash Cost Per Production Tonne 1 1 Excluding realized mark‐to‐market gains and losses * Q1 2016 includes $18 / tonne in brine management costs. MOP production costs are reflective of actual costs during the period. These costs are captured in inventory and are not necessarily reflective of costs included in costs of goods sold for the period. *

$39 $0 $5 $10 $15 $20 $25 $30 $35 $40 $45 $50 2011 2012 2013 2014 2015 D o l l a r s / T o n n e Mining Cash Costs/Tonne of Phosphate Rock Mosaic Phosphates: Operational Excellence Source: Mosaic 8

0% 5% 10% 15% 20% 25% $‐ $50 $100 $150 $200 $250 $300 $350 $400 $450 $500 Q1 2014 Q2 2014 Q3 2014 Q4 2014 Q1 2015 Q2 2015 Q3 2015 Q4 2015 Q1 2016 Q2 2016F Q3‐Q4 2016F Avg. GM % GM % Range Realized DAP Average Price DAP Stripping Margin Phosphates: Improving Profitability in H2 9 Gross margin improving to 15 ‐ 20% in H2 of 2016 Source: Mosaic Stripping Margin: the difference between the fob plant price of DAP and the cost of sulphur and ammonia in one tonne of DAP

Mosaic: History of Innovation Source: Mosaic 10 0% 5% 10% 15% 20% 25% ‐ 200 400 600 800 1,000 1,200 1,400 1,600 1,800 2,000 2011 2012 2013 2014 2015 T h o u s a n d T o n n e s MicroEssentials® sales volume MicroEssentials® % of phosphate product volumes

Mosaic: Effective Capital Management Source: Mosaic 11 * 2013 through 2015 18% 13% 29% 40% Capital Allocation: Three Year Summary* Maintenance Organic Growth Investment Commitments Return to Shareholders (dividends & repurchases) ($ in billions) Total: $11.5 Billion A Balanced Approach to Capital Allocation
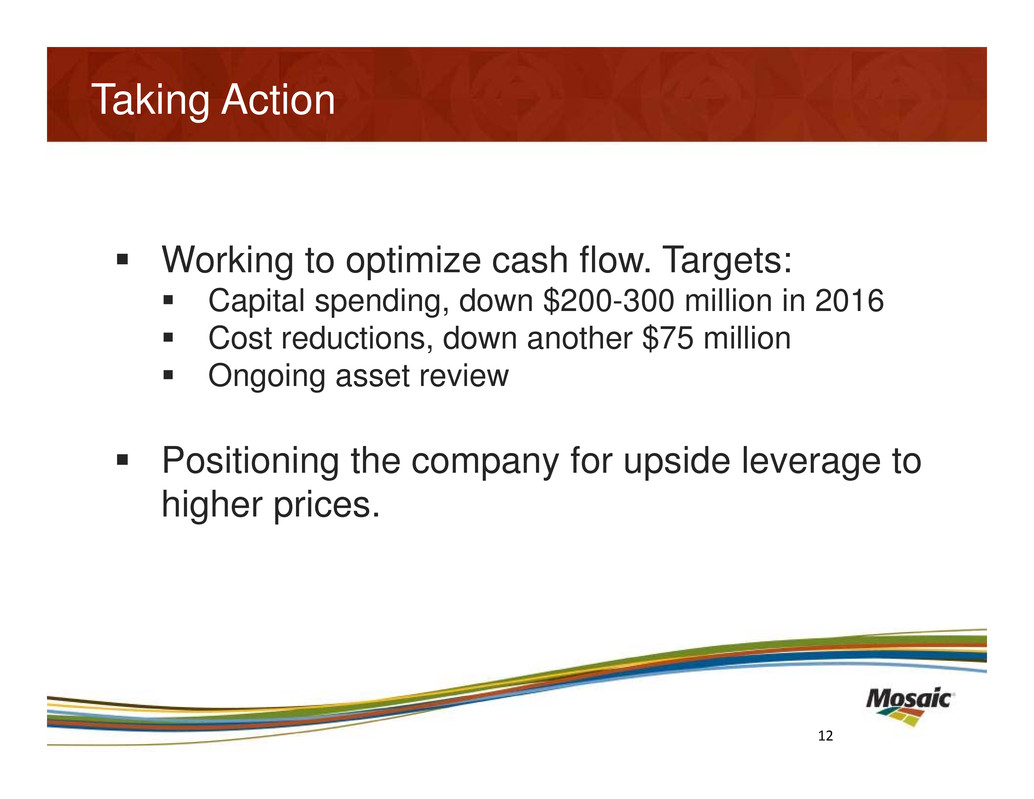
Taking Action 12 Working to optimize cash flow. Targets: Capital spending, down $200-300 million in 2016 Cost reductions, down another $75 million Ongoing asset review Positioning the company for upside leverage to higher prices.

Long Term 14

Yield Growth Required To Keep Up With Demand And The Long-term Trend Is Up 1.75 2.00 2.25 2.50 2.75 3.00 3.25 3.50 3.75 4.00 750 775 800 825 850 875 900 925 950 975 80 85 90 95 00 05 10 15F 20F 25F 30F MT HaMil Ha Actual Area Forecast Area Actual Yield Required Yield 1980-12 Yield Trend Source: USDA and Mosaic World Harvested Area and Average Yield 14

Mosaic’s Focus Build on Mosaic’s Track Record of Success: Execution Smart Investments Environmental Stewardship & Safety Prudently Manage Capital Grow Value for Mosaic’s Shareholders 15

Thank you

Global Potash Shipment Forecasts by Region (May 4, 2016) Muriate of Potash Million Tonnes (KCl) 2014R 2015R Feb Low 2016F Feb High 2016F May Low 2016F May High 2016F Comments China 13.8 15.9 13.4 13.7 13.6 13.8 The demand outlook remains positive, but shipments are projected to drop this year as a result of a drawdown of channel inventories. Q1 imports were in line with year‐ago levels, but Q2‐Q4 imports are expected to be less than last year given the later settlement of 2016 contracts (most likely in May). Based on input from our Beijing team, there is upside risk to our forecast (to 14.2 mmt). India 4.3 4.0 3.7 3.9 4.0 4.2 A below average monsoon and a weaker and volatile rupee combined to reduce demand even more than the decline in imports in 2015. Demand is expected to recover this year due to a good monsoon, a stronger rupee, and a workable subsidy. However, shipments are projected to stay flat to increase modestly as a result of an expected pull‐down of channel inventories. Indonesia/ Malaysia 5.3 4.3 4.7 5.1 4.9 5.1 Shipments dropped 1.0 mmt last year due to a build of channel inventories in 2014, weaker currencies, lower palm oil prices, and dry weather. Our shipment forecast has been revised higher – calling for a rebound of as much as 750,000 tonnes this year – based on better rainfall, lower K prices, and higher rice and palm oil prices. Europe and FSU 10.4 10.4 10.3 10.6 10.1 10.3 We have rebased our historical shipments using updated CRU data, which now show shipment volumes were flat last year. Shipments are forecast to tick lower this year as channel inventories are pulled down to average levels. Brazil 9.3 8.7 8.2 8.5 8.5 8.7 The drop in shipments was in line with the decline in use last year. As a result, channel inventories remained at elevated levels at the end of 2015. De‐stocking is taking place now, and demand prospects continue to improve due to near‐record local currency prices for soybeans, sugar and coffee. As a result, we now project only a slight decline in shipments this year. North America 9.8 8.9 8.8 9.1 9.0 9.1 Despite a well‐stocked distribution channel on January 1, we have nudged up our shipment forecast for 2016 based on improving demand prospects driven by higher crop prices, a jump in corn area, reports of strong and stable application rates, and lower retail MOP prices/improved affordability. Other 10.2 8.9 8.9 9.1 8.9 9.1 Shipments last year declined from high levels in 2014, but are projected to recover slightly in 2016 as a result of moderate gains in demand – particularly in SE Asia – partly offset by an inventory pulldown. Total 63.1 61.1 58.0 60.0 59.0 60.3 Our 2016 global shipments point estimate is unchanged at 59.7 mmt. We have narrowed our forecast range by lifting the bottom end to 59 million tonnes. Our bias is more upside than downside risk to current forecasts. Source: CRU and Mosaic. Numbers may not sum to total due to rounding. 17

Global Phosphate Shipment Forecasts by Region (May 4, 2016) Million Tonnes DAP/MAP/NPS*/TSP 2014 2015E Feb Low 2016F Feb High 2016F May Low 2016F May High 2016F Comments China 21.4 19.6 20.6 20.9 20.0 20.2 We have tempered expectations for a large rebound in shipments this year based on continued destocking of channel inventories under new working capital constraints and due to demand uncertainties caused by recent changes to key agricultural support prices (e.g. corn). India 7.7 9.2 8.5 8.8 9.1 9.3 Shipments and imports rose 1.5 and 2.5 mmt, respectively, last year, but a poor monsoon reduced on‐farm use and led to a large buildup of channel inventories. Forecasts for an above‐average monsoon, a stronger rupee, and a workable subsidy underpin outstanding demand prospects this year. We have boosted our shipment forecast while still expecting a pulldown of channel inventories. Other Asia/Oceania 7.5 8.5 8.1 8.3 7.9 8.1 Shipments last year exceeded expectations despite weaker/volatile currencies and weather issues in some regions. We project a modest drop in shipments this year, but note that there is more upside than downside risk to this forecast due to higher crop prices, more moderate P prices, average to below‐average channel inventories, improved weather prospects, and more stable forex rates. Europe and FSU 4.8 4.7 5.3 5.5 5.1 5.2 We have moderated our expectations for a recovery of shipments in Europe due to a stronger Euro and lower wheat prices. FSU currencies, particularly the ruble, have strengthened as well, curbing grain export economics and phosphate demand expectations. Weather, as always, is a wild card. Brazil 7.5 6.9 7.0 7.3 7.2 7.4 A stronger rebound in shipments is expected due to the recent rally in oilseed prices and near‐record local currency prices for sugar and coffee. In addition, the earlier release of more subsided credit and the greater use of barter are keeping product moving to the farm. Volatility of the real remains an issue. Other Latin America 3.2 3.0 3.2 3.4 3.2 3.3 We maintain our forecast for an increase in shipments elsewhere in Latin America based on solid farm economics. We continue to monitor the potential for higher‐than‐ expected imports by Argentina due to recent policy changes. North America 8.9 9.0 8.8 9.0 8.9 9.0 Large shipments and channel de‐stocking took place this spring. We estimate that U.S. farmers will plant ~92, ~84, and ~50 million acres of corn, soybeans, and wheat in 2015/16, and maintain P application rates. Prospects for 2016/17 are expected to stay strong with shipments in the 9.0 million tonne range. Other 4.0 3.5 3.6 3.8 3.6 3.7 Modest growth is expected in Africa and the Middle East. Total 64.9 64.4 65.0 67.0 65.0 66.0 Our point estimate of 65.6 million tonnes is up a whisker from the February forecast, but we narrowed our guidance to 65‐66 million tonnes. There likely is more upside than downside risk to forecasts for the major consuming regions. Source: CRU and Mosaic. Numbers may not sum to total due to rounding. * NPS products included in this analysis are those with a combined N and P2O5 nutrient content of 45 units or greater. 18
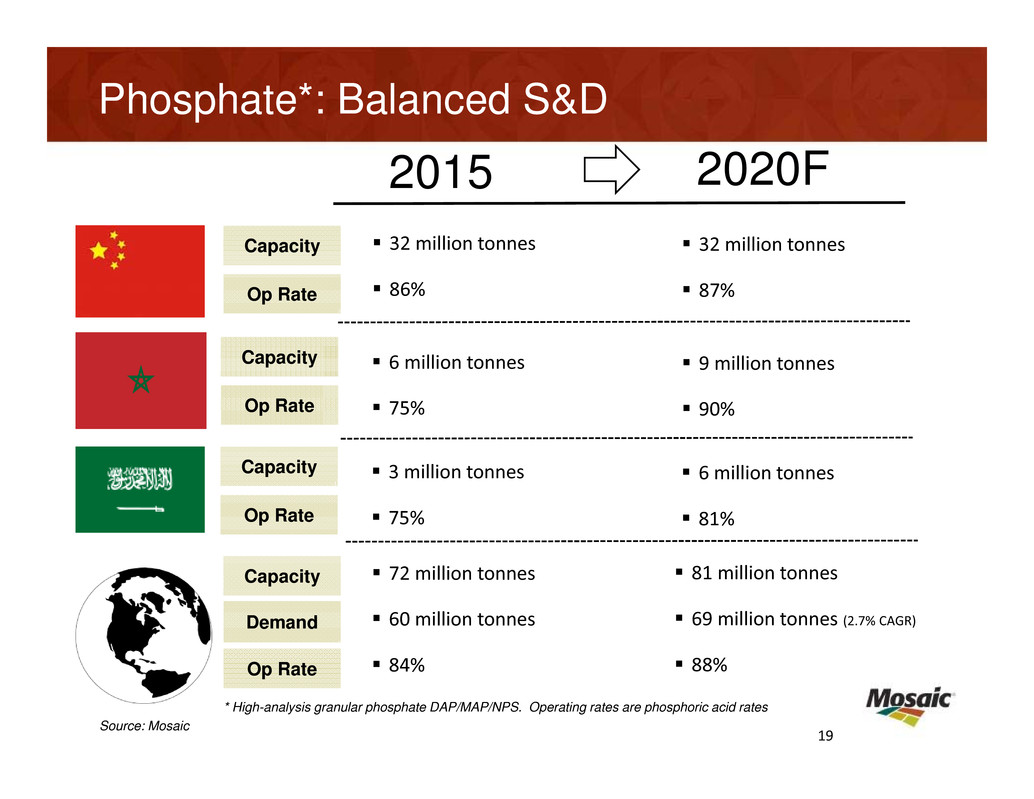
Phosphate*: Balanced S&D 2015 72 million tonnes 60 million tonnes 84% 2020F 81 million tonnes 69 million tonnes (2.7% CAGR) 88% 6 million tonnes 75% 9 million tonnes 90% 32 million tonnes 86% 32 million tonnes 87% Capacity Op Rate Capacity Op Rate Capacity Demand Op Rate 3 million tonnes 75% 6 million tonnes 81% Capacity Op Rate * High-analysis granular phosphate DAP/MAP/NPS. Operating rates are phosphoric acid rates 19 Source: Mosaic
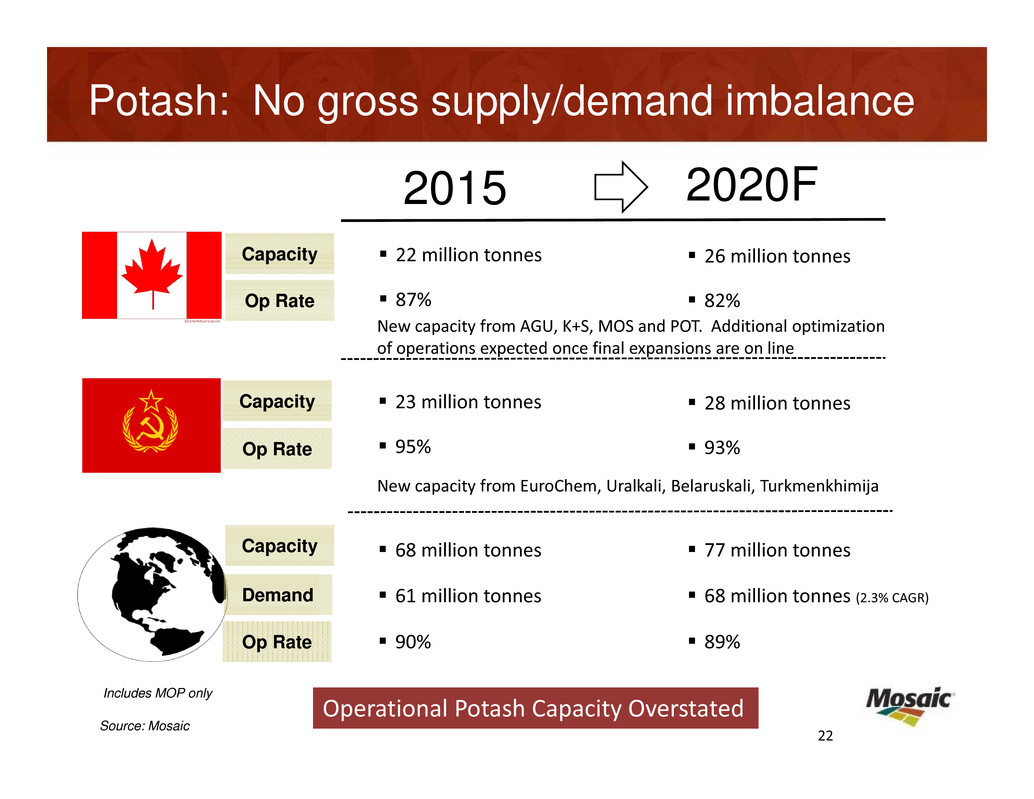
2015 68 million tonnes 61 million tonnes 90% 2020F Capacity Op Rate Capacity Op Rate Capacity Op Rate 77 million tonnes 68 million tonnes (2.3% CAGR) 89% 23 million tonnes 95% 28 million tonnes 93% 22 million tonnes 87% 26 million tonnes 82% Potash: No gross supply/demand imbalance Operational Potash Capacity Overstated Demand Includes MOP only 22 New capacity from EuroChem, Uralkali, Belaruskali, Turkmenkhimija New capacity from AGU, K+S, MOS and POT. Additional optimization of operations expected once final expansions are on line Source: Mosaic

0.65 0.70 0.75 0.80 0.85 0.90 0.95 1.00 Canada 0.04 0.06 0.08 0.10 0.12 Belarussia 0.010 0.015 0.020 0.025 0.030 0.035 Russia 2.0 2.5 3.0 3.5 4.0 4.5 Brazil 6.1 6.3 6.5 6.7 China 58.0 63.0 68.0 India Potash: Currency Swing Exacerbating Price Movement Source: Factset Bringing costs of production down …… …… and costs for customers up. 1/1/14 2/16 1/1/14 2/16 ‐24% +72% ‐58% +7.6% ‐56% +11% 21

Potash: Supply Reductions and Curtailments* Producer Reduced / Closed 2014-2018 Capacity (in tonnes) Mosaic Hersey Carlsbad MOP Colonsay re‐scale 100K 500K 800K Potash Corp New Brunswick 1,800K Uralkali Solikamsk 2 50% of 2,400K ICL Boulby MOP 900K Intrepid Carlsbad East & West MOP 700K TOTAL ~7 MM Supply Response to Low Prices is Evident * Sources in appendix 23
Source Disclosure Slide 16, Closure Sources: Press release, "The Mosaic Company Reports Third Quarter 2013 Results", November 5, 2013 Press release, "The Mosaic Company Reports Second Quarter 2014 Results", July 31, 2014 Press release, "PotashCorp Reports 2015 Third‐Quarter Earnings of $0.34 per Share". October 27, 2015 Press release, "Intrepid Potash Announces Second Quarter and First Half 2015 Results", October 27, 2015. Also, “Intrepid Potash Announces First Quarter 2016 Results”, May 9, 2015. ICL UK website, "Learn about ICL UK's Restructure", http://icl‐uk.uk/restructure Reuters, "UPDATE 1‐Russian potash mine accident pushes Uralkali shares to 4‐year low article", November 19, 2014 Bloomberg Business, "China to Sell Stake in Uralkali in $2.3 Billion Buyback", September 25, 2015 Slide 16, Curtailment Sources: Press release, “The Mosaic Company Reports Third Quarter 2015 Results", November 3, 2015 (amount of curtailment is based on guided operating rate for Q4 2015, around 70 percent, compared to the Q4 2014 operating rate, 91 percent). Press release, "PotashCorp Reports 2015 Fourth‐Quarter Earnings ", January 28, 2016 Press release, Belarusian Potash Company website, belpc.by/en/pressroom/news‐and‐events/2015/10/30/press‐release,‐october‐30,‐2015, October 30, 2015. Reuters UK, "Russia's Uralkali says may cut Q4 potash sales target by 300,000 T", November 10, 2015 27
