Attached files
| file | filename |
|---|---|
| 8-K - FORM 8-K - Superior Drilling Products, Inc. | v439904_8k.htm |
| EX-99.1 - EXHIBIT 99.1 - Superior Drilling Products, Inc. | v439904_ex99-1.htm |
| EX-99.2 - EXHIBIT 99.2 - Superior Drilling Products, Inc. | v439904_ex99-2.htm |
| EX-10.1 - EXHIBIT 10.1 - Superior Drilling Products, Inc. | v439904_ex10-1.htm |
Exhibit 99.3

© 2016 Superior Drilling Products First Quarter 2016 Financial Results Conference Call May 13, 2016 NYSE MKT: SDPI
© 2016 Superior Drilling Products 2 Safe Harbor Statement These slides and the accompanying oral presentation contain “forward - looking statements” within the meaning of the safe harbor provisions, 15 U.S.C. † 78u - 5, of the Private Securities Litigation Reform Act of 1995. All statements, other than statements of historical fact included in these slides and the accompanying oral presentation, regarding our strategy, future operations, financial position, estimated revenue and losses, projected costs, prospects, plans and objectives of management, are forward - looking statements. The use of words “could,” “believe,” “anticipate,” “intend,” “estimate,” “expect,” “may,” “continue,” “predict,” “potential,” “project”, “forecast,” “should” or “plan, and similar expressions are intended to identify forward - looking statements, although not all forward - looking statements contain such identifying words. Certain statements in these slides and the accompanying oral presentation may constitute forward - looking statements, including statements regarding the Company’s financial position, market success with specialized tools, effectiveness of its sales efforts, success at developing future tools, and the Company’s effectiveness at executing its business strategy and plans. These statements reflect the beliefs and expectations of the Company and are subject to risks and uncertainties that may cause actual results to differ materially. These risks and uncertainties include, among other factors, our business strategy and prospects for growth; our cash flows and liquidity; our financial strategy, budget, projections and operating results; the amount, nature and timing of capital expenditures; the availability and terms of capital; competition and government regulations; and general economic conditions. These and other factors could adversely affect the outcome and financial effects of the Company’s plans and described herein. Therefore, you should not rely on any of these forward - looking statements. Any forward - looking statement made by us in these slides and the accompanying oral presentation is based only on information currently available to us and speaks only as of the date on which it is made. We undertake no obligation to publicly update any forward - looking statement, whether written or oral, that may be made from time to time, whether as a result of new information, future developments or otherwise.
© 2016 Superior Drilling Products Troy Meier Chairman and Chief Executive Officer
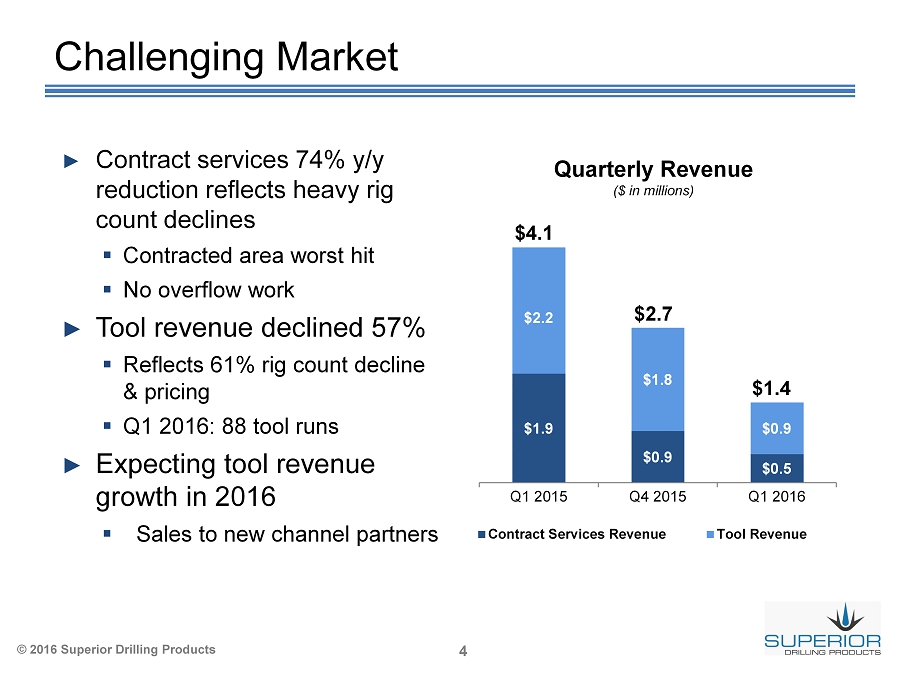
© 2016 Superior Drilling Products 4 $1.9 $0.9 $0.5 $2.2 $1.8 $0.9 Q1 2015 Q4 2015 Q1 2016 Contract Services Revenue Tool Revenue Challenging Market ► Contract services 74% y/y reduction reflects heavy rig count declines ▪ Contracted area worst hit ▪ No overflow work ► Tool revenue declined 57% ▪ Reflects 61% rig count decline & pricing ▪ Q1 2016: 88 tool runs ► Expecting tool revenue growth in 2016 ▪ Sales to new channel partners ($ in millions) Quarterly Revenue $4.1 $2.7 $1.4
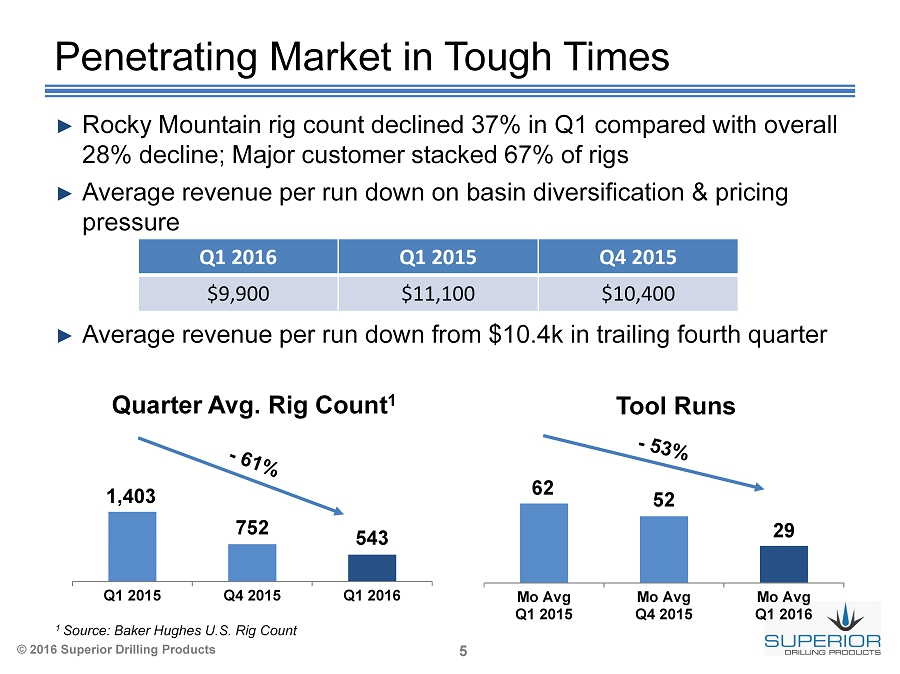
© 2016 Superior Drilling Products 5 ► Rocky Mountain rig count declined 37% in Q1 compared with overall 28% decline; Major customer stacked 67% of rigs ► Average revenue per run down on basin diversification & pricing pressure ► Average revenue per run down from $10.4k in trailing fourth quarter 1,403 752 543 Q1 2015 Q4 2015 Q1 2016 Penetrating Market in Tough Times 1 Source : Baker Hughes U.S. Rig Count 62 52 29 Mo Avg Q1 2015 Mo Avg Q4 2015 Mo Avg Q1 2016 Tool Runs Quarter Avg. Rig Count 1 Q1 2016 Q1 2015 Q4 2015 $9,900 $11,100 $10,400
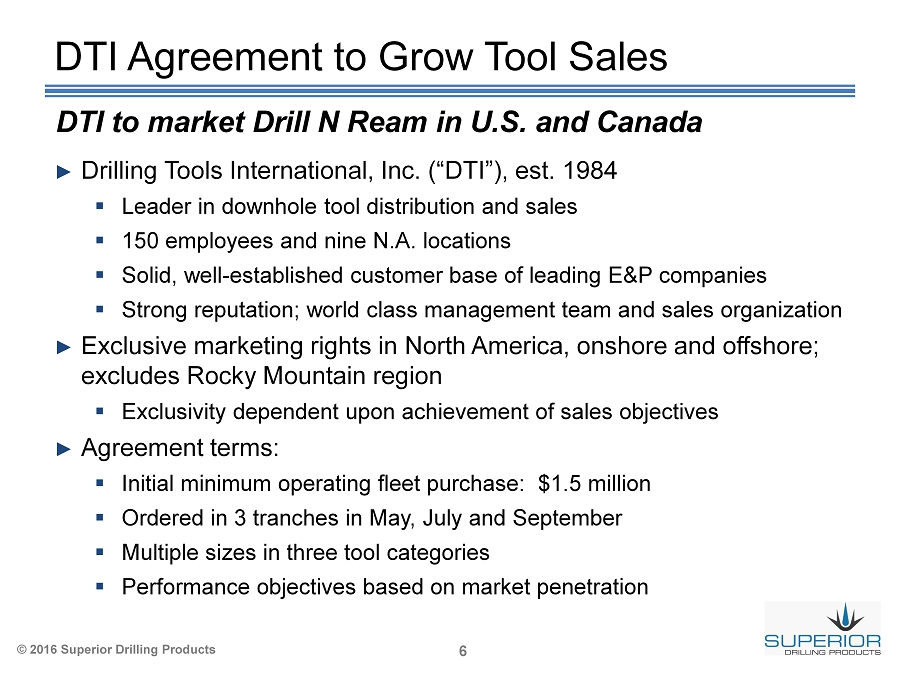
© 2016 Superior Drilling Products 6 DTI Agreement to Grow Tool Sales ► Drilling Tools International, Inc. (“DTI”), est. 1984 ▪ Leader in downhole tool distribution and sales ▪ 150 employees and nine N.A. locations ▪ Solid, well - established customer base of leading E&P companies ▪ Strong reputation; world class management team and sales organization ► Exclusive marketing rights in North America, onshore and offshore; excludes Rocky Mountain region ▪ Exclusivity dependent upon achievement of sales objectives ► Agreement terms: ▪ Initial minimum operating fleet purchase: $1.5 million ▪ Ordered in 3 tranches in May, July and September ▪ Multiple sizes in three tool categories ▪ Performance objectives based on market penetration DTI to market Drill N Ream in U.S. and Canada

© 2016 Superior Drilling Products Financial Results Chris Cashion Chief Financial Officer
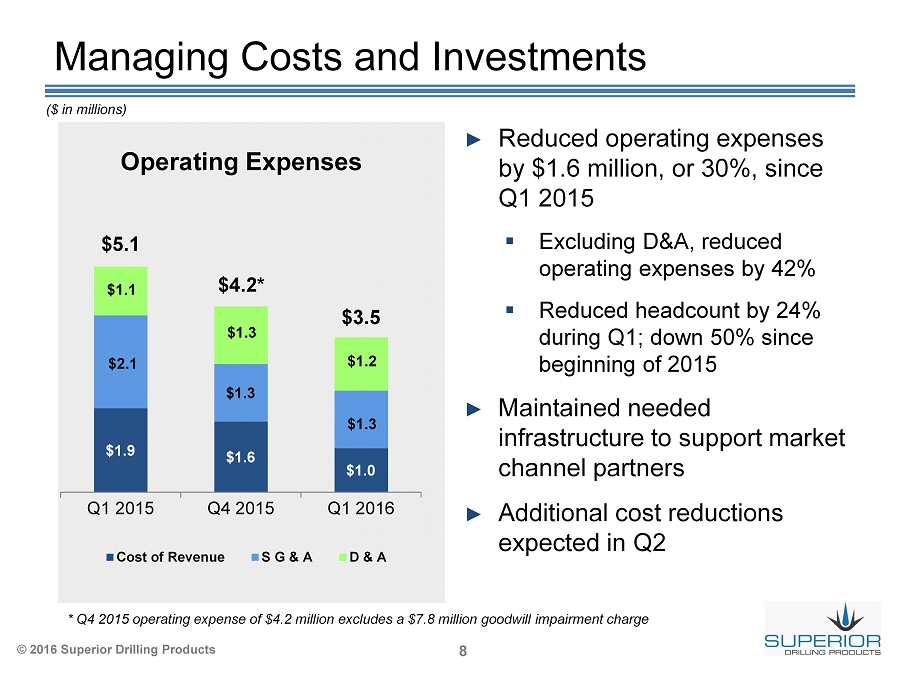
© 2016 Superior Drilling Products 8 $1.9 $1.6 $1.0 $2.1 $1.3 $1.3 $1.1 $1.3 $1.2 Q1 2015 Q4 2015 Q1 2016 Cost of Revenue S G & A D & A $5.1 $4.2* $3.5 Managing Costs and Investments ► Reduced operating expenses by $1.6 million, or 30%, since Q1 2015 ▪ Excluding D&A , reduced operating expenses by 42% ▪ Reduced headcount by 24% during Q1; down 50% since beginning of 2015 ► Maintained needed infrastructure to support market channel partners ► Additional cost reductions expected in Q2 Operating Expenses ($ in millions) * Q4 2015 operating expense of $4.2 million excludes a $7.8 million goodwill impairment charge
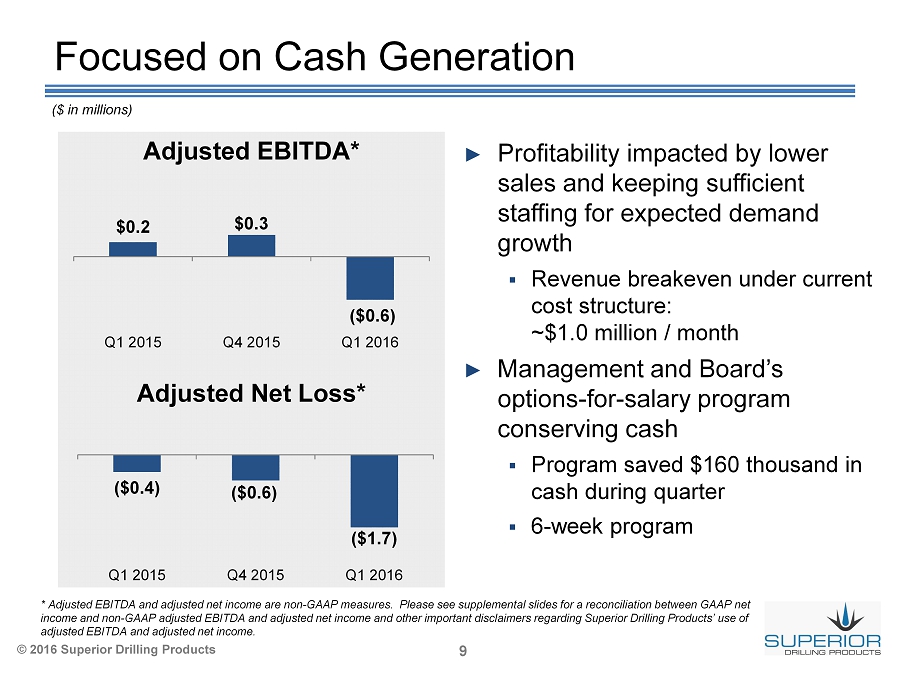
© 2016 Superior Drilling Products 9 Focused on Cash Generation $0.2 $0.3 ($0.6) Q1 2015 Q4 2015 Q1 2016 ► Profitability impacted by lower sales and keeping sufficient staffing for expected demand growth ▪ Revenue breakeven under current cost structure: ~$1.0 million / month ► Management and Board’s options - for - salary program conserving cash ▪ Program saved $160 thousand in cash during quarter ▪ 6 - week program Adjusted EBITDA * * Adjusted EBITDA and adjusted net income are non - GAAP measures. Please see supplemental slides for a reconciliation between GA AP net income and non - GAAP adjusted EBITDA and adjusted net income and other important disclaimers regarding Superior Drilling Products ’ use of adjusted EBITDA and adjusted net income. ($ in millions) Adjusted Net Loss* ($0.4) ($0.6) ($1.7) Q1 2015 Q4 2015 Q1 2016
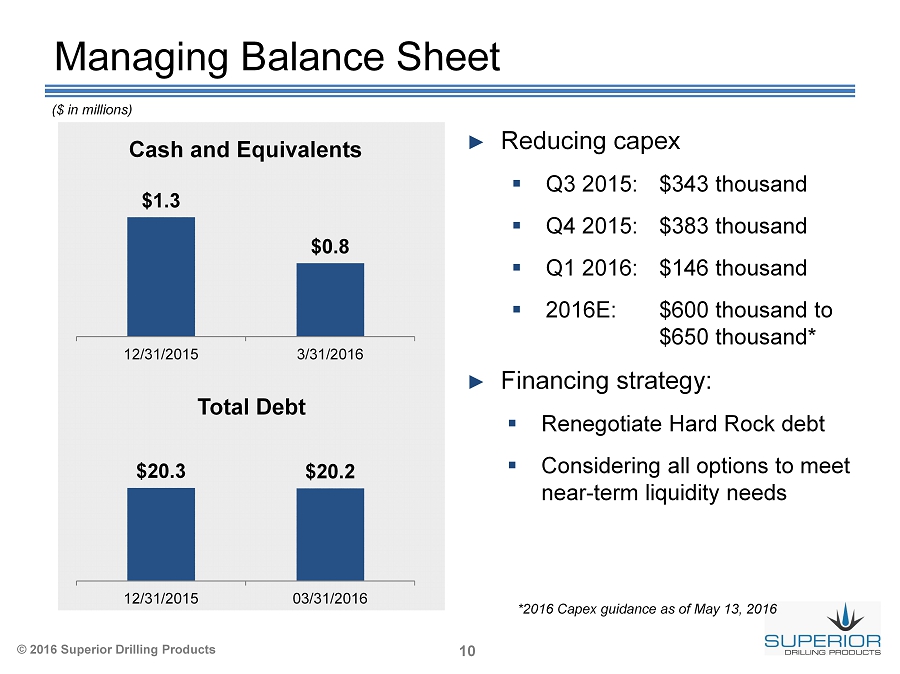
© 2016 Superior Drilling Products 10 Managing Balance Sheet ► Reducing capex ▪ Q3 2015: $343 thousand ▪ Q4 2015: $383 thousand ▪ Q1 2016: $146 thousand ▪ 2016E: $600 thousand to $650 thousand* ► Financing strategy: ▪ Renegotiate Hard Rock debt ▪ Considering all options to meet near - term liquidity needs Cash and Equivalents Total Debt $20.3 $20.2 12/31/2015 03/31/2016 ($ in millions) $1.3 $0.8 12/31/2015 3/31/2016 *2016 Capex guidance as of May 13, 2016
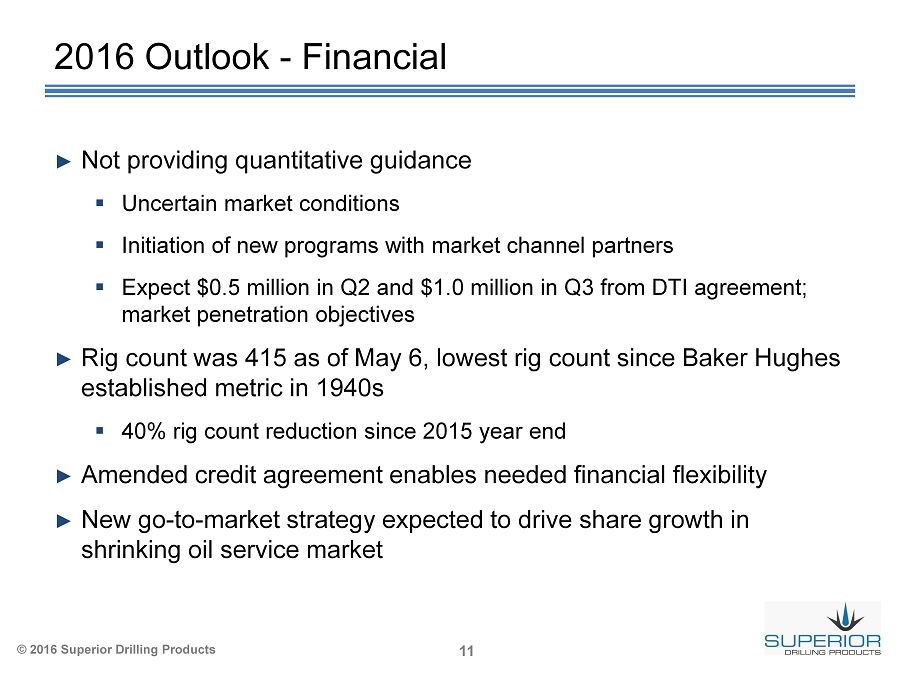
© 2016 Superior Drilling Products 11 2016 Outlook - Financial ► Not providing quantitative guidance ▪ Uncertain market conditions ▪ Initiation of new programs with market channel partners ▪ Expect $0.5 million in Q2 and $1.0 million in Q3 from DTI agreement; market penetration objectives ► Rig count was 415 as of May 6, lowest rig count since Baker Hughes established metric in 1940s ▪ 40% rig count reduction since 2015 year end ► Amended credit agreement enables needed financial flexibility ► New go - to - market strategy expected to drive share growth in shrinking oil service market

© 2016 Superior Drilling Products Overview and Outlook Troy Meier Chairman and Chief Executive Officer
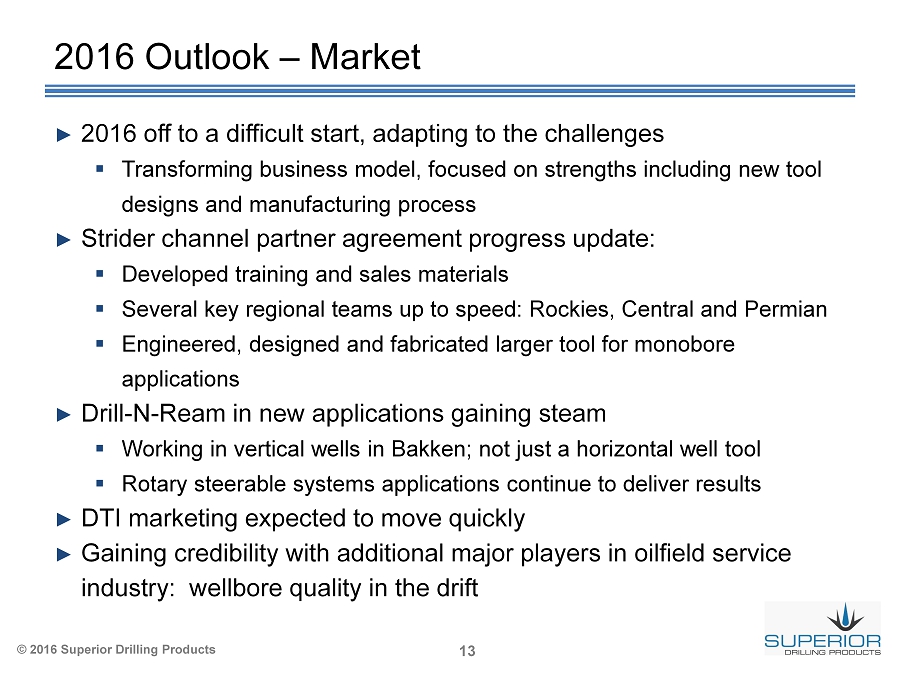
© 2016 Superior Drilling Products 13 2016 Outlook – Market ► 2016 off to a difficult start, adapting to the challenges ▪ Transforming business model, focused on strengths including new tool designs and manufacturing process ► Strider channel partner agreement progress update: ▪ Developed training and sales materials ▪ Several key regional teams up to speed: Rockies, Central and Permian ▪ Engineered, designed and fabricated larger tool for monobore applications ► Drill - N - Ream in new applications gaining steam ▪ Working in vertical wells in Bakken; not just a horizontal well tool ▪ Rotary steerable systems applications continue to deliver results ► DTI marketing expected to move quickly ► Gaining credibility with additional major players in oilfield service industry: wellbore quality in the drift
© 2016 Superior Drilling Products Supplemental Information
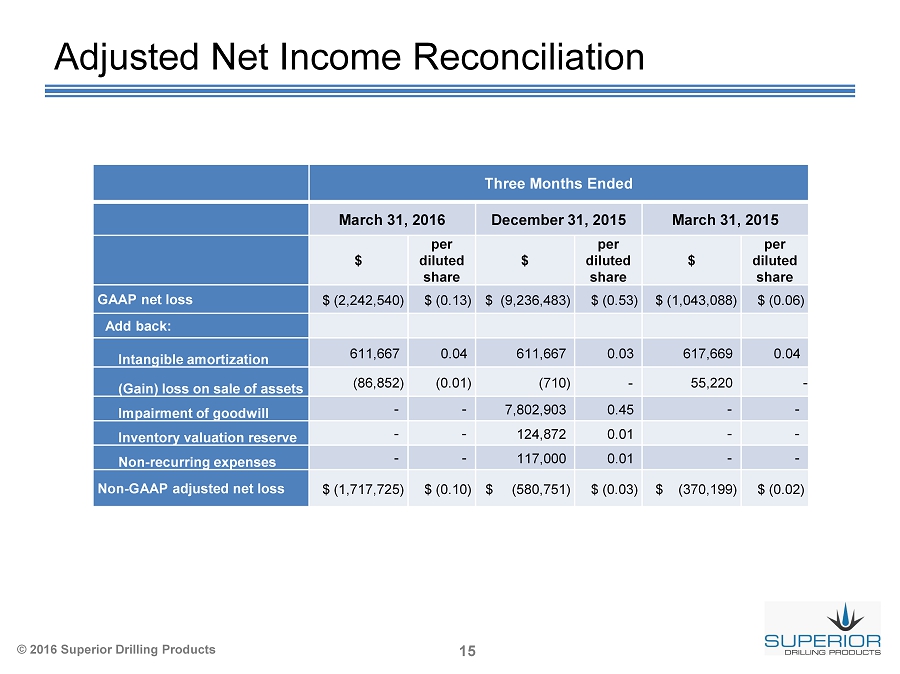
© 2016 Superior Drilling Products 15 Adjusted Net Income Reconciliation Three Months Ended March 31, 2016 December 31, 2015 March 31, 2015 $ per diluted share $ per diluted share $ per diluted share GAAP net loss $ ( 2,242,540) $ (0.13) $ (9,236,483) $ (0.53) $ (1,043,088) $ (0.06) Add back: Intangible amortization 611,667 0.04 611,667 0.03 617,669 0.04 (Gain) loss on sale of assets (86,852) (0.01) (710) - 55,220 - Impairment of goodwill - - 7,802,903 0.45 - - Inventory valuation reserve - - 124,872 0.01 - - Non - recurring expenses - - 117,000 0.01 - - Non - GAAP adjusted net loss $ ( 1,717,725) $ (0.10) $ (580,751) $ (0.03) $ (370,199) $ (0.02)
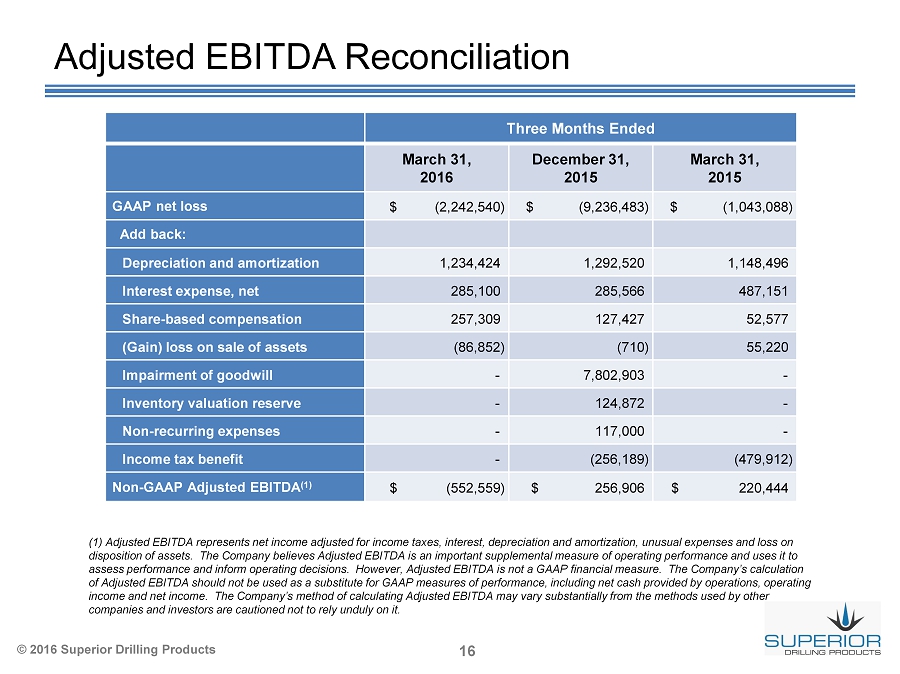
© 2016 Superior Drilling Products 16 Adjusted EBITDA Reconciliation (1) Adjusted EBITDA represents net income adjusted for income taxes, interest, depreciation and amortization, unusual expenses and loss on disposition of assets. The Company believes Adjusted EBITDA is an important supplemental measure of operating performance and uses it to assess performance and inform operating decisions. However, Adjusted EBITDA is not a GAAP financial measure. The Company’s cal culation of Adjusted EBITDA should not be used as a substitute for GAAP measures of performance, including net cash provided by operat ion s, operating income and net income. The Company’s method of calculating Adjusted EBITDA may vary substantially from the methods used by o the r companies and investors are cautioned not to rely unduly on it. Three Months Ended March 31, 2016 December 31, 2015 March 31, 2015 GAAP net loss $ ( 2,242,540) $ (9,236,483) $ (1,043,088) Add back: Depreciation and amortization 1,234,424 1,292,520 1,148,496 Interest expense, net 285,100 285,566 487,151 Share - based compensation 257,309 127,427 52,577 (Gain) loss on sale of assets (86,852) (710) 55,220 Impairment of goodwill - 7,802,903 - Inventory valuation reserve - 124,872 - Non - recurring expenses - 117,000 - Income tax benefit - (256,189) (479,912) Non - GAAP Adjusted EBITDA (1) $ (552,559) $ 256,906 $ 220,444