Attached files
| file | filename |
|---|---|
| 8-K - FORM 8-K - Macquarie Leasing Pty Ltd | d153784d8k.htm |
Exhibit 99.1

Australia and New Zealand Banking Group Limited
ABN 11 005 357 522
Half Year
31 March 2016
Consolidated Financial Report
Dividend Announcement
and Appendix 4D
|
The Consolidated Financial Report and Dividend Announcement contains information required by Appendix 4D of the Australian Securities Exchange (ASX) Listing Rules. It should be read in conjunction with ANZ’s 2015 Annual Report, and is lodged with the ASX under listing rule 4.2A.
|
| RESULTS FOR ANNOUNCEMENT TO THE MARKET | APPENDIX 4D |
| Name of Company: | Australia and New Zealand Banking Group Limited ABN 11 005 357 522 |
Report for the half year ended 31 March 2016
| Operating Results1 | AUD million | |||||||||||||
| Operating income |
¨ | 0% | to | 10,265 | ||||||||||
| Net statutory profit attributable to shareholders |
ò | -22% | to | 2,738 | ||||||||||
| Cash profit2 |
ò | -24% | to | 2,782 | ||||||||||
| Dividends3 | Cents per share |
Franked amount4 per share | ||||||
| Proposed interim dividend |
80 | 100% | ||||||
| Record date for determining entitlements to the proposed 2016 interim dividend |
10 May 2016 | |||||||
| Payment date for the proposed 2016 interim dividend |
1 July 2016 | |||||||
Dividend Reinvestment Plan and Bonus Option Plan
Australia and New Zealand Banking Group Limited (ANZ) has a Dividend Reinvestment Plan (DRP) and a Bonus Option Plan (BOP) that will operate in respect of the 2016 interim dividend. For the 2016 interim dividend, ANZ intends to provide shares under the DRP and BOP through the issue of new shares. The ‘Acquisition Price’ to be used in determining the number of shares to be provided under the DRP and BOP will be calculated by reference to the arithmetic average of the daily volume weighted average sale price of all fully paid ANZ ordinary shares sold in the ordinary course of trading on the ASX during the ten trading days commencing on 13 May 2016, and then rounded to the nearest whole cent. Shares provided under the DRP and BOP will rank equally in all respects with existing fully paid ANZ ordinary shares. Election notices from shareholders wanting to commence, cease or vary their participation in the DRP or BOP for the 2016 interim dividend must be received by ANZ’s Share Registrar by 5.00pm (Australian Eastern Standard Time) on 11 May 2016. Subject to receiving effective contrary instructions from the shareholder, dividends payable to shareholders with a registered address in the United Kingdom (including the Channel Islands and the Isle of Man) or New Zealand will be converted to Pounds Sterling or New Zealand Dollars respectively at an exchange rate calculated on 13 May 2016.
| 1 | Unless otherwise noted, all comparisons are to the half year ended 31 March 2015. |
| 2 | Cash profit excludes non-core items included in statutory profit and is provided to assist readers in understanding the result of the ongoing business activities of the Group. The non-core items are calculated consistently period on period so as not to discriminate between positive and negative adjustments and fall into one of the three categories: gains or losses included in earnings arising from changes in tax, legal or accounting legislation or other non-core items not associated with ongoing operations of the Group; treasury shares, revaluation of policy liabilities, economic hedging and similar accounting items that represent timing differences that will reverse through earnings in the future; and accounting reclassifications between individual line items that do not impact reported results, such as policy holder gross up. Cash profit is not a measure of cash flow or profit determined on a cash basis. The net after tax adjustment was an addition to statutory profit of $44 million made up of several items. Refer pages 91 to 96 for further details. |
| 3 | There is no foreign conduit income attributed to the dividends. |
| 4 | It is proposed that the interim dividend will be fully franked for Australian tax purposes (30% tax rate) and carry New Zealand imputation credits of NZD 10 cents per ordinary share. |
| AUSTRALIA AND NEW ZEALAND BANKING GROUP LIMITED | ABN 11 005 357 522 |
CONSOLIDATED FINANCIAL REPORT, DIVIDEND ANNOUNCEMENT AND APPENDIX 4D
Half year ended 31 March 2016
|
CONTENTS
|
PAGE
| |
| Section 1 – News Release |
5 | |
| Section 2 – Summary |
9 | |
| Section 3 – Strategic Review |
19 | |
| Section 4 – Group Results |
21 | |
| Section 5 – Divisional Results |
49 | |
| Section 6 – Geographic Results |
83 | |
| Section 7 – Profit Reconciliation |
91 | |
| Section 8 – Condensed Consolidated Financial Statements |
97 | |
| Section 9 – Supplementary Information |
129 | |
| Definitions |
148 | |
| ASX Appendix 4D Cross Reference Index |
151 | |
| Alphabetical Index
|
152
| |
|
|
||
This Consolidated Financial Report, Dividend Announcement and Appendix 4D has been prepared for Australia and New Zealand Banking Group Limited (the “Company” or “Parent Entity”) together with its subsidiaries which are variously described as “ANZ”, “Group”, “ANZ Group”, “the consolidated entity” “the Bank”, “us”, “we” or “our”.
All amounts are in Australian dollars unless otherwise stated. The information on which the Condensed Consolidated Financial Statements are based have been reviewed by the Group’s auditors, KPMG. The Company has a formally constituted Audit Committee of the Board of Directors. The signing of the Condensed Consolidated Financial Statements was approved by resolution of a Committee of the Board of Directors on 2 May 2016.
When used in this Results Announcement the words “estimate”, “project”, “intend”, “anticipate”, “believe”, “expect”, “should” and similar expressions, as they relate to ANZ and its management, are intended to identify forward-looking statements. Readers are cautioned not to place undue reliance on these forward-looking statements, which speak only as of the date hereof. ANZ does not undertake any obligation to publicly release the result of any revisions to these forward-looking statements to reflect events or circumstances after the date hereof or to reflect the occurrence of unanticipated events.
| AUSTRALIA AND NEW ZEALAND BANKING GROUP LIMITED | ABN 11 005 357 522 |
This page has been left blank intentionally
| AUSTRALIA AND NEW ZEALAND BANKING GROUP LIMITED | ABN 11 005 357 522 |
| News Release |

|
ANZ reports 2016 Half Year Result1
ANZ today announced a statutory profit after tax for the half year ended 31 March 2016 of $2.7 billion down 22% and a cash profit2 of $2.8 billion down 24%, following a $717 million net charge primarily related to initiatives to reposition the Group for stronger profit before provisions growth in the future.
Excluding these Specified Items (see page 3), allowing for better comparison with previous periods, adjusted pro-forma cash profit3 was $3.5 billion down 4% and profit before provisions was up 5%.
The Interim Dividend of 80 cents per share fully franked is down 7% reflecting a move to gradually consolidate ANZ’s dividend payout ratio within its historic range of 60-65% of annual cash profit4 which provides a conservative, sustainable and fully franked dividend base for the future. The Final Dividend for FY16 is expected to be at least the same as the Interim Dividend in cents per share.
The result reflects a strong performance in ANZ’s Australian and New Zealand consumer and small business franchises and challenging market conditions in Institutional Banking including higher provisions in the resources sector and in related industries.
Significant progress was also made in streamlining and simplifying ANZ to ensure the bank is future ready. This included a particularly strong expense management outcome, improved capital efficiency and initiatives to accelerate momentum and deliver future benefits including a restructuring charge and a change to the application of accounting policy to accelerate software amortisation.
| Selected Group Financial Information | ||||||||||||
| Earnings ($m) | 1H15 | 2H15 | 1H16 | |||||||||
| Statutory basis |
||||||||||||
| Profit before credit impairment and tax |
5,637 | 6,075 | 4,786 | |||||||||
| Statutory Profit |
3,506 | 3,987 | 2,738 | |||||||||
| Cash basis |
||||||||||||
| Profit before credit impairment and tax |
5,592 | 5,567 | 4,837 | |||||||||
| Cash Profit |
3,676 | 3,540 | 2,782 | |||||||||
| Earnings Per Share (cents) |
134 | 127 | 96 | |||||||||
| Return on Equity (%) |
14.7 | 13.3 | 9.7 | |||||||||
| Adjusted Pro-forma3 |
||||||||||||
| Profit before credit impairment and tax |
5,468 | 5,459 | 5,737 | |||||||||
| Adjusted Pro-forma Profit |
3,638 | 3,507 | 3,499 | |||||||||
| Operating expenses to income (CTI, %) |
45.5 | 46.4 | 45.0 | |||||||||
| Net Interest Margin (%) |
2.02 | 2.02 | 2.01 | |||||||||
| Earnings Per Share (cents) |
132 | 126 | 121 | |||||||||
| Return on Equity (%) |
14.5 | 13.2 | 12.2 | |||||||||
| Balance sheet ($b) |
1H15 | 2H15 | 1H16 | |||||||||
| Gross Loans and Advances (GLAs) |
562 | 574 | 566 | |||||||||
| Total Risk Weighted Assets |
387 | 402 | 388 | |||||||||
| Customer Deposits |
436 | 445 | 447 | |||||||||
| Leverage Ratio (%) |
NA5 | 5.1 | 5.1 | |||||||||
| Common Equity Tier 1 Ratio (%) |
8.7 | 9.6 | 9.8 | |||||||||
| Common Equity Tier 1 Ratio Internationally Comparable Basel 3 (%) |
12.1 | 13.2 | 14.0 | |||||||||
| Asset Quality |
1H15 | 2H15 | 1H16 | |||||||||
| Total Credit Impairment Charge as a % of avg GLAs (%) |
0.19 | 0.24 | 0.32 | |||||||||
| Collective Provision as a % of Credit RWAs (%) |
0.86 | 0.85 | 0.86 | |||||||||
| Gross impaired assets as a % of GLAs (%) |
0.48 | 0.47 | 0.51 | |||||||||
| Other |
1H15 | 2H15 | 1H16 | |||||||||
| Full time equivalent staff (FTE) |
51,243 | 50,152 | 48,896 | |||||||||
5
| AUSTRALIA AND NEW ZEALAND BANKING GROUP LIMITED | ABN 11 005 357 522 |
ANZ Chief Executive Officer Shayne Elliott said: “This result reflects a challenging period for banking and we have taken the opportunity to move decisively and adapt to the changing environment by building a simpler, better capitalised and more balanced bank.
“We have strong underlying drivers in our Australia and New Zealand consumer and small business franchise and we have seen good early progress in transforming Institutional Banking. This has been supported by prudent capital management and tight control of costs with total expenses, excluding the impact of Specified Items, being lower for the first time in seven halves.
“Banking is however continuing to experience rapid shifts in technology, customer expectations and regulation against a backdrop of low economic growth, volatile financial markets and rising credit costs. Our priority is to take bold action to ensure ANZ is fit and ready for this future.
“This means for the immediate future we are in a period of consolidation, simplification and transition. We have a clear plan and we have made significant progress this half through a focus on four strategic priorities,” Mr Elliott said.
|
Strategic Priorities
|
1H16 Progress Highlights
| |||||||
|
1. |
Create a simpler, better capitalised, better balanced and more agile bank.
Reduce operating costs and risks by removing product and management complexity, exiting low return and non-core businesses and reducing our reliance on low-return aspects of Institutional banking in particular. Further strengthen the balance sheet by rebalancing our portfolio. |
• |
Reduced 1H16 dividend providing foundation for a conservative, sustainable, fully franked pay-out ratio of 60-65% of cash profit4 | |||||
|
• |
Lower absolute operations costs (-2% pcp) and lower FTE (-5% pcp). | |||||||
|
• |
Reduced Risk Weighted Assets by 3% ($14 billion) - primarily low return Institutional Asia lending. | |||||||
|
• |
Sold Esanda dealer finance portfolio and Oasis. | |||||||
|
• |
Taken $138 million restructuring charge to underpin further simplification and productivity. | |||||||
|
• |
Repositioned minority investments in Asia as Group assets, valuation adjustments made. | |||||||
|
• |
Supported Bank of Tianjin listing and subsequent dilution in holding to ~12%. | |||||||
|
• |
Merged Asia Wealth with Asia Retail and commenced a strategic review.
| |||||||
|
2. |
Focus our efforts on attractive areas where we can carve out a winning position.
Make buying and owning a home or starting, running and growing a small business in Australia and New Zealand easy. Be the best bank in the world for customers driven by the movement of goods and capital in our region. |
• |
New organisation structure and Executive Committee aligned with focus areas. | |||||
|
• |
Merged Wealth distribution activities with core Retail to align priority segments. | |||||||
|
• |
Simplified and re-focused Institutional. | |||||||
|
• |
Established new Digital Banking Division to support growth in priority areas. | |||||||
|
• |
Moved to #3 market share in Australian Home Loans.
| |||||||
|
3. |
Drive a purpose and values led transformation of the Bank.
Creating a stronger sense of core purpose, ethics and fairness, investing in leaders who can help sense and navigate a rapidly changing environment. |
• |
Signed up to ABA conduct review. | |||||
|
• |
Launched review of recruitment and remuneration. | |||||||
|
• |
Invested in MIT Digital Leadership Program. | |||||||
|
• |
Uncompromising approach to enforcing ANZ’s Code of Conduct.
| |||||||
|
4. |
Build a superior everyday experience for our people and customers in order to compete in the digital age.
Build more convenient, engaging banking solutions to simplify the lives of customers and our own people. |
• |
Maile Carnegie appointed from Google to lead Digital. | |||||
|
• |
First Australian bank to launch Apple Pay, augmenting existing Android Pay plans. | |||||||
|
• |
New software capitalisation treatment recognises the nature and speed of digital change and supports innovation. | |||||||
|
• |
Implementation of multi-channel digital platform for Australian Retail banking to support improved customer experience.
| |||||||
6
| AUSTRALIA AND NEW ZEALAND BANKING GROUP LIMITED | ABN 11 005 357 522 |
Capital and Dividend. The actions being taken to simplify the business, rebalance our portfolio, divest non-core assets and increase capital efficiency in the Institutional loan book assisted the Group to generate 76 basis points of capital during the half. Further benefits are expected in future periods.
The Interim Dividend is 7% lower than the prior comparable period 1H15, reflecting actions undertaken to reshape ANZ and a normalisation of the credit cycle. The dividend payout ratio during the half of 84% primarily reflects the impact of specified items. On an adjusted pro-forma basis the ratio is 67%.
Consistent with ANZ’s normal practice, it is expected the Final Dividend for FY16 will be at least the same as the Interim Dividend in cents per share terms.
ANZ recognises the stability of the Group’s payout ratio and ability to fully frank dividends are critical considerations for shareholders. Following a period of dividend payout ratio expansion in the Australian banking sector, ANZ will gradually consolidate to its historic range of 60-65% of annual cash profit. This setting better reflects the changed banking environment in which we operate and the greater demands for capital.
Specified Items. During the half the Group sold the Esanda Dealer Finance portfolio and also recognised the impact of a number of items collectively referred to as ‘Specified Items’ which form part of the Group’s cash profit.
These specified items are (on an after tax basis): an accounting change to the application of the Group’s software capitalisation policy ($441 million), impairment of the Group’s investment in AmBank ($260 million), a net gain in relation to Bank of Tianjin ($29 million) and Group restructuring expenses ($101 million), as well as the Esanda dealer finance sale ($56 million). An information pack on these changes is on anz.com within the 1H16 results materials.
ANZ, by lifting the software capitalisation threshold and directly expensing more project related costs, has introduced a greater level of discipline into the management of technology investment. The change, effective from 1 October 2015, of itself does not impact the Group’s total spend on technology but better aligns the application of ANZ’s policy with the rapidly changing technology landscape, increased pace of innovation in financial services and the Group’s own evolving digital strategy. These changes bring forward the recognition of software expense resulting in lower amortisation charges in future years.
A restructuring charge of $138 million (pre-tax) was recognised in the half which will underpin further productivity in the second half and future years, through reducing complexity and aligning the Group to the changing emphasis on Institutional and International businesses.
Credit Quality. The total provision charge of $918 million ($892 million individual provision charge $26 million collective provision charge) is consistent with ANZ’s ASX disclosure of 24 March and equates to a 32 basis point loss rate. The loss rate is trending towards the long term average from historically low levels. Gross impaired assets were $2.9 billion up 6%, with new impaired assets flat compared to the prior half.
While the overall credit environment remains broadly stable, ANZ has continued to see pockets of weakness associated with low commodity prices in the resources sector and in related industries. Increased provision charges in the first half include charges related to a small number of Australian and multi-national resources related exposures.
Video interviews with Shayne Elliott and Acting Chief Financial Officer Graham Hodges regarding today’s 2016 Half Year result announcement are available at www.bluenotes.anz.com.
| For media enquiries contact: | For investor and analyst enquiries contact: | |
| Paul Edwards + 61-434-070101 | Jill Campbell, Tel: +61-412-047448 | |
| Stephen Ries +61-409-655551 | Cameron Davis, Tel: +61-421-613819 |
Footnotes:
| 1. | All comparisons are First Half Financial Year 2016 compared to First Half Financial Year 2015. |
| 2. | Cash profit excludes non-core items included in statutory profit and is provided to assist readers in understanding the results of the ongoing business activities of the Group. The net after tax adjustment was an addition to statutory profit of $44 million comprised of several items. |
| 3. | Pro-forma refers to Cash Profit adjusted to remove the impact of ‘Specified items’ including the impact of software capitalisation policy changes, Asia Partnership impairment charge (AmBank) and gain of cessation of equity accounting (Bank of Tianjin), restructuring expenses, sale of Esanda Dealer Finance portfolio. Further detail provided in the ANZ Half Year 2016 consolidated Financial Report p14. |
| 4. | Previously 65 to 70 per cent of cash profit. |
| 5. | APRA introduced amendments in May 2015 to enable calculation of the leverage ratio. |
7
| AUSTRALIA AND NEW ZEALAND BANKING GROUP LIMITED | ABN 11 005 357 522 |
This page has been left blank intentionally
8
SUMMARY
CONTENTS
Section 2 – Summary
Statutory Profit Results
Cash Profit Results
Key Balance Sheet Metrics
Cash Profit Results - FX Adjusted
Cash Profit Results - Adjusted Pro-forma, FX adjusted
Other Non-financial Information
9
SUMMARY
Statutory Profit Results
| Half Year
|
Movement
| |||||||||||||||
| Mar 16 $M |
Sep 15 $M |
Mar 15 $M |
Mar 16 v. Sep 15 |
Mar 16 v. Mar 15 | ||||||||||||
| Net interest income |
7,568 | 7,478 | 7,138 | 1% | 6% | |||||||||||
| Other operating income
|
2,697
|
|
3,372
|
|
3,102
|
|
-20%
|
|
-13%
| |||||||
| Operating income |
10,265 | 10,850 | 10,240 | -5% | 0% | |||||||||||
| Operating expenses |
(5,479)
|
|
(4,775)
|
|
(4,603)
|
|
15%
|
|
19%
| |||||||
| Profit before credit impairment and income tax |
4,786 | 6,075 | 5,637 | -21% | -15% | |||||||||||
| Credit impairment charge |
(904)
|
|
(685)
|
|
(494)
|
|
32%
|
|
83%
| |||||||
| Profit before income tax |
3,882 | 5,390 | 5,143 | -28% | -25% | |||||||||||
| Income tax expense |
(1,140) | (1,397) | (1,629) | -18% | -30% | |||||||||||
| Non-controlling interests
|
(4)
|
|
(6)
|
|
(8)
|
|
-33%
|
|
-50%
| |||||||
| Profit attributable to shareholders of the Company |
2,738
|
|
3,987
|
|
3,506
|
|
-31%
|
|
-22%
| |||||||
| Earnings per ordinary share (cents) | Half Year
|
Movement
| ||||||||||||||||||
| Reference Page |
Mar 16 | Sep 15 | Mar 15 |
Mar 16 |
Mar 16 | |||||||||||||||
| Basic |
109 | 94.8 | 143.4 | 128.0 | -34% | -26% | ||||||||||||||
| Diluted |
109
|
89.7
|
|
134.9
|
|
124.6
|
|
-34%
|
|
-28%
| ||||||||||
| Half Year
| ||||||||||||
| Reference Page |
Mar 16 | Sep 15 | Mar 15 | |||||||||
| Ordinary share dividends (cents) |
||||||||||||
| Interim - 100% franked1 |
108 | 80 | - | 86 | ||||||||
| Final - 100% franked1
|
|
108
|
|
-
|
95
|
-
| ||||||
| Total - 100% franked1 |
108 | 80 | 95 | 86 | ||||||||
| Ordinary share dividend payout ratio2 |
108 | 85.2% | 69.2% | 67.9% | ||||||||
| Preference share dividend ($M) |
||||||||||||
| Dividend paid3
|
|
108
|
|
-
|
-
|
1
| ||||||
| Profitability ratios |
||||||||||||
| Return on average ordinary shareholders’ equity4 |
9.5% | 15.0% | 14.0% | |||||||||
| Return on average assets |
0.61% | 0.91% | 0.85% | |||||||||
| Net interest margin
|
2.01%
|
2.04%
|
2.04%
| |||||||||
| Efficiency ratios |
||||||||||||
| Operating expenses to operating income |
53.4% | 44.0% | 45.0% | |||||||||
| Operating expenses to average assets
|
1.22%
|
1.09%
|
1.11%
| |||||||||
| Credit impairment charge/(release) |
||||||||||||
| Individual credit impairment charge ($M) |
878 | 645 | 439 | |||||||||
| Collective credit impairment charge/(release) ($M)
|
26
|
40
|
55
| |||||||||
| Total credit impairment charge ($M) |
113 | 904 | 685 | 494 | ||||||||
| Individual credit impairment charge as a % of average gross loans & advances5 |
0.31% | 0.23% | 0.16% | |||||||||
| Total credit impairment charge as a % of average gross loans & advances5
|
0.31%
|
0.24%
|
0.18%
| |||||||||
| 1. | Fully franked for Australian tax purposes and carry New Zealand imputation credits of NZ 10 cents per ordinary share for the proposed 2016 interim dividend (2015 final dividend: NZ 11 cents, 2015 interim dividend: NZ 10 cents). |
| 2. | Dividend payout ratio is calculated using the proposed 2016 interim, 2015 final and 2015 interim dividends. |
| 3. | Represents dividends paid on Euro Trust Securities (preference shares) issued on 13 December 2004. The Euro Trust Securities were bought back by ANZ for cash at face value and cancelled on 15 December 2014. |
| 4. | Average ordinary shareholders’ equity excludes non-controlling interests and preference shares. |
| 5. | Loans & advances as at 30 September 2015 include Esanda Dealer Finance assets divested to Macquarie Group Limited in the March 2016 half. |
10
SUMMARY
Cash Profit Results1
| Half Year | Movement | |||||||||||||
| Mar 16 $M |
Sep 15 $M |
Mar 15 $M |
Mar 16 v. Sep 15 |
Mar 16 v. Mar 15 | ||||||||||
| Net interest income |
7,568 | 7,478 | 7,138 | 1% | 6% | |||||||||
| Other operating income
|
2,748 | 2,864 | 3,057 | -4% | -10% | |||||||||
| Operating income |
10,316 | 10,342 | 10,195 | 0% | 1% | |||||||||
| Operating expenses
|
(5,479)
|
(4,775)
|
(4,603)
|
15%
|
19%
| |||||||||
| Profit before credit impairment and income tax |
4,837 | 5,567 | 5,592 | -13% | -14% | |||||||||
| Credit impairment charge
|
(918)
|
(695)
|
(510)
|
32%
|
80%
| |||||||||
| Profit before income tax |
3,919 | 4,872 | 5,082 | -20% | -23% | |||||||||
| Income tax expense |
(1,133) | (1,326) | (1,398) | -15% | -19% | |||||||||
| Non-controlling interests
|
(4)
|
(6)
|
(8)
|
-33%
|
-50%
| |||||||||
| Cash profit
|
2,782
|
3,540
|
3,676
|
-21%
|
-24%
| |||||||||
| Earnings per ordinary share (cents) | ||||||||||||||
| Half Year | Movement | |||||||||||||
| Reference
Page |
Mar 16 | Sep 15 | Mar 15 |
Mar 16 |
Mar 16 v. Mar 15 | |||||||||
| Basic |
39 | 95.9 | 126.8 | 133.6 | -24% | -28% | ||||||||
| Diluted |
39
|
90.7
|
119.8
|
129.9
|
-24%
|
-30%
| ||||||||
| Half Year | ||||||||
| Reference Page |
Mar 16 | Sep 15 | Mar 15 | |||||
| Ordinary share dividends |
||||||||
| Ordinary share dividend payout ratio2
|
40
|
83.9%
|
77.9%
|
64.7%
| ||||
|
Profitability ratios |
||||||||
| Return on average ordinary shareholders’ equity3 |
9.7% | 13.3% | 14.7% | |||||
| Return on average assets |
0.62% | 0.81% | 0.89% | |||||
| Net interest margin |
24 | 2.01% | 2.04% | 2.04% | ||||
| Profit per average FTE ($)
|
55,889
|
69,214
|
72,421
| |||||
|
Efficiency ratios |
||||||||
| Operating expenses to operating income |
53.1% | 46.2% | 45.1% | |||||
| Operating expenses to average assets
|
1.22%
|
1.09%
|
1.11%
| |||||
|
Credit impairment charge/(release) |
||||||||
| Individual credit impairment charge ($M) |
33 | 892 | 655 | 455 | ||||
| Collective credit impairment charge/(release) ($M)
|
34
|
26
|
40
|
55
| ||||
| Total credit impairment charge ($M) |
33 | 918 | 695 | 510 | ||||
| Individual credit impairment charge as a % of average gross loans & advances4 |
0.31% | 0.23% | 0.17% | |||||
| Total credit impairment charge as a % of average gross loans & advances4
|
0.32%
|
0.24%
|
0.19%
| |||||
| Cash profit/(loss) by division/geography (in AUD) | Half Year | Movement | ||||||||||
| Mar 16 $M |
Sep 15 $M |
Mar 15 |
|
Mar 16 v. Sep 15 |
Mar 16 v. Mar 15 | |||||||
| Australia |
1,753 | 1,706 | 1,650 | 3% | 6% | |||||||
| Institutional |
632 | 893 | 1,071 | -29% | -41% | |||||||
| New Zealand |
578 | 561 | 566 | 3% | 2% | |||||||
| Wealth |
261 | 346 | 263 | -25% | -1% | |||||||
| Asia Retail & Pacific |
53 | 45 | 99 | 18% | -46% | |||||||
| TSO and Group Centre
|
(495)
|
(11)
|
27
|
large
|
large
| |||||||
| Cash profit by division |
2,782
|
3,540
|
3,676
|
-21%
|
-24%
| |||||||
|
|
||||||||||||
| Australia |
1,830 | 2,269 | 2,147 | -19% | -15% | |||||||
| Asia Pacific, Europe & America |
259 | 492 | 743 | -47% | -65% | |||||||
| New Zealand
|
693
|
779
|
786
|
-11%
|
-12%
| |||||||
| Cash profit by geography
|
2,782
|
3,540
|
3,676
|
-21%
|
-24%
| |||||||
| 1. | Cash profit excludes non-core items included in statutory profit and is provided to assist readers in understanding the result of the ongoing business activities of the Group. Refer to page 91 for the reconciliation between statutory and cash profit. |
| 2. | Dividend payout ratio is calculated using the proposed 2016 interim, 2015 final and 2015 interim dividends. |
| 3. | Average ordinary shareholders’ equity excludes non-controlling interests and preference shares. |
| 4. | Loans & advances as at 30 September 2015 include Esanda Dealer Finance assets divested to Macquarie Group Limited in the March 2016 half. |
11
SUMMARY
Key Balance Sheet Metrics
| As at |
Movement | |||||||||||||
| Reference Page |
Mar 16 | Sep 15 | Mar 15 |
Mar
16 |
Mar 16 v. Mar 15 | |||||||||
| Capital adequacy |
||||||||||||||
| Common Equity Tier 1 |
||||||||||||||
| - APRA Basel 3 |
44 | 9.8% | 9.6% | 8.7% | ||||||||||
| - Internationally Comparable Basel 31 |
44 | 14.0% | 13.2% | 12.1% | ||||||||||
| Credit risk weighted assets ($B) |
132 | 334.3 | 349.8 | 339.7 | -4% | -2% | ||||||||
| Total risk weighted assets ($B)
|
132
|
388.3
|
401.9
|
386.9
|
-3%
|
0%
| ||||||||
|
Balance Sheet: Key Items |
||||||||||||||
| Gross loans & advances ($B)2 |
565.9 | 574.3 | 562.2 | -1% | 1% | |||||||||
| Net loans & advances ($B)2 |
561.8 | 570.2 | 558.2 | -1% | 1% | |||||||||
| Total assets ($B) |
895.3 | 889.9 | 860.1 | 1% | 4% | |||||||||
| Customer deposits ($B) |
446.8 | 444.6 | 436.1 | 0% | 2% | |||||||||
| Total equity ($B) |
56.5 | 57.4 | 52.1 | -2% | 8% | |||||||||
| Leverage Ratio
|
46
|
5.1%
|
5.1%
|
n/a
|
0%
|
n/a
| ||||||||
| Half Year Average | Movement | |||||||||||||
| Balance Sheet: Key Items | Mar 16 | Sep 15 | Mar 15 | Mar 16 v. Sep 15 |
Mar 16 v. Mar 15 | |||||||||
| Liquidity Coverage Ratio
|
42
|
126%
|
124%
|
118%
|
2%
|
7%
| ||||||||
| As at | Movement | |||||||||||||
| Reference Page |
Mar 16 | Sep 15 | Mar 15 | Mar 16 v. Sep 15 |
Mar 16 v. Mar 15 | |||||||||
|
Impaired assets |
||||||||||||||
| Gross impaired assets ($M) |
35 | 2,883 | 2,719 | 2,708 | 6% | 6% | ||||||||
| Gross impaired assets as a % of gross loans & advances2 |
0.51% | 0.47% | 0.48% | |||||||||||
| Net impaired assets ($M) |
35 | 1,645 | 1,658 | 1,594 | -1% | 3% | ||||||||
| Net impaired assets as a % of shareholders’ equity |
2.9% | 2.9% | 3.1% | |||||||||||
|
Individual provision ($M) |
113 | 1,238 | 1,061 | 1,114 | 17% | 11% | ||||||||
| Individual provision as a % of gross impaired assets |
42.9% | 39.0% | 41.1% | |||||||||||
| Collective provision ($M) |
113 | 2,862 | 2,956 | 2,914 | -3% | -2% | ||||||||
| Collective provision as a % of credit risk weighted assets
|
0.86%
|
0.85%
|
0.86%
|
|||||||||||
|
Net Assets |
||||||||||||||
| Net tangible assets attributable to ordinary shareholders ($B) |
48.8 | 48.9 | 43.6 | 0% | 12% | |||||||||
| Net tangible assets per ordinary share ($)
|
16.77
|
16.86
|
15.75
|
-1%
|
6%
| |||||||||
| 1. | See page 45 for further details regarding the differences between APRA Basel 3 and Internationally Comparable Basel 3 standards. |
| 2. | Loans & advances as at 30 September 2015 include Esanda Dealer Finance assets divested to Macquarie Group Limited in the March 2016 half. |
| Net loans and advances by division/geography | As at | Movement | ||||||||||
| Mar 16 $B |
Sep 15 $B |
Mar 15 $B |
Mar
16 |
Mar 16 v. Mar 15 | ||||||||
| Australia |
320.0 | 313.7 | 297.6 | 2% | 8% | |||||||
| Institutional |
125.6 | 142.2 | 144.9 | -12% | -13% | |||||||
| New Zealand |
97.2 | 95.2 | 97.7 | 2% | -1% | |||||||
| Wealth |
7.3 | 7.1 | 6.9 | 3% | 6% | |||||||
| Asia Retail & Pacific |
11.9 | 12.5 | 11.6 | -5% | 3% | |||||||
| TSO and Group Centre
|
(0.2)
|
(0.5)
|
(0.5)
|
-60%
|
-60%
| |||||||
| Net loans and advances by division3
|
561.8
|
570.2
|
558.2
|
-1%
|
1%
| |||||||
| Australia |
386.8 | 381.2 | 362.8 | 1% | 7% | |||||||
| Asia Pacific, Europe & America |
69.1 | 85.1 | 88.4 | -19% | -22% | |||||||
| New Zealand
|
105.9
|
103.9
|
107.0
|
2%
|
-1%
| |||||||
| Net loans and advances by geography3
|
561.8
|
570.2
|
558.2
|
-1%
|
1%
| |||||||
| 3. | Loans & advances as at 30 September 2015 include Esanda Dealer Finance assets divested to Macquarie Group Limited in the March 2016 half. |
12
SUMMARY
Cash Profit Results – FX Adjusted
The following tables present the Group’s cash profit results neutralised for the impact of foreign currency translation. Comparative data has been adjusted to remove the translation impact of foreign exchange movements by retranslating prior period comparatives at current period foreign exchange rates. Refer to page 37 for further details on the impact of exchange rate movements.
Cash Profit - March 2016 Half Year vs March 2015 Half Year
| Half Year |
Movement | |||||||||||||||
| Actual | FX unadjusted |
FX impact |
FX adjusted |
FX unadjusted |
FX impact |
FX adjusted | ||||||||||
| Mar 16 $M |
Mar 15 $M |
Mar 15 $M |
Mar 15 $M |
Mar 16 v. Mar 15 |
Mar 16 v. Mar 15 |
Mar 16 v. Mar 15 | ||||||||||
| Net interest income |
7,568 | 7,138 | 77 | 7,215 | 6% | 1% | 5% | |||||||||
| Other operating income
|
2,748
|
3,057
|
149
|
3,206
|
-10%
|
4%
|
-14%
| |||||||||
| Operating income |
10,316 | 10,195 | 226 | 10,421 | 1% | 2% | -1% | |||||||||
| Operating expenses
|
(5,479)
|
(4,603)
|
(115)
|
(4,718)
|
19%
|
3%
|
16%
| |||||||||
| Profit before credit impairment and income tax |
4,837 | 5,592 | 111 | 5,703 | -14% | 1% | -15% | |||||||||
| Credit impairment charge
|
(918)
|
(510)
|
(5)
|
(515)
|
80%
|
2%
|
78%
| |||||||||
| Profit before income tax |
3,919 | 5,082 | 106 | 5,188 | -23% | 1% | -24% | |||||||||
| Income tax expense |
(1,133) | (1,398) | (25) | (1,423) | -19% | 1% | -20% | |||||||||
| Non-controlling interests
|
(4)
|
(8)
|
(2)
|
(10)
|
-50%
|
10%
|
-60%
| |||||||||
| Cash profit
|
2,782
|
3,676
|
79
|
3,755
|
-24%
|
2%
|
-26%
| |||||||||
Cash Profit - March 2016 Half Year vs September 2015 Half Year
| Half Year |
Movement | |||||||||||||||
| Actual | FX unadjusted |
FX impact |
FX adjusted |
FX unadjusted |
FX impact |
FX adjusted | ||||||||||
| Mar 16 $M |
Sep 15 $M |
Sep 15 $M |
Sep 15 $M |
Mar 16 v. Sep 15 |
Mar 16 v. Sep 15 |
Mar 16 v. Sep 15 | ||||||||||
| Net interest income |
7,568 | 7,478 | 32 | 7,510 | 1% | 0% | 1% | |||||||||
| Other operating income
|
2,748
|
2,864
|
103
|
2,967
|
-4%
|
3%
|
-7%
| |||||||||
| Operating income |
10,316 | 10,342 | 135 | 10,477 | 0% | 2% | -2% | |||||||||
| Operating expenses
|
(5,479)
|
(4,775)
|
(37)
|
(4,812)
|
15%
|
1%
|
14%
| |||||||||
| Profit before credit impairment and income tax |
4,837 | 5,567 | 98 | 5,665 | -13% | 2% | -15% | |||||||||
| Credit impairment charge
|
(918)
|
(695)
|
(8)
|
(703)
|
32%
|
1%
|
31%
| |||||||||
| Profit before income tax |
3,919 | 4,872 | 90 | 4,962 | -20% | 1% | -21% | |||||||||
| Income tax expense |
(1,133) | (1,326) | (28) | (1,354) | -15% | 1% | -16% | |||||||||
| Non-controlling interests
|
(4)
|
(6)
|
1
|
(5)
|
-33%
|
-13%
|
-20%
| |||||||||
| Cash profit |
2,782
|
3,540
|
63
|
3,603
|
-21%
|
2%
|
-23%
| |||||||||
13
SUMMARY
Cash Profit Results – Adjusted Pro-forma, FX adjusted
During the March 2016 half, the Group sold the Esanda Dealer Finance portfolio and recognised the impact of a number of items collectively referred to as ‘specified items’ which form part of the Group’s cash profit. The tables on the following pages present the Group’s FX adjusted cash profit adjusted for these items to assist readers to understand the estimated growth rates of the ongoing business performance of the Group. The “Cash Profit Results - Adjusted Pro-forma, FX adjusted” are not subject to review or audit by the external auditor.
| ¡ | Esanda Dealer Finance divestment |
On 1 November 2015, the Group sold the Esanda Dealer Finance portfolio with the majority of the business transferred by 31 December 2015. Pro-forma results have been prepared on the assumption that the sale which occurred during the March 2016 half took effect from 1 October 2014, effectively restating the Group’s cash profit for each of the March 2015, September 2015 and March 2016 halves.
| ¡ | Software capitalisation changes |
During the March 2016 half, the Board resolved to amend the application of the Group’s software capitalisation policy by increasing the threshold for capitalisation of software development costs to $20 million, reflecting the increasingly shorter useful life of smaller items of software, and directly expensing more project related costs.
For software assets at 1 October 2015 with an original cost below the revised threshold, the carrying values were expensed through an accelerated amortisation charge of $556 million (recognised in TSO & Group Centre). Of this, $88 million would otherwise have been amortised in the March 2016 half (i.e. the half year amortisation charge increased by $468 million).
In addition, application of the software capitalisation changes also increased other operating expenses by $161 million for the March 2016 half relating to software development costs that would otherwise have been capitalised and amortised in future periods.
Going forward, these changes will result in higher project expenditure being expensed in the profit and loss which will be offset by lower amortisation charges.
| March 2016 Half Year | ||||||||
| Accelerated amortisation $M |
Amortisation $M |
Application of policy to new project expenditure $M |
Total impact $M | |||||
| Operating expense increase/(decrease) by division |
||||||||
| Australia |
- | (13) | 49 | 36 | ||||
| Institutional |
- | (26) | 30 | 4 | ||||
| New Zealand |
- | (7) | 17 | 10 | ||||
| Wealth |
- | (14) | 19 | 5 | ||||
| Asia Retail & Pacific |
- | (4) | - | (4) | ||||
| TSO and Group Centre
|
556
|
(24)
|
46
|
578
| ||||
| Total
|
556
|
(88)
|
161
|
629
| ||||
| ¡ | Asian minority investment adjustments |
During the March 2016 half, the Group recognised a $260 million impairment to its equity accounted investment in AMMB Holdings Berhad (Ambank) bringing the carrying value in line with value-in-use calculations (refer Note 1 (v) of the Condensed Consolidated Financial Statements).
On 30 March 2016, Bank of Tianjin (BoT), an equity accounted investment, completed a capital raising and listing on the Hong Kong Stock Exchange through an Initial Public Offering (IPO). As the Group did not participate in the capital raising, its ownership interest decreased from 14% to 12%. As a consequence, the Group ceased equity accounting the investment in BoT and commenced accounting for the investment as for as an available-for-sale asset. A net gain of $29 million was recognised in relation to the remeasurement of the investment to fair value and recycling the associated equity accounted reserves.
| ¡ | Restructuring |
The Group is in the process of evolving its strategy, including reshaping of the workforce to reduce complexity and duplication, and to align with its changing emphasis on Institutional and Wealth businesses, restructure of Retail Asia and Pacific and delayering and simplification in TSO and Group Centre. A restructuring expense of $138 million was recognised in the March 2016 half.
| Half Year
| ||||||
| Restructuring expense by division | Mar 16 $M | Sep 15 $M | Mar 15 $M | |||
| Australia |
22 | 2 | - | |||
| Institutional |
51 | 6 | 2 | |||
| New Zealand |
2 | 1 | 2 | |||
| Wealth |
13 | - | 1 | |||
| Asia Retail & Pacific |
12 | - | - | |||
| TSO and Group Centre
|
38
|
12
|
5
| |||
|
Total
|
138
|
21
|
10
| |||
14
SUMMARY
Cash Profit Results - Adjusted Pro-forma, FX adjusted
| March 2016 Half Year |
March 2015 Half Year |
Mar 16 v. Mar 15 | ||||||||||||||||||||||||||||
| Cash profit | Software capitalisation changes |
Asian minority investment adjust |
Restructuring | Esanda Dealer Finance |
Adjusted pro-forma |
Cash profit | Restructuring | Esanda Dealer Finance |
FX impact | Adjusted pro-forma, FX adj |
Adjusted pro- forma, FX unadj |
Adjusted pro-forma, FX adj | ||||||||||||||||||
|
Cash Profit - March 2016 v March 2015 |
||||||||||||||||||||||||||||||
| Net interest income |
7,568 | - | - | - | (31) | 7,537 | 7,138 | - | (130) | 77 | 7,085 | 8% | 6% | |||||||||||||||||
| Other operating income
|
2,748
|
-
|
231
|
-
|
(78)
|
2,901
|
3,057
|
-
|
(25)
|
149
|
3,181
|
-4%
|
-9%
| |||||||||||||||||
|
Operating income |
10,316 | - | 231 | - | (109) | 10,438 | 10,195 | - | (155) | 226 | 10,266 | 4% | 2% | |||||||||||||||||
| Operating expenses
|
(5,479)
|
629
|
-
|
138
|
11
|
(4,701)
|
(4,603)
|
10
|
21
|
(115)
|
(4,687)
|
3%
|
0%
| |||||||||||||||||
|
Profit before credit impairment and income tax |
4,837 | 629 | 231 | 138 | (98) | 5,737 | 5,592 | 10 | (134) | 111 | 5,579 | 5% | 3% | |||||||||||||||||
| Credit impairment charge
|
(918)
|
-
|
-
|
-
|
13
|
(905)
|
(510)
|
-
|
69
|
(5)
|
(446)
|
large
|
large
| |||||||||||||||||
|
Profit before income tax |
3,919 | 629 | 231 | 138 | (85) | 4,832 | 5,082 | 10 | (65) | 106 | 5,133 | -4% | -6% | |||||||||||||||||
| Income tax expense |
(1,133) | (188) | - | (37) | 29 | (1,329) | (1,398) | (3) | 20 | (25) | (1,406) | -4% | -5% | |||||||||||||||||
| Non-controlling interests
|
(4)
|
-
|
-
|
-
|
-
|
(4)
|
(8)
|
-
|
-
|
(2)
|
(10)
|
-50%
|
-60%
| |||||||||||||||||
| Cash profit
|
2,782
|
441
|
231
|
101
|
(56)
|
3,499
|
3,676
|
7
|
(45)
|
79
|
3,717
|
-4%
|
-6%
| |||||||||||||||||
|
March 2016 Half Year |
March 2015 Half Year |
Mar 16 v. Mar 15 | ||||||||||||||||||||||||||||
| Cash profit | Software capitalisation changes |
Asian minority |
Restructuring | Esanda Dealer Finance |
Adjusted pro-forma |
Cash profit | Restructuring | Esanda Dealer Finance |
FX impact | Adjusted pro-forma, FX adj |
Adjusted pro- forma, FX unadj |
Adjusted pro-forma, FX adj | ||||||||||||||||||
|
Profit before income tax by division - March 2016 v March 2015 |
||||||||||||||||||||||||||||||
| Australia |
2,505 | 36 | - | 22 | (19) | 2,544 | 2,359 | - | (65) | - | 2,294 | 11% | 11% | |||||||||||||||||
| Institutional |
880 | 4 | - | 51 | - | 935 | 1,497 | 2 | - | 50 | 1,549 | -38% | -40% | |||||||||||||||||
| New Zealand |
804 | 10 | - | 2 | - | 816 | 787 | 2 | - | (10) | 779 | 3% | 5% | |||||||||||||||||
| Wealth |
359 | 5 | - | 13 | - | 377 | 368 | 1 | - | (1) | 368 | 2% | 2% | |||||||||||||||||
| Asia Retail & Pacific |
67 | (4) | - | 12 | - | 75 | 128 | - | - | 8 | 136 | -41% | -45% | |||||||||||||||||
| TSO and Group Centre1
|
(696)
|
578
|
231
|
38
|
(66)
|
85
|
(57)
|
5
|
-
|
59
|
7
|
large
|
large
| |||||||||||||||||
|
Profit before income tax |
3,919 | 629 | 231 | 138 | (85) | 4,832 | 5,082 | 10 | (65) | 106 | 5,133 | -4% | -6% | |||||||||||||||||
| Income tax expense & non-controlling interests
|
(1,137)
|
(188)
|
-
|
(37)
|
29
|
(1,333)
|
(1,406)
|
(3)
|
20
|
(27)
|
(1,416)
|
-4%
|
-6%
| |||||||||||||||||
| Cash profit
|
2,782
|
441
|
231
|
101
|
(56)
|
3,499
|
3,676
|
7
|
(45)
|
79
|
3,717
|
-4%
|
-6%
| |||||||||||||||||
| 1. | Cash profit for TSO and Group Centre in the March 2016 half includes the accelerated amortisation for all divisions resulting from the software capitalisation changes and the net gain on divestment of the Esanda Dealer Finance portfolio. |
15
SUMMARY
Cash Profit Results - Adjusted Pro-forma, FX adjusted
| March 2016 Half Year | September 2015 Half Year |
Mar 16 v. Sep 15 | ||||||||||||||||||||||||||||
| Cash profit | Software capitalisation changes |
Asian minority investment adjust |
Restructuring | Esanda Dealer Finance |
Adjusted pro-forma |
Cash profit | Restructuring | Esanda Dealer Finance |
FX impact | Adjusted pro-forma, FX adj |
Adjusted pro-forma, FX unadj |
Adjusted pro-forma, FX adj | ||||||||||||||||||
| Cash Profit - March 2016 v September 2015 | ||||||||||||||||||||||||||||||
| Net interest income |
7,568 | - | - | - | (31) | 7,537 | 7,478 | - | (125) | 32 | 7,385 | 3% | 2% | |||||||||||||||||
| Other operating income
|
2,748
|
-
|
231
|
-
|
(78)
|
2,901
|
2,864
|
-
|
(26)
|
103
|
2,941
|
2%
|
-1%
| |||||||||||||||||
|
Operating income |
10,316 | - | 231 | - | (109) | 10,438 | 10,342 | - | (151) | 135 | 10,326 | 2% | 1% | |||||||||||||||||
| Operating expenses
|
(5,479)
|
629
|
-
|
138
|
11
|
(4,701)
|
(4,775)
|
21
|
22
|
(37)
|
(4,769)
|
-1%
|
-1%
| |||||||||||||||||
|
Profit before credit impairment and income tax |
4,837 | 629 | 231 | 138 | (98) | 5,737 | 5,567 | 21 | (129) | 98 | 5,557 | 5% | 3% | |||||||||||||||||
| Credit impairment charge
|
(918)
|
-
|
-
|
-
|
13
|
(905)
|
(695)
|
-
|
61
|
(8)
|
(642)
|
43%
|
41%
| |||||||||||||||||
|
Profit before income tax |
3,919 | 629 | 231 | 138 | (85) | 4,832 | 4,872 | 21 | (68) | 90 | 4,915 | 0% | -2% | |||||||||||||||||
| Income tax expense |
(1,133) | (188) | - | (37) | 29 | (1,329) | (1,326) | (6) | 20 | (28) | (1,340) | 1% | -1% | |||||||||||||||||
| Non-controlling interests
|
(4)
|
-
|
-
|
-
|
-
|
(4)
|
(6)
|
-
|
-
|
1
|
(5)
|
-33%
|
-20%
| |||||||||||||||||
| Cash profit
|
2,782
|
441
|
231
|
101
|
(56)
|
3,499
|
3,540
|
15
|
(48)
|
63
|
3,570
|
0%
|
-2%
| |||||||||||||||||
|
March 2016 Half Year |
September 2015 Half Year |
Mar 16 v. Sep 15 | ||||||||||||||||||||||||||||
| Cash profit | Software capitalisation changes |
Asian minority investment adjust |
Restructuring | Esanda Dealer Finance |
Adjusted pro-forma |
Cash profit | Restructuring | Esanda Dealer Finance |
FX impact | Adjusted pro-forma, FX adj |
Adjusted pro-forma, FX unadj |
Adjusted pro-forma, FX adj | ||||||||||||||||||
| Profit before income tax by division - Mar 2016 v Sep 2015 | ||||||||||||||||||||||||||||||
| Australia |
2,505 | 36 | - | 22 | (19) | 2,544 | 2,427 | 2 | (68) | - | 2,361 | 8% | 8% | |||||||||||||||||
| Institutional |
880 | 4 | - | 51 | - | 935 | 1,256 | 6 | - | 1 | 1,263 | -26% | -26% | |||||||||||||||||
| New Zealand |
804 | 10 | - | 2 | - | 816 | 779 | 1 | - | 4 | 784 | 5% | 4% | |||||||||||||||||
| Wealth |
359 | 5 | - | 13 | - | 377 | 399 | - | - | - | 399 | -6% | -6% | |||||||||||||||||
| Asia Retail & Pacific |
67 | (4) | - | 12 | - | 75 | 68 | - | - | (1) | 67 | 10% | 12% | |||||||||||||||||
| TSO and Group Centre1
|
(696)
|
578
|
231
|
38
|
(66)
|
85
|
(57)
|
12
|
-
|
86
|
41
|
large
|
large
| |||||||||||||||||
|
Profit before income tax |
3,919 | 629 | 231 | 138 | (85) | 4,832 | 4,872 | 21 | (68) | 90 | 4,915 | 0% | -2% | |||||||||||||||||
| Income tax expense & non-controlling interests
|
(1,137)
|
(188)
|
-
|
(37)
|
29
|
(1,333)
|
(1,332)
|
(6)
|
20
|
(27)
|
(1,345)
|
1%
|
-1%
| |||||||||||||||||
| Cash profit
|
2,782
|
441
|
231
|
101
|
(56)
|
3,499
|
3,540
|
15
|
(48)
|
63
|
3,570
|
0%
|
-2%
| |||||||||||||||||
| 1. | Cash profit for TSO and Group Centre in the March 2016 half includes the accelerated amortisation for all divisions resulting from the software capitalisation changes and the net gain on divestment of the Esanda Dealer Finance portfolio. |
16
SUMMARY
Other Non-financial Information
| As at
|
Movement
| |||||||||||||||
| Mar 16 | Sep 15 | Mar 15 | Mar 16 v. Sep 15 |
Mar 16 v. Mar 15 | ||||||||||||
|
Full time equivalent staff information |
||||||||||||||||
| Full time equivalent staff (FTE) |
48,896 | 50,152 | 51,243 | -3% | -5% | |||||||||||
| Assets per FTE ($M)
|
18.3
|
|
17.7
|
|
16.8
|
|
3%
|
|
9%
| |||||||
| Half Year |
Movement | |||||||||||||||
| Mar 16 | Sep 15 | Mar 15 | Mar 16 v. Sep 15 |
Mar 16 v. Mar 15 | ||||||||||||
|
Shareholder value - ordinary shares |
||||||||||||||||
| Share price ($) |
||||||||||||||||
| - high |
29.17 | 37.25 | 37.19 | -22% | -22% | |||||||||||
| - low |
21.86 | 26.38 | 30.47 | -17% | -28% | |||||||||||
| - closing |
23.46 | 27.08 | 36.64 | -13% | -36% | |||||||||||
| Closing market capitalisation of ordinary shares ($B) |
68.4 | 78.6 | 101.3 | -13% | -32% | |||||||||||
| Total shareholder returns (TSR)
|
-10.2%
|
|
-21.9%
|
|
19.9%
|
|
-53%
|
|
large
| |||||||
| As at Mar 16
| ||||||||||||||||
| Credit Ratings | Short-Term | Long-Term | Outlook | |||||||||||||
| Moody’s Investor Services |
P-1 | Aa2 | Stable | |||||||||||||
| Standard & Poor’s |
A-1+ | AA- | Stable | |||||||||||||
| Fitch Ratings
|
F1+
|
|
AA-
|
|
Stable
| |||||||||||
17
SUMMARY
This page has been left blank intentionally
18
STRATEGIC REVIEW
Strategic Review1
Our strategy is to use the strength of our Australian and New Zealand foundations, regional connectivity and a focus on providing market-leading service and insights, to better meet the needs of our customers and capture opportunities linked to trade and capital flows.
The strategy has three key elements – creating the best bank in Australia and New Zealand for home owners and small businesses, building the best bank in the world for clients driven by trade and capital flows between Australia and New Zealand and Asia, and establishing common, digital-ready infrastructure to provide great customer experience, agility, scale and control. The strategy is underpinned by disciplined resource allocation, strong leaders and an engaged workforce. ANZ is committed to maintaining high standards of ethics and conduct in the way it deals with customers, stakeholders and its own staff.
ANZ’s approach to sustainability supports the achievement of our business strategy by guiding the way we make decisions and conduct business in all of the markets in which we operate. Our decision making processes take into account the social and environmental impacts of ANZ’s operations and prioritise building trust and respect amongst all of our stakeholders. Details of ANZ’s approach to sustainability, including the identification and management of material issues and sustainability risks and opportunities, are available in the Corporate Sustainability review. The 2015 review was published on anz.com in December 2015, and an update on our progress in 2016 will be released on 3 May 2016.
In the first half of financial year 2016 cash profit decreased by 24%. A number of items impacted the result this half, excluding these, Cash Profit - Adjusted Pro-forma, FX adjusted2 decreased 6% to $3.5 billion, with income growth of 2% and flat expenses being offset by a $459 million increase in the credit impairment charge. The increase in the credit impairment charge was mainly due to an increase in the individual provision charge resulting from a small number of Australian and multi-national resources related exposures. The collective impairment charge remained low in absolute terms at $29 million. Loss rates increased from historic lows and are in line with the long term average.
The Common Equity Tier 1 (CET1) ratio on an APRA basis was 9.8% at 31 March, up 22 basis points (bps), which equates to 14.0% on an Internationally Comparable Basel 3 basis, placing ANZ within the top quartile of international peer banks. We declared a fully franked dividend of 80 cents per share, 7% lower than the March 2015 interim dividend. The resetting of the dividend better reflects the changing banking environment in which we operate and the greater demands for capital.
Strategic Progress
Over the course of the half, ANZ delivered strong growth in retail banking in Australia and steady growth across most portfolios in New Zealand, while the Institutional business was once again impacted by challenging market conditions.
| • | Retail banking in Australia and New Zealand continued to deliver market share gains and strong earnings growth, with income up 15% and 5% (NZD) respectively and costs were well contained resulting in lower cost to income ratios (CTI). Provisions were up slightly in both markets. In Australia, we continued to invest in NSW and our digital capabilities, with our Multi-Channel Platform program going live during the half. |
| • | With the exception of Small Business, conditions were more challenging for our Corporate & Commercial Banking segments in both key geographies, with revenues falling 5% in Australia and 2% in New Zealand due to ongoing margin compression and the Esanda Dealer Finance divestment in Australia. Costs were well contained in response, but increasing provisions saw cash profits fall in both markets. |
| • | We are the leading Institutional bank in Australia and New Zealand (Source: Peter Lee) and the number four Corporate bank in Asia (Source: Greenwich Associates). However, challenging economic conditions saw lending margins fall a further 4 bps driven by margin compression in Loans and Specialised Finance. Trade Finance revenues were down as a consequence of active risk weighted asset (RWA) management. Credit impairment charges increased by $235 million, impacted by small number of Australian and multi-national resources related exposures. In response, we have accelerated the restructure of the division, simplifying the business and prioritising the use of our balance sheet. FTE reduced 6%, while RWAs reduced by $14 billion through targeted reduction of assets that were dilutive to returns. We anticipate this trend to continue into the second half. |
| • | Our in-house regional delivery network is a source of ongoing competitive advantage. The network is enabling the transformation of key business activities and delivery of productivity improvements while driving a more consistent, higher quality experience for our customers. The regional delivery centres provide full service regional coverage across our operating time zones helping to drive lower unit costs, improve quality and lower risk. |
| • | Since the September 2015 half, ANZ’s generated $3.1 billion of net organic capital and paid out $3 billion (net of reinvestment) in dividends. The Group CET1 ratio increased by 22 bps to 9.8% or 14% on an internationally comparable basis at 31 March, which is within the top-quartile of Basel Group 1 Banks. We expect our APRA CET1 ratio to remain around 9% post implementing the mortgage RWA change in July 2016. |
| 1. | Unless otherwise noted, the Strategic Review is reported on a cash profit basis. All comparisons are to the half year ended 31 March 2015 and not adjusted for the impact of foreign currency translation. |
| 2. | Adjusted Pro-forma, FX adjusted includes the following specified items: software capitalisation changes, impairment of investment in Ambank, gain on cessation of equity accounting for BoT, restructuring costs, and the Esanda Dealership Finance divestment. Comparative data is adjusted to remove the translation impacts of foreign exchange movements. |
19
STRATEGIC REVIEW
This page has been left blank intentionally
20
GROUP RESULTS
CONTENTS
Section 4 – Group Results
Group performance
Net interest income
Other operating income
Operating expenses
Technology infrastructure spend
Software capitalisation
Credit risk
Income tax expense
Impact of foreign currency translation
Earnings related hedges
Earnings per share
Dividends
Economic profit
Condensed balance sheet
Liquidity risk
Capital management
Leverage ratio
Other regulatory developments
21
GROUP RESULTS
Non-IFRS information
The Group provides additional measures of performance in the Consolidated Financial Report & Dividend Announcement which are prepared on a basis other than in accordance with accounting standards. The guidance provided in Australian Securities and Investments Commission (ASIC) Regulatory Guide RG230 has been followed when presenting this information.
Cash profit
Cash profit represents ANZ’s preferred measure of the result of the ongoing business activities of the Group, enabling readers to assess Group and Divisional performance against prior periods and against peer institutions. To calculate cash profit, the Group excludes non-core items from statutory profit (refer to Definitions for further details). The adjustments made in arriving at cash profit are included in statutory profit which is subject to review within the context of the external auditor’s review of the Condensed Consolidated Financial Statements. Cash profit is not subject to review or audit by the external auditor, however, the external auditor has informed the Audit Committee that the adjustments have been determined on a consistent basis across each period presented.
The Group Results section is reported on a cash profit basis.
| Half Year
|
Movement
| |||||||||||
| Mar 16 $M |
Sep 15 $M |
Mar 15 $M |
Mar 16 v. Sep 15 |
Mar 16 v. Mar 15 | ||||||||
| Statutory profit attributable to shareholders of the Company |
2,738 | 3,987 | 3,506 | -31% | -22% | |||||||
| Adjustments between statutory profit and cash profit1 |
||||||||||||
| Treasury shares adjustments |
(29) | (95) | 79 | -69% | large | |||||||
| Revaluation of policy liabilities |
(14) | (6) | (67) | large | -79% | |||||||
| Economic hedges |
128 | (165) | (14) | large | large | |||||||
| Revenue and net investment hedges |
(39) | (179) | 176 | -78% | large | |||||||
| Structured credit intermediation trades
|
(2) | (2) | (4) | 0% | -50% | |||||||
| Total adjustments between statutory profit and cash profit1
|
44 | (447) | 170 | large | -74% | |||||||
|
Cash Profit
|
2,782 | 3,540 | 3,676 | -21% | -24% | |||||||
| 1. | Refer to pages 91 to 96 for analysis of the adjustments between statutory profit and cash profit. |
| Group Performance | Half Year
|
Movement
| ||||||||||
| Mar 16 $M |
Sep 15 $M |
Mar 15 $M |
Mar 16 v. Sep 15 |
Mar 16 v. Mar 15 | ||||||||
| Net interest income |
7,568 | 7,478 | 7,138 | 1% | 6% | |||||||
| Other operating income
|
2,748 | 2,864 | 3,057 | -4% | -10% | |||||||
|
Operating income |
10,316 | 10,342 | 10,195 | 0% | 1% | |||||||
| Operating expenses
|
(5,479) | (4,775) | (4,603) | 15% | 19% | |||||||
|
Profit before credit impairment and income tax |
4,837 | 5,567 | 5,592 | -13% | -14% | |||||||
| Credit impairment charge
|
(918) | (695) | (510) | 32% | 80% | |||||||
|
Profit before income tax |
3,919 | 4,872 | 5,082 | -20% | -23% | |||||||
| Income tax expense |
(1,133) | (1,326) | (1,398) | -15% | -19% | |||||||
| Non-controlling interests
|
(4) | (6) | (8) | -33% | -50% | |||||||
|
Cash profit
|
2,782 | 3,540 | 3,676 | -21% | -24% | |||||||
| Half Year
|
Movement
| |||||||||||
| Cash profit/(loss) by division | Mar 16 $M |
Sep 15 $M |
Mar 15 $M |
Mar 16 v. Sep 15 |
Mar 16 v. Mar 15 | |||||||
|
Australia |
1,753 | 1,706 | 1,650 | 3% | 6% | |||||||
| Institutional |
632 | 893 | 1,071 | -29% | -41% | |||||||
| New Zealand |
578 | 561 | 566 | 3% | 2% | |||||||
| Wealth |
261 | 346 | 263 | -25% | -1% | |||||||
| Asia Retail & Pacific |
53 | 45 | 99 | 18% | -46% | |||||||
| TSO and Group Centre
|
(495) | (11) | 27 | large | large | |||||||
|
Cash profit
|
2,782 | 3,540 | 3,676 | -21% | -24% | |||||||
22
GROUP RESULTS
Group Cash Profit – March 2016 Half Year v March 2015 Half Year
| ¡ | March 2016 v March 2015 |
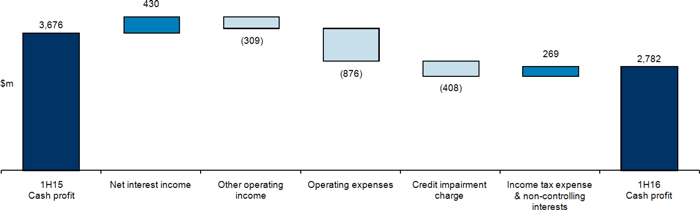
Cash profit decreased 24% compared to the March 2015 half mainly due to a number of specified items: software capitalisation changes, Asian minority investment adjustments, restructuring expenses, and the Esanda Dealer Finance divestment. Excluding these items, and the impact of foreign currency translation, cash profit decreased 6%.
| • | Net interest income increased $430 million (6%) with 7% growth in average interest earning assets, partly offset by a 3 basis point decrease in net interest margin. $77 million of the increase in net interest income was due to foreign currency translation impact. The $52.2 billion increase in average interest earning assets reflected a $17.0 billion foreign currency translation impact and lending growth of $20.5 billion, primarily in Australia and New Zealand home loans. |
| • | Other operating income decreased $309 million (10%) with foreign currency translation having a $149 million favourable impact. Adjusting for this, other operating income decreased by $458 million. The decrease was mainly due to a $331 million reduction in Markets other operating income and a $260 million impairment of the investment in Ambank, partially offset by $82 million increase in net foreign exchange earnings, the $66 million gain on Esanda Dealer Finance divestment, and $29 million gain on cessation of equity accounting for BoT. |
| • | Operating expenses increased $876 million (19%) mainly due to $629 million increase relating to the software capitalisation changes, $128 million increase in restructuring charges and a $115 million foreign currency translation impact. Adjusting for these items, operating expenses were flat. |
| • | Credit impairment charges increased $408 million (80%) due to a $437 million (96%) increase in the individual credit impairment charge, mainly from a small number of Australian and multinational resource related exposures, increases in Small Business Banking and Regional Business Banking together with lower recoveries, partially offset by a $29 million decrease in the collective impairment charge. |
| ¡ | March 2016 v September 2015 |
Cash profit decreased 21% compared to the September 2015 half year mainly due to the specified items outlined above. Excluding these items, and the impact of foreign currency translation, cash profit decreased 2%.
| • | Net interest income increased $90 million (1%) with 3% growth in average interest earning assets, partly offset by a 3 basis point contraction in net interest margin. $32 million of the increase in net interest income was due to foreign currency translation impact. The $22.7 billion increase in average interest earning assets reflected a $5.7 billion foreign currency translation impact and lending growth of $4.6 billion, primarily in Australia and New Zealand home loans. |
| • | Other operating income decreased by $116 million (4%) with foreign currency translation having a $103 million favourable impact. Adjusting for this, other operating income decreased by $219 million (7%). The decrease was mainly due to the $260 million impairment of the investment in Ambank, partially offset by a $75 million increase in net foreign exchange earnings, $66 million gain on Esanda Dealer Finance divestment and $29 million gain on cessation of equity accounting for BoT. |
| • | Operating expenses increased $704 million (15%) mainly due to the $629 million increase relating to the software capitalisation changes, $117 million increase in restructuring charges and $37 million increase due to foreign currency translation impact. Adjusting for these items, operating expenses decreased by $79 million (1%) reflecting the 3% decrease in FTE. |
| • | Credit impairment charges increased $223 million (32%) due to a $237 million (36%) increase in individual credit impairment charges mainly from a small number of Australian and multinational resource related exposures, partially offset by a $14 million decrease in the collective credit impairment charge. |
23
GROUP RESULTS
Net interest income
| Half Year
|
Movement
| |||||||||||
| Group | Mar 16 $M |
Sep 15 $M |
Mar 15 $M |
Mar 16 v. Sep 15 |
Mar 16 v. Mar 15 | |||||||
| Cash net interest income |
7,568 | 7,478 | 7,138 | 1% | 6% | |||||||
| Average interest earning assets |
754,391 | 731,739 | 702,203 | 3% | 7% | |||||||
| Average deposits and other borrowings |
587,235 | 567,709 | 551,805 | 3% | 6% | |||||||
| Net interest margin (%) - cash
|
2.01 | 2.04 | 2.04 | -3 bps | -3 bps | |||||||
| Group (excluding Markets) |
||||||||||||
| Cash net interest income |
7,006 | 6,878 | 6,631 | 2% | 6% | |||||||
| Average interest earning assets |
556,107 | 546,007 | 529,707 | 2% | 5% | |||||||
| Average deposits and other borrowings |
453,137 | 436,702 | 420,878 | 4% | 8% | |||||||
| Net interest margin (%) - cash |
2.52 | 2.51 | 2.51 | 1 bps | 1 bps | |||||||
| Half Year
|
Movement
| |||||||||||
| Cash net interest margin by major division | Mar 16 $M |
Sep 15 $M |
Mar 15 $M |
Mar 16 v. Sep 15 |
Mar 16 v. Mar 15 | |||||||
| Australia |
||||||||||||
| Net interest margin (%) |
2.54 | 2.53 | 2.54 | 1 bps | 0 bps | |||||||
| Average interest earning assets |
317,540 | 306,816 | 294,368 | 3% | 8% | |||||||
| Average deposits and other borrowings |
172,779 | 164,732 | 162,688 | 5% | 6% | |||||||
| Institutional |
||||||||||||
| Net interest margin (%) |
1.15 | 1.20 | 1.19 | -5 bps | -4 bps | |||||||
| Average interest earning assets |
312,961 | 305,902 | 292,914 | 2% | 7% | |||||||
| Average deposits and other borrowings |
233,729 | 231,655 | 227,460 | 1% | 3% | |||||||
| New Zealand |
||||||||||||
| Net interest margin (%) |
2.37 | 2.44 | 2.52 | -7 bps | -15 bps | |||||||
| Average interest earning assets |
98,741 | 94,624 | 92,395 | 4% | 7% | |||||||
| Average deposits and other borrowings
|
67,540 | 63,996 | 62,314 | 6% | 8% | |||||||
Group net interest margin – March 2016 Half Year v March 2015 Half Year
| ¡ | March 2016 v March 2015 |
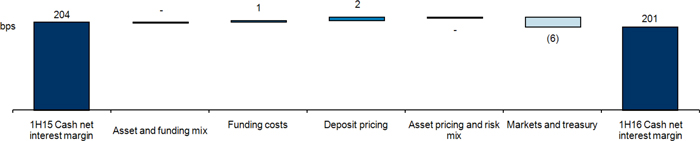
Net interest margin (-3 bps)
| • | Asset mix and funding mix (0 bp): favourable mix impact from a higher proportion of capital and run-off of lower margin trade loans offset by the adverse asset mix impact from the Esanda Dealer Finance divestment. |
| • | Funding costs (1 bp): favourable wholesale funding costs. |
| • | Deposit competition (2 bps): benefit from deposit repricing, particularly term deposits. |
| • | Asset competition and risk mix (0 bp): improved Australian Home Loan margins following repricing offset by lending margin compression in New Zealand and lower spreads within Institutional and Commercial lending. |
| • | Markets and treasury (-6 bps): adverse impact of lower earnings on capital from lower interest rates and growth in lower margin liquidity portfolios in Markets. |
24
GROUP RESULTS
Average interest earning assets (+$52.2 billion or +7%)
| • | Average gross loans and advances (+$29.0 billion or +5%): excluding the impact of foreign currency translation, growth was $20.5 billion or +4% driven by growth in Australia and New Zealand home loans as well as growth in New Zealand Commercial lending. This was slightly offset by a decline in Trade loans due to active portfolio reduction and strategic repositioning of that business, as well as the Esanda Dealer Finance divestment. |
| • | Average trading and available-for-sale assets (+$10.9 billion or +12%): excluding the impact of foreign currency translation, growth was $8.4 billion or +9% driven by growth in the liquidity portfolio. |
| • | Average cash (+$5.6 billion or +12%): excluding the impact of foreign currency translation, growth was $2.0 billion or +4% driven by management of liquidity requirements. |
| • | Average collateral paid (+$3.2 billion or +42%): excluding the impact of foreign currency translation, growth was $2.6 billion or +33%. |
Average deposits and other borrowings (+$35.4 billion or +6%)
| • | Average deposits and other borrowings (+$35.4 billion or +6%): excluding the impact of foreign currency translation, growth was $17.7 billion or +3% driven by growth in Retail and Commercial customer deposits across both Australia and New Zealand. |
Group net interest margin – March 2016 Half Year v September 2015 Half Year
| ¡ | March 2016 v September 2015 |
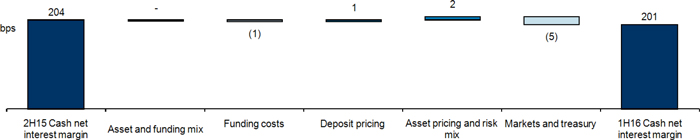
Net interest margin (-3 bps)
| • | Asset mix and funding mix (0 bp): favourable mix impact from higher proportion of capital and run-off of lower margin trade loans offset by the adverse asset mix impact from the Esanda Dealer Finance divestment. |
| • | Funding costs (-1 bps): adverse impact of increased wholesale funding costs. |
| • | Deposit competition (1 bp): benefit from deposit repricing, particularly in Australia and Asia. |
| • | Asset competition and risk mix (2 bps): improved margins, particularly in Home Loans following repricing, partly offset by lower Commercial and Institutional lending spreads. |
| • | Markets and treasury (-5 bps): adverse impact of lower earnings on capital from lower interest rates and growth in lower margin liquidity portfolio in Markets. |
Average interest earning assets (+$22.7 billion or +3%)
| • | Average gross loans and advances (+$7.3 billion or +1%): excluding the impact of foreign currency translation, growth was $4.6 billion or +1% driven by growth in Australia and New Zealand home loans as well as growth in New Zealand Commercial lending. This was slightly offset by the Esanda Dealer Finance divestment and a decline in Trade loans due to active portfolio reduction and strategic repositioning of that business. |
| • | Average trading and available-for-sale assets (+$6.9 billion or +8%): excluding the impact of foreign currency translation, growth was $6.1 billion or +7% driven by growth in the liquidity portfolio. |
| • | Average cash (+$4.6 billion or +10%): excluding the impact of foreign currency translation, growth was $3.7 billion or +8% driven by management of liquidity requirements. |
| • | Average collateral paid (+$1.7 billion or +19%): excluding the impact of foreign currency translation, growth was $1.4 billion or +15%. |
Average deposits and other borrowings (+$19.5 billion or +3%)
| • | Average deposits and other borrowings (+$19.5 billion or +3%): excluding the impact of foreign currency translation, growth was $13.7 billion or +2% driven by growth in Retail and Commercial customer deposits across both Australia and New Zealand, partially offset by a small decline in Institutional cash management deposits. |
25
GROUP RESULTS
Other operating income
| Half Year
|
Movement
| |||||||||||
| Mar 16 $M |
Sep 15 $M |
Mar 15 $M |
Mar 16 v. Sep 15 |
Mar 16 v. Mar 15 | ||||||||
| Net fee and commission income1 |
1,194 | 1,232 | 1,212 | -3% | -1% | |||||||
| Net funds management and insurance income |
771 | 772 | 732 | 0% | 5% | |||||||
| Markets other operating income |
433 | 423 | 716 | 2% | -40% | |||||||
| Share of associates profit1 |
301 | 311 | 314 | -3% | -4% | |||||||
| Net foreign exchange earnings1 |
141 | 64 | 59 | large | large | |||||||
|
Other1,2 |
(92)
|
62
|
24
|
large
|
large
| |||||||
| Cash other operating income |
2,748
|
2,864
|
3,057
|
-4%
|
-10%
| |||||||
|
1. Excluding Markets.
2. Other income for the March 2016 half includes the $260 million impairment of investment in Ambank, $29 million gain on cessation of equity accounting of BoT and $66 million gain on Esanda Dealer Finance divestment.
| ||||||||||||
| Half Year
|
Movement
| |||||||||||
| Markets income | Mar 16 $M |
Sep 15 $M |
Mar 15 $M |
Mar 16 v. Sep 15 |
Mar 16 v. Mar 15 | |||||||
| Net interest income |
562 | 600 | 507 | -6% | 11% | |||||||
| Other operating income |
433
|
423
|
716
|
2%
|
-40%
| |||||||
| Cash Markets income |
995
|
1,023
|
1,223
|
-3%
|
-19%
| |||||||
| Half Year
|
Movement
| |||||||||||
| Other operating income by division | Mar 16 $M |
Sep 15 $M |
Mar 15 $M |
Mar 16 v. Sep 15 |
Mar 16 v. Mar 15 | |||||||
| Australia |
594 | 606 | 580 | -2% | 2% | |||||||
| Institutional |
911 | 948 | 1,229 | -4% | -26% | |||||||
| New Zealand |
201 | 185 | 183 | 9% | 10% | |||||||
| Wealth |
779 | 790 | 762 | -1% | 2% | |||||||
| Asia Retail & Pacific |
231 | 236 | 221 | -2% | 5% | |||||||
| TSO and Group Centre1 |
32
|
99
|
82
|
-68%
|
-61% | |||||||
| Cash other operating income
|
2,748
|
2,864
|
3,057
|
-4%
|
-10%
| |||||||
| 1. | Other income for the March 2016 half includes the $260 million impairment of investment in Ambank, $29 million gain on cessation of equity accounting of BoT and $66 million gain on Esanda Dealer Finance divestment. |
Other operating income – March 2016 Half Year v March 2015 Half Year
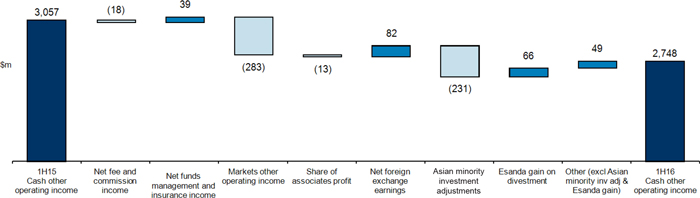
| ¡ | March 2016 v March 2015 |
Other operating income decreased $309 million (10%). Excluding the specified items (impairment of investment in Ambank, gain on cessation of equity accounting of BoT, and gain on Esanda Dealer Finance divestment) and the impact of foreign currency translation, other operating income decreased by 9%.
Net fee and commission income
Decreased by $18 million (1%). Key factors include:
| • | $21 million positive impact due to foreign currency translation. |
| • | Decrease in fee income of $35 million in Institutional due to lower customer demand and competitive pricing pressure. |
| • | $5 million decrease in fees in Australia resulting from the Esanda Dealer Finance divestment, partially offset by growth in Small Business Banking lending fee income. |
26
GROUP RESULTS
Net funds management and insurance income
Increased by $39 million (5%). Key factors include:
| • | $4 million positive impact of foreign currency translation. |
| • | Improved lapse experience in the life insurance business, partially offset by adverse claims experience and a shift in business towards lower margin products. |
Markets operating income
Decreased by $283 million (40%). Key factors include:
| • | $48 million positive impact of foreign currency translation. |
| • | Balance Sheet income decreased $116 million (45%) due to widening credit spreads. |
| • | Rates income decreased $85 million (27%) as a result of lower customer demand for interest rate hedging products. |
| • | Commodities income decreased $20 million (21%) due to declining demand for gold from Asian customers. |
Refer to page 66 for further information.
Share of associates’ profit
Decreased by $13 million (4%) with foreign currency translation impact driving an increase of $19 million and the remaining movement driven by:
| • | Ambank decreased $30 million due to margin contraction and subdued Malaysian economic conditions. |
| • | P.T. Bank Pan Indonesia decreased $19 million due to higher credit provisions. |
| • | BoT decreased $5 million mainly due to higher credit provisions and increased operating expenses. |
| • | Shanghai Rural Commercial Bank increased $20 million with higher investment income. |
Net foreign exchange earnings
Increased by $82 million (large %). Key factors include:
| • | Lower realised losses on earnings related hedges in TSO and Group Centre ($61 million) compared with the March 2015 half, these offset translation gains elsewhere in the Group. |
| • | Higher unrealised gains on foreign currency balances held in Institutional ($6 million). |
Other
Decreased by $116 million (large %). Key factors include:
| • | $3 million positive impact due to foreign currency translation. |
| • | $260 million impairment of investment in Ambank. |
| • | $66 million gain on Esanda Dealer Finance divestment. |
| • | $29 million gain on cessation of equity accounting for BoT. |
| ¡ | March 2016 v September 2015 |
Other operating income decreased by $116 million (4%). Excluding the specified items (impairment of investment in Ambank, gain on cessation of equity accounting of BoT, and gain on Esanda Dealer Finance divestment), and the impact of foreign currency translation, other operating income decreased by 1%.
Net fee and commission income
Decreased by $38 million (3%). Key factors include:
| • | $6 million positive impact of foreign currency translation. |
| • | Decrease in fee income of $26 million in Institutional due to lower customer demand and competitive pricing pressure. |
| • | $13 million decrease in fees in Australia resulting from the Esanda Dealer Finance divestment, partially offset by growth in Deposits and Payments. |
Net funds management and insurance income
Decreased by $1 million (0%). Key factors include:
| • | $2 million positive impact of foreign currency translation. |
| • | Decrease in funds management income partially offset by improved lapse experience and in-force premium growth. |
27
GROUP RESULTS
Markets operating income
Increased by $10 million (2%). Key factors include:
| • | Foreign Exchange income increased $63 million (15%) due to increased customer demand as a depreciating Chinese Yuan resulted in customers seeking to hedge their foreign exchange exposures. |
| • | Commodities income decreased $19 million (20%) due to declining demand for gold from Asian customers. Refer to page 66 for further information. |
Share of associates’ profit
Decreased by $10 million (3%) with foreign currency translation impact driving a decrease of $1 million and the remaining movement driven by:
| • | Ambank decreased $14 million due to margin contraction. |
| • | P.T. Bank Pan Indonesia decreased $28 million due to higher credit provisions. |
| • | Shanghai Rural Commercial Bank increased $24 million with higher investment income. |
| • | BoT increased $10 million due asset growth. |
Net foreign exchange earnings
Increased by $77 million (large %). Key factors include:
| • | Lower realised losses on earnings related hedges in TSO and Group Centre ($90 million) compared with the September 2015 half, these offset translation gains elsewhere in the Group. |
| • | Higher unrealised losses on foreign currency balances held in Institutional ($7 million). |
Other
Decreased by $154 million (large %). Key factors include:
| • | $2 million positive impact due to foreign currency translation |
| • | $260 million impairment of investment in Ambank. |
| • | $15 million decrease on credit default swaps hedging lending exposures in Loans and Specialised Finance. |
| • | $66 million gain on Esanda Dealer Finance divestment. |
| • | $29 million gain on cessation of equity accounting for BoT. |
28
GROUP RESULTS
Operating Expenses
| Half Year
|
Movement
| |||||||||||
| Mar 16 $M |
Sep 15 $M |
Mar 15 $M |
Mar 16 v. Sep 15 |
Mar 16 v. Mar 15 | ||||||||
| Personnel expenses1 |
2,801 | 2,764 | 2,715 | 1% | 3% | |||||||
| Premises expenses |
458 | 467 | 455 | -2% | 1% | |||||||
| Technology expenses1 |
1,324 | 761 | 701 | 74% | 89% | |||||||
| Restructuring expenses |
138 | 21 | 10 | large | large | |||||||
| Other expenses1
|
758 | 762 | 722 | -1% | 5% | |||||||
| Total cash operating expenses
|
5,479 | 4,775 | 4,603 | 15% | 19% | |||||||
| Total full time equivalent staff (FTE)
|
48,896 | 50,152 | 51,243 | -3% | -5% | |||||||
| 1. | The $629 million charge associated with the software capitalisation changes included in the March 2016 half comprises $98 million of personnel expenses, $513 million technology expenses, and $18 million other expenses. Refer to page 32 for further details. |
| Half Year | Movement | |||||||||||||||
| Expenses by division | Mar 16 $M |
Sep 15 $M |
Mar 15 $M |
Mar 16 v. Sep 15 |
Mar 16 v. Mar 15 | |||||||||||
| Australia |
1,665 | 1,618 | 1,556 | 3% | 7% | |||||||||||
| Institutional |
1,510 | 1,425 | 1,385 | 6% | 9% | |||||||||||
| New Zealand |
527 | 525 | 539 | 0% | -2% | |||||||||||
| Wealth |
521 | 481 | 484 | 8% | 8% | |||||||||||
| Asia Retail & Pacific |
401 | 395 | 374 | 2% | 7% | |||||||||||
| TSO and Group Centre
|
855 | 331 | 265 | large | large | |||||||||||
| Total cash operating expenses
|
5,479 | 4,775 | 4,603 | 15% | 19% | |||||||||||
Operating expenses – March 2016 Half Year v March 2015 Half Year
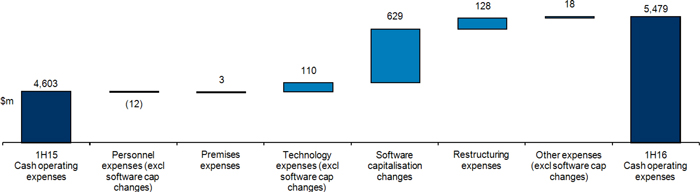
| ¡ | March 2016 v March 2015 |
Operating expenses increased 19% compared to the March 2015 half year due to the inclusion of specified items (software capitalisation changes and restructuring). Excluding these and the impact of foreign currency translation, operating expenses were flat.
| • | Personnel expenses increased $86 million (3%), with $81 million due to the impact of foreign currency translation and $98 million due to the software capitalisation changes (personnel expenses that would otherwise have been capitalised). Excluding these, personnel expenses decreased $93 million (3%) due to a 5% decrease in FTE, primarily managed through natural attrition, and lower incentive costs. |
| • | Premises expenses increased $3 million (1%) with a $10 million increase due to the impact of foreign currency translation. Adjusting for this, premises expense decreased $7 million (2%) due to premises consolidation benefits offsetting annual rent increases. |
| • | Technology expenses increased $623 million (89%). $513 million of the increase was due to the software capitalisation changes comprising $468 million of increased amortisation for software assets and $45 million due to software expenditure which would otherwise have been capitalised. Excluding this, technology expenses increased $110 million (16%) from higher licensing, outsourced services and data communication costs, along with $9 million due to the impact of foreign currency translation. |
| • | Restructuring expenses increased $128 million reflecting the reshaping of the workforce in response to the Group evolving its strategy, including the simplification of the Institutional and Wealth businesses, restructure of Retail Asia and Pacific and delayering and simplification in TSO and Group Centre. |
| • | Other expenses increased $36 million (5%), with $15 million due to the impact of foreign currency translation and $18 million due to the software capitalisation changes. Excluding these, other expenses were flat with higher compliance and remediation spend being offset by decreased travel, entertainment and advertising expenses. |
29
GROUP RESULTS
| ¡ | March 2016 v September 2015 |
Operating expenses increased 15% compared to the September 2015 half year due to the inclusion of specified items (software capitalisation changes and restructuring). Excluding these items and the impact of foreign currency translation expenses were down 1%.
| • | Personnel expenses increased $37 million (1%), with $25 million due to the impact of foreign currency translation and $98 million due to the software capitalisation changes (personnel expenses that would otherwise have been capitalised). Excluding these, personnel expenses decreased $86 million (3%) due to a 3% decrease in FTE, primarily managed through natural attrition, and lower incentive costs. |
| • | Premises expenses decreased $9 million (2%), with a $3 million increase due to the impact of foreign currency translation and a $12 million decrease driven by premises consolidation benefits which more than offset annual rent increases. |
| • | Technology expenses increased $563 million (74%). $513 million of the increase was due to the software capitalisation changes comprising $468 million of increased amortisation for software assets and $45 million due to software expenditure which would otherwise have been capitalised. Excluding these, technology expenses increased $50 million (7%) driven by higher licensing costs and outsourced services, and $4 million due to the impact of foreign currency translation. |
| • | Restructuring expenses increased $117 million, reflecting the reshaping of the workforce in response to the Group evolving its strategy, including the simplification of the Institutional and Wealth businesses, restructure of Retail Asia and Pacific and delayering and simplification in TSO and Group Centre. |
| • | Other expenses decreased $4 million (1%), with a $5 million increase due to the impact of foreign currency translation and $18 million due to the software capitalisation changes. Excluding these, other expenses decreased $28 million (4%) due to decreased travel and entertainment expenses and lower advertising spend. |
30
GROUP RESULTS
Technology infrastructure spend
Technology infrastructure spend includes expenditure that develops and enhances the Group’s technology infrastructure to meet business and strategic objectives and to improve capability and efficiency.
| Half Year
|
Movement
| |||||||||||
| Mar 16
|
Sep 15
|
Mar 15
|
Mar 16
|
Mar 16
| ||||||||
| Expensed investment spend |
272 | 135 | 123 | large | large | |||||||
| Capitalised investment spend
|
197
|
425
|
314
|
-54%
|
-37%
| |||||||
| Technology infrastructure spend
|
469
|
560
|
437
|
-16%
|
7%
| |||||||
| Comprising | Half Year
|
Movement
| ||||||||||
| Mar 16
|
Sep 15
|
Mar 15
|
Mar 16
|
Mar 16
| ||||||||
| Growth |
190 | 242 | 204 | -21% | -7% | |||||||
| Productivity |
83 | 114 | 102 | -27% | -19% | |||||||
| Risk and compliance |
115 | 141 | 82 | -18% | 40% | |||||||
| Infrastructure and other
|
81
|
63
|
49
|
29%
|
65%
| |||||||
| Technology infrastructure spend
|
469
|
560
|
437
|
-16%
|
7%
| |||||||
| Technology infrastructure spend by division | Half Year
|
Movement | ||||||||||
| Mar 16
|
Sep 15
|
Mar 15
|
Mar 16
|
Mar 16
| ||||||||
| Australia |
143 | 158 | 136 | -9% | 5% | |||||||
| Institutional |
96 | 147 | 98 | -35% | -2% | |||||||
| New Zealand |
37 | 39 | 28 | -5% | 32% | |||||||
| Asia Retail & Pacific |
4 | 4 | 3 | 0% | 33% | |||||||
| Wealth |
45 | 49 | 35 | -8% | 29% | |||||||
| TSO and Group Centre
|
144
|
163
|
137
|
-12%
|
5%
| |||||||
| Technology infrastructure spend
|
469
|
560
|
437
|
-16%
|
7%
| |||||||
Digitisation is becoming central to ANZ’s business operations by reshaping how ANZ works and providing technology that enables better solutions for customers. The Group’s aim is to create a digital bank; one that allows us to streamline operations such that we deliver fast, easy and innovative solutions for our customers while also reducing the operational complexity of the organisation and thereby improving productivity and reducing risk. ANZ has invested in digital across the Group, delivering multichannel platforms that have globally extensible capabilities covering aspects like employee mobility, products (goMoney™ and MobilePay), security systems and more intuitive internet banking.
Australia division has delivered key foundations with the go-live of multi-channel platforms during the March 2016 half to enable a consistent digital experience and will now focus on continuous delivery of digital channels to improve both customer and banker experience. Investment is also continuing in simplification initiatives such as Banker Desktop which is simplifying key common branch processes through digitisation to enhance banker productivity.
Institutional continues to invest in risk and compliance projects to meet increasing regulatory requirements across the region. Institutional investment focused primarily on the Markets business globally; Transaction Banking in China; and on banking and data management systems in Singapore and Indonesia. The division recently concluded a number of projects aimed at establishing businesses in Thailand and Myanmar, with the condensed growth agenda now focusing on key digital infrastructure in Markets and Payments Application Consolidation in Transaction Banking.
New Zealand has introduced new digital services for customers including goMoney™ Wallet for Android users and self-service funds transfers for KiwiSavers on internet banking.
Wealth investment has focused on strategic growth initiatives to help customers better connect with, protect and grow their financial well-being. These initiatives include digital platforms, such as Grow by ANZ™, that better connect customers to their wealth.
TSO and Group Centre is investing in common platforms to drive transformation of key business activities, improve customer experience and drive down cost to serve. Investment continues in Payments Transformation to provide competitive payment services for our customers, and our Global Loan Management System to further transform wholesale lending capabilities.
| ¡ | March 2016 v March 2015 |
During the March 2016 half, the Group continued to invest strongly with spend of $469 million. The $32 million (7%) increase compared to the March 2015 half was driven by Australia (Small Business Origination System and Global Asset Finance), New Zealand (RBNZ Payments Industry Compliance, Deposits Remediation and Teradata Pan-bank Data Platform), Wealth (Superannuation Transition, Smart Choice, and E*Trade Rebranding) and TSO and Group Centre (transforming wholesale lending capabilities).
| ¡ | March 2016 v September 2015 |
The $91 million decrease (16%) in March 2016 reflects the completion of a number of programs at the end of September 2015, such as Thailand business mobilisation, over the counter (OTC) derivative reform program and China data centre expansion in Institutional, anz.com redesign and ANZ Mobile Pay in Australia, and insurance on Grow™ in Wealth.
31
GROUP RESULTS
Software capitalisation
As at 31 March 2016, the Group’s intangible assets included $2,249 million in relation to costs incurred in acquiring and developing software. Details are set out in the table below:
| Half Year
|
Movement
| |||||||||||
| Mar 16 $M |
Sep 15 $M |
Mar 15 $M |
Mar 16 v. Sep 15 |
Mar 16 v. Mar 15 | ||||||||
| Balance at start of period |
2,893 | 2,689 | 2,533 | 8% | 14% | |||||||
| Software capitalised during the period |
209 | 457 | 350 | -54% | -40% | |||||||
| Amortisation during the period |
||||||||||||
| - Current period amortisation |
(245) | (275) | (267) | -11% | -8% | |||||||
| - Accelerated amortisation |
(556) | - | - | n/a | n/a | |||||||
| Software impaired/written-off |
(2) | (13) | (4) | -85% | -50% | |||||||
| Foreign exchange differences
|
(50)
|
35
|
77
|
large
|
large
| |||||||
| Total capitalised software
|
2,249
|
2,893
|
2,689
|
-22%
|
-16%
| |||||||
| Capitalised cost analysis by Division | Half Year
|
Movement
| ||||||||||
| Mar 16 $M |
Sep 15 $M |
Mar 15 $M |
Mar 16 v. Sep 15 |
Mar 16 v. Mar 15 | ||||||||
| Australia |
56 | 121 | 93 | -54% | -40% | |||||||
| Institutional |
40 | 87 | 90 | -54% | -56% | |||||||
| New Zealand |
4 | 28 | 14 | -86% | -71% | |||||||
| Wealth |
- | 35 | 21 | -100% | -100% | |||||||
| Asia Retail & Pacific |
9 | 4 | 10 | large | -10% | |||||||
| TSO and Group Centre
|
100
|
182
|
122
|
-45%
|
-18%
| |||||||
| Total
|
209
|
457
|
350
|
-54%
|
-40%
| |||||||
| Net book value by Division | Half Year
|
Movement
| ||||||||||
| Mar 16 $M |
Sep 15 $M |
Mar 15 $M |
Mar 16 v. Sep 15 |
Mar 16 v. Mar 15 | ||||||||
| Australia |
514 | 628 | 580 | -18% | -11% | |||||||
| Institutional |
847 | 1,059 | 1,014 | -20% | -16% | |||||||
| New Zealand |
19 | 68 | 51 | -72% | -63% | |||||||
| Wealth |
28 | 121 | 101 | -77% | -72% | |||||||
| Asia Retail & Pacific |
62 | 74 | 77 | -16% | -19% | |||||||
| TSO and Group Centre
|
779
|
943
|
866
|
-17%
|
-10%
| |||||||
| Total
|
2,249
|
2,893
|
2,689
|
-22%
|
-16%
| |||||||
During the March 2016 half, the Group changed the application of its accounting policy for the capitalisation of expenditure on internally generated software assets effective from 1 October 2015. The change aligns the accounting policy for software assets with the rapidly changing technology landscape and the Group’s evolving digital strategy by increasing the threshold for capitalisation of software development costs reflecting the increasingly shorter useful life of smaller items of software and directly expensing more project related costs.
The change does not affect the total investment in technology but does affect the timing of recognition of costs in the income statement. The impact of the change on the March 2016 half was:
| • | Accelerated amortisation of $556 million relating to software assets where the original cost was below the revised threshold at 1 October 2015. This brings forward amortisation which otherwise would have been recognised in future periods, of which $88 million would have been recognised in the March 2016 half (i.e. the half year amortisation charge increased by $468 million). |
| • | Higher operating expenses of $161 million relating to software development costs which otherwise would have been capitalised and amortised in future periods. |
The change in capitalised software treatment has no impact on regulatory capital ratios.
The table below shows the capitalised costs and net book values by division at 31 March 2016 had the changes not taken place:
| Capitalised costs $M |
Net book value $M | |||
| Australia |
105 | 652 | ||
| Institutional |
70 | 983 | ||
| New Zealand |
21 | 81 | ||
| Wealth |
19 | 119 | ||
| Asia Retail & Pacific |
9 | 70 | ||
| TSO and Group Centre
|
146
|
973
| ||
| Total
|
370
|
2,878
| ||
32
GROUP RESULTS
Credit risk
| Half Year
|
Movement
| |||||||||||||
| Mar 16 | Sep 15 | Mar 15 | Mar 16 | Mar 16 | ||||||||||
| Credit impairment charge/(release) | $M | $M | $M | v. Sep 15 | v. Mar 15 | |||||||||
| Individual credit impairment charge |
892 | 655 | 455 | 36% | 96% | |||||||||
| Collective credit impairment charge
|
26 | 40 | 55 | -35% | -53% | |||||||||
| Total credit impairment charge
|
918 | 695 | 510 | 32% | 80% | |||||||||
| Half Year
|
Movement
| |||||||||||||
| Mar 16 | Sep 15 | Mar 15 | Mar 16 | Mar 16 | ||||||||||
| Credit impairment charge/(release) | $M | $M | $M | v. Sep 15 | v. Mar 15 | |||||||||
| Australia |
462 | 458 | 395 | 1% | 17% | |||||||||
| Institutional |
323 | 111 | 88 | large | large | |||||||||
| New Zealand |
42 | 36 | 19 | 17% | large | |||||||||
| Wealth |
- | 1 | (1) | -100% | -100% | |||||||||
| Asia Retail & Pacific |
91 | 87 | 10 | 5% | large | |||||||||
| TSO and Group Centre |
- | 2 | (1) | -100% | -100% | |||||||||
| Total credit impairment charge |
918 | 695 | 510 | 32% | 80% | |||||||||
| Individual credit impairment charge | ||||||||||||||
| Half Year
|
Movement
| |||||||||||||
| Mar 16 | Sep 15 | Mar 15 | Mar 16 | Mar 16 | ||||||||||
| Individual credit impairment charge by division | $M | $M | $M | v. Sep 15 | v. Mar 15 | |||||||||
| Australia |
429 | 427 | 334 | 0% | 28% | |||||||||
| Institutional |
339 | 114 | 92 | large | large | |||||||||
| New Zealand |
43 | 32 | 22 | 34% | 95% | |||||||||
| Wealth |
(1) | 1 | (1) | large | 0% | |||||||||
| Asia Retail & Pacific |
82 | 78 | 8 | 5% | large | |||||||||
| TSO and Group Centre
|
- | 3 | - | -100% | n/a | |||||||||
| Total individual credit impairment charge
|
892 | 655 | 455 | 36% | 96% | |||||||||
| New and increased individual credit impairments |
||||||||||||||
| Australia |
600 | 573 | 530 | 5% | 13% | |||||||||
| Institutional |
354 | 187 | 127 | 89% | large | |||||||||
| New Zealand |
96 | 100 | 90 | -4% | 7% | |||||||||
| Wealth |
- | 1 | - | -100% | n/a | |||||||||
| Asia Retail & Pacific |
101 | 99 | 75 | 2% | 35% | |||||||||
| TSO and Group Centre
|
- | 1 | - | -100% | n/a | |||||||||
| New and increased individual credit impairments
|
1,151 | 961 | 822 | 20% | 40% | |||||||||
| Recoveries and write-backs |
||||||||||||||
| Australia |
(171) | (146) | (196) | 17% | -13% | |||||||||
| Institutional |
(15) | (73) | (35) | -79% | -57% | |||||||||
| New Zealand |
(53) | (68) | (68) | -22% | -22% | |||||||||
| Wealth |
(1) | - | (1) | n/a | 0% | |||||||||
| Asia Retail & Pacific |
(19) | (22) | (67) | -14% | -72% | |||||||||
| TSO and Group Centre
|
- | 3 | - | -100% | n/a | |||||||||
| Recoveries and write-backs
|
(259) | (306) | (367) | -15% | -29% | |||||||||
| Total individual credit impairment charge
|
892 | 655 | 455 | 36% | 96% | |||||||||
| ¡ | March 2016 v March 2015 |
The individual credit impairment charge increased $437 million (96%) driven by increases in new and existing provisions of $329 million, combined with a $108 million reduction in write-backs. The main driver of the increase in new and existing provisions was in the Institutional division from a small number of Australian and multi-national resource related exposures and continued commodity sector weakness. In Australia division, the increases were in Small Business Banking, Cards & Personal Loans and Regional Business Banking, partially offset by the Esanda Dealer Finance divestment. Lower write-backs reflected a large write-back in Asia Retail & Pacific that occurred in the March 2015 half.
| ¡ | March 2016 v September 2015 |
The individual credit impairment charge increased by $237 million (36%) driven by an increase in new and existing provisions of $190 million combined with a $47 million reduction in write-backs. The main driver of the increase in new and existing provisions was in the Institutional division from a small number of Australian and multi-national resource related exposures and continued commodity sector weakness.
33
GROUP RESULTS
Collective credit impairment charge
| Half Year
|
Movement
| |||||||||||||
| Mar 16 | Sep 15 | Mar 15 | Mar 16 | Mar 16 | ||||||||||
| Collective credit impairment charge/(release) by source | $M | $M | $M | v. Sep 15 | v. Mar 15 | |||||||||
| Lending growth |
56 | 50 | 54 | 12% | 4% | |||||||||
| Risk profile |
(30) | 65 | 5 | large | large | |||||||||
| Portfolio mix |
- | (3) | 3 | -100% | -100% | |||||||||
| Economic cycle and concentration risk adjustment
|
- | (72) | (7) | -100% | -100% | |||||||||
| Total collective credit impairment charge
|
26 | 40 | 55 | -35% | -53% | |||||||||
| Half Year
|
Movement
| |||||||||||||
| Mar 16 | Sep 15 | Mar 15 | Mar 16 | Mar 16 | ||||||||||
| Collective credit impairment charge/(release) by division | $M | $M | $M | v. Sep 15 | v. Mar 15 | |||||||||
| Australia |
33 | 31 | 61 | 6% | -46% | |||||||||
| Institutional |
(16) | (3) | (4) | large | large | |||||||||
| New Zealand |
(1) | 4 | (3) | large | -67% | |||||||||
| Wealth |
1 | - | - | n/a | n/a | |||||||||
| Asia Retail & Pacific |
9 | 9 | 2 | 0% | large | |||||||||
| TSO and Group Centre
|
- | (1) | (1) | -100% | -100% | |||||||||
| Total collective credit impairment charge
|
26 | 40 | 55 | -35% | -53% | |||||||||
| ¡ | March 2016 v March 2015 |
The collective credit impairment charge decreased $29 million (53%) driven by a number of customer downgrades in the Institutional division and subsequent migration of provisioning from collective to individual provision.
| ¡ | March 2016 v September 2015 |
The collective credit impairment charge decreased $14 million (35%) driven by a number of customer downgrades in the Institutional division and subsequent migration of provisioning from collective to individual provision, and releases from the economic cycle overlay in September 2015.
Provision for credit impairment balance
| As at
|
Movement
| |||||||||||||
| Mar 16 | Sep 15 | Mar 15 | Mar 16 | Mar 16 | ||||||||||
| $M | $M | $M | v. Sep 15 | v. Mar 15 | ||||||||||
| Collective provision1 |
2,862 | 2,956 | 2,914 | -3% | -2% | |||||||||
| Individual provision
|
1,238 | 1,061 | 1,114 | 17% | 11% | |||||||||
| Total provision for credit impairment
|
4,100 | 4,017 | 4,028 | 2% | 2% | |||||||||
| 1. | The collective provision includes amounts for off-balance sheet credit exposures of $663 million at 31 Mar 2016 (Sep 2015: $677 million; Mar 2015: $646 million). The impact on the income statement for the half year ended 31 March 2016 was a $3 million charge (Sep 2015 half: $20 million charge; Mar 2015 half: $7 million charge). |
34
GROUP RESULTS
Gross Impaired Assets
| As at
|
Movement
| |||||||||||||
| Mar 16 | Sep 15 | Mar 15 | Mar 16 | Mar 16 | ||||||||||
| $M | $M | $M | v. Sep 15 | v. Mar 15 | ||||||||||
| Impaired loans |
2,564 | 2,441 | 2,466 | 5% | 4% | |||||||||
| Restructured items |
226 | 184 | 146 | 23% | 55% | |||||||||
| Non-performing commitments and contingencies
|
93 | 94 | 96 | -1% | -3% | |||||||||
| Gross impaired assets |
2,883 | 2,719 | 2,708 | 6% | 6% | |||||||||
| Individual provisions |
||||||||||||||
| Impaired loans |
(1,209) | (1,038) | (1,081) | 16% | 12% | |||||||||
| Non-performing commitments and contingencies
|
(29) | (23) | (33) | 26% | -12% | |||||||||
| Net impaired assets
|
1,645 | 1,658 | 1,594 | -1% | 3% | |||||||||
| Gross impaired assets by division |
||||||||||||||
| Australia |
1,093 | 1,193 | 1,245 | -8% | -12% | |||||||||
| Institutional |
1,281 | 960 | 826 | 33% | 55% | |||||||||
| New Zealand |
273 | 338 | 434 | -19% | -37% | |||||||||
| Wealth |
4 | 5 | 8 | -20% | -50% | |||||||||
| Asia Retail & Pacific
|
232 | 223 | 195 | 4% | 19% | |||||||||
| Gross impaired assets
|
2,883 | 2,719 | 2,708 | 6% | 6% | |||||||||
| Gross impaired assets by size of exposure |
||||||||||||||
| Less than $10 million |
1,597 | 1,748 | 1,903 | -9% | -16% | |||||||||
| $10 million to $100 million |
970 | 708 | 607 | 37% | 60% | |||||||||
| Greater than $100 million
|
316 | 263 | 198 | 20% | 60% | |||||||||
| Gross impaired assets
|
2,883 | 2,719 | 2,708 | 6% | 6% | |||||||||
| ¡ | March 2016 v March 2015 |
Gross impaired assets increased $175 million (6%) driven by Institutional ($455 million), partially offset by decreases in Australia division ($152 million) and New Zealand division ($161 million). The increase in Institutional relates to impairments on a small number of Australian and multi-national resource related exposures due to continued weakness in the commodity sector. The Australia division decrease is driven by the Esanda Dealer Finance divestment. In the New Zealand division, the decrease is due to repayments and transfers out of the impaired category. The Group’s individual provision coverage ratio on impaired assets was 42.9% at 31 March 2016, up from 41.1% at 31 March 2015.
| ¡ | March 2016 v September 2015 |
Gross impaired assets increased $164 million (6%) driven by Institutional ($321 million), partially offset by decreases in Australia division ($100 million) and New Zealand division ($65 million). The increase in Institutional relates to impairments on a small number of Australian and multi-national resource related exposures due to continued weakness in the commodity sector. The Australia division decrease is due to the Esanda Dealer Finance divestment. In the New Zealand division, the decrease is due to repayments and transfers out of the impaired category. The Group’s individual provision coverage ratio on impaired assets was 42.9% at 31 March 2016, up from 39.0% at 30 September 2015.
New Impaired Assets
| Half Year
|
Movement
| |||||||||||||
| Mar 16 | Sep 15 | Mar 15 | Mar 16 | Mar 16 | ||||||||||
| $M | $M | $M | v. Sep 15 | v. Mar 15 | ||||||||||
| Impaired loans |
1,657 | 1,707 | 1,141 | -3% | 45% | |||||||||
| Restructured items |
81 | 4 | 26 | large | large | |||||||||
| Non-performing commitments and contingencies
|
46 | 72 | 30 | -36% | 53% | |||||||||
| Total new impaired assets
|
1,784 | 1,783 | 1,197 | 0% | 49% | |||||||||
| New impaired assets by division |
||||||||||||||
| Australia |
777 | 840 | 778 | -8% | 0% | |||||||||
| Institutional |
652 | 614 | 146 | 6% | large | |||||||||
| New Zealand |
194 | 203 | 165 | -4% | 18% | |||||||||
| Wealth |
- | - | 18 | n/a | -100% | |||||||||
| Asia Retail & Pacific
|
161 | 126 | 90 | 28% | 79% | |||||||||
| Total new impaired assets
|
1,784 | 1,783 | 1,197 | 0% | 49% | |||||||||
35
GROUP RESULTS
| ¡ | March 2016 v March 2015 |
New impaired assets increased $587 million (49%) with increases in Institutional ($506 million). The increase in Institutional related to a small number of Australian and multi-national resource related exposures due to continued weakness in the commodity sector.
| ¡ | March 2016 v September 2015 |
New impaired assets increased $1 million (0%) with increases in Institutional ($38 million) and Asia Retail & Pacific ($36 million), offset by a decrease in Australia division ($63 million). The increase in Institutional related to a small number of Australian and multi-national resource related exposures due to continued weakness in the commodity sector, offset by the Esanda Dealer Finance divestment in the Australia Division.
| As at
|
Movement
| |||||||||||||
| Ageing analysis of net loans and advances | Mar 16 | Sep 15 | Mar 15 | Mar 16 | Mar 16 | |||||||||
| that are past due but not impaired | $M | $M | $M | v. Sep 15 | v. Mar 15 | |||||||||
| 1-5 days |
2,926 | 2,621 | 3,323 | 12% | -12% | |||||||||
| 6-29 days |
5,942 | 5,235 | 5,271 | 14% | 13% | |||||||||
| 30-59 days |
2,222 | 1,674 | 2,069 | 33% | 7% | |||||||||
| 60-89 days |
1,263 | 1,050 | 1,160 | 20% | 9% | |||||||||
| >90 days
|
2,573 | 2,378 | 2,248 | 8% | 14% | |||||||||
| Total
|
14,926 | 12,958 | 14,071 | 15% | 6% | |||||||||
| ¡ | March 2016 v March 2015 |
The 90 days past due but not impaired increased by $325 million (14%) primarily within Australia division due to growth in the mortgage portfolio and portfolio deterioration mainly in Western Australia and Queensland.
| ¡ | March 2016 v September 2015 |
The 90 days past due but not impaired increased by $195 million (8%) primarily within Australia division due to growth in the mortgage portfolio and portfolio deterioration predominantly in Western Australia and Queensland.
Income tax expense
| Half Year | Movement | |||||||||||
| Mar 16 | Sep 15 | Mar 15 | Mar 16 | Mar 16 | ||||||||
| $M | $M | $M | v. Sep 15 | v. Mar 15 | ||||||||
| Income tax expense on cash profit | 1,133 | 1,326 | 1,398 | -15% | -19% | |||||||
| Effective tax rate (cash profit)
|
28.9%
|
27.2%
|
27.5%
|
1.7%
|
1.4%
| |||||||
| ¡ | March 2016 v March 2015 |
The effective tax rate increased from 27.5% to 28.9%. The increase of 140 bps is primarily due to the impairment of our investment in Ambank and lower average tax rate on decreased offshore earnings during the March 2016 half.
| ¡ | March 2016 v September 2015 |
The effective tax rate increased from 27.2% to 28.9%. The increase of 170 bps is primarily due to the impairment of our investment in Ambank and a one off favourable Wealth tax consolidation benefit recognised in the September 2015 half, partially offset by a release of tax provisions.
36
GROUP RESULTS
Impact of foreign currency translation
The following tables present the Group’s cash profit results and net loans and advances neutralised for the impact of foreign currency translation. Comparative data has been adjusted to remove the translation impact of foreign currency movements by retranslating prior period comparatives at current period foreign exchange rates.
Cash Profit - March 2016 Half Year vs March 2015 Half Year
| Half Year | Movement | |||||||||||||||
| Actual | FX unadjusted |
FX impact |
FX adjusted |
FX unadjusted |
FX impact |
FX adjusted | ||||||||||
| Mar 16 $M |
Mar 15 $M |
Mar 15 $M |
Mar 15 $M |
Mar 16 v. Mar 15 |
Mar 16 v. Mar 15 |
Mar 16 v. Mar 15 | ||||||||||
| Net interest income |
7,568 | 7,138 | 77 | 7,215 | 6% | 1% | 5% | |||||||||
| Other operating income
|
2,748
|
3,057
|
149
|
3,206
|
-10%
|
4%
|
-14%
| |||||||||
| Operating income |
10,316 | 10,195 | 226 | 10,421 | 1% | 2% | -1% | |||||||||
| Operating expenses
|
(5,479)
|
(4,603)
|
(115)
|
(4,718)
|
19%
|
3%
|
16%
| |||||||||
| Profit before credit impairment and income tax |
4,837 | 5,592 | 111 | 5,703 | -14% | 1% | -15% | |||||||||
| Credit impairment charge
|
(918)
|
(510)
|
(5)
|
(515)
|
80%
|
2%
|
78%
| |||||||||
| Profit before income tax |
3,919 | 5,082 | 106 | 5,188 | -23% | 1% | -24% | |||||||||
| Income tax expense |
(1,133) | (1,398) | (25) | (1,423) | -19% | 1% | -20% | |||||||||
| Non-controlling interests
|
(4)
|
(8)
|
(2)
|
(10)
|
-50%
|
10%
|
-60%
| |||||||||
| Cash profit
|
2,782
|
3,676
|
79
|
3,755
|
-24%
|
2%
|
-26%
| |||||||||
Cash Profit by Division and Geography - March 2016 Half Year vs March 2015 Half Year
| Half Year | Movement | |||||||||||||||
| Actual | FX unadjusted |
FX impact |
FX adjusted |
FX unadjusted |
FX impact |
FX adjusted | ||||||||||
| Mar 16 $M |
Mar 15 $M |
Mar 15 $M |
Mar 15 $M |
Mar 16 v. Mar 15 |
Mar 16 v. Mar 15 |
Mar 16 v. Mar 15 | ||||||||||
| Australia |
1,753 | 1,650 | - | 1,650 | 6% | 0% | 6% | |||||||||
| Institutional |
632 | 1,071 | 36 | 1,107 | -41% | 2% | -43% | |||||||||
| New Zealand |
578 | 566 | (7) | 559 | 2% | -1% | 3% | |||||||||
| Wealth |
261 | 263 | (1) | 262 | -1% | -1% | 0% | |||||||||
| Asia Retail & Pacific |
53 | 99 | 6 | 105 | -46% | 4% | -50% | |||||||||
| TSO and Group Centre
|
(495)
|
27
|
45
|
72
|
large
|
large
|
large
| |||||||||
| Cash profit by division
|
2,782
|
3,676
|
79
|
3,755
|
-24%
|
2%
|
-26%
| |||||||||
|
Australia |
1,830 | 2,147 | 35 | 2,182 | -15% | 1% | -16% | |||||||||
| Asia Pacific, Europe & America |
259 | 743 | 54 | 797 | -65% | 3% | -68% | |||||||||
| New Zealand
|
693
|
786
|
(10)
|
776
|
-12%
|
-1%
|
-11%
| |||||||||
| Cash profit by geography
|
2,782
|
3,676
|
79
|
3,755
|
-24%
|
2%
|
-26%
| |||||||||
Net loans and advances by division and geography - March 2016 Half Year vs March 2015 Half Year
| As at | Movement | |||||||||||||||
| Actual | FX unadjusted |
FX impact |
FX adjusted |
FX unadjusted |
FX impact |
FX adjusted | ||||||||||
| Mar 16 $B |
Mar 15 $B |
Mar 15 $B |
Mar 15 $B |
Mar 16 v. Mar 15 |
Mar 16 v. Mar 15 |
Mar 16 v. Mar 15 | ||||||||||
| Australia |
320.0 | 297.6 | - | 297.6 | 8% | 0% | 8% | |||||||||
| Institutional |
125.6 | 144.9 | (1.4) | 143.5 | -13% | -1% | -12% | |||||||||
| New Zealand |
97.2 | 97.7 | (8.0) | 89.7 | -1% | -9% | 8% | |||||||||
| Wealth |
7.3 | 6.9 | (0.2) | 6.7 | 6% | -3% | 9% | |||||||||
| Asia Retail & Pacific |
11.9 | 11.6 | (0.1) | 11.5 | 3% | 0% | 3% | |||||||||
| TSO and Group Centre
|
(0.2)
|
(0.5)
|
-
|
(0.5)
|
-60%
|
0%
|
-60%
| |||||||||
| Net loans and advances by division1
|
561.8
|
558.2
|
(9.7)
|
548.5
|
1%
|
-1%
|
2%
| |||||||||
|
Australia |
386.8 | 362.8 | - | 362.8 | 7% | 0% | 7% | |||||||||
| Asia Pacific, Europe & America |
69.1 | 88.4 | (1.0) | 87.3 | -22% | -1% | -21% | |||||||||
| New Zealand
|
105.9
|
107.0
|
(8.7)
|
98.3
|
-1%
|
-9%
|
8%
| |||||||||
| Net loans and advances by geography1
|
561.8
|
558.2
|
(9.7)
|
548.5
|
1%
|
-1%
|
2%
| |||||||||
| 1. | Loans & advances as at 30 September 2015 include Esanda Dealer Finance assets divested to Macquarie Group Limited in the March 2016 half. |
37
GROUP RESULTS
Cash Profit - March 2016 Half Year vs September 2015 Half Year
| Half Year | Movement | |||||||||||||||
| Actual | FX unadjusted |
FX impact |
FX adjusted |
FX unadjusted |
FX impact |
FX adjusted | ||||||||||
| Mar 16 $M |
Sep 15 $M |
Sep 15 $M |
Sep 15 $M |
Mar 16 v. Sep 15 |
Mar 16 v. Sep 15 |
Mar 16 v. Sep 15 | ||||||||||
| Net interest income |
7,568 | 7,478 | 32 | 7,510 | 1% | 0% | 1% | |||||||||
| Other operating income
|
2,748
|
2,864
|
103
|
2,967
|
-4%
|
3%
|
-7%
| |||||||||
| Operating income |
10,316 | 10,342 | 135 | 10,477 | 0% | 2% | -2% | |||||||||
| Operating expenses
|
(5,479)
|
(4,775)
|
(37)
|
(4,812)
|
15%
|
1%
|
14%
| |||||||||
| Profit before credit impairment and income tax |
4,837 | 5,567 | 98 | 5,665 | -13% | 2% | -15% | |||||||||
| Credit impairment charge
|
(918)
|
(695)
|
(8)
|
(703)
|
32%
|
1%
|
31%
| |||||||||
| Profit before income tax |
3,919 | 4,872 | 90 | 4,962 | -20% | 1% | -21% | |||||||||
| Income tax expense |
(1,133) | (1,326) | (28) | (1,354) | -15% | 1% | -16% | |||||||||
| Non-controlling interests
|
(4)
|
(6)
|
1
|
(5)
|
-33%
|
-13%
|
-20%
| |||||||||
| Cash profit
|
2,782
|
3,540
|
63
|
3,603
|
-21%
|
2%
|
-23%
| |||||||||
Cash Profit by Division and Geography - March 2016 Half Year vs September 2015 Half Year
| Half Year | Movement | |||||||||||||||
| Actual | FX unadjusted |
FX impact |
FX adjusted |
FX unadjusted |
FX impact |
FX adjusted | ||||||||||
| Mar 16 $M |
Sep 15 $M |
Sep 15 $M |
Sep 15 $M |
Mar 16 v. Sep 15 |
Mar 16 v. Sep 15 |
Mar 16 v. Sep 15 | ||||||||||
| Australia |
1,753 | 1,706 | - | 1,706 | 3% | 0% | 3% | |||||||||
| Institutional |
632 | 893 | 1 | 894 | -29% | 0% | -29% | |||||||||
| New Zealand |
578 | 561 | 3 | 564 | 3% | 1% | 2% | |||||||||
| Wealth |
261 | 346 | - | 346 | -25% | 0% | -25% | |||||||||
| Asia Retail & Pacific |
53 | 45 | (1) | 44 | 18% | -2% | 20% | |||||||||
| TSO and Group Centre
|
(495)
|
(11)
|
60
|
49
|
large
|
large
|
large
| |||||||||
| Cash profit by division
|
2,782
|
3,540
|
63
|
3,603
|
-21%
|
2%
|
-23%
| |||||||||
|
Australia |
1,830 | 2,269 | 64 | 2,333 | -19% | 3% | -22% | |||||||||
| Asia Pacific, Europe & America |
259 | 492 | (4) | 488 | -47% | 0% | -47% | |||||||||
| New Zealand
|
693
|
779
|
3
|
782
|
-11%
|
0%
|
-11%
| |||||||||
| Cash profit by geography
|
2,782
|
3,540
|
63
|
3,603
|
-21%
|
2%
|
-23%
| |||||||||
Net loans and advances by division and geography - March 2016 Half Year vs September 2015 Half Year
| As at | Movement | |||||||||||||||
| Actual | FX unadjusted |
FX impact |
FX adjusted |
FX unadjusted |
FX impact |
FX adjusted | ||||||||||
| Mar 16 $B |
Sep 15 $B |
Sep 15 $B |
Sep 15 $B |
Mar 16 v. Sep 15 |
Mar 16 v. Sep 15 |
Mar 16 v. Sep 15 | ||||||||||
| Australia |
320.0 | 313.7 | - | 313.7 | 2% | 0% | 2% | |||||||||
| Institutional |
125.6 | 142.2 | (5.5) | 136.7 | -12% | -4% | -8% | |||||||||
| New Zealand |
97.2 | 95.2 | (0.8) | 94.4 | 2% | -1% | 3% | |||||||||
| Wealth |
7.3 | 7.1 | (0.2) | 6.9 | 3% | -3% | 6% | |||||||||
| Asia Retail & Pacific |
11.9 | 12.5 | (0.8) | 11.7 | -5% | -7% | 2% | |||||||||
| TSO and Group Centre
|
(0.2)
|
(0.5)
|
-
|
(0.5)
|
-60%
|
0%
|
-60%
| |||||||||
| Net loans and advances by division1
|
561.8
|
570.2
|
(7.3)
|
562.9
|
-1%
|
-1%
|
0%
| |||||||||
|
Australia |
386.8 | 381.2 | - | 381.2 | 1% | 0% | 1% | |||||||||
| Asia Pacific, Europe & America |
69.1 | 85.1 | (6.4) | 78.6 | -19% | -7% | -12% | |||||||||
| New Zealand
|
105.9
|
103.9
|
(0.9)
|
103.0
|
2%
|
-1%
|
3%
| |||||||||
| Net loans and advances by geography1
|
561.8
|
570.2
|
(7.3)
|
562.9
|
-1%
|
-1%
|
0%
| |||||||||
| 1. | Loans & advances as at 30 September 2015 include Esanda Dealer Finance assets divested to Macquarie Group Limited in the March 2016 half. |
38
GROUP RESULTS
Earnings related hedges
The Group has taken out economic hedges against larger foreign exchange denominated revenue streams (primarily New Zealand Dollar, US Dollar and US Dollar correlated). New Zealand dollar exposure relates to the New Zealand geography and USD exposure relates to APEA. Details of these hedges are set out below.
| Half Year
| ||||||
| NZD Economic hedges | Mar 16 $M |
Sep 15 $M |
Mar 15 $M | |||
| Net open NZD position (notional principal)1 |
3,119 | 3,567 | 2,375 | |||
| Amount taken to income (pre-tax statutory basis)2 |
(2) | 168 | (220) | |||
| Amount taken to income (pre-tax cash basis)3 |
(2) | (34) | (51) | |||
| USD Economic hedges |
||||||
| Net open USD position (notional principal)1 |
85 | 352 | 823 | |||
| Amount taken to income (pre-tax statutory basis)2 |
24 | (41) | (129) | |||
| Amount taken to income (pre-tax cash basis)3
|
(34)
|
(92)
|
(46)
| |||
| 1. | Value in AUD at contracted rate. |
| 2. | Unrealised valuation movement plus realised revenue from closed hedges. |
| 3. | Realised revenue from closed hedges. |
As at 31 March 2016, the following hedges are in place to partially hedge future earnings against adverse movements in exchange rates:
| • | NZD 3.4 billion at a forward rate of approximately NZD 1.09 / AUD. |
| • | USD 0.1 billion at a forward rate of approximately USD 0.95 / AUD. |
During the March 2016 half:
| • | NZD 1.0 billion of economic hedges matured and a realised loss of $2 million (pre-tax) was recorded in cash profit. |
| • | USD 0.1 billion of economic hedges matured and a realised loss of $34 million (pre-tax) was recorded in cash profit. |
| • | An unrealised gain of $58 million (pre-tax) on the outstanding NZD and USD economic hedges was recorded in the statutory income statement during the half. This unrealised gain has been treated as an adjustment to statutory profit in calculating cash profit as these are hedges of future NZD and USD revenues. |
Earnings per share
| Half Year | Movement | |||||||||||
| Mar 16 | Sep 15 | Mar 15 | Mar 16 v. Sep 15 |
Mar 16 v. Mar 15 | ||||||||
| Cash earnings per share (cents) |
||||||||||||
| Basic |
95.9 | 126.8 | 133.6 | -24% | -28% | |||||||
| Diluted |
90.7 | 119.8 | 129.9 | -24% | -30% | |||||||
| Cash weighted average number of ordinary shares (M)1 |
||||||||||||
| Basic |
2,901.4 | 2,792.7 | 2,750.0 | 4% | 6% | |||||||
| Diluted |
3,229.5 | 3,077.4 | 2,926.8 | 5% | 10% | |||||||
| Cash profit ($M) |
2,782 | 3,540 | 3,676 | -21% | -24% | |||||||
| Preference share dividends ($M)
|
-
|
-
|
(1)
|
n/a
|
-100%
| |||||||
|
Cash profit less preference share dividends ($M)
|
2,782
|
3,540
|
3,675
|
-21%
|
-24%
| |||||||
| Diluted cash profit less preference share dividends ($M)
|
2,929
|
3,687
|
3,802
|
-21%
|
-23%
| |||||||
| 1. | Includes Treasury shares held in Wealth as the associated gains and losses are included in cash profit. |
39
GROUP RESULTS
Dividends
| Half Year
|
Movement
| |||||||||||
| Mar 16 | Mar 16 | |||||||||||
| Dividend per ordinary share (cents)
|
Mar 16
|
Sep 15
|
Mar 15
|
v. Sep 15
|
v. Mar 15
| |||||||
| Interim (fully franked)1 |
80 | - | 86 | n/a | -7% | |||||||
| Final (fully franked)
|
-
|
95
|
-
|
n/a
|
n/a
| |||||||
|
Total (fully franked) |
80 |
95 |
86 |
-16% |
-7% | |||||||
| Ordinary share dividends used in payout ratio ($M)2 |
2,334 | 2,758 | 2,379 | -15% | -2% | |||||||
| Cash profit ($M) |
2,782 | 3,540 | 3,676 | -21% | -24% | |||||||
| Less: Preference share dividends paid |
- | - | (1) | n/a | -100% | |||||||
| Ordinary share dividend payout ratio (cash basis)2
|
83.9%
|
77.9%
|
64.7%
|
|||||||||
| 1. | 2016 interim dividend is proposed. |
| 2. | Dividend payout ratio is calculated using proposed 2016 interim dividend of $2,334 million, which is based on the forecast number of ordinary shares on issue at the dividend record date. Dividend payout ratios for the September 2015 half and March 2015 half year are calculated using actual dividend paid of $2,758 million and $2,379 million respectively. Dividend payout ratio is calculated by adjusting profit attributable to shareholders of the company by the amount of preference share dividends paid. |
The Directors propose that an interim dividend of 80 cents be paid on each eligible fully paid ANZ ordinary share on 1 July 2016. The proposed 2016 interim dividend will be fully franked for Australian tax purposes, and New Zealand imputation credits of NZ 10 cents per ordinary share will also be attached.
Economic profit
| Half Year
|
Movement
| |||||||||||
| Mar 16 $M |
Sep 15 $M |
Mar 15 $M |
Mar 16 v. Sep 15 |
Mar 16 v. Mar 15 | ||||||||
|
Statutory profit attributable to shareholders of the Company |
2,738 |
3,987 |
3,506 |
-31% |
-22% | |||||||
| Adjustments between statutory profit and cash profit
|
44
|
(447)
|
170
|
large
|
-74%
| |||||||
|
Cash Profit |
2,782 |
3,540 |
3,676 |
-21% |
-24% | |||||||
| Economic credit cost adjustment |
(71) | (203) | (290) | -65% | -76% | |||||||
| Imputation credits
|
568
|
663
|
657
|
-14%
|
-14%
| |||||||
|
Economic return |
3,279 |
4,000 |
4,043 |
-18% |
-19% | |||||||
| Cost of capital
|
(2,876)
|
(2,660)
|
(2,508)
|
8%
|
15%
| |||||||
| Economic profit
|
403
|
1,340
|
1,535
|
-70%
|
-74%
| |||||||
Economic profit is a risk adjusted profit measure used to evaluate business unit performance and is considered in determining the variable component of remuneration packages. This is used for internal management purposes and is not subject to review or audit by the external auditor.
Economic profit is calculated via a series of adjustments to cash profit. The economic credit cost adjustment replaces the actual credit loss charge with internal expected loss based on the average loss per annum on the portfolio over an economic cycle. The benefit of imputation credits to our shareholders is recognised, measured at 70% of Australian tax. The cost of capital is a major component of economic profit. At an ANZ Group level, this is calculated using average ordinary shareholders’ equity (excluding non-controlling interests), multiplied by a cost of capital rate (10% applied across all reporting periods) plus the dividend on preference shares. At a business unit level, capital is allocated based on economic capital, whereby higher risk businesses attract higher levels of capital. This method is designed to help drive appropriate risk management and ensure business returns align with the relevant risk. Key risks covered include credit risk, operating risk, market risk and other risks.
Economic profit decreased 74% on the March 2015 half due to a 24% decrease in cash profit and a 15% increase in cost of capital partially offset by a lower economic credit cost adjustment reflecting higher credit impairment charges.
Economic profit decreased 70% on the September 2015 half due to a 21% decrease in cash profit and an 8% increase in cost of capital partially offset by a lower economic credit cost adjustment reflecting higher credit impairment charges.
40
GROUP RESULTS
Condensed balance sheet
| As at
|
Movement
| |||||||||||
| Assets | Mar 16 $B |
Sep 15 $B |
Mar 15 $B |
Mar 16 v. Sep 15 |
Mar 16 v. Mar 15 | |||||||
| Cash / Settlement balances owed to ANZ / Collateral paid |
88.0 | 82.5 | 79.3 | 7% | 11% | |||||||
| Trading and available-for-sale assets |
100.5 | 92.7 | 89.7 | 8% | 12% | |||||||
| Derivative financial instruments |
88.7 | 85.6 | 73.6 | 4% | 21% | |||||||
| Net loans and advances1 |
561.8 | 570.2 | 558.2 | -1% | 1% | |||||||
| Investment backing policy liabilities |
34.5 | 34.8 | 36.5 | -1% | -5% | |||||||
| Other
|
21.8
|
24.1
|
22.8
|
-10%
|
-4%
| |||||||
|
Total assets
|
895.3
|
889.9
|
860.1
|
1%
|
4%
| |||||||
|
Liabilities |
||||||||||||
| Settlement balances owed by ANZ / Collateral received |
20.2 | 19.1 | 12.6 | 6% | 60% | |||||||
| Deposits and other borrowings |
578.1 | 570.8 | 567.2 | 1% | 2% | |||||||
| Derivative financial instruments |
91.7 | 81.3 | 73.2 | 13% | 25% | |||||||
| Debt issuances |
81.9 | 93.7 | 85.7 | -13% | -4% | |||||||
| Policy liabilities and external unit holder liabilities |
38.4 | 38.7 | 40.3 | -1% | -5% | |||||||
| Other
|
28.5
|
28.9
|
29.0
|
-1%
|
-2%
| |||||||
|
Total liabilities
|
838.8
|
832.5
|
808.0
|
1%
|
4%
| |||||||
|
Total equity
|
56.5
|
57.4
|
52.1
|
-2%
|
8%
| |||||||
| 1. | Loans & advances as at 30 September 2015 include Esanda Dealer Finance assets divested to Macquarie Group Limited in the March 2016 half. |
| ¡ | March 2016 v March 2015 |
| • | Cash, settlement balances and collateral paid increased by $9 billion primarily due to increased cash held by Markets ($3 billion), increased settlement balances with central banks held by Treasury ($3 billion) and increased collateral paid by Markets on derivative transactions ($2 billion). |
| • | Trading and available-for-sale assets increased $11 billion. Adjusting for foreign currency translation, the $12 billion increase is due to purchases of government and semi government securities as part of the liquidity portfolio and the reclassification of the BoT investment as an available-for- sale asset upon cessation of equity accounting. |
| • | Derivative financial assets and liabilities increased by $15 billion and $19 billion respectively as foreign exchange rate and interest rate movements resulted in higher derivative fair values. |
| • | Net loans and advances increased $4 billion. Adjusting for a $10 billion decrease due to foreign currency translation, the $14 billion increase comprised a $25 billion increase in Australia division home loans and a $7 billion increase in New Zealand term loans, partially offset by a $2 billion decrease in non-housing loans and a $16 billion decrease in Institutional lending given the strategic reorganisation of that business. |
| • | Deposits and other borrowings increased $11 billion. Adjusting for a $8 billion decrease due to foreign currency translation, the $19 billion increase comprised a $25 billion increase in interest bearing deposits across all divisions (primarily $11 billion in Australia and $7 billion in Institutional division), $6 billion growth in Group Treasury certificates of deposit, partially offset by a $10 billion decrease in term deposits mainly in Institutional. |
| • | Total equity increased $4 billion primarily due to $7 billion of profits generated over the year, $3 billion from an institutional share placement and retail share purchase plan in the 2015 September half, offset by the payment (net of reinvestment) of the 2015 interim and 2015 final dividends of $5 billion. |
¡ March 2016 v September 2015
| • | Cash, settlement balances and collateral paid increased by $5 billion. Adjusting for a decrease of $4 billion from foreign currency translation, the $9 billion increase is primarily due to increased settlement balances with central banks held by Treasury ($8 billion) and increased collateral paid held by Markets on derivative transactions ($3 billion), offset by reduced cash held by Markets ($2 billion). |
| • | Net loans and advances decreased $8 billion. Adjusting for a $7 billion decrease due to foreign currency translation, the net $1 billion decrease comprised a $12 billion increase in Australia division home loans, a $2 billion increase in New Zealand, and a $15 billion decrease in Institutional lending following a heightened focus on returns. |
| • | Deposits and other borrowings increased $7 billion. Adjusting for a $13 billion decrease due to foreign currency translation, the $20 billion increased comprised a $7 billion increase in interest bearing deposits primarily in Australia and New Zealand, $2 billion growth in Group Treasury certificates of deposit, $7 billion increase in deposits from banks in Institutional, a $5 billion increase in term deposits mainly in Australia, partly offset by a $2 billion decrease in commercial paper. |
| • | Derivative financial assets and liabilities increased by $3 billion and $10 billion respectively as foreign exchange rate and interest rate movements resulted in higher derivative fair values. |
| • | Debt issuances decreased $12 billion mainly due to a foreign currency translation impact of $9 billion and maturing debt rolling off. |
| • | Total equity decreased by $1 billion primarily due to $3 billion of profits generated over the half year, offset by the payment (net of reinvestment) of the 2015 final dividend of $3 billion and a reduction in foreign currency translation reserves of $1 billion. |
41
GROUP RESULTS
Liquidity risk
Liquidity risk is the risk that the Group is unable to meet its payment obligations as they fall due, including repaying depositors or maturing wholesale debt, or that the Group has insufficient capacity to fund increases in assets. The timing mismatch of cash flows and the related liquidity risk is inherent in all banking operations and is closely monitored by the Group and managed in accordance with the risk appetite set by the Board.
The Group’s approach to liquidity risk management incorporates two key components:
| ¡ | Scenario modelling of funding sources |
ANZ’s liquidity risk appetite is defined by the ability to meet a range of regulatory requirements and internal liquidity metrics mandated by the Board. The metrics cover a range of scenarios of varying duration and level of severity. This framework:
| • | Provides protection against shorter-term extreme market dislocations and stresses. |
| • | Maintains structural strength in the balance sheet by ensuring an appropriate amount of longer-term assets are funded with longer-term funding. |
| • | Ensures no undue timing concentrations exist in the Group’s funding profile. |
A key component of this framework is the Liquidity Coverage Ratio (LCR), which is a severe short term liquidity stress scenario mandated under APRA regulatory requirements. As part of meeting the LCR requirements, ANZ has a Committed Liquidity Facility (CLF) with the Reserve Bank of Australia (RBA). The CLF has been established as a solution to a High Quality Liquid Asset (HQLA) shortfall in the Australian marketplace and provides an alternative form of RBA-qualifying liquid assets. The total amount of the CLF available to a qualifying ADI is set annually by APRA.
| ¡ | Liquid assets |
The Group holds a portfolio of high quality unencumbered liquid assets in order to protect the Group’s liquidity position in a severely stressed environment, as well as to meet regulatory requirements. High quality liquid assets comprise three categories, with the definitions consistent with Basel 3 LCR:
| • | Highest-quality liquid assets (HQLA1): Cash, highest credit quality government, central bank or public sector securities eligible for repurchase with central banks to provide same-day liquidity. |
| • | High-quality liquid assets (HQLA2): High credit quality government, central bank or public sector securities, high quality corporate debt securities and high quality covered bonds eligible for repurchase with central banks to provide same-day liquidity. |
| • | Alternative liquid assets (ALA): Assets qualifying as collateral for the CLF and eligible securities listed by the Reserve Bank of New Zealand (RBNZ). |
The Group monitors and manages the composition of liquid assets to ensure diversification by asset class, counterparty, currency and tenor. Minimum levels of liquid assets held are set annually based on a range of ANZ specific and general market liquidity stress scenarios such that potential cash flow obligations can be met over the short to medium term, and holdings are appropriate to existing and future business activities, regulatory requirements and in line with the approved risk appetite.
| Market Values Post Discount2 | Half Year Average
|
Movement
| ||||||||
| Mar 16 $B |
Sep 15 $B |
Mar 15 $B1 |
Mar 16 v. Sep 15 |
Mar 16 v. Mar 15 | ||||||
| HQLA13 |
117.2 | 98.2 | 95.7 | 19% | 22% | |||||
| HQLA2 |
3.3 | 3.1 | 3.4 | 6% | -3% | |||||
| Internal Residential Mortgage Backed Securities (Australia)3 |
35.1 | 37.9 | 40.6 | -7% | -14% | |||||
| Internal Residential Mortgage Backed Securities (New Zealand) |
1.5 | 1.3 | 3.6 | 15% | -58% | |||||
| Other ALA4
|
18.6
|
17.4
|
13.4
|
7%
|
39%
| |||||
|
Total Liquid Assets
|
175.7
|
157.9
|
156.7
|
11%
|
12%
| |||||
| Cash flows modelled under stress scenario |
||||||||||
| Cash outflows |
181.0 | 170.2 | 176.1 | 6% | 3% | |||||
| Cash inflows
|
42.1
|
42.6
|
43.4
|
-1%
|
-3%
| |||||
| Net cash outflows
|
138.9
|
127.6
|
132.7
|
9%
|
5%
| |||||
|
Liquidity Coverage Ratio5
|
126%
|
124%
|
118%
|
2%
|
7%
| |||||
| 1. | Based on Mar 2015 quarter given LCR implementation on 1 January 2015. |
| 2. | Half year average basis, calculated as prescribed per APRA Prudential Regulatory Standard (APS 210 Liquidity) and consistent with APS 330 requirements. |
| 3. | RBA open arrangement netted down from CLF, with corresponding HQLA inflow. |
| 4. | Comprised of assets qualifying as collateral for the CLF, excluding internal RMBS, up to approved facility limit; and any liquid assets contained in the RBNZ’s Liquidity Policy - Annex: Liquidity Assets - Prudential Supervision Department Document BS13A12. |
| 5. | All currency Group LCR. |
42
GROUP RESULTS
Funding
ANZ targets a diversified funding base, avoiding undue concentrations by investor type, maturity, market source and currency.
$12.5 billion of term wholesale debt (with a remaining term greater than one year as at 31 March 2016) was issued during the half year ended 31 March 2016. The weighted average tenor of new term debt was 5.0 years (Sep 15: 4.9 years).
| The following tables show the Group’s total funding composition: | As at
|
Movement
| ||||||||||
| Mar 16 $M |
Sep 15 $M |
Mar 15 $M |
Mar 16 v. Sep 15 |
Mar 16 v. Mar 15 | ||||||||
|
Customer deposits and other liabilities1
|
||||||||||||
| Australia
|
175,772
|
169,280
|
162,587
|
4%
|
8%
| |||||||
| Institutional
|
176,126
|
183,040
|
183,345
|
-4%
|
-4%
| |||||||
| New Zealand
|
62,327
|
59,703
|
60,293
|
4%
|
3%
| |||||||
| Wealth
|
18,945
|
18,467
|
17,357
|
3%
|
9%
| |||||||
| Asia Retail & Pacific
|
19,005
|
19,455
|
17,779
|
-2%
|
7%
| |||||||
| TSO and Group Centre1
|
(5,397)
|
(5,361)
|
(5,214)
|
1%
|
4%
| |||||||
| Customer deposits
|
446,778
|
444,584
|
436,147
|
0%
|
2%
| |||||||
| Other funding liabilities2
|
16,127
|
14,346
|
12,315
|
12%
|
31%
| |||||||
| Total customer liabilities (funding)
|
462,905
|
458,930
|
448,462
|
1%
|
3%
| |||||||
| Wholesale funding3 |
||||||||||||
|
Debt issuances4 |
81,947 | 93,347 | 84,859 | -12% | -3% | |||||||
|
Subordinated debt |
17,557 | 17,009 | 16,463 | 3% | 7% | |||||||
|
Certificates of deposit |
65,077 | 63,446 | 59,646 | 3% | 9% | |||||||
|
Commercial paper |
21,065 | 22,989 | 22,729 | -8% | -7% | |||||||
|
Other wholesale borrowings5,6 |
56,391
|
44,556
|
53,625
|
27%
|
5%
| |||||||
| Total wholesale funding |
242,037
|
241,347
|
237,322
|
0%
|
2%
| |||||||
|
Shareholders’ Equity (excl. preference shares)
|
56,464
|
57,353
|
52,051
|
-2%
|
8%
| |||||||
|
Total Funding
|
761,406
|
757,630
|
737,835
|
0%
|
3%
| |||||||
| As at
|
Movement
| |||||||||||
| Mar 16 $M |
Sep 15 $M |
Mar 15 $M |
Mar 16 v. Sep 15 |
Mar 16 v. Mar 15 | ||||||||
| Funded Assets |
||||||||||||
| Other short term assets & trade finance assets7 |
68,015 |
78,879 |
87,755 |
-14% |
-22% | |||||||
|
Liquids6 |
147,419
|
135,496
|
123,835
|
9%
|
19%
| |||||||
| Short term funded assets |
215,434 |
214,375
|
211,590
|
0%
|
2%
| |||||||
| Lending & fixed assets8 |
545,972
|
543,255
|
526,245
|
1%
|
4%
| |||||||
| Total Funded Assets |
761,406
|
757,630
|
737,835
|
0%
|
3%
| |||||||
| Funding Liabilities3,4,6 |
||||||||||||
|
Other short term liabilities |
40,360 | 27,863 | 30,858 | 45% | 31% | |||||||
|
Short term funding |
65,204 | 59,850 | 60,394 | 9% | 8% | |||||||
|
Term funding < 12 months |
30,579 | 41,549 | 31,860 | -26% | -4% | |||||||
|
Other customer and central bank deposits1,9 |
87,632 | 88,288 | 101,223 | -1% | -13% | |||||||
|
Total short term funding liabilities |
223,775 | 217,550 | 224,335 | 3% | 0% | |||||||
|
Stable customer deposits1,10 |
392,150 | 387,988 | 370,331 | 1% | 6% | |||||||
|
Term funding > 12 months |
81,589 | 87,316 | 83,665 | -7% | -2% | |||||||
|
Shareholders’ equity and hybrid debt |
63,891 | 64,776 | 59,504 | -1% | 7% | |||||||
|
Total Stable Funding |
537,631 | 540,080 | 513,500 | 0% | 5% | |||||||
|
Total Funding |
761,406 | 757,630 | 737,835 | 0% | 3% | |||||||
| 1. | Includes term deposits, other deposits and an adjustment recognised in Group Centre to eliminate Wealth investments in ANZ deposit products. |
| 2. | Includes interest accruals, payables and other liabilities, provisions and net tax provisions, excluding other liabilities in Wealth. |
| 3. | Excludes liability for acceptances as they do not provide net funding. |
| 4. | Excludes term debt issued externally by Wealth which matured during the March 2016 half. |
| 5. | Includes borrowings from banks, net derivative balances, special purpose vehicles and other borrowings. |
| 6. | RBA open-repo arrangement netted down by the exchange settlement account cash balance. |
| 7. | Includes short-dated assets such as trading securities, available-for-sale securities, trade dated assets and trade finance loans. |
| 8. | Excludes trade finance loans. |
| 9. | Total customer liabilities (funding) plus Central Bank deposits less Stable customer deposits. |
| 10. | Stable customer deposits represent operational type deposits or those sourced from retail / business / corporate customers and the stable component of Other funding liabilities. |
43
GROUP RESULTS
Capital Management
| As at
| ||||||||||||||
| APRA Basel 3 | Internationally Comparable Basel 31 | |||||||||||||
| Mar 16 | Sep 15 | Mar 15 | Mar 16 | Sep 15 | Mar 15 | |||||||||
|
Capital Ratios |
||||||||||||||
|
Common Equity Tier 1 |
9.8%
|
9.6%
|
8.7%
|
14.0%
|
13.2%
|
12.1%
| ||||||||
|
Tier 1 |
11.6%
|
11.3%
|
10.6%
|
16.2%
|
15.3%
|
14.4%
| ||||||||
|
Total capital
|
13.7%
|
13.3%
|
12.6%
|
18.7%
|
17.8%
|
16.8%
| ||||||||
|
Risk weighted assets ($B)
|
388.3
|
401.9
|
386.9
|
317.8
|
332.1
|
319.3
| ||||||||
| 1. | Internationally Comparable methodology aligns with APRA’s information paper entitled International Capital Comparison Study (13 July 2015). |
APRA Basel 3 Common Equity Tier 1 (CET1) – March 2016 v September 2015
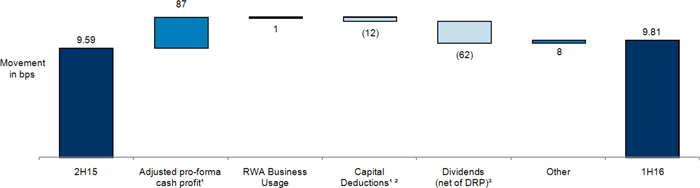
| 1. | Excludes the impact from the software capitalisation changes and impact from the Asian minority investment adjustments which have gone through Cash Profit as they are neutral on CET1. |
| 2. | Capital Deductions represents the movement in retained earnings in deconsolidated entities, capitalised software (excluding accounting changes relating to the threshold for capitalising internally generated software assets) and other intangibles in the period. |
| 3. | 9.7 million ordinary shares were issued under the Dividend Reinvestment Plan and Bonus Option Plan for the 2015 final dividend. |
| ¡ | March 2016 v September 2015 |
ANZ’s CET1 ratio increased 22 bps to 9.8% in the March 2016 half. Key drivers of the CET1 ratio were:
| • | Net organic capital generation is 76 bps or $3.1 billion. Cash profit and net RWA reduction during the half provided 88 bps to the CET1 ratio, which was partially offset by capital usage and other business capital deductions. The net RWA reduction resulted from strong balance sheet discipline and RWA reduction initiatives in the Institutional division. |
| • | Payment of the September 2015 Final Dividend (net of shares issued under the DRP) reduced the CET1 ratio by 62 bps. |
| • | Other impacts of 8 bps were mainly due to capital benefits arising from the divestment of the Esanda Dealer Finance portfolio (16 bps), partly offset by the impact from repayment of the remaining tranche of debt ($400 million) issued by ANZ Wealth Australia Limited (ANZWA) in March 2016 (-10 bps) and other net impacts from RWA measurement changes, restructuring costs, movement in non-cash earnings and net foreign currency translation. |
44
GROUP RESULTS
APRA to Internationally Comparable1 Common Equity Tier 1 (CET1) as at 31 March 2016
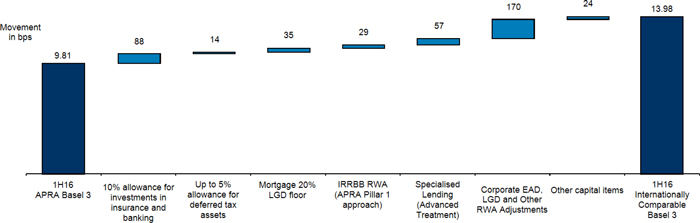
| 1. | ANZ’s interpretation of the regulations documented in the Basel Committee publications; “Basel 3: A global regulatory framework for more resilient banks and banking systems” (June 2011) and “International Convergence of Capital Measurement and Capital Standards” (June 2006). Also includes differences identified in APRA’s information paper entitled International Capital Comparison Study (13 July 2015). |
The above provides a reconciliation of the CET1 ratio under APRA’s Basel 3 prudential capital standards to Internationally Comparable Basel 3 standards. APRA views the Basel 3 reforms as a minimum requirement and hence has not incorporated some of the concessions proposed in the Basel 3 rules and has also set higher requirements in other areas. As a result, Australian banks’ Basel 3 reported capital ratios will not be directly comparable with international peers. The International Comparable Basel 3 CET1 ratio incorporates differences between APRA and both the Basel Committee Basel 3 framework (including differences identified in the March 2014 Basel Committee’s Regulatory Consistency Assessment Programme (RCAP) on Basel 3 implementation in Australia) and its application in major offshore jurisdictions.
The material differences in APRA’s Basel 3 and Internationally Comparable Basel 3 ratios include:
Deductions
| • | Investment in insurance and banking associates – APRA requires full deduction against CET1. On an Internationally Comparable basis, these investments are subject to a concessional threshold before a deduction is required. |
| • | Deferred tax assets – A full deduction is required from CET1 for deferred tax assets (DTA) relating to temporary differences. On an Internationally Comparable basis, this is first subject to a concessional threshold before the deduction is required. |
Risk Weighted Assets (RWA)
| • | IRRBB RWA – APRA requires inclusion of Interest Rate Risk in the Banking Book (IRRBB) within the RWA base for the CET1 ratio calculation. This is not required on an Internationally Comparable basis. |
| • | Mortgages RWA – APRA imposes a floor of 20% on the downturn Loss Given Default (LGD) used in credit RWA calculations for residential mortgages. The Internationally Comparable Basel 3 framework only requires downturn LGD floor of 10%. |
| • | Specialised Lending - APRA requires the supervisory slotting approach be used in determining credit RWA for specialised lending exposures. The Internationally Comparable basis allows for the advanced internal ratings based approach to be used when calculating RWA for these exposures. |
| • | Unsecured Corporate Lending LGD – Adjustment to align ANZ’s unsecured corporate lending LGD to 45% to be consistent with banks in other jurisdictions. The 45% LGD rate is also used in the Foundation Internal Ratings-Based approach (FIRB). |
| • | Undrawn Corporate Lending Exposure at Default (EAD) – To adjust ANZ’s credit conversion factors (CCF) for undrawn corporate loan commitments to 75% (used in FIRB approach) to align with banks in other jurisdictions. |
45
GROUP RESULTS
Leverage Ratio
At 31 March 2016, the Group’s APRA Leverage Ratio was 5.1% which is above the 3% minimum currently proposed by the BCBS. APRA has not finalised a minimum leverage ratio requirement for Australians ADIs. The following table summarises the Group’s Leverage Ratio calculation:
| As at
|
Movement
| |||||||
| Mar 16 $M |
Sep 15 $M |
Mar 16 v. Sep 15 | ||||||
| Tier 1 Capital (net of capital deductions) |
45,062 | 45,484 | -1% | |||||
| On-balance sheet exposures (excluding derivatives and securities financing transaction exposures) |
733,935 | 733,756 | 0% | |||||
| Derivative exposures |
30,542 | 38,115 | -20% | |||||
| Securities financing transaction (SFT) exposures |
21,420 | 17,297 | 24% | |||||
| Other off-balance sheet exposures
|
102,953
|
107,817
|
-5%
| |||||
|
Total exposure measure
|
888,850
|
896,985
|
-1%
| |||||
|
APRA Leverage Ratio1
|
5.1%
|
5.1%
|
0%
| |||||
|
Internationally Comparable Leverage Ratio1
|
5.7%
|
5.7%
|
0%
| |||||
| 1. | Leverage ratios include Additional Tier 1 securities subject to Basel 3 transitional relief, net of any transitional adjustments. |
| ¡ | March 2016 v September 2015 |
ANZ’s leverage ratio remained stable during the March 2016 half. An increase in the leverage ratio arising from capital generation from cash earnings were offset by the impact from payment of the 2015 final dividend (net of DRP) and increased holdings of High Quality Liquid Assets (HQLA) which contributed to growth in the exposure measure.
Other regulatory developments
| ¡ | Financial System Inquiry (FSI) |
The FSI final report into Australia’s financial system was released on 7 December 2014. The contents of the final FSI report are wide-ranging and key recommendations that may have an impact on regulatory capital levels include:
| ¡ | Setting capital standards ensuring that capital ratios of Australian Authorised Deposit-taking Institutions (ADIs) are unquestionably strong; |
| ¡ | Raising the average internal ratings-based (IRB) mortgage risk weight to narrow the difference between average mortgage risk-weight for ADIs using IRB models and those using standardised risk weights in order to increase competition in mortgage lending; |
| ¡ | Implementing a framework for minimum loss absorbing and recapitalisation capacity in line with emerging international practice; |
| ¡ | Developing a common reporting template that improves the transparency and comparability of capital ratios of ADIs; and |
| ¡ | Introducing a leverage ratio that acts as a backstop to ADI’s risk-based capital requirements, in line with Basel framework. |
APRA responded to key recommendations of the FSI inquiry in July 2015 with the following announcements:
| ¡ | APRA released an information paper entitled “International capital comparison study” (“APRA Study”) which supports the FSI’s recommendation that the capital ratios of ADIs should be unquestionably strong. The APRA Study confirmed that the major ADIs are well-capitalised and acknowledged the challenges and complexity of comparing capital ratios between ADIs and international peers given the varied national discretions exercised by some jurisdictions when implementing the global capital adequacy framework (Basel framework). The APRA Study did not confirm the definition of ‘unquestionably strong’ and stated that APRA does not intend to directly link Australian capital requirements to a continually moving benchmark. The results of the APRA Study will only inform but will not determine APRA’s approach for setting capital adequacy requirements. |
| ¡ | Effective from 1 July 2016, APRA requires increased capital requirements for Australian residential mortgage exposures by ADIs accredited to use the internal ratings-based (IRB) approach to credit risk. These new requirements are expected to increase the average risk weighting for mortgage portfolios to approximately 25%. The impact on ANZ is an approximate 60 bps reduction in CET1 on implementation of this change. In response to this, ANZ raised $3.2 billion of ordinary share capital via a fully underwritten Institutional Placement in August 2015 ($2.5 billion raised) and a Share Purchase Plan offer to eligible Australian and New Zealand shareholders in September 2015 ($0.7 billion raised). APRA has indicated that further changes may be required once greater clarity on the deliberations of the Basel Committee is available, particularly in relation to revisions to the standardised approach for credit risk and capital floors. |
The Australian Government released its response to the FSI in October 2015 and it agrees with all of the above capital-related recommendations. The Australian Government supports and endorses APRA to implement the recommendations, including the initial actions to raise the capital requirements for Australian residential mortgage exposures and to take additional steps to ensure that the major banks have unquestionably strong capital ratios by the end of 2016.
Apart from the July 2015 announcements, APRA has not made any determination on the other key recommendations to date. Therefore, the final outcomes from the FSI, including any impacts and the timing of these impacts on ANZ, remain uncertain.
In addition, there are several Government inquiries and proposals for new inquiries, the impact of which is indeterminate at this stage.
46
GROUP RESULTS
| ¡ | Liquidity Ratios |
The Basel 3 Liquidity changes include the introduction of two liquidity ratios to measure liquidity risk: (i) the Liquidity Coverage Ratio (LCR) which became effective on 1 January 2015 and (ii) the Net Stable Funding Ratio (NSFR).
The final Basel 3 revised NSFR standard was released in October 2014. APRA released a consultation paper in March 2016 which confirmed NSFR will become a minimum requirement on 1 January 2018. As part of managing future liquidity requirements, ANZ monitors the NSFR in its internal reporting and believe the Group is well placed to meet this requirement by the implementation date.
| ¡ | Domestic Systemically Important Bank (D-SIB) Framework |
APRA’s D-SIB requirements for ANZ and the other three major Australian banks deemed to be domestic systemically important banks (Australian D-SIBs) came into effect on 1 January 2016. As a result, the Capital Conservation Buffer (CCB) requirements for the Australian D-SIBs have increased by 100 bps, further strengthening their capital position. ANZ’s current position as at 31 March 2016 is already in excess of APRA’s requirements including the D-SIB overlay.
| ¡ | Composition of Level 2 ADI Group |
In May 2014, APRA provided further clarification to the definition of the Level 2 Authorised Deposit-Taking Institution (ADI) group, where subsidiary intermediate holding companies are now considered part of the Level 2 Group.
The above clarification results in the phasing out, over time, of capital benefits arising from debt issued by its subsidiary, ANZ Wealth Australia Limited (ANZWA). Following the repayment of the last tranche of the ANZWA debt ($400 million or approximately 10 bps on CET1) in March 2016, ANZ had fully repaid all debt affected by this change as at 31 March 2016. APRA is still providing implementation guidance on certain aspects of the changes with any impact on ANZ not expected to be material.
| ¡ | Level 3 Conglomerates (“Level 3”) |
In March 2016, APRA announced a revised implementation timetable for the Level 3 framework taking into consideration the Australian Government response to the FSI recommendations. The Level 3 framework is meant to supervise Conglomerates Groups (Level 3) and includes updated Level 3 capital adequacy standards which will regulate a bancassurance group such as ANZ as a single economic entity with minimum capital requirements and additional monitoring on risk exposure levels.
APRA has deferred finalising the capital components of the Level 3 framework (minimum capital requirements for Conglomerates Group) until 2019 at the earliest, to allow the final form of the capital requirements arising from FSI recommendations and international initiatives that are already in progress to be determined.
The non-capital components of the Level 3 framework however, covering group governance, risk exposures, intragroup transactions and other risk management and compliance requirements will become effective on 1 July 2017. As part of the March 2016 announcement, APRA has released updated draft prudential standards in relation to these requirements and is currently consulting with the industry on the changes. ANZ is not expecting any material impact on its operations based upon the current draft of these standards.
| ¡ | Current Proposals from the Basel Committee on Banking Supervision on Risk Weighted Assets (RWA) |
As part of BCBS agenda to simplify RWA measurement and reduce their variability amongst banks, the BCBS has issued a number of consultation documents associated with:
| • | Standardised approach to RWA for credit risk; |
| • | Revisions to Standardised Measurement Approach to Operational Risk; |
| • | Fundamental Review of the Trading Book; |
| • | Interest Rate Risk in the Banking Book; |
| • | Framework on imposition of capital floors based on standardised RWA approaches; and |
| • | Additional constraints on the use of internal models in Credit RWA. |
The impact of any changes arising from the above on ANZ cannot be accurately determined until BCBS and APRA finalise their proposals.
| ¡ | Basel 3 Securitisation Framework |
In November 2015, APRA released a second consultation paper outlining proposed revisions to the prudential framework for securitisation (APS 120). The release of this paper follows BCBS finalisation of the revised Basel 3 securitisation framework in December 2014. The revised framework is proposed to take effect from January 2018. The impact of any changes on ANZ arising from a revised APS 120 standard cannot be determined until APRA finalises their proposal.
47
GROUP RESULTS
This page has been left blank intentionally
48
DIVISIONAL RESULTS
CONTENTS
Section 5 – Divisional Results
Divisional performance
Australia
Institutional
New Zealand
Wealth
Asia Retail & Pacific
Technology, Services and Operations (TSO) and Group Centre
49
DIVISIONAL RESULTS
Divisional Performance
During the March 2016 half, the Group announced changes to the organisation’s structure to better meet the needs of our retail, commercial and institutional customers. As a result of these organisational changes there are six reported divisions: Australia, New Zealand, Institutional, Asia Retail & Pacific, Wealth and Technology, Services & Operations (“TSO”) and Group Centre. These divisions were created by removing the Asia Retail & Pacific business from the former International & Institutional Banking (“IIB”) division, and repositioning minority investments in Asia from IIB to the Group Centre. The residual IIB business has been renamed Institutional.
The Wealth changes announced during the March 2016 half will not take effect until 1 April 2016. For further information on the composition of the divisions refer to the Definitions on page 150.
Other than those described above, there have been no significant structural changes. However, certain prior period comparatives have been restated to align with current period presentation as a result of changes to customer segmentation and the continued realignment of support functions.
The Divisional Results section is reported on a cash profit basis.
March 2016 Half Year
| AUD M | Australia | Institutional | New Zealand | Wealth | Asia Retail & Pacific |
TSO & Group Centre |
Group | |||||||||||||||||||||
| Net interest income |
4,038 | 1,802 | 1,172 | 101 | 328 | 127 | 7,568 | |||||||||||||||||||||
| Other operating income |
594 | 911 | 201 | 779 | 231 | 32 | 2,748 | |||||||||||||||||||||
| Operating income |
4,632 | 2,713 | 1,373 | 880 | 559 | 159 | 10,316 | |||||||||||||||||||||
| Operating expenses |
(1,665) | (1,510) | (527) | (521) | (401) | (855) | (5,479) | |||||||||||||||||||||
| Profit before credit impair’t and income tax |
2,967 | 1,203 | 846 | 359 | 158 | (696) | 4,837 | |||||||||||||||||||||
| Credit impairment (charge)/release |
(462) | (323) | (42) | - | (91) | - | (918) | |||||||||||||||||||||
| Profit before income tax |
2,505 | 880 | 804 | 359 | 67 | (696) | 3,919 | |||||||||||||||||||||
| Income tax expense and non-controlling interests |
(752) | (248) | (226) | (98) | (14) | 201 | (1,137) | |||||||||||||||||||||
| Cash profit/(loss) |
1,753 | 632 | 578 | 261 | 53 | (495) | 2,782 | |||||||||||||||||||||
| March 2015 Half Year |
||||||||||||||||||||||||||||
| AUD M | Australia | Institutional | New Zealand | Wealth | Asia Retail & Pacific |
TSO & Group Centre |
Group | |||||||||||||||||||||
| Net interest income |
3,730 | 1,741 | 1,162 | 89 | 291 | 125 | 7,138 | |||||||||||||||||||||
| Other operating income |
580 | 1,229 | 183 | 762 | 221 | 82 | 3,057 | |||||||||||||||||||||
| Operating income |
4,310 | 2,970 | 1,345 | 851 | 512 | 207 | 10,195 | |||||||||||||||||||||
| Operating expenses |
(1,556) | (1,385) | (539) | (484) | (374) | (265) | (4,603) | |||||||||||||||||||||
| Profit before credit impair’t and income tax |
2,754 | 1,585 | 806 | 367 | 138 | (58) | 5,592 | |||||||||||||||||||||
| Credit impairment (charge)/release |
(395) | (88) | (19) | 1 | (10) | 1 | (510) | |||||||||||||||||||||
| Profit before income tax |
2,359 | 1,497 | 787 | 368 | 128 | (57) | 5,082 | |||||||||||||||||||||
| Income tax expense and non-controlling interests |
(709) | (426) | (221) | (105) | (29) | 84 | (1,406) | |||||||||||||||||||||
| Cash profit |
1,650 | 1,071 | 566 | 263 | 99 | 27 | 3,676 | |||||||||||||||||||||
| March 2016 Half Year vs March 2015 Half Year |
| |||||||||||||||||||||||||||
| AUD M | Australia | Institutional | New Zealand | Wealth | Asia Retail & Pacific |
TSO & Group Centre |
Group | |||||||||||||||||||||
| Net interest income |
8% | 4% | 1% | 13% | 13% | 2% | 6% | |||||||||||||||||||||
| Other operating income |
2% | -26% | 10% | 2% | 5% | -61% | -10% | |||||||||||||||||||||
| Operating income |
7% | -9% | 2% | 3% | 9% | -23% | 1% | |||||||||||||||||||||
| Operating expenses |
7% | 9% | -2% | 8% | 7% | large | 19% | |||||||||||||||||||||
| Profit before credit impair’t and income tax |
8% | -24% | 5% | -2% | 14% | large | -14% | |||||||||||||||||||||
| Credit impairment (charge)/release |
17% | large | large | -100% | large | -100% | 80% | |||||||||||||||||||||
| Profit before income tax |
6% | -41% | 2% | -2% | -48% | large | -23% | |||||||||||||||||||||
| Income tax expense and non-controlling interests |
6% | -42% | 2% | -7% | -52% | large | -19% | |||||||||||||||||||||
| Cash profit |
6% | -41% | 2% | -1% | -46% | large | -24% | |||||||||||||||||||||
50
DIVISIONAL RESULTS
Cash profit by division – March 2016 v March 2015
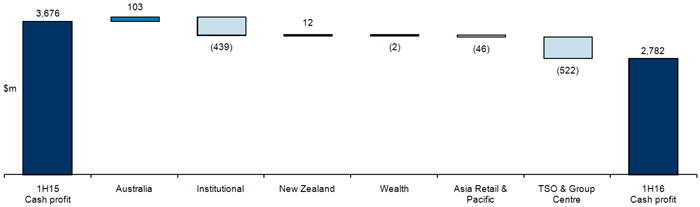
| March 2016 Half Year | ||||||||||||||||||||||||||||
| AUD M | Australia | Institutional | New Zealand | Wealth | Asia Retail & Pacific |
TSO & Group Centre |
Group | |||||||||||||||||||||
| Net interest income |
4,038 | 1,802 | 1,172 | 101 | 328 | 127 | 7,568 | |||||||||||||||||||||
| Other operating income |
594 | 911 | 201 | 779 | 231 | 32 | 2,748 | |||||||||||||||||||||
| Operating income |
4,632 | 2,713 | 1,373 | 880 | 559 | 159 | 10,316 | |||||||||||||||||||||
| Operating expenses |
(1,665 | ) | (1,510 | ) | (527 | ) | (521 | ) | (401 | ) | (855 | ) | (5,479 | ) | ||||||||||||||
| Profit before credit impairment and income tax |
2,967 | 1,203 | 846 | 359 | 158 | (696 | ) | 4,837 | ||||||||||||||||||||
| Credit impairment (charge)/release |
(462 | ) | (323 | ) | (42 | ) | - | (91 | ) | - | (918 | ) | ||||||||||||||||
| Profit before income tax |
2,505 | 880 | 804 | 359 | 67 | (696 | ) | 3,919 | ||||||||||||||||||||
| Income tax expense and non-controlling interests |
(752 | ) | (248 | ) | (226 | ) | (98 | ) | (14 | ) | 201 | (1,137 | ) | |||||||||||||||
| Cash profit/(loss) |
1,753 | 632 | 578 | 261 | 53 | (495 | ) | 2,782 | ||||||||||||||||||||
| September 2015 Half Year |
||||||||||||||||||||||||||||
| AUD M | Australia | Institutional | New Zealand | Wealth | Asia Retail & Pacific |
TSO & Group Centre |
Group | |||||||||||||||||||||
| Net interest income |
3,897 | 1,844 | 1,155 | 91 | 314 | 177 | 7,478 | |||||||||||||||||||||
| Other operating income |
606 | 948 | 185 | 790 | 236 | 99 | 2,864 | |||||||||||||||||||||
| Operating income |
4,503 | 2,792 | 1,340 | 881 | 550 | 276 | 10,342 | |||||||||||||||||||||
| Operating expenses |
(1,618 | ) | (1,425 | ) | (525 | ) | (481 | ) | (395 | ) | (331 | ) | (4,775 | ) | ||||||||||||||
| Profit before credit impairment and income tax |
2,885 | 1,367 | 815 | 400 | 155 | (55 | ) | 5,567 | ||||||||||||||||||||
| Credit impairment (charge)/release |
(458 | ) | (111 | ) | (36 | ) | (1 | ) | (87 | ) | (2 | ) | (695 | ) | ||||||||||||||
| Profit before income tax |
2,427 | 1,256 | 779 | 399 | 68 | (57 | ) | 4,872 | ||||||||||||||||||||
| Income tax expense and non-controlling interests |
(721 | ) | (363 | ) | (218 | ) | (53 | ) | (23 | ) | 46 | (1,332 | ) | |||||||||||||||
| Cash profit/(loss) |
1,706 | 893 | 561 | 346 | 45 | (11 | ) | 3,540 | ||||||||||||||||||||
| March 2016 Half Year vs September 2015 Half Year |
| |||||||||||||||||||||||||||
| AUD M | Australia | Institutional | New Zealand | Wealth | Asia Retail & Pacific |
TSO & Group Centre |
Group | |||||||||||||||||||||
| Net interest income |
4% | -2% | 1% | 11% | 4% | -28% | 1% | |||||||||||||||||||||
| Other operating income |
-2% | -4% | 9% | -1% | -2% | -68% | -4% | |||||||||||||||||||||
| Operating income |
3% | -3% | 2% | 0% | 2% | -42% | 0% | |||||||||||||||||||||
| Operating expenses |
3% | 6% | 0% | 8% | 2% | large | 15% | |||||||||||||||||||||
| Profit before credit impairment and income tax |
3% | -12% | 4% | -10% | 2% | large | -13% | |||||||||||||||||||||
| Credit impairment (charge)/release |
1% | large | 17% | -100% | 5% | -100% | 32% | |||||||||||||||||||||
| Profit before income tax |
3% | -30% | 3% | -10% | -1% | large | -20% | |||||||||||||||||||||
| Income tax expense and non-controlling interests |
4% | -32% | 4% | 85% | -39% | large | -15% | |||||||||||||||||||||
| Cash profit |
3% | -29% | 3% | -25% | 18% | large | -21% | |||||||||||||||||||||
51
DIVISIONAL RESULTS
Australia
Fred Ohlsson
Cash profit – March 2016 Half Year v March 2015 Half Year
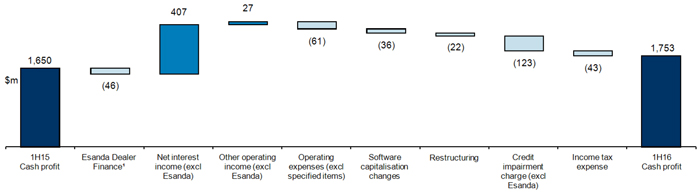
| 1. | The Esanda Dealer Finance divestment had a negative impact of $46 million on Australia division’s profit before income tax. This amount is comprised of -$99 million of net interest income, -$13 million of other operating income, $10 million of operating expenses and $56 million of credit impairment charges. Refer to page 58 for further details. |
52
DIVISIONAL RESULTS
Australia
Fred Ohlsson
| Half Year | Movement | |||||||||||||||||||||
| Mar 16 $M |
Sep 15 $M |
Mar 15 $M |
Mar 16 v. Sep 15 |
Mar 16 |
||||||||||||||||||
| Net interest income |
4,038 | 3,897 | 3,730 | 4% | 8% | |||||||||||||||||
| Other operating income |
594 | 606 | 580 | -2% | 2% | |||||||||||||||||
| Operating income |
4,632 | 4,503 | 4,310 | 3% | 7% | |||||||||||||||||
| Operating expenses |
(1,665 | ) | (1,618 | ) | (1,556 | ) | 3% | 7% | ||||||||||||||
| Profit before credit impairment and income tax |
2,967 | 2,885 | 2,754 | 3% | 8% | |||||||||||||||||
| Credit impairment charge |
(462 | ) | (458 | ) | (395 | ) | 1% | 17% | ||||||||||||||
| Profit before income tax |
2,505 | 2,427 | 2,359 | 3% | 6% | |||||||||||||||||
| Income tax expense and non-controlling interests |
(752 | ) | (721 | ) | (709 | ) | 4% | 6% | ||||||||||||||
| Cash profit |
1,753 | 1,706 | 1,650 | 3% | 6% | |||||||||||||||||
| Consisting of: |
||||||||||||||||||||||
| Retail |
1,169 | 1,080 | 981 | 8% | 19% | |||||||||||||||||
| Corporate & Commercial Banking |
584 | 626 | 669 | -7% | -13% | |||||||||||||||||
| Cash profit |
1,753 | 1,706 | 1,650 | 3% | 6% | |||||||||||||||||
| Balance Sheet |
||||||||||||||||||||||
| Net loans & advances |
320,023 | 313,672 | 297,642 | 2% | 8% | |||||||||||||||||
| Other external assets |
3,060 | 2,911 | 2,885 | 5% | 6% | |||||||||||||||||
| External assets |
323,083 | 316,583 | 300,527 | 2% | 8% | |||||||||||||||||
| Customer deposits |
175,772 | 169,280 | 162,587 | 4% | 8% | |||||||||||||||||
| Other external liabilities |
11,354 | 11,408 | 11,422 | 0% | -1% | |||||||||||||||||
| External liabilities |
187,126 | 180,688 | 174,009 | 4% | 8% | |||||||||||||||||
| Risk weighted assets |
129,168 | 128,428 | 116,386 | 1% | 11% | |||||||||||||||||
| Average gross loans and advances |
317,542 | 306,820 | 294,357 | 3% | 8% | |||||||||||||||||
| Average deposits and other borrowings |
172,779 | 164,732 | 162,688 | 5% | 6% | |||||||||||||||||
| Ratios |
||||||||||||||||||||||
| Return on assets |
1.10% | 1.11% | 1.12% | |||||||||||||||||||
| Net interest margin |
2.54% | 2.53% | 2.54% | |||||||||||||||||||
| Operating expenses to operating income |
35.9% | 35.9% | 36.1% | |||||||||||||||||||
| Operating expenses to average assets |
1.04% | 1.05% | 1.06% | |||||||||||||||||||
| Individual credit impairment charge/(release) |
429 | 427 | 334 | 0% | 28% | |||||||||||||||||
| Individual credit impairment charge/(release) as a % of average GLA |
0.27% | 0.28% | 0.23% | |||||||||||||||||||
| Collective credit impairment charge/(release) |
33 | 31 | 61 | 6% | -46% | |||||||||||||||||
| Collective credit impairment charge/(release) as a % of average GLA |
0.02% | 0.02% | 0.04% | |||||||||||||||||||
| Gross impaired assets |
1,093 | 1,193 | 1,245 | -8% | -12% | |||||||||||||||||
| Gross impaired assets as a % of GLA |
0.34% | 0.38% | 0.42% | |||||||||||||||||||
| Total full time equivalent staff (FTE) |
8,791 | 8,766 | 9,018 | 0% | -3% | |||||||||||||||||
53
DIVISIONAL RESULTS
Australia
Fred Ohlsson
| Individual credit impairment charge/(release) | Half Year | Movement | ||||||||||||||||||||
|
Mar 16 |
Sep 15 |
Mar 15 |
Mar 16 |
Mar 16 |
||||||||||||||||||
| Retail |
200 | 196 | 158 | 2% | 27% | |||||||||||||||||
| Home Loans |
17 | 10 | 6 | 70% | large | |||||||||||||||||
| Cards and Personal Loans |
172 | 174 | 144 | -1% | 19% | |||||||||||||||||
| Deposits and Payments1 |
11 | 12 | 8 | -8% | 38% | |||||||||||||||||
| Corporate & Commercial Banking |
229 | 231 | 176 | -1% | 30% | |||||||||||||||||
| Corporate Banking |
19 | - | (18) | n/a | large | |||||||||||||||||
| Esanda |
44 | 93 | 100 | -53% | -56% | |||||||||||||||||
| Regional Business Banking |
53 | 35 | 20 | 51% | large | |||||||||||||||||
| Business Banking |
20 | 22 | 24 | -9% | -17% | |||||||||||||||||
| Small Business Banking |
93 | 81 | 50 | 15% | 86% | |||||||||||||||||
| Individual credit impairment charge |
429 | 427 | 334 | 0% | 28% | |||||||||||||||||
| Collective credit impairment charge/(release) | Half Year | Movement | ||||||||||||||||||||
|
Mar 16 |
Sep 15 |
Mar 15 |
Mar 16 |
Mar 16 |
||||||||||||||||||
| Retail |
23 | 7 | 37 | large | -38% | |||||||||||||||||
| Home Loans |
15 | 15 | 11 | 0% | 36% | |||||||||||||||||
| Cards and Personal Loans |
5 | (12) | 25 | large | -80% | |||||||||||||||||
| Deposits and Payments2 |
3 | 4 | 1 | -25% | large | |||||||||||||||||
| Corporate & Commercial Banking |
10 | 24 | 24 | -58% | -58% | |||||||||||||||||
| Corporate Banking |
- | 17 | (29) | -100% | -100% | |||||||||||||||||
| Esanda |
2 | (6) | 27 | large | -93% | |||||||||||||||||
| Regional Business Banking |
(3) | (6) | 12 | -50% | large | |||||||||||||||||
| Business Banking |
3 | 9 | (1) | -67% | large | |||||||||||||||||
| Small Business Banking |
8 | 10 | 15 | -20% | -47% | |||||||||||||||||
| Collective credit impairment charge |
33 | 31 | 61 | 6% | -46% | |||||||||||||||||
| Total credit impairment charge |
462 | 458 | 395 | 1% | 17% | |||||||||||||||||
| 1. | Represents individual credit impairment charge/(release) on Overdraft balances. |
| 2. | Represents collective credit impairment charge/(release) on Overdraft balances. |
54
DIVISIONAL RESULTS
Australia
Fred Ohlsson
| Net loans and advances | Half Year | Movement | ||||||||||||||||||||
|
Mar 16 |
Sep 15 |
Mar 15 |
Mar 16 |
Mar 16 |
||||||||||||||||||
| Retail |
254,103 | 242,333 | 229,211 | 5% | 11% | |||||||||||||||||
| Home Loans |
242,861 | 231,206 | 217,977 | 5% | 11% | |||||||||||||||||
| Cards and Personal Loans |
11,151 | 11,049 | 11,139 | 1% | 0% | |||||||||||||||||
| Deposits and Payments1 |
91 | 78 | 95 | 17% | -4% | |||||||||||||||||
| Corporate & Commercial Banking |
65,920 | 71,339 | 68,431 | -8% | -4% | |||||||||||||||||
| Corporate Banking |
12,800 | 12,996 | 12,024 | -2% | 6% | |||||||||||||||||
| Esanda2 |
8,802 | 15,917 | 15,776 | -45% | -44% | |||||||||||||||||
| Regional Business Banking |
13,879 | 13,827 | 13,142 | 0% | 6% | |||||||||||||||||
| Business Banking |
15,375 | 14,249 | 14,004 | 8% | 10% | |||||||||||||||||
| Small Business Banking |
15,064 | 14,350 | 13,485 | 5% | 12% | |||||||||||||||||
| Net loans and advances |
320,023 | 313,672 | 297,642 | 2% | 8% | |||||||||||||||||
| Customer deposits | Half Year | Movement | ||||||||||||||||||||
|
Mar 16 |
Sep 15 |
Mar 15 |
Mar 16 v. Sep 15 |
Mar 16 v. Mar 15 |
||||||||||||||||||
| Retail |
123,085 | 118,433 | 112,906 | 4% | 9% | |||||||||||||||||
| Home Loans3 |
23,619 | 21,861 | 19,211 | 8% | 23% | |||||||||||||||||
| Cards and Personal Loans |
228 | 258 | 230 | -12% | -1% | |||||||||||||||||
| Deposits and Payments |
99,238 | 96,314 | 93,465 | 3% | 6% | |||||||||||||||||
| Corporate & Commercial Banking |
52,687 | 50,847 | 49,681 | 4% | 6% | |||||||||||||||||
| Corporate Banking4 |
3,067 | 3,162 | 3,047 | -3% | 1% | |||||||||||||||||
| Regional Business Banking |
6,209 | 5,739 | 5,648 | 8% | 10% | |||||||||||||||||
| Business Banking |
10,941 | 10,157 | 10,134 | 8% | 8% | |||||||||||||||||
| Small Business Banking |
32,470 | 31,789 | 30,852 | 2% | 5% | |||||||||||||||||
| Customer deposits |
175,772 | 169,280 | 162,587 | 4% | 8% | |||||||||||||||||
| 1. | Net loans and advances for the Deposits and Payments business represent amounts in overdraft. |
| 2. | Includes $766 million of Esanda Dealer Finance bailment facilities which are due to migrate to Macquarie during the third quarter of 2016. |
| 3. | Customer deposit amounts for the Home Loans business represent balances in offset accounts. |
| 4. | Institutional division also holds $12 billion of Corporate Banking deposits. |
55
DIVISIONAL RESULTS
Australia
Fred Ohlsson
March 2016 Half Year
| AUD M | Retail | C&CB1 | Australia Total |
|||||||||
| Net interest income |
2,665 | 1,373 | 4,038 | |||||||||
| Other operating income |
381 | 213 | 594 | |||||||||
| Operating income |
3,046 | 1,586 | 4,632 | |||||||||
| Operating expenses |
(1,154) | (511) | (1,665) | |||||||||
| Profit before credit impairment and income tax |
1,892 | 1,075 | 2,967 | |||||||||
| Credit impairment (charge)/release |
(223) | (239) | (462) | |||||||||
| Profit before income tax |
1,669 | 836 | 2,505 | |||||||||
| Income tax expense and non-controlling interests |
(500) | (252) | (752) | |||||||||
| Cash profit |
1,169 | 584 | 1,753 | |||||||||
| Individual credit impairment charge/(release) |
200 | 229 | 429 | |||||||||
| Collective credit impairment charge/(release) |
23 | 10 | 33 | |||||||||
| Net loans & advances |
254,103 | 65,920 | 320,023 | |||||||||
| Customer deposits |
123,085 | 52,687 | 175,772 | |||||||||
| Risk weighted assets |
64,546 | 64,622 | 129,168 | |||||||||
| March 2015 Half Year |
||||||||||||
| Net interest income |
2,278 | 1,452 | 3,730 | |||||||||
| Other operating income |
364 | 216 | 580 | |||||||||
| Operating income |
2,642 | 1,668 | 4,310 | |||||||||
| Operating expenses |
(1,046) | (510) | (1,556) | |||||||||
| Profit before credit impairment and income tax |
1,596 | 1,158 | 2,754 | |||||||||
| Credit impairment (charge)/release |
(195) | (200) | (395) | |||||||||
| Profit before income tax |
1,401 | 958 | 2,359 | |||||||||
| Income tax expense and non-controlling interests |
(420) | (289) | (709) | |||||||||
| Cash profit |
981 | 669 | 1,650 | |||||||||
| Individual credit impairment charge/(release) |
158 | 176 | 334 | |||||||||
| Collective credit impairment charge/(release) |
37 | 24 | 61 | |||||||||
| Net loans & advances |
229,211 | 68,431 | 297,642 | |||||||||
| Customer deposits |
112,906 | 49,681 | 162,587 | |||||||||
| Risk weighted assets |
57,310 | 59,076 | 116,386 | |||||||||
| March 2016 Half Year vs March 2015 Half Year |
||||||||||||
| Net interest income |
17% | -5% | 8% | |||||||||
| Other operating income |
5% | -1% | 2% | |||||||||
| Operating income |
15% | -5% | 7% | |||||||||
| Operating expenses |
10% | 0% | 7% | |||||||||
| Profit before credit impairment and income tax |
19% | -7% | 8% | |||||||||
| Credit impairment (charge)/release |
14% | 20% | 17% | |||||||||
| Profit before income tax |
19% | -13% | 6% | |||||||||
| Income tax expense and non-controlling interests |
19% | -13% | 6% | |||||||||
| Cash profit |
19% | -13% | 6% | |||||||||
| Individual credit impairment charge/(release) |
27% | 30% | 28% | |||||||||
| Collective credit impairment charge/(release) |
-38% | -58% | -46% | |||||||||
| Net loans & advances |
11% | -4% | 8% | |||||||||
| Customer deposits |
9% | 6% | 8% | |||||||||
| Risk weighted assets |
13% | 9% | 11% | |||||||||
| 1. | The March 2016 half includes the contribution from Esanda Dealer Finance portfolio to the date of divestment which was substantially completed by 31 December 2015. |
56
DIVISIONAL RESULTS
Australia
Fred Ohlsson
March 2016 Half Year
| AUD M | Retail | C&CB1 | Australia Total |
|||||||||
| Net interest income |
2,665 | 1,373 | 4,038 | |||||||||
| Other operating income |
381 | 213 | 594 | |||||||||
| Operating income |
3,046 | 1,586 | 4,632 | |||||||||
| Operating expenses |
(1,154) | (511) | (1,665) | |||||||||
| Profit before credit impairment and income tax |
1,892 | 1,075 | 2,967 | |||||||||
| Credit impairment (charge)/release |
(223) | (239) | (462) | |||||||||
| Profit before income tax |
1,669 | 836 | 2,505 | |||||||||
| Income tax expense and non-controlling interests |
(500) | (252) | (752) | |||||||||
| Cash profit |
1,169 | 584 | 1,753 | |||||||||
| Individual credit impairment charge/(release) |
200 | 229 | 429 | |||||||||
| Collective credit impairment charge/(release) |
23 | 10 | 33 | |||||||||
| Net loans & advances |
254,103 | 65,920 | 320,023 | |||||||||
| Customer deposits |
123,085 | 52,687 | 175,772 | |||||||||
| Risk weighted assets |
64,546 | 64,622 | 129,168 | |||||||||
| September 2015 Half Year |
||||||||||||
| Net interest income |
2,439 | 1,458 | 3,897 | |||||||||
| Other operating income |
382 | 224 | 606 | |||||||||
| Operating income |
2,821 | 1,682 | 4,503 | |||||||||
| Operating expenses |
(1,088) | (530) | (1,618) | |||||||||
| Profit before credit impairment and income tax |
1,733 | 1,152 | 2,885 | |||||||||
| Credit impairment (charge)/release |
(203) | (255) | (458) | |||||||||
| Profit before income tax |
1,530 | 897 | 2,427 | |||||||||
| Income tax expense and non-controlling interests |
(450) | (271) | (721) | |||||||||
| Cash profit |
1,080 | 626 | 1,706 | |||||||||
| Individual credit impairment charge/(release) |
196 | 231 | 427 | |||||||||
| Collective credit impairment charge/(release) |
7 | 24 | 31 | |||||||||
| Net loans & advances |
242,333 | 71,339 | 313,672 | |||||||||
| Customer deposits |
118,433 | 50,847 | 169,280 | |||||||||
| Risk weighted assets |
61,878 | 66,550 | 128,428 | |||||||||
| March 2016 Half Year vs September 2015 Half Year |
||||||||||||
| Net interest income |
9% | -6% | 4% | |||||||||
| Other operating income |
0% | -5% | -2% | |||||||||
| Operating income |
8% | -6% | 3% | |||||||||
| Operating expenses |
6% | -4% | 3% | |||||||||
| Profit before credit impairment and income tax |
9% | -7% | 3% | |||||||||
| Credit impairment (charge)/release |
10% | -6% | 1% | |||||||||
| Profit before income tax |
9% | -7% | 3% | |||||||||
| Income tax expense and non-controlling interests |
11% | -7% | 4% | |||||||||
| Cash profit |
8% | -7% | 3% | |||||||||
| Individual credit impairment charge/(release) |
2% | -1% | 0% | |||||||||
| Collective credit impairment charge/(release) |
large | -58% | 6% | |||||||||
| Net loans & advances |
5% | -8% | 2% | |||||||||
| Customer deposits |
4% | 4% | 4% | |||||||||
| Risk weighted assets |
4% | -3% | 1% | |||||||||
| 1. | The March 2016 half includes the contribution from Esanda Dealer Finance portfolio to the date of divestment which was substantially completed by 31 December 2015. |
57
DIVISIONAL RESULTS
Australia
Fred Ohlsson
Cash Profit Results – Esanda Dealer Finance divestment
During the March 2016 half, the Group sold the Esanda Dealer Finance portfolio to Macquarie Group Limited. The tables below show the Australia division and C&CB excluding the contribution of the divested Esanda portfolio from current and prior period earnings. The divestment gain was recognised in TSO and Group Centre. $766 million of Esanda Dealer Finance bailment facilities remain on ANZ’s balance sheet at 31 March 2016 which are scheduled to transition to Macquarie during the third quarter of 2016. As these assets were not subject to equitable assignment and ANZ continues to receive profits prior to migration, the transfer of these residual facilities will not impact the divestment gain.
Australia division excluding Esanda Dealer Finance divestment
| Half Year | Movement | |||||||||||
| Mar 16 $M |
Sep 15 $M |
Mar 15 $M |
Mar 16 v. Sep 15 |
Mar 16 v. Mar 15 | ||||||||
| Net interest income |
4,007 | 3,772 | 3,600 | 6% | 11% | |||||||
| Other operating income
|
582
|
580
|
555
|
0%
|
5%
| |||||||
| Operating income |
4,589 | 4,352 | 4,155 | 5% | 10% | |||||||
| Operating expenses
|
(1,654)
|
(1,596)
|
(1,535)
|
4%
|
8%
| |||||||
| Profit before credit impairment and income tax |
2,935 | 2,756 | 2,620 | 6% | 12% | |||||||
| Credit impairment charge
|
(449)
|
(397)
|
(326)
|
13%
|
38%
| |||||||
| Profit before income tax |
2,486 | 2,359 | 2,294 | 5% | 8% | |||||||
| Income tax expense and non-controlling interests
|
(746)
|
(701)
|
(689)
|
6%
|
8%
| |||||||
| Cash profit
|
1,740
|
1,658
|
1,605
|
5%
|
8%
| |||||||
| Individual credit impairment charge/(release) |
415 | 367 | 274 | 13% | 51% | |||||||
| Collective credit impairment charge/(release) |
34 | 30 | 52 | 13% | -35% | |||||||
| Net loans and advances
|
319,257
|
305,607
|
289,462
|
4%
|
10%
| |||||||
C&CB excluding Esanda Dealer Finance divestment
| Half Year | Movement | |||||||||||
| Mar 16 $M |
Sep 15 $M |
Mar 15 $M |
Mar 16 v.Sep 15 |
Mar 16 v. Mar 15 | ||||||||
| Net interest income |
1,342 | 1,333 | 1,322 | 1% | 2% | |||||||
| Other operating income
|
201
|
198
|
191
|
2%
|
5%
| |||||||
| Operating income |
1,543 | 1,531 | 1,513 | 1% | 2% | |||||||
| Operating expenses
|
(500)
|
(508)
|
(489)
|
-2%
|
2%
| |||||||
| Profit before credit impairment and income tax |
1,043 | 1,023 | 1,024 | 2% | 2% | |||||||
| Credit impairment charge
|
(226)
|
(194)
|
(131)
|
16%
|
73%
| |||||||
| Profit before income tax |
817 | 829 | 893 | -1% | -9% | |||||||
| Income tax expense and non-controlling interests
|
(246)
|
(251)
|
(269)
|
-2%
|
-9%
| |||||||
| Cash profit
|
571
|
578
|
624
|
-1%
|
-8%
| |||||||
| Individual credit impairment charge/(release) |
215 | 171 | 116 | 26% | 85% | |||||||
| Collective credit impairment charge/(release) |
11 | 23 | 15 | -52% | -27% | |||||||
| Net loans and advances
|
65,154
|
63,274
|
60,251
|
3%
|
8%
| |||||||
Esanda Dealer Finance divestment
| Half Year | Movement | |||||||||||
| Mar 16 $M |
Sep 15 $M |
Mar 15 $M |
Mar 16 v. Sep 15 |
Mar 16 v. Mar 15 | ||||||||
| Net interest income |
31 | 125 | 130 | -75% | -76% | |||||||
| Other operating income
|
12
|
26
|
25
|
-54%
|
-52%
| |||||||
| Operating income |
43 | 151 | 155 | -72% | -72% | |||||||
| Operating expenses
|
(11)
|
(22)
|
(21)
|
-50%
|
-48%
| |||||||
| Profit before credit impairment and income tax |
32 | 129 | 134 | -75% | -76% | |||||||
| Credit impairment charge
|
(13)
|
(61)
|
(69)
|
-79%
|
-81%
| |||||||
| Profit before income tax |
19 | 68 | 65 | -72% | -71% | |||||||
| Income tax expense and non-controlling interests
|
(6)
|
(20)
|
(20)
|
-70%
|
-70%
| |||||||
| Cash profit
|
13
|
48
|
45
|
-73%
|
-71%
| |||||||
| Individual credit impairment charge/(release) |
14 | 60 | 60 | -77% | -77% | |||||||
| Collective credit impairment charge/(release) |
(1) | 1 | 9 | large | large | |||||||
| Net loans and advances1
|
766
|
8,065
|
8,180
|
-91%
|
-91%
| |||||||
| 1. | Includes $766 million of Esanda Dealer Finance bailment facilities which are due to migrate to Macquarie during the third quarter of 2016. |
58
DIVISIONAL RESULTS
This page has been left blank intentionally
59
DIVISIONAL RESULTS
Institutional
Mark Whelan
Cash profit – March 16 Half Year v March 15 Half Year
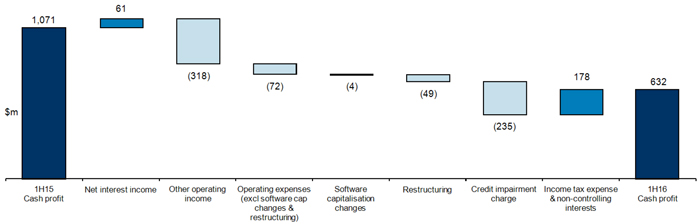
60
DIVISIONAL RESULTS
Institutional
Mark Whelan
| Half Year | Movement | |||||||||||||||||||||
|
Mar 16 |
Sep 15 |
Mar 15 |
Mar 16 |
Mar 16 |
||||||||||||||||||
| Net interest income |
1,802 | 1,844 | 1,741 | -2% | 4% | |||||||||||||||||
| Other operating income |
911 | 948 | 1,229 | -4% | -26% | |||||||||||||||||
| Operating income |
2,713 | 2,792 | 2,970 | -3% | -9% | |||||||||||||||||
| Operating expenses |
(1,510) | (1,425) | (1,385) | 6% | 9% | |||||||||||||||||
| Profit before credit impairment and income tax |
1,203 | 1,367 | 1,585 | -12% | -24% | |||||||||||||||||
| Credit impairment charge |
(323) | (111) | (88) | large | large | |||||||||||||||||
| Profit before income tax |
880 | 1,256 | 1,497 | -30% | -41% | |||||||||||||||||
| Income tax expense and non-controlling interests |
(248) | (363) | (426) | -32% | -42% | |||||||||||||||||
| Cash profit |
632 | 893 | 1,071 | -29% | -41% | |||||||||||||||||
| Consisting of: |
||||||||||||||||||||||
| Transaction Banking |
184 | 290 | 296 | -37% | -38% | |||||||||||||||||
| Loans & Specialised Finance |
252 | 379 | 390 | -34% | -35% | |||||||||||||||||
| Markets |
202 | 255 | 398 | -21% | -49% | |||||||||||||||||
| Central Functions |
(6) | (31) | (13) | -81% | -54% | |||||||||||||||||
| Cash profit |
632 | 893 | 1,071 | -29% | -41% | |||||||||||||||||
| Balance Sheet |
||||||||||||||||||||||
| Net loans & advances |
125,610 | 142,196 | 144,850 | -12% | -13% | |||||||||||||||||
| Other external assets |
275,658 | 261,308 | 241,935 | 5% | 14% | |||||||||||||||||
| External assets |
401,268 | 403,504 | 386,785 | -1% | 4% | |||||||||||||||||
| Customer deposits |
176,126 | 183,040 | 183,345 | -4% | -4% | |||||||||||||||||
| Other deposits and borrowings |
48,991 | 41,855 | 51,676 | 17% | -5% | |||||||||||||||||
| Deposits and other borrowings |
225,117 | 224,895 | 235,021 | 0% | -4% | |||||||||||||||||
| Other external liabilities |
121,768 | 109,584 | 93,790 | 11% | 30% | |||||||||||||||||
| External liabilities |
346,885 | 334,479 | 328,811 | 4% | 5% | |||||||||||||||||
| Risk weighted assets |
181,889 | 197,880 | 195,486 | -8% | -7% | |||||||||||||||||
| Average gross loans and advances |
138,972 | 147,515 | 142,195 | -6% | -2% | |||||||||||||||||
| Average deposits and other borrowings |
233,729 | 231,655 | 227,460 | 1% | 3% | |||||||||||||||||
| Ratios |
||||||||||||||||||||||
| Return on assets |
0.31% | 0.45% | 0.58% | |||||||||||||||||||
| Net interest margin |
1.15% | 1.20% | 1.19% | |||||||||||||||||||
| Net interest margin (excluding Markets) |
2.16% | 2.06% | 2.06% | |||||||||||||||||||
| Operating expenses to operating income |
55.7% | 51.0% | 46.6% | |||||||||||||||||||
| Operating expenses to average assets |
0.74% | 0.72% | 0.75% | |||||||||||||||||||
| Individual credit impairment charge/(release) |
339 | 114 | 92 | large | large | |||||||||||||||||
| Individual credit impairment charge/(release) as a % of average GLA |
0.49% | 0.15% | 0.13% | |||||||||||||||||||
| Collective credit impairment charge/(release) |
(16) | (3) | (4) | large | large | |||||||||||||||||
| Collective credit impairment charge/(release) as a % of average GLA |
(0.02%) | (0.00%) | (0.01%) | |||||||||||||||||||
| Gross impaired assets |
1,281 | 960 | 826 | 33% | 55% | |||||||||||||||||
| Gross impaired assets as a % of GLA |
1.01% | 0.67% | 0.56% | |||||||||||||||||||
| Total full time equivalent staff (FTE) |
4,056 | 4,231 | 4,319 | -4% | -6% | |||||||||||||||||
61
DIVISIONAL RESULTS
Institutional
Mark Whelan
Institutional by Geography
| Half Year | Movement | |||||||||||||||||||||
| Australia |
Mar 16 |
Sep 15 |
Mar 15 |
Mar 16 |
Mar 16 |
|||||||||||||||||
| Net interest income |
987 | 1,020 | 967 | -3% | 2% | |||||||||||||||||
| Other operating income |
308 | 331 | 445 | -7% | -31% | |||||||||||||||||
| Operating income |
1,295 | 1,351 | 1,412 | -4% | -8% | |||||||||||||||||
| Operating expenses |
(665) | (587 | ) | (603 | ) | 13% | 10% | |||||||||||||||
| Profit before credit impairment and income tax |
630 | 764 | 809 | -18% | -22% | |||||||||||||||||
| Credit impairment (charge)/release |
(112) | 17 | (34 | ) | large | large | ||||||||||||||||
| Profit before income tax |
518 | 781 | 775 | -34% | -33% | |||||||||||||||||
| Income tax expense and non-controlling interests |
(156) | (232 | ) | (232 | ) | -33% | -33% | |||||||||||||||
| Cash profit |
362 | 549 | 543 | -34% | -33% | |||||||||||||||||
| Individual credit impairment charge/(release) |
124 | (1 | ) | 41 | large | large | ||||||||||||||||
| Collective credit impairment charge/(release) |
(12) | (16 | ) | (7 | ) | -25% | 71% | |||||||||||||||
| Net loans & advances |
63,867 | 64,785 | 62,491 | -1% | 2% | |||||||||||||||||
| Customer deposits |
66,634 | 65,876 | 62,610 | 1% | 6% | |||||||||||||||||
| Asia Pacific, Europe, and America |
||||||||||||||||||||||
| Net interest income |
657 | 670 | 644 | -2% | 2% | |||||||||||||||||
| Other operating income |
543 | 466 | 601 | 17% | -10% | |||||||||||||||||
| Operating income |
1,200 | 1,136 | 1,245 | 6% | -4% | |||||||||||||||||
| Operating expenses |
(756) | (750 | ) | (695 | ) | 1% | 9% | |||||||||||||||
| Profit before credit impairment and income tax |
444 | 386 | 550 | 15% | -19% | |||||||||||||||||
| Credit impairment (charge)/release |
(207) | (121 | ) | (44 | ) | 71% | large | |||||||||||||||
| Profit before income tax |
237 | 265 | 506 | -11% | -53% | |||||||||||||||||
| Income tax expense and non-controlling interests |
(57) | (74 | ) | (134 | ) | -23% | -57% | |||||||||||||||
| Cash profit |
180 | 191 | 372 | -6% | -52% | |||||||||||||||||
| Individual credit impairment charge/(release) |
212 | 113 | 39 | 88% | large | |||||||||||||||||
| Collective credit impairment charge/(release) |
(5) | 8 | 5 | large | large | |||||||||||||||||
| Net loans & advances |
55,244 | 70,488 | 74,807 | -22% | -26% | |||||||||||||||||
| Customer deposits |
96,168 | 104,906 | 107,455 | -8% | -11% | |||||||||||||||||
| New Zealand |
||||||||||||||||||||||
| Net interest income |
158 | 154 | 130 | 3% | 22% | |||||||||||||||||
| Other operating income |
60 | 151 | 183 | -60% | -67% | |||||||||||||||||
| Operating income |
218 | 305 | 313 | -29% | -30% | |||||||||||||||||
| Operating expenses |
(89) | (88 | ) | (87 | ) | 1% | 2% | |||||||||||||||
| Profit before credit impairment and income tax |
129 | 217 | 226 | -41% | -43% | |||||||||||||||||
| Credit impairment (charge)/release |
(4) | (7 | ) | (10 | ) | -43% | -60% | |||||||||||||||
| Profit before income tax |
125 | 210 | 216 | -40% | -42% | |||||||||||||||||
| Income tax expense and non-controlling interests |
(35) | (57 | ) | (60 | ) | -39% | -42% | |||||||||||||||
| Cash profit |
90 | 153 | 156 | -41% | -42% | |||||||||||||||||
| Individual credit impairment charge/(release) |
3 | 2 | 12 | 50% | -75% | |||||||||||||||||
| Collective credit impairment charge/(release) |
1 | 5 | (2 | ) | -80% | large | ||||||||||||||||
| Net loans & advances |
6,499 | 6,923 | 7,552 | -6% | -14% | |||||||||||||||||
| Customer deposits |
13,324 | 12,258 | 13,280 | 9% | 0% | |||||||||||||||||
62
DIVISIONAL RESULTS
Institutional
Mark Whelan
Individual credit impairment charge/(release)
| Half Year | Movement | |||||||||||||||||||||
|
Mar 16 |
Sep 15 |
Mar 15 |
Mar 16 v. Sep 15 |
Mar 16 |
||||||||||||||||||
| Transaction Banking |
103 | 42 | 19 | large | large | |||||||||||||||||
| Loans & Specialised Finance |
223 | 63 | 34 | large | large | |||||||||||||||||
| Markets |
11 | 9 | 38 | 22% | -71% | |||||||||||||||||
| Central Functions |
2 | - | 1 | n/a | 100% | |||||||||||||||||
| Individual credit impairment charge |
339 | 114 | 92 | large | large | |||||||||||||||||
| Collective credit impairment charge/(release) | ||||||||||||||||||||||
| Half Year | Movement | |||||||||||||||||||||
| Mar 16 $M |
Sep 15 $M |
Mar 15 $M |
Mar 16 v. Sep 15 |
Mar 16 v. Mar 15 |
||||||||||||||||||
| Transaction Banking |
2 | (29) | (1) | large | large | |||||||||||||||||
| Loans & Specialised Finance |
(19) | 23 | (5) | large | large | |||||||||||||||||
| Markets |
1 | 1 | - | 0% | n/a | |||||||||||||||||
| Central Functions |
- | 2 | 2 | -100% | -100% | |||||||||||||||||
| Collective credit impairment charge |
(16) | (3) | (4) | large | large | |||||||||||||||||
| Total credit impairment charge |
323 | 111 | 88 | large | large | |||||||||||||||||
| Net loans and advances | ||||||||||||||||||||||
| Half Year | Movement | |||||||||||||||||||||
| Mar 16 $M |
Sep 15 $M |
Mar 15 $M |
Mar 16 v. Sep 15 |
Mar 16 v. Mar 15 |
||||||||||||||||||
| Transaction Banking |
17,036 | 26,175 | 32,683 | -35% | -48% | |||||||||||||||||
| Loans & Specialised Finance |
86,849 | 92,317 | 89,634 | -6% | -3% | |||||||||||||||||
| Markets |
21,487 | 23,367 | 22,152 | -8% | -3% | |||||||||||||||||
| Central Functions |
238 | 337 | 381 | -29% | -38% | |||||||||||||||||
| Net loans and advances |
125,610 | 142,196 | 144,850 | -12% | -13% | |||||||||||||||||
| Customer deposits | ||||||||||||||||||||||
| Half Year | Movement | |||||||||||||||||||||
| Mar 16 $M |
Sep 15 $M |
Mar 15 $M |
Mar 16 v. Sep 15 |
Mar 16 v. Mar 15 |
||||||||||||||||||
| Transaction Banking |
90,231 | 94,188 | 91,066 | -4% | -1% | |||||||||||||||||
| Loans & Specialised Finance |
977 | 785 | 762 | 24% | 28% | |||||||||||||||||
| Markets |
84,540 | 87,621 | 91,064 | -4% | -7% | |||||||||||||||||
| Central Functions |
378 | 446 | 453 | -15% | -17% | |||||||||||||||||
| Customer deposits |
176,126 | 183,040 | 183,345 | -4% | -4% | |||||||||||||||||
63
DIVISIONAL RESULTS
Institutional
Mark Whelan
March 2016 Half Year
| AUD M | Transaction Banking |
Loans & Specialised Finance |
Markets | Central Functions |
Institutional Total |
|||||||||||||||
| Net interest income |
458 | 764 | 562 | 18 | 1,802 | |||||||||||||||
| Other operating income |
394 | 58 | 433 | 26 | 911 | |||||||||||||||
| Operating income |
852 | 822 | 995 | 44 | 2,713 | |||||||||||||||
| Operating expenses |
(477) | (271) | (712) | (50) | (1,510) | |||||||||||||||
| Profit before credit impairment and income tax |
375 | 551 | 283 | (6) | 1,203 | |||||||||||||||
| Credit impairment (charge)/release |
(105) | (204) | (12) | (2) | (323) | |||||||||||||||
| Profit before income tax |
270 | 347 | 271 | (8) | 880 | |||||||||||||||
| Income tax expense and non-controlling interests |
(86) | (95) | (69) | 2 | (248) | |||||||||||||||
| Cash profit |
184 | 252 | 202 | (6) | 632 | |||||||||||||||
| Individual credit impairment charge/(release) |
103 | 223 | 11 | 2 | 339 | |||||||||||||||
| Collective credit impairment charge/(release) |
2 | (19) | 1 | - | (16) | |||||||||||||||
| Net loans & advances |
17,036 | 86,849 | 21,487 | 238 | 125,610 | |||||||||||||||
| Customer deposits |
90,231 | 977 | 84,540 | 378 | 176,126 | |||||||||||||||
| Risk weighted assets |
28,889 | 96,902 | 54,584 | 1,514 | 181,889 | |||||||||||||||
| March 2015 Half Year |
||||||||||||||||||||
| Net interest income |
468 | 750 | 507 | 16 | 1,741 | |||||||||||||||
| Other operating income |
423 | 64 | 716 | 26 | 1,229 | |||||||||||||||
| Operating income |
891 | 814 | 1,223 | 42 | 2,970 | |||||||||||||||
| Operating expenses |
(460) | (254) | (647) | (24) | (1,385) | |||||||||||||||
| Profit before credit impairment and income tax |
431 | 560 | 576 | 18 | 1,585 | |||||||||||||||
| Credit impairment (charge)/release |
(18) | (29) | (38) | (3) | (88) | |||||||||||||||
| Profit before income tax |
413 | 531 | 538 | 15 | 1,497 | |||||||||||||||
| Income tax expense and non-controlling interests |
(117) | (141) | (140) | (28) | (426) | |||||||||||||||
| Cash profit |
296 | 390 | 398 | (13) | 1,071 | |||||||||||||||
| Individual credit impairment charge/(release) |
19 | 34 | 38 | 1 | 92 | |||||||||||||||
| Collective credit impairment charge/(release) |
(1) | (5) | - | 2 | (4) | |||||||||||||||
| Net loans & advances |
32,683 | 89,634 | 22,152 | 381 | 144,850 | |||||||||||||||
| Customer deposits |
91,066 | 762 | 91,064 | 453 | 183,345 | |||||||||||||||
| Risk weighted assets |
41,211 | 94,601 | 59,072 | 602 | 195,486 | |||||||||||||||
| March 2016 Half Year vs March 2015 Half Year |
||||||||||||||||||||
| Net interest income |
-2% | 2% | 11% | 13% | 4% | |||||||||||||||
| Other operating income |
-7% | -9% | -40% | 0% | -26% | |||||||||||||||
| Operating income |
-4% | 1% | -19% | 5% | -9% | |||||||||||||||
| Operating expenses |
4% | 7% | 10% | large | 9% | |||||||||||||||
| Profit before credit impairment and income tax |
-13% | -2% | -51% | large | -24% | |||||||||||||||
| Credit impairment (charge)/release |
large | large | -68% | -33% | large | |||||||||||||||
| Profit before income tax |
-35% | -35% | -50% | large | -41% | |||||||||||||||
| Income tax expense and non-controlling interests |
-26% | -33% | -51% | large | -42% | |||||||||||||||
| Cash profit |
-38% | -35% | -49% | -54% | -41% | |||||||||||||||
| Individual credit impairment charge/(release) |
large | large | -71% | 100% | large | |||||||||||||||
| Collective credit impairment charge/(release) |
large | large | n/a | -100% | large | |||||||||||||||
| Net loans & advances |
-48% | -3% | -3% | -38% | -13% | |||||||||||||||
| Customer deposits |
-1% | 28% | -7% | -17% | -4% | |||||||||||||||
| Risk weighted assets |
-30% | 2% | -8% | large | -7% | |||||||||||||||
64
DIVISIONAL RESULTS
Institutional
Mark Whelan
March 2016 Half Year
| AUD M | Transaction Banking |
Loans & Specialised Finance |
Markets | Central Functions |
Institutional Total |
|||||||||||||||
| Net interest income |
458 | 764 | 562 | 18 | 1,802 | |||||||||||||||
| Other operating income |
394 | 58 | 433 | 26 | 911 | |||||||||||||||
| Operating income |
852 | 822 | 995 | 44 | 2,713 | |||||||||||||||
| Operating expenses |
(477) | (271) | (712) | (50) | (1,510) | |||||||||||||||
| Profit before credit impairment and income tax |
375 | 551 | 283 | (6) | 1,203 | |||||||||||||||
| Credit impairment (charge)/release |
(105) | (204) | (12) | (2) | (323) | |||||||||||||||
| Profit before income tax |
270 | 347 | 271 | (8) | 880 | |||||||||||||||
| Income tax expense and non-controlling interests |
(86) | (95) | (69) | 2 | (248) | |||||||||||||||
| Cash profit |
184 | 252 | 202 | (6) | 632 | |||||||||||||||
| Individual credit impairment charge/(release) |
103 | 223 | 11 | 2 | 339 | |||||||||||||||
| Collective credit impairment charge/(release) |
2 | (19) | 1 | - | (16) | |||||||||||||||
| Net loans & advances |
17,036 | 86,849 | 21,487 | 238 | 125,610 | |||||||||||||||
| Customer deposits |
90,231 | 977 | 84,540 | 378 | 176,126 | |||||||||||||||
| Risk weighted assets |
28,889 | 96,902 | 54,584 | 1,514 | 181,889 | |||||||||||||||
| September 2015 Half Year |
||||||||||||||||||||
| Net interest income |
467 | 769 | 600 | 8 | 1,844 | |||||||||||||||
| Other operating income |
411 | 90 | 423 | 24 | 948 | |||||||||||||||
| Operating income |
878 | 859 | 1,023 | 32 | 2,792 | |||||||||||||||
| Operating expenses |
(467) | (264) | (662) | (32) | (1,425) | |||||||||||||||
| Profit before credit impairment and income tax |
411 | 595 | 361 | - | 1,367 | |||||||||||||||
| Credit impairment (charge)/release |
(13) | (86) | (10) | (2) | (111) | |||||||||||||||
| Profit before income tax |
398 | 509 | 351 | (2) | 1,256 | |||||||||||||||
| Income tax expense and non-controlling interests |
(108) | (130) | (96) | (29) | (363) | |||||||||||||||
| Cash profit |
290 | 379 | 255 | (31) | 893 | |||||||||||||||
| Individual credit impairment charge/(release) |
42 | 63 | 9 | - | 114 | |||||||||||||||
| Collective credit impairment charge/(release) |
(29) | 23 | 1 | 2 | (3) | |||||||||||||||
| Net loans & advances |
26,175 | 92,317 | 23,367 | 337 | 142,196 | |||||||||||||||
| Customer deposits |
94,188 | 785 | 87,621 | 446 | 183,040 | |||||||||||||||
| Risk weighted assets |
35,381 | 101,376 | 59,738 | 1,385 | 197,880 | |||||||||||||||
| March 2016 Half Year vs September 2015 Half Year |
||||||||||||||||||||
| Net interest income |
-2% | -1% | -6% | large | -2% | |||||||||||||||
| Other operating income |
-4% | -36% | 2% | 8% | -4% | |||||||||||||||
| Operating income |
-3% | -4% | -3% | 38% | -3% | |||||||||||||||
| Operating expenses |
2% | 3% | 8% | 56% | 6% | |||||||||||||||
| Profit before credit impairment and income tax |
-9% | -7% | -22% | n/a | -12% | |||||||||||||||
| Credit impairment (charge)/release |
large | large | 20% | 0% | large | |||||||||||||||
| Profit before income tax |
-32% | -32% | -23% | large | -30% | |||||||||||||||
| Income tax expense and non-controlling interests |
-20% | -27% | -28% | large | -32% | |||||||||||||||
| Cash profit |
-37% | -34% | -21% | -81% | -29% | |||||||||||||||
| Individual credit impairment charge/(release) |
large | large | 22% | n/a | large | |||||||||||||||
| Collective credit impairment charge/(release) |
large | large | 0% | -100% | large | |||||||||||||||
| Net loans & advances |
-35% | -6% | -8% | -29% | -12% | |||||||||||||||
| Customer deposits |
-4% | 24% | -4% | -15% | -4% | |||||||||||||||
| Risk weighted assets |
-18% | -4% | -9% | 9% | -8% | |||||||||||||||
65
DIVISIONAL RESULTS
Institutional
Mark Whelan
Analysis of Markets operating income
| Half Year | Movement | |||||||||||||||||||||
| Composition of Markets operating income by business activity |
Mar 16 |
Sep |
Mar |
Mar 16 |
Mar 16
|
|||||||||||||||||
| Sales1 |
549 | 577 | 668 | -5% | -18% | |||||||||||||||||
| Trading2 |
303 | 307 | 296 | -1% | 2% | |||||||||||||||||
| Balance sheet3 |
143 | 139 | 259 | 3% | -45% | |||||||||||||||||
| Markets operating income |
995 | 1,023 | 1,223 | -3% | -19% | |||||||||||||||||
| 1. | Sales represents direct client flow business on core products such as fixed income, foreign exchange, commodities and capital markets. |
| 2. | Trading primarily represents management of the Group’s strategic positions and those taken as part of direct client sales flow. |
| 3. | Balance sheet represents hedging of interest rate risk on the Group’s loan and deposit books and the management of the Group’s liquidity portfolio. |
| Half Year | Movement | |||||||||||||||||||||
| Composition of Markets operating income by geography |
Mar 16 |
Sep 15 |
Mar 15 |
Mar 16 |
Mar 16 |
|||||||||||||||||
| Australia |
373 | 405 | 461 | -8% | -19% | |||||||||||||||||
| Asia Pacific, Europe & America |
549 | 458 | 594 | 20% | -8% | |||||||||||||||||
| New Zealand |
73 | 160 | 168 | -54% | -57% | |||||||||||||||||
| Markets operating income |
995 | 1,023 | 1,223 | -3% | -19% | |||||||||||||||||
66
DIVISIONAL RESULTS
Institutional
Mark Whelan
Market risk
Traded market risk
Below are aggregate Value at Risk (VaR) exposures at 99% confidence level covering both physical and derivative trading positions for ANZ’s principal trading centres. All figures are in AUD.
99% confidence level (1 day holding period)
| As at | High for period |
Low for period |
Avg for period |
As at | High for year |
Low for year |
Avg for year |
|||||||||||||||||||||||||||
| Mar 16 $M |
Mar 16 $M |
Mar 16 $M |
Mar 16 $M |
Sep 15 $M |
Sep 15 $M |
Sep 15 $M |
Sep 15 $M |
|||||||||||||||||||||||||||
| Value at Risk at 99% confidence |
||||||||||||||||||||||||||||||||||
| Foreign exchange |
5.9 | 11.4 | 2.6 | 5.6 | 5.0 | 18.2 | 2.8 | 7.9 | ||||||||||||||||||||||||||
| Interest rate |
9.0 | 20.1 | 6.9 | 11.3 | 10.1 | 20.2 | 4.8 | 9.3 | ||||||||||||||||||||||||||
| Credit |
2.7 | 4.6 | 2.4 | 3.0 | 3.5 | 5.4 | 2.9 | 3.8 | ||||||||||||||||||||||||||
| Commodities |
1.2 | 2.5 | 1.0 | 1.7 | 1.6 | 3.6 | 1.3 | 2.4 | ||||||||||||||||||||||||||
| Equity |
0.1 | 2.0 | 0.1 | 0.2 | 2.5 | 6.3 | 0.1 | 1.1 | ||||||||||||||||||||||||||
| Diversification benefit |
(8.0) | n/a | n/a | (6.2) | (6.0) | n/a | n/a | (13.2) | ||||||||||||||||||||||||||
| Total VaR |
10.9 | 25.4 | 8.7 | 15.6 | 16.7 | 19.7 | 6.9 | 11.3 | ||||||||||||||||||||||||||
Non-traded interest rate risk
Non-traded interest rate risk is managed by Markets and relates to the potential adverse impact of changes in market interest rates on future net interest income for the Group. Interest rate risk is reported using various techniques including VaR and scenario analysis to a 1% rate shock.
99% confidence level (1 day holding period)
| As at | High for period |
Low for period |
Avg for period |
As at | High for year |
Low for year |
Avg for year |
|||||||||||||||||||||||||||
| Mar 16 $M |
Mar 16 $M |
Mar 16 $M |
Mar 16 $M |
Sep 15 $M |
Sep 15 $M |
Sep 15 $M |
Sep 15 $M |
|||||||||||||||||||||||||||
| Value at Risk at 99% confidence |
||||||||||||||||||||||||||||||||||
| Australia |
31.9 | 31.9 | 28.0 | 29.7 | 25.4 | 38.5 | 21.2 | 27.2 | ||||||||||||||||||||||||||
| New Zealand |
8.8 | 11.0 | 8.8 | 9.6 | 9.7 | 11.4 | 8.9 | 10.2 | ||||||||||||||||||||||||||
| Asia Pacific, Europe & America |
16.1 | 17.3 | 15.1 | 16.2 | 14.4 | 14.4 | 7.9 | 10.4 | ||||||||||||||||||||||||||
| Diversification benefit |
(23.0) | n/a | n/a | (22.3) | (16.8) | n/a | n/a | (14.8) | ||||||||||||||||||||||||||
| Total VaR |
33.8 | 35.4 | 31.3 | 33.2 | 32.7 | 37.4 | 28.6 | 33.0 | ||||||||||||||||||||||||||
Impact of 1% rate shock on the next 12 months’ net interest income
| As at | ||||||||
| Mar 16 | Sep 15 | |||||||
| As at period end |
0.27% | 0.61% | ||||||
| Maximum exposure |
0.48% | 1.36% | ||||||
| Minimum exposure |
0.00% | 0.45% | ||||||
| Average exposure (in absolute terms) |
0.28% | 0.93% | ||||||
67
DIVISIONAL RESULTS
New Zealand
David Hisco
New Zealand’s result and commentary are reported in NZD. AUD results are shown on page 73.
Cash profit – March 2016 Half Year v March 2015 Half Year
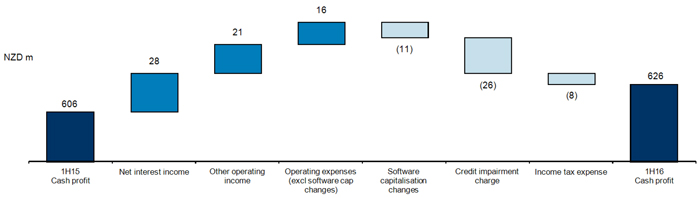
68
DIVISIONAL RESULTS
New Zealand
David Hisco
Table reflects NZD for New Zealand
AUD results shown on page 73
| Half Year | Movement | |||||||||||||||||||||
| Mar 16 NZD M |
Sep 15 NZD M |
Mar 15 NZD M |
Mar 16 v. Sep 15 |
Mar 16 v. Mar 15 |
||||||||||||||||||
| Net interest income |
1,270 | 1,257 | 1,242 | 1% | 2% | |||||||||||||||||
| Other operating income |
217 | 201 | 196 | 8% | 11% | |||||||||||||||||
| Operating income |
1,487 | 1,458 | 1,438 | 2% | 3% | |||||||||||||||||
| Operating expenses |
(571) | (572) | (576) | 0% | -1% | |||||||||||||||||
| Profit before credit impairment and income tax |
916 | 886 | 862 | 3% | 6% | |||||||||||||||||
| Credit impairment (charge)/release |
(46) | (39) | (20) | 18% | large | |||||||||||||||||
| Profit before income tax |
870 | 847 | 842 | 3% | 3% | |||||||||||||||||
| Income tax expense and non-controlling interests |
(244) | (237) | (236) | 3% | 3% | |||||||||||||||||
| Cash profit |
626 | 610 | 606 | 3% | 3% | |||||||||||||||||
| Consisting of: |
||||||||||||||||||||||
| Retail |
395 | 369 | 365 | 7% | 8% | |||||||||||||||||
| Commercial |
221 | 237 | 242 | -7% | -9% | |||||||||||||||||
| Central Functions |
10 | 4 | (1) | large | large | |||||||||||||||||
| Cash profit |
626 | 610 | 606 | 3% | 3% | |||||||||||||||||
| Balance Sheet |
||||||||||||||||||||||
| Net loans & advances |
107,845 | 104,756 | 99,518 | 3% | 8% | |||||||||||||||||
| Other external assets |
3,536 | 3,514 | 3,699 | 1% | -4% | |||||||||||||||||
| External assets |
111,381 | 108,270 | 103,217 | 3% | 8% | |||||||||||||||||
| Customer deposits |
69,140 | 65,689 | 61,427 | 5% | 13% | |||||||||||||||||
| Other deposits and borrowings |
5,451 | 4,963 | 6,273 | 10% | -13% | |||||||||||||||||
| Deposits and other borrowings |
74,591 | 70,652 | 67,700 | 6% | 10% | |||||||||||||||||
| Other external liabilities |
19,356 | 21,503 | 19,749 | -10% | -2% | |||||||||||||||||
| External liabilities |
93,947 | 92,155 | 87,449 | 2% | 7% | |||||||||||||||||
| Risk weighted assets |
60,134 | 59,024 | 55,006 | 2% | 9% | |||||||||||||||||
| Average gross loans and advances |
106,705 | 102,629 | 98,262 | 4% | 9% | |||||||||||||||||
| Average deposits and other borrowings |
73,170 | 69,602 | 66,622 | 5% | 10% | |||||||||||||||||
| Ratios |
||||||||||||||||||||||
| Return on assets |
1.14% | 1.15% | 1.20% | |||||||||||||||||||
| Net interest margin |
2.37% | 2.44% | 2.52% | |||||||||||||||||||
| Operating expenses to operating income |
38.4% | 39.2% | 40.1% | |||||||||||||||||||
| Operating expenses to average assets |
1.04% | 1.08% | 1.14% | |||||||||||||||||||
| Individual credit impairment charge/(release) |
47 | 35 | 23 | 34% | large | |||||||||||||||||
| Individual credit impairment charge/(release) as a % of average GLA |
0.09% | 0.07% | 0.05% | |||||||||||||||||||
| Collective credit impairment charge/(release) |
(1) | 4 | (3) | large | -67% | |||||||||||||||||
| Collective credit impairment charge/(release) as a % of average GLA |
(0.00%) | 0.01% | (0.01%) | |||||||||||||||||||
| Gross impaired assets |
302 | 372 | 443 | -19% | -32% | |||||||||||||||||
| Gross impaired assets as a % of GLA |
0.28% | 0.35% | 0.44% | |||||||||||||||||||
| Total full time equivalent staff (FTE) |
5,022 | 5,074 | 5,096 | -1% | -1% | |||||||||||||||||
69
DIVISIONAL RESULTS
New Zealand
David Hisco
| Individual credit impairment charge/(release) | Half Year | Movement | ||||||||||||||||||||
| Mar 16 NZD M |
Sep 15 NZD M |
Mar 15 NZD M |
Mar 16 v. Sep 15 |
Mar 16 v. Mar 15 |
||||||||||||||||||
| Retail |
26 | 29 | 25 | -10% | 4% | |||||||||||||||||
| Home Loans |
(2) | 4 | 2 | large | large | |||||||||||||||||
| Other |
28 | 25 | 23 | 12% | 22% | |||||||||||||||||
| Commercial |
21 | 6 | (2) | large | large | |||||||||||||||||
| Individual credit impairment charge |
47 | 35 | 23 | 34% | large | |||||||||||||||||
| Collective credit impairment charge/(release) | Half Year | Movement | ||||||||||||||||||||
|
Mar 16 |
Sep 15 |
Mar 15 |
Mar 16 |
Mar 16 |
||||||||||||||||||
| Retail |
2 | 7 | (3) | -71% | large | |||||||||||||||||
| Home Loans |
(2) | (3) | (2) | -33% | 0% | |||||||||||||||||
| Other |
4 | 10 | (1) | -60% | large | |||||||||||||||||
| Commercial |
(3) | (3) | - | 0% | n/a | |||||||||||||||||
| Collective credit impairment charge/(release) |
(1) | 4 | (3) | large | -67% | |||||||||||||||||
| Total credit impairment charge |
46 | 39 | 20 | 18% | large | |||||||||||||||||
| Net loans and advances | As at | Movement | ||||||||||||||||||||
|
Mar 16 |
Sep 15 |
Mar 15 |
Mar 16 v. Sep 15 |
Mar 16 v. Mar 15 |
||||||||||||||||||
| Retail |
67,708 | 65,422 | 61,917 | 4% | 9% | |||||||||||||||||
| Home Loans |
63,794 | 61,508 | 58,152 | 4% | 10% | |||||||||||||||||
| Other |
3,914 | 3,914 | 3,765 | 0% | 4% | |||||||||||||||||
| Commercial |
40,137 | 39,334 | 37,601 | 2% | 7% | |||||||||||||||||
| Net loans and advances |
107,845 | 104,756 | 99,518 | 3% | 8% | |||||||||||||||||
| Customer deposits | As at | Movement | ||||||||||||||||||||
|
Mar 16 |
Sep 15 |
Mar 15 |
Mar 16 v. Sep 15 |
Mar 16 v. Mar 15 |
||||||||||||||||||
| Retail |
55,994 | 53,407 | 49,834 | 5% | 12% | |||||||||||||||||
| Commercial |
13,146 | 12,282 | 11,593 | 7% | 13% | |||||||||||||||||
| Customer deposits |
69,140 | 65,689 | 61,427 | 5% | 13% | |||||||||||||||||
70
DIVISIONAL RESULTS
New Zealand
David Hisco
March 2016 Half Year
| NZD M | Retail | Commercial | |
Central Functions |
|
|
New Zealand Total |
| ||||||||
| Net interest income |
818 | 445 | 7 | 1,270 | ||||||||||||
| Other operating income
|
|
195
|
|
|
8
|
|
|
14
|
|
|
217
|
| ||||
| Operating income |
1,013 | 453 | 21 | 1,487 | ||||||||||||
| Operating expenses
|
|
(436)
|
|
|
(128)
|
|
|
(7)
|
|
|
(571)
|
| ||||
| Profit before credit impairment and income tax |
577 | 325 | 14 | 916 | ||||||||||||
| Credit impairment (charge)/release
|
|
(28)
|
|
|
(18)
|
|
|
-
|
|
|
(46)
|
| ||||
| Profit before income tax |
549 | 307 | 14 | 870 | ||||||||||||
| Income tax expense and non-controlling interests
|
|
(154)
|
|
|
(86)
|
|
|
(4)
|
|
|
(244)
|
| ||||
|
Cash profit
|
|
395
|
|
|
221
|
|
|
10
|
|
|
626
|
| ||||
| Individual credit impairment charge/(release) |
26 | 21 | - | 47 | ||||||||||||
| Collective credit impairment charge/(release) |
2 | (3) | - | (1) | ||||||||||||
| Net loans & advances |
67,708 | 40,137 | - | 107,845 | ||||||||||||
| Customer deposits |
55,994 | 13,146 | - | 69,140 | ||||||||||||
| Risk weighted assets
|
|
29,117
|
|
|
30,452
|
|
|
565
|
|
|
60,134
|
| ||||
| March 2015 Half Year |
||||||||||||||||
| Net interest income |
781 | 452 | 9 | 1,242 | ||||||||||||
| Other operating income
|
|
187
|
|
|
9
|
|
|
-
|
|
|
196
|
| ||||
| Operating income |
968 | 461 | 9 | 1,438 | ||||||||||||
| Operating expenses
|
|
(440)
|
|
|
(126)
|
|
|
(10)
|
|
|
(576)
|
| ||||
| Profit before credit impairment and income tax |
528 | 335 | (1) | 862 | ||||||||||||
| Credit impairment (charge)/release
|
|
(22)
|
|
|
2
|
|
|
-
|
|
|
(20)
|
| ||||
| Profit before income tax |
506 | 337 | (1) | 842 | ||||||||||||
| Income tax expense and non-controlling interests
|
|
(141)
|
|
|
(95)
|
|
|
-
|
|
|
(236)
|
| ||||
|
Cash profit
|
|
365
|
|
|
242
|
|
|
(1)
|
|
|
606
|
| ||||
| Individual credit impairment charge/(release) |
25 | (2) | - | 23 | ||||||||||||
| Collective credit impairment charge/(release) |
(3) | - | - | (3) | ||||||||||||
| Net loans & advances |
61,917 | 37,601 | - | 99,518 | ||||||||||||
| Customer deposits |
49,834 | 11,593 | - | 61,427 | ||||||||||||
| Risk weighted assets
|
|
27,914
|
|
|
26,403
|
|
|
689
|
|
|
55,006
|
| ||||
| March 2016 Half Year vs March 2015 Half Year |
||||||||||||||||
| Net interest income |
5% | -2% | -22% | 2% | ||||||||||||
| Other operating income
|
|
4%
|
|
|
-11%
|
|
|
n/a
|
|
|
11%
|
| ||||
| Operating income |
5% | -2% | large | 3% | ||||||||||||
| Operating expenses
|
|
-1%
|
|
|
2%
|
|
|
-30%
|
|
|
-1%
|
| ||||
| Profit before credit impairment and income tax |
9% | -3% | large | 6% | ||||||||||||
| Credit impairment (charge)/release
|
|
27%
|
|
|
large
|
|
|
n/a
|
|
|
large
|
| ||||
| Profit before income tax |
8% | -9% | large | 3% | ||||||||||||
| Income tax expense and non-controlling interests
|
|
9%
|
|
|
-9%
|
|
|
n/a
|
|
|
3%
|
| ||||
|
Cash profit
|
|
8%
|
|
|
-9%
|
|
|
large
|
|
|
3%
|
| ||||
| Individual credit impairment charge/(release) |
4% | large | n/a | large | ||||||||||||
| Collective credit impairment charge/(release) |
large | n/a | n/a | -67% | ||||||||||||
| Net loans & advances |
9% | 7% | n/a | 8% | ||||||||||||
| Customer deposits |
12% | 13% | n/a | 13% | ||||||||||||
| Risk weighted assets
|
|
4%
|
|
|
15%
|
|
|
-18%
|
|
|
9%
|
| ||||
71
DIVISIONAL RESULTS
New Zealand
David Hisco
| March 2016 Half Year |
||||||||||||||||
| NZD M | Retail | Commercial | |
Central Functions |
|
|
New Zealand Total |
| ||||||||
| Net interest income |
818 | 445 | 7 | 1,270 | ||||||||||||
| Other operating income |
195 | 8 | 14 | 217 | ||||||||||||
| Operating income |
1,013 | 453 | 21 | 1,487 | ||||||||||||
| Operating expenses |
(436) | (128) | (7) | (571) | ||||||||||||
| Profit before credit impairment and income tax |
577 | 325 | 14 | 916 | ||||||||||||
| Credit impairment (charge)/release |
(28) | (18) | - | (46) | ||||||||||||
| Profit before income tax |
549 | 307 | 14 | 870 | ||||||||||||
| Income tax expense and non-controlling interests |
(154) | (86) | (4) | (244) | ||||||||||||
| Cash profit |
395 | 221 | 10 | 626 | ||||||||||||
| Individual credit impairment charge/(release) |
26 | 21 | - | 47 | ||||||||||||
| Collective credit impairment charge/(release) |
2 | (3) | - | (1) | ||||||||||||
| Net loans & advances |
67,708 | 40,137 | - | 107,845 | ||||||||||||
| Customer deposits |
55,994 | 13,146 | - | 69,140 | ||||||||||||
| Risk weighted assets |
29,117 | 30,452 | 565 | 60,134 | ||||||||||||
| September 2015 Half Year |
||||||||||||||||
| Net interest income |
794 | 453 | 10 | 1,257 | ||||||||||||
| Other operating income |
195 | 8 | (2) | 201 | ||||||||||||
| Operating income |
989 | 461 | 8 | 1,458 | ||||||||||||
| Operating expenses |
(439) | (130) | (3) | (572) | ||||||||||||
| Profit before credit impairment and income tax |
550 | 331 | 5 | 886 | ||||||||||||
| Credit impairment (charge)/release |
(36) | (3) | - | (39) | ||||||||||||
| Profit before income tax |
514 | 328 | 5 | 847 | ||||||||||||
| Income tax expense and non-controlling interests |
(145) | (91) | (1) | (237) | ||||||||||||
| Cash profit |
369 | 237 | 4 | 610 | ||||||||||||
| Individual credit impairment charge/(release) |
29 | 6 | - | 35 | ||||||||||||
| Collective credit impairment charge/(release) |
7 | (3) | - | 4 | ||||||||||||
| Net loans & advances |
65,422 | 39,334 | - | 104,756 | ||||||||||||
| Customer deposits |
53,407 | 12,282 | - | 65,689 | ||||||||||||
| Risk weighted assets |
29,029 | 29,224 | 771 | 59,024 | ||||||||||||
| March 2016 Half Year vs September 2015 Half Year |
||||||||||||||||
| Net interest income |
3% | -2% | -30% | 1% | ||||||||||||
| Other operating income |
0% | 0% | large | 8% | ||||||||||||
| Operating income |
2% | -2% | large | 2% | ||||||||||||
| Operating expenses |
-1% | -2% | large | 0% | ||||||||||||
| Profit before credit impairment and income tax |
5% | -2% | large | 3% | ||||||||||||
| Credit impairment (charge)/release |
-22% | large | n/a | 18% | ||||||||||||
| Profit before income tax |
7% | -6% | large | 3% | ||||||||||||
| Income tax expense and non-controlling interests |
6% | -5% | large | 3% | ||||||||||||
| Cash profit |
7% | -7% | large | 3% | ||||||||||||
| Individual credit impairment charge/(release) |
-10% | large | n/a | 34% | ||||||||||||
| Collective credit impairment charge/(release) |
-71% | 0% | n/a | large | ||||||||||||
| Net loans & advances |
4% | 2% | n/a | 3% | ||||||||||||
| Customer deposits |
5% | 7% | n/a | 5% | ||||||||||||
| Risk weighted assets |
0% | 4% | -27% | 2% | ||||||||||||
72
DIVISIONAL RESULTS
New Zealand
David Hisco
Table reflects AUD for New Zealand
NZD results shown on page 69
| Half Year | Movement | |||||||||||||||||||||
| Mar 16 $M |
Sep 15 $M |
Mar 15 $M |
Mar 16 v. Sep 15 |
Mar 16 v. Mar 15 |
||||||||||||||||||
| Net interest income |
1,172 | 1,155 | 1,162 | 1% | 1% | |||||||||||||||||
| Other operating income |
201 | 185 | 183 | 9% | 10% | |||||||||||||||||
| Operating income |
1,373 | 1,340 | 1,345 | 2% | 2% | |||||||||||||||||
| Operating expenses |
(527) | (525) | (539) | 0% | -2% | |||||||||||||||||
| Profit before credit impairment and income tax |
846 | 815 | 806 | 4% | 5% | |||||||||||||||||
| Credit impairment (charge)/release |
(42) | (36) | (19) | 17% | large | |||||||||||||||||
| Profit before income tax |
804 | 779 | 787 | 3% | 2% | |||||||||||||||||
| Income tax expense and non-controlling interests |
(226) | (218) | (221) | 4% | 2% | |||||||||||||||||
| Cash profit |
578 | 561 | 566 | 3% | 2% | |||||||||||||||||
| Consisting of: |
||||||||||||||||||||||
| Retail |
365 | 340 | 341 | 7% | 7% | |||||||||||||||||
| Commercial |
204 | 217 | 226 | -6% | -10% | |||||||||||||||||
| Central Functions |
9 | 4 | (1) | large | large | |||||||||||||||||
| Cash profit |
578 | 561 | 566 | 3% | 2% | |||||||||||||||||
| Balance Sheet |
||||||||||||||||||||||
| Net loans & advances |
97,217 | 95,211 | 97,679 | 2% | 0% | |||||||||||||||||
| Other external assets |
3,187 | 3,194 | 3,631 | 0% | -12% | |||||||||||||||||
| External assets |
100,404 | 98,405 | 101,310 | 2% | -1% | |||||||||||||||||
| Customer deposits |
62,327 | 59,703 | 60,293 | 4% | 3% | |||||||||||||||||
| Other deposits and borrowings |
4,913 | 4,511 | 6,157 | 9% | -20% | |||||||||||||||||
| Deposits and other borrowings |
67,240 | 64,214 | 66,450 | 5% | 1% | |||||||||||||||||
| Other external liabilities |
17,449 | 19,545 | 19,384 | -11% | -10% | |||||||||||||||||
| External liabilities |
84,689 | 83,759 | 85,834 | 1% | -1% | |||||||||||||||||
| Risk weighted assets |
54,208 | 53,646 | 53,990 | 1% | 0% | |||||||||||||||||
| Average gross loans and advances |
98,495 | 94,362 | 91,908 | 4% | 7% | |||||||||||||||||
| Average deposits and other borrowings |
67,540 | 63,996 | 62,314 | 6% | 8% | |||||||||||||||||
| Ratios |
||||||||||||||||||||||
| Return on assets |
1.14% | 1.15% | 1.20% | |||||||||||||||||||
| Net interest margin |
2.37% | 2.44% | 2.52% | |||||||||||||||||||
| Operating expenses to operating income |
38.4% | 39.2% | 40.1% | |||||||||||||||||||
| Operating expenses to average assets |
1.04% | 1.08% | 1.14% | |||||||||||||||||||
| Individual credit impairment charge/(release) |
43 | 32 | 22 | 34% | 95% | |||||||||||||||||
| Individual credit impairment charge/(release) as a % of average GLA |
0.09% | 0.07% | 0.05% | |||||||||||||||||||
| Collective credit impairment charge/(release) |
(1) | 4 | (3) | large | -67% | |||||||||||||||||
| Collective credit impairment charge/(release) as a % of average GLA |
(0.00%) | 0.01% | (0.01%) | |||||||||||||||||||
| Gross impaired assets |
273 | 338 | 434 | -19% | -37% | |||||||||||||||||
| Gross impaired assets as a % of GLA |
0.28% | 0.35% | 0.44% | |||||||||||||||||||
| Total full time equivalent staff (FTE) |
5,022 | 5,074 | 5,096 | -1% | -1% | |||||||||||||||||
73
DIVISIONAL RESULTS
Wealth
Alexis George, David Hisco & Fred Ohlsson
Cash profit – March 2016 Half Year v March 2015 Half Year
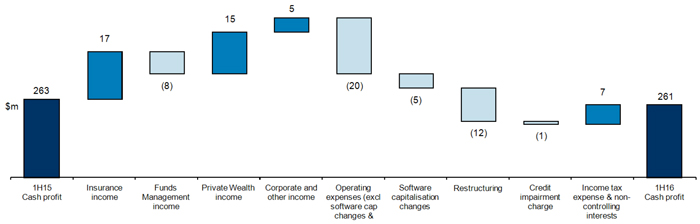
74
DIVISIONAL RESULTS
| Wealth | ||||||||||||||||||||||
| Alexis George, David Hisco & Fred Ohlsson | ||||||||||||||||||||||
| Half Year | Movement | |||||||||||||||||||||
|
Mar 16 |
Sep 15 |
Mar 15 |
Mar 16 |
Mar 16 |
||||||||||||||||||
| Net interest income |
101 | 91 | 89 | 11% | 13% | |||||||||||||||||
| Other operating income |
52 | 60 | 63 | -13% | -17% | |||||||||||||||||
| Net funds management and insurance income |
727 | 730 | 699 | 0% | 4% | |||||||||||||||||
| Operating income |
880 | 881 | 851 | 0% | 3% | |||||||||||||||||
| Operating expenses |
(521) | (481) | (484) | 8% | 8% | |||||||||||||||||
| Profit before credit impairment and income tax |
359 | 400 | 367 | -10% | -2% | |||||||||||||||||
| Credit impairment (charge)/release |
- | (1) | 1 | -100% | -100% | |||||||||||||||||
| Profit before income tax |
359 | 399 | 368 | -10% | -2% | |||||||||||||||||
| Income tax expense and non-controlling interests |
(98) | (53) | (105) | 85% | -7% | |||||||||||||||||
| Cash profit |
261 | 346 | 263 | -25% | -1% | |||||||||||||||||
| Consisting of: |
||||||||||||||||||||||
| Business Units |
||||||||||||||||||||||
| Insurance |
151 | 155 | 144 | -3% | 5% | |||||||||||||||||
| Funds Management |
58 | 79 | 79 | -27% | -27% | |||||||||||||||||
| Private Wealth |
53 | 51 | 44 | 4% | 20% | |||||||||||||||||
| Corporate and Other1 |
(1) | 61 | (4) | large | -75% | |||||||||||||||||
| Total Wealth |
261 | 346 | 263 | -25% | -1% | |||||||||||||||||
| Australia |
194 | 285 | 202 | -32% | -4% | |||||||||||||||||
| New Zealand |
63 | 64 | 62 | -2% | 2% | |||||||||||||||||
| Asia Pacific, Europe & America |
4 | (3) | (1) | large | large | |||||||||||||||||
| Total Wealth |
261 | 346 | 263 | -25% | -1% | |||||||||||||||||
| Income from invested capital2 |
65 | 59 | 55 | 10% | 18% | |||||||||||||||||
| Key metrics |
||||||||||||||||||||||
| In-force premiums3 |
2,071 | 2,217 | 2,154 | -7% | -4% | |||||||||||||||||
| Funds under management |
66,522 | 65,392 | 68,405 | 2% | -3% | |||||||||||||||||
| Average funds under management |
66,810 | 66,993 | 64,615 | 0% | 3% | |||||||||||||||||
| Net loans and advances |
6,573 | 6,468 | 6,163 | 2% | 7% | |||||||||||||||||
| Customer deposits |
18,945 | 18,467 | 17,357 | 3% | 9% | |||||||||||||||||
| Average gross loans and advances |
6,654 | 6,157 | 5,725 | 8% | 16% | |||||||||||||||||
| Average customer deposits |
19,096 | 17,922 | 15,639 | 7% | 22% | |||||||||||||||||
| Risk weighted assets |
4,391 | 4,291 | 4,174 | 2% | 5% | |||||||||||||||||
| Ratios |
||||||||||||||||||||||
| Operating expenses to operating income |
59.2% | 54.6% | 56.9% | |||||||||||||||||||
| Insurance expenses to in-force premiums |
||||||||||||||||||||||
| Australia |
12.1% | 9.9% | 10.3% | |||||||||||||||||||
| New Zealand |
35.2% | 35.4% | 32.1% | |||||||||||||||||||
| Retail Insurance lapse rates |
||||||||||||||||||||||
| Australia4 |
13.0% | 14.0% | 12.6% | |||||||||||||||||||
| New Zealand |
14.8% | 16.8% | 14.3% | |||||||||||||||||||
| Funds Management expenses to average FUM5 |
||||||||||||||||||||||
| Australia |
0.58% | 0.51% | 0.51% | |||||||||||||||||||
| New Zealand |
0.27% | 0.28% | 0.31% | |||||||||||||||||||
| Total full time equivalent staff (FTE) |
2,385 | 2,481 | 2,530 | -4% | -6% | |||||||||||||||||
| Aligned adviser numbers6 |
1,785 | 1,819 | 1,823 | -2% | -2% | |||||||||||||||||
| 1. | Corporate and Other includes a one-off tax consolidation benefit of $56 million in September 2015. |
| 2. | Income from invested capital represents after tax revenue generated from investing all Insurance and Funds Management business’s capital balances held for regulatory purposes. The invested capital as at 31 March 2016 was $3.7 billion (Sep 15 & Mar 15: $3.6 billion), which comprises fixed interest securities of 47% and cash deposits of 53% (Sep 15 & Mar 15: 49% fixed interest securities and 51% cash deposits). |
| 3. | In-force premiums reflect the impact of ceasing the underwriting of new home, content, travel and motor insurance in the September 2015 half and the disposal of the New Zealand medical business in the March 2016 half. |
| 4. | A definition change to the retail insurance lapse rate was implemented in the Sep 15 half to reflect the inclusion of partial premium reductions within the policy renewal period. Comparatives have been restated to align with the revised methodology. |
| 5. | Funds Management expense and FUM only relates to Pensions & Investments business. |
| 6. | Includes corporate authorised representatives of dealer groups wholly or partially owned by ANZ Wealth Australia and ANZ employed financial planners. |
75
DIVISIONAL RESULTS
| Wealth | ||||||||||||||||||||||
| Alexis George, David Hisco & Fred Ohlsson | ||||||||||||||||||||||
| Major business units |
||||||||||||||||||||||
| Half Year | Movement | |||||||||||||||||||||
| Insurance |
Mar 16 |
Sep 15 |
Mar 15 |
Mar 16 |
Mar 16 |
|||||||||||||||||
| Net interest income |
15 | 15 | 17 | 0% | -12% | |||||||||||||||||
| Other operating income |
(9) | - | - | n/a | n/a | |||||||||||||||||
| Insurance income |
493 | 500 | 469 | -1% | 5% | |||||||||||||||||
| Insurance volume related expenses |
(150) | (167) | (154) | -10% | -3% | |||||||||||||||||
| Operating income |
349 | 348 | 332 | 0% | 5% | |||||||||||||||||
| Operating expenses |
(144) | (134) | (132) | 7% | 9% | |||||||||||||||||
| Profit before income tax |
205 | 214 | 200 | -4% | 3% | |||||||||||||||||
| Income tax expense and non-controlling interests |
(54) | (59) | (56) | -8% | -4% | |||||||||||||||||
| Cash profit |
151 | 155 | 144 | -3% | 5% | |||||||||||||||||
| Half Year | Movement | |||||||||||||||||||||
| Funds Management |
Mar 16 |
Sep 15 |
Mar 15 |
Mar 16 v. Sep 15 |
Mar 16 v. Mar 15 |
|||||||||||||||||
| Net interest income |
16 | 15 | 15 | 7% | 7% | |||||||||||||||||
| Other operating income |
36 | 35 | 37 | 3% | -3% | |||||||||||||||||
| Funds management income |
409 | 437 | 431 | -6% | -5% | |||||||||||||||||
| Funds management volume related expenses |
(185) | (197) | (199) | -6% | -7% | |||||||||||||||||
| Operating income |
276 | 290 | 284 | -5% | -3% | |||||||||||||||||
| Operating expenses |
(194) | (181) | (171) | 7% | 13% | |||||||||||||||||
| Profit before income tax |
82 | 109 | 113 | -25% | -27% | |||||||||||||||||
| Income tax expense and non-controlling interests |
(24) | (30) | (34) | -20% | -29% | |||||||||||||||||
| Cash profit |
58 | 79 | 79 | -27% | -27% | |||||||||||||||||
| Half Year | Movement | |||||||||||||||||||||
| Private Wealth |
Mar 16 |
Sep 15 |
Mar 15 |
Mar 16 v. Sep 15 |
Mar 16 v. Mar 15 |
|||||||||||||||||
| Net interest income |
90 | 81 | 79 | 11% | 14% | |||||||||||||||||
| Other operating income |
20 | 17 | 19 | 18% | 5% | |||||||||||||||||
| Net funds management income |
29 | 28 | 26 | 4% | 12% | |||||||||||||||||
| Operating income |
139 | 126 | 124 | 10% | 12% | |||||||||||||||||
| Operating expenses |
(64) | (52) | (63) | 23% | 2% | |||||||||||||||||
| Profit before credit impairment and income tax |
75 | 74 | 61 | 1% | 23% | |||||||||||||||||
| Credit impairment charge |
- | (1) | 1 | -100% | -100% | |||||||||||||||||
| Profit before income tax |
75 | 73 | 62 | 3% | 21% | |||||||||||||||||
| Income tax expense and non-controlling interests |
(22) | (22) | (18) | 0% | 22% | |||||||||||||||||
| Cash profit |
53 | 51 | 44 | 4% | 20% | |||||||||||||||||
76
DIVISIONAL RESULTS
Wealth
Alexis George, David Hisco & Fred Ohlsson
| Half Year | Movement | |||||||||||||||||||||
| Operating expenses by business unit | Mar 16 $M |
Sep 15 $M |
Mar 15 $M |
Mar 16 v. Sep 15 |
Mar 16 v. Mar 15 |
|||||||||||||||||
| Insurance |
144 | 134 | 132 | 7% | 9% | |||||||||||||||||
| Funds Management |
194 | 181 | 171 | 7% | 13% | |||||||||||||||||
| Private Wealth |
64 | 52 | 63 | 23% | 2% | |||||||||||||||||
| Corporate and Other |
119 | 114 | 118 | 4% | 1% | |||||||||||||||||
| Total |
521 | 481 | 484 | 8% | 8% | |||||||||||||||||
| Half Year | Movement | |||||||||||||||||||||
| Operating expenses by geographic region |
Mar 16 |
Sep 15 |
Mar 15 |
Mar 16 |
Mar 16 |
|||||||||||||||||
| Australia |
423 | 381 | 387 | 11% | 9% | |||||||||||||||||
| New Zealand |
68 | 68 | 65 | 0% | 5% | |||||||||||||||||
| Asia Pacific, Europe & America |
30 | 32 | 32 | -6% | -6% | |||||||||||||||||
| Total |
521 | 481 | 484 | 8% | 8% | |||||||||||||||||
| Half Year | Movement | |||||||||||||||||||||
| Insurance operating margin | Mar 16 $M |
Sep 15 $M |
Mar 15 $M |
Mar 16 v. Sep 15 |
Mar 16 v. Mar 15 |
|||||||||||||||||
| Life Insurance Planned profit margin |
72 | 78 | 66 | -8% | 9% | |||||||||||||||||
| Experience profit/(loss)1 |
4 | 1 | 4 | large | 0% | |||||||||||||||||
| General Insurance operating profit margin |
51 | 50 | 47 | 2% | 9% | |||||||||||||||||
| Australia |
127 | 129 | 117 | -2% | 9% | |||||||||||||||||
| Life Insurance Planned profit margin |
20 | 23 | 24 | -13% | -17% | |||||||||||||||||
| Experience profit/(loss)1 |
4 | 3 | 3 | 33% | 33% | |||||||||||||||||
| New Zealand |
24 | 26 | 27 | -8% | -11% | |||||||||||||||||
| Total |
151 | 155 | 144 | -3% | 5% | |||||||||||||||||
| 1. | Experience profit/(loss) variations are gains or losses arising from actual experience differing from plan. |
| As at | Movement | |||||||||||||||||||||
| Insurance annual in-force premiums | Mar 16 $M |
Sep 15 $M |
Mar 15 $M |
Mar 16 v. Sep 15 |
Mar 16 v. Mar 15 |
|||||||||||||||||
| Group |
439 | 423 | 390 | 4% | 13% | |||||||||||||||||
| Individual |
1,297 | 1,284 | 1,246 | 1% | 4% | |||||||||||||||||
| General Insurance |
335 | 510 | 518 | -34% | -35% | |||||||||||||||||
| Total |
2,071 | 2,217 | 2,154 | -7% | -4% | |||||||||||||||||
| Insurance annual in-force premiums by region | ||||||||||||||||||||||
| Australia |
1,904 | 2,026 | 1,955 | -6% | -3% | |||||||||||||||||
| New Zealand |
167 | 191 | 199 | -13% | -16% | |||||||||||||||||
| Total |
2,071 | 2,217 | 2,154 | -7% | -4% | |||||||||||||||||
| Insurance in-force book movement | Sep 15 $M |
New business |
Lapses $M |
Mar 16 $M |
||||||||||||
| Group |
423 | 31 | (15 | ) | 439 | |||||||||||
| Individual3 |
1,284 | 108 | (95 | ) | 1,297 | |||||||||||
| General Insurance3 |
510 | 53 | (228 | ) | 335 | |||||||||||
| Total |
2,217 | 192 | (338 | ) | 2,071 | |||||||||||
| Insurance in-force book movement by region |
||||||||||||||||
| Australia3 |
2,026 | 179 | (301 | ) | 1,904 | |||||||||||
| New Zealand3 |
191 | 13 | (37 | ) | 167 | |||||||||||
| Total |
2,217 | 192 | (338 | ) | 2,071 | |||||||||||
| 2. | New business includes the impact of foreign currency gains/ (losses) on translation. |
| 3. | Lapses for General Insurance and Australia include the impact of ceasing the underwriting new home, content, travel and motor insurance in Sep 15 half. Lapses for Individual and New Zealand include the impact of the disposal of the New Zealand medical business in the Mar 16 half. |
77
DIVISIONAL RESULTS
Wealth
Alexis George, David Hisco & Fred Ohlsson
| As at | Movement | |||||||||||||||||||||
| Funds under management | Mar 16 $M |
Sep 15 $M |
Mar 15 $M |
Mar 16 v. Sep 15 |
Mar 16 v. Mar 15 |
|||||||||||||||||
| Funds under management - average |
66,810 | 66,993 | 64,615 | 0% | 3% | |||||||||||||||||
| Funds under management - end of period |
66,522 | 65,392 | 68,405 | 2% | -3% | |||||||||||||||||
| Composed of: |
||||||||||||||||||||||
| Australian equities |
15,955 | 16,124 | 18,040 | -1% | -12% | |||||||||||||||||
| International equities |
17,001 | 17,596 | 18,533 | -3% | -8% | |||||||||||||||||
| Cash and fixed interest |
29,136 | 27,653 | 27,583 | 5% | 6% | |||||||||||||||||
| Property and infrastructure |
4,430 | 4,019 | 4,249 | 10% | 4% | |||||||||||||||||
| Total |
66,522 | 65,392 | 68,405 | 2% | -3% | |||||||||||||||||
| As at | Movement | |||||||||||||||||||||
| Funds under management by region | Mar 16 $M |
Sep 15 $M |
Mar 15 $M |
Mar 16 v. Sep 15 |
Mar 16 v. Mar 15 |
|||||||||||||||||
| Australia |
48,828 | 48,874 | 51,369 | 0% | -5% | |||||||||||||||||
| New Zealand |
17,694 | 16,518 | 17,036 | 7% | 4% | |||||||||||||||||
| Total |
66,522 | 65,392 | 68,405 | 2% | -3% | |||||||||||||||||
| Funds Management cash flows by product | Sep 15 $M |
In- flows |
Out- flows |
Other1 | Mar 16 $M |
|||||||||||||||
| OneAnswer Frontier |
8,677 | 818 | (475 | ) | 146 | 9,166 | ||||||||||||||
| ANZ Smart Choice |
4,254 | 1,183 | (489 | ) | 4,862 | 9,810 | ||||||||||||||
| Oasis Voyage |
1,708 | 205 | (72 | ) | 51 | 1,892 | ||||||||||||||
| Private Wealth - Australia |
2,073 | 293 | (133 | ) | (35 | ) | 2,198 | |||||||||||||
| KiwiSaver |
6,817 | 732 | (260 | ) | 221 | 7,510 | ||||||||||||||
| Private Wealth - New Zealand |
4,976 | 529 | (294 | ) | 68 | 5,279 | ||||||||||||||
| Other New Zealand |
4,725 | 833 | (699 | ) | 46 | 4,905 | ||||||||||||||
| Retail |
20,223 | 430 | (1,317 | ) | (32 | ) | 19,304 | |||||||||||||
| Employer Super |
11,939 | 109 | (806 | ) | (4,784 | ) | 6,458 | |||||||||||||
| Total |
65,392 | 5,132 | (4,545 | ) | 543 | 66,522 | ||||||||||||||
| 1. | Other includes investment income net of taxes, fees and charges, distributions and the impact of foreign currency translations. It also includes the transition of funds under management from Employer Super to ANZ Smart Choice of approximately $5 billion, as a result of regulatory changes in the industry. |
| Embedded value and value of new business (insurance and investments only) |
|
Australia $M |
|
|
New Zealand $M |
|
|
Total $M |
| |||
| Embedded value as at September 20151 |
4,012 | 554 | 4,566 | |||||||||
| Value of new business2 |
62 | 14 | 76 | |||||||||
| Expected return3 |
162 | 24 | 186 | |||||||||
| Experience deviations and assumption changes4 |
29 | - | 29 | |||||||||
| Embedded value before economic assumption changes and net transfer |
4,265 | 592 | 4,857 | |||||||||
| Economic assumptions change |
(4 | ) | 7 | 3 | ||||||||
| Net transfer5 |
206 | (91 | ) | 115 | ||||||||
| Embedded value as at March 2016 |
4,467 | 508 | 4,975 | |||||||||
| 1. | Embedded value represents the present value of future profits and releases of capital arising from the business in-force at the valuation date, and adjusted net assets. It is determined using best estimate assumptions with franking credits included at 70% of face value. Projected cash flows have been discounted using capital asset pricing model risk discount rates of 7.50%-9.25%. ANZ Lenders Mortgage Insurance business is not included in the valuation. |
| 2. | Value of new business represents the present value of future profits less the cost of capital arising from new business written over the period. |
| 3. | Expected return represents the expected increase in value over the period. |
| 4. | Experience deviations and assumption changes arise from deviations and changes to best estimate assumptions underlying the prior period embedded value. Improvement in retention in Insurance business has led to favourable results for the Australian business partially offset by adverse movement from the investment market. |
| 5. | Net transfer represents the net capital movements over the period including capital injections, transfer of cash dividends and value of franking credits. There was a $400 million capital injection from the parent entity, partially offset by $238 million of cash dividends and $47 million of franking credits transferred to the parent entity. |
78
DIVISIONAL RESULTS
This page has been left blank intentionally
79
DIVISIONAL RESULTS
Asia Retail & Pacific
David Hisco
Cash Profit – March 2016 Half Year v March 2015 Half Year
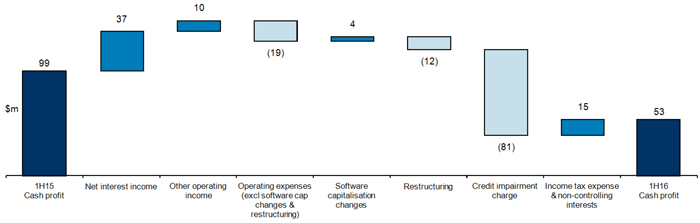
80
DIVISIONAL RESULTS
Asia Retail & Pacific
David Hisco
| Half Year
|
Movement
| |||||||||||
| Mar 16 $M |
Sep 15 $M |
Mar 15 $M |
Mar 16 v. Sep 15 |
Mar 16 v. Mar 15 | ||||||||
| Net interest income |
328 | 314 | 291 | 4% | 13% | |||||||
| Other operating income
|
231
|
236
|
221
|
-2%
|
5%
| |||||||
|
Operating income |
559 |
550 |
512 |
2% |
9% | |||||||
| Operating expenses
|
(401)
|
(395)
|
(374)
|
2%
|
7%
| |||||||
|
Profit before credit impairment and income tax |
158 |
155 |
138 |
2% |
14% | |||||||
| Credit impairment (charge)/release
|
(91)
|
(87)
|
(10)
|
5%
|
large
| |||||||
|
Profit before income tax |
67 |
68 |
128 |
-1% |
-48% | |||||||
| Income tax expense and non-controlling interests
|
(14)
|
(23)
|
(29)
|
-39%
|
-52%
| |||||||
|
Cash profit/(loss)
|
53
|
45
|
99
|
18%
|
-46%
| |||||||
|
Balance Sheet |
||||||||||||
| Net loans & advances |
11,909 | 12,545 | 11,667 | -5% | 2% | |||||||
| Customer deposits |
19,005 | 19,455 | 17,779 | -2% | 7% | |||||||
| Risk weighted assets |
11,617
|
11,945
|
10,767
|
-3%
|
8%
| |||||||
| Ratios |
||||||||||||
| Return on assets |
0.55% | 0.48% | 1.15% | |||||||||
| Net interest margin |
3.51% | 3.46% | 3.49% | |||||||||
| Operating expenses to operating income |
71.7% | 71.8% | 73.0% | |||||||||
| Operating expenses to average assets
|
4.18%
|
4.20%
|
4.33%
|
|||||||||
|
Individual credit impairment charge/(release) |
82 |
78 |
8 |
5% |
large | |||||||
| Individual credit impairment charge/(release) as a % of average GLA |
1.30% | 1.27% | 0.14% | |||||||||
| Collective credit impairment charge/(release) |
9 | 9 | 2 | 0% | large | |||||||
| Collective credit impairment charge/(release) as a % of average GLA |
0.14% | 0.15% | 0.04% | |||||||||
| Gross impaired assets |
232 | 223 | 195 | 4% | 19% | |||||||
| Gross impaired assets as a % of GLA
|
1.92%
|
1.75%
|
1.64%
|
|||||||||
|
Total full time equivalent staff (FTE)
|
3,183
|
3,313
|
3,437
|
-4%
|
-7%
| |||||||
81
DIVISIONAL RESULTS
Technology, Services & Operations and Group Centre
| Half Year
|
Movement
| |||||||||||
| Mar 16 $M |
Sep 15 $M |
Mar 15 $M |
Mar 16 v. Sep 15 |
Mar 16 v. Mar 15 | ||||||||
| Operating income (minority investments in Asia) |
73 | 304 | 311 | -76% | -77% | |||||||
| Operating income (excluding minority investments in Asia)
|
86
|
(28)
|
(104)
|
large
|
large
| |||||||
|
Operating income |
159 |
276 |
207 |
-42% |
-23% | |||||||
| Operating expenses
|
(855)
|
(331)
|
(265)
|
large
|
large
| |||||||
|
Profit before credit impairment and income tax |
(696) |
(55) |
(58) |
large |
large | |||||||
| Credit impairment (charge)/release
|
-
|
(2)
|
1
|
-100%
|
-100%
| |||||||
|
Profit before income tax |
(696) |
(57) |
(57) |
large |
large | |||||||
| Income tax expense and non-controlling interests
|
201
|
46
|
84
|
large
|
large
| |||||||
|
Cash profit/(loss)
|
(495)
|
(11)
|
27
|
large
|
large
| |||||||
|
Risk weighted assets |
6,264 |
4,739 |
4,979 |
32% |
26% | |||||||
|
Total full time equivalent staff (FTE)
|
25,459
|
26,287
|
26,843
|
-3%
|
-5%
| |||||||
82
GEOGRAPHIC RESULTS
CONTENTS
Section 6 – Geographic Results
Geographic performance
Australia geography
Asia Pacific, Europe & America geography
New Zealand geography
83
GEOGRAPHIC REVIEW
Geographic Performance
| The | Group’s divisions operate across multiple geographies with components of the following divisional results reflected in each geography: |
| ¡ | Australia - comprises the Australia division and the Australian operations of Institutional, Wealth and TSO & Group Centre divisions; |
| ¡ | Asia, Pacific, Europe & America (APEA) - comprises the Asia Retail & Pacific division and the APEA components of Institutional, Wealth and TSO & Group Centre divisions; and |
| ¡ | New Zealand - comprises the New Zealand division and the New Zealand components of Institutional, Wealth and TSO & Group Centre divisions. |
| Half Year
|
Movement
| |||||||||||
| Statutory Profit | Mar 16 $M |
Sep 15 $M |
Mar 15 $M |
Mar 16 v. Sep 15 |
Mar 16 v. Mar 15 | |||||||
| Australia |
1,797 | 2,674 | 1,964 | -33% | -9% | |||||||
| Asia Pacific, Europe & America |
237 | 490 | 722 | -52% | -67% | |||||||
| New Zealand
|
704
|
823
|
820
|
-14%
|
-14%
| |||||||
|
Total statutory profit
|
2,738
|
3,987
|
3,506
|
-31%
|
-22%
| |||||||
| Half Year
|
Movement
| |||||||||||
| Cash Profit | Mar 16 $M |
Sep 15 $M |
Mar 15 $M |
Mar 16 v. Sep 15 |
Mar 16 v. Mar 15 | |||||||
| Australia |
1,830 | 2,269 | 2,147 | -19% | -15% | |||||||
| Asia Pacific, Europe & America |
259 | 492 | 743 | -47% | -65% | |||||||
| New Zealand
|
693 | 779 | 786 | -11% | -12% | |||||||
|
Total cash profit
|
2,782 | 3,540 | 3,676 | -21% | -24% | |||||||
| Half Year
|
Movement
| |||||||||||
| Net loans & advances | Mar 16 $M |
Sep 15 $M |
Mar 15 $M |
Mar 16 v. Sep 15 |
Mar 16 v. Mar 15 | |||||||
| Australia |
386,734 | 381,222 | 362,830 | 1% | 7% | |||||||
| Asia Pacific, Europe & America |
69,140 | 85,062 | 88,356 | -19% | -22% | |||||||
| New Zealand
|
105,894 | 103,954 | 107,017 | 2% | -1% | |||||||
|
Total net loans & advances1
|
561,768 | 570,238 | 558,203 | -1% | 1% | |||||||
| Half Year
|
Movement
| |||||||||||
| Customer deposits | Mar 16 $M |
Sep 15 $M |
Mar 15 $M |
Mar 16 v. Sep 15 |
Mar 16 v. Mar 15 | |||||||
| Australia |
245,810 | 238,184 | 227,560 | 3% | 8% | |||||||
| Asia Pacific, Europe & America |
119,704 | 129,263 | 129,733 | -7% | -8% | |||||||
| New Zealand
|
81,264 | 77,137 | 78,854 | 5% | 3% | |||||||
|
Total customer deposits
|
446,778 | 444,584 | 436,147 | 0% | 2% | |||||||
| Half Year
|
Movement
| |||||||||||
| Risk weighted assets | Mar 16 $M |
Sep 15 $M |
Mar 15 $M |
Mar 16 v. Sep 15 |
Mar 16 v. Mar 15 | |||||||
| Australia |
225,273 | 224,830 | 209,981 | 0% | 7% | |||||||
| Asia Pacific, Europe & America |
95,870 | 109,842 | 108,953 | -13% | -12% | |||||||
| New Zealand
|
67,192 | 67,265 | 67,929 | 0% | -1% | |||||||
|
Total risk weighted assets
|
388,335 | 401,937 | 386,863 | -3% | 0% | |||||||
| 1. | Loans & advances as at 30 September 2015 include Esanda Dealer Finance assets divested to Macquarie Group Limited in the March 2016 half. |
84
GEOGRAPHIC REVIEW
Australia geography
| Half Year
|
Movement
| |||||||||||
| Mar 16 $M |
Sep 15 $M |
Mar 15 $M |
Mar 16 v. Sep 15 |
Mar 16 v. Mar 15 | ||||||||
| Net interest income |
5,197 | 5,151 | 4,882 | 1% | 6% | |||||||
| Other operating income
|
1,514 | 1,393 | 1,454 | 9% | 4% | |||||||
|
Operating income |
6,711 | 6,544 | 6,336 | 3% | 6% | |||||||
| Operating expenses
|
(3,490) | (2,871) | (2,792) | 22% | 25% | |||||||
|
Profit before credit impairment and income tax |
3,221 | 3,673 | 3,544 | -12% | -9% | |||||||
| Credit impairment charge
|
(573) | (444) | (428) | 29% | 34% | |||||||
|
Profit before income tax |
2,648 | 3,229 | 3,116 | -18% | -15% | |||||||
| Income tax expense and non-controlling interests
|
(818) | (960) | (969) | -15% | -16% | |||||||
|
Cash profit |
1,830 | 2,269 | 2,147 | -19% | -15% | |||||||
| Adjustments between statutory profit and cash profit
|
(33) | 405 | (183) | large | -82% | |||||||
|
Statutory profit
|
1,797 | 2,674 | 1,964 | -33% | -9% | |||||||
|
Balance Sheet |
||||||||||||
| Net loans & advances1 |
386,734 | 381,222 | 362,830 | 1% | 7% | |||||||
| Other external assets |
191,212 | 180,742 | 174,729 | 6% | 9% | |||||||
|
External assets
|
577,946 | 561,964 | 537,559 | 3% | 8% | |||||||
|
Customer deposits |
245,810 | 238,184 | 227,560 | 3% | 8% | |||||||
| Other deposits and borrowings
|
96,805 | 92,771 | 87,669 | 4% | 10% | |||||||
|
Deposits and other borrowings |
342,615 | 330,955 | 315,229 | 4% | 9% | |||||||
| Other external liabilities
|
186,711 | 188,877 | 179,420 | -1% | 4% | |||||||
|
External liabilities
|
529,326 | 519,832 | 494,649 | 2% | 7% | |||||||
|
Risk weighted assets |
225,273 | 224,830 | 209,981 | 0% | 7% | |||||||
| Average gross loans and advances1 |
388,023 | 377,090 | 358,774 | 3% | 8% | |||||||
| Average deposits and other borrowings |
341,850 | 327,871 | 318,382 | 4% | 7% | |||||||
| Ratios |
||||||||||||
| Net interest margin - cash |
2.27% | 2.30% | 2.29% | |||||||||
| Operating expenses to operating income - cash |
52.0% | 43.9% | 44.1% | |||||||||
| Operating expenses to average assets - cash
|
1.23% | 1.04% | 1.07% | |||||||||
|
Individual credit impairment charge/(release) - cash |
552 | 430 | 375 | 28% | 47% | |||||||
| Individual credit impairment charge/(release) as a % of average GLA1 - cash |
0.28% | 0.23% | 0.21% | |||||||||
| Collective credit impairment charge/(release) - cash |
21 | 14 | 53 | 50% | -60% | |||||||
| Collective credit impairment charge/(release) as a % of average GLA1 - cash |
0.01% | 0.01% | 0.03% | |||||||||
| Gross impaired assets |
1,635 | 1,528 | 1,589 | 7% | 3% | |||||||
| Gross impaired assets as a % of GLA1
|
0.42% | 0.40% | 0.43% | |||||||||
|
Total full time equivalent staff (FTE)
|
20,808 | 21,138 | 22,096 | -2% | -6% | |||||||
| 1. | Loans & advances as at 30 September 2015 include Esanda Dealer Finance assets divested to Macquarie Group Limited in the March 2016 half. |
85
GEOGRAPHIC REVIEW
Asia Pacific, Europe & America geography
Table reflects AUD results for the APEA regions
| Half Year
|
Movement
| |||||||||||
| Statutory Profit | Mar 16 $M |
Sep 15 $M |
Mar 15 $M |
Mar 16 v. Sep 15 |
Mar 16 v. Mar 15 | |||||||
| Asia |
79 | 338 | 571 | -77% | -86% | |||||||
| Europe & America |
64 | 77 | 65 | -17% | -2% | |||||||
| Pacific
|
94 | 75 | 86 | 25% | 9% | |||||||
|
Total statutory profit
|
237 | 490 | 722 | -52% | -67% | |||||||
| Half Year
|
Movement
| |||||||||||
| Cash Profit | Mar 16 $M |
Sep 15 $M |
Mar 15 $M |
Mar 16 v. Sep 15 |
Mar 16 v. Mar 15 | |||||||
| Asia |
79 | 338 | 571 | -77% | -86% | |||||||
| Europe & America |
86 | 79 | 86 | 9% | 0% | |||||||
| Pacific
|
94 | 75 | 86 | 25% | 9% | |||||||
|
Total cash profit
|
259 | 492 | 743 | -47% | -65% | |||||||
| Half Year
|
Movement
| |||||||||||
| Net loans & advances | Mar 16 $M |
Sep 15 $M |
Mar 15 $M |
Mar 16 v. Sep 15 |
Mar 16 v. Mar 15 | |||||||
| Asia |
57,532 | 73,236 | 76,459 | -21% | -25% | |||||||
| Europe & America |
7,882 | 7,697 | 8,006 | 2% | -2% | |||||||
| Pacific
|
3,726 | 4,129 | 3,891 | -10% | -4% | |||||||
|
Total net loans & advances
|
69,140 | 85,062 | 88,356 | -19% | -22% | |||||||
| Half Year
|
Movement
| |||||||||||
| Customer deposits | Mar 16 $M |
Sep 15 $M |
Mar 15 $M |
Mar 16 v. Sep 15 |
Mar 16 v. Mar 15 | |||||||
| Asia |
64,412 | 73,495 | 72,335 | -12% | -11% | |||||||
| Europe & America |
49,888 | 50,129 | 51,936 | 0% | -4% | |||||||
| Pacific
|
5,404 | 5,639 | 5,462 | -4% | -1% | |||||||
|
Total customer deposits
|
119,704 | 129,263 | 129,733 | -7% | -8% | |||||||
| Half Year
|
Movement
| |||||||||||
| Risk weighted assets | Mar 16 $M |
Sep 15 $M |
Mar 15 $M |
Mar 16 v. Sep 15 |
Mar 16 v. Mar 15 | |||||||
| Asia |
64,112 | 76,295 | 78,274 | -16% | -18% | |||||||
| Europe & America |
24,212 | 25,956 | 22,514 | -7% | 8% | |||||||
| Pacific
|
7,546 | 7,591 | 8,165 | -1% | -8% | |||||||
|
Total risk weighted assets
|
95,870 | 109,842 | 108,953 | -13% | -12% | |||||||
86
GEOGRAPHIC REVIEW
Asia Pacific, Europe & America geography
Table reflects AUD for the APEA region
| Half Year
|
Movement
| |||||||||||
| Mar 16 $M |
Sep 15 $M |
Mar 15 $M |
Mar 16 v. Sep 15 |
Mar 16 v. Mar 15 | ||||||||
| Net interest income |
993 | 987 | 926 | 1% | 7% | |||||||
| Other operating income
|
862 | 1,016 | 1,127 | -15% | -24% | |||||||
|
Operating income |
1,855 | 2,003 | 2,053 | -7% | -10% | |||||||
| Operating expenses
|
(1,236) | (1,224) | (1,120) | 1% | 10% | |||||||
|
Profit before credit impairment and income tax |
619 | 779 | 933 | -21% | -34% | |||||||
| Credit impairment charge
|
(299) | (209) | (53) | 43% | large | |||||||
|
Profit before income tax |
320 | 570 | 880 | -44% | -64% | |||||||
| Income tax expense and non-controlling interests
|
(61) | (78) | (137) | -22% | -55% | |||||||
|
Cash profit1 |
259 | 492 | 743 | -47% | -65% | |||||||
| Adjustments between statutory profit and cash profit
|
(22) | (2) | (21) | large | 5% | |||||||
|
Statutory profit
|
237 | 490 | 722 | -52% | -67% | |||||||
|
Balance Sheet |
||||||||||||
| Net loans & advances |
69,140 | 85,062 | 88,356 | -19% | -22% | |||||||
| Other external assets
|
105,526 | 105,781 | 96,512 | 0% | 9% | |||||||
|
External assets
|
174,666 | 190,843 | 184,868 | -8% | -6% | |||||||
| Customer deposits |
119,704 | 129,263 | 129,733 | -7% | -8% | |||||||
| Other deposits and borrowings
|
27,772 | 28,207 | 35,764 | -2% | -22% | |||||||
|
Deposits and other borrowings |
147,476 | 157,470 | 165,497 | -6% | -11% | |||||||
| Other external liabilities
|
37,267 | 37,698 | 30,025 | -1% | 24% | |||||||
|
External liabilities
|
184,743 | 195,168 | 195,522 | -5% | -6% | |||||||
|
Risk weighted assets |
95,870 | 109,842 | 108,953 | -13% | -12% | |||||||
| Average gross loans and advances |
79,132 | 86,886 | 86,172 | -9% | -8% | |||||||
| Average deposits and other borrowings |
156,569 | 156,228 | 151,272 | 0% | 4% | |||||||
| Ratios |
||||||||||||
| Net interest margin - cash |
1.11% | 1.12% | 1.10% | |||||||||
| Operating expenses to operating income - cash |
66.6% | 61.1% | 54.6% | |||||||||
| Operating expenses to average assets - cash
|
1.21% | 1.23% | 1.19% | |||||||||
|
Individual credit impairment charge/(release) - cash |
294 | 191 | 46 | 54% | large | |||||||
| Individual credit impairment charge/(release) as a % of average GLA - cash |
0.74% | 0.44% | 0.11% | |||||||||
| Collective credit impairment charge/(release) - cash |
5 | 18 | 7 | -72% | -29% | |||||||
| Collective credit impairment charge/(release) as a % of average GLA - cash |
0.01% | 0.04% | 0.02% | |||||||||
| Gross impaired assets |
939 | 811 | 609 | 16% | 54% | |||||||
| Gross impaired assets as a % of GLA
|
1.32% | 0.94% | 0.68% | |||||||||
|
Total full time equivalent staff (FTE)
|
20,025 | 20,910 | 20,910 | -4% | -4% | |||||||
| 1. | Includes the Asia Retail & Pacific division (Mar 16 half: $53 million, Sep 15 half: $45 million; Mar 15 half: $99 million), and the APEA components of Institutional (Mar 16 half: $180 million, Sep 15 half: $191 million; Mar 15 half: $372 million), Wealth (Mar 16 half: $4 million; Sep 15 half: -$3 million; Mar 15 half: -$1 million), and TSO & Group Centre (Mar 16 half: $22 million, Sep 15 half: $259 million; Mar 15 half: $273 million). |
87
GEOGRAPHIC REVIEW
Asia Pacific, Europe & America geography
Table reflects USD for the APEA region
| Half Year
|
Movement
| |||||||||||
| Mar 16 USD M |
Sep 15 USD M |
Mar 15 USD M |
Mar 16 v. Sep 15 |
Mar 16 v. Mar 15 | ||||||||
| Net interest income |
716 | 740 | 759 | -3% | -6% | |||||||
| Other operating income
|
621 | 755 | 924 | -18% | -33% | |||||||
|
Operating income |
1,337 | 1,495 | 1,683 | -11% | -21% | |||||||
| Operating expenses
|
(892) | (920) | (918) | -3% | -3% | |||||||
|
Profit before credit impairment and income tax |
445 | 575 | 765 | -23% | -42% | |||||||
| Credit impairment charge
|
(216) | (161) | (44) | 34% | large | |||||||
|
Profit before income tax |
229 | 414 | 721 | -45% | -68% | |||||||
| Income tax expense and non-controlling interests
|
(43) | (55) | (112) | -22% | -62% | |||||||
|
Cash profit |
186 | 359 | 609 | -48% | -69% | |||||||
| Adjustments between statutory profit and cash profit
|
(15) | (1) | (17) | large | -12% | |||||||
|
Statutory profit
|
171 | 358 | 592 | -52% | -71% | |||||||
|
Balance Sheet |
||||||||||||
| Net loans & advances |
52,899 | 59,654 | 67,451 | -11% | -22% | |||||||
| Other external assets
|
80,738 | 74,184 | 73,677 | 9% | 10% | |||||||
|
External assets
|
133,637 | 133,838 | 141,128 | 0% | -5% | |||||||
|
Customer deposits |
91,585 | 90,653 | 99,038 | 1% | -8% | |||||||
| Other deposits and borrowings
|
21,249 | 19,781 | 27,303 | 7% | -22% | |||||||
|
Deposits and other borrowings |
112,834 | 110,434 | 126,341 | 2% | -11% | |||||||
| Other external liabilities
|
28,513 | 26,437 | 22,921 | 8% | 24% | |||||||
|
External liabilities
|
141,347 | 136,871 | 149,262 | 3% | -5% | |||||||
|
Risk weighted assets |
73,350 | 77,032 | 83,175 | -5% | -12% | |||||||
| Average gross loans and advances |
57,070 | 65,013 | 70,659 | -12% | -19% | |||||||
| Average deposits and other borrowings |
112,916 | 117,030 | 124,040 | -4% | -9% | |||||||
| Ratios |
||||||||||||
| Net interest margin - cash |
1.11% | 1.12% | 1.10% | |||||||||
| Operating expenses to operating income - cash |
66.6% | 61.5% | 54.6% | |||||||||
| Operating expenses to average assets - cash
|
1.21% | 1.23% | 1.19% | |||||||||
|
Individual credit impairment charge/(release) - cash |
211 | 148 | 38 | 43% | large | |||||||
| Individual credit impairment charge/(release) as a % of average GLA - cash |
0.74% | 0.44% | 0.11% | |||||||||
| Collective credit impairment charge/(release) - cash |
5 | 13 | 6 | -62% | -17% | |||||||
| Collective credit impairment charge/(release) as a % of average GLA - cash |
0.01% | 0.04% | 0.02% | |||||||||
| Gross impaired assets |
710 | 570 | 466 | 25% | 52% | |||||||
| Gross impaired assets as a % of GLA
|
1.32% | 0.94% | 0.68% | |||||||||
|
Total full time equivalent staff (FTE)
|
20,025 | 20,910 | 20,910 | -4% | -4% | |||||||
88
GEOGRAPHIC REVIEW
New Zealand geography
Table reflects AUD results for the New Zealand geography
| Half Year
|
Movement
| |||||||||||
| Mar 16 $M |
Sep 15 $M |
Mar 15 $M |
Mar 16 v. Sep 15 |
Mar 16 v. Mar 15 | ||||||||
| Net interest income |
1,378 | 1,341 | 1,330 | 3% | 4% | |||||||
| Other operating income
|
372 | 455 | 476 | -18% | -22% | |||||||
|
Operating income |
1,750 | 1,796 | 1,806 | -3% | -3% | |||||||
| Operating expenses
|
(753) | (680) | (691) | 11% | 9% | |||||||
|
Profit before credit impairment and income tax |
997 | 1,116 | 1,115 | -11% | -11% | |||||||
| Credit impairment charge
|
(46) | (42) | (29) | 10% | 59% | |||||||
|
Profit before income tax |
951 | 1,074 | 1,086 | -11% | -12% | |||||||
| Income tax expense and non-controlling interests
|
(258) | (295) | (300) | -13% | -14% | |||||||
|
Cash profit |
693 | 779 | 786 | -11% | -12% | |||||||
| Adjustments between statutory profit and cash profit
|
11 | 44 | 34 | -75% | -68% | |||||||
|
Statutory profit
|
704 | 823 | 820 | -14% | -14% | |||||||
|
Balance Sheet |
||||||||||||
| Net loans & advances |
105,894 | 103,954 | 107,017 | 2% | -1% | |||||||
| Other external assets
|
36,771 | 33,139 | 30,637 | 11% | 20% | |||||||
|
External assets
|
142,665 | 137,093 | 137,654 | 4% | 4% | |||||||
|
Customer deposits |
81,264 | 77,137 | 78,854 | 5% | 3% | |||||||
| Other deposits and borrowings
|
6,716 | 5,232 | 7,635 | 28% | -12% | |||||||
|
Deposits and other borrowings |
87,980 | 82,369 | 86,489 | 7% | 2% | |||||||
| Other external liabilities
|
36,764 | 35,178 | 31,375 | 5% | 17% | |||||||
|
External liabilities
|
124,744 | 117,547 | 117,864 | 6% | 6% | |||||||
|
Risk weighted assets |
67,192 | 67,265 | 67,929 | 0% | -1% | |||||||
| Average gross loans and advances |
107,761 | 103,633 | 100,920 | 4% | 7% | |||||||
| Average deposits and other borrowings |
88,816 | 83,610 | 82,150 | 6% | 8% | |||||||
| Ratios |
||||||||||||
| Net interest margin - cash |
2.19% | 2.22% | 2.27% | |||||||||
| Operating expenses to operating income - cash |
43.0% | 37.8% | 38.3% | |||||||||
| Operating expenses to average assets - cash
|
1.03% | 0.97% | 1.05% | |||||||||
|
Individual credit impairment charge/(release) - cash |
46 | 34 | 34 | 35% | 35% | |||||||
| Individual credit impairment charge/(release) as a % of average GLA - cash |
0.09% | 0.07% | 0.07% | |||||||||
| Collective credit impairment charge/(release) - cash |
- | 8 | (5) | -100% | -100% | |||||||
| Collective credit impairment charge/(release) as a % of average GLA - cash |
0.00% | 0.02% | (0.01%) | |||||||||
| Gross impaired assets |
309 | 379 | 510 | -18% | -39% | |||||||
| Gross impaired assets as a % of GLA
|
0.29% | 0.36% | 0.48% | |||||||||
|
Total full time equivalent staff (FTE)
|
8,063 | 8,104 | 8,237 | -1% | -2% | |||||||
89
GEOGRAPHIC REVIEW
New Zealand geography
Table reflects NZD results for the New Zealand geography
| Half Year
|
Movement
| |||||||||||
| Mar 16 NZD M |
Sep 15 NZD M |
Mar 15 NZD M |
Mar 16 v. Sep 15 |
Mar 16 v. Mar 15 | ||||||||
| Net interest income |
1,493 | 1,458 | 1,422 | 2% | 5% | |||||||
| Other operating income
|
402 | 496 | 509 | -19% | -21% | |||||||
|
Operating income |
1,895 | 1,954 | 1,931 | -3% | -2% | |||||||
| Operating expenses
|
(815) | (739) | (739) | 10% | 10% | |||||||
|
Profit before credit impairment and income tax |
1,080 | 1,215 | 1,192 | -11% | -9% | |||||||
| Credit impairment charge
|
(50) | (45) | (31) | 11% | 61% | |||||||
|
Profit before income tax |
1,030 | 1,170 | 1,161 | -12% | -11% | |||||||
| Income tax expense and non-controlling interests
|
(279) | (324) | (320) | -14% | -13% | |||||||
|
Cash profit |
751 | 846 | 841 | -11% | -11% | |||||||
| Adjustments between statutory profit and cash profit
|
12 | 48 | 36 | -75% | -67% | |||||||
|
Statutory profit
|
763 | 894 | 877 | -15% | -13% | |||||||
|
Balance Sheet |
||||||||||||
| Net loans & advances |
117,470 | 114,376 | 109,031 | 3% | 8% | |||||||
| Other external assets
|
40,792 | 36,460 | 31,214 | 12% | 31% | |||||||
|
External assets
|
158,262 | 150,836 | 140,245 | 5% | 13% | |||||||
|
Customer deposits |
90,148 | 84,870 | 80,338 | 6% | 12% | |||||||
| Other deposits and borrowings
|
7,450 | 5,756 | 7,778 | 29% | -4% | |||||||
|
Deposits and other borrowings |
97,598 | 90,626 | 88,116 | 8% | 11% | |||||||
| Other external liabilities
|
40,783 | 38,705 | 31,966 | 5% | 28% | |||||||
|
External liabilities
|
138,381 | 129,331 | 120,082 | 7% | 15% | |||||||
|
Risk weighted assets |
74,537 | 74,008 | 69,208 | 1% | 8% | |||||||
| Average gross loans and advances |
116,743 | 112,712 | 107,898 | 4% | 8% | |||||||
| Average deposits and other borrowings |
96,219 | 90,942 | 87,830 | 6% | 10% | |||||||
| Ratios |
||||||||||||
| Net interest margin - cash |
2.19% | 2.22% | 2.27% | |||||||||
| Operating expenses to operating income - cash |
43.0% | 37.8% | 38.3% | |||||||||
| Operating expenses to average assets - cash
|
1.03% | 0.97% | 1.05% | |||||||||
|
Individual credit impairment charge/(release) - cash |
50 | 36 | 37 | 39% | 35% | |||||||
| Individual credit impairment charge/(release) as a % of average GLA - cash |
0.09% | 0.07% | 0.07% | |||||||||
| Collective credit impairment charge/(release) - cash |
- | 9 | (6) | -100% | -100% | |||||||
| Collective credit impairment charge/(release) as a % of average GLA - cash |
0.00% | 0.02% | (0.01%) | |||||||||
| Gross impaired assets |
343 | 419 | 523 | -18% | -34% | |||||||
| Gross impaired assets as a % of GLA
|
0.29% | 0.36% | 0.48% | |||||||||
|
Total full time equivalent staff (FTE)
|
8,063 | 8,104 | 8,237 | -1% | -2% | |||||||
90
PROFIT RECONCILIATION
CONTENTS
Section 7 – Profit Reconciliation
Adjustments between statutory profit and cash profit
Explanation of adjustments between statutory profit and cash profit
Other reclassifications between statutory profit and cash profit
Reconciliation of statutory profit to cash profit
91
PROFIT RECONCILIATION
Non-IFRS information
The Group provides additional measures of performance in the Consolidated Financial Report & Dividend Announcement which are prepared on a basis other than in accordance with accounting standards. The guidance provided in ASIC’s RG230 has been followed when presenting this information.
Adjustments between statutory profit and cash profit
Cash profit represents ANZ’s preferred measure of the result of the ongoing business activities of the Group, enabling readers to assess Group and Divisional performance against prior periods and against peer institutions. To calculate cash profit, the Group excludes non-core items from statutory profit (refer to Definitions for further details). The adjustments made in arriving at cash profit are included in statutory profit which is subject to review within the context of the external auditor’s review of the Condensed Consolidated Financial Statements. Cash profit is not subject to review or audit by the external auditor, however, the external auditor has informed the Audit Committee that the adjustments have been determined on a consistent basis across each period presented.
| Half Year
|
Movement
| |||||||||||
| Mar 16 $M |
Sep 15 $M |
Mar 15 $M |
Mar 16 v. Sep 15 |
Mar 16 v. Mar 15 | ||||||||
| Statutory profit attributable to shareholders of the Company |
2,738 | 3,987 | 3,506 | -31% | -22% | |||||||
| Adjustments between statutory profit and cash profit |
||||||||||||
| Treasury shares adjustments |
(29) | (95) | 79 | -69% | large | |||||||
| Revaluation of policy liabilities |
(14) | (6) | (67) | large | -79% | |||||||
| Economic hedges |
128 | (165) | (14) | large | large | |||||||
| Revenue and net investment hedges |
(39) | (179) | 176 | -78% | large | |||||||
| Structured credit intermediation trades |
(2) | (2) | (4) | 0% | -50% | |||||||
|
Total adjustments between statutory profit and cash profit
|
44 | (447) | 170 | large | -74% | |||||||
|
Cash Profit
|
2,782 | 3,540 | 3,676 | -21% | -24% | |||||||
Explanation of adjustments between statutory profit and cash profit
| • | Treasury shares adjustment |
ANZ shares held by the Group in the Wealth business are deemed to be Treasury shares for accounting purposes. Dividends and realised and unrealised gains and losses from these shares are reversed as these are not permitted to be recognised as income for statutory reporting purposes. In deriving cash profit, these earnings are included to ensure there is no asymmetrical impact on the Group’s profits because the Treasury shares are held to support policy liabilities which are revalued through the Income Statement. Accordingly, the half year loss of $29 million after tax ($34 million pre-tax) reversed for statutory accounting purposes has been added back to cash profit.
| • | Revaluation of policy liabilities |
When calculating policy liabilities, the projected future cash flows on insurance contracts are discounted to reflect the present value of the obligation, with the impact of changes in the market discount rate each period being reflected in the income statement. ANZ includes the impact on the re-measurement of the insurance contract attributable to changes in market discount rates as an adjustment to statutory profit to remove the volatility attributable to changes in market interest rates which reverts to zero over the life of the insurance contract.
92
PROFIT RECONCILIATION
| • | Economic hedging and Revenue and net investment hedges |
The Group enters into economic hedges to manage its interest rate and foreign exchange risk. The application of “AASB 139: Financial Instruments – Recognition and Measurement” results in fair value gains and losses being recognised within the income statement. ANZ removes the mark-to-market adjustments from cash profit as the profit or loss resulting from the hedge transactions will reverse over time to match with the profit or loss from the economically hedged item as part of cash profit. This includes gains and losses arising from approved classes of derivatives not designated in accounting hedge relationships but which are considered to be economic hedges, including hedges of larger foreign exchange denominated revenue and expense streams, primarily NZD and USD (and USD correlated), as well as ineffectiveness from designated accounting hedges.
Economic hedging comprises:
| – | Funding related swaps (primarily cross currency interest rate swaps) that are being used to convert the proceeds of foreign currency debt issuances into floating rate Australian dollar and New Zealand dollar debt. As these swaps do not qualify for hedge accounting, movements in the fair values are recorded in the income statement. The main drivers of these fair values are currency basis spreads and the Australian dollar and New Zealand dollar fluctuations against other major funding currencies. |
| – | Economic hedges of select structured finance and specialised leasing transactions that do not qualify for hedge accounting. The main drivers of these fair value adjustments are Australian and New Zealand yield curve movements. |
| – | Ineffectiveness from designated accounting hedge relationships. |
The majority of the half year gain/loss in economic hedging is related to funding related swaps that were impacted by the significant strengthening in the AUD across a number of major currencies, most notably the USD and EUR.
Gains/losses on revenue and net investment hedges in the March 2016 half were principally attributable to the recycling of the impact of prior period losses on USD positions that settled during the half.
| Half Year
| ||||||
| Adjustments to the income statement | Mar 16 $M |
Sep 15 $M |
Mar 15 $M | |||
| Timing differences where IFRS results in asymmetry between the hedge and hedged items |
||||||
| Economic hedging |
181 | (236) | (20) | |||
| Revenue and net investment hedges |
(55) | (256) | 252 | |||
|
Increase/(decrease) to cash profit before tax
|
126 | (492) | 232 | |||
|
Increase/(decrease) to cash profit after tax
|
89 | (344) | 162 | |||
| As at | ||||||
| Cumulative increase/(decrease) to cash profit pre-tax | Mar 16 $M |
Sep 15 $M |
Mar 15 $M | |||
| Timing differences where IFRS results in asymmetry between the hedge and hedged items |
||||||
| Economic hedging1 |
443 | 294 | 530 | |||
| Revenue and net investment hedges
|
(23) | 32 | 288 | |||
| 420
|
326 | 818 | ||||
| 1. | A reduction of $32 million was made to the cumulative economic hedging balance on 1 October 2015. The reduction related to balances not recycled into cash profit between 2008 and 2014. |
93
PROFIT RECONCILIATION
| • | Structured credit intermediation trades |
ANZ entered into a series of structured credit intermediation trades with US financial guarantors from 2004 to 2007. The underlying structures involved credit default swaps (CDSs) over synthetic collateralised debt obligations (CDOs), portfolios of external collateralised loan obligations (CLOs) or specific bonds/floating rate notes (FRNs). ANZ sold protection using CDSs over these structures and then to mitigate risk, purchased protection via CDSs over the same structures from eight US financial guarantors.
Being derivatives, both the sold protection and purchased protection are measured at fair value and marked-to-model. Prior to the commencement of the global financial crisis, movements in valuations of these positions were not significant and largely offset each other in income. Following the onset of the global financial crisis, the purchased protection has provided only a partial offset against movements in valuation of the sold protection because:
| – | one of the counterparties to the purchased protection defaulted and many of the remaining counterparties were downgraded; and |
| – | a credit valuation adjustment is applied to the remaining counterparties to the purchased protection reflecting changes to their credit worthiness. |
ANZ is actively monitoring this portfolio with a view to reducing the exposures via termination and restructuring of both the bought and sold protection if and when ANZ deems it cost effective relative to the perceived risk associated with a specific trade or counterparty. As at 31 March 2016, ANZ’s remaining exposure is against two financial guarantors.
The bought and sold protection trades are by nature largely offsetting, with the notional amount on the outstanding bought CDSs and outstanding sold CDSs at 31 March 2016 each amounting to $0.7 billion (Sep 15: $0.7 billion; Mar 15: $0.8 billion).
The profit and loss impact of credit risk on structured credit derivatives is driven by market movements in credit spreads and AUD/USD and NZD/USD rates.
The (gain)/loss on structured credit intermediation trades is included as an adjustment to cash profit as it relates to a legacy business where, unless terminated early, the fair value movements are expected to reverse to zero in future periods.
| Half Year
|
Movement
| |||||||||||
| Increase/(decrease) to cash profit | Mar 16 $M |
Sep 15 $M |
Mar 15 $M |
Mar 16 v. Sep 15 |
Mar 16 v. Mar 15 | |||||||
| Profit before income tax |
(3) | (3) | (5) | 0% | -40% | |||||||
| Income tax expense
|
1 | 1 | 1 | 0% | 0% | |||||||
|
Profit after income tax
|
(2) | (2) | (4) | 0% | -50% | |||||||
| As at
|
Movement
| |||||||||||
| Financial impacts of credit intermediation trades | Mar 16 $M |
Sep 15 $M |
Mar 15 $M |
Mar 16 v. Sep 15 |
Mar 16 v. Mar 15 | |||||||
| Mark-to-market exposure to financial guarantors
|
63 | 69 | 78 | -9% | -19% | |||||||
| Cumulative costs relating to financial guarantors1 |
||||||||||||
| CVA for outstanding transactions |
14 | 17 | 19 | -18% | -26% | |||||||
| Realised close out and hedge costs
|
372 | 372 | 373 | 0% | 0% | |||||||
|
Cumulative life to date charges
|
386 | 389 | 392 | -1% | -2% | |||||||
| 1. | The cumulative costs in managing the positions include realised losses relating to restructuring of trades in order to reduce risks and realised losses on termination of sold protection trades. It also includes foreign exchange hedging losses. |
Other reclassifications between statutory profit and cash profit
| • | Credit risk on impaired derivatives (nil profit after tax impact) |
The charge to income for credit valuation adjustments of $14 million on defaulted and impaired derivative exposures has been reclassified to cash credit impairment charges in the March 2016 half year (Sep 15 half: $10 million charge; Mar 15 half: $16 million charge). The reclassification has been made to reflect the manner in which the defaulted and impaired derivatives are managed.
| • | Policyholders tax gross up (nil profit after tax impact) |
For statutory reporting purposes, policyholder income tax and other related taxes paid on behalf of policyholders are included in both net funds management and insurance income and the Group’s income tax expense. The gross up of $32 million for the March 2016 half year (Sep 15 half: $91 million net down; Mar 15 half: $277 million gross up) has been excluded from the cash results as it does not reflect the underlying performance of the business which is assessed on a net of policyholder tax basis.
94
PROFIT RECONCILIATION
|
Statutory
profit
|
Adjustments to statutory profit
|
Cash profit |
||||||||||||||||||||||||||||||||||||||
| Treasury shares adjustment |
Policy-holders tax gross up |
Revaluation of policy liabilities |
Economic hedging |
Revenue and net investment hedges |
Structured credit |
Credit risk on impaired derivatives |
Total adjustments to statutory profit |
|||||||||||||||||||||||||||||||||
| $M | $M | $M | $M | $M | $M | $M | $M | $M | $M | |||||||||||||||||||||||||||||||
| March 2016 Half Year |
||||||||||||||||||||||||||||||||||||||||
| Net interest income
|
7,568 | - | - | - | - | - | - | - | - | 7,568 | ||||||||||||||||||||||||||||||
|
Net fee and commission income |
1,268 | - | - | - | - | - | - | - | - | 1,268 | ||||||||||||||||||||||||||||||
| Net foreign exchange earnings |
602 | - | - | - | (5) | (55) | - | - | (60) | 542 | ||||||||||||||||||||||||||||||
| Profit on trading instruments |
(86) | - | - | - | 50 | - | (3) | 14 | 61 | (25) | ||||||||||||||||||||||||||||||
| Net funds management and insurance income |
857 | (34) | (32) | (20) | - | - | - | - | (86) | 771 | ||||||||||||||||||||||||||||||
| Other
|
56 | - | - | - | 136 | - | - | - | 136 | 192 | ||||||||||||||||||||||||||||||
|
Other operating income
|
2,697 | (34) | (32) | (20) | 181 | (55) | (3) | 14 | 51 | 2,748 | ||||||||||||||||||||||||||||||
|
Operating income |
10,265 | (34) | (32) | (20) | 181 | (55) | (3) | 14 | 51 | 10,316 | ||||||||||||||||||||||||||||||
| Operating expenses
|
(5,479) | - | - | - | - | - | - | - | - | (5,479) | ||||||||||||||||||||||||||||||
|
Profit before credit impairment and tax |
4,786 | (34) | (32) | (20) | 181 | (55) | (3) | 14 | 51 | 4,837 | ||||||||||||||||||||||||||||||
| Credit impairment charge
|
(904) | - | - | - | - | - | - | (14) | (14) | (918) | ||||||||||||||||||||||||||||||
|
Profit before income tax |
3,882 | (34) | (32) | (20) | 181 | (55) | (3) | - | 37 | 3,919 | ||||||||||||||||||||||||||||||
| Income tax expense |
(1,140) | 5 | 32 | 6 | (53) | 16 | 1 | - | 7 | (1,133) | ||||||||||||||||||||||||||||||
| Non-controlling interests
|
(4) | - | - | - | - | - | - | - | - | (4) | ||||||||||||||||||||||||||||||
|
Profit
|
2,738 | (29) | - | (14) | 128 | (39) | (2) | - | 44 | 2,782 | ||||||||||||||||||||||||||||||
|
September 2015 Half Year |
||||||||||||||||||||||||||||||||||||||||
| Net interest income
|
7,478 | - | - | - | - | - | - | - | - | 7,478 | ||||||||||||||||||||||||||||||
|
Net fee and commission income |
1,328 | - | - | - | - | - | - | - | - | 1,328 | ||||||||||||||||||||||||||||||
| Net foreign exchange earnings |
747 | - | - | - | 3 | (256) | - | - | (253) | 494 | ||||||||||||||||||||||||||||||
| Profit on trading instruments |
(219) | - | - | - | (21) | - | (3) | 10 | (14) | (233) | ||||||||||||||||||||||||||||||
| Net funds management and insurance income |
795 | (107) | 91 | (7) | - | - | - | - | (23) | 772 | ||||||||||||||||||||||||||||||
| Other
|
721 | - | - | - | (218) | - | - | - | (218) | 503 | ||||||||||||||||||||||||||||||
|
Other operating income
|
3,372 | (107) | 91 | (7) | (236) | (256) | (3) | 10 | (508) | 2,864 | ||||||||||||||||||||||||||||||
|
Operating income |
10,850 | (107) | 91 | (7) | (236) | (256) | (3) | 10 | (508) | 10,342 | ||||||||||||||||||||||||||||||
| Operating expenses
|
(4,775) | - | - | - | - | - | - | - | - | (4,775) | ||||||||||||||||||||||||||||||
|
Profit before credit impairment and tax |
6,075 | (107) | 91 | (7) | (236) | (256) | (3) | 10 | (508) | 5,567 | ||||||||||||||||||||||||||||||
|
Credit impairment charge
|
(685) | - | - | - | - | - | - | (10) | (10) | (695) | ||||||||||||||||||||||||||||||
|
Profit before income tax |
5,390 | (107) | 91 | (7) | (236) | (256) | (3) | - | (518) | 4,872 | ||||||||||||||||||||||||||||||
| Income tax expense |
(1,397) | 12 | (91) | 1 | 71 | 77 | 1 | - | 71 | (1,326) | ||||||||||||||||||||||||||||||
| Non-controlling interests
|
(6) | - | - | - | - | - | - | - | - | (6) | ||||||||||||||||||||||||||||||
|
Profit
|
3,987 | (95) | - | (6) | (165) | (179) | (2) | - | (447) | 3,540 | ||||||||||||||||||||||||||||||
95
PROFIT RECONCILIATION
|
Statutory
profit
|
Adjustments to statutory profit
|
Cash
profit
|
||||||||||||||||||||||||||||||||||||||
| Treasury shares adjustment |
Policy-holders tax gross up |
Revaluation of policy liabilities |
Economic hedging |
Revenue and net investment hedges |
Structured credit |
Credit risk on impaired derivatives |
Total adjustments to statutory profit |
|||||||||||||||||||||||||||||||||
| $M | $M | $M | $M | $M | $M | $M | $M | $M | $M | |||||||||||||||||||||||||||||||
| March 2015 Half Year |
||||||||||||||||||||||||||||||||||||||||
| Net interest income
|
7,138 | - | - | - | - | - | - | - | - | 7,138 | ||||||||||||||||||||||||||||||
|
Net fee and commission income |
1,303 | - | - | - | - | - | - | - | - | 1,303 | ||||||||||||||||||||||||||||||
| Net foreign exchange earnings |
258 | - | - | - | - | 252 | - | - | 252 | 510 | ||||||||||||||||||||||||||||||
| Profit on trading instruments |
99 | - | - | - | 12 | - | (5) | 16 | 23 | 122 | ||||||||||||||||||||||||||||||
| Net funds management and insurance income |
1,020 | 86 | (277) | (97) | - | - | - | - | (288) | 732 | ||||||||||||||||||||||||||||||
| Other
|
422 | - | - | - | (32) | - | - | - | (32) | 390 | ||||||||||||||||||||||||||||||
|
Other operating income
|
3,102 | 86 | (277) | (97) | (20) | 252 | (5) | 16 | (45) | 3,057 | ||||||||||||||||||||||||||||||
|
Operating income |
10,240 | 86 | (277) | (97) | (20) | 252 | (5) | 16 | (45) | 10,195 | ||||||||||||||||||||||||||||||
| Operating expenses
|
(4,603) | - | - | - | - | - | - | - | - | (4,603) | ||||||||||||||||||||||||||||||
|
Profit before credit impairment and tax |
5,637 | 86 | (277) | (97) | (20) | 252 | (5) | 16 | (45) | 5,592 | ||||||||||||||||||||||||||||||
| Credit impairment charge
|
(494) | - | - | - | - | - | - | (16) | (16) | (510) | ||||||||||||||||||||||||||||||
|
Profit before income tax |
5,143 | 86 | (277) | (97) | (20) | 252 | (5) | - | (61) | 5,082 | ||||||||||||||||||||||||||||||
| Income tax expense |
(1,629) | (7) | 277 | 30 | 6 | (76) | 1 | - | 231 | (1,398) | ||||||||||||||||||||||||||||||
| Non-controlling interests
|
(8) | - | - | - | - | - | - | - | - | (8) | ||||||||||||||||||||||||||||||
|
Profit
|
3,506 | 79 | - | (67) | (14) | 176 | (4) | - | 170 | 3,676 | ||||||||||||||||||||||||||||||
96
CONDENSED CONSOLIDATED FINANCIAL STATEMENTS – TABLE OF CONTENTS
|
CONTENTS
|
PAGE
|
|||
| Directors’ Report |
98 | |||
| Condensed Consolidated Income Statement |
99 | |||
| Condensed Consolidated Statement of Comprehensive Income |
100 | |||
| Condensed Consolidated Balance Sheet |
101 | |||
| Condensed Consolidated Cash Flow Statement |
102 | |||
| Condensed Consolidated Statement of Changes in Equity |
103 | |||
| Notes to Condensed Consolidated Financial Statements |
104 | |||
| Directors’ Declaration and Responsibility Statement |
127 | |||
| Auditor’s Review Report and Independence Declaration |
128 | |||
97
DIRECTORS’ REPORT
The Directors present their report on the Condensed Consolidated Financial Statements for the half year ended 31 March 2016.
Directors
The names of the Directors of the Company who held office during and since the end of the half year are:
| Mr DM Gonski, AC
|
Chairman
| |
| Mr SC Elliott
|
Director and Chief Executive Officer, since 1 January 2016
| |
| Ms IR Atlas
|
Director
| |
| Ms PJ Dwyer
|
Director
| |
| Mr Lee Hsien Yang
|
Director
| |
| Mr GR Liebelt
|
Director
| |
| Mr IJ Macfarlane, AC
|
Director
| |
| Mr JT Macfarlane
|
Director
| |
| Mr MRP Smith, OBE | Director, retired on 31 December 2015 |
Result
The consolidated profit attributable to shareholders of the Company was $2,738 million. Further details are contained in Group Results on pages 21 to 47 which forms part of this report, and in the Condensed Consolidated Financial Statements.
Review of operations
A review of the operations of the Group during the half year and the results of those operations are contained in the Group Results on pages 21 to 47 which forms part of this report.
Lead auditor’s independence declaration
The lead auditor’s independence declaration given under section 307C of the Corporations Act 2001 (as amended) is set out on page 128 which forms part of this report.
Rounding of amounts
The amounts contained in these Condensed Consolidated Financial Statements have been rounded to the nearest million dollars, except where otherwise indicated, as permitted by ASIC Class Order 98/100.
Significant events since balance date
There have been no significant events from 31 March 2016 to the date of this report.
Signed in accordance with a resolution of the Directors.
| /s/ David M Gonski, AC | /s/ Shayne C Elliott | |
| David M Gonski, AC Chairman |
Shayne C Elliott Director |
2 May 2016
98
CONDENSED CONSOLIDATED INCOME STATEMENT
Australia and New Zealand Banking Group Limited
| Half Year
|
Movement
| |||||||||||||
| Note | Mar 16 $M |
Sep 15 $M |
Mar 15 $M |
Mar 16 v. Sep 15 |
Mar 16 v. Mar 15 | |||||||||
|
Interest income |
15,090 | 15,132 | 15,394 | 0% | -2% | |||||||||
| Interest expense
|
(7,522)
|
(7,654)
|
(8,256)
|
-2%
|
-9%
| |||||||||
|
Net interest income |
2 | 7,568 | 7,478 | 7,138 | 1% | 6% | ||||||||
| Other operating income1 |
2 | 1,539 | 2,266 | 1,768 | -32% | -13% | ||||||||
| Net funds management and insurance income1 |
2 | 857 | 795 | 1,020 | 8% | -16% | ||||||||
| Share of associates’ profit
|
2,18
|
301
|
311
|
314
|
-3%
|
-4%
| ||||||||
|
Operating income |
10,265 | 10,850 | 10,240 | -5% | 0% | |||||||||
| Operating expenses1
|
3
|
(5,479)
|
(4,775)
|
(4,603)
|
15%
|
19%
| ||||||||
|
Profit before credit impairment and income tax |
4,786 | 6,075 | 5,637 | -21% | -15% | |||||||||
| Credit impairment charge
|
10
|
(904)
|
(685)
|
(494)
|
32%
|
83%
| ||||||||
|
Profit before income tax |
3,882 | 5,390 | 5,143 | -28% | -25% | |||||||||
| Income tax expense
|
4
|
(1,140)
|
(1,397)
|
(1,629)
|
-18%
|
-30%
| ||||||||
| Profit for the period
|
2,742
|
3,993
|
3,514
|
-31%
|
-22%
| |||||||||
|
Comprising: |
||||||||||||||
| Profit attributable to non-controlling interests |
4 | 6 | 8 | -33% | -50% | |||||||||
| Profit attributable to shareholders of the Company
|
2,738
|
3,987
|
3,506
|
-31%
|
-22%
| |||||||||
| Earnings per ordinary share (cents) |
||||||||||||||
| Basic |
6 | 94.8 | 143.4 | 128.0 | -34% | -26% | ||||||||
| Diluted |
6 | 89.7 | 134.9 | 124.6 | -34% | -28% | ||||||||
| Dividend per ordinary share (cents)
|
5
|
80
|
95
|
86
|
-16%
|
-7%
| ||||||||
| 1. | Comparatives have changed; refer Note 2 Income and Note 3 Operating expenses for further details. |
The notes appearing on pages 104 to 126 form an integral part of the Condensed Consolidated Financial Statements.
99
CONDENSED CONSOLIDATED STATEMENT OF COMPREHENSIVE INCOME
Australia and New Zealand Banking Group Limited
| Half Year
|
Movement
| |||||||||||
| Mar 16 $M |
Sep 15 $M |
Mar 15 $M |
Mar 16 v. Sep 15 |
Mar 16 v. Mar 15 | ||||||||
| Profit for the period | 2,742 | 3,993 | 3,514 | -31% | -22% | |||||||
| Other comprehensive income | ||||||||||||
| Items that will not be reclassified subsequently to profit or loss | ||||||||||||
| Remeasurement gain/(loss) on defined benefit plans | (4) | (4) | (2) | 0% | 100% | |||||||
| Fair value gain/(loss) attributable to changes in own credit risk of financial liabilities designated at fair value | 11 | 39 | 13 | -72% | -15% | |||||||
| Income tax on items that will not be reclassified subsequently to profit or loss | ||||||||||||
| Remeasurement gain/(loss) on defined benefit plans | 1 | 1 | 3 | 0% | -67% | |||||||
| Fair value gain/(loss) attributable to changes in own credit risk of financial liabilities designated at fair value | (3) | (11) | (4) | -73% | -25% | |||||||
| Items that may be reclassified subsequently to profit or loss | ||||||||||||
| Foreign currency translation reserve | ||||||||||||
| Exchange differences taken to equity1 |
(1,015) | (445) | 2,181 | large | large | |||||||
| Exchange differences transferred to income statement |
(126) | (4) | - | large | n/a | |||||||
| Available-for-sale revaluation reserve | ||||||||||||
| Valuation gain/(loss) taken to equity |
(11) | (157) | 117 | -93% | large | |||||||
| Transferred to income statement |
(31) | (21) | (50) | 48% | -38% | |||||||
| Cash flow hedge reserve | ||||||||||||
| Valuation gain/(loss) taken to equity |
(60) | (77) | 237 | -22% | large | |||||||
| Transferred to income statement |
14 | (3) | (12) | large | large | |||||||
| Income tax on items that may be reclassified subsequently to profit or loss | ||||||||||||
| Available-for-sale assets revaluation reserve | 16 | 53 | (17) | -70% | large | |||||||
| Cash flow hedge reserve
|
16 | 24 | (69) | -33% | large | |||||||
| Share of associates’ other comprehensive income2
|
(6)
|
9
|
50
|
large
|
large
| |||||||
| Other comprehensive income net of tax
|
(1,198) | (596) | 2,447 | large | large | |||||||
| Total comprehensive income for the period
|
1,544 | 3,397 | 5,961 | -55% | -74% | |||||||
| Comprising total comprehensive income attributable to: | ||||||||||||
| Non-controlling interests |
(4) | 12 | 18 | large | large | |||||||
| Shareholders of the Company
|
1,548
|
3,385
|
5,943
|
-54%
|
-74%
| |||||||
| 1. | Includes foreign currency translation differences attributable to non-controlling interests of $8 million loss (Sep 15 half: $6 million gain; Mar 15 half: $10 million gain). |
| 2. | Share of associates other comprehensive income includes the following items that may be reclassified subsequently to profit and loss: an Available-for-sale revaluation reserve loss of $11 million (Sep 15 half: $6 million gain; Mar 15 half: $47 million gain) and a Foreign currency translation reserve gain of $5 million (Sep 15 half: $5 million gain; Mar 15 half: $3 million gain), as well as items that will not be reclassified subsequently to profit or loss comprised of the remeasurement gain or loss on defined benefit plans of nil (Sep 15 half: $2 million loss; Mar 15 half: nil). |
The notes appearing on pages 104 to 126 form an integral part of the Condensed Consolidated Financial Statements.
100
CONDENSED CONSOLIDATED BALANCE SHEET
Australia and New Zealand Banking Group Limited
| As at
|
Movement
| |||||||||||||
| Assets | Note | Mar 16 $M |
Sep 15 $M |
Mar 15 $M |
Mar 16 v. Sep 15 |
Mar 16 v. Mar 15 | ||||||||
|
Cash |
49,144 |
53,903 |
46,004 |
-9% |
7% | |||||||||
| Settlement balances owed to ANZ | 26,048 | 18,596 | 22,570 | 40% | 15% | |||||||||
| Collateral paid | 12,783 | 9,967 | 10,707 | 28% | 19% | |||||||||
| Trading securities | 50,073 | 49,000 | 51,386 | 2% | -3% | |||||||||
| Derivative financial instruments | 88,747 | 85,625 | 73,580 | 4% | 21% | |||||||||
| Available-for-sale assets | 50,377 | 43,667 | 38,336 | 15% | 31% | |||||||||
| Net loans and advances | 9 | 561,768 | 562,173 | 558,203 | 0% | 1% | ||||||||
| Regulatory deposits | 2,135 | 1,773 | 1,804 | 20% | 18% | |||||||||
| Investment in associates | 4,213 | 5,440 | 5,315 | -23% | -21% | |||||||||
| Current tax assets | 289 | 90 | 38 | large | large | |||||||||
| Deferred tax assets | 578 | 402 | 162 | 44% | large | |||||||||
| Goodwill and other intangible assets | 7,585 | 8,312 | 8,384 | -9% | -10% | |||||||||
| Investments backing policy liabilities | 34,541 | 34,820 | 36,495 | -1% | -5% | |||||||||
| Premises and equipment | 2,188 | 2,221 | 2,203 | -1% | -1% | |||||||||
| Other assets | 4,809 | 5,846 | 4,900 | -18% | -2% | |||||||||
| Esanda dealer finance assets held for sale
|
9 | - | 8,065 | - | -100% | n/a | ||||||||
|
Total assets
|
895,278 | 889,900 | 860,087 | 1% | 4% | |||||||||
|
Liabilities |
||||||||||||||
| Settlement balances owed by ANZ | 13,626 | 11,250 | 7,759 | 21% | 76% | |||||||||
| Collateral received | 6,615 | 7,829 | 4,844 | -16% | 37% | |||||||||
| Deposits and other borrowings | 11 | 578,071 | 570,794 | 567,215 | 1% | 2% | ||||||||
| Derivative financial instruments | 91,706 | 81,270 | 73,210 | 13% | 25% | |||||||||
| Current tax liabilities | 129 | 267 | 123 | -52% | 5% | |||||||||
| Deferred tax liabilities | 286 | 249 | 322 | 15% | -11% | |||||||||
| Policy liabilities | 35,159 | 35,401 | 36,820 | -1% | -5% | |||||||||
| External unit holder liabilities (life insurance funds) | 3,265 | 3,291 | 3,489 | -1% | -6% | |||||||||
| Provisions | 1,202 | 1,074 | 1,128 | 12% | 7% | |||||||||
| Payables and other liabilities | 9,251 | 10,366 | 10,999 | -11% | -16% | |||||||||
| Debt issuances | 81,947 | 93,747 | 85,664 | -13% | -4% | |||||||||
| Subordinated debt |
12 | 17,557 | 17,009 | 16,463 | 3% | 7% | ||||||||
| Total liabilities
|
838,814 | 832,547 | 808,036 | 1% | 4% | |||||||||
| Net assets
|
56,464 | 57,353 | 52,051 | -2% | 8% | |||||||||
|
Shareholders’ equity |
||||||||||||||
| Ordinary share capital | 28,625 | 28,367 | 24,152 | 1% | 19% | |||||||||
| Reserves | 377 | 1,571 | 2,188 | -76% | -83% | |||||||||
| Retained earnings
|
27,361 | 27,309 | 25,616 | 0% | 7% | |||||||||
|
Share capital and reserves attributable to shareholders of the Company |
16 | 56,363 | 57,247 | 51,956 | -2% | 8% | ||||||||
| Non-controlling interests
|
101 | 106 | 95 | -5% | 6% | |||||||||
| Total shareholders’ equity
|
16 | 56,464 | 57,353 | 52,051 | -2% | 8% | ||||||||
The notes appearing on pages 104 to 126 form an integral part of the Condensed Consolidated Financial Statements.
101
CONDENSED CONSOLIDATED CASH FLOW STATEMENT
Australia and New Zealand Banking Group Limited
| Half Year | ||||||||
| Inflows (Outflows) |
Inflows (Outflows) |
Inflows (Outflows) | ||||||
| Note | Mar 16 $M |
Sep 15 $M |
Mar 15 $M | |||||
| Cash flows from operating activities |
||||||||
| Interest received | 14,977 | 15,269 | 15,398 | |||||
| Interest paid | (7,657) | (7,145) | (8,313) | |||||
| Dividends received | 12 | 202 | 29 | |||||
| Other operating income received | 1,848 | 6,862 | 11,374 | |||||
| Other operating expenses paid | (4,373) | (4,322) | (4,270) | |||||
| Income taxes paid | (1,555) | (1,433) | (1,649) | |||||
| Net cash flows from funds management and insurance business | ||||||||
| Premiums, other income and life investment deposits received |
3,396 | 4,023 | 3,622 | |||||
| Investment income and policy deposits received |
107 | 95 | 191 | |||||
| Claims and policy liability payments |
(2,800) | (2,949) | (3,006) | |||||
| Commission expense paid |
(281) | (308) | (303) | |||||
| Cash flows from operating activities before changes in operating assets and liabilities |
3,674 | 10,294 | 13,073 | |||||
| Changes in operating assets and liabilities arising from cash flow movements | ||||||||
| (Increase)/decrease in operating assets | ||||||||
| Collateral paid |
(3,462) | 920 | (4,505) | |||||
| Trading securities |
(2,160) | 2,460 | 410 | |||||
| Net loans and advances |
(6,440) | (15,554) | (16,726) | |||||
| Net cash flows from investments backing policy liabilities | ||||||||
| Purchase of insurance assets |
(7,255) | (3,484) | (3,581) | |||||
| Proceeds from sale/maturity of insurance assets |
7,660 | 3,501 | 3,738 | |||||
| Increase/(decrease) in operating liabilities | ||||||||
| Deposits and other borrowings |
20,283 | (533) | 30,583 | |||||
| Settlement balances owed by ANZ |
2,517 | 3,476 | (2,695) | |||||
| Collateral received |
(744) | 2,437 | (1,364) | |||||
| Payables and other liabilities |
(2,638) | (1,406) | 432 | |||||
| Change in operating assets and liabilities arising from cash flow movements |
7,761 | (8,183) | 6,292 | |||||
| Net cash provided by operating activities |
11,435 | 2,111 | 19,365 | |||||
| Cash flows from investing activities | ||||||||
| Available-for-sale assets | ||||||||
| Purchases |
(21,486) | (9,033) | (15,203) | |||||
| Proceeds from sale or maturity |
13,457 | 5,384 | 10,321 | |||||
| Controlled entities and associates | ||||||||
| Proceeds on sale of businesses |
- | - | 4 | |||||
| Premises and equipment | ||||||||
| Purchases |
(186) | (202) | (119) | |||||
| Proceeds from sale |
37 | - | - | |||||
| Esanda Dealer Finance divestment | 6,682 | - | - | |||||
| Other assets |
305 | (781) | (147) | |||||
| Net cash (used in) investing activities |
(1,191) | (4,632) | (5,144) | |||||
| Cash flows from financing activities | ||||||||
| Debt issuances | ||||||||
| Issue proceeds |
10,611 | 8,040 | 8,597 | |||||
| Redemptions |
(16,816) | (6,834) | (9,132) | |||||
| Subordinated debt | ||||||||
| Issue proceeds |
943 | 186 | 2,497 | |||||
| Dividends paid | (2,485) | (1,453) | (2,310) | |||||
| Share capital issues | - | 3,207 | - | |||||
| Preference shares bought back |
- | - | (755) | |||||
| Net cash (used in) / provided by financing activities |
(7,747) | 3,146 | (1,103) | |||||
| Net increase in cash and cash equivalents | 2,497 | 625 | 13,118 | |||||
| Cash and cash equivalents at beginning of period | 69,278 | 65,462 | 48,229 | |||||
| Effects of exchange rate changes on cash and cash equivalents |
(3,064) | 3,191 | 4,115 | |||||
| Cash and cash equivalents at end of period |
8 | 68,711 | 69,278 | 65,462 | ||||
The notes appearing on pages 104 to 126 form an integral part of the Condensed Consolidated Financial Statements.
102
CONDENSED CONSOLIDATED STATEMENT OF CHANGES IN EQUITY
Australia and New Zealand Banking Group Limited
| Ordinary
$M |
Preference
$M |
Reserves1
$M |
Retained
$M |
Share capital and
$M |
Non-
$M |
Total
$M |
||||||||||||||||||||||
| As at 1 October 2014
|
|
24,031
|
|
|
871
|
|
|
(239)
|
|
|
24,544
|
|
|
49,207
|
|
|
77
|
|
|
49,284
|
| |||||||
|
Profit or loss |
- | - | - | 3,506 | 3,506 | 8 | 3,514 | |||||||||||||||||||||
|
Other comprehensive income for the period
|
|
-
|
|
|
-
|
|
|
2,427
|
|
|
10
|
|
|
2,437
|
|
|
10
|
|
|
2,447
|
| |||||||
|
Total comprehensive income for the period |
- | - | 2,427 | 3,516 | 5,943 | 18 | 5,961 | |||||||||||||||||||||
|
Transactions with equity holders in their capacity as equity holders: |
||||||||||||||||||||||||||||
|
Dividends paid |
- | - | - | (2,579) | (2,579) | - | (2,579) | |||||||||||||||||||||
|
Dividend income on treasury shares held within the Group’s life insurance statutory funds |
- | - | - | 12 | 12 | - | 12 | |||||||||||||||||||||
|
Dividend reinvestment plan |
257 | - | - | - | 257 | - | 257 | |||||||||||||||||||||
|
Preference shares bought back |
- | (871) | - | - | (871) | - | (871) | |||||||||||||||||||||
|
Other equity movements: |
||||||||||||||||||||||||||||
|
Share based payments |
- | - | 7 | - | 7 | - | 7 | |||||||||||||||||||||
|
Treasury shares Wealth adjustment |
(39) | - | - | - | (39) | - | (39) | |||||||||||||||||||||
|
Group employee share acquisition scheme |
(97) | - | - | - | (97) | - | (97) | |||||||||||||||||||||
|
Transfer of options/rights lapsed |
- | - | (7) | 7 | - | - | - | |||||||||||||||||||||
|
Foreign exchange gains on preference share capital bought back
|
- | - | - | 116 | 116 | - | 116 | |||||||||||||||||||||
| As at 31 March 2015
|
|
24,152
|
|
|
-
|
|
|
2,188
|
|
|
25,616
|
|
|
51,956
|
|
|
95
|
|
|
52,051
|
| |||||||
|
Profit or loss |
- | - | - | 3,987 | 3,987 | 6 | 3,993 | |||||||||||||||||||||
|
Other comprehensive income for the period
|
- | - | (625) | 23 | (602) | 6 | (596) | |||||||||||||||||||||
|
Total comprehensive income for the period |
- | - | (625) | 4,010 | 3,385 | 12 | 3,397 | |||||||||||||||||||||
|
Transactions with equity holders in their capacity as equity holders: |
||||||||||||||||||||||||||||
|
Dividends paid |
- | - | - | (2,328) | (2,328) | (1) | (2,329) | |||||||||||||||||||||
|
Dividend income on treasury shares held within the Group’s life insurance statutory funds |
- | - | - | 10 | 10 | - | 10 | |||||||||||||||||||||
|
Dividend reinvestment plan
|
865 | - | - | - | 865 | - | 865 | |||||||||||||||||||||
| Other equity movements:
|
||||||||||||||||||||||||||||
| Share based payments
|
- | - | 9 | - | 9 | - | 9 | |||||||||||||||||||||
| Share Placement and Purchase Plan
|
3,206 | - | - | - | 3,206 | - | 3,206 | |||||||||||||||||||||
| Group share option scheme
|
2 | - | - | - | 2 | - | 2 | |||||||||||||||||||||
| Treasury shares Wealth adjustment
|
44 | - | - | - | 44 | - | 44 | |||||||||||||||||||||
| Group employee share acquisition scheme
|
98 | - | - | - | 98 | - | 98 | |||||||||||||||||||||
| Transfer of options/rights lapsed
|
- | - | (1) | 1 | - | - | - | |||||||||||||||||||||
| As at 30 September 2015
|
28,367 | - | 1,571 | 27,309 | 57,247 | 106 | 57,353 | |||||||||||||||||||||
|
Profit or loss |
- | - | - | 2,738 | 2,738 | 4 | 2,742 | |||||||||||||||||||||
| Other comprehensive income for the period
|
- | - | (1,195) | 5 | (1,190) | (8) | (1,198) | |||||||||||||||||||||
|
Total comprehensive income for the period
|
- | - | (1,195) | 2,743 | 1,548 | (4) | 1,544 | |||||||||||||||||||||
| Transactions with equity holders in their capacity as equity holders:
|
||||||||||||||||||||||||||||
| Dividends paid
|
- | - | - | (2,711) | (2,711) | (1) | (2,712) | |||||||||||||||||||||
| Dividend income on treasury shares held within the Group’s life insurance statutory funds
|
- | - | - | 12 | 12 | - | 12 | |||||||||||||||||||||
| Dividend reinvestment plan
|
215 | - | - | - | 215 | - | 215 | |||||||||||||||||||||
| Other equity movements:
|
- | - | ||||||||||||||||||||||||||
| Share based payments
|
- | - | 9 | - | 9 | - | 9 | |||||||||||||||||||||
| Treasury shares Wealth adjustment
|
(13) | - | - | - | (13) | - | (13) | |||||||||||||||||||||
| Group employee share acquisition scheme
|
56 | - | - | - | 56 | - | 56 | |||||||||||||||||||||
| Transfer of options/rights lapsed
|
|
-
|
|
|
-
|
|
|
(8)
|
|
|
8
|
|
|
-
|
|
|
-
|
|
|
-
|
| |||||||
| As at 31 March 2016
|
|
28,625
|
|
|
-
|
|
|
377
|
|
|
27,361
|
|
|
56,363
|
|
|
101
|
|
|
56,464
|
| |||||||
| 1. | Further information on reserves is disclosed in Note 16. |
The notes appearing on pages 104 to 126 form an integral part of the Condensed Consolidated Financial Statements.
103
NOTES TO CONDENSED CONSOLIDATED FINANCIAL STATEMENTS
| 1. | Basis of preparation |
These Condensed Consolidated Financial Statements:
| ¡ | have been prepared in accordance with the recognition and measurement requirements of Australian Accounting Standards (“AASs”); |
| ¡ | should be read in conjunction with ANZ’s Annual Financial Statements for the year ended 30 September 2015 and any public announcements made by the Parent Entity and its controlled entities (the Group) for the half year ended 31 March 2016 in accordance with the continuous disclosure obligations under the Corporations Act 2001 and the ASX Listing Rules; |
| ¡ | do not include all notes of the type normally included in ANZ’s Annual Financial Statements; |
| ¡ | are presented in Australian dollars unless otherwise stated; and |
| ¡ | were approved by the Board of Directors on 2 May 2016. |
| i) | Statement of Compliance |
These Condensed Consolidated Financial Statements have been prepared in accordance with the Corporations Act 2001 and AASB 134 which ensures compliance with IAS 34 Interim Financial Reporting.
| ii) | Accounting policies |
These Condensed Consolidated Financial Statements have been prepared on the basis of accounting policies and using methods of computation consistent with those applied in the 2015 ANZ Annual Financial Statements.
| iii) | Software |
In the current period the Group made a number of changes to the way in which it applies its accounting policy relating to the capitalisation of internally generated software assets by increasing the threshold for capitalisation of software development spend, reflecting the increasingly shorter useful life of smaller items of software, and direct expensing of more project related costs. The impact of the change was an accelerated amortisation charge of $556 million relating to previously capitalised software balances (of this, $88 million would otherwise have been amortised during the March 2016 half) and higher operating expenses during the period of $161 million relating to development costs that would otherwise have been capitalised. These costs would otherwise have been amortised to the Income Statement in future periods of up to 5 years.
| iv) | Basis of measurement |
The financial information has been prepared in accordance with the historical cost basis except that the following assets and liabilities are stated at their fair value:
| ¡ | derivative financial instruments as well as, in the case of fair value hedging, the fair value adjustment on the underlying hedged exposure; |
| ¡ | available-for-sale financial assets; |
| ¡ | financial instruments held for trading; and |
| ¡ | assets and liabilities designated at fair value through profit and loss. |
In accordance with AASB 1038 Life Insurance Contracts, life insurance liabilities are measured using the Margin on Services model.
In accordance with AASB 119 Employee Benefits, defined benefit obligations are measured using the Projected Unit Credit method.
| v) | Use of estimates, assumptions and judgments |
The preparation of these Condensed Consolidated Financial Statements requires the use of management judgement, estimates and assumptions that affect reported amounts and the application of accounting policies. Discussion of the critical accounting estimates and judgements, which include complex or subjective decisions or assessments are covered in Note 2 of the 2015 Annual Financial Statements. Such estimates and judgements are reviewed on an ongoing basis.
At 31 March 2016, the impairment assessment of non-lending assets identified that two of the Group’s associate investments (AMMB Holdings Berhad (Ambank) and PT Bank Pan Indonesia (PT Panin)) had indicators of impairment; specifically their market value (based on share price) was below their carrying value. The Group performed value in use (VIU) calculations to assess if the carrying value of the investments were impaired.
The VIU calculation is sensitive to a number of key assumptions, including discount rate, long term growth rates, future profitability and capital levels. The key assumptions used in the value in use calculations are outlined below:
| As at 31 Mar 16
|
||||||||
| Ambank | PT Panin | |||||||
|
Pre-tax discount rate
|
|
10.1%
|
|
|
13.7%
|
| ||
|
Terminal growth rate
|
|
5.0%
|
|
|
5.7%
|
| ||
|
Expected NPAT growth (compound annual growth rate – 5 years)
|
|
3.4%
|
|
|
5.0%
|
| ||
|
Core equity tier 1 rate
|
|
10% to 12.2%
|
|
|
11.3%
|
| ||
The VIU calculation continued to support the carrying value of the investment in PT Panin, however the VIU did not support the carrying value of the Group’s investment in Ambank. As a consequence the Group recorded an impairment charge of $260 million in the half year. The associate investment in Ambank forms part of the TSO and Group Centre operating segment.
104
NOTES TO CONDENSED CONSOLIDATED FINANCIAL STATEMENTS
| vi) | Rounding of amounts |
The amounts contained in these Condensed Consolidated Financial Statements have been rounded to the nearest million dollars, except where otherwise indicated, as permitted by Australian Securities and Investments Commission Class Order 98/100.
| vii) | Comparatives |
Certain amounts in the comparative information have been reclassified to conform to current period financial statement presentation.
| vii) | New accounting standards not yet effective |
The following accounting standards relevant to the Group have been issued but are not yet effective and have not been applied in these Condensed Consolidated Financial Statements:
AASB 9 Financial Instruments (‘AASB 9’)
The Australian Accounting Standards Board (AASB) issued the final version of AASB 9 in December 2014. When operative, this standard will replace AASB 139 Financial Instruments: Recognition and Measurement. AASB 9 addresses recognition and measurement requirements for financial assets and financial liabilities, impairment requirements that introduce an expected credit loss impairment model and general hedge accounting requirements which more closely align with risk management activities undertaken when hedging financial and non-financial risks.
AASB 9 is not mandatorily effective for the Group until 1 October 2018. The Group is in the process of assessing the impact of application of AASB 9 and is not yet able to reasonably estimate the impact on its financial statements.
The Group early adopted, in isolation, the part of AASB 9 relating to gains and losses attributable to changes in own credit risk of financial liabilities designated as fair value through profit or loss in the financial year ended 30 September 2014.
AASB 15 Revenue from Contracts with Customers (‘AASB 15’)
The AASB issued the final version of AASB 15 in December 2014. The standard is not mandatorily effective for the Group until 1 October 2018. AASB 15 contains new requirements for the recognition of revenue and additional disclosures about revenue.
While it is expected that a significant proportion of the Group’s revenue will be outside the scope of AASB 15, the Group is in the process of assessing the impact of application of AASB 15 and is not yet able to reasonably estimate the impact on its financial statements.
AASB 16 Leases (‘AASB 16’)
The AASB issued the final version of AASB 16 in February 2016. The standard is not mandatorily effective for the Group until 1 October 2019. AASB 16 introduces a single lessee accounting model and requires a lessee to recognise assets and liabilities for all leases with a term of more than 12 months, unless the underlying asset is of low value. A lessee is required to recognise a right-of-use asset representing its right to use the underlying leased asset and a lease liability representing its obligation to make lease payments. AASB 16 substantially carries forward the lessor accounting requirements in AASB 117 Leases. Accordingly, a lessor continues to classify its leases as operating leases or finance leases, and to account for those two types of leases differently.
The Group is in the process of assessing the impact of AASB 16 and is not yet able to reasonably estimate the impact on its financial statements.
105
NOTES TO CONDENSED CONSOLIDATED FINANCIAL STATEMENTS
| 2. | Income |
| Half Year
|
Movement
| |||||||||||
| Mar 16 $M
|
Sep 15 $M
|
Mar 15 $M
|
Mar 16
|
Mar 16
| ||||||||
| Interest income | 15,090 | 15,132 | 15,394 | 0% | -2% | |||||||
| Interest expense
|
(7,522)
|
(7,654)
|
(8,256)
|
-2%
|
-9%
| |||||||
| Net interest income
|
7,568
|
7,478
|
7,138
|
1%
|
6%
| |||||||
| i) Fee and commission income | ||||||||||||
| Lending fees1 | 391 | 411 | 422 | -5% | -7% | |||||||
| Non-lending fees and commissions2
|
1,451
|
1,464
|
1,421
|
-1%
|
2%
| |||||||
| Total fee and commission income2 | 1,842 | 1,875 | 1,843 | -2% | 0% | |||||||
| Fee and commission expense2,3
|
(574)
|
(547)
|
(540)
|
5%
|
6%
| |||||||
| Net fee and commission income2,3
|
1,268
|
1,328
|
1,303
|
-5%
|
-3%
| |||||||
| ii) Net funds management and insurance income | ||||||||||||
| Funds management income2 | 446 | 458 | 484 | -3% | -8% | |||||||
| Investment income | 470 | (1,301) | 3,149 | large | -85% | |||||||
| Insurance premium income2 | 780 | 865 | 768 | -10% | 2% | |||||||
| Commission (expense) | (192) | (213) | (239) | -10% | -20% | |||||||
| Claims2 | (358) | (387) | (356) | -7% | 1% | |||||||
| Changes in policy liabilities4 | (323) | 1,266 | (2,700) | large | -88% | |||||||
| Elimination of treasury share (gain)/loss
|
34
|
107
|
(86)
|
-68%
|
large
| |||||||
| Total net funds management and insurance income2
|
857
|
795
|
1,020
|
8%
|
-16%
| |||||||
| iii) Share of associates’ profit
|
301
|
311
|
314
|
-3%
|
-4% | |||||||
| iv) Other income | ||||||||||||
| Net foreign exchange earnings2 | 602 | 747 | 258 | -19% | large | |||||||
| Net gain/(loss) from trading securities and derivatives2 | (85) | (220) | 95 | -61% | large | |||||||
| Credit risk on credit intermediation trades | 3 | 3 | 5 | 0% | -40% | |||||||
| Movement on financial instruments measured at fair value through profit & loss5 | (155) | 209 | 32 | large | large | |||||||
| Brokerage income | 25 | 24 | 34 | 4% | -26% | |||||||
| Impairment of Ambank | (260) | - | - | n/a | n/a | |||||||
| Gain on cessation of equity accounting of investment in Bank of Tianjin (BoT) | 29 | - | - | n/a | n/a | |||||||
| Gain on Esanda Dealer Finance divestment | 66 | - | - | n/a | n/a | |||||||
| Other2
|
46 | 175 | 41 | -74% | 12% | |||||||
| Total other income2,5
|
271
|
938
|
465
|
-71%
|
-42%
| |||||||
| Total other operating income2,6
|
2,697
|
3,372
|
3,102
|
-20%
|
-13%
| |||||||
| Total income2
|
17,787
|
18,504
|
18,496
|
-4%
|
-4%
| |||||||
| 1. | Lending fees exclude fees treated as part of the effective yield calculation in interest income. |
| 2. | Certain insurance related income and card related fees have been reclassified within other operating income and operating expenses in the current period to better reflect the nature of the items. Comparatives have been restated. For the Sep 15 half, insurance and other wealth related income of $38 million was reclassified from other operating income to net funds management and insurance income (Mar 15: $41 million) and $9 million of card related fees were reclassified from other operating income to operating expenses (Mar 15: $10 million). |
| 3. | Includes interchange fees paid. |
| 4. | Includes policyholder tax gross up, which represents contribution tax (recovered at 15% on the super contributions made by members) debited to the policyholder account once a year in July when the statement is issued to the members at the end of the 30 June financial year. |
| 5. | Includes fair value movements (excluding realised and accrued interest) on derivatives not designated as accounting hedges entered into to manage interest rate and foreign exchange risk on funding instruments, ineffective portions of cash flow hedges, and fair value movements in financial assets and liabilities designated at fair value through profit and loss. |
| 6. | Total other operating income includes external dividend income of nil (Sep 15 half: $0.8 million; Mar 15 half: nil). |
106
NOTES TO CONDENSED CONSOLIDATED FINANCIAL STATEMENTS
| 3. | Operating expenses |
| Half Year
|
Movement
| |||||||||||
| Mar 16 $M
|
Sep 15 $M
|
Mar 15 $M
|
Mar 16 v. Sep 15
|
Mar 16 v. Mar 15
| ||||||||
| Personnel |
||||||||||||
|
Employee entitlements and taxes |
133 | 170 | 155 | -22% | -14% | |||||||
|
Salaries and wages |
2,024 | 1,867 | 1,852 | 8% | 9% | |||||||
|
Superannuation costs - defined benefit plans |
- | 4 | 3 | -100% | -100% | |||||||
|
Superannuation costs - defined contribution plans |
169 | 169 | 155 | 0% | 9% | |||||||
|
Equity-settled share-based payments |
92 | 108 | 108 | -15% | -15% | |||||||
| Other |
383
|
446
|
442
|
-14%
|
-13%
| |||||||
| Total personnel expenses |
2,801
|
2,764
|
2,715
|
1%
|
3%
| |||||||
|
Premises |
||||||||||||
|
Depreciation and amortisation |
97 | 95 | 97 | 2% | 0% | |||||||
|
Rent |
245 | 241 | 238 | 2% | 3% | |||||||
|
Utilities and other outgoings |
84 | 93 | 87 | -10% | -3% | |||||||
| Other |
32
|
38
|
33
|
-16%
|
-3%
| |||||||
| Total premises expenses |
458
|
467
|
455
|
-2%
|
1%
| |||||||
|
Technology |
||||||||||||
|
Data communications |
68 | 65 | 50 | 5% | 36% | |||||||
|
Depreciation and amortisation1 |
870 | 343 | 332 | large | large | |||||||
|
Licences and outsourced services |
275 | 238 | 209 | 16% | 32% | |||||||
|
Rentals and repairs |
89 | 80 | 78 | 11% | 14% | |||||||
|
Software impairment |
2 | 13 | 4 | -85% | -50% | |||||||
| Other |
20
|
22
|
28
|
-9%
|
-29%
| |||||||
| Total technology expenses |
1,324
|
761
|
701
|
74%
|
89%
| |||||||
| Restructuring
|
138
|
21
|
10
|
large
|
large
| |||||||
|
Other |
||||||||||||
|
Advertising and public relations2 |
132 | 181 | 144 | -27% | -8% | |||||||
|
Audit and other fees |
10 | 10 | 11 | 0% | -9% | |||||||
|
Non-lending losses, frauds and forgeries |
62 | 31 | 35 | 100% | 77% | |||||||
|
Professional fees |
186 | 182 | 142 | 2% | 31% | |||||||
|
Travel and entertainment expenses |
86 | 105 | 100 | -18% | -14% | |||||||
|
Amortisation and impairment of other intangible assets |
43 | 44 | 44 | -2% | -2% | |||||||
|
Freight, stationery, postage and telephone |
135 | 136 | 127 | -1% | 6% | |||||||
| Other2
|
104
|
73
|
119
|
42%
|
-13%
| |||||||
| Total other expenses2
|
758
|
762
|
722
|
-1%
|
5%
| |||||||
| Total operating expenses2
|
5,479
|
4,775
|
4,603
|
15%
|
19%
| |||||||
| 1. | The March 2016 half includes a $556 million charge for accelerated amortisation associated with the software capitalisation changes. |
| 2. | Certain cards related fees that are integral to the generation of income were reclassified from operating expenses to other operating income to better reflect the nature of the items and comparatives were restated. For the September 15 half $9 million of card related fees were reclassified from other operating income to operating expenses (Mar 15: $10 million). |
107
NOTES TO CONDENSED CONSOLIDATED FINANCIAL STATEMENTS
| 4. | Income tax expense |
Reconciliation of the prima facie income tax expense on pre-tax profit with the income tax expense charged in the Income Statement
| Half Year
|
Movement
| |||||||||||
| Mar 16 $M |
Sep 15 $M |
Mar 15 $M |
Mar 16 v. Sep 15 |
Mar 16 v. Mar 15 | ||||||||
|
Profit before income tax |
3,882 | 5,390 | 5,143 | -28% | -25% | |||||||
|
Prima facie income tax expense at 30% |
1,165 | 1,617 | 1,543 | -28% | -24% | |||||||
|
Tax effect of permanent differences: |
||||||||||||
|
Overseas tax rate differential |
(25) | (36) | (59) | -31% | -58% | |||||||
|
Rebateable and non-assessable dividends |
- | (1) | (1) | -100% | -100% | |||||||
|
Share of associates’ profit |
(90) | (93) | (94) | -3% | -4% | |||||||
|
Offshore Banking Unit |
- | (1) | - | -100% | n/a | |||||||
|
Wealth - Policyholder income and contributions tax |
23 | (64) | 194 | large | -88% | |||||||
|
Wealth - Tax consolidation benefit |
- | (56) | - | -100% | n/a | |||||||
|
Impairment of Ambank |
78 | - | - | n/a | n/a | |||||||
|
Gain on cessation of equity accounting for BoT |
(9) | - | - | n/a | n/a | |||||||
|
Tax provisions no longer required |
(28) | - | (17) | n/a | 65% | |||||||
|
Interest on Convertible Instruments |
35 | 35 | 37 | 0% | -5% | |||||||
| Other
|
1
|
(4)
|
26
|
large
|
-96%
| |||||||
|
1,150 |
1,397 |
1,629 |
-18% |
-29% | ||||||||
| Income tax under/(over) provided in previous years
|
(10)
|
-
|
-
|
n/a
|
n/a
| |||||||
| Total income tax expense charged in the income statement |
1,140
|
1,397
|
1,629
|
-18%
|
-30%
| |||||||
|
Australia |
799 |
972 |
1,171 |
-18% |
-32% | |||||||
| Overseas |
341
|
425
|
458
|
-20%
|
-26%
| |||||||
|
1,140
|
1,397
|
1,629
|
-18%
|
-30%
| ||||||||
| Effective Tax Rate - Group |
29.4%
|
25.9%
|
31.7%
|
|||||||||
| 5. | Dividends |
| Half Year
|
Movement
| |||||||||||
| Dividend per ordinary share (cents) | Mar 16 | Sep 15 | Mar 15 | Mar 16 v. Sep 15 |
Mar 16 v. Mar 15 | |||||||
|
Interim (fully franked) |
80 | - | 86 | n/a | -7% | |||||||
| Final (fully franked)
|
-
|
95
|
-
|
n/a
|
n/a
| |||||||
| Total
|
80
|
95
|
86
|
-16%
|
-7%
| |||||||
|
Ordinary share dividend ($M)1 |
||||||||||||
|
Interim dividend |
- | 2,379 | - | n/a | n/a | |||||||
|
Final dividend |
2,758 | - | 2,619 | n/a | 5% | |||||||
| Bonus option plan adjustment
|
(47)
|
(51)
|
(41)
|
-8%
|
15%
| |||||||
| Total2
|
2,711
|
2,328
|
2,578
|
16%
|
5%
| |||||||
| Ordinary share dividend payout ratio (%)3 |
85.2%
|
69.2%
|
67.9%
|
|||||||||
| 1. | Dividends paid to ordinary equity holders of the Company. Excludes dividends paid by subsidiaries of the Group to non-controlling equity holders of $1.4 million (Sep 15 half: $1 million; Mar 15 half: nil). |
| 2. | Dividends payable are not accrued and are recorded when paid. |
| 3. | Dividend payout ratio is calculated using proposed 2016 interim dividend of $2,334 million (not shown in the above table). The proposed 2016 interim dividend of $2,334 million is based on the forecast number of ordinary shares on issue at the dividend record date. Dividend payout ratios for the September 2015 half and March 2015 half are calculated using actual dividends paid of $2,758 million and $2,379 million respectively. Dividend payout ratio is calculated by adjusting profit attributable to shareholders of the Company by the amount of preference share dividends paid. |
Ordinary Shares
The Directors propose that an interim dividend of 80 cents be paid on each eligible fully paid ANZ ordinary share on 1 July 2016. The proposed 2016 interim dividend will be fully franked for Australian tax purposes, and New Zealand imputation credits of NZ 10 cents per ordinary share will also be attached.
ANZ has a Dividend Reinvestment Plan (DRP) and a Bonus Option Plan (BOP) that will operate in respect of the proposed 2016 interim dividend. For the 2016 interim dividend, ANZ intends to provide shares under the DRP and BOP through the issue of new shares. The “Acquisition Price” to be used in determining the number of shares to be provided under the DRP and BOP will be calculated by reference to the arithmetic average of the daily volume weighted average sale price of all fully paid ANZ ordinary shares sold in the ordinary course of trading on the ASX during the ten trading days commencing on 13 May 2016, and then rounded to the nearest whole cent. Shares provided under the DRP and BOP will rank equally in all respects with existing fully paid ANZ ordinary shares. Election notices from shareholders wanting to commence, cease or vary their participation in the DRP or BOP for the 2016 interim dividend must be received by ANZ’s Share Registrar by 5.00pm (Australian Eastern Standard Time) on 11 May 2016.
108
NOTES TO CONDENSED CONSOLIDATED FINANCIAL STATEMENTS
Subject to receiving effective contrary instructions from the shareholder, dividends payable to shareholders with a registered address in the United Kingdom (including the Channel Islands and the Isle of Man) or New Zealand will be converted to Pounds Sterling or New Zealand Dollars respectively at an exchange rate calculated on 13 May 2016.
Preference Shares
The Euro Trust Securities were bought back by ANZ for cash at face value and cancelled on 15 December 2014. During the period from 1 October 2014 to 15 December 2014, $1 million of preference share dividends were paid to security holders (€1.88 per preference share).
| 6. | Earnings per share |
| Half Year
|
Movement
| |||||||||||
| Mar 16 | Sep 15 | Mar 15 | Mar 16 v. Sep 15 |
Mar 16 v. Mar 15 | ||||||||
|
Number of fully paid ordinary shares on issue (M)1
|
2,917.6
|
2,902.7
|
2,766.0
|
1%
|
5%
| |||||||
|
Basic |
||||||||||||
|
Profit attributable to shareholders of the Company ($M) |
2,738 | 3,987 | 3,506 | -31% | -22% | |||||||
| Less Preference share dividends ($M)
|
-
|
-
|
(1)
|
n/a
|
-100%
| |||||||
|
Profit less preference share dividends ($M)
|
2,738
|
3,987
|
3,505
|
-31%
|
-22%
| |||||||
| Weighted average number of ordinary shares (M)2 | 2,889.3 | 2,780.6 | 2,737.3 | 4% | 6% | |||||||
| Basic earnings per share (cents)3
|
94.8
|
143.4
|
128.0
|
-34%
|
-26%
| |||||||
|
Diluted
|
||||||||||||
| Profit less preference share dividends ($M)
|
2,738
|
3,987
|
3,505
|
-31%
|
-22%
| |||||||
| Interest on ANZ Convertible Preference Shares ($M)4
|
62
|
61
|
67
|
2%
|
-7%
| |||||||
| Interest on ANZ Capital Notes ($M)5
|
73 | 74 | 60 | -1% | 22% | |||||||
| Interest on ANZ NZ Capital Notes ($M)6
|
12
|
12
|
-
|
0%
|
n/a
| |||||||
|
Profit less preference share dividends and interest on ANZ Convertible Preference Shares, ANZ Capital Notes and ANZ NZ Capital Notes ($M)
|
2,885
|
4,134
|
3,632
|
-30%
|
-21%
| |||||||
| Weighted average number of shares on issue (M)2
|
2,889.3
|
2,780.6
|
2,737.3
|
4%
|
6%
| |||||||
| Weighted average number of convertible options (M)
|
6.9
|
6.3
|
6.2
|
10%
|
11%
| |||||||
| Weighted average number of ANZ Convertible Preference Shares (M)4
|
142.5
|
123.4
|
91.2
|
15%
|
56%
| |||||||
| Weighted average number of convertible ANZ Capital Notes (M)5 | 159.3 | 138.0 | 79.3 | 15% | large | |||||||
| Weighted average number of convertible ANZ NZ Capital Notes (M)6
|
19.4
|
17.0
|
0.1
|
14%
|
large
| |||||||
| Adjusted weighted average number of shares - diluted (M)
|
3,217.4
|
3,065.3
|
2,914.1
|
5%
|
10%
| |||||||
| Diluted earnings per share (cents)3
|
89.7
|
134.9
|
124.6
|
-34%
|
-28%
| |||||||
| 1. | Number of fully paid ordinary shares on issue includes Treasury shares of 23.0 million at 31 March 2016 (Sep 15: 23.0 million; Mar 15: 24.6 million), comprised of 11.0 million in ANZEST Pty Ltd (Sep 15: 11.4 million; Mar 15: 11.5 million) and 12.0 million held in Wealth (Sep 15: 11.6 million; Mar 15: 13.1 million). Number of fully paid ordinary shares also includes 80.8 million resulting from the Institutional share placement on 13 August 2015 and 27.3 million resulting from the Retail share purchase plan on 17 September 2015. |
| 2. | Weighted average number of ordinary shares excludes 10.7 million weighted average number of ordinary Treasury shares for the half year ended 31 March 2016 held in ANZEST Pty Ltd for the group employee share acquisition scheme (Sep 15: 11.4 million; Mar 15: 12.3 million) and excludes 12.1 million weighted average number of ordinary Treasury shares for the half year ended 31 March 2016 held in Wealth (Sep 15: 12.1 million; Mar 15: 12.7 million). |
| 3. | Basic earnings per share was reduced by 3.6 cents for the half year ended 31 March 2016 (Sep 15: 1.2 cents per share) and Diluted earnings per share was reduced by 3.1 cents (Sep 15: 1.0 cents per share) as a result of the Institutional share placement and the Retail share purchase plan which increased the weighted average number of ordinary shares by 108.0 million for the half year ended 31 March 2016 (Sep 15: 23.7 million). |
| 4. | There are two “tranches” of convertible preference shares. The first are convertible preference shares (CPS2) issued on 17 December 2009 that convert to ordinary shares on 15 December 2016 at the market price of ANZ ordinary shares less 1.0% (subject to certain conversion conditions). The second are convertible preference shares (CPS3) issued on 28 September 2011 that convert to ordinary shares on 1 September 2019 at the market price of ANZ ordinary shares less 1.0% (subject to certain conversion conditions). |
| 5. | There are three “tranches” of ANZ Capital Notes. The first are ANZ Capital Notes 1 (CN1) issued on 7 August 2013 which convert to ANZ ordinary shares on 1 September 2023 at the market price of ANZ ordinary shares less 1.0% (subject to certain conversion conditions). The second are ANZ Capital Notes 2 (CN2) issued on 31 March 2014 which convert to ANZ ordinary shares on 24 March 2024 at the market price of ANZ ordinary shares less 1.0% (subject to certain conversion conditions). The third are ANZ Capital Notes 3 (CN3) issued on 5 March 2015 which convert to ANZ ordinary shares on 24 March 2025 at the market price of ANZ ordinary shares less 1.0% (subject to certain conversion conditions). |
| 6. | ANZ Bank New Zealand Limited issued ANZ NZ Capital Notes on 31 March 2015 which convert to ANZ ordinary shares on 25 May 2022 at the market price of ANZ ordinary shares less 1.0% (subject to certain conversion conditions). |
109
NOTES TO CONDENSED CONSOLIDATED FINANCIAL STATEMENTS
| 7. | Segment analysis |
(i) Description of segments
During the March 2016 half, the Group announced changes to the organisation’s structure to better meet the needs of our retail, commercial and institutional customers. As a result of these organisational changes there are six reported divisions; Australia, New Zealand, Institutional, Asia Retail & Pacific, Wealth and Technology, Services & Operations (“TSO”) and Group Centre. These divisions were created by removing the Asia Retail & Pacific business from the former International & Institutional Banking (“IIB”) division, and repositioning minority investments in Asia from IIB to the Group Centre. The residual IIB business has been renamed Institutional.
The Wealth changes designed to simplify the approach to the wealth management business will not take effect until 1 April 2016. For further information on the composition of the divisions refer to the Definitions on page 150.
Other than those described above, there have been no other significant structural change. However, certain prior period comparatives have been restated to align with current period presentation as a result of changes to customer segmentation and the continued realignment of support functions. The divisions reported below are consistent with internal reporting provided to the chief operating decision maker, being the Chief Executive Officer.
(ii) Operating segments
| Half Year | Movement | |||||||||||||||||||||
| Operating Income | Mar 16 $M |
Sep 15 $M |
Mar 15 $M |
Mar 16 v. Sep 15 |
Mar 16 v. Mar 15 |
|||||||||||||||||
| Australia |
4,632 | 4,503 | 4,310 | 3% | 7% | |||||||||||||||||
| Institutional |
2,713 | 2,792 | 2,970 | -3% | -9% | |||||||||||||||||
| New Zealand |
1,373 | 1,340 | 1,345 | 2% | 2% | |||||||||||||||||
| Wealth |
880 | 881 | 851 | 0% | 3% | |||||||||||||||||
| Asia Retail & Pacific |
559 | 550 | 512 | 2% | 9% | |||||||||||||||||
| TSO and Group Centre1
|
159
|
|
276
|
|
207
|
-42%
|
-23%
|
|||||||||||||||
|
Subtotal |
10,316 | 10,342 | 10,195 | 0% | 1% | |||||||||||||||||
|
Other2
|
(51)
|
|
508
|
|
45
|
large
|
large
|
|||||||||||||||
|
Group total |
10,265
|
|
10,850
|
|
10,240
|
-5%
|
0%
|
|||||||||||||||
|
1. Includes $260 million impairment of our investment in Ambank, $66 million gain arising from the Esanda Dealer Finance divestment, and the $29 million gain on cessation of equity accounting of BoT.
2. In evaluating the performance of the operating divisions, certain items are removed from the operating division results where they are not considered integral to the ongoing performance of the segment and are evaluated separately. | ||||||||||||||||||||||
| Half Year | Movement | |||||||||||||||||||||
| Profit | Mar 16 $M |
Sep 15 $M |
Mar 15 $M |
Mar 16 v. Sep 15 |
Mar 16 v. Mar 15 |
|||||||||||||||||
| Australia |
1,753 | 1,706 | 1,650 | 3% | 6% | |||||||||||||||||
| Institutional |
632 | 893 | 1,071 | -29% | -41% | |||||||||||||||||
| New Zealand |
578 | 561 | 566 | 3% | 2% | |||||||||||||||||
| Wealth |
261 | 346 | 263 | -25% | -1% | |||||||||||||||||
| Asia Retail & Pacific |
53 | 45 | 99 | 18% | -46% | |||||||||||||||||
| TSO and Group Centre
|
(495)
|
|
(11)
|
|
27
|
large
|
large
|
|||||||||||||||
|
Subtotal |
2,782 | 3,540 | 3,676 | -21% | -24% | |||||||||||||||||
|
Other1
|
(44)
|
|
447
|
|
(170)
|
large
|
-74%
|
|||||||||||||||
|
Group total
|
2,738
|
|
3,987
|
|
3,506
|
-31%
|
-22%
|
|||||||||||||||
|
1. In evaluating the performance of the operating divisions, certain items are removed from the operating division results where they are not considered integral to the ongoing performance of the division and are evaluated separately. These items are set out in part (iii) of this note (refer pages 91 to 96 for further analysis).
(iii) Other items
The table below sets out the profit after tax impact of other items.
| ||||||||||||||||||||||
| Half Year | Movement | |||||||||||||||||||||
| Item gains/(losses) | Related segment | Mar 16 $M |
Sep 15 $M |
Mar 15 $M |
Mar 16 v. Sep 15 |
Mar 16 v. Mar 15 |
||||||||||||||||
| Treasury shares adjustment |
Wealth |
29 | 95 | (79) | -69% | large | ||||||||||||||||
| Revaluation of policy liabilities |
Wealth |
14 | 6 | 67 | large | -79% | ||||||||||||||||
| Economic hedging |
Institutional |
(128) | 165 | 14 | large | large | ||||||||||||||||
| Revenue and net investment hedges |
TSO and Group Centre |
39 | 179 | (176) | -78% | large | ||||||||||||||||
| Structured credit intermediation trades
|
Institutional
|
2
|
|
2
|
|
4
|
0%
|
-50%
|
||||||||||||||
|
Total profit after tax
|
(44)
|
|
447
|
|
(170)
|
large
|
-74%
|
|||||||||||||||
110
NOTES TO CONDENSED CONSOLIDATED FINANCIAL STATEMENTS
| 8. | Note to the Cash Flow Statement |
(i) Reconciliation of profit after income tax to net cash provided by/(used in) operating activities
| Half Year | ||||||||||
| Inflows (Outflows) |
Inflows (Outflows) |
Inflows (Outflows) |
||||||||
| Mar 16 $M |
Sep 15 $M |
Mar 15 $M |
||||||||
| Profit after income tax |
2,738 | 3,987 | 3,506 | |||||||
| Adjustments to reconcile to net cash provided by/(used in) operating activities |
||||||||||
| Provision for credit impairment |
904 | 685 | 494 | |||||||
| Depreciation and amortisation |
1,010 | 482 | 473 | |||||||
| Profit on Esanda Dealer Finance divestment |
(66) | - | - | |||||||
| (Profit)/loss on sale of premises and equipment |
(10) | 6 | - | |||||||
| Net derivatives/foreign exchange adjustment |
257 | 4,711 | 9,684 | |||||||
| Equity-settled share-based payments expense1 |
65 | 107 | (89) | |||||||
| Impairment of investment in AmBank |
260 | - | - | |||||||
| Other non-cash movements |
(297) | (199) | (300) | |||||||
| Net (increase)/decrease in operating assets: |
||||||||||
| Trading securities |
(2,160) | 2,460 | 410 | |||||||
| Collateral paid |
(3,462) | 920 | (4,505) | |||||||
| Net loans and advances |
(6,440) | (15,554) | (16,726) | |||||||
| Investments backing policy liabilities |
(384) | 1,335 | (3,122) | |||||||
| Interest receivable |
(113) | 137 | (31) | |||||||
| Accrued income |
(128) | - | (44) | |||||||
| Net tax assets |
(415) | (36) | (20) | |||||||
| Net increase/(decrease) in operating liabilities: |
||||||||||
| Deposits and other borrowings |
20,283 | (533) | 30,583 | |||||||
| Settlement balances owed by ANZ |
2,517 | 3,476 | (2,695) | |||||||
| Collateral received |
(744) | 2,437 | (1,364) | |||||||
| Life insurance contract policy liabilities |
355 | (1,253) | 2,760 | |||||||
| Payables and other liabilities |
(2,638) | (1,406) | 432 | |||||||
| Interest payable |
(122) | 507 | (55) | |||||||
| Accrued expenses |
(109) | (116) | (32) | |||||||
| Provisions including employee entitlements
|
134
|
|
(42)
|
|
6
|
|||||
|
Total adjustments
|
8,697
|
|
(1,876)
|
|
15,859
|
|||||
|
Net cash provided by/(used in) operating activities
|
11,435
|
|
2,111
|
|
19,365
|
|||||
| 1. | The equity settled share-based payments expense is net of on-market share purchases of $34 million (Sep 15 half: nil; Mar 15 half: $197 million) used to satisfy the obligation. |
(ii) Reconciliation of cash and cash equivalents
Cash and cash equivalents at the end of the period as shown in the Cash Flow Statement are reflected in the related items in the Balance Sheet as follows:
| As at | ||||||||||
| Mar 16 $M |
Sep 15 $M |
Mar 15 $M |
||||||||
| Cash |
49,144 | 53,903 | 46,004 | |||||||
| Settlement balances owed to ANZ
|
19,567
|
|
15,375
|
|
19,458
|
|||||
|
68,711
|
|
69,278
|
|
65,462
|
||||||
|
(iii) Non-cash financing and investing activities |
||||||||||
| Half Year | ||||||||||
| Share capital issues
|
Mar 16 $M |
Sep 15 $M |
Mar 15 $M |
|||||||
| Dividends satisfied by share issue |
215 | 865 | 257 | |||||||
| Dividends satisfied by bonus share issue
|
47
|
|
51
|
|
41
|
|||||
|
262
|
|
916
|
|
298
|
||||||
(iv) Esanda Dealer Finance divestment
During the period, the Group received $6,682 million proceeds on the Esanda Dealer Finance divestment. The net assets sold of $6,540 million primarily included net loans and advances in the retail portfolio. This does not include the Esanda Dealer Finance bailment facilities that are progressively being transferred. No cash was included in the net assets sold.
111
NOTES TO CONDENSED CONSOLIDATED FINANCIAL STATEMENTS
| 9. | Net loans and advances |
| As at
|
Movement
| |||||||||||
| Mar 16 $M
|
Sep 15 $M
|
Mar 15 $M
|
Mar 16
|
Mar 16
| ||||||||
| Australia |
||||||||||||
| Overdrafts |
6,175 | 6,284 | 5,998 | -2% | 3% | |||||||
| Credit card outstandings |
8,872 | 8,950 | 9,134 | -1% | -3% | |||||||
| Commercial bills outstanding |
10,439 | 10,420 | 10,859 | 0% | -4% | |||||||
| Term loans - housing |
242,426 | 230,879 | 217,756 | 5% | 11% | |||||||
| Term loans - non-housing1 |
118,456 | 124,051 | 118,027 | -5% | 0% | |||||||
| Lease receivables |
1,255 | 1,346 | 1,345 | -7% | -7% | |||||||
| Hire purchase |
957 | 1,111 | 1,293 | -14% | -26% | |||||||
| Other
|
255
|
114
|
489
|
large
|
-48%
| |||||||
| 388,835
|
383,155
|
364,901
|
1%
|
7%
| ||||||||
| Asia Pacific, Europe & America |
||||||||||||
| Overdrafts |
1,175 | 1,616 | 1,643 | -27% | -28% | |||||||
| Credit card outstandings |
1,446 | 1,445 | 1,370 | 0% | 6% | |||||||
| Commercial bills outstanding |
2,692 | 3,781 | 3,286 | -29% | -18% | |||||||
| Term loans - housing |
7,226 | 7,846 | 7,430 | -8% | -3% | |||||||
| Term loans - non-housing |
56,429 | 69,669 | 74,041 | -19% | -24% | |||||||
| Lease receivables |
254 | 341 | 222 | -26% | 14% | |||||||
| Other
|
341
|
137
|
31
|
large
|
large
| |||||||
| 69,563
|
84,835
|
88,023
|
-18%
|
-21%
| ||||||||
| New Zealand |
||||||||||||
| Overdrafts |
1,017 | 1,055 | 1,147 | -4% | -11% | |||||||
| Credit card outstandings |
1,517 | 1,535 | 1,609 | -1% | -6% | |||||||
| Term loans - housing |
63,649 | 61,743 | 63,311 | 3% | 1% | |||||||
| Term loans - non-housing |
39,003 | 38,973 | 40,259 | 0% | -3% | |||||||
| Lease receivables |
206 | 214 | 250 | -4% | -18% | |||||||
| Hire purchase |
901 | 860 | 862 | 5% | 5% | |||||||
| Other
|
-
|
-
|
123
|
n/a
|
-100%
| |||||||
| 106,293
|
104,380
|
107,561
|
2%
|
-1%
| ||||||||
| Sub-total
|
564,691
|
572,370
|
560,485
|
-1%
|
1%
| |||||||
| Unearned income |
(596) | (739) | (803) | -19% | -26% | |||||||
| Capitalised brokerage/mortgage origination fees2 |
1,013 | 1,253 | 1,127 | -19% | -10% | |||||||
| Customers’ liabilities for acceptances
|
760
|
1,371
|
1,422
|
-45%
|
-47%
| |||||||
| Gross loans and advances (including assets classified as held for sale)
|
565,868
|
574,255
|
562,231
|
-1%
|
1%
| |||||||
| Provision for credit impairment (refer Note 10)
|
(4,100)
|
(4,017)
|
(4,028)
|
2%
|
2%
| |||||||
| Net loans and advances (including assets classified as held for sale)
|
561,768
|
570,238
|
558,203
|
-1%
|
1%
| |||||||
| Assets classified as held for sale1
|
-
|
(8,065)
|
-
|
-100%
|
n/a
| |||||||
| Net loans and advances
|
561,768
|
562,173
|
558,203
|
0%
|
1%
| |||||||
| 1. | Includes $766 million of Esanda Dealer Finance bailment facilities which are due to migrate to Macquarie Group Limited during the third quarter of 2016. These assets formed part of the $8,065 million classified as held for sale as at 30 September 2015. |
| 2. | Capitalised brokerage/mortgage origination fees are amortised over the expected life of the loan. |
112
NOTES TO CONDENSED CONSOLIDATED FINANCIAL STATEMENTS
| 10. | Provision for credit impairment |
| Half Year
|
Movement
| |||||||||||
| Mar 16 $M |
Sep 15 $M |
Mar 15 $M |
Mar 16 v. Sep 15 |
Mar 16 v. Mar 15 | ||||||||
| Individual provision |
||||||||||||
| Balance at start of period |
1,061 | 1,114 | 1,176 | -5% | -10% | |||||||
| New and increased provisions |
1,137 | 951 | 806 | 20% | 41% | |||||||
| Write-backs |
(160) | (174) | (260) | -8% | -38% | |||||||
| Adjustment for exchange rate fluctuations |
(26) | 7 | 33 | large | large | |||||||
| Discount unwind |
(26) | (22) | (32) | 18% | -19% | |||||||
| Bad debts written-off |
(656) | (815) | (609) | -20% | 8% | |||||||
| Esanda Dealer Finance divestment
|
(92)
|
-
|
-
|
n/a
|
n/a
| |||||||
| Total individual provision
|
1,238
|
1,061
|
1,114
|
17%
|
11%
| |||||||
| Collective provision |
||||||||||||
| Balance at start of period |
2,956 | 2,914 | 2,757 | 1% | 7% | |||||||
| Charge/(release) to income statement |
26 | 40 | 55 | -35% | -53% | |||||||
| Adjustment for exchange rate fluctuations |
(47) | 2 | 102 | large | large | |||||||
| Esanda Dealer Finance divestment
|
(73)
|
-
|
-
|
n/a
|
n/a
| |||||||
| Total collective provision1
|
2,862
|
2,956
|
2,914
|
-3%
|
-2%
| |||||||
| Total provision for credit impairment
|
4,100
|
4,017
|
4,028
|
2%
|
2%
| |||||||
| 1. | The collective provision includes amounts for off-balance sheet credit exposures of $663 million at March 2016 (Sep 15: $677 million; Mar 2015: $646 million). The impact on the income statement for the half year ended 31 March 2016 was a $3 million charge (Sep 2015 half: $20 million charge; Mar 2015 half: $7 million charge). |
| Half Year
|
Movement
| |||||||||||
| Provision movement analysis | Mar 16 $M |
Sep 15 $M |
Mar 15 $M |
Mar 16 v. Sep 15 |
Mar 16 v. Mar 15 | |||||||
| New and increased individual provisions |
||||||||||||
| Australia |
738 | 616 | 587 | 20% | 26% | |||||||
| Asia Pacific, Europe & America |
299 | 227 | 116 | 32% | large | |||||||
| New Zealand
|
100
|
108
|
103
|
-7%
|
-3%
| |||||||
| 1,137 | 951 | 806 | 20% | 41% | ||||||||
| Write-backs
|
(160)
|
(174)
|
(260)
|
-8%
|
-38%
| |||||||
| 977 | 777 | 546 | 26% | 79% | ||||||||
| Recoveries of amounts previously written-off
|
(99)
|
(132)
|
(107)
|
-25%
|
-7%
| |||||||
| Individual credit impairment charge |
878 | 645 | 439 | 36% | 100% | |||||||
| Collective credit impairment charge
|
26
|
40
|
55
|
-35%
|
-53%
| |||||||
| Credit impairment charge
|
904
|
685
|
494
|
32%
|
83%
| |||||||
| Half Year
|
Movement
| |||||||||||
| Mar 16 $M |
Sep 15 $M |
Mar 15 $M |
Mar 16 v. Sep 15 |
Mar 16 v. Mar 15 | ||||||||
| Individual provision balance |
||||||||||||
| Australia |
762 | 698 | 698 | 9% | 9% | |||||||
| Asia Pacific, Europe & America |
353 | 216 | 219 | 63% | 61% | |||||||
| New Zealand
|
123
|
147
|
197
|
-16%
|
-38%
| |||||||
| Total individual provision
|
1,238
|
1,061
|
1,114
|
17%
|
11%
| |||||||
| Collective provision balance |
||||||||||||
| Australia |
1,844 | 1,895 | 1,882 | -3% | -2% | |||||||
| Asia Pacific, Europe & America |
597 | 636 | 582 | -6% | 3% | |||||||
| New Zealand
|
421
|
425
|
450
|
-1%
|
-6%
| |||||||
| Total collective provision
|
2,862
|
2,956
|
2,914
|
-3%
|
-2%
| |||||||
113
NOTES TO CONDENSED CONSOLIDATED FINANCIAL STATEMENTS
| 11. | Deposits and other borrowings |
| As at
|
Movement
| |||||||||||
| Mar 16 $M |
Sep 15 $M |
Mar 15 $M |
Mar 16 v. Sep 15 |
Mar 16 v. Mar 15 | ||||||||
| Australia
|
||||||||||||
| Certificates of deposit |
56,513 | 57,390 | 55,857 | -2% | 1% | |||||||
| Term deposits |
68,427 | 66,394 | 69,595 | 3% | -2% | |||||||
| On demand and short term deposits |
169,268 | 164,009 | 150,832 | 3% | 12% | |||||||
| Deposits not bearing interest |
8,116 | 7,782 | 7,133 | 4% | 14% | |||||||
| Deposits from banks |
24,532 | 19,692 | 19,761 | 25% | 24% | |||||||
| Commercial paper |
15,106 | 15,511 | 11,446 | -3% | 32% | |||||||
| Securities sold under repurchase agreements
|
653
|
177
|
605
|
large
|
8%
| |||||||
| 342,615
|
330,955
|
315,229
|
4%
|
9%
| ||||||||
| Asia Pacific, Europe & America |
||||||||||||
| Certificates of deposit |
6,888 | 5,379 | 2,354 | 28% | large | |||||||
| Term deposits |
90,112 | 96,487 | 101,087 | -7% | -11% | |||||||
| On demand and short term deposits |
25,010 | 27,663 | 23,966 | -10% | 4% | |||||||
| Deposits not bearing interest |
4,586 | 5,126 | 4,684 | -11% | -2% | |||||||
| Deposits from banks |
19,340 | 19,249 | 27,716 | 0% | -30% | |||||||
| Commercial paper |
1,045 | 2,965 | 5,125 | -65% | -80% | |||||||
| Securities sold under repurchase agreements
|
495
|
601
|
565
|
-18%
|
-12%
| |||||||
| 147,476
|
157,470
|
165,497
|
-6%
|
-11%
| ||||||||
| New Zealand |
||||||||||||
| Certificates of deposit |
1,675 | 677 | 1,435 | large | 17% | |||||||
| Term deposits |
33,871 | 31,795 | 34,211 | 7% | -1% | |||||||
| On demand and short term deposits |
39,276 | 37,662 | 36,896 | 4% | 6% | |||||||
| Deposits not bearing interest |
6,552 | 6,103 | 6,148 | 7% | 7% | |||||||
| Deposits from banks |
127 | 43 | 43 | large | large | |||||||
| Commercial paper |
4,913 | 4,511 | 6,157 | 9% | -20% | |||||||
| Borrowing corporations’ debt
|
1,566
|
1,578
|
1,599
|
-1%
|
-2%
| |||||||
| 87,980
|
82,369
|
86,489
|
7%
|
2%
| ||||||||
| Total deposits and other borrowings
|
578,071
|
570,794
|
567,215
|
1%
|
2%
| |||||||
114
NOTES TO CONDENSED CONSOLIDATED FINANCIAL STATEMENTS
| 12. | Subordinated debt |
| Half Year |
Movement | |||||||||||
| Mar 16 $M |
Sep 15 $M |
Mar 15 $M |
Mar 16 v. Sep 15 |
Mar 16 v. Mar 15 | ||||||||
| Additional Tier 1 Capital1
|
||||||||||||
| Convertible Preference Shares (ANZ CPS)
|
||||||||||||
| ANZ CPS22
|
1,969
|
1,969
|
1,969
|
0%
|
0%
| |||||||
| ANZ CPS33
|
1,338
|
1,336
|
1,335
|
0%
|
0%
| |||||||
| ANZ Capital Notes (ANZ CN)
|
||||||||||||
| ANZ CN14
|
1,113
|
1,112
|
1,110
|
0%
|
0%
| |||||||
| ANZ CN25
|
1,600
|
1,598
|
1,597
|
0%
|
0%
| |||||||
| ANZ CN36
|
961
|
959
|
958
|
0%
|
0%
| |||||||
| ANZ NZ Capital Notes7
|
446
|
449
|
484
|
-1%
|
-8%
| |||||||
| Tier 2 Capital8
|
||||||||||||
| Perpetual subordinated notes
|
1,145
|
1,188
|
1,211
|
-4%
|
-5%
| |||||||
| Term subordinated notes
|
8,985
|
8,398
|
7,799
|
7%
|
15%
| |||||||
| Total subordinated debt
|
17,557
|
17,009
|
16,463
|
3%
|
7%
| |||||||
| 1. | ANZ Capital Notes and the ANZ NZ Capital Notes are Basel 3 compliant. APRA has granted transitional capital treatment for ANZ CPS2 and CPS3 until their first conversion date. |
| 2. | On 17 December 2009, ANZ issued convertible preference shares (CPS2) which will convert into ANZ ordinary shares on 15 December 2016 at a 1% discount (subject to certain conditions being satisfied). |
| 3. | On 28 September 2011, ANZ issued convertible preference shares (CPS3) which will convert into ANZ ordinary shares on 1 September 2019 at a 1% discount (subject to certain conditions being satisfied). If ANZ’s Common Equity Tier 1 capital ratio is equal to or less than 5.125% then the convertible preference shares will immediately convert into ANZ ordinary shares at a 1% discount subject to a maximum conversion number. Subject to certain conditions, on and from 1 September 2017 the convertible preference shares are redeemable or convertible into ANZ ordinary shares (on similar terms to the mandatory conversion) by ANZ. |
| 4. | On 7 August 2013, ANZ issued convertible notes (ANZ Capital Notes 1 or CN1) which will convert into ANZ ordinary shares on 1 September 2023 at a 1% discount (subject to certain conditions being satisfied). If ANZ’s Common Equity Tier 1 capital ratio is equal to or less than 5.125%, or ANZ receives a notice of non-viability from APRA, then the notes will immediately convert into ANZ ordinary shares at a 1% discount subject to a maximum conversion number. Subject to certain conditions, on 1 September 2021 the notes are redeemable or convertible into ANZ ordinary shares (on similar terms to the mandatory conversion) by ANZ. |
| 5. | On 31 March 2014, ANZ issued convertible notes (ANZ Capital Notes 2 or CN2) which will convert into ANZ ordinary shares on 24 March 2024 at a 1% discount (subject to certain conditions being satisfied). If ANZ’s Common Equity Tier 1 capital ratio is equal to or less than 5.125%, or ANZ receives a notice of non-viability from APRA, then the notes will immediately convert into ANZ ordinary shares at a 1% discount subject to a maximum conversion number. Subject to certain conditions, on 24 March 2022 the notes are redeemable or convertible into ANZ ordinary shares (on similar terms to the mandatory conversion) by ANZ. |
| 6. | On 5 March 2015, ANZ acting through its New Zealand Branch issued convertible notes (ANZ Capital Notes 3 or CN3) which will convert into ANZ ordinary shares on 24 March 2025 at a 1% discount (subject to certain conditions being satisfied). If ANZ’s Common Equity Tier 1 capital ratio is equal to or less than 5.125%, or ANZ receives a notice of non-viability from APRA, then the notes will immediately convert into ANZ ordinary shares at a 1% discount subject to a maximum conversion number. Subject to certain conditions, on 24 March 2023 the notes are redeemable or convertible into ANZ ordinary shares (on similar terms to the mandatory conversion) by ANZ. |
| 7. | On 31 March 2015, ANZ Bank New Zealand Limited (ANZ Bank NZ) issued convertible notes (ANZ NZ Capital Notes) which will convert into ANZ ordinary shares on 25 May 2022 at a 1% discount (subject to certain conditions being satisfied). If ANZ or ANZ Bank NZ’s Common Equity Tier 1 capital ratio is equal to or less than 5.125%, ANZ receives a notice of non-viability from APRA, ANZ Bank NZ receives a direction from RBNZ or a statutory manager is appointed to ANZ Bank NZ and makes a determination, then the notes will immediately convert into ANZ ordinary shares at a 1% discount subject to a maximum conversion number. Subject to certain conditions, on 25 May 2020 the notes are redeemable or convertible into ANZ ordinary shares (on similar terms to the mandatory conversion) by ANZ Bank NZ. |
| 8. | The convertible subordinated notes are Basel 3 compliant. APRA has granted transitional capital treatment for all other outstanding subordinated notes until their first call date or, in the case of the perpetual subordinated notes the earlier of the end of the transitional period (December 2021) and the first call date when a step-up event occurs. If ANZ receives a notice of non-viability from APRA, then the convertible subordinated notes will immediately convert into ANZ ordinary shares at a 1% discount subject to a maximum conversion number. |
115
NOTES TO CONDENSED CONSOLIDATED FINANCIAL STATEMENTS
| 13. Credit | risk |
Financial assets maximum exposure to credit risk
For financial assets recognised on the balance sheet, the maximum exposure to credit risk is the carrying amount. In certain circumstances, there may be differences between the carrying amounts reported on the balance sheet and the amounts reported in the tables below. Principally, these differences arise in respect of financial assets that are subject to risks other than credit risk, such as equity investments which are primarily subject to market risk. For contingent exposures, the maximum exposure to credit risk is the maximum amount the Group would have to pay if the instrument is called upon. For undrawn facilities, the maximum exposure to credit risk is the full amount of the committed facilities.
The following tables present the maximum exposure to credit risk of on-balance sheet and off-balance sheet financial assets before taking account of any collateral held or other credit enhancements.
| As at
|
Movement
| |||||||||||
| Maximum exposure to credit risk
|
Mar 16 $M
|
Sep 15 $M1
|
Mar 15 $M
|
Mar 16
|
Mar 16
| |||||||
| Net loans and advances2 |
561,768 | 570,238 | 558,203 | -1% | 1% | |||||||
| Other financial assets3
|
280,101
|
265,167
|
246,131
|
6%
|
14%
| |||||||
| On-balance sheet sub total
|
841,869
|
835,405
|
804,334
|
1%
|
5%
| |||||||
| Undrawn facilities |
219,086 | 230,794 | 213,303 | -5% | 3% | |||||||
| Contingent facilities
|
38,750
|
40,335
|
41,018
|
-4%
|
-6%
| |||||||
| Off-balance sheet sub total
|
257,836
|
271,129
|
254,321
|
-5%
|
1%
| |||||||
| Total exposure to credit risk
|
1,099,705
|
1,106,534
|
1,058,655
|
-1%
|
4%
| |||||||
| 1. | The September 2015 half include Esanda Dealer Finance assets divested to Macquarie Group Limited in the March 2016 half. |
| 2. | Includes individual and collective provisions for credit impairment held in respect of credit related commitments. |
| 3. | Certain other financial assets totalling $37.1 billion (Sep 15 half: $36.6 billion; Mar 15 half: $38.2 billion) have been excluded. These are comprised of bank notes and coins within cash, equity instruments within available-for-sale financial assets and investments relating to the insurance business where the credit risk is passed onto the policy holder. |
Distribution of financial assets by credit quality
| Net loans and advances1
|
Other financial assets
|
Credit related commitments1,2
| ||||||||||||||||||||
|
As at
|
As at
|
As at
| ||||||||||||||||||||
| Mar 16 $M
|
Sep 15
|
Mar 15 $M
|
Mar 16 $M
|
Sep 15 $M
|
Mar 15 $M
|
Mar 16 $M
|
Sep 15 $M
|
Mar 15 $M
| ||||||||||||||
| Neither past due nor impaired | 545,953 | 556,393 | 543,280 | 280,082 | 265,130 | 246,104 | 257,099 | 270,395 | 253,606 | |||||||||||||
| Past due but not impaired | 14,926 | 12,958 | 14,071 | - | - | - | - | - | - | |||||||||||||
| Restructured | 226 | 184 | 146 | - | - | - | - | - | - | |||||||||||||
| Net impaired
|
1,355
|
1,403
|
1,385
|
19
|
37
|
27
|
45
|
34
|
36
| |||||||||||||
| Total
|
562,460
|
570,938
|
558,882
|
280,101
|
265,167
|
246,131
|
257,144
|
270,429
|
253,642
| |||||||||||||
| 1. | Individual and collective provisions for credit impairment held in respect of credit related commitments have been reallocated to credit related commitments in this table. |
| 2. | Comprises undrawn commitments and customer contingent liabilities net of collective and individual provisions. |
| 3. | The September 2015 half include Esanda Dealer Finance assets divested to Macquarie Group Limited in the March 2016 half. |
Credit quality of financial assets neither past due nor impaired
The credit quality of financial assets is managed by the Group using internal customer credit ratings (CCRs) based on their current probability of default. The Group’s masterscales are mapped to external rating agency scales, to enable wider comparisons.
| Net loans and advances
|
Other financial assets
|
Credit related commitments1
| ||||||||||||||||||||
|
As at
|
As at
|
As at
| ||||||||||||||||||||
| Mar 16 $M
|
Sep 15
|
Mar 15 $M
|
Mar 16 $M
|
Sep 15 $M
|
Mar 15 $M
|
Mar 16 $M
|
Sep 15 $M
|
Mar 15 $M
| ||||||||||||||
| Strong credit profile3 | 419,296 | 423,572 | 412,909 | 275,339 | 260,041 | 241,170 | 211,147 | 220,815 | 211,380 | |||||||||||||
| Satisfactory risk4 | 109,110 | 112,822 | 112,049 | 4,525 | 4,729 | 4,574 | 42,913 | 46,681 | 39,773 | |||||||||||||
| Sub-standard but not past due or impaired5
|
17,547
|
19,999
|
18,322
|
218
|
360
|
360
|
3,039
|
2,899
|
2,453
| |||||||||||||
| Total
|
545,953
|
556,393
|
543,280
|
280,082
|
265,130
|
246,104
|
257,099
|
270,395
|
253,606
| |||||||||||||
| 1. | Comprises undrawn commitments and customer contingent liabilities net of collective provisions. |
| 2. | The September 2015 half include Esanda Dealer Finance assets divested to Macquarie Group Limited in the March 2016 half. |
| 3. | Customers that have demonstrated superior stability in their operating and financial performance over the long-term, and whose debt servicing capacity is not significantly vulnerable to foreseeable events. This rating broadly corresponds to ratings “Aaa” to “Baa3” and “AAA” to “BBB-” of Moody’s and Standard & Poor’s respectively. |
| 4. | Customers that have consistently demonstrated sound operational and financial stability over the medium to long term, even though some may be susceptible to cyclical trends or variability in earnings. This rating broadly corresponds to ratings “Ba2” to “Ba3” and “BB” to “BB-” of Moody’s and Standard & Poor’s respectively. |
| 5. | Customers that have demonstrated some operational and financial instability, with variability and uncertainty in profitability and liquidity projected to continue over the short and possibly medium term. This rating broadly corresponds to ratings “B1” to “Caa” and “B+” to “CCC” of Moody’s and Standard & Poor’s respectively. |
116
NOTES TO CONDENSED CONSOLIDATED FINANCIAL STATEMENTS
| 13. | Credit Risk, cont’d |
Ageing analysis of financial assets that are past due but not impaired
Ageing analysis of past due loans is used by the Group to measure and manage emerging credit risks. Financial assets that are past due but not impaired include those which are assessed, approved and managed on a portfolio basis within a centralised environment (for example credit cards and personal loans) that can be held on a productive basis until they are 180 days past due, as well as those which are managed on an individual basis.
A large portion of retail credit exposures, such as residential mortgages, are generally well secured. That is, the value of supporting collateral is sufficient to cover amounts outstanding.
| As at
|
Movement
| |||||||||||
| Ageing analysis of net loans and advances that are past due but not impaired
|
Mar 16 $M |
Sep 15 $M |
Mar 15 $M |
Mar 16 v. Sep 15 |
Mar 16 v. Mar 15 | |||||||
| 1-5 days |
2,926 | 2,621 | 3,323 | 12% | -12% | |||||||
| 6-29 days |
5,942 | 5,235 | 5,271 | 14% | 13% | |||||||
| 30-59 days |
2,222 | 1,674 | 2,069 | 33% | 7% | |||||||
| 60-89 days |
1,263 | 1,050 | 1,160 | 20% | 9% | |||||||
| >90 days
|
2,573
|
2,378
|
2,248
|
8%
|
14%
| |||||||
| Total
|
14,926
|
12,958
|
14,071
|
15%
|
6%
| |||||||
Financial assets that are individually impaired
ANZ regularly reviews its portfolio and monitors adherence to contractual terms. When doubt arises as to the collectability of a credit facility, the financial instrument (or ‘the facility’) is classified and reported as individually impaired and an individual provision is allocated against it.
As described in the summary of significant accounting policies in the 2015 Annual Financial Statements, impairment provisions are created for financial instruments that are reported on the balance sheet at amortised cost. For instruments reported at fair value, impairment provisions are treated as part of overall change in fair value and directly reduce the reported carrying amounts.
| Impaired instruments
|
Individual provision balances
| |||||||||||||
|
As at
|
As at
| |||||||||||||
| Mar 16 $M
|
Sep 15
|
Mar 15
|
Mar 16 $M
|
Sep 15
|
Mar 15
| |||||||||
| Derivative financial instruments1 |
19 | 37 | 27 | - |
- | - | ||||||||
| Net loans and advances |
2,564 | 2,441 | 2,466 | 1,209 | 1,038 | 1,081 | ||||||||
| Credit related commitments2
|
74
|
57
|
69
|
29
|
23
|
33
| ||||||||
| Total
|
2,657
|
2,535
|
2,562
|
1,238
|
1,061
|
1,114
| ||||||||
| 1. | Derivative financial instruments are net of credit valuation adjustments. |
| 2. | Comprises undrawn commitments and customer contingent liabilities. |
| As at
|
Movement
| |||||||||||
| Mar 16 $M
|
Sep 15
|
Mar 15
|
Mar 16
|
Mar 16
| ||||||||
| Less than $10 million |
1,597 | 1,748 | 1,903 | -9% | -16% | |||||||
| $10 million to $100 million |
970 | 708 | 607 | 37% | 60% | |||||||
| Greater than $100 million
|
316
|
263
|
198
|
20%
|
60%
| |||||||
| Gross impaired assets1 |
2,883 | 2,719 | 2,708 | 6% | 6% | |||||||
| Less: Individual provision for credit impairment
|
(1,238)
|
(1,061)
|
(1,114)
|
17%
|
11%
| |||||||
| Net impaired assets
|
1,645
|
1,658
|
1,594
|
-1%
|
3%
| |||||||
| 1. | Includes $226 million of restructured items (Sep 15: $184 million; Mar 15: $146 million). |
117
NOTES TO CONDENSED CONSOLIDATED FINANCIAL STATEMENTS
| 14. | Fair Value Measurement |
A significant number of financial instruments are carried on the balance sheet at fair value. The following disclosures set out the classification of financial assets and financial liabilities and, in respect of the fair value either recognised or disclosed, the various levels within which fair value measurements are categorised, and the valuation methodologies and techniques used. The fair value disclosure does not cover those instruments that are not considered financial instruments from an accounting perspective, such as intangible assets.
(i) Financial assets and financial liabilities measured at fair value in the balance sheet
| (a) | Valuation methodologies |
ANZ has an established control framework that ensures fair value is either determined or validated by a function independent of the party that undertakes the transaction. The control framework ensures that all models are calibrated periodically to test that outputs reflect prices from observable current market transactions in the same instrument or other available observable market data.
Where quoted market prices are used, prices are independently verified from other sources. For fair values determined using a valuation model, the control framework may include, as applicable, independent development or validation of valuation models, any inputs to those models, any adjustments required outside the valuation model and, where possible, independent validation of model outputs. In this way, continued appropriateness of the valuations is ensured.
In instances where the Group holds offsetting risk positions, the Group uses the portfolio exemption in AASB 13 to measure the fair value of such groups of financial assets and financial liabilities on the basis of the price that would be received to sell a net long position (that is, an asset) for a particular risk exposure or to transfer a net short position (that is, a liability) for a particular risk exposure.
The Group categorises its fair value measurements on the basis of inputs used in measuring fair value using the fair value hierarchy below:
| ¡ | Level 1 – Financial instruments that have been valued by reference to unadjusted quoted prices in active markets for identical financial instruments. This category includes financial instruments valued using quoted yields where available for specific debt securities. |
| ¡ | Level 2 – Financial instruments that have been valued through valuation techniques incorporating inputs other than quoted prices within Level 1 that are observable for a similar financial asset or liability, either directly or indirectly. |
| ¡ | Level 3 – Financial instruments that have been valued using valuation techniques which incorporate significant inputs that are not based on observable market data (unobservable inputs). |
| (b) | Valuation techniques and inputs used |
In the event that there is no quoted market price for the instrument, fair value is based on valuation techniques. The valuation models incorporate the impact of bid/ask spreads, counterparty credit spreads, funding costs and other factors that would influence the fair value determined by market participants.
The majority of valuation techniques employ only observable market data. However, for certain financial instruments the valuation technique may employ some data (valuation inputs or components) which is not readily observable in the current market. In these cases valuation inputs (or components of the overall value) are derived and extrapolated from other relevant market data and tested against historic transactions and observed market trends. To the extent that valuation is based on models or inputs that are not observable in the market, the determination of fair value can be more subjective, dependent on the significance of the unobservable input to the overall valuation.
The following valuation techniques have been applied to determine the fair values of financial instruments where there is no quoted price for the instrument:
| ¡ | For instruments classified as Trading security assets and Securities short sold, Derivative financial assets and liabilities, Available-for-sale assets, and Investments backing policy liabilities, fair value measurements are derived by using modelled valuation techniques (including discounted cash flow models) that incorporate market prices/yields for securities with similar credit risk, maturity and yield characteristics; and/or current market yields for similar instruments. |
| ¡ | For Net loans and advances, Deposits and other borrowings and Debt issuances, discounted cash flow techniques are used where contractual future cash flows of the instrument are discounted using discount rates incorporating wholesale market rates or market borrowing rates of debt with similar maturities or a yield curve appropriate for the remaining term to maturity. |
| ¡ | The fair value of external unit holder liabilities (life insurance funds) represents the external unit holder’s share of the net assets of the consolidated investment funds, which are carried at fair value. The fair value of policy liabilities, being liabilities of the insurance business is directly linked to the performance and value of the assets backing the liabilities. These liabilities are carried at fair value using observable inputs. |
Further details of valuation techniques and significant unobservable inputs used in measuring fair values are described in (ii)(a) below.
There have been no substantial changes in the valuation techniques applied to different classes of financial instruments during the current half-year period.
| (c) | Fair value measurements |
The following table provides an analysis of financial instruments carried at fair value at reporting date categorised according to the lowest level input into a valuation model or a valuation component that is significant to the reported fair value. The significance of the input is assessed against the reported fair value of the financial instrument and considers various factors specific to the financial instrument. The fair value has been allocated in full to the category in the fair value hierarchy which most appropriately reflects the determination of the fair value.
118
NOTES TO CONDENSED CONSOLIDATED FINANCIAL STATEMENTS
| Fair value measurements
|
||||||||||||||||
| As at March 2016 |
Level 1 $M |
Level 2 $M |
Level 3 $M |
Total $M |
||||||||||||
| Financial assets |
||||||||||||||||
| Trading securities |
46,988 | 3,080 | 5 | 50,073 | ||||||||||||
| Derivative financial instruments |
519 | 88,143 | 85 | 88,747 | ||||||||||||
| Available-for-sale assets1 |
43,262 | 6,819 | 296 | 50,377 | ||||||||||||
| Net loans and advances (measured at fair value) |
- | 574 | 14 | 588 | ||||||||||||
| Investments backing policy liabilities1
|
|
17,550
|
|
|
16,473
|
|
|
518
|
|
|
34,541
|
| ||||
|
Total
|
|
108,319
|
|
|
115,089
|
|
|
918
|
|
|
224,326
|
| ||||
| Financial liabilities |
||||||||||||||||
| Deposits and other borrowings (designated at fair value) |
- | 4,986 | - | 4,986 | ||||||||||||
| Derivative financial instruments |
635 | 90,988 | 83 | 91,706 | ||||||||||||
| Policy liabilities2 |
- | 34,854 | - | 34,854 | ||||||||||||
| External unit holder liabilities (life insurance funds) |
- | 3,265 | - | 3,265 | ||||||||||||
| Payables and other liabilities3 |
2,761 | 201 | - | 2,962 | ||||||||||||
| Debt issuances (designated at fair value)
|
|
-
|
|
|
2,823
|
|
|
-
|
|
|
2,823
|
| ||||
|
Total
|
|
3,396
|
|
|
137,117
|
|
|
83
|
|
|
140,596
|
| ||||
| As at September 2015 | ||||||||||||||||
| Financial assets |
||||||||||||||||
| Trading securities |
45,227 | 3,769 | 4 | 49,000 | ||||||||||||
| Derivative financial instruments |
388 | 85,155 | 82 | 85,625 | ||||||||||||
| Available-for-sale assets |
37,086 | 6,347 | 234 | 43,667 | ||||||||||||
| Net loans and advances (measured at fair value) |
- | 683 | 16 | 699 | ||||||||||||
| Investments backing policy liabilities
|
|
17,983
|
|
|
16,298
|
|
|
539
|
|
|
34,820
|
| ||||
|
Total
|
|
100,684
|
|
|
112,252
|
|
|
875
|
|
|
213,811
|
| ||||
| Financial liabilities |
||||||||||||||||
| Deposits and other borrowings (designated at fair value) |
- | 4,576 | - | 4,576 | ||||||||||||
| Derivative financial instruments |
782 | 80,387 | 101 | 81,270 | ||||||||||||
| Policy liabilities2 |
- | 35,029 | - | 35,029 | ||||||||||||
| External unit holder liabilities (life insurance funds) |
- | 3,291 | - | 3,291 | ||||||||||||
| Payables and other liabilities3 |
2,443 | 125 | - | 2,568 | ||||||||||||
| Debt issuances (designated at fair value)
|
|
-
|
|
|
3,165
|
|
|
-
|
|
|
3,165
|
| ||||
|
Total
|
|
3,225
|
|
|
126,573
|
|
|
101
|
|
|
129,899
|
| ||||
| As at March 2015 | ||||||||||||||||
| Financial assets |
||||||||||||||||
| Trading securities |
48,091 | 3,295 | - | 51,386 | ||||||||||||
| Derivative financial instruments |
432 | 73,027 | 121 | 73,580 | ||||||||||||
| Available-for-sale assets |
31,502 | 6,514 | 320 | 38,336 | ||||||||||||
| Net loans and advances (designated at fair value) |
- | 695 | - | 695 | ||||||||||||
| Investments backing policy liabilities
|
|
19,141
|
|
|
16,615
|
|
|
739
|
|
|
36,495
|
| ||||
|
Total
|
|
99,166
|
|
|
100,146
|
|
|
1,180
|
|
|
200,492
|
| ||||
| Financial liabilities |
||||||||||||||||
| Deposits and other borrowings (designated at fair value) |
- | 6,278 | - | 6,278 | ||||||||||||
| Derivative financial instruments |
688 | 72,397 | 125 | 73,210 | ||||||||||||
| Policy liabilities2 |
- | 36,449 | - | 36,449 | ||||||||||||
| External unit holder liabilities (life insurance funds) |
- | 3,489 | - | 3,489 | ||||||||||||
| Payables and other liabilities3 |
3,905 | 158 | - | 4,063 | ||||||||||||
| Debt issuances (designated at fair value)
|
|
-
|
|
|
3,501
|
|
|
-
|
|
|
3,501
|
| ||||
|
Total
|
|
4,593
|
|
|
122,272
|
|
|
125
|
|
|
126,990
|
| ||||
| 1. | During the period there were transfers from Level 1 to Level 2 of $599 million (Sep 2015: $190 million, Mar 2015: $114 million) following a reassessment of available pricing information. Of the total transfers of $599 million in the current period, $486 million relates to Available-for-sale assets and $113 million relates to Investments backing policy liabilities. During the period there were also transfers from Level 2 to Level 1 of $14 million (Sep 2015: $114 million, Mar 2015: $127 million) following increased trading activity to support the quoted prices relating to Investments backing policy liabilities. Transfers into and out of Level 1 and Level 2 are deemed to have occurred as of the beginning of the reporting period in which the transfer occurred. |
| 2. | Policy liabilities relate to life investment contract liabilities only as these are designated at fair value through profit or loss. |
| 3. | Represents securities short sold. |
119
NOTES TO CONDENSED CONSOLIDATED FINANCIAL STATEMENTS
| (ii) | Details of fair value measurements that incorporate unobservable market data |
| (a) | Composition of Level 3 fair value measurements |
The following table presents the composition of financial instruments measured at fair value with significant unobservable inputs (Level 3 fair value measurements).
| As at March 2016 | Financial assets | Financial | ||||||||||||||||||||
| Trading securities $M |
Derivatives $M |
Available-for- sale $M |
Net loans and advances $M |
Investments $M |
Derivatives $M | |||||||||||||||||
| Asset backed securities |
- | - | 1 | - | 192 | - | ||||||||||||||||
| Illiquid corporate bonds |
5 | - | 260 | 14 | 6 | - | ||||||||||||||||
| Structured credit products |
- | 49 | - | - | - | (62) | ||||||||||||||||
| Alternative assets |
- | - | 35 | - | 320 | - | ||||||||||||||||
| Other derivatives
|
|
-
|
|
|
36
|
|
|
-
|
|
|
-
|
|
|
-
|
|
(21)
| ||||||
|
Total
|
|
5
|
|
|
85
|
|
|
296
|
|
|
14
|
|
|
518
|
|
(83)
| ||||||
| As at September 2015 | ||||||||||||||||||||||
| Asset backed securities |
- | - | 2 | - | 188 | - | ||||||||||||||||
| Illiquid corporate bonds |
4 | - | 198 | 16 | - | - | ||||||||||||||||
| Structured credit products |
- | 52 | - | - | - | (67) | ||||||||||||||||
| Alternative assets |
- | - | 34 | - | 351 | - | ||||||||||||||||
| Other derivatives
|
|
-
|
|
|
30
|
|
|
-
|
|
|
-
|
|
|
-
|
|
(34)
| ||||||
|
Total
|
|
4
|
|
|
82
|
|
|
234
|
|
|
16
|
|
|
539
|
|
(101)
| ||||||
| As at March 2015 | ||||||||||||||||||||||
| Asset backed securities |
- | - | 1 | - | 191 | - | ||||||||||||||||
| Illiquid corporate bonds |
- | - | 289 | - | 5 | - | ||||||||||||||||
| Structured credit products |
- | 59 | - | - | - | (77) | ||||||||||||||||
| Managed funds (suspended) |
- | - | - | - | 5 | - | ||||||||||||||||
| Alternative assets |
- | - | 30 | - | 538 | - | ||||||||||||||||
| Other derivatives
|
|
-
|
|
|
62
|
|
|
-
|
|
|
-
|
|
|
-
|
|
(48)
| ||||||
|
Total
|
|
-
|
|
|
121
|
|
|
320
|
|
|
-
|
|
|
739
|
|
(125)
| ||||||
Structured credit products comprise the structured credit intermediation trades that the Group entered into from 2004 to 2007 whereby it sold protection using credit default swaps over certain structures, and mitigated risk by purchasing protection via credit default swaps from US financial guarantors over the same structures. These trades are valued using complex models with certain inputs relating to the reference assets and derivative counterparties not being observable in the market. Such unobservable inputs include credit spreads and default probabilities contributing from 16% to 25% of the valuation. The assets underlying the structured credit products are diverse instruments with a wide range of credit spreads and default probabilities relevant to the valuation.
The remaining Level 3 balances include Asset backed securities and Illiquid corporate bonds where the effect on fair value of issuer credit cannot be directly or indirectly observed in the market; managed funds (suspended) comprising fixed income and mortgage investments in managed funds that are illiquid and are not currently redeemable; Alternative assets that largely comprise investments in funds which are illiquid and are not currently redeemable, as well as various investments in unlisted equity securities for which no active market exists; and Other derivatives which predominantly include reverse mortgage swaps where the mortality rate cannot be observed and options over emissions certificates where the volatility input cannot be observed.
120
NOTES TO CONDENSED CONSOLIDATED FINANCIAL STATEMENTS
| (b) | Movements in Level 3 fair value measurements |
The following table sets out movements in Level 3 fair value measurements. Derivatives are categorised on a portfolio basis and classified as either financial assets or financial liabilities based on whether the closing balance is an unrealised gain or loss. This could be different to the opening balance.
| As at March 2016 | Financial assets | Financial liabilities |
||||||||||||||||||||||
| Trading securities $M |
Derivatives $M |
Available- for-sale $M |
Net loans and advances $M |
Investments $M |
Derivatives $M |
|||||||||||||||||||
| Opening balance |
4 | 82 | 234 | 16 | 539 | (101) | ||||||||||||||||||
| New purchases and issues |
1 | 1 | 1 | - | 87 | - | ||||||||||||||||||
| Disposals / (sales) |
- | (1) | (4) | - | (98) | - | ||||||||||||||||||
| Cash settlements |
- | - | - | - | - | 1 | ||||||||||||||||||
| Transfers: |
||||||||||||||||||||||||
| Transfers into Level 3 category1 |
- | 1 | 77 | - | 61 | (1) | ||||||||||||||||||
| Transfers out of Level 3 category1 |
- | - | - | - | (20) | 9 | ||||||||||||||||||
| Fair value gain/(loss) recorded in other operating income in the income statement2 |
- | 2 | (1) | (2) | (51) | 9 | ||||||||||||||||||
| Fair value gain/(loss) recognised in reserves in equity
|
|
-
|
|
|
-
|
|
|
(11)
|
|
|
-
|
|
|
-
|
|
|
-
|
| ||||||
|
Closing balance
|
|
5
|
|
|
85
|
|
|
296
|
|
|
14
|
|
|
518
|
|
|
(83)
|
| ||||||
| As at September 2015 | ||||||||||||||||||||||||
| Opening balance |
- | 121 | 320 | - | 739 | (125) | ||||||||||||||||||
| New purchases and issues |
- | - | 4 | 21 | 56 | - | ||||||||||||||||||
| Disposals / (sales) |
- | - | (14) | - | (60) | - | ||||||||||||||||||
| Cash settlements |
- | - | - | - | - | 3 | ||||||||||||||||||
| Transfers: |
||||||||||||||||||||||||
| Transfers into Level 3 category |
10 | 2 | - | - | 7 | (2) | ||||||||||||||||||
| Transfers out of Level 3 category |
- | (17) | (69) | - | (246) | 8 | ||||||||||||||||||
| Fair value gain/(loss) recorded in other operating income in the income statement2 |
(6) | (24) | 1 | (5) | 43 | 15 | ||||||||||||||||||
| Fair value gain/(loss) recognised in reserves in equity
|
|
-
|
|
|
-
|
|
|
(8)
|
|
|
-
|
|
|
-
|
|
|
-
|
| ||||||
|
Closing balance
|
|
4
|
|
|
82
|
|
|
234
|
|
|
16
|
|
|
539
|
|
|
(101)
|
| ||||||
| As at March 2015 | ||||||||||||||||||||||||
| Opening balance |
- | 106 | 40 | - | 545 | (105) | ||||||||||||||||||
| New purchases and issues |
- | - | 4 | - | 241 | (1) | ||||||||||||||||||
| Disposals / (sales) |
- | (8) | (6) | - | (293) | - | ||||||||||||||||||
| Cash settlements |
- | - | - | - | - | 5 | ||||||||||||||||||
| Transfers: |
||||||||||||||||||||||||
| Transfers into Level 3 category |
- | - | 267 | - | 172 | - | ||||||||||||||||||
| Transfers out of Level 3 category |
- | - | - | - | 1 | |||||||||||||||||||
| Fair value gain/(loss) recorded in other operating income in the income statement2 |
- | 23 | 4 | - | 74 | (25) | ||||||||||||||||||
| Fair value gain/(loss) recognised in reserves in equity
|
|
-
|
|
|
-
|
|
|
11
|
|
|
-
|
|
|
-
|
|
|
-
|
| ||||||
|
Closing balance
|
|
-
|
|
|
121
|
|
|
320
|
|
|
-
|
|
|
739
|
|
|
(125)
|
| ||||||
| 1. | Transfers into Level 3 for the Group relate principally to illiquid corporate bonds and asset backed securities where market activity has reduced resulting in pricing to no longer be observable. Transfers out of Level 3 for the Group relate principally to asset backed securities following an increase in trading activity to support observable pricing as well as derivative liabilities were the current valuation is now deemed to only include observable inputs which are significant to the valuation. Transfers into and out of Level 3 are deemed to have occurred as of the beginning of the reporting period in which the transfer occurred. |
| 2. | Relating to assets and liabilities held at the end of the period. |
| (c) | Sensitivity to Level 3 data inputs |
Where valuation techniques are employed and assumptions are required due to significant data inputs not being directly observed in the market place (Level 3 inputs), changing these assumptions changes the resultant estimate of fair value. The majority of transactions in this category are ‘back-to-back’ in nature where ANZ either acts as a financial intermediary or hedges the market risks. Similarly, the valuation of Investments backing policy liabilities directly impacts the associated life investment contracts they relate to. In these circumstances, changes in the assumptions generally have minimal impact on the income statement and net assets of ANZ. An exception to this is the ‘back-to-back’ structured credit intermediation trades which create significant exposure to credit risk.
Principal inputs used in the determination of fair value of financial instruments included in the structured credit portfolio include counterparty credit spreads, market-quoted CDS prices, recovery rates, default probabilities, correlation curves and other inputs, some of which may not be directly observable in the market. The potential effect of changing prevailing unobservable inputs to reasonably possible alternative assumptions for valuing those financial instruments could result in less than a (+/-) $3 million (Sep 2015 & Mar 2015: (+/-) $5 million) impact on profit. The ranges of reasonably possible alternative assumptions are established by application of professional judgement and analysis of the data available to support each assumption.
121
NOTES TO CONDENSED CONSOLIDATED FINANCIAL STATEMENTS
| (d) | Deferred fair value gains and losses |
Where the fair value of a financial instrument at initial recognition is determined using unobservable data that is significant to the valuation of the instrument, the difference between the transaction price and the amount determined based on the valuation technique (day one gain or loss) is not immediately recognised in the income statement. Subsequently, the day one gain or loss is recognised in the income statement over the life of the transaction on a straight line basis or over the period until all inputs become observable.
The table below summarises the aggregate amount of day-one gains not yet recognised in the income statement and amounts which have been subsequently recognised.
| Half Year | ||||||
| Mar 16 | Sep 15 | Mar 15 | ||||
| $M | $M | $M | ||||
| Opening balance |
2 | 2 | 3 | |||
| Deferral on new transactions |
1 | - | - | |||
| Amounts recognised in income statement during the period
|
(1)
|
-
|
(1)
| |||
|
Closing balance1 |
2
|
2
|
2
| |||
| 1. | The closing balance of unrecognised gains predominantly relates to derivative financial instruments. |
(iii) Financial assets and financial liabilities not measured at fair value
The table below reflects the carrying amounts of financial instruments not measured at fair value on the Group’s balance sheet and where the carrying amount is not considered a close approximation of fair value. The table also provides comparison of the carrying amount of these financial instruments to the Group’s estimate of their fair value.
| Carrying amount in the balance sheet | Fair Value | |||||||||||||||||
| As at March 2016 |
At amortised $M |
At fair $M |
Total $M |
$M | ||||||||||||||
| Financial assets |
||||||||||||||||||
| Net loans and advances1 |
561,180 | 588 | 561,768 | 562,545 | ||||||||||||||
| Financial liabilities |
||||||||||||||||||
| Deposits and other borrowings |
573,085 | 4,986 | 578,071 | 578,432 | ||||||||||||||
| Debt issuances1 |
79,124 | 2,823 | 81,947 | 81,842 | ||||||||||||||
| Subordinated debt1
|
|
17,557
|
|
|
-
|
|
|
17,557
|
|
|
17,545
|
| ||||||
|
|
669,766
|
|
|
7,809
|
|
|
677,575
|
|
|
677,819
|
| |||||||
| As at September 2015 |
||||||||||||||||||
| Financial assets |
||||||||||||||||||
| Net loans and advances1 |
569,539 | 699 | 570,238 | 571,639 | ||||||||||||||
| Financial liabilities |
||||||||||||||||||
| Deposits and other borrowings |
566,218 | 4,576 | 570,794 | 571,212 | ||||||||||||||
| Debt issuances1 |
90,582 | 3,165 | 93,747 | 93,871 | ||||||||||||||
| Subordinated debt1
|
|
17,009
|
|
|
-
|
|
|
17,009
|
|
|
17,083
|
| ||||||
|
|
673,809
|
|
|
7,741
|
|
|
681,550
|
|
|
682,166
|
| |||||||
| As at March 2015 |
||||||||||||||||||
| Financial assets |
||||||||||||||||||
| Net loans and advances1 |
557,508 | 695 | 558,203 | 559,400 | ||||||||||||||
| Financial liabilities |
||||||||||||||||||
| Deposits and other borrowings |
560,937 | 6,278 | 567,215 | 567,711 | ||||||||||||||
| Debt issuances1 |
82,163 | 3,501 | 85,664 | 86,405 | ||||||||||||||
| Subordinated debt1
|
|
16,463
|
|
|
-
|
|
|
16,463
|
|
|
16,657
|
| ||||||
|
|
659,563
|
|
|
9,779
|
|
|
669,342
|
|
|
670,773
|
| |||||||
| 1. | Fair value hedging is applied to certain financial instruments within the amortised cost categories. The resulting fair value adjustments mean that the carrying value differs from the original amortised cost. |
122
NOTES TO CONDENSED CONSOLIDATED FINANCIAL STATEMENTS
| 15. | Share capital |
| Issued and quoted securities | Half Year
| |||||
| Ordinary share capital |
Mar 16 No. |
Sep 15 No. |
Mar 15 No. | |||
| Closing balance |
2,917,560,098 | 2,902,714,361 | 2,765,980,222 | |||
| Issued during the period1,2 |
14,845,737 | 136,734,139 | 9,352,451 | |||
| Preference share capital |
||||||
| Bought back during the period3 |
- | - | 500,000 | |||
| 1. | The company issued 9.7 million shares under the Dividend Reinvestment Plan and Bonus Option Plan for the 2015 final dividend (28.6 million shares for the 2015 interim dividend; 9.3 million shares for the 2014 final dividend) and 5.1 million shares to satisfy obligations under the Group’s Employee share acquisition plans (nil in prior periods). |
| 2. | The company issued 80.8 million ordinary shares under the Institutional Share Placement and 27.3 million ordinary shares under the Retail Share Purchase Plan in the September half 2015. |
| 3. | All 500,000 Euro Trust Securities on issue were bought back by ANZ for cash at face value (€1,000 per security) and cancelled on 15 December 2014. |
| 16. | Shareholders’ equity |
| Half Year
|
Movement | |||||||||||||||
| Mar 16 $M |
Sep 15 $M |
Mar 15 $M |
Mar 16 v. Sep 15 |
Mar 16 v. Mar 15 | ||||||||||||
| Share capital |
||||||||||||||||
| Balance at start of period |
28,367 | 24,152 | 24,902 | 17% | 14% | |||||||||||
| Ordinary share capital movements |
||||||||||||||||
| Dividend reinvestment plan |
215 | 865 | 257 | -75% | -16% | |||||||||||
| Share Placement and Purchase Plan |
- | 3,206 | - | -100% | n/a | |||||||||||
| Group employee share acquisition scheme1 |
56 | 98 | (97) | -43% | large | |||||||||||
| Treasury shares in Wealth2 |
(13) | 44 | (39) | large | -67% | |||||||||||
| Group share option scheme |
- | 2 | - | -100% | n/a | |||||||||||
| Group share buyback |
- | - | - | n/a | n/a | |||||||||||
| Preference share capital movements |
||||||||||||||||
| Preference shares bought back3
|
-
|
|
-
|
|
(871)
|
|
n/a
|
|
-100%
| |||||||
|
Total share capital
|
28,625
|
|
28,367
|
|
24,152
|
|
1%
|
|
19%
| |||||||
| 1. | As at 31 March 2016, there were 11.0 million ANZEST Treasury shares outstanding (Sep 15: 11.4 million; Mar 15: 11.5 million). Shares in the Company which are purchased on-market by ANZEST Pty Ltd (trustee of ANZ employee share and option plans) or issued by the Company to ANZEST Pty Ltd are classified as Treasury shares (to the extent that they relate to unvested employee share-based awards). |
| 2. | As at 31 March 2016, there were 12.0 million Wealth Treasury shares outstanding (Sep 15: 11.6 million; Mar 15: 13.1 million). Wealth purchases and holds shares in the Company to back policy liabilities. These shares are classified as Treasury shares. |
| 3. | All 500,000 Euro Trust Securities on issue were bought back by ANZ for cash at face value (€1,000 per security) and cancelled on 15 December 2014. |
123
NOTES TO CONDENSED CONSOLIDATED FINANCIAL STATEMENTS
| 16. | Shareholders’ equity, cont’d |
| Half Year
|
Movement
| |||||||||||||||||
|
Mar 16 |
Sep 15 |
Mar 15 |
Mar
16 |
Mar
16 | ||||||||||||||
| Foreign currency translation reserve |
||||||||||||||||||
| Balance at start of period |
1,119 | 1,569 | (605) | -29% | large | |||||||||||||
| Transfer to the income statement |
(126) | (4) | - | large | n/a | |||||||||||||
| Currency translation adjustments net of hedges
|
(1,002)
|
|
(446)
|
|
|
2,174
|
|
|
large
|
|
large
| |||||||
|
Total foreign currency translation reserve
|
(9)
|
|
1,119
|
|
|
1,569
|
|
|
large
|
|
large
| |||||||
| Share option reserve4 |
||||||||||||||||||
| Balance at start of period |
68 | 60 | 60 | 13% | 13% | |||||||||||||
| Share based payments/(exercises) |
9 | 9 | 7 | 0% | 29% | |||||||||||||
| Transfer of options/rights lapsed to retained earnings
|
(8)
|
|
(1)
|
|
|
(7)
|
|
|
large
|
|
14%
| |||||||
|
Total share option reserve
|
69
|
|
68
|
|
|
60
|
|
|
1%
|
|
15%
| |||||||
| Available-for-sale revaluation reserve5 |
||||||||||||||||||
| Balance at start of period |
138 | 257 | 160 | -46% | -14% | |||||||||||||
| Gain /(loss) recognised |
(9) | (105) | 132 | -91% | large | |||||||||||||
| Transferred to income statement
|
(28)
|
|
(14)
|
|
|
(35)
|
|
|
100%
|
|
-20%
| |||||||
|
Total available-for-sale revaluation reserve
|
101
|
|
138
|
|
|
257
|
|
|
-27%
|
|
-61%
| |||||||
| Cash flow hedge reserve6 |
||||||||||||||||||
| Balance at start of period |
269 | 325 | 169 | -17% | 59% | |||||||||||||
| Gain /(loss) recognised |
(40) | (53) | 164 | -25% | large | |||||||||||||
| Transferred to income statement
|
10
|
|
(3)
|
|
|
(8)
|
|
|
large
|
|
large
| |||||||
|
Total hedging reserve
|
239
|
|
269
|
|
|
325
|
|
|
-11%
|
|
-26%
| |||||||
| Transactions with non-controlling interests reserve |
||||||||||||||||||
| Balance at start of period |
(23) | (23) | (23) | 0% | 0% | |||||||||||||
| Transfer to the income statement
|
-
|
|
-
|
|
|
-
|
|
|
n/a
|
|
n/a
| |||||||
|
Total transactions with non-controlling interests reserve
|
(23)
|
|
(23)
|
|
|
(23)
|
|
|
0%
|
|
0%
| |||||||
|
Total reserves
|
377
|
|
1,571
|
|
|
2,188
|
|
|
-76%
|
|
-83%
| |||||||
| Retained earnings |
||||||||||||||||||
| Balance at start of period |
27,309 | 25,616 | 24,544 | 7% | 11% | |||||||||||||
| Profit attributable to shareholders of the Company |
2,738 | 3,987 | 3,506 | -31% | -22% | |||||||||||||
| Transfer of options/rights lapsed from share option reserve
|
8
|
|
1
|
|
|
7
|
|
|
large
|
|
14%
| |||||||
| Total available for appropriation |
30,055 | 29,604 | 28,057 | 2% | 7% | |||||||||||||
| Remeasurement gain/(loss) on defined benefit plans |
(3) | (5) | 1 | -40% | large | |||||||||||||
| Fair value gain/(loss) attributable to changes in own credit risk of financial liabilities designated at fair value |
8 | 28 | 9 | -71% | -11% | |||||||||||||
| Ordinary share dividend paid |
(2,711) | (2,328) | (2,578) | 16% | 5% | |||||||||||||
| Dividend income on Treasury shares held within the Group’s life insurance statutory funds |
12 | 10 | 12 | 20% | 0% | |||||||||||||
| Preference share dividend paid |
- | - | (1) | n/a | -100% | |||||||||||||
| Foreign exchange gains on preference shares bought back7
|
-
|
|
-
|
|
|
116
|
|
|
n/a
|
|
-100%
| |||||||
|
Retained earnings at end of period
|
27,361
|
|
27,309
|
|
|
25,616
|
|
|
0%
|
|
7%
| |||||||
| Share capital and reserves attributable to shareholders of the Company |
56,363 | 57,247 | 51,956 | -2% | 8% | |||||||||||||
| Non-controlling interests
|
101
|
|
106
|
|
|
95
|
|
|
-5%
|
|
6%
| |||||||
|
Total shareholders’ equity
|
56,464
|
|
57,353
|
|
|
52,051
|
|
|
-2%
|
|
8%
| |||||||
| 4. | The share option reserve arises on the grant of share options/deferred share rights/performance rights (“options and rights”) to selected employees under the ANZ Share Option Plan. Amounts are transferred from the share option reserve to other equity accounts when the options and rights are exercised and to retained earnings when lapsed or forfeited after vesting. Forfeited options and rights due to termination prior to vesting are credited to the income statement. |
| 5. | The available-for-sale revaluation reserve arises on the revaluation of available-for-sale financial assets. Where a revalued financial asset is sold or impaired, that portion of the reserve which relates to that financial asset is recognised in the income statement. |
| 6. | The cash flow hedge reserve represents hedging gains and losses recognised on the effective portion of cash flow hedges. The cumulative deferred gain or loss on the hedge is recognised in the income statement when the hedged transaction impacts profit or loss. |
| 7. | The Euro Trust Securities were bought back by ANZ for cash at face value and cancelled on 15 December 2014. The foreign exchange gain between the issue date and 15 December 2014 was recognised directly in retained earnings. |
124
NOTES TO CONDENSED CONSOLIDATED FINANCIAL STATEMENTS
| 17. | Changes in composition of the Group |
There were no material controlled entities incorporated, acquired, or disposed of during the half year ended 31 March 2016.
| 18. | Investments in Associates |
| Half Year
|
Movement
| |||||||||||
| Mar 16 $M |
Sep 15 $M |
Mar 15 $M |
Mar 16 v. Sep 15 |
Mar 16 v. Mar 15 | ||||||||
| Share of associates’ profit |
301 | 311 | 314 | -3% | -4% | |||||||
| Contributions to profit 1 | Contribution to Group profit after tax
|
Ownership interest held by Group
| ||||||||||||
| Associates | Half Year
|
As at
| ||||||||||||
| Mar 16 $M |
Sep 15 $M |
Mar 15 $M |
Mar 16 % |
Sep 15 % |
Mar 15 % | |||||||||
| P.T. Bank Pan Indonesia |
17 | 43 | 35 | 39 | 39 | 39 | ||||||||
| AMMB Holdings Berhad |
43 | 61 | 77 | 24 | 24 | 24 | ||||||||
| Shanghai Rural Commercial Bank |
137 | 112 | 106 | 20 | 20 | 20 | ||||||||
| Bank of Tianjin (up to 30 March 2016)2 |
86 | 75 | 80 | 12 | 14 | 14 | ||||||||
| Other associates |
18
|
20
|
16
|
n/a
|
n/a
|
n/a
| ||||||||
| Share of associates’ profit |
301
|
311
|
314
|
|||||||||||
| 1. | Contributions to profit reflect the IFRS equivalent results adjusted to align with the Group’s financial year end which may differ from the published results of these entities. Excludes gains or losses on disposal or valuation adjustments. |
| 2. | On 30 March 2016, the Bank of Tianjin (BoT) completed a capital raising and initial public offering (IPO) on the Hong Kong Stock Exchange. As a result, the Group’s equity interest reduced from 14% to 12% and the Group ceased equity accounting the investment due to losing the ability to appoint directors to the Board of BoT at this date. At 31 March 2016, the investment is classified as an available-for-sale asset on the balance sheet. |
| 19. | Related party disclosure |
There have been no significant changes to the arrangements with related parties.
| 20. | Contingent liabilities and contingent assets |
There are outstanding court proceedings, claims and possible claims for and against the Group. Where relevant, expert legal advice has been obtained and, in the light of such advice, provisions and/or disclosures as deemed appropriate have been made. In some instances we have not disclosed the estimated financial impact of the individual items either because it is not practicable to do so or because such disclosure may prejudice the interests of the Group. Refer to Note 43 of the 2015 ANZ Annual Financial Statements for a description of contingent liabilities and contingent assets as at 30 September 2015.
A summary of some of those contingent liabilities is set out below.
| – | Bank fees litigation |
Litigation funder IMF Bentham Limited commenced a class action against ANZ in 2010, followed by a second similar class action in March 2013. Together the class actions are claimed to be on behalf of more than 40,000 ANZ customers. The customers currently involved in these class actions are only part of ANZ’s customer base for credit cards and transaction accounts.
The applicants contended that the relevant exception fees (honour, dishonour and non-payment fees on transaction accounts and late payment and overlimit fees on credit cards) were unenforceable penalties (at law and in equity) and that various of the fees were also unenforceable under statutory provisions governing unconscionable conduct, unfair contract terms and unjust transactions.
In April 2015, the Full Federal Court delivered judgment in respect of appeals by both parties in the second class action. The Full Federal Court found in ANZ’s favour in respect of all fees subject to appeal (in relation to both the penalty and statutory claims).
IMF Bentham Limited appealed the Full Federal Court’s decision to the High Court of Australia in respect of credit card late payment fees. It did not appeal the findings in relation to the other fees.
The High Court appeal on late payment fees was heard on 4 and 5 February 2016. We are waiting for the Court’s decision.
The first class action is on hold.
In August 2014, IMF Bentham Limited commenced a separate class action against ANZ for late payment fees charged to ANZ customers in respect of commercial credit cards and other ANZ products (at this stage not specified). The action is expressed to apply to all relevant customers, rather than being limited to those who have signed up with IMF Bentham Limited. The action is at an early stage and has been put on hold.
125
NOTES TO CONDENSED CONSOLIDATED FINANCIAL STATEMENTS
In June 2013, litigation funder Litigation Lending Services (NZ) commenced a representative action against ANZ for certain fees charged to New Zealand customers since 2007. This action is currently on hold.
There is a risk that further claims could emerge in Australia, New Zealand or elsewhere.
| – | ASIC proceedings in relation to Bank Bill Swap Rate (BBSW) |
On 4 March 2016, ASIC initiated proceedings against ANZ seeking declarations and civil penalties for alleged market manipulation, unconscionable conduct, and alleged breaches by ANZ of certain statutory obligations as a financial services licensee. ASIC has subsequently initiated similar proceedings against another Australian bank. ASIC’s case against ANZ concerns transactions in the Australian interbank BBSW market in the period from March 2010 to May 2012. ANZ is defending the proceedings. The potential civil penalty or other financial impact is uncertain.
| – | Regulator investigations into foreign exchange trading |
Since 2014, each of ASIC and the Australian Competition and Consumer Commission (ACCC) have been investigating foreign exchange trading conduct of various banks including ANZ. ASIC’s and the ACCC’s investigations are ongoing and the range of potential outcomes include civil penalties and other actions under the relevant legislation.
| – | Security recovery actions |
Various claims have been made or are anticipated, arising from security recovery actions taken to resolve impaired assets over recent years. ANZ will defend these claims.
| 21. | Subsequent events since balance date |
There have been no subsequent events from 31 March 2016 to the date of this report.
126
DIRECTORS’ DECLARATION AND RESPONSIBILITY STATEMENT
Directors’ Declaration
The Directors of Australia and New Zealand Banking Group Limited declare that:
| 1. | in the Directors’ opinion the Condensed Consolidated Financial Statements and Notes to the Condensed Consolidated Financial Statements are in accordance with the Corporations Act 2001, including: |
| • | section 304, that they comply with the Australian Accounting Standards and any further requirements in the Corporations Regulations 2001; and |
| • | section 305, that they give a true and fair view of the financial position of the Group as at 31 March 2016 and of its performance for the half year ended on that date; and |
| 2. | in the Directors’ opinion as at the date of this declaration there are reasonable grounds to believe that the Company will be able to pay its debts as and when they become due and payable. |
Signed in accordance with a resolution of the Directors.
| /s/ David M Gonski, AC | /s/ Shayne C Elliott | |
| David M Gonski, AC Chairman |
Shayne C Elliott Director |
2 May 2016
Responsibility statement of the Directors in accordance with the Disclosure and Transparency Rule 4.2.10(3)(b) of the United Kingdom Financial Conduct Authority
The Directors of Australia and New Zealand Banking Group Limited confirm to the best of their knowledge that:
the Condensed Consolidated Financial Statements and Notes to the Condensed Consolidated Financial Statements for the half year ended 31 March 2016, Directors’ Report (including matters included by reference) and Directors’ Declaration as set out on pages 98 to 127 as well as the additional information on pages 139 to 147 includes a fair review of:
| (i) | an indication of the important events that have occurred during the first six months of the financial year, and their impact on the Condensed Consolidated Financial Statements; and |
| (ii) | a description of the principal risks and uncertainties for the remaining six months of the financial year. |
Signed in accordance with a resolution of the Directors.
| /s/ David M Gonski, AC | /s/ Shayne C Elliott | |
| David M Gonski, AC
Chairman |
Shayne C Elliott
Director |
2 May 2016
127
AUDITOR’S REVIEW REPORT AND INDEPENDENCE DECLARATION
Independent auditor’s review report to the members of Australia and New Zealand Banking Group Limited

Report on the condensed consolidated financial statements
We have reviewed the accompanying half year condensed consolidated financial statements of Australia and New Zealand Banking Group Limited (the “Company”) which comprises the Group’s condensed consolidated balance sheet as at 31 March 2016, condensed consolidated income statement and condensed consolidated statement of comprehensive income, condensed consolidated statement of changes in equity and condensed consolidated cash flow statement for the half year ended on that date, notes 1 to 21 comprising a basis of preparation and other explanatory notes, and the directors’ declaration. The Group comprised the Company and the entities it controlled at the half year’s end or from time to time during the half year.
Directors’ responsibility for the half year condensed consolidated financial statements
The directors of the Company are responsible for the preparation of the half year condensed consolidated financial statements that give a true and fair view in accordance with Australian Accounting Standards and the Corporations Act 2001 and for such internal controls as the directors determine is necessary to enable the preparation of the half year condensed consolidated financial statements that are free from material misstatement, whether due to fraud or error.
Auditors’ responsibility
Our responsibility is to express a conclusion on the half year condensed consolidated financial statements based on our review. We conducted our review in accordance with Auditing Standard on Review Engagements ASRE 2410 Review of a Financial Report Performed by the Independent Auditor of the Entity, in order to state whether, on the basis of the procedures described, we have become aware of any matter that makes us believe that the half year condensed consolidated financial statements are not in accordance with the Corporations Act 2001 including: giving a true and fair view of the Group’s financial position as at 31 March 2016 and its performance for the half year ended on that date; and complying with Australian Accounting Standard AASB 134 Interim Financial Reporting and the Corporations Regulations 2001. As auditor of Australia and New Zealand Banking Group Limited, ASRE 2410 requires that we comply with the ethical requirements relevant to the audit of the annual report.
A review of a half year condensed consolidated financial statements consists of making enquiries, primarily of persons responsible for financial and accounting matters, and applying analytical and other review procedures. A review is substantially less in scope than an audit conducted in accordance with Australian Auditing Standards and consequently does not enable us to obtain assurance that we would become aware of all significant matters that might be identified in an audit. Accordingly, we do not express an audit opinion.
Independence
In conducting our review, we have complied with the independence requirements of the Corporations Act 2001.
Conclusion
Based on our review, which is not an audit, we have not become aware of any matter that makes us believe that the half year condensed consolidated financial statements of Australia and New Zealand Banking Group Limited is not in accordance with the Corporations Act 2001, including:
| (a) | giving a true and fair view of the Group’s financial position as at 31 March 2016 and of its performance for the half year ended on that date; and |
| (b) | complying with Australian Accounting Standard AASB 134 Interim Financial Reporting and the Corporations Regulations 2001. |
| /s/ KPMG | /s/ Andrew Yates | |
| Melbourne, Australia
2 May 2016 |
Andrew Yates Partner |
Lead Auditor’s Independence Declaration under section 307C of the Corporations Act 2001
To: the directors of Australia and New Zealand Banking Group Limited
I declare that, to the best of my knowledge and belief, in relation to the review for the half year ended 31 March 2016, there have been:
| (i) | no contraventions of the auditor independence requirements as set out in the Corporations Act 2001 in relation to the review; and |
| (ii) | no contraventions of any applicable code of professional conduct in relation to the review. |
| /s/ KPMG | /s/ Andrew Yates | |
| Melbourne, Australia 2 May 2016 |
Andrew Yates Partner |
KPMG, an Australian partnership and a member firm of the KPMG network of independent member firms affiliated with KPMG International Cooperative (”KPMG International”), a Swiss entity.
Liability limited by a scheme approved under Professional Standards Legislation.
128
SUPPLEMENTARY INFORMATION
CONTENTS
Section 9 – Supplementary information
| Capital management |
| Average balance sheet and related interest |
| Full time equivalent staff |
| Funds management and insurance income reconciliation |
| Exchange rates |
| Derivative financial instruments |
| Principal risks and uncertainties |
| Definitions |
129
SUPPLEMENTARY INFORMATION
Capital management
ANZ provides information as required under APRA’s prudential standard APS 330: Public Disclosure. This information is located in the Regulatory Disclosures section of ANZ’s website: shareholder.anz.com/pages/regulatory-disclosure.
This information includes disclosures detailed in the following sections of the standard, Attachment A: Capital disclosure template, Attachment B: Main features of Capital instruments, Attachment E: Leverage ratio disclosure requirements and Attachment F: Liquidity Coverage Ratio disclosure template.
| As at | Movement | |||||||||||||||||
| Qualifying Capital | Mar 16 $M |
Sep 15 $M |
Mar 15 $M |
Mar 16 v. Sep 15 |
Mar 16 v. Mar 15 | |||||||||||||
| Tier 1 | ||||||||||||||||||
| Shareholders’ equity and non-controlling interests | 56,464 | 57,353 | 52,051 | -2% | 8% | |||||||||||||
| Prudential adjustments to shareholders’ equity | Table 1 | (584) | (387) | (519) | 51% | 13% | ||||||||||||
| Gross Common Equity Tier 1 capital | 55,880 | 56,966 | 51,532 | -2% | 8% | |||||||||||||
| Deductions | Table 2 | (17,778) | (18,440) | (17,796) | -4% | 0% | ||||||||||||
| Common Equity Tier 1 capital | 38,102 | 38,526 | 33,736 | -1% | 13% | |||||||||||||
| Additional Tier 1 capital | Table 3 | 6,960 | 6,958 | 7,352 | 0% | -5% | ||||||||||||
| Tier 1 capital | 45,062 | 45,484 | 41,088 | -1% | 10% | |||||||||||||
| Tier 2 capital | Table 4 | 8,076 | 7,951 | 7,716 | 2% | 5% | ||||||||||||
| Total qualifying capital | 53,138 | 53,435 | 48,804 | -1% | 9% | |||||||||||||
| Capital adequacy ratios | ||||||||||||||||||
| Common Equity Tier 1 | 9.8% | 9.6% | 8.7% | |||||||||||||||
| Tier 1 | 11.6% | 11.3% | 10.6% | |||||||||||||||
| Tier 2 | 2.1% | 2.0% | 2.0% | |||||||||||||||
| Total | 13.7% | 13.3% | 12.6% | |||||||||||||||
| Risk weighted assets | Table 5 | 388,335 | 401,937 | 386,863 | -3% | 0% | ||||||||||||
130
SUPPLEMENTARY INFORMATION
Capital management, cont’d
| As at | Movement | |||||||||||||||||
| Mar 16 $M |
Sep 15 $M |
Mar 15 $M |
Mar 16 v. Sep 15 |
Mar 16 v. Mar 15 | ||||||||||||||
| Table 1: Prudential adjustments to shareholders’ equity | ||||||||||||||||||
| Treasury shares attributable to ANZ Wealth policy holders | 254 | 242 | 287 | 5% | -11% | |||||||||||||
| Accumulated retained profits and reserves of insurance and funds management entities | (931) | (791) | (951) | 18% | -2% | |||||||||||||
| Deferred fee revenue including fees deferred as part of loan yields | 290 | 380 | 397 | -24% | -27% | |||||||||||||
| Available-for-sale reserve attributable to deconsolidated subsidiaries | (98) | (113) | (150) | -13% | -35% | |||||||||||||
| Other | (99) | (105) | (102) | -6% | -3% | |||||||||||||
| Total | (584) | (387) | (519) | 51% | 13% | |||||||||||||
| Table 2: Deductions from Common Equity Tier 1 capital | ||||||||||||||||||
| Unamortised goodwill & other intangibles (excluding ANZ Wealth Australia and New Zealand) | (3,767) | (4,109) | (4,369) | -8% | -14% | |||||||||||||
| Intangible component of investments in ANZ Wealth Australia and New Zealand | (2,091) | (2,093) | (2,117) | 0% | -1% | |||||||||||||
| Capitalised software | (2,190) | (2,832) | (2,631) | -23% | -17% | |||||||||||||
| Capitalised expenses including loan and lease origination fees | (1,078) | (1,320) | (1,197) | -18% | -10% | |||||||||||||
| Applicable deferred net tax assets | (793) | (694) | (610) | 14% | 30% | |||||||||||||
| Expected losses in excess of eligible provisions | Table 8 | (600) | (479) | (374) | 25% | 60% | ||||||||||||
| Investment in other insurance and funds management subsidiaries | (297) | (297) | (401) | 0% | -26% | |||||||||||||
| Investment in ANZ Wealth Australia and New Zealand | (1,749) | (1,349) | (990) | 30% | 77% | |||||||||||||
| Investment in banking associates and minority interests | (4,708) | (4,734) | (4,499) | -1% | 5% | |||||||||||||
| Other deductions | (505) | (533) | (608) | -5% | -17% | |||||||||||||
| Total | (17,778) | (18,440) | (17,796) | -4% | 0% | |||||||||||||
| Table 3: Additional Tier 1 capital | ||||||||||||||||||
| Convertible Preference Shares | ||||||||||||||||||
| ANZ CPS2 |
1,969 | 1,969 | 1,969 | 0% | 0% | |||||||||||||
| ANZ CPS3 |
1,338 | 1,336 | 1,335 | 0% | 0% | |||||||||||||
| ANZ Capital Notes 1 | 1,113 | 1,112 | 1,110 | 0% | 0% | |||||||||||||
| ANZ Capital Notes 2 | 1,600 | 1,598 | 1,597 | 0% | 0% | |||||||||||||
| ANZ Capital Notes 3 | 961 | 959 | 958 | 0% | 0% | |||||||||||||
| ANZ Bank NZ Capital Notes | 446 | 449 | 484 | -1% | -8% | |||||||||||||
| Regulatory adjustments and deductions | (467) | (465) | (101) | 1% | large | |||||||||||||
| Total | 6,960 | 6,958 | 7,352 | 0% | -5% | |||||||||||||
| Table 4: Tier 2 capital | ||||||||||||||||||
| General reserve for impairment of financial assets | 255 | 252 | 249 | 1% | 2% | |||||||||||||
| Perpetual subordinated notes | 1,145 | 1,188 | 1,211 | -4% | -5% | |||||||||||||
| Subordinated debt | 8,985 | 8,398 | 7,799 | 7% | 15% | |||||||||||||
| Regulatory adjustments and deductions | (660) | (717) | (336) | -8% | 96% | |||||||||||||
| Transitional adjustments | (1,649) | (1,170) | (1,207) | 41% | 37% | |||||||||||||
| Total | 8,076 | 7,951 | 7,716 | 2% | 5% | |||||||||||||
131
SUPPLEMENTARY INFORMATION
Capital management, cont’d
| As at | Movement | |||||||||||||||||
| Mar 16 $M |
Sep 15 $M |
Mar 15 $M |
Mar 16 v. Sep 15 |
Mar 16 v. Mar 15 | ||||||||||||||
| Table 5: Risk weighted assets | ||||||||||||||||||
| On balance sheet | 235,875 | 245,542 | 241,807 | -4% | -2% | |||||||||||||
| Commitments | 62,223 | 61,965 | 56,683 | 0% | 10% | |||||||||||||
| Contingents | 14,489 | 15,929 | 16,212 | -9% | -11% | |||||||||||||
| Derivatives | 21,721 | 26,315 | 24,995 | -17% | -13% | |||||||||||||
| Total credit risk | Table 6 | 334,308 | 349,751 | 339,697 | -4% | -2% | ||||||||||||
| Market risk - Traded | 6,059 | 6,868 | 6,042 | -12% | 0% | |||||||||||||
| Market risk - IRRBB | 10,280 | 7,433 | 7,690 | 38% | 34% | |||||||||||||
| Operational risk | 37,688 | 37,885 | 33,434 | -1% | 13% | |||||||||||||
| Total risk weighted assets | 388,335 | 401,937 | 386,863 | -3% | 0% | |||||||||||||
| As at | Movement | |||||||||||||||||
| Mar 16 $M |
Sep 15 $M |
Mar 15 $M |
Mar 16 v. Sep 15 |
Mar 16 v. Mar 15 | ||||||||||||||
| Table 6: Credit risk weighted assets by Basel asset class | ||||||||||||||||||
| Subject to Advanced IRB approach | ||||||||||||||||||
| Corporate | 139,643 | 150,165 | 140,451 | -7% | -1% | |||||||||||||
| Sovereign | 6,185 | 6,664 | 5,385 | -7% | 15% | |||||||||||||
| Bank | 15,061 | 17,445 | 22,078 | -14% | -32% | |||||||||||||
| Residential mortgage | 57,218 | 54,996 | 53,501 | 4% | 7% | |||||||||||||
| Qualifying revolving retail (credit cards) | 7,744 | 7,546 | 7,775 | 3% | 0% | |||||||||||||
| Other retail | 30,681 | 32,990 | 31,664 | -7% | -3% | |||||||||||||
| Credit risk weighted assets subject to Advanced IRB approach | 256,532 | 269,806 | 260,854 | -5% | -2% | |||||||||||||
| Credit risk specialised lending exposures subject to slotting criteria | 35,066 | 32,240 | 31,442 | 9% | 12% | |||||||||||||
| Subject to Standardised approach | ||||||||||||||||||
| Corporate | 22,941 | 26,217 | 27,033 | -12% | -15% | |||||||||||||
| Residential mortgage | 2,616 | 2,882 | 2,603 | -9% | 0% | |||||||||||||
| Other retail (includes credit cards) | 3,550 | 3,625 | 3,271 | -2% | 9% | |||||||||||||
| Credit risk weighted assets subject to Standardised approach | 29,107 | 32,724 | 32,907 | -11% | -12% | |||||||||||||
| Credit Valuation Adjustment and Qualifying Central Counterparties | 8,355 | 10,170 | 9,630 | -18% | -13% | |||||||||||||
| Credit risk weighted assets relating to securitisation exposures | 1,194 | 1,156 | 1,067 | 3% | 12% | |||||||||||||
| Other assets | 4,054 | 3,655 | 3,797 | 11% | 7% | |||||||||||||
| Total credit risk weighted assets | 334,308 | 349,751 | 339,697 | -4% | -2% | |||||||||||||
132
SUPPLEMENTARY INFORMATION
Capital management, cont’d
| Collective Provision and Individual
|
Basel Expected Loss1
| |||||||||||||
| Table 7: Total provision for credit impairment and expected loss by division |
Mar 16 $M |
Sep 15 $M |
Mar 15 $M |
Mar 16 $M |
Sep 15 $M |
Mar 15 $M | ||||||||
| Australia | 1,746 | 1,828 | 1,796 | 2,600 | 2,635 | 2,563 | ||||||||
| Institutional | 1,681 | 1,480 | 1,488 | 1,410 | 1,299 | 1,452 | ||||||||
| New Zealand | 448 | 476 | 536 | 712 | 718 | 779 | ||||||||
| Asia Retail & Pacific | 210 | 217 | 193 | 5 | 1 | 4 | ||||||||
| Wealth | 12 | 13 | 12 | 13 | 12 | 12 | ||||||||
| TSO and Group Centre | 3 | 3 | 3 | - | - | - | ||||||||
| Total provision for credit impairment and expected loss | 4,100 | 4,017 | 4,028 | 4,740 | 4,665 | 4,810 | ||||||||
| 1. | Only applicable to Advanced Internal Ratings based portfolios. |
| As at
|
Movement | |||||||||||||
|
Mar 16 |
Sep 15 | Mar 15 | Mar 16 | March 16 | ||||||||||
| Table 8: APRA Expected loss in excess of eligible provisions | $M | $M | $M | v. Sep 15 | v. March 15 | |||||||||
| APRA Basel 3 expected loss: non-defaulted | 2,894 | 2,850 | 2,735 | 2% | 6% | |||||||||
| Less: Qualifying collective provision | ||||||||||||||
| Collective provision |
(2,862) | (2,956) | (2,914) | -3% | -2% | |||||||||
| Non-qualifying collective provision |
313 | 333 | 304 | -6% | 3% | |||||||||
| Standardised collective provision |
255 | 252 | 249 | 1% | 2% | |||||||||
| Non-defaulted excess included in deduction | 600 | 479 | 374 | 25% | 60% | |||||||||
| APRA Basel 3 expected loss: defaulted | 1,846 | 1,815 | 2,075 | 2% | -11% | |||||||||
| Less: Qualifying individual provision | ||||||||||||||
| Individual provision |
(1,238) | (1,061) | (1,114) | 17% | 11% | |||||||||
| Additional individual provision for partial write offs |
(528) | (633) | (859) | -17% | -39% | |||||||||
| Standardised individual provision |
171 | 107 | 103 | 60% | 66% | |||||||||
| Collective provision on advanced defaulted |
(265) | (286) | (271) | -7% | -2% | |||||||||
| (14) | (58) | (66) | -76% | -79% | ||||||||||
| Shortfall in expected loss not included in deduction | 14 | 58 | 66 | -76% | -79% | |||||||||
| Defaulted excess included in deduction | - | - | - | n/a | n/a | |||||||||
| Gross deduction | 600 | 479 | 374 | 25% | 60% | |||||||||
Table 9: APRA Basel 3 Common Equity Tier 1
| Half Year | ||
|
Mar 16 vs Sep 15
| ||
| APRA Basel 3 Common Equity Tier 1 | ||
| Adjusted pro-forma Cash profit1 | +87bps | |
| Risk weighted assets | ||
| Portfolio growth and mix |
+5bp | |
| Risk migration and expected losses in excess of eligible provisions |
-3bps | |
| Non-credit risk |
-1bps | |
| Capital retention in insurance businesses and associates1 | -10bps | |
| Capitalised software and intangibles1 | -2bps | |
| Organic capital generation | +76bps | |
| Ordinary share dividends (net of dividend reinvestment plan) | -62bps | |
| Other | +8bps | |
| Total Common Equity Tier 1 movement | +22bps | |
| APRA Basel 3 Common Equity Tier 1 ratio | 9.8% | |
| 1. | Excludes the impact from the software capitalisation changes and impact from the Asian minority investment adjustments which have gone through Cash Profit as they are neutral on CET1. |
133
SUPPLEMENTARY INFORMATION
Average balance sheet and related interest1
| Half Year Mar 16 | Half Year Sep 15 | Half Year Mar 15 | ||||||||||||||||||||
| Avg bal $M |
Int $M |
Rate % |
Avg bal $M |
Int $M |
Rate % |
Avg bal $M |
Int $M |
Rate % | ||||||||||||||
| Loans and advances2 |
||||||||||||||||||||||
| Overdrafts and credit cards | 20,539 | 1,062 | 10.3% | 22,203 | 1,072 | 9.6% | 20,901 | 1,060 | 10.2% | |||||||||||||
| Commercial bills outstanding | 13,237 | 112 | 1.7% | 13,781 | 135 | 2.0% | 14,168 | 137 | 1.9% | |||||||||||||
| Term loans - housing | 308,808 | 7,203 | 4.7% | 292,206 | 6,934 | 4.7% | 279,757 | 7,023 | 5.0% | |||||||||||||
| Term loans - non-housing | 221,728 | 4,890 | 4.4% | 224,208 | 5,108 | 4.5% | 219,047 | 5,243 | 4.8% | |||||||||||||
| Lease financing | 8,365 | 279 | 6.7% | 9,374 | 343 | 7.3% | 9,438 | 365 | 7.8% | |||||||||||||
| Other loans and advances | 2,239 | 26 | 2.3% | 5,837 | 51 | 1.7% | 2,555 | 45 | 3.5% | |||||||||||||
| Individual provision for credit impairment | (988) | - | n/a | (1,104) | - | n/a | (1,166) | - | n/a | |||||||||||||
| 573,928 | 13,572 | 4.7% | 566,505 | 13,643 | 4.8% | 544,700 | 13,873 | 5.1% | ||||||||||||||
| Other interest earning assets | ||||||||||||||||||||||
| Cash | 51,054 | 247 | 1.0% | 46,484 | 209 | 0.9% | 45,498 | 276 | 1.2% | |||||||||||||
| Settlement Balances owed to ANZ | 18,521 | 34 | 0.4% | 16,562 | 46 | 0.6% | 15,268 | 21 | 0.3% | |||||||||||||
| Collateral Paid | 10,737 | 26 | 0.5% | 9,033 | 29 | 0.6% | 7,548 | 31 | 0.8% | |||||||||||||
| Trading and available-for-sale assets | 98,884 | 1,134 | 2.3% | 91,971 | 1,166 | 2.5% | 87,995 | 1,187 | 2.7% | |||||||||||||
| Regulatory Deposits | 1,259 | 7 | 1.1% | 1,173 | 4 | 0.7% | 1,183 | 4 | 0.7% | |||||||||||||
| Other assets | 8 | 70 | n/a | 11 | 35 | n/a | 11 | 2 | n/a | |||||||||||||
| 180,463 | 1,518 | 1.7% | 165,234 | 1,489 | 1.8% | 157,503 | 1,521 | 1.9% | ||||||||||||||
| Total interest earning assets3 | 754,391 | 15,090 | 4.0% | 731,739 | 15,132 | 4.1% | 702,203 | 15,394 | 4.4% | |||||||||||||
| Non-interest earning assets | ||||||||||||||||||||||
| Derivatives | 79,804 | 71,572 | 65,114 | |||||||||||||||||||
| Premises and equipment | 2,222 | 2,182 | 2,180 | |||||||||||||||||||
| Insurance assets | 34,846 | 36,380 | 34,092 | |||||||||||||||||||
| Other assets | 32,399 | 32,683 | 29,559 | |||||||||||||||||||
| Collective provision for credit impairment | (2,914) | (2,951) | (2,795) | |||||||||||||||||||
| 146,357 | 139,866 | 128,150 | ||||||||||||||||||||
| Total average assets | 900,748 | 871,605 | 830,353 | |||||||||||||||||||
| Interest bearing deposits and other borrowings | ||||||||||||||||||||||
| Certificates of deposit | 63,722 | 781 | 2.5% | 64,616 | 806 | 2.5% | 60,740 | 884 | 2.9% | |||||||||||||
| Term deposits | 197,297 | 1,942 | 2.0% | 192,790 | 1,951 | 2.0% | 196,891 | 2,259 | 2.3% | |||||||||||||
| On demand and short term deposits | 227,027 | 2,193 | 1.9% | 215,001 | 2,216 | 2.1% | 199,826 | 2,358 | 2.4% | |||||||||||||
| Deposits from banks | 51,307 | 327 | 1.3% | 53,188 | 327 | 1.2% | 54,063 | 356 | 1.3% | |||||||||||||
| Commercial paper | 25,783 | 288 | 2.2% | 21,322 | 253 | 2.4% | 21,135 | 262 | 2.5% | |||||||||||||
| Securities sold under agreements to repurchase | 1,191 | 4 | 0.7% | 1,064 | 7 | 1.3% | 675 | 5 | 1.5% | |||||||||||||
| Borrowing corporations’ debt | 1,576 | 33 | 4.2% | 1,535 | 36 | 4.7% | 1,474 | 34 | 4.6% | |||||||||||||
| 567,903 | 5,568 | 2.0% | 549,516 | 5,596 | 2.0% | 534,804 | 6,158 | 2.3% | ||||||||||||||
| Other interest bearing liabilities | ||||||||||||||||||||||
| Settlement Balances owed by ANZ | 4,478 | 15 | 0.7% | 3,647 | 17 | 0.9% | 3,134 | 18 | 1.2% | |||||||||||||
| Collateral Received | 5,806 | 14 | 0.5% | 5,581 | 20 | 0.7% | 5,339 | 9 | 0.3% | |||||||||||||
| Debt issuances & subordinated debt | 101,507 | 1,819 | 3.6% | 95,591 | 1,847 | 3.9% | 95,815 | 1,901 | 4.0% | |||||||||||||
| Other liabilities | 5,109 | 106 | 4.1% | 9,782 | 174 | 3.5% | 6,606 | 170 | 5.2% | |||||||||||||
| 116,900 | 1,954 | 3.3% | 114,601 | 2,058 | 3.6% | 110,894 | 2,098 | 3.8% | ||||||||||||||
| Total interest bearing liabilities | 684,803 | 7,522 | 2.2% | 664,117 | 7,654 | 2.3% | 645,698 | 8,256 | 2.6% | |||||||||||||
| Non-interest bearing liabilities | ||||||||||||||||||||||
| Deposits | 19,332 | 18,193 | 17,001 | |||||||||||||||||||
| Derivatives | 85,666 | 78,374 | 64,382 | |||||||||||||||||||
| Insurance Liabilities | 35,456 | 36,654 | 34,974 | |||||||||||||||||||
| External unit holder liabilities (life insurance funds) | 3,291 | 3,491 | 3,181 | |||||||||||||||||||
| Other liabilities | 14,735 | 17,811 | 14,620 | |||||||||||||||||||
| 158,480 | 154,523 | 134,158 | ||||||||||||||||||||
| Total average liabilities | 843,283 | 818,640 | 779,856 | |||||||||||||||||||
| 1. | Averages used are predominantly daily averages. |
| 2. | Loans & advances as at 30 September 2015 include Esanda Dealer Finance assets divested to Macquarie Group Limited in the March 2016 half. |
| 3. | During the period individual provisions for credit impairment were moved from non-interest earning assets to interest earning assets to more accurately reflect the yield on impaired loans and advances. Comparatives have been restated but there was no impact on the net interest margin ratios. |
134
SUPPLEMENTARY INFORMATION
Average balance sheet and related interest1 (cont’d)
| Half Year Mar 16 | Half Year Sep 15 | Half Year Mar 15 | ||||||||||||||||||||
| Avg bal $M |
Int $M |
Rate % |
Avg bal $M |
Int $M |
Rate % |
Avg bal $M |
Int $M |
Rate % | ||||||||||||||
| Loans and advances2 | ||||||||||||||||||||||
| Australia |
387,035 | 9,429 | 4.9% | 375,986 | 9,257 | 4.9% | 357,608 | 9,480 | 5.3% | |||||||||||||
| Asia Pacific, Europe & America |
79,132 | 1,296 | 3.3% | 86,886 | 1,317 | 3.0% | 86,172 | 1,238 | 2.9% | |||||||||||||
| New Zealand |
107,761 | 2,847 | 5.3% | 103,633 | 3,069 | 5.9% | 100,920 | 3,155 | 6.3% | |||||||||||||
| 573,928 | 13,572 | 4.7% | 566,505 | 13,643 | 4.8% | 544,700 | 13,873 | 5.1% | ||||||||||||||
| Trading and available-for-sale assets | ||||||||||||||||||||||
| Australia |
56,200 | 661 | 2.4% | 53,152 | 720 | 2.7% | 50,278 | 725 | 2.9% | |||||||||||||
| Asia Pacific, Europe & America |
29,199 | 233 | 1.6% | 26,392 | 211 | 1.6% | 25,134 | 212 | 1.7% | |||||||||||||
| New Zealand |
13,485 | 240 | 3.6% | 12,427 | 235 | 3.8% | 12,583 | 250 | 4.0% | |||||||||||||
| 98,884 | 1,134 | 2.3% | 91,971 | 1,166 | 2.5% | 87,995 | 1,187 | 2.7% | ||||||||||||||
| Total interest earning assets3 | ||||||||||||||||||||||
| Australia |
466,032 | 10,292 | 4.4% | 450,919 | 10,143 | 4.5% | 427,470 | 10,422 | 4.9% | |||||||||||||
| Asia Pacific, Europe & America |
162,505 | 1,612 | 2.0% | 160,210 | 1,584 | 2.0% | 157,469 | 1,512 | 1.9% | |||||||||||||
| New Zealand |
125,854 | 3,186 | 5.1% | 120,610 | 3,405 | 5.6% | 117,264 | 3,460 | 5.9% | |||||||||||||
| 754,391 | 15,090 | 4.0% | 731,739 | 15,132 | 4.1% | 702,203 | 15,394 | 4.4% | ||||||||||||||
| Total average assets | ||||||||||||||||||||||
| Australia |
569,243 | 551,794 | 524,435 | |||||||||||||||||||
| Asia Pacific, Europe & America |
188,923 | 183,650 | 176,849 | |||||||||||||||||||
| New Zealand |
142,582 | 136,161 | 129,069 | |||||||||||||||||||
| Total average assets | 900,748 | 871,605 | 830,353 | |||||||||||||||||||
| % of total average assets attributable to overseas activities | 36.8% | 36.7% | 36.8% | |||||||||||||||||||
| Interest bearing deposits and other borrowings | ||||||||||||||||||||||
| Australia |
333,740 | 3,789 | 2.3% | 320,247 | 3,696 | 2.3% | 311,454 | 4,243 | 2.7% | |||||||||||||
| Asia Pacific, Europe & America |
151,696 | 547 | 0.7% | 151,508 | 507 | 0.7% | 146,851 | 488 | 0.7% | |||||||||||||
| New Zealand |
82,467 | 1,232 | 3.0% | 77,761 | 1,393 | 3.6% | 76,499 | 1,427 | 3.7% | |||||||||||||
| 567,903 | 5,568 | 2.0% | 549,516 | 5,596 | 2.0% | 534,804 | 6,158 | 2.3% | ||||||||||||||
| Total interest bearing liabilities3 | ||||||||||||||||||||||
| Australia |
409,816 | 5,138 | 2.5% | 396,971 | 5,111 | 2.6% | 387,583 | 5,706 | 3.0% | |||||||||||||
| Asia Pacific, Europe & America |
172,261 | 714 | 0.8% | 168,686 | 628 | 0.7% | 163,031 | 604 | 0.7% | |||||||||||||
| New Zealand |
102,726 | 1,670 | 3.3% | 98,460 | 1,915 | 3.9% | 95,084 | 1,946 | 4.1% | |||||||||||||
| 684,803 | 7,522 | 2.2% | 664,117 | 7,654 | 2.3% | 645,698 | 8,256 | 2.6% | ||||||||||||||
| Total average liabilities | ||||||||||||||||||||||
| Australia |
526,500 | 513,643 | 491,356 | |||||||||||||||||||
| Asia Pacific, Europe & America |
193,380 | 187,679 | 179,210 | |||||||||||||||||||
| New Zealand |
123,403 | 117,318 | 109,290 | |||||||||||||||||||
| 843,283 | 818,640 | 779,856 | ||||||||||||||||||||
| % of total average liabilities attributable to overseas activities |
37.6% | 37.3% | 37.0% | |||||||||||||||||||
| Total average shareholder’s equity | ||||||||||||||||||||||
| Ordinary share capital, reserves and retained earnings4 | 57,465 | 52,965 | 50,131 | |||||||||||||||||||
| Preference share capital | - | - | 366 | |||||||||||||||||||
| 57,465 | 52,965 | 50,497 | ||||||||||||||||||||
|
Total average liabilities and shareholder’s equity |
900,748 | 871,605 | 830,353 | |||||||||||||||||||
| 1. | Averages used are predominantly daily averages. |
| 2. | Loans & advances as at 30 September 2015 include Esanda Dealer Finance assets divested to Macquarie Group Limited in the March 2016 half. |
| 3. | Intra-group interest earning assets and interest income and Intra-group interest earning liabilities and interest expense have been eliminated. |
| 4. | Average shareholders’ equity at 31 March 2016 includes $254 million of Wealth shares that are eliminated from the statutory shareholders’ equity balance (Sep 15: $242 million; Mar 15: $287 million). |
135
SUPPLEMENTARY INFORMATION
Average balance sheet and related interest (cont’d)
| Half Year | ||||||
| Mar 16 % |
Sep 15 % |
Mar 15 % | ||||
| Gross earnings rate1 | ||||||
| Australia | 4.51 | 4.58 | 4.98 | |||
| Asia Pacific, Europe & America | 1.91 | 1.84 | 1.82 | |||
| New Zealand | 5.06 | 5.63 | 5.92 | |||
| Group | 4.00 | 4.12 | 4.39 | |||
| Interest spread and net interest margin may be analysed as follows: | ||||||
| Half Year | ||||||
| Mar 16 % |
Sep 15 % |
Mar 15 % | ||||
| Australia1 | ||||||
| Net interest spread | 1.99 | 2.01 | 2.03 | |||
| Interest attributable to net non-interest bearing items | 0.28 | 0.29 | 0.26 | |||
| Net interest margin - Australia | 2.27 | 2.30 | 2.29 | |||
| Asia Pacific, Europe & America1 | ||||||
| Net interest spread | 1.08 | 1.09 | 1.07 | |||
| Interest attributable to net non-interest bearing items | 0.03 | 0.03 | 0.03 | |||
| Net interest margin - Asia Pacific, Europe & America | 1.11 | 1.12 | 1.10 | |||
| New Zealand1 | ||||||
| Net interest spread | 1.81 | 1.81 | 1.82 | |||
| Interest attributable to net non-interest bearing items | 0.38 | 0.41 | 0.45 | |||
| Net interest margin - New Zealand | 2.19 | 2.22 | 2.27 | |||
| Group | ||||||
| Net interest spread | 1.80 | 1.82 | 1.82 | |||
| Interest attributable to net non-interest bearing items | 0.21 | 0.22 | 0.22 | |||
| Net interest margin | 2.01 | 2.04 | 2.04 | |||
| Net interest margin (excluding Markets) | 2.52 | 2.51 | 2.51 | |||
| 1. | Geographic gross earnings rate, net interest spread and net interest margin are calculated gross of intra group items (Intra-group interest earning assets and associated interest income and intra-group interest bearing liabilities and associated interest expense). |
136
SUPPLEMENTARY INFORMATION
Full Time Equivalent Staff
At 31 March 2016, ANZ employed 48,896 people worldwide (Sep 15: 50,152; Mar 15: 51,243) on a full-time equivalent basis (“FTEs”).
Division
| As at | Movement | |||||||||||
|
Mar 16 |
Mar 16 | |||||||||||
| Mar 16 | Sep 15 | Mar 15 | v Sep 15 | v Mar 15 | ||||||||
| Australia | 8,791 | 8,766 | 9,018 | 0% | -3% | |||||||
| Institutional | 4,056 | 4,231 | 4,319 | -4% | -6% | |||||||
| New Zealand | 5,022 | 5,074 | 5,096 | -1% | -1% | |||||||
| Wealth | 2,385 | 2,481 | 2,530 | -4% | -6% | |||||||
| Asia Retail & Pacific | 3,183 | 3,313 | 3,437 | -4% | -7% | |||||||
| TSO and Group Centre | 25,459 | 26,287 | 26,843 | -3% | -5% | |||||||
| Total | 48,896 | 50,152 | 51,243 | -3% | -5% | |||||||
| Average FTE | 49,777 | 51,146 | 50,759 | -3% | -2% | |||||||
| Geography | As at | Movement | ||||||||||
|
Mar 16 |
Mar 16 | |||||||||||
| Mar 16 | Sep 15 | Mar 15 | v Sep 15 | v Mar 15 | ||||||||
| Australia | 20,808 | 21,138 | 22,096 | -2% | -6% | |||||||
| Asia Pacific, Europe & America | 20,025 | 20,910 | 20,910 | -4% | -4% | |||||||
| New Zealand | 8,063 | 8,104 | 8,237 | -1% | -2% | |||||||
| Total | 48,896 | 50,152 | 51,243 | -3% | -5% | |||||||
Funds Management and Insurance Income Reconciliation
| Half Year | Movement | |||||||||||||
|
Reference |
Mar 16 | Sep 15 | Mar 15 | Mar 16 | Mar 16 | |||||||||
| Page | $M | $M | $M | v. Sep 15 | v. Mar 15 | |||||||||
| Net funds management and insurance income - statutory basis | 95 | 857 | 795 | 1,020 | 8% | -16% | ||||||||
| Adjustments between cash and statutory profit | ||||||||||||||
| Treasury shares adjustment | 95 | (34) | (107) | 86 | -68% | large | ||||||||
| Policyholders tax gross up | 95 | (32) | 91 | (277) | large | -88% | ||||||||
| Revaluation of policy liabilities | 95 | (20) | (7) | (97) | large | -79% | ||||||||
| Net funds management and insurance income - cash basis | 95 | 771 | 772 | 732 | 0% | 5% | ||||||||
| Wealth - Net funds management and insurance income | 74 | 727 | 730 | 699 | 0% | 4% | ||||||||
| Australia - Funds management and insurance income | 19 | 19 | 20 | 0% | -5% | |||||||||
| Asia Retail & Pacific - Funds management and insurance income | 55 | 50 | 55 | 10% | 0% | |||||||||
| New Zealand - Funds management and insurance income | 42 | 44 | 42 | -5% | 0% | |||||||||
| Inter-divisional eliminations | (72) | (71) | (84) | 1% | -14% | |||||||||
| Net funds management and insurance income - cash basis | 26 | 771 | 772 | 732 | 0% | 5% | ||||||||
137
SUPPLEMENTARY INFORMATION
Exchange rates
Major exchange rates used in the translation of foreign subsidiaries, branches, investments in associates and issued debt are as follows:
| Balance Sheet | Profit & Loss Average | |||||||||||||||||||||||||
| As at | Half Year | |||||||||||||||||||||||||
| Mar 16 | Sep 15 | Mar 15 | Mar 16 | Sep 15 | Mar 15 | |||||||||||||||||||||
| Chinese Renminbi | 4.9471 | 4.4573 | 4.7365 | 4.6622 | 4.6831 | 5.0786 | ||||||||||||||||||||
| Euro | 0.6760 | 0.6229 | 0.7057 | 0.6558 | 0.6767 | 0.6909 | ||||||||||||||||||||
| Pound Sterling | 0.5335 | 0.4625 | 0.5163 | 0.4886 | 0.4853 | 0.5295 | ||||||||||||||||||||
| Indian Rupee | 50.741 | 46.142 | 47.759 | 48.101 | 48.141 | 50.911 | ||||||||||||||||||||
| Indonesian Rupiah | 10,164 | 10,281 | 9,987 | 9,835 | 10,127 | 10,271 | ||||||||||||||||||||
| Japanese Yen | 85.951 | 84.072 | 91.715 | 85.328 | 91.330 | 95.713 | ||||||||||||||||||||
| Malaysian Ringgit | 3.0015 | 3.1176 | 2.8372 | 3.0565 | 2.8898 | 2.8623 | ||||||||||||||||||||
| New Taiwan Dollar | 24.640 | 23.066 | 23.887 | 23.708 | 23.511 | 25.580 | ||||||||||||||||||||
| New Zealand Dollar | 1.1093 | 1.1003 | 1.0188 | 1.0834 | 1.0878 | 1.0691 | ||||||||||||||||||||
| Papua New Guinean Kina | 2.3724 | 2.0123 | 2.0439 | 2.1565 | 2.0649 | 2.1233 | ||||||||||||||||||||
| United States Dollar | 0.7651 | 0.7013 | 0.7634 | 0.7212 | 0.7480 | 0.8200 | ||||||||||||||||||||
Derivative financial instruments
Derivative financial instruments are contracts whose value is derived from one or more underlying variables or indices defined in the contract, require little or no initial net investment and are settled at a future date. Derivatives include contracts traded on registered exchanges and contracts agreed between counterparties. The use of derivatives and their sale to customers as risk management products is an integral part of the Group’s trading and sales activities. Derivatives are also used to manage the Group’s own exposure to fluctuations in foreign exchange and interest rates as part of its asset and liability management activities.
The following table provides an overview of the Group’s foreign exchange, interest rate, commodity and credit derivatives. They include all trading and balance sheet risk management contracts. The derivative instruments become favourable (assets) or unfavourable (liabilities) as a result of fluctuations in market rates relative to the terms of the derivative.
| Assets | Liabilities | Assets | Liabilities | Assets | Liabilities | |||||||||||
| As at
|
As at
|
As at
| ||||||||||||||
| Fair Values | Mar 16 $M |
Mar 16 $M |
Sep 15 $M |
Sep 15 $M |
Mar 15 $M |
Mar 15 $M | ||||||||||
| Foreign exchange contracts | ||||||||||||||||
| Spot and forward contracts |
17,145 | (16,911) | 15,208 | (13,964) | 11,972 | (10,515) | ||||||||||
| Swap agreements |
18,000 | (23,473) | 20,967 | (20,270) | 15,369 | (19,220) | ||||||||||
| Options purchased |
1,388 | - | 2,441 | - | 2,539 | - | ||||||||||
| Options sold |
- | (1,087) | - | (2,081) | - | (2,333) | ||||||||||
| 36,533 | (41,471) | 38,616 | (36,315) | 29,880 | (32,068) | |||||||||||
| Commodity contracts | ||||||||||||||||
| Derivative contracts |
2,424 | (1,950) | 2,750 | (2,207) | 2,232 | (1,668) | ||||||||||
| Interest rate contracts | ||||||||||||||||
| Forward rate agreements |
35 | (46) | 37 | (51) | 10 | (21) | ||||||||||
| Swap agreements |
48,490 | (46,127) | 42,967 | (40,747) | 39,878 | (37,062) | ||||||||||
| Futures contracts |
31 | (213) | 28 | (96) | 49 | (255) | ||||||||||
| Options purchased |
907 | - | 944 | - | 1,140 | - | ||||||||||
| Options sold |
- | (1,557) | - | (1,573) | - | (1,722) | ||||||||||
| 49,463 | (47,943) | 43,976 | (42,467) | 41,077 | (39,060) | |||||||||||
| Credit default swaps | ||||||||||||||||
| Structured credit derivatives purchased |
49 | - | 52 | - | 59 | - | ||||||||||
| Other credit derivatives purchased |
256 | (268) | 205 | (194) | 277 | (323) | ||||||||||
| Total credit derivatives purchased |
305 | (268) | 257 | (194) | 336 | (323) | ||||||||||
| Structured credit derivatives sold |
- | (62) | - | (67) | - | (77) | ||||||||||
| Other credit derivatives sold |
22 | (12) | 26 | (20) | 55 | (14) | ||||||||||
| Total credit derivatives sold |
22 | (74) | 26 | (87) | 55 | (91) | ||||||||||
| Total fair value | 88,747 | (91,706) | 85,625 | (81,270) | 73,580 | (73,210) | ||||||||||
138
SUPPLEMENTARY INFORMATION
Principal risks and uncertainties
| 1. | Introduction |
The Group’s activities are subject to risks that can adversely impact its business, operations and financial condition. The risks and uncertainties described below are not the only ones that the Group may face. Additional risks and uncertainties that the Group is unaware of, or that the Group currently deems to be immaterial, may also become important factors that affect it. If any of the listed or unlisted risks actually occur, the Group’s business, operations, financial condition, or reputation could be materially and adversely affected, with the result that the trading price of the Group’s equity or debt securities could decline, and investors could lose all or part of their investment.
| 2. | Changes in general business and economic conditions, including disruption in regional or global credit and capital markets, may adversely affect the Group’s business, operations and financial condition |
The Group’s financial performance is primarily influenced by the economic conditions and the level of business activity in the major countries and regions in which it operates or trades, i.e. Australia, New Zealand, Asia Pacific, Europe and the United States. The Group’s business, operations, and financial condition can be negatively affected by changes in economic and business conditions in these markets.
The economic and business conditions that prevail in the Group’s major operating and trading markets are affected by domestic and international economic events, political events and natural disasters, and by movements and events that occur in global financial markets.
For example, the global financial crisis saw a sudden and prolonged dislocation in credit and equity capital markets, a contraction in global economic activity and the emergence of many challenges for financial services institutions worldwide that still persist to some extent in many regions. Sovereign risk and its potential impact on financial institutions in Europe and globally subsequently emerged as a significant risk (see risk factor 5 “Sovereign risk may destabilise global financial markets adversely affecting all participants, including the Group”). The impact of the global financial crisis and its aftermath continue to affect regional and global economic activity, confidence and capital markets. Prudential authorities have implemented and continue to implement increased regulations to mitigate the risk of such events recurring, although there can be no assurance that such regulations will be effective.
Economic effects of the global financial crisis and European sovereign debt crisis have been widespread and far-reaching with unfavourable ongoing impacts on retail spending, personal and business credit growth, housing credit, and business and consumer confidence. While some of these economic factors have since improved, lasting impacts from the global financial crisis and the subsequent volatility in financial markets, the European sovereign debt crisis and the potential for escalation in geopolitical risks suggest ongoing vulnerability and potential adjustment of consumer and business behaviour.
Other current economic conditions impacting the Group and its customers include changes in the real estate markets in Australia and New Zealand (see risk factor 6 “Weakening of the real estate markets in Australia, New Zealand or other markets where the Group does business may adversely affect its business, operations and financial condition”) and a decline in natural resources demand and prices (see risk factor 20 “An increase in the failure of third parties to honour their commitments in connection with the Group’s trading, lending, derivatives and other activities may adversely affect its business, operations and financial condition”).
Should difficult economic conditions in the Group’s markets eventuate, asset values in the housing, commercial or rural property markets could decline, unemployment could rise and corporate and personal incomes could suffer. Also, deterioration in global markets, including equity, property, currency and other asset markets, could impact the Group’s customers and the security the Group holds against loans and other credit exposures, which may impact its ability to recover some loans and other credit exposures.
All or any of the negative economic and business impacts described above could cause a reduction in demand for the Group’s products and services and/or an increase in loan and other credit defaults and bad debts, which could adversely affect the Group’s business, operations, and financial condition.
The Group’s financial performance could also be adversely affected if it were unable to adapt cost structures, products, pricing or activities in response to a drop in demand or lower than expected revenues. Similarly, higher than expected costs (including credit and funding costs) could be incurred because of adverse changes in the economy, general business conditions or the operating environment in the countries in which it operates.
Geopolitical instability, such as threats of, potential for, or actual conflict, occurring around the world, such as the ongoing unrest and conflicts in the Ukraine, North Korea, Syria, Egypt, Afghanistan, Iraq and elsewhere, as well as the current high threat of terrorist activities, may also adversely affect global financial markets, general economic and business conditions and the Group’s ability to continue operating or trading in a country, which in turn may adversely affect the Group’s business, operations, and financial condition.
Natural and biological disasters such as, but not restricted to, cyclones, floods, droughts, earthquakes and pandemics, and the economic and financial market implications of such disasters on domestic and global conditions can adversely impact the Group’s ability to continue operating or trading in the country or countries directly or indirectly affected, which in turn may adversely affect the Group’s business, operations and financial condition. For more risks in relation to natural and biological disasters, refer to risk factor 22 “The Group may be exposed to the impact of future climate change, geological events, plant and animal diseases, and other extrinsic events which may adversely affect its business, operations and financial condition”.
Other economic and financial factors or events that may adversely affect the Group’s performance, and give rise to operational and markets risk are covered in risk factors 13 (“The Group is exposed to market risk, which may adversely affect its business, operations and financial condition”) and 14 (“Changes in exchange rates may adversely affect the Group’s business, operations and financial condition”).
| 3. | Competition may adversely affect the Group’s business, operations and financial conditions, in the markets in which it operates |
The markets in which the Group operates are highly competitive and could become even more so. Factors that contribute to competition risk include industry regulation, mergers and acquisitions, changes in customers’ needs and preferences, entry of new participants, development of new distribution and service methods, increased diversification of products by competitors, and regulatory changes in the rules governing the operations of banks and non-bank competitors. For example, changes in the financial services sector in Australia and New Zealand have made it possible for non-banks to offer products and services traditionally provided by banks, such as payments, home loans, and credit cards. In addition, it is possible that existing companies from outside of the traditional financial services sector may seek to obtain banking licences to directly compete with the Group by offering products and services traditionally provided by banks. In addition, banks organised in jurisdictions outside Australia and
139
SUPPLEMENTARY INFORMATION
New Zealand are subject to different levels of regulation and consequently some may have lower cost structures. Increasing competition for customers could also potentially lead to a compression in the Group’s net interest margins or increased advertising and related expenses to attract and retain customers.
Furthermore, increased competition for deposits could also increase the Group’s cost of funding and lead the Group to access other types of funding or reduce lending. The Group relies on bank deposits to fund a significant portion of its balance sheet and deposits have been a relatively stable source of funding. The group competes with banks and other financial services firms for such deposits. To the extent that the Group is not able to successfully compete for deposits, the Group would be forced to rely more heavily on other, potentially less stable or more expensive forms of funding, or reduce lending. This could adversely affect the Group’s business, prospects, financial performance or financial condition.
The impact on ANZ of an increase in competitive market conditions, especially in the Group’s main markets and products, would potentially lead to a material reduction in the market share and/or margins of the relevant Group business(es), which would adversely affect the Group’s financial performance and position.
| 4. | Changes in monetary policies may adversely affect the Group’s business, operations and financial condition |
Central monetary authorities (including the RBA, the RBNZ, the United States Federal Reserve, the Bank of England and the monetary authorities in the Asian jurisdictions in which the Group operates) set official interest rates or take other measures to affect the demand for money and credit in their relevant jurisdictions. In some Asian jurisdictions, currency policy is also used to influence general business conditions and the demand for money and credit. These policies can significantly affect the Group’s cost of funds for lending and investing and the return that the Group will earn on those loans and investments. These factors impact the Group’s net interest margin and can affect the value of financial instruments it holds, such as debt securities and hedging instruments. The policies of the central monetary authorities can also affect the Group’s borrowers, potentially increasing the risk that they may fail to repay loans. Changes in such policies are difficult to predict.
| 5. | Sovereign risk may destabilise global financial markets adversely affecting all participants, including the Group |
Sovereign risk is the risk that foreign governments will default on their debt obligations, be unable to refinance their debts as and when they fall due or nationalise parts of their economy. Sovereign risk remains in many economies, including the United States and Australia. Should one sovereign default, there could be a cascading effect to other markets and countries, the consequences of which, while difficult to predict, may be similar to or worse than those experienced during the global financial crisis and subsequent sovereign debt crises. Such events could destabilise global financial markets, adversely affecting all participants, including adversely affecting the Group’s liquidity, financial performance or financial condition.
| 6. | Weakening of the real estate markets in Australia, New Zealand or other markets where the Group does business may adversely affect its business, operations and financial condition |
Residential and commercial property lending, together with real estate development and investment property finance, constitute important businesses to the Group. Major sub-segments within the Group’s lending portfolio include:
| • | Residential housing loans, owner occupier and investment; and |
| • | Commercial real estate loans. |
Declining asset prices could impact customers and counterparties and the value of the security (including residential and commercial property) we hold against loans which may impair our ability to recover amounts owing to us if customers or counterparties were to default.
A significant decrease in Australian and New Zealand housing valuations could adversely impact our home lending activities because borrowers with loans in excess of their property value show a higher propensity to default and, in the event of such defaults our security values would be eroded, causing us to incur higher credit losses which could adversely affect the Group’s financial performance and condition. The demand for our home lending products may also decline due to buyer concerns about decreases in values or concerns about rising interest rates, which could make our lending products less attractive to potential homeowners and investors.
A significant decrease in commercial property valuations or a significant slowdown in Australia, New Zealand or other commercial real estate markets where the Group does business could result in a decrease in the amount of new lending the Group is able to write and/or increase the losses that the Group may experience from existing loans, which, in either case, could materially and adversely impact the Group’s financial condition and operations. The Group’s portfolio of commercial property interest only loans, may be particularly susceptible to losses in the event of a decline in property prices as a result of refinance risk and deteriorating security values. A material decline in residential housing prices could also cause losses in our residential build to sell portfolio if customers who are pre-committed to purchase these dwellings are unable or unwilling to complete their contracts and we are forced to re-sell these dwellings at a loss.
| 7. | The Group is exposed to liquidity and funding risk, which may adversely affect its business, operations and financial condition |
Liquidity risk is the risk that the Group is unable to meet its payment obligations as they fall due (including repaying depositors or maturing wholesale debt) or that the Group has insufficient capacity to fund increases in assets. Liquidity risk is inherent in all banking operations due to the timing mismatch between cash inflows and cash outflows.
Reduced liquidity could lead to an increase in the cost of the Group’s borrowings and constrain the volume of new lending, which could adversely affect the Group’s profitability. A deterioration in investor confidence in the Group could materially impact the Group’s cost of borrowing, and the Group’s ongoing operations and funding.
The Group raises funding from a variety of sources, including customer deposits and wholesale funding in Australia and offshore markets to meet its funding obligations and to maintain or grow its business generally. In times of liquidity stress, if there is damage to market confidence in the Group or if funding inside or outside of Australia is not available or constrained, the Group’s ability to access sources of funding and liquidity may be constrained and it will be exposed to liquidity risk. In any such cases, the Group may be forced to seek alternative funding. The availability of such alternative funding, and the terms on which it may be available, will depend on a variety of factors, including prevailing market conditions and the Group’s credit ratings (which are strongly influenced by Australia’s sovereign credit rating). Even if available, the cost of these funding alternatives may be more expensive or on unfavourable terms, which could adversely affect the Group’s financial performance, liquidity, capital resources and financial condition.
Since the advent of the global financial crisis in 2008, developments in the United States, European and Chinese markets have adversely affected the liquidity in global capital markets and increased funding costs compared with the period immediately preceding the global financial crisis.
140
SUPPLEMENTARY INFORMATION
More recently, the provision of significant amounts of liquidity by major central banks globally has helped mitigate near term liquidity concerns, although no assurance can be given that such liquidity concerns will not return, particularly when the extraordinary liquidity is withdrawn by central banks. Future deterioration in market conditions may limit the Group’s ability to replace maturing liabilities and access funding in a timely and cost-effective manner necessary to fund and grow the Group’s businesses.
| 8. | Regulatory changes or a failure to comply with regulatory standards, law or policies may adversely affect the Group’s business, operations or financial condition |
As a financial institution, the Group is subject to detailed laws and regulations in each of the jurisdictions in which it operates or obtains funding, including Australia, New Zealand, the United States, Europe and Asia Pacific. The Group is also supervised by a number of different regulatory and supervisory authorities.
The Group is responsible for ensuring that it complies with all applicable legal and regulatory requirements (including accounting standards) and industry codes of practice in the jurisdictions in which it operates or obtains funding.
Compliance risk arises from these legal, regulatory and internal- compliance requirements. If the Group, or an employee of the Group, fails to comply, the Group may be subject to fines, penalties or restrictions on its ability to do business and it may lose customer confidence and business, which could have a material adverse impact on the Group. In Australia, an example of the broad administrative power available to regulatory authorities is the power available to APRA under the Banking Act in certain circumstances to investigate the Group’s affairs and/or issue a direction to the Group (such as direction to comply with a prudential requirement, to conduct an audit, to remove a director, executive officer or employee or not to undertake a transaction). Other regulators also have the power to investigate the Group. In recent years, there have been significant increases in the nature and scale of regulatory investigations, enforcement actions (whether by court action or otherwise) and the quantum of fines issued by regulators. Recent public scrutiny of banking culture has also led to a proposal by the Opposition Australian Labor Party for a Royal Commission to investigate Australian banks. Regulatory investigations, fines, penalties or regulator imposed conditions could adversely affect the Group’s business, reputation, prospects, financial performance or financial condition.
As with other financial services providers, the Group faces increasing supervision and regulation in most of the jurisdictions in which the Group operates or obtains funding, particularly in the areas of funding, liquidity, product design and pricing, capital adequacy, conduct and prudential regulation, cyber-security, anti-bribery and corruption, anti-money laundering and counter-terrorism financing and trade sanctions.
In December 2010, the Basel Committee (BCBS) released capital reform packages known as Basel 3 to strengthen the resilience of the banking and insurance sectors, including proposals to strengthen capital and liquidity requirements for the banking sector. APRA released prudential standards implementing Basel 3 capital reforms with effect from 1 January 2013. With regards to Basel 3 liquidity reforms, APRA requires the Group to comply with the Liquidity Coverage Ratio (LCR) requirements with effect from 1 January 2015 and is currently consulting on the implementation of the Net Stable Funding Ratio (NSFR) requirements, which are expected to be implemented by 1 January 2018. Certain regulators in jurisdictions where the Group has a presence have also either implemented or are in the process of implementing Basel 3 and equivalent reforms.
Separately, since 2014, the BCBS has also released a number of consultation documents as part of its reforms aimed at simplifying the measurement of risk-weighted assets and reducing their variability across banks and jurisdictions. Consultation and finalisation of these reforms are current and on-going. Any impacts on the Group resulting from these reforms cannot be determined as final calibration is still to be finalised by the BCBS and they are also subject to the form of these proposals that APRA will implement in Australia.
In addition, there have also been a series of other regulatory releases from authorities in the various jurisdictions in which we operate or obtain funding proposing significant regulatory change for financial institutions. This includes new accounting and reporting standards, or implementing global OTC derivatives reform and the United States Dodd-Frank legislation, including the Volcker Rule promulgated thereunder.
In 2015, the Australian Government announced its response to the Financial System Inquiry (FSI). The response tasks APRA with implementation of a number of resilience-related FSI recommendations in line with emerging international regulatory practice. These FSI recommendations are intended to increase the strength of the financial system and may result in requirements to hold additional capital (such as Additional Tier 1 Capital, Tier 2 Capital or other forms of subordinated capital or senior debt that may be available to absorb loss) or additional liquid assets. The Australian Government response also endorses FSI recommendations relating to Australia’s superannuation system and retirement incomes, innovation-related issues, reforms to improve consumer outcomes when purchasing financial products, and the overall regulation of the financial sector. These are likely to result in changes to laws, regulations, codes of practice and policies that will impact the Group. The implementation of any recommendations could also result in changes to laws, regulations, codes of practice or policies which could adversely affect the Group in substantial and unpredictable ways.
Regulation is becoming increasingly extensive and complex. Some areas of potential regulatory change involve multiple jurisdictions seeking to adopt a coordinated approach. This may result in conflicts with specific requirements of the jurisdictions in which the Group operates and, in addition, such changes may be inconsistently introduced across jurisdictions. Changes may also occur in the oversight approach of regulators. It is possible for example that governments in jurisdictions in which we operate or obtain funding might revise their application of existing regulatory policies that apply to, or impact, the Group’s business, including for reasons relating to national interest and systemic stability.
Regulatory changes and the timing of their introduction continue to evolve. The nature and impact of future changes are not predictable and are beyond the Group’s control. Regulatory change may impact the Group in a range of ways, such as by requiring the Group to change its business mix, incur additional costs as a result of increased management attention, raise additional amounts of higher-quality capital (such as ordinary shares, Additional Tier 1 capital or Tier 2 capital instruments) or retain capital (through lower dividends), and hold significant levels of additional liquid assets and undertake further lengthening of the funding base. Further examples of ways in which regulatory change may impact the Group include: limiting the types, amount and composition of financial services and products the Group can offer, limiting the fees and interest that the Group may charge, increasing the ability of other banks or of non-banks to offer competing financial services or products and changes to accounting standards, taxation laws and prudential regulatory requirements. Regulatory change could adversely affect one or more of the Group’s businesses, restrict its flexibility, require it to incur substantial costs and impact the profitability of one or more business lines. Any such costs or restrictions could adversely affect the Group’s business, prospects, financial performance or financial condition.
141
SUPPLEMENTARY INFORMATION
| 9. | The Group is exposed to the risk of receiving significant regulatory fines and sanctions in the event of breaches of regulation and law relating to anti-money laundering, counter-terrorism financing and sanctions |
Anti-money laundering, counter-terrorist financing and sanctions compliance have been the subject of increasing regulatory change and enforcement in recent years. The increasingly complicated environment in which the Group operates across the Asia Pacific region has heightened these operational and compliance risks. Furthermore, the upward trend in compliance breaches by global banks and the related fines and settlement sums means that these risks continue to be an area of focus for the Group.
The Group maintains appropriate policies, and has invested in procedures and internal controls aimed to detect, prevent and report money laundering, terrorist financing, and sanctions breaches. The risk of non-compliance remains high given the scale and complexity of the Group. A failure to operate a robust program to combat money laundering, bribery and terrorist financing or to ensure compliance with economic sanctions could have serious legal and reputational consequences for the Group and its employees. Consequences can include fines, criminal and civil penalties, civil claims, reputational harm and limitations on doing business in certain jurisdictions. The Group’s foreign operations may place the Group under increased scrutiny by regulatory authorities, and may increase the risk of a member of the Group breaching applicable rules, regulations or laws.
| 10. | The Group may experience challenges in managing its capital base, which could give rise to greater volatility in capital ratios |
The Group’s capital base is critical to the management of its businesses and access to funding. Prudential regulators of the Group include, but are not limited to, APRA, RBNZ and various regulators in the Asia Pacific, U.S. and U.K. The Group is required to maintain adequate regulatory capital.
Under current regulatory requirements, risk-weighted assets and expected loan losses increase as a counterparty’s risk grade worsens. These additional regulatory capital requirements compound any reduction in capital resulting from lower profits in times of stress. As a result, greater volatility in capital ratios may arise and may require the Group to raise additional capital. There can be no certainty that any additional capital required would be available or could be raised on reasonable terms.
The Group’s capital ratios may be affected by a number of factors, such as (i) lower earnings (including lower dividends from its deconsolidated subsidiaries such as those in the insurance and funds management businesses as well as from its investment in associates), (ii) increased asset growth, (iii) changes in the value of the Australian dollar against other currencies in which the Group operates (particularly the New Zealand dollar and United States dollar) that impact risk weighted assets or the foreign currency translation reserve and (iv) changes in business strategy (including acquisitions, divestments and investments or an increase in capital intensive businesses).
APRA’s Prudential Standards implementing Basel 3 are now in effect. Certain other regulators have either implemented or are in the process of implementing regulations, including Basel 3, which seek to strengthen, among other things, the liquidity and capital requirements of banks, funds management entities and insurance entities, though there can be no assurance that these regulations will have their intended effect. Some of these regulations, together with any risks arising from any regulatory changes (including those arising from the requirements of the BCBS or the Australian Government’s response to the FSI), are described in risk factor 8 “Regulatory changes or a failure to comply with regulatory standards, law or policies may adversely affect the Group’s business, operations or financial condition”.
| 11. | The Group is exposed to credit risk, which may adversely affect its business, operations and financial condition |
As a financial institution, the Group is exposed to the risks associated with extending credit to other parties. Less favourable business or economic conditions, whether generally or in a specific industry sector or geographic region, or natural disasters, could cause customers or counterparties to fail to meet their obligations in accordance with agreed terms. For example, the Group’s customers and counterparties in the natural resources sector and the New Zealand dairy industry could be adversely impacted by a prolonged slowdown in the Chinese economy and current decline in commodity prices. Also, the Group’s customers and counterparties may be adversely impacted by more expensive imports due to the reduced strength of the Australian and New Zealand dollars relative to other currencies.
In addition, in assessing whether to extend credit or enter into other transactions with customers and/or counterparties, the Group relies on information provided by or on behalf of customers and/or counterparties, including financial statements and other financial information. The Group may also rely on representations of customers and independent consultants as to the accuracy and completeness of that information. The Group’s financial performance could be negatively impacted to the extent that it relies on information that is inaccurate or materially misleading.
The Group holds provisions for credit impairment. The amount of these provisions is determined by assessing the extent of impairment inherent within the current lending portfolio, based on current information. This process, which is critical to the Group’s financial condition and results, requires subjective and complex judgements, including forecasts of how current and future economic conditions might impair the ability of borrowers to repay their loans. However, if the information upon which the assessment is made proves to be inaccurate or if the Group fails to analyse the information correctly, the provisions made for credit impairment may be insufficient, which could have a material adverse effect on the Group’s business, operations and financial condition.
| 12. | The Group is exposed to the risk that its credit ratings could change, which could adversely affect its ability to raise capital and wholesale funding |
The Group’s credit ratings have a significant impact on both its access to, and cost of, capital and wholesale funding. Credit ratings may be withdrawn, qualified, revised or suspended by credit rating agencies at any time. The methodologies by which they are determined may also be revised in response to legal or regulatory changes, market developments or for any other reason. A downgrade or potential downgrade to the Group’s credit rating may reduce access to capital and wholesale debt markets, leading to an increase in funding costs, as well as affecting the willingness of counterparties to transact with the Group.
In addition, the ratings of individual securities (including, but not limited to, certain Tier 1 capital and Tier 2 capital securities and covered bonds) issued by the Group (and other banks globally) could be impacted from time to time by changes in the regulatory requirements for those instruments as well as the ratings methodologies used by rating agencies. Further, the Group’s credit ratings could be revised at any time in response to a change in the credit rating of the Commonwealth of Australia.
Credit ratings are not a recommendation by the relevant rating agency to invest in securities offered by the Group.
142
SUPPLEMENTARY INFORMATION
| 13. | The Group is exposed to market risk, which may adversely affect its business, operations and financial condition |
The Group is subject to market risk, which is the risk to the Group’s earnings arising from changes in interest rates, foreign exchange rates, credit spreads, equity prices and indices, prices of commodities, debt securities and other financial contracts, such as derivatives. Losses arising from these risks may have a material adverse effect on the Group.
As the Group conducts business in several different currencies, its businesses may be affected by a change in currency exchange rates. Additionally, as the Group’s annual and interim reports are prepared and stated in Australian dollars, any appreciation in the Australian dollar against other currencies in which the Group earns revenues (particularly to the New Zealand dollar and United States dollar) may adversely affect the reported earnings.
The profitability of the Group’s funds management and insurance businesses is also affected by changes in investment markets and weaknesses in global securities markets.
| 14. | Changes in exchange rates may adversely affect the Group’s business, operations and financial condition |
Movements in the Australian and New Zealand dollars in recent times illustrate the potential volatility in, and significance of global economic events to, the value of these currencies relative to other currencies. Depreciation of the Australian or New Zealand dollars relative to other currencies would increase the debt service obligations in the Group’s unhedged exposures denominated in Australian or New Zealand dollars. In contrast, any upward pressure on the Australian or New Zealand dollar could cause business conditions to deteriorate for certain portions of the Australian and New Zealand economies, including some agricultural exports, tourism, manufacturing, retailing subject to internet competition, and import-competing producers. In addition, appreciation of the Australian dollar against the New Zealand dollar, United States dollar and other currencies has a potential negative earnings translation effect on non-hedged exposures, and future appreciation could have a greater negative impact on the Group’s results from its other non-Australian businesses, particularly its New Zealand and Asian businesses, which are largely based on non-Australian dollar revenues. The relationship between exchange rates and commodity prices is volatile. The Group has put in place hedges to partially mitigate the impact of currency changes, but there can be no assurance that the Group’s hedges will be sufficient or effective, and any further appreciation could have an adverse impact upon the Group’s earnings.
| 15. | The Group is exposed to operational risk and reputational risk, which may adversely affect its business, operations and financial condition |
Operational risk is the risk of loss resulting from inadequate or failed internal processes, people and systems or from external events. This definition includes legal risk, and the risk of loss of reputation or damage arising from inadequate or failed internal processes, people and systems, but excludes strategic risk.
Loss from operational risk events could adversely affect the Group’s financial results. Such losses can include fines, penalties, loss or theft of funds or assets, legal costs, customer compensation, loss of shareholder value, reputation loss, loss of life or injury to people, and loss of property and/or information.
Operational risk is typically classified into the risk event type categories to measure and compare risks on a consistent basis. Examples of operational risk events according to category are as follows:
| • | Internal Fraud: is associated with ANZ employees acting outside their normal employment conditions/procedures to create a financial advantage for themselves or others; |
| • | External Fraud: fraudulent acts or attempts which originate from outside the Group, more commonly associated with digital banking, lending, and cards products. Specific threats include ATM skimming, malware and phishing attacks and fraudulent applications, where financial advantage is obtained; |
| • | Employment Practices and Workplace Safety: employee relations, diversity and discrimination, and health and safety risks to the Group employees; |
| • | Clients, Products and Business Practices: risk of market manipulation, product defects, incorrect advice, money laundering and misuse or unauthorised disclosure of customer information; |
| • | Technology: the risk of loss resulting from inadequate or failed information technology; |
| • | Business Disruption (including systems failures): risk that the Group’s banking operating systems are disrupted or fail; |
| • | Damage to physical assets: risk that a natural disaster or terrorist or vandalism attack damages the Group’s buildings or property; and |
| • | Execution, Delivery and Process Management: is associated with losses resulting from, among other things, process errors made by ANZ employees caused by inadequate or poorly designed internal processes, or the poor execution of standard processes, vendor, supplier or outsource provider errors or failed mandatory reporting errors. |
Direct or indirect losses that occur as a result of operational failures, breakdowns, omissions or unplanned events could adversely affect the Group’s financial results.
Reputation risk may arise as a result of an external event or the Group’s own actions, and adversely affect perceptions about the Group held by the public (including the Group’s customers), shareholders, investors, regulators or rating agencies. The impact of a risk event on the Group’s reputation may exceed any direct cost of the risk event itself and may adversely impact the Group’s business, operations and financial condition.
Damage to the Group’s reputation may also have wide-ranging impacts, including adverse effects on the Group’s profitability, capacity and cost of sourcing funding and availability of new business opportunities. The Group’s ability to attract and retain customers could also be adversely affected if the Group’s reputation is damaged, which could adversely affect the Group’s business prospects, financial performance or financial condition.
| 16. | The Group may be exposed to risks relating to the provision of advice, recommendations or guidance about financial products and services, or behaviours which do not appropriately consider the interests of consumers, the integrity of financial markets and the expectations of the community, in the course of its business activities |
Such risks can include:
| • | the provision of unsuitable or inappropriate advice (e.g., commensurate with a customer’s objectives and appetite for risk); |
143
SUPPLEMENTARY INFORMATION
| • | the representation of, or disclosure about, a product or service which is inaccurate, or does not provide adequate information about risks and benefits to customers; |
| • | a failure to deliver product features and benefits in accordance with terms, disclosures, recommendations and/or advice; |
| • | a failure to appropriately avoid or manage conflicts of interest; |
| • | sales and/or promotion processes (including incentives and remuneration for staff engaged in promotion, sales and/or the provision of advice); |
| • | the provision of credit, outside of ANZ policies and standards; and |
| • | trading activities in financial markets, outside of ANZ policies and standards e.g., BBSW, LIBOR, rate fixing. |
Exposure to such risks may increase during periods of declining investment asset values (such as during a period of economic downturn or investment market volatility), leading to sub-optimal performance of investment products and/or portfolios that were not aligned with the customer’s objectives and risk appetite.
The Group is regulated under various legislative mechanisms in the countries in which it operates that provide for consumer protection around advisory, marketing and sales practices. These may include, but are not limited to, appropriate management of conflicts of interest, appropriate accreditation standards for staff authorised to provide advice about financial products and services, disclosure standards, standards for ensuring adequate assessment of client/product suitability, quality assurance activities, adequate record keeping, and procedures for the management of complaints and disputes.
Inappropriate advice about financial products and services may result in material litigation (and associated financial costs) and together with failure to avoid or manage conflicts of interest, may expose the Group to regulatory actions, and/or reputational consequences.
| 17. | Disruption of information technology systems or failure to successfully implement new technology systems could significantly interrupt the Group’s business, which may adversely affect its business, operations and financial condition |
The Group is highly dependent on information systems and technology. Therefore, there is a risk that these, or the services the Group uses or is dependent upon, might fail, including because of unauthorised access or use.
Most of the Group’s daily operations are computer-based and information technology systems are essential to maintaining effective communications with customers. The Group is also conscious that threats to information systems and technology are continuously evolving and that cyber threats and risk of attacks are increasing. The Group may not be able to anticipate or implement effective measures to prevent or minimise disruptions that may be caused by all cyber threats because the techniques used can be highly sophisticated and those perpetuating the attacks may be well resourced. The exposure to systems risks includes the complete or partial failure of information technology systems or data centre infrastructure, the inadequacy of internal and third-party information technology systems due to, among other things, failure to keep pace with industry developments and the capacity of the existing systems to effectively accommodate growth, prevent unauthorised access and integrate existing and future acquisitions and alliances.
To manage these risks, the Group has disaster recovery and information technology governance in place. However, there can be no guarantee that the steps the Group is taking in this regard will be effective and any failure of these systems could result in business interruption, customer dissatisfaction and ultimately loss of customers, financial compensation, damage to reputation and/or a weakening of the Group’s competitive position, which could adversely impact the Group’s business and have a material adverse effect on the Group’s financial condition and operations.
In addition, the Group has an ongoing need to update and implement new information technology systems, in part to assist it to satisfy regulatory demands, ensure information security, enhance computer-based banking services for the Group’s customers and integrate the various segments of its business. The Group may not implement these projects effectively or execute them efficiently, which could lead to increased project costs, delays in the ability to comply with regulatory requirements, failure of the Group’s information security controls or a decrease in the Group’s ability to service its customers. ANZ New Zealand relies on ANZBGL to provide a number of information technology systems, and any failure of ANZBGL systems could directly affect ANZ New Zealand.
| 18. | The Group is exposed to risks associated with information security, which may adversely affect its financial results and reputation |
Information security means protecting information and information systems from unauthorised access, use, disclosure, disruption, modification, perusal, inspection, recording or destruction. As a bank, the Group handles a considerable amount of personal and confidential information about its customers and its own internal operations, including in Australia, New Zealand and India. The Group employs a team of information security experts who are responsible for the development and implementation of the Group’s Information Security Policy. The Group also uses third parties to process and manage information on its behalf, and any failure on their part could adversely affect its business. The Group is conscious that threats to information systems are continuously evolving and that cyber threats and risk of attacks are increasing, and as such the Group may be unable to develop policies and procedures to adequately address or mitigate such risks. Accordingly, information about the Group and/or our clients may be inadvertently accessed, inappropriately distributed or illegally accessed or stolen. The Group may not be able to anticipate or to implement effective measures to prevent or minimise damage that may be caused by all information security threats because the techniques used can be highly sophisticated and those perpetuating the attacks may be well resourced. Any unauthorised access of the Group’s information systems or unauthorised use of its confidential information could potentially result in disruption of the Group’s operations, breaches of privacy laws, regulatory sanctions, legal action, and claims for compensation or erosion to the Group’s competitive market position, which could adversely affect the Group’s financial position and reputation.
| 19. | Unexpected changes to the Group’s licence to operate in any jurisdiction may adversely affect its business, operations and financial condition |
The Group is licenced to operate in various countries, states and territories. Unexpected changes in the conditions of the licences to operate by governments, administrations or regulatory agencies which prohibit or restrict the Group from trading in a manner that was previously permitted may adversely impact the Group’s operations and subsequent financial results.
144
SUPPLEMENTARY INFORMATION
| 20. | An increase in the failure of third parties to honour their commitments in connection with the Group’s trading, lending, derivatives and other activities may adversely affect its business, operations and financial condition |
The Group is exposed to the potential risk of credit-related losses that can occur as a result of a counterparty being unable or unwilling to honour its contractual obligations. As with any financial services organisation, the Group assumes counterparty risk in connection with its lending, trading, derivatives, insurance and other businesses where it relies on the ability of a third party (including reinsurers) to satisfy its financial obligations to the Group on a timely basis. The Group is also subject to the risk that its rights against third parties may not be enforceable in certain circumstances.
The risk of credit-related losses may also be increased by a number of factors, including deterioration in the financial condition of the economy, a sustained high level of unemployment, a deterioration of the financial condition of the Group’s counterparties, a reduction in the value of assets the Group holds as collateral, and a reduction in the market value of the counterparty instruments and obligations it holds.
The Group is directly and indirectly exposed to the natural resources sector, including contractors and related industries. Lower commodity prices, mining activity, demand for resources, or corporate investment in the natural resources sector may adversely affect the amount of new lending the Group is able to write, or lead to an increase in lending losses from this sector. Recently, crude oil prices have reached a 12 year low and a prolonged period of low oil prices, beyond 12 months, is likely to result in reduced investment and increased asset write downs. The suddenness and magnitude of oil price decline and the shift in sentiment towards this sector introduces challenges across the energy supply chain. Upstream exploration and production firms and related services operators are currently the most directly exposed as new project investment is wound back and operations rationalised. Services to mining customers are also subject to heightened oversight given the cautious outlook for the services sector. This industry-specific revenue decline may lead to a broader regional economic downturn with a long recovery period.
Credit losses can and have resulted in financial services organisations realising significant losses and in some cases failing altogether. Should material unexpected credit losses occur to the Group’s credit exposures, it could have an adverse effect on the Group’s business, operations and financial condition.
| 21. | The unexpected loss of key staff or inadequate management of human resources may adversely affect the Group’s business, operations and financial condition |
The Group’s ability to attract and retain suitably qualified and skilled employees is an important factor in achieving its strategic objectives. The Chief Executive Officer and the management team of the Chief Executive Officer have skills and reputation that are critical to setting the strategic direction, successful management and growth of the Group, and whose unexpected loss due to resignation, retirement, death or illness may adversely affect its operations and financial condition. If the Group had difficulty retaining or attracting highly qualified people for important roles, this also could adversely affect its business, operations and financial condition.
| 22. | The Group may be exposed to the impact of future climate change, geological events, plant, animal and human diseases, and other extrinsic events which may adversely affect its business, operations and financial condition |
The Group and its customers are exposed to climate related events, including climate change. These events include severe storms, drought, fires, cyclones, hurricanes, floods and rising sea levels. The Group and its customers may also be exposed to other events such as geological events (including volcanic seismic activity or tsunamis), plant and animal diseases or a pandemic.
Depending on their severity, events such as these may temporarily interrupt or restrict the provision of some local or Group services, and may also adversely affect the Group’s financial condition or collateral position in relation to credit facilities extended to customers.
| 23. | The Group is exposed to insurance risk, which may adversely affect its business, operations and financial condition |
Insurance risk is the risk of loss due to unexpected changes in current and future insurance claim rates. In the Group’s life insurance business, insurance risk arises primarily through mortality (death) and morbidity (illness and injury) risks being greater than expected and, in the case of annuity business, should annuitants live longer than expected. In August 2015, ANZ ceased to issue home, car and travel insurance and became a distributer only of these products. The general insurance business now solely comprises a small amount of unemployment benefit. The Group has exposure to insurance risk in both its life insurance and general insurance business, which may adversely affect its businesses, operations and financial condition.
| 24. | The Group is exposed to increased compliance costs and the risk of penalties and regulatory scrutiny with respect to the significant obligations imposed by global tax reporting regimes which are still evolving |
In 2010, the U.S. enacted the Foreign Account Tax Compliance Act (“FATCA”) that requires non-U.S. banks and other financial institutions to undertake specific customer due diligence and provide information on account holders who are U.S. citizens or residents to the United States Federal tax authority, the Internal Revenue Service (“IRS”). The United States has entered into intergovernmental agreements (“IGAs”) with a number of jurisdictions (including Australia and New Zealand) which generally require such jurisdictions to enact legislation or other binding rules pursuant to which local financial institutions and branches provide such information to their local revenue authority to then forward to the IRS. In countries that have not entered into such an agreement, the financial institution must enter into an agreement directly with the IRS to complete similar obligations and provide similar information directly to the United States. If the aforementioned customer due diligence and provision of account holder information is not undertaken and provided in a manner and form meeting the applicable requirements, the Group and/or persons owning assets in accounts with Group members may be subjected to a 30 percent withholding tax on certain amounts. While such withholding tax may currently apply only to certain payments derived from sources within the United States (and, beginning on 1 January 2019, certain gross proceeds from the disposition of assets that can give rise to such U.S. source payments), no such withholding tax will be imposed on any payments derived from sources outside the United States that are made prior to 1 January 2019, at the earliest. Australia and New Zealand have each signed an IGA with the United States and have enacted legislation to implement the respective IGAs. Local guidance in relation to the enacted legislation is still evolving.
In addition to FATCA, the U.S. may require the Group in certain circumstances to provide certain information to U.S. payors (withholding agents, custodians, etc.), and the Group may face adverse consequences in case it does not provide such information in compliance with the applicable rules and regulations.
The Organisation for Economic Co-operation and Development (“OECD”) has finalised a global Common Reporting Standard (“CRS”) for the Automatic Exchange Of (financial account) Information (“AEOI”) in tax matters. Over 90 jurisdictions have committed to implement the CRS in 2016 or 2017, with the first exchange of information to take place in 2017 or 2018. Countries with a start date of 1 January, 2016 include Cayman Islands, France, Germany, India, the United Kingdom and South Korea. On 3 June 2015, Australia signed the Multilateral Competent Authority Agreement
145
SUPPLEMENTARY INFORMATION
(“MCAA”) that enables Common Reporting Standard information to be exchanged between countries’ tax authorities. Several countries, including Canada, New Zealand and India, also signed the MCAA on 3 June 2015. Australia has legislated for the CRS to apply from 1 July 2017 (with the government to government exchange of information to take place by September 2018). Australian financial institutions that do not fully comply with all the requirements of the CRS (as modified by the implementing legislation), will be subject to administrative penalties.
To date, no legislation has been introduced in the New Zealand Parliament to support implementation of the CRS although the New Zealand Government has recently released a media statement announcing that it intends for the CRS to apply from 1 July 2017 (with exchange of information to take place in September 2018) and preliminary consultation activities on an approach to CRS have commenced.
In countries where an entity of the Group (including certain trusts and branches) operates and which maintains financial accounts, there may be a requirement to collect customer information including customers’ tax residence and report it to local tax authorities. Even if an entity of the Group does not operate in a country that has adopted CRS, it will still be required to capture information on residents of that country who have an account with the Group. CRS requirements, though generally similar to FATCA, have significant differences and a higher standard of compliance in many aspects, including penalties for non-collection of prescribed customer information.
In addition to FATCA and CRS, there are an increasing number of tax reporting initiatives that require financial institutions to undertake due diligence and report customer information including the Annual Investment Income Report (Australia), UK Crown Dependency and Overseas Territory (“CDOT”) automatic exchange of information regime and many others that will require due diligence and reporting to the in-country revenue authority.
In line with other global financial institutions, ANZ has made and is expected to make significant investments in order to comply with, in all the countries that it operates in, the extensive requirements of FATCA, the CRS and the various other in-country tax reporting initiatives.
| 25. | The Group may experience changes in the valuation of some of its assets and liabilities that may have a material adverse effect on its earnings and/or equity |
Under AASs, the Group recognises the following instruments at fair value with changes in fair value recognised in earnings or equity:
| • | derivative instruments, including in the case of fair value hedging, the fair value adjustment on the underlying hedged exposure with changes in fair value recognised in earnings with the exception of derivatives designated in qualifying cash flow or net investment hedges where the change is recognised in equity and released to earnings together with the underlying hedged exposure; |
| • | assets and liabilities held for trading; |
| • | available-for-sale assets with changes in fair value recognised in equity unless the asset is impaired, in which case, the decline in fair value is recognised in earnings; and |
| • | assets and liabilities designated at fair value through profit and loss with changes recognised in earnings with the exception of changes in fair value attributable to the own credit component of liabilities that is recognised in equity. |
Generally, in order to establish the fair value of these instruments, the Group relies on quoted market prices or, where the market for a financial instrument is not sufficiently active, fair values are based on present value estimates or other accepted valuation techniques which incorporate the impact of factors that would influence the fair value as determined by a market participant. The fair value of these instruments is impacted by changes in market prices or valuation inputs which could have a material adverse effect on the Group’s earnings.
In addition, the Group may be exposed to a reduction in the value of non-lending related assets as a result of impairments loss which is recognised in earnings. The Group is required to assess the recoverability of the goodwill balances at least annually and other non-financial assets including Premises and Equipment, investment in associates, capitalised software and other intangible assets (including acquired portfolio of insurance and investment business and deferred acquisition costs) where there are indictors of impairment.
For the purpose of assessing the recoverability of the goodwill balances, the Group uses either a discounted cash flow or a multiple of earnings calculation. Changes in the assumptions upon which the calculation is based, together with expected changes in future cash flows, could materially impact this assessment, resulting in the potential write-off of a part or all of the goodwill balances.
In respect of other non-financial assets, in the event that an asset is no longer in use, or that the cash flows generated by the asset do not support the carrying value, impairment may be recorded.
| 26. | Changes to accounting policies may adversely affect the Group’s financial position or performance |
The accounting policies and methods that the Group applies are fundamental to how it records and reports its financial position and results of operations. Management must exercise judgment in selecting and applying many of these accounting policies and methods so that they not only comply with generally accepted accounting principles but they also reflect the most appropriate manner in which to record and report on the Group’s financial position and results of operations. However, these accounting policies may be applied inaccurately, resulting in a misstatement of the Group’s financial position and results of operations. In addition, the application of new or revised generally accepted accounting principles could have a material adverse effect on the Group’s financial position and results of operations.
In some cases, management must select an accounting policy or method from two or more alternatives, any of which might comply with the generally accepted accounting principles applicable to the Group and be reasonable under the circumstances, yet might result in reporting materially different outcomes than would have been reported under another alternative.
| 27. | Litigation and contingent liabilities may adversely affect the Group’s business, operations and financial condition |
From time to time, the Group may be subject to material litigation, regulatory actions, legal or arbitration proceedings and other contingent liabilities which, if they crystallise, may adversely affect the Group’s results.
The Group had contingent liabilities as at 31 March 2016 in respect of the matters outlined in Note 20 to the Condensed Consolidated Financial Statements for the half year ended 31 March 2016.
There is a risk that contingent liabilities may be larger than anticipated or that additional litigation or other contingent liabilities may arise.
146
SUPPLEMENTARY INFORMATION
| 28. | The Group regularly considers acquisition and divestment opportunities, and there is a risk that the Group may undertake an acquisition or divestment that could result in a material adverse effect on its business, operations and financial condition |
The Group regularly examines a range of corporate opportunities, including material acquisitions and disposals, with a view to determining whether those opportunities will enhance the Group’s strategic position and financial performance.
There can be no assurance that any acquisition (or divestment) would have the anticipated positive results, including results relating to the total cost of integration (or separation), the time required to complete the integration (or separation), the amount of longer-term cost savings, the overall performance of the combined (or remaining) entity, or an improved price for the Group’s securities. The Group’s operating performance, risk profile and capital structure may be affected by these corporate opportunities and there is a risk that the Group’s credit ratings may be placed on credit watch or downgraded if these opportunities are pursued.
Integration (or separation) of an acquired (or divested) business can be complex and costly, sometimes including combining (or separating) relevant accounting and data processing systems, and management controls, as well as managing relevant relationships with employees, customers, regulators, counterparties, suppliers and other business partners. Integration (or separation) efforts could create inconsistencies in standards, controls, procedures and policies, as well as diverting management attention and resources. This could adversely affect the Group’s ability to conduct its business successfully and impact the Group’s operations or results. Additionally, there can be no assurance that employees, customers, counterparties, suppliers and other business partners of newly acquired (or retained) businesses will remain post-acquisition (or post-divestment), and the loss of employees, customers, counterparties, suppliers and other business partners could adversely affect the Group’s operations or results.
147
DEFINITIONS
AASB – Australian Accounting Standards Board. The term “AASB” is commonly used when identifying Australian Accounting Standards issued by the AASB.
ADI – Authorised Deposit-taking Institution.
APRA – Australian Prudential Regulation Authority.
APS – ADI Prudential Standard.
BCBS – Basel Committee on Banking Supervision.
Cash and cash equivalents comprise coins, notes, money at call, balances held with central banks, liquid settlement balances (readily convertible to known amounts of cash which are subject to insignificant risk of changes in value) and securities purchased under agreements to resell (“reverse repos”) in less than three months.
Cash profit is an additional measure of profit which is prepared on a basis other than in accordance with accounting standards. Cash profit represents ANZ’s preferred measure of the result of the ongoing business activities of the Group, enabling readers to assess Group and Divisional performance against prior periods and against peer institutions. To calculate cash profit, the Group excludes non-core items from statutory profit as noted below. These items are calculated consistently period on period so as not to discriminate between positive and negative adjustments.
Gains and losses are adjusted where they are significant, or have the potential to be significant in any one period, and fall into one of three categories:
| 1. | gains or losses included in earnings arising from changes in tax, legal or accounting legislation or other non-core items not associated with the ongoing operations of the Group; |
| 2. | treasury shares, revaluation of policy liabilities, economic hedging impacts and similar accounting items that represent timing differences that will reverse through earnings in the future; and |
| 3. | accounting reclassifications between individual line items that do not impact reported results, such as policyholder tax gross up. |
Cash profit is not a measure of cash flow or profit determined on a cash accounting basis.
Collective provision is the provision for credit losses that are inherent in the portfolio but not able to be individually identified. A collective provision is only recognised when a loss event has occurred. Losses expected as a result of future events, no matter how likely, are not recognised.
Credit risk is the risk of financial loss resulting from the failure of ANZ’s customers and counterparties to honour or perform fully the terms of a loan or contract.
Credit risk weighted assets represent assets which are weighted for credit risk according to a set formula (APS 112/113).
Credit valuation adjustment (CVA) – Over the life of a derivative instrument, ANZ uses a CVA model to adjust fair value to take into account the impact of counterparty credit quality. The methodology calculates the present value of expected losses over the life of the financial instrument as a function of probability of default, loss given default, expected credit risk exposure and an asset correlation factor. Impaired derivatives are also subject to a CVA.
Customer deposits represent term deposits, other deposits bearing interest, deposits not bearing interest and borrowing corporations’ debt excluding securitisation deposits.
Dividend payout ratio is the total ordinary dividend payment divided by profit attributable to shareholders of the Company, adjusted for the amount of preference share dividends paid.
Gross loans and advances (GLA) is made up of loans and advances, acceptances and capitalised brokerage/mortgage origination fees less unearned income.
IFRS – International Financial Reporting Standards.
Impaired assets are those financial assets where doubt exists as to whether the full contractual amount will be received in a timely manner, or where concessional terms have been provided because of the financial difficulties of the customer. Financial assets are impaired if there is objective evidence of impairment as a result of a loss event that occurred prior to the reporting date, and that loss event has had an impact, which can be reliably estimated, on the expected future cash flows of the individual asset or portfolio of assets.
Impaired loans comprise drawn facilities where the customer’s status is defined as impaired.
Individual provision is the amount of expected credit losses on financial instruments assessed for impairment on an individual basis (as opposed to on a collective basis). It takes into account expected cash flows over the lives of those financial instruments.
Interest rate risk in the banking book (IRRBB) relates to the potential adverse impact of changes in market interest rates on ANZ’s future net interest income. The risk generally arises from:
| 1. | Repricing and yield curve risk - the risk to earnings or market value as a result of changes in the overall level of interest rates and/or the relativity of these rates across the yield curve; |
| 2. | Basis risk - the risk to earnings or market value arising from volatility in the interest margin applicable to banking book items; and |
| 3. | Optionality risk - the risk to earnings or market value arising from the existence of stand-alone or embedded options in banking book items. |
Internationally comparable ratios are ANZ’s interpretation of the regulations documented in the Basel Committee publications; “Basel 3: A global regulatory framework for more resilient banks and banking systems” (June 2011) and “International Convergence of Capital Measurement and Capital Standards” (June 2006). They also include differences identified in APRA’s information paper entitled International Capital Comparison Study (13 July 2015).
Net interest margin (NIM) is net interest income as a percentage of average interest earning assets.
Net loans and advances represent gross loans and advances less provisions for credit impairment.
Net tangible assets equal share capital and reserves attributable to shareholders of the Company less preference share capital and unamortised intangible assets (including goodwill and software).
Operating expenses include personnel expenses, premises expenses, technology expenses, restructuring expenses, and other operating expenses (excluding credit impairment charges).
148
DEFINITIONS
Operating income includes net interest income, net fee and commission income, net funds management and insurance income, share of associates’ profit and other income.
Restructured items comprise facilities in which the original contractual terms have been modified for reasons related to the financial difficulties of the customer. Restructuring may consist of reduction of interest, principal or other payments legally due, or an extension in maturity materially beyond those typically offered to new facilities with similar risk.
Return on average assets is the profit attributable to shareholders of the Company, adjusted for the amount of preference share dividends paid, divided by average total assets.
Return on average ordinary shareholders’ equity is the profit attributable to shareholders of the Company, adjusted for the amount of preference share dividends paid, divided by average ordinary shareholders’ equity.
Regulatory deposits are mandatory reserve deposits lodged with local central banks in accordance with statutory requirements.
Risk weighted assets (RWA) – Assets (both on and off-balance sheet) are risk weighted according to each asset’s inherent potential for default and what the likely losses would be in the case of default. In the case of non asset backed risks (i.e. market and operational risk), RWA is determined by multiplying the capital requirements for those risks by 12.5.
Settlement balances owed to / by ANZ represent financial assets and/or liabilities which are in the course of being settled. These may include trade dated assets and liabilities, nostro / vostro accounts and securities settlement accounts.
149
DEFINITIONS
|
Description of divisions
|
During the March 2016 half, the Group announced changes to the organisation’s structure to better meet the needs of our retail, commercial and institutional customers. As a result of these organisational changes there are six reported divisions; Australia, New Zealand, Institutional, Asia Retail & Pacific, Wealth and Technology, Services & Operations (“TSO”) and Group Centre. These divisions were created by removing the Asia Retail & Pacific business from the former International & Institutional Banking (“IIB”) division, and repositioning minority investments in Asia from IIB to the Group Centre. The residual IIB business has been renamed Institutional.
The Wealth changes designed to simplify the approach to the wealth management business will not take effect until 1 April 2016.
Australia
The Australia division comprises the Retail and Corporate & Commercial Banking (C&CB) business units.
| • | Retail provides products and services to consumer customers via the branch network, mortgage specialists, the contact centre and a variety of self-service channels (internet banking, phone banking, ATMs, website and mobile phone banking). |
| • | C&CB provides a full range of banking services including traditional relationship banking and sophisticated financial solutions; including asset financing through dedicated managers focusing on privately owned small, medium and large enterprises as well as the agricultural business segment. |
Institutional
The Institutional division services global institutional and business customers across three product sets: Transaction Banking, Loans & Specialised Finance and Markets.
| • | Transaction Banking provides working capital and liquidity solutions including documentary trade, supply chain financing, structured trade finance as well as cash management solutions, deposits, payments and clearing. |
| • | Loans & Specialised Finance provides specialised loan structuring and execution, loan syndication, project and export finance, debt structuring and acquisition finance, structured asset finance and corporate advisory. |
| • | Markets provide risk management services on foreign exchange, interest rates, credit, commodities, debt capital markets and wealth solutions in addition to managing the Group’s interest rate exposure and liquidity position. |
New Zealand
The New Zealand division comprises the Retail and Commercial business units.
| • | Retail provides products and services to consumer and small business banking customers via the branch network, mortgage specialists, business managers, the contact centre and a variety of self-service channels (internet banking, phone banking, ATMs, website and mobile phone banking). |
| • | Commercial provides a full range of banking services including traditional relationship banking and sophisticated financial solutions including asset financing through dedicated managers focusing on privately owned medium to large enterprises and the agricultural business segment. |
Wealth
The Wealth division comprises Insurance, Funds Management and Private Wealth business units which provide insurance, investment, superannuation and private banking solutions to customers in the Asia Pacific region to make it easier for them to connect with, protect and grow their wealth.
| • | Insurance includes life insurance, general insurance and ANZ Lenders Mortgage Insurance. |
| • | Funds Management includes the Pensions and Investments business and E*TRADE. |
| • | Private Wealth includes private banking business which specialises in assisting individuals and families to manage, grow and preserve their wealth. |
Asia Retail & Pacific
The Asia Retail & Pacific division comprises the Asia Retail and Pacific business units, connecting customers to specialists for their banking needs.
| • | Asia Retail provides general banking and wealth management services to affluent and emerging affluent retail customers across nine Asian countries via relationship managers, branches, contact centres and a variety of self-service digital channels (internet and mobile banking, phone and ATMs). Core products offered include deposits, credit cards, loans, investments and insurance. |
| • | Pacific provides products and services to retail customers and small to medium sized enterprises located in the Pacific Islands (excluding Papua New Guinea). Products and services include retail products provided to consumers, traditional relationship banking and sophisticated financial solutions provided to business customers through dedicated managers. |
Technology, Services & Operations and Group Centre
TSO and Group Centre provide support to the operating divisions, including technology, operations, shared services, property, risk management, financial management, strategy, marketing, human resources and corporate affairs. The Group Centre includes Group Treasury, Shareholder Functions and minority investments in Asia.
150
ASX APPENDIX 4D – CROSS REFERENCE INDEX
| Page | ||||
| Details of the reporting period (4D Item 1) | After front cover | |||
| Results for Announcement to the Market (4D Item 2) | After front cover | |||
| Net Tangible Assets per security (4D Item 3) | 12 | |||
| Details of entities over which control has been gained or lost (4D Item 4) | 125 | |||
| Dividends and dividend dates (4D Item 5) | After front cover | |||
| Dividend Reinvestment Plan (4D Item 6) | After front cover | |||
| Details of associates and joint venture entities (4D Item 7) | 125 | |||
151
ALPHABETICAL INDEX
| PAGE | ||||
| Appendix 4D Statement | 2 | |||
| Appendix 4D Cross Reference Index | 151 | |||
| Auditor’s Review Report and Independence Declaration | 128 | |||
| Basis of Preparation | 104 | |||
| Changes in Composition of the Group | 125 | |||
| Condensed Consolidated Balance Sheet | 101 | |||
| Condensed Consolidated Cash Flow Statement | 102 | |||
| Condensed Consolidated Income Statement | 99 | |||
| Condensed Consolidated Statement of Comprehensive Income | 100 | |||
| Condensed Statement of Changes in Equity | 103 | |||
| Contingent Liabilities and Contingent Assets | 125 | |||
| Credit Risk | 116 | |||
| Definitions | 148 | |||
| Deposits and Other Borrowings | 114 | |||
| Directors’ Declaration and Responsibility Statement | 127 | |||
| Directors’ Report | 98 | |||
| Dividends | 108 | |||
| Divisional Results | 49 | |||
| Earnings Per Share | 109 | |||
| Fair Value Measurement | 118 | |||
| Geographic Results | 83 | |||
| Group Results | 21 | |||
| Income | 106 | |||
| Income Tax Expense | 108 | |||
| Investments In Associates | 125 | |||
| Net Loans and Advances | 112 | |||
| News Release | 5 | |||
| Note to the Cash Flow Statement | 111 | |||
| Operating Expenses | 107 | |||
| Profit Reconciliation | 91 | |||
| Provision for Credit Impairment | 113 | |||
| Related Party Disclosures | 125 | |||
| Segment Analysis | 110 | |||
| Share Capital | 123 | |||
| Shareholders’ Equity | 123 | |||
| Strategic Review | 19 | |||
| Subordinated Debt | 115 | |||
| Subsequent Events Since Balance Date | 126 | |||
| Summary | 9 | |||
| Supplementary Information – Average Balance Sheet and Related Interest | 134 | |||
| Supplementary Information – Capital Management | 130 | |||
| Supplementary Information – Derivative Financial Instruments | 138 | |||
| Supplementary Information – Exchange Rates | 138 | |||
| Supplementary Information – Full Time Equivalent Staff | 137 | |||
| Supplementary Information – Funds Management and Insurance Income Reconciliation | 137 | |||
| Supplementary Information – Principal Risks and Uncertainties | 139 | |||
152