Attached files
| file | filename |
|---|---|
| 8-K - 8-K - Conifer Holdings, Inc. | a8-k1stquarter2016slidedeck.htm |

FIRST QUARTER 2016 INVESTOR CONFERENCE CALL May 13, 2016
1 SAFE HARBOR STATEMENT This presentation contains “forward-looking” statements within the meaning of Section 27A of the Securities Act of 1933, as amended, and Section 21E of the Securities Exchange Act of 1934, as amended, that are based on our management’s beliefs and assumptions and on information currently available to management. These forward-looking statements include, without limitation, statements regarding our industry, business strategy, plans, goals and expectations concerning our market position, product expansion, future operations, margins, profitability, future efficiencies, and other financial and operating information. When used in this discussion, the words “may,” “believes,” “intends,” “seeks,” “anticipates,” “plans,” “estimates,” “expects,” “should,” “assumes,” “continues,” “potential,” “could,” “will,” “future” and the negative of these or similar terms and phrases are intended to identify forward-looking statements. Forward-looking statements involve known and unknown risks, uncertainties, inherent risks and other factors that may cause our actual results, performance or achievements to be materially different from any future results, performance or achievements expressed or implied by the forward-looking statements. Forward-looking statements represent our management’s beliefs and assumptions only as of the date of this presentation. Our actual future results may be materially different from what we expect due to factors largely outside our control, including the occurrence of severe weather conditions and other catastrophes, the cyclical nature of the insurance industry, future actions by regulators, our ability to obtain reinsurance coverage at reasonable rates and the effects of competition. These and other risks and uncertainties associated with our business are described under the heading “Risk Factors” in our Annual Report on Form 10-K for the year ended December 31, 2015, which should be read in conjunction with this presentation. The company and subsidiaries operate in a dynamic business environment, and therefore the risks identified are not meant to be exhaustive. Risk factors change and new risks emerge frequently. Except as required by law, we assume no obligation to update these forward-looking statements publicly, or to update the reasons actual results could differ materially from those anticipated in the forward-looking statements, even if new information becomes available in the future. 1
22 Results Overview Business Mix Specialty Products Financial Review
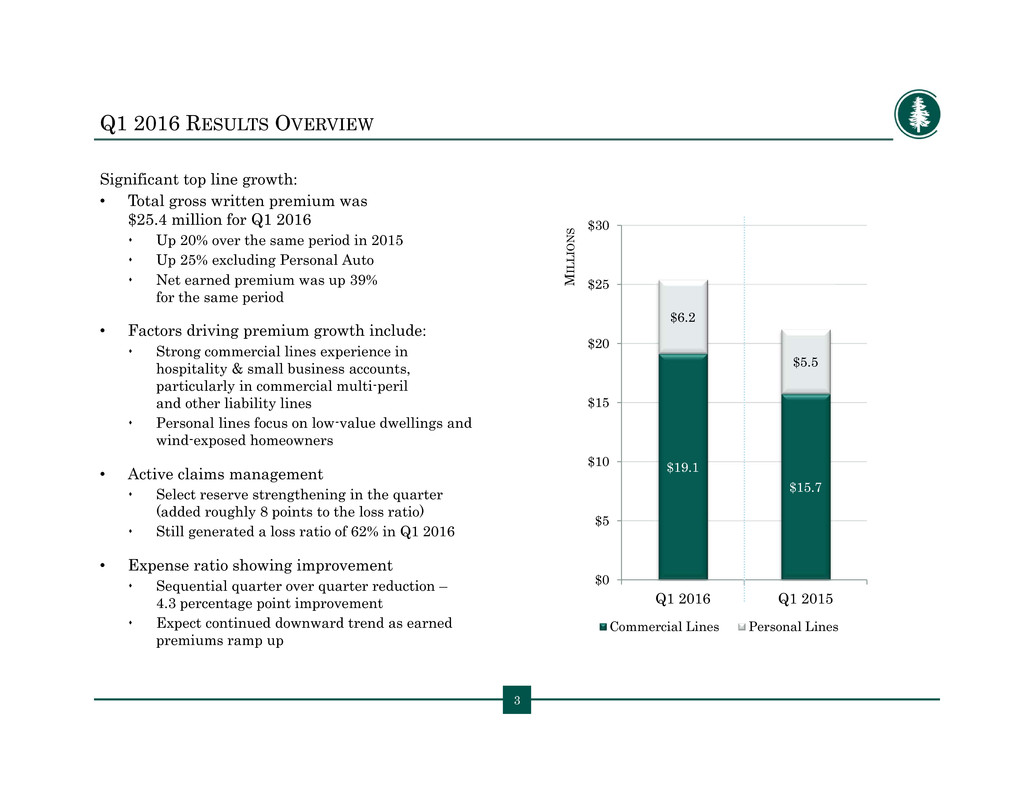
$19.1 $15.7 $6.2 $5.5 $0 $5 $10 $15 $20 $25 $30 Q1 2016 Q1 2015 M I L L I O N S Commercial Lines Personal Lines Q1 2016 RESULTS OVERVIEW Significant top line growth: • Total gross written premium was $25.4 million for Q1 2016 Up 20% over the same period in 2015 Up 25% excluding Personal Auto Net earned premium was up 39% for the same period • Factors driving premium growth include: Strong commercial lines experience in hospitality & small business accounts, particularly in commercial multi-peril and other liability lines Personal lines focus on low-value dwellings and wind-exposed homeowners • Active claims management Select reserve strengthening in the quarter (added roughly 8 points to the loss ratio) Still generated a loss ratio of 62% in Q1 2016 • Expense ratio showing improvement Sequential quarter over quarter reduction – 4.3 percentage point improvement Expect continued downward trend as earned premiums ramp up 3

4 SHIFTING BUSINESS MIX TO IMPROVE PROFITABILITY • Private Passenger Auto impact (in run-off): added 2.8 percentage points to Q1 2016 loss ratio • Reserve strengthening impact: added 7.9 percentage points to Q1 2016 loss ratio • Even with full impact of above, loss ratio was 62.4% for Q1 2016 56.1% 54.1% 81.9% 63.4%62.4% 57.2% Q1 2016 Q1 2015 Commercial Lines Personal Lines Consolidated RESULTS OVERVIEW: Q1 2016 4 Loss Ratio Target: 55%

55 Results Overview Business Mix Specialty Products Financial Review

6 75.4% 24.6% Commercial Lines Personal Lines BUSINESS MIX Gross Written Premium Commercial Multi-Peril, 47.7% Other Liability, 13.4% Commercial Auto, 10.0% Other Commercial, 4.3% Wind-Exposed, 15.5% Low-Value Dwelling, 9.1%

77 Results Overview Business Mix Specialty Products Financial Review
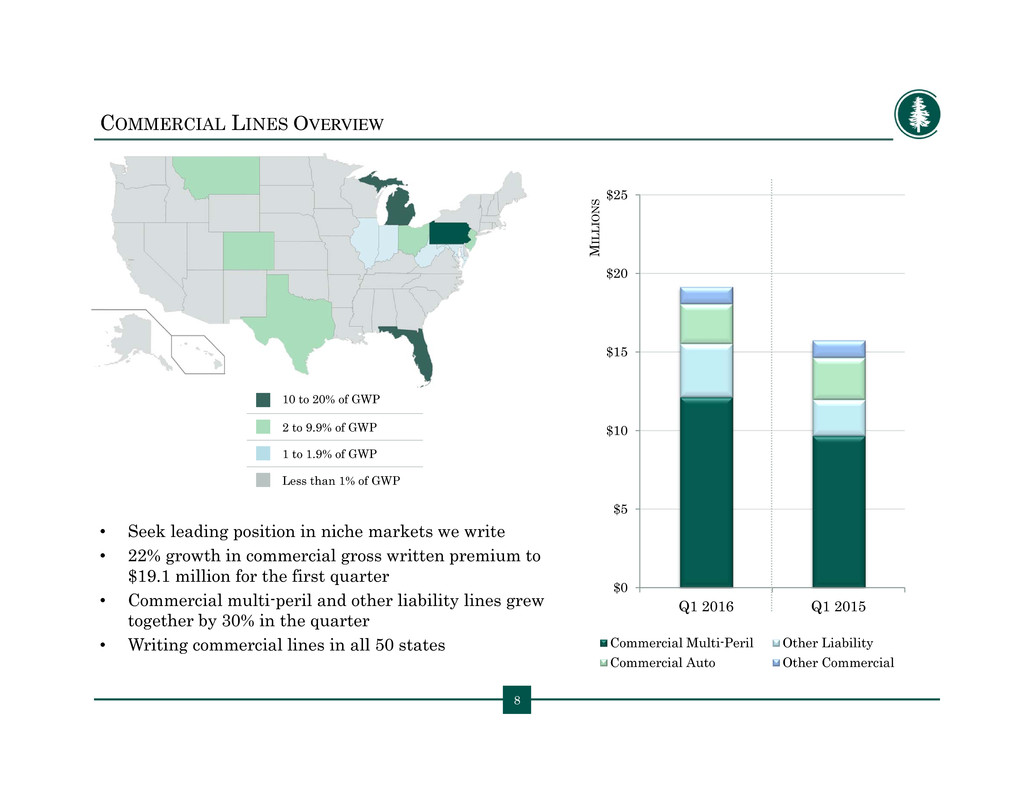
$0 $5 $10 $15 $20 $25 Q1 2016 Q1 2015 M I L L I O N S Commercial Multi-Peril Other Liability Commercial Auto Other Commercial COMMERCIAL LINES OVERVIEW • Seek leading position in niche markets we write • 22% growth in commercial gross written premium to $19.1 million for the first quarter • Commercial multi-peril and other liability lines grew together by 30% in the quarter • Writing commercial lines in all 50 states 8 10 to 20% of GWP 2 to 9.9% of GWP 1 to 1.9% of GWP Less than 1% of GWP
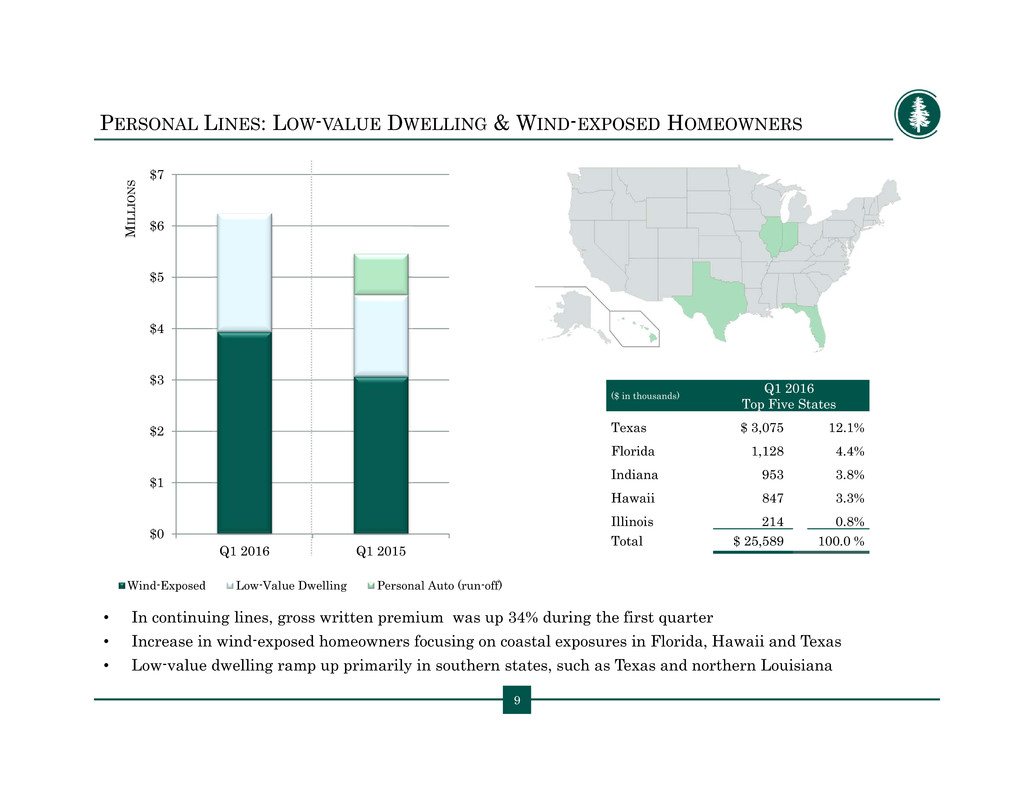
$0 $1 $2 $3 $4 $5 $6 $7 Q1 2016 Q1 2015 M I L L I O N S Wind-Exposed Low-Value Dwelling Personal Auto (run-off) • In continuing lines, gross written premium was up 34% during the first quarter • Increase in wind-exposed homeowners focusing on coastal exposures in Florida, Hawaii and Texas • Low-value dwelling ramp up primarily in southern states, such as Texas and northern Louisiana PERSONAL LINES: LOW-VALUE DWELLING & WIND-EXPOSED HOMEOWNERS ($ in thousands) Q1 2016 Top Five States Texas $ 3,075 12.1% Florida 1,128 4.4% Indiana 953 3.8% Hawaii 847 3.3% Illinois 214 0.8% Total $ 25,589 100.0 % 9

1010 Results Overview Business Mix Specialty Products Financial Review

11 Q1 2016 INCOME STATEMENT • Increased production in hospitality, small commercial, security services and select homeowners lines of business • 2015 investments in experienced underwriting teams are driving organic growth • Operating loss of $0.27 per diluted share for Q1 2016 • $10.08 per share, or $76.7 million, of shareholders’ equity ($ in thousands, except per share data and ratios) Three Months Ended March 31, 2016 Three Months Ended March 31, 2015 Gross Written Premium $25,393 $21,204 Net Written Premium 22,050 13,666 Net Earned Premium 20,109 14,493 Net Income (Loss) (2,028) 512 Net Income (Loss) Allocable to Common Shareholders (2,028) 250 EPS, Basic and Diluted (0.27) 0.06 Operating Income (Loss) (2,020) 105 Operating Income (Loss) per share (0.27) 0.02 11
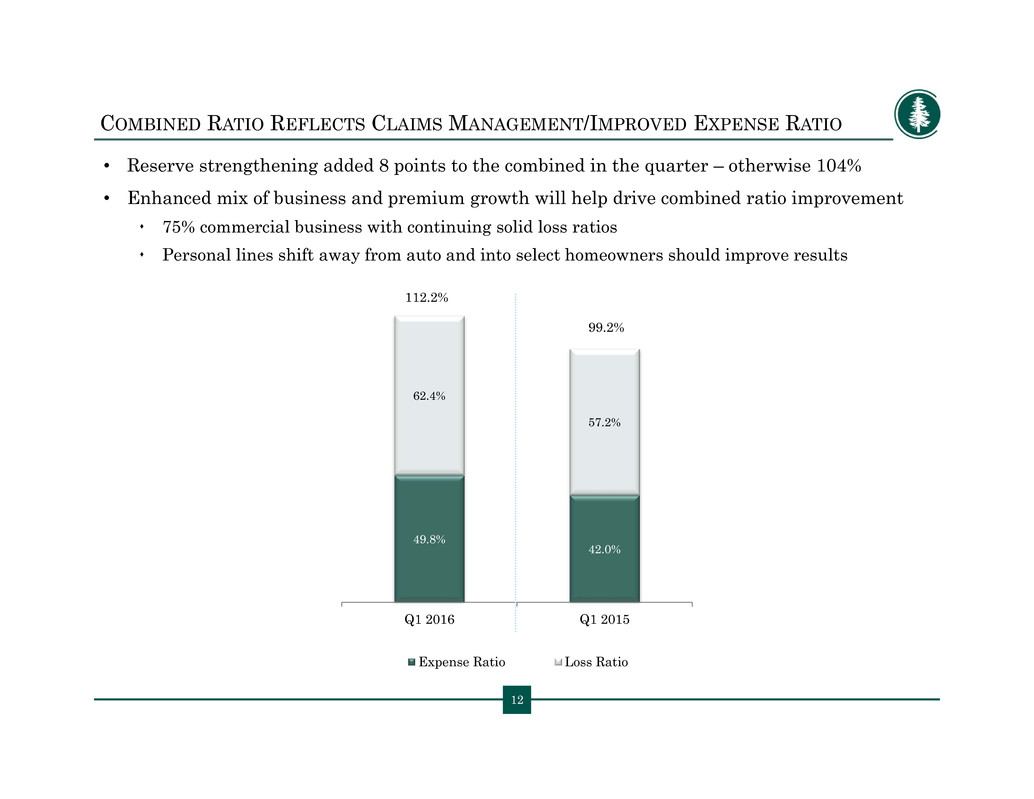
12 49.8% 42.0% 62.4% 57.2% Q1 2016 Q1 2015 Expense Ratio Loss Ratio COMBINED RATIO REFLECTS CLAIMS MANAGEMENT/IMPROVED EXPENSE RATIO • Reserve strengthening added 8 points to the combined in the quarter – otherwise 104% • Enhanced mix of business and premium growth will help drive combined ratio improvement 75% commercial business with continuing solid loss ratios Personal lines shift away from auto and into select homeowners should improve results 12 112.2% 99.2%
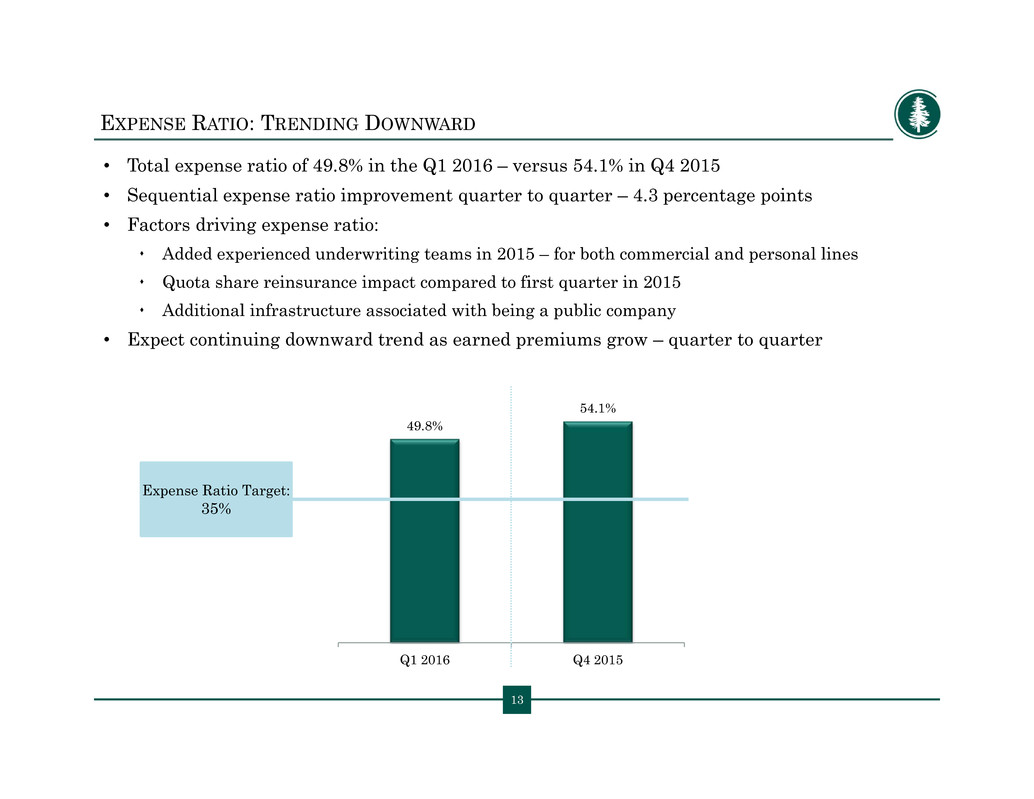
13 49.8% 54.1% Q1 2016 Q4 2015 EXPENSE RATIO: TRENDING DOWNWARD • Total expense ratio of 49.8% in the Q1 2016 – versus 54.1% in Q4 2015 • Sequential expense ratio improvement quarter to quarter – 4.3 percentage points • Factors driving expense ratio: Added experienced underwriting teams in 2015 – for both commercial and personal lines Quota share reinsurance impact compared to first quarter in 2015 Additional infrastructure associated with being a public company • Expect continuing downward trend as earned premiums grow – quarter to quarter 13 Expense Ratio Target: 35%
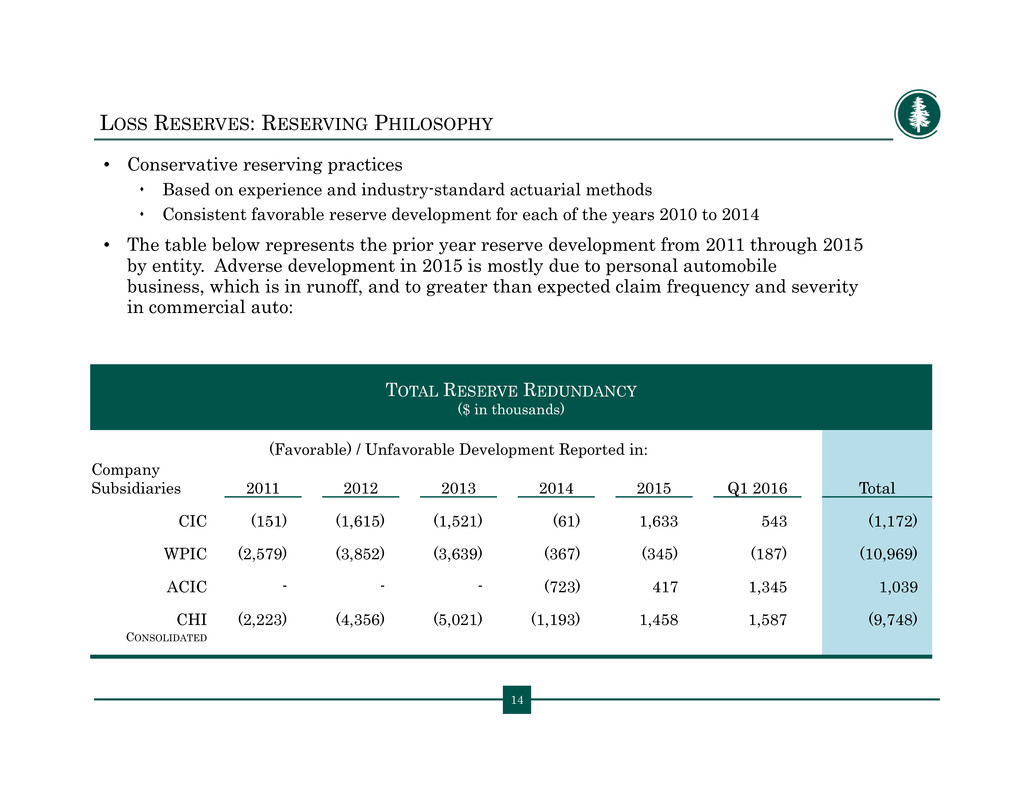
14 LOSS RESERVES: RESERVING PHILOSOPHY • Conservative reserving practices Based on experience and industry-standard actuarial methods Consistent favorable reserve development for each of the years 2010 to 2014 • The table below represents the prior year reserve development from 2011 through 2015 by entity. Adverse development in 2015 is mostly due to personal automobile business, which is in runoff, and to greater than expected claim frequency and severity in commercial auto: TOTAL RESERVE REDUNDANCY ($ in thousands) (Favorable) / Unfavorable Development Reported in: Company Subsidiaries 2011 2012 2013 2014 2015 Q1 2016 Total CIC (151) (1,615) (1,521) (61) 1,633 543 (1,172) WPIC (2,579) (3,852) (3,639) (367) (345) (187) (10,969) ACIC - - - (723) 417 1,345 1,039 CHI (2,223) (4,356) (5,021) (1,193) 1,458 1,587 (9,748) CONSOLIDATED

15 CONSERVATIVE INVESTMENT STRATEGY • Investment philosophy is to maintain a highly liquid portfolio of investment-grade fixed income securities • Total cash & investment securities of $135M at March 31, 2016: Average duration: 3.1 years Average tax-equivalent yield: ~2% Average credit quality: AA FIXED INCOME PORTFOLIO CREDIT RATING ($ in thousands) March 31, 2016 Fair Value % of Total AAA $ 31,823 28% AA 41,556 36% A 24,585 22% BBB 15,760 14% TOTAL FIXED INCOME INVESTMENTS $ 114,565 100% 5% 13% 33% 41% 4% 5% PORTFOLIO ALLOCATION U.S. Government Obligations State & Local Governments Corporate Debt Commercial Mortgage & Asset-Backed Securities Equity Securities Short-Term Investments

APPENDIX

18 SUMMARY FINANCIAL STATEMENTS: INCOME STATEMENT Operating Results Three Months Ended March 31, ($ in thousands, except per share data) 2016 2015 Gross written premiums $ 25,393 $ 21,204 Ceded written premiums (3,343) (7,538) Net written premiums $ 22,050 $ 13,666 Net earned premiums 20,109 14,493 Net investment income 537 486 Net realized investment & other gains (8) 145 Other income 245 489 Total revenue $ 20,883 $ 15,613 Losses and loss adjustment expenses, net 12,699 8,570 Policy acquisition costs 6,003 2,595 Operating expenses 4,139 3,692 Interest expense 157 244 Total expenses $ 22,998 $ 15,101 Income (loss) before income taxes (2,028) 512 Income tax expense (benefit) -- -- Equity earnings 87 -- Net income (loss) $ (2,028) $ 512 Less net income (loss) attributable to non-controlling interest -- 49 Net income (loss) attributable to Conifer (2,028) 463 Net income (loss) allocable to common shareholders $ (2,028) $ 250 Income (loss) per share allocable to common shareholders, basic and diluted $ (0.27) $ (0.06) Weighted average common shares outstanding, basic and diluted 7,638,780 4,040,872 18

19 FINANCIAL RESULTS: CHI CONSOLIDATED BALANCE SHEET Summary Balance Sheet ($ in thousands) March 31, 2016 March 31, 2015 Cash and invested assets $ 135,036 $ 124,021 Reinsurance recoverables 6,054 6,814 Goodwill and intangible assets 1,422 2,257 Total assets $ 184,024 $ 165,753 Unpaid losses and loss adjustment expenses 38,488 32,987 Unearned premiums 49,763 43,612 Senior debt 13,250 28,212 Total liabilities $ 107,275 $ 113,879 Preferred stock -- 6,180 Total shareholders' equity $76,749 $ 51,874
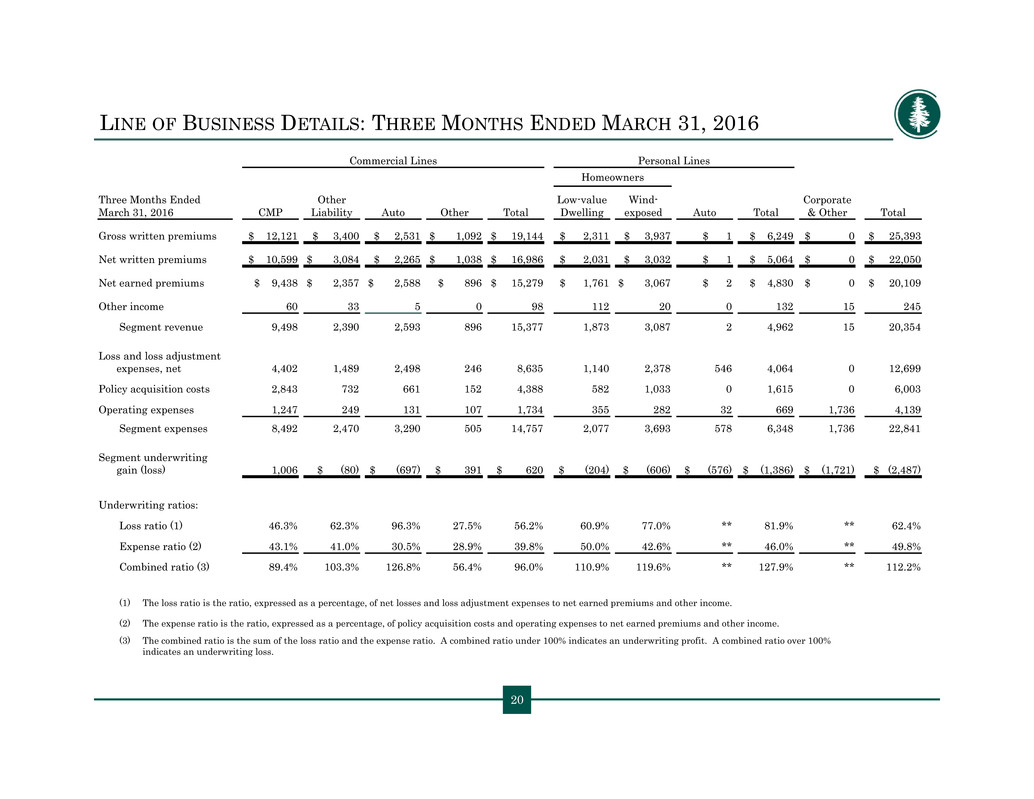
20 LINE OF BUSINESS DETAILS: THREE MONTHS ENDED MARCH 31, 2016 Commercial Lines Personal Lines Homeowners Three Months Ended March 31, 2016 CMP Other Liability Auto Other Total Low-value Dwelling Wind- exposed Auto Total Corporate & Other Total Gross written premiums $ 12,121 $ 3,400 $ 2,531 $ 1,092 $ 19,144 $ 2,311 $ 3,937 $ 1 $ 6,249 $ 0 $ 25,393 Net written premiums $ 10,599 $ 3,084 $ 2,265 $ 1,038 $ 16,986 $ 2,031 $ 3,032 $ 1 $ 5,064 $ 0 $ 22,050 Net earned premiums $ 9,438 $ 2,357 $ 2,588 $ 896 $ 15,279 $ 1,761 $ 3,067 $ 2 $ 4,830 $ 0 $ 20,109 Other income 60 33 5 0 98 112 20 0 132 15 245 Segment revenue 9,498 2,390 2,593 896 15,377 1,873 3,087 2 4,962 15 20,354 Loss and loss adjustment expenses, net 4,402 1,489 2,498 246 8,635 1,140 2,378 546 4,064 0 12,699 Policy acquisition costs 2,843 732 661 152 4,388 582 1,033 0 1,615 0 6,003 Operating expenses 1,247 249 131 107 1,734 355 282 32 669 1,736 4,139 Segment expenses 8,492 2,470 3,290 505 14,757 2,077 3,693 578 6,348 1,736 22,841 Segment underwriting gain (loss) 1,006 $ (80) $ (697) $ 391 $ 620 $ (204) $ (606) $ (576) $ (1,386) $ (1,721) $ (2,487) Underwriting ratios: Loss ratio (1) 46.3% 62.3% 96.3% 27.5% 56.2% 60.9% 77.0% ** 81.9% ** 62.4% Expense ratio (2) 43.1% 41.0% 30.5% 28.9% 39.8% 50.0% 42.6% ** 46.0% ** 49.8% Combined ratio (3) 89.4% 103.3% 126.8% 56.4% 96.0% 110.9% 119.6% ** 127.9% ** 112.2% (1) The loss ratio is the ratio, expressed as a percentage, of net losses and loss adjustment expenses to net earned premiums and other income. (2) The expense ratio is the ratio, expressed as a percentage, of policy acquisition costs and operating expenses to net earned premiums and other income. (3) The combined ratio is the sum of the loss ratio and the expense ratio. A combined ratio under 100% indicates an underwriting profit. A combined ratio over 100% indicates an underwriting loss.
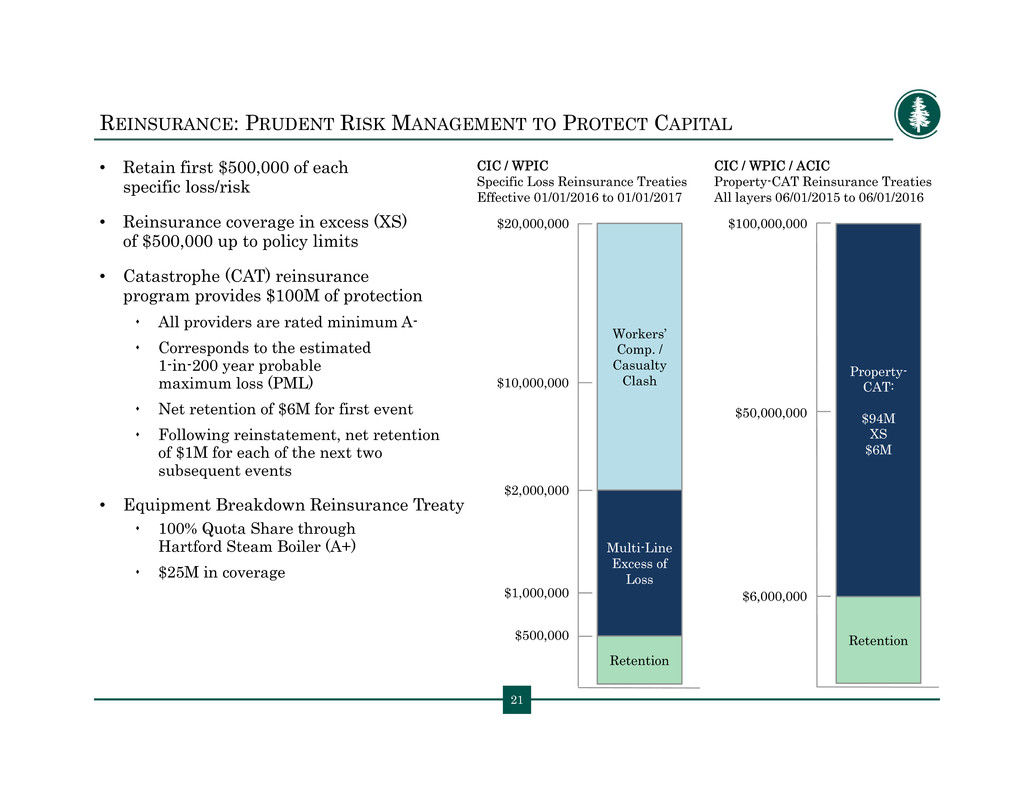
21 REINSURANCE: PRUDENT RISK MANAGEMENT TO PROTECT CAPITAL • Retain first $500,000 of each specific loss/risk • Reinsurance coverage in excess (XS) of $500,000 up to policy limits • Catastrophe (CAT) reinsurance program provides $100M of protection All providers are rated minimum A- Corresponds to the estimated 1-in-200 year probable maximum loss (PML) Net retention of $6M for first event Following reinstatement, net retention of $1M for each of the next two subsequent events • Equipment Breakdown Reinsurance Treaty 100% Quota Share through Hartford Steam Boiler (A+) $25M in coverage $50,000,000 $100,000,000 Retention Property- CAT: $94M XS $6M $6,000,000 $2,000,000 $20,000,000 $500,000 $1,000,000 $10,000,000 Multi-Line Excess of Loss Workers’ Comp. / Casualty Clash Retention CIC / WPIC Specific Loss Reinsurance Treaties Effective 01/01/2016 to 01/01/2017 CIC / WPIC / ACIC Property-CAT Reinsurance Treaties All layers 06/01/2015 to 06/01/2016

22 REINSURANCE: PRUDENT RISK MANAGEMENT TO PROTECT CAPITAL Commercial Property Per Risk Reinsurance Treaty Effective 07/01/15 to 07/01/16 $2,000,000 $500,000 $1,000,000 Retention Multi-Line Excess of Loss Property Per Risk Multi-Line Excess of Loss $4,000,000 Homeowners Property Per Risk Reinsurance Treaty Effective 11/01/14 to 01/01/17 $300,000 Retention Property $3,000,000
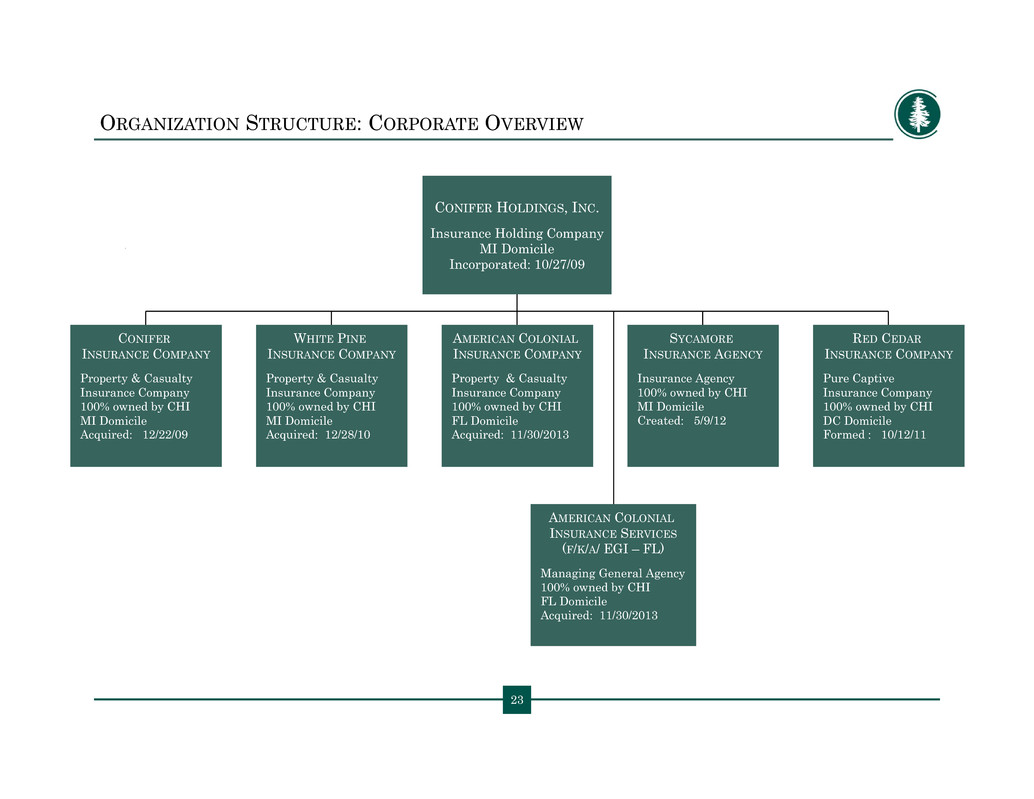
23 ORGANIZATION STRUCTURE: CORPORATE OVERVIEW CONIFER HOLDINGS, INC. Insurance Holding Company MI Domicile Incorporated: 10/27/09 RED CEDAR INSURANCE COMPANY Pure Captive Insurance Company 100% owned by CHI DC Domicile Formed : 10/12/11 WHITE PINE INSURANCE COMPANY Property & Casualty Insurance Company 100% owned by CHI MI Domicile Acquired: 12/28/10 AMERICAN COLONIAL INSURANCE COMPANY Property & Casualty Insurance Company 100% owned by CHI FL Domicile Acquired: 11/30/2013 SYCAMORE INSURANCE AGENCY Insurance Agency 100% owned by CHI MI Domicile Created: 5/9/12 CONIFER INSURANCE COMPANY Property & Casualty Insurance Company 100% owned by CHI MI Domicile Acquired: 12/22/09 AMERICAN COLONIAL INSURANCE SERVICES (F/K/A/ EGI – FL) Managing General Agency 100% owned by CHI FL Domicile Acquired: 11/30/2013
