Attached files
| file | filename |
|---|---|
| 8-K - 8-K - Premier, Inc. | d179659d8k.htm |
| EX-99.4 - EX-99.4 - Premier, Inc. | d179659dex994.htm |
| EX-99.2 - EX-99.2 - Premier, Inc. | d179659dex992.htm |
| EX-99.1 - EX-99.1 - Premier, Inc. | d179659dex991.htm |
May 10, 2016 Third-Quarter Fiscal 2016 Financial Results and Update Exhibit 99.3
Forward-looking statements—Certain statements included in this presentation, including, but not limited to, those related to our financial and business outlook, strategy and growth drivers, member retention and renewal rates and revenue visibility, cross and upsell opportunities, acquisition activities and pipeline, revenue available under contract, 2016 financial guidance and related assumptions, and target growth rate are “forward-looking statements” within the meaning of the federal securities laws. Forward-looking statements may involve known and unknown risks, uncertainties and other factors that may cause the actual results of Premier to be materially different from historical results or from any future results or projections expressed or implied by such forward-looking statements. Accordingly, readers should not place undue reliance on any forward looking statements. Readers are urged to consider statements in the conditional or future tenses or that include terms such as “believes,” “belief,” “expects,” “estimates,” “intends,” “anticipates” or “plans” to be uncertain and forward-looking. Forward-looking statements may include comments as to Premier’s beliefs and expectations as to future events and trends affecting its business and are necessarily subject to uncertainties, many of which are outside Premier’s control. You should carefully read Premier’s current and future filings with the SEC for more information on potential risks and other factors that could affect Premier’s financial results. Forward-looking statements speak only as of the date they are made. Premier undertakes no obligation to publicly update or revise any forward-looking statements. Non-GAAP financial measures—This presentation includes certain “non-GAAP financial measures” as defined in Regulation G under the Securities Exchange Act of 1934. Schedules are attached that reconcile the non-GAAP financial measures included in this presentation to the most directly comparable financial measures calculated and presented in accordance with Generally Accepted Accounting Principles in the United States. You should carefully read Premier’s current and future filings with the SEC for further explanation and disclosure regarding our use of non-GAAP financial measures and such filings should be read in conjunction with this presentation. Forward-looking statements and Non-GAAP financial measures
Susan DeVore, President & CEO Overview and Business Update
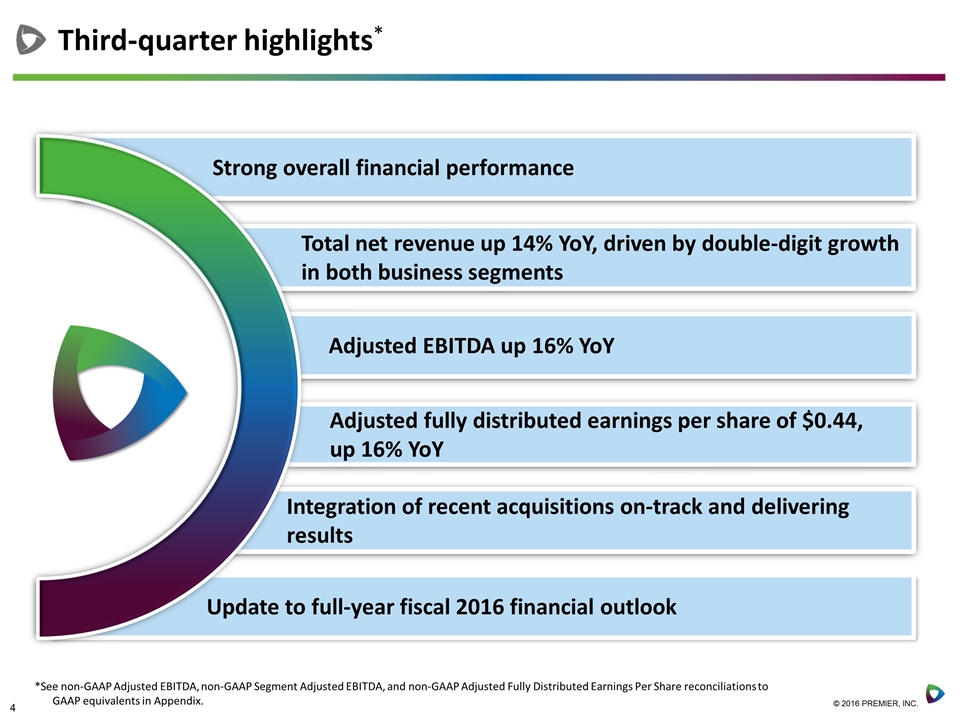
Third-quarter highlights* Total net revenue up 14% YoY, driven by double-digit growth in both business segments Adjusted fully distributed earnings per share of $0.44, up 16% YoY Adjusted EBITDA up 16% YoY Integration of recent acquisitions on-track and delivering results Update to full-year fiscal 2016 financial outlook Strong overall financial performance *See non-GAAP Adjusted EBITDA, non-GAAP Segment Adjusted EBITDA, and non-GAAP Adjusted Fully Distributed Earnings Per Share reconciliations to GAAP equivalents in Appendix.
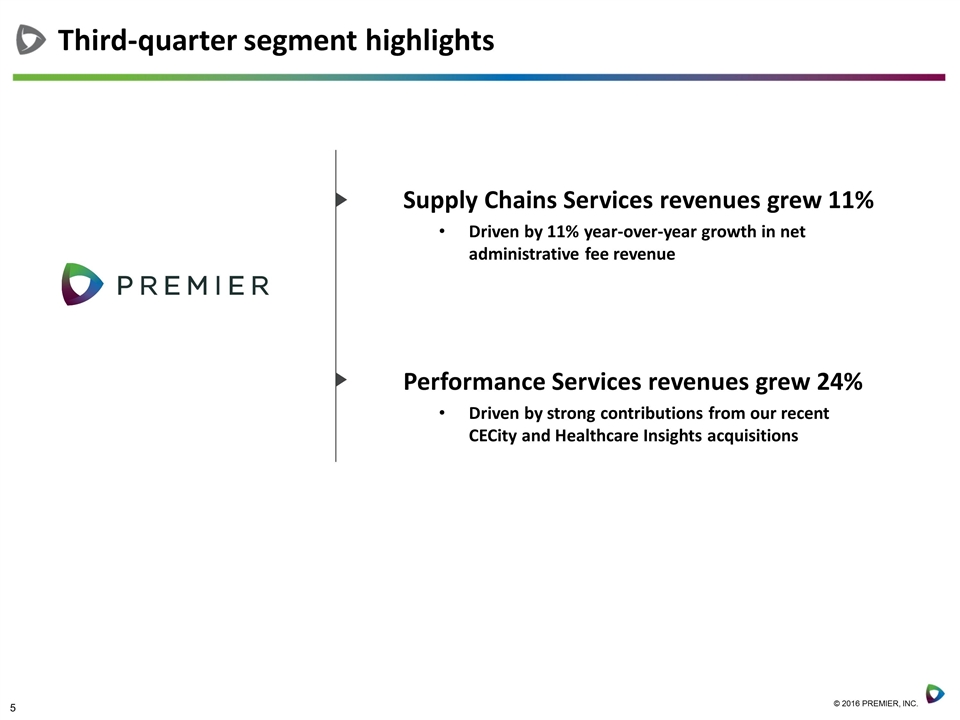
Third-quarter segment highlights Supply Chains Services revenues grew 11% Driven by 11% year-over-year growth in net administrative fee revenue Performance Services revenues grew 24% Driven by strong contributions from our recent CECity and Healthcare Insights acquisitions
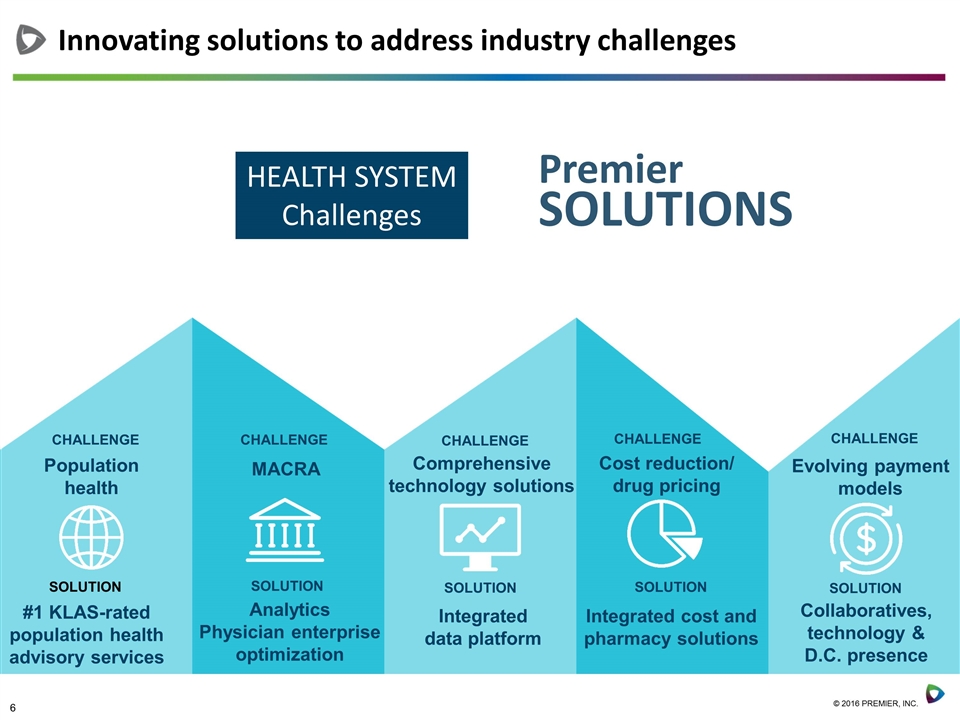
Innovating solutions to address industry challenges Premier SOLUTIONS Population health HEALTH SYSTEM Challenges #1 KLAS-rated population health advisory services CHALLENGE Analytics Physician enterprise optimization Comprehensive technology solutions Integrated data platform Integrated cost and pharmacy solutions Evolving payment models Collaboratives, technology & D.C. presence SOLUTION CHALLENGE CHALLENGE CHALLENGE CHALLENGE MACRA SOLUTION SOLUTION SOLUTION Cost reduction/ drug pricing SOLUTION
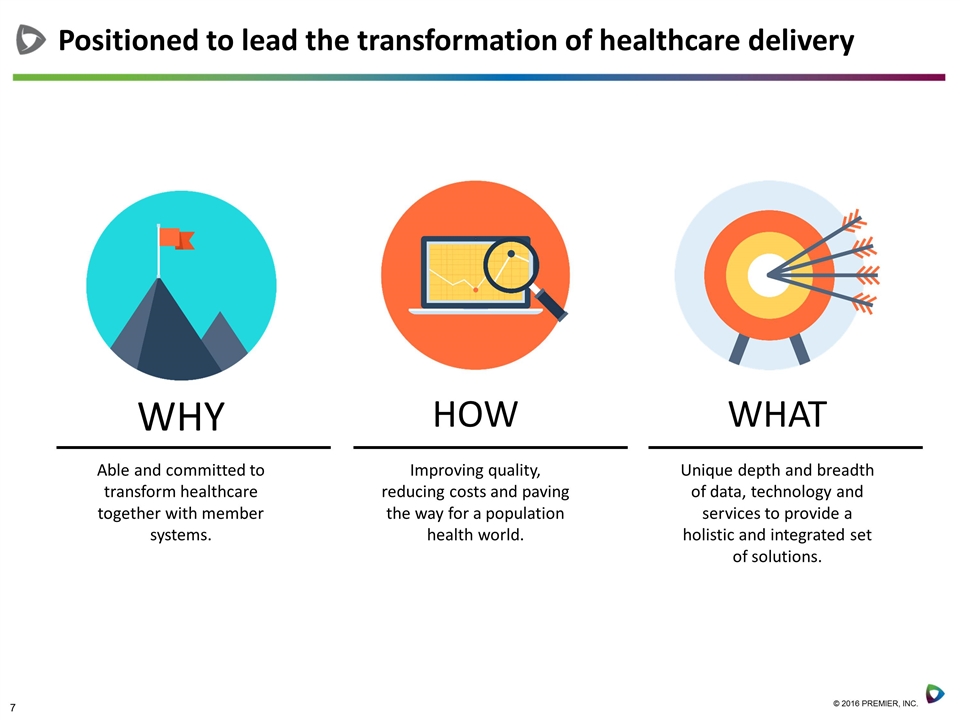
Positioned to lead the transformation of healthcare delivery WHY HOW WHAT Able and committed to transform healthcare together with member systems. Improving quality, reducing costs and paving the way for a population health world. Unique depth and breadth of data, technology and services to provide a holistic and integrated set of solutions.
Michael Alkire, Chief Operating Officer Operations Update
Strong, Long-term relationships with our members The strength of our relationships provide a roadmap for future success Member owner average tenure of over 16 years with over 80% at more than 10 years. On track to achieve continued high GPO retention and SaaS institutional renewal rates for fiscal 2016.
Major system expands relationship to include PremierConnect Supply Chain analytics across its health, academic and administrative institutions. New York’s Mount Sinai Health System expands relationship to include labor benchmarking and productivity analytics through PremierConnect platform. Rochester Regional Health expands relationship to include PremierConnect Enterprise data warehousing and analysis capabilities. Merck and CECity in collaboration to co-develop solutions to improve population health and reduce the cost of patient care. Third-quarter achievements
Craig McKasson, Chief Financial Officer Financial Review
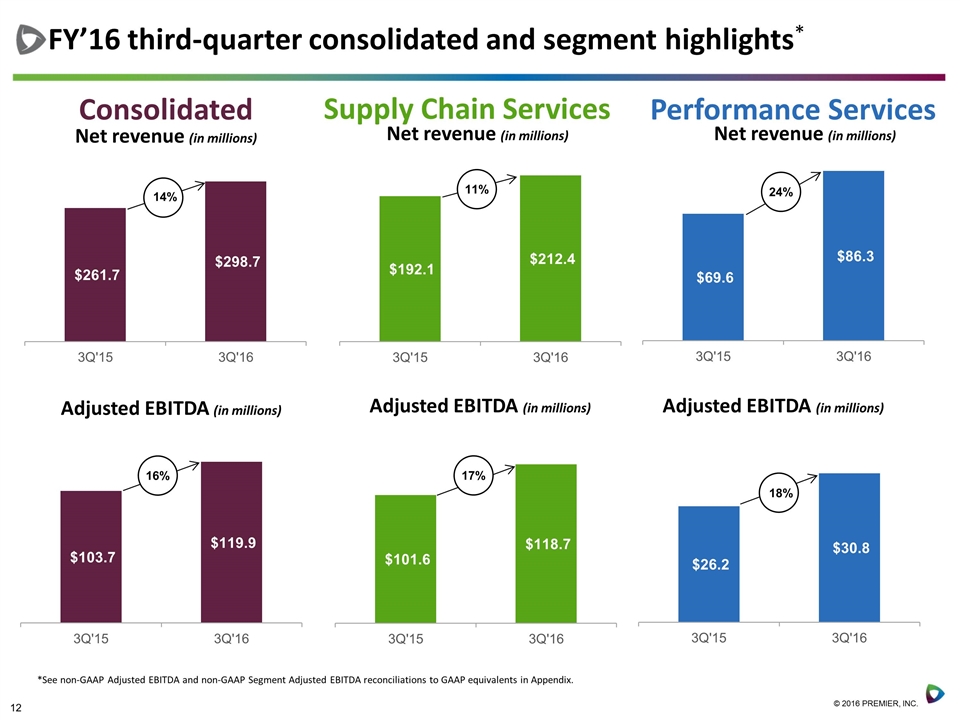
FY’16 third-quarter consolidated and segment highlights* Consolidated Net revenue (in millions) Supply Chain Services Net revenue (in millions) Performance Services Net revenue (in millions) Adjusted EBITDA (in millions) Adjusted EBITDA (in millions) Adjusted EBITDA (in millions) *See non-GAAP Adjusted EBITDA and non-GAAP Segment Adjusted EBITDA reconciliations to GAAP equivalents in Appendix. 14% 16% 11% 17% 24% 18%
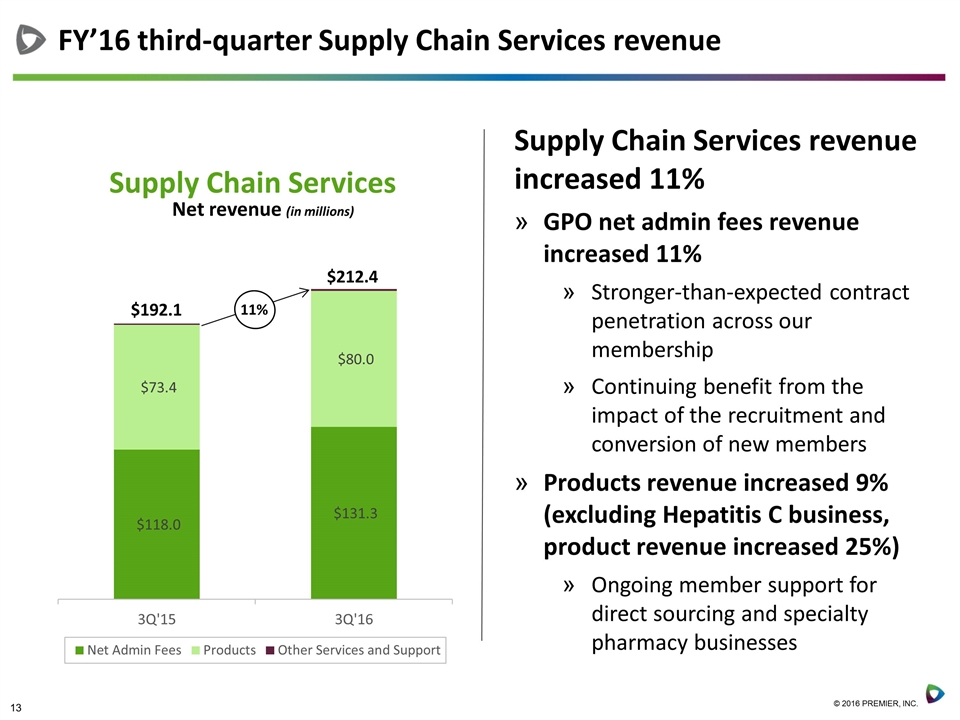
FY’16 third-quarter Supply Chain Services revenue Supply Chain Services revenue increased 11% GPO net admin fees revenue increased 11% Stronger-than-expected contract penetration across our membership Continuing benefit from the impact of the recruitment and conversion of new members Products revenue increased 9% (excluding Hepatitis C business, product revenue increased 25%) Ongoing member support for direct sourcing and specialty pharmacy businesses Supply Chain Services Net revenue (in millions) 11% $192.1 $212.4
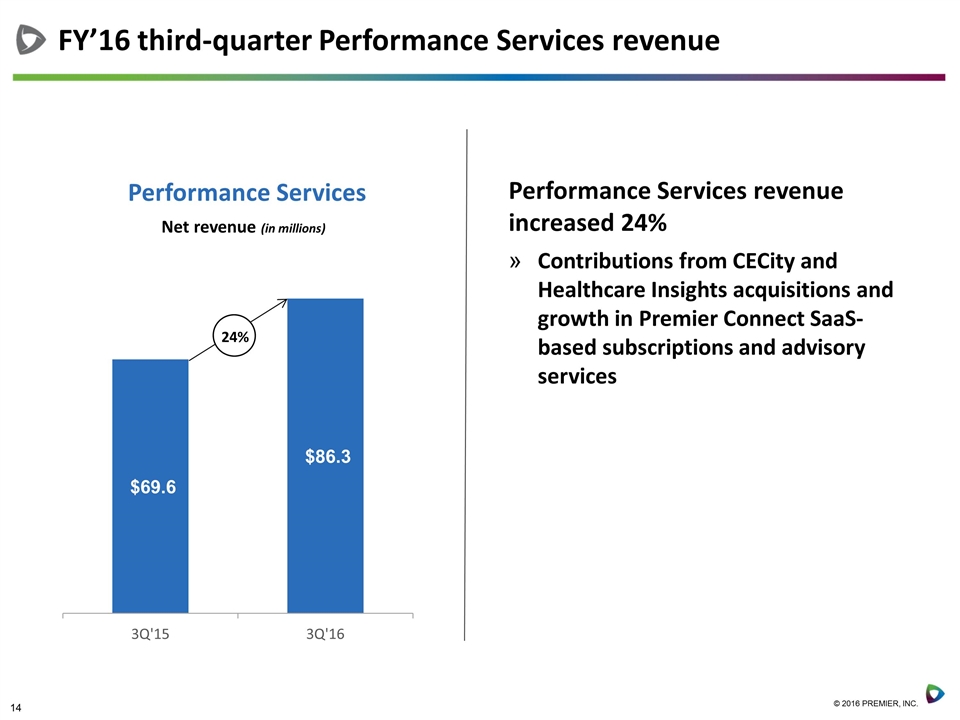
FY’16 third-quarter Performance Services revenue Performance Services revenue increased 24% Contributions from CECity and Healthcare Insights acquisitions and growth in Premier Connect SaaS-based subscriptions and advisory services Performance Services Net revenue (in millions) 24%
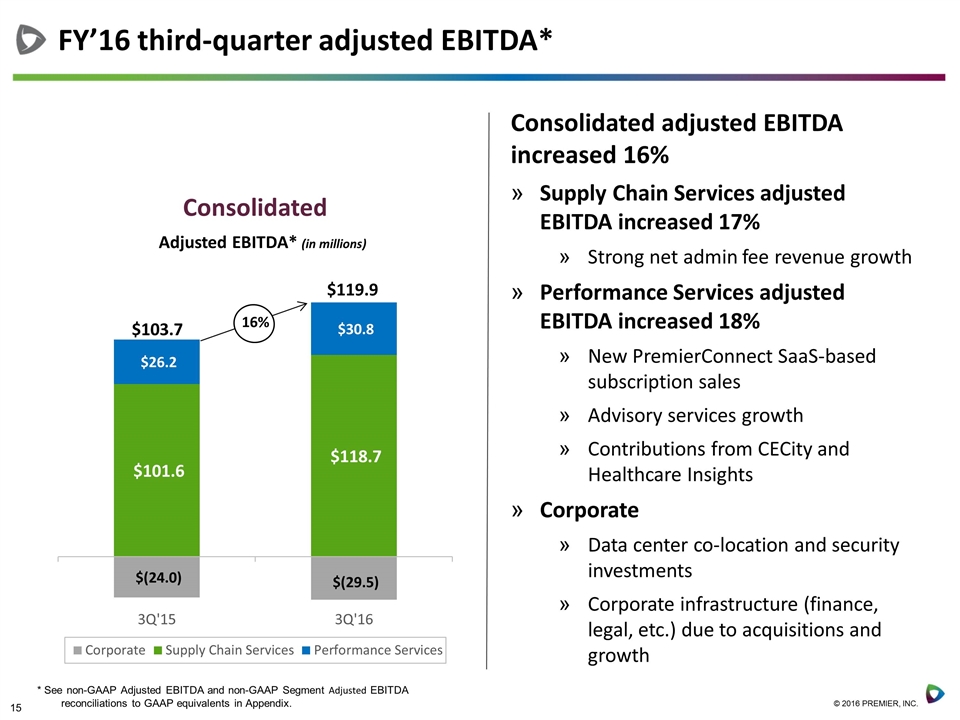
FY’16 third-quarter adjusted EBITDA* Consolidated adjusted EBITDA increased 16% Supply Chain Services adjusted EBITDA increased 17% Strong net admin fee revenue growth Performance Services adjusted EBITDA increased 18% New PremierConnect SaaS-based subscription sales Advisory services growth Contributions from CECity and Healthcare Insights Corporate Data center co-location and security investments Corporate infrastructure (finance, legal, etc.) due to acquisitions and growth Consolidated Adjusted EBITDA* (in millions) 16% $103.7 $119.9 * See non-GAAP Adjusted EBITDA and non-GAAP Segment Adjusted EBITDA reconciliations to GAAP equivalents in Appendix.
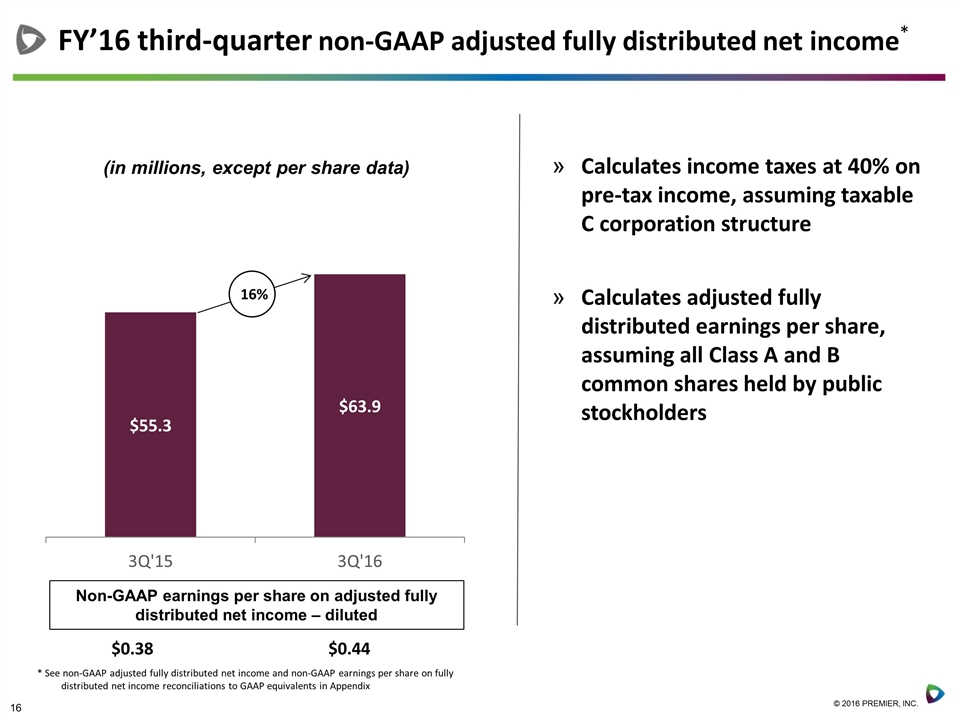
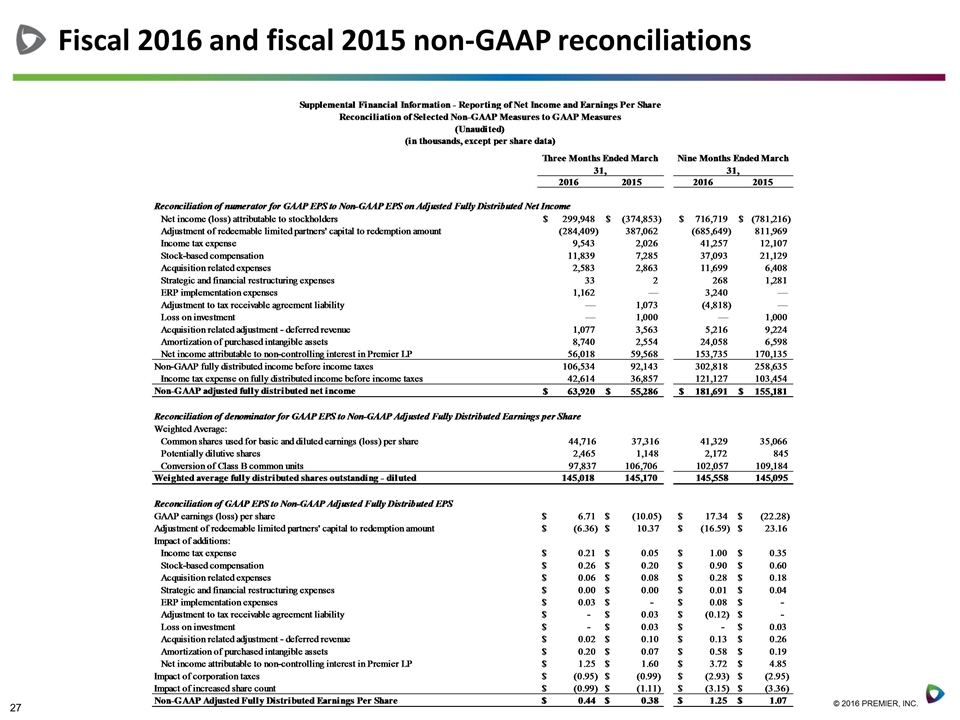
FY’16 third-quarter non-GAAP adjusted fully distributed net income* 16% $0.38 $0.44 Non-GAAP earnings per share on adjusted fully distributed net income – diluted * See non-GAAP adjusted fully distributed net income and non-GAAP earnings per share on fully distributed net income reconciliations to GAAP equivalents in Appendix Calculates income taxes at 40% on pre-tax income, assuming taxable C corporation structure Calculates adjusted fully distributed earnings per share, assuming all Class A and B common shares held by public stockholders
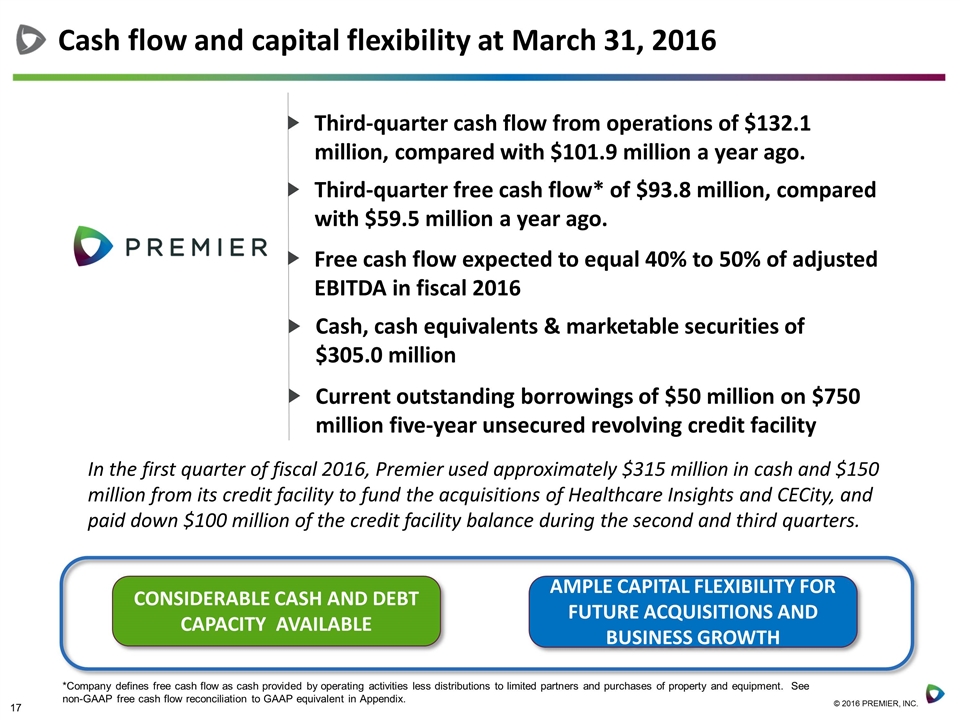
Third-quarter cash flow from operations of $132.1 million, compared with $101.9 million a year ago. Cash flow and capital flexibility at March 31, 2016 CONSIDERABLE CASH AND DEBT CAPACITY AVAILABLE AMPLE CAPITAL FLEXIBILITY FOR FUTURE ACQUISITIONS AND BUSINESS GROWTH Third-quarter free cash flow* of $93.8 million, compared with $59.5 million a year ago. Cash, cash equivalents & marketable securities of $305.0 million Current outstanding borrowings of $50 million on $750 million five-year unsecured revolving credit facility In the first quarter of fiscal 2016, Premier used approximately $315 million in cash and $150 million from its credit facility to fund the acquisitions of Healthcare Insights and CECity, and paid down $100 million of the credit facility balance during the second and third quarters. Free cash flow expected to equal 40% to 50% of adjusted EBITDA in fiscal 2016 *Company defines free cash flow as cash provided by operating activities less distributions to limited partners and purchases of property and equipment. See non-GAAP free cash flow reconciliation to GAAP equivalent in Appendix.
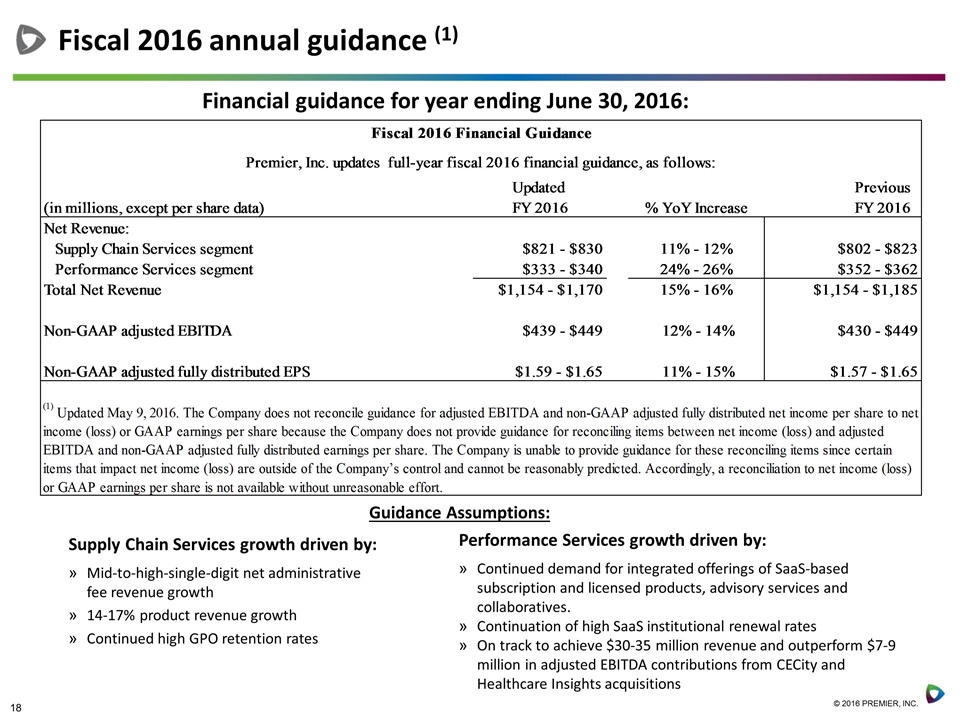
Fiscal 2016 annual guidance (1) Financial guidance for year ending June 30, 2016: Supply Chain Services growth driven by: Mid-to-high-single-digit net administrative fee revenue growth 14-17% product revenue growth Continued high GPO retention rates Guidance Assumptions: Performance Services growth driven by: Continued demand for integrated offerings of SaaS-based subscription and licensed products, advisory services and collaboratives. Continuation of high SaaS institutional renewal rates On track to achieve $30-35 million revenue and outperform $7-9 million in adjusted EBITDA contributions from CECity and Healthcare Insights acquisitions
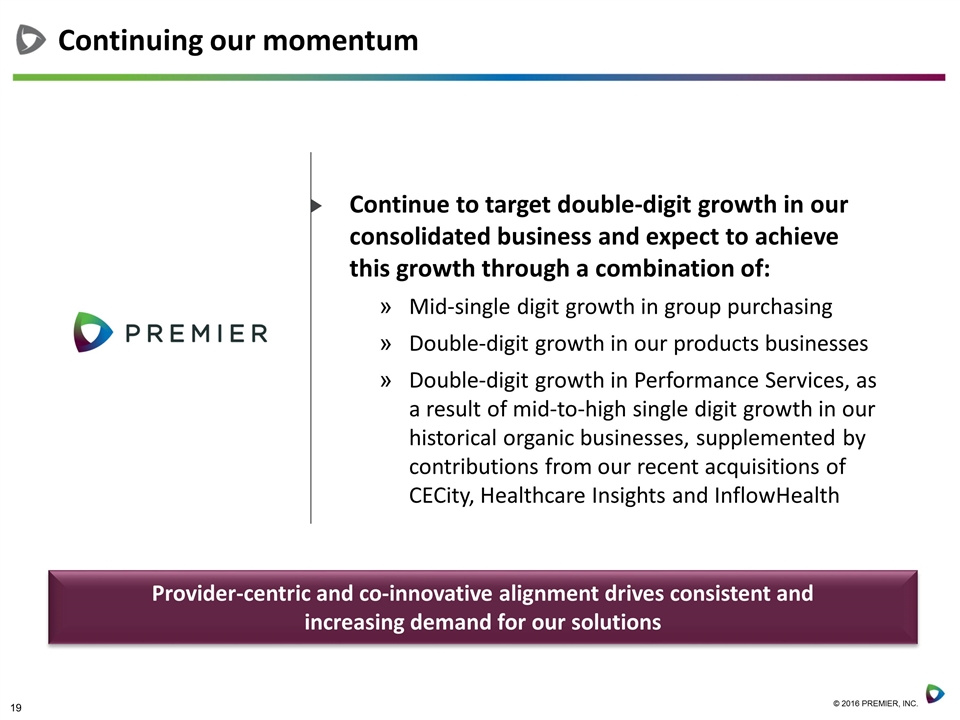
Continuing our momentum Continue to target double-digit growth in our consolidated business and expect to achieve this growth through a combination of: Mid-single digit growth in group purchasing Double-digit growth in our products businesses Double-digit growth in Performance Services, as a result of mid-to-high single digit growth in our historical organic businesses, supplemented by contributions from our recent acquisitions of CECity, Healthcare Insights and InflowHealth Provider-centric and co-innovative alignment drives consistent and increasing demand for our solutions
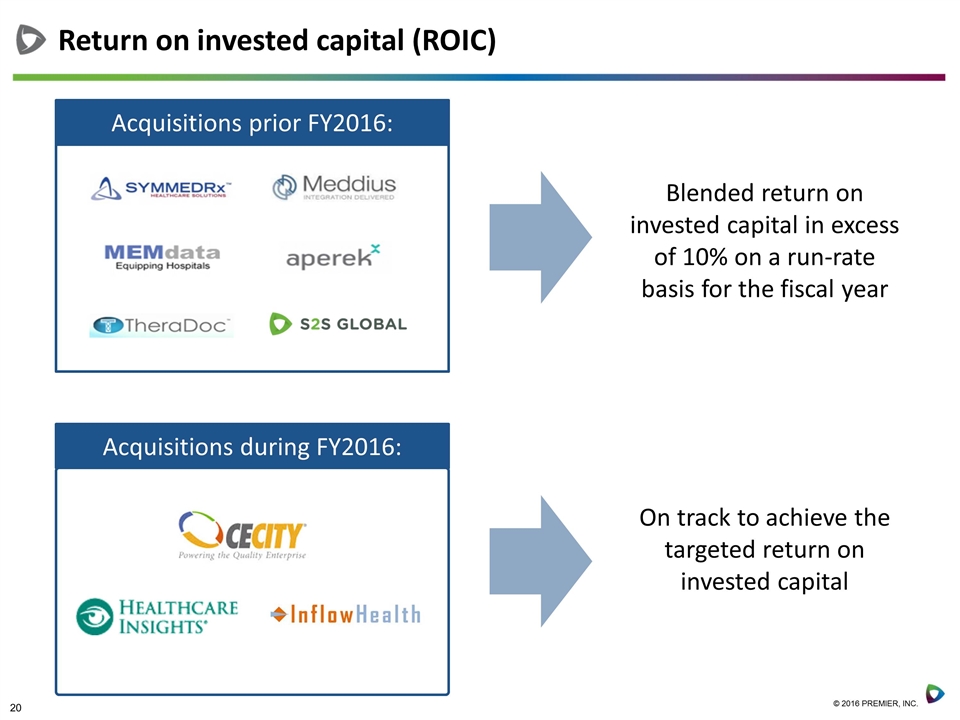
Acquisitions during FY2016: Return on invested capital (ROIC) Acquisitions prior FY2016: Blended return on invested capital in excess of 10% on a run-rate basis for the fiscal year On track to achieve the targeted return on invested capital
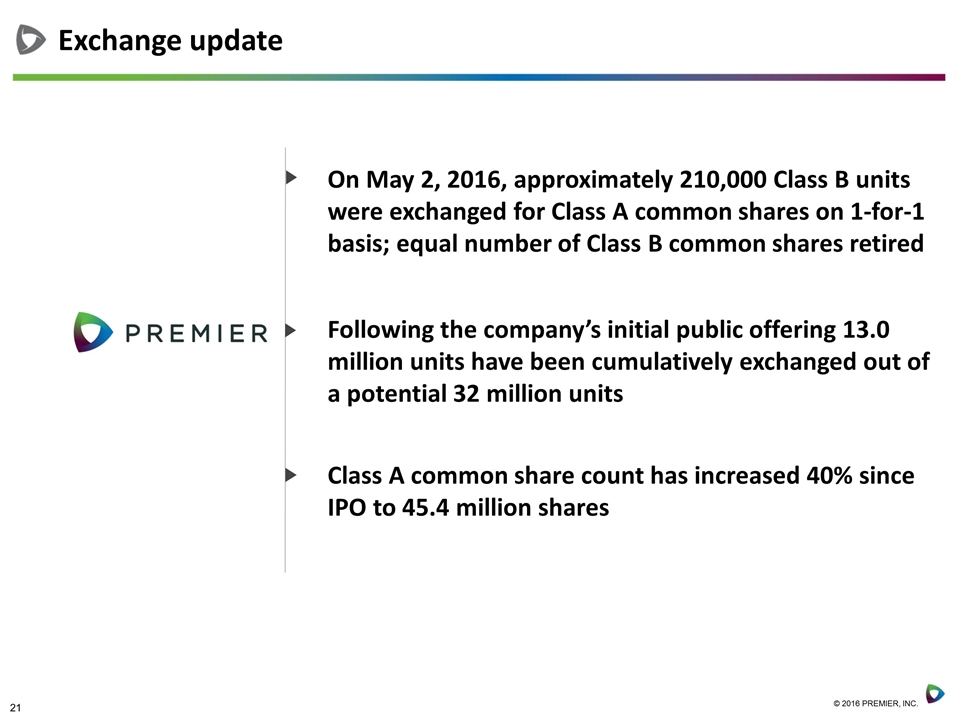
Exchange update On May 2, 2016, approximately 210,000 Class B units were exchanged for Class A common shares on 1-for-1 basis; equal number of Class B common shares retired Following the company’s initial public offering 13.0 million units have been cumulatively exchanged out of a potential 32 million units Class A common share count has increased 40% since IPO to 45.4 million shares
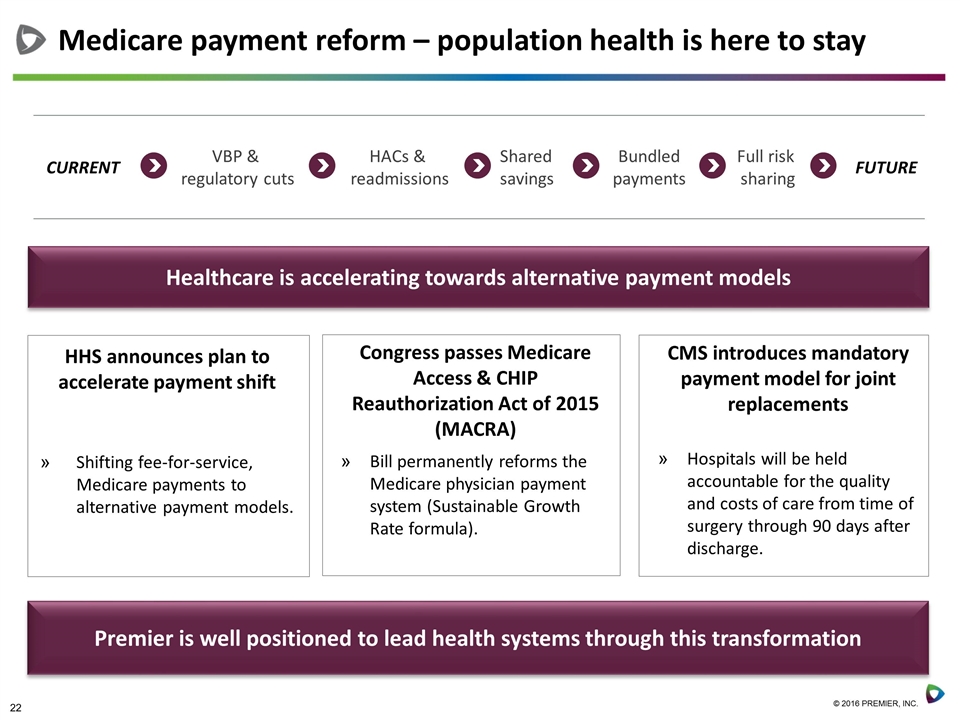
Healthcare is accelerating towards alternative payment models CURRENT VBP & regulatory cuts HACs & readmissions Shared savings Bundled payments Full risk sharing FUTURE HHS announces plan to accelerate payment shift Shifting fee-for-service, Medicare payments to alternative payment models. Congress passes Medicare Access & CHIP Reauthorization Act of 2015 (MACRA) Bill permanently reforms the Medicare physician payment system (Sustainable Growth Rate formula). Medicare payment reform – population health is here to stay Premier is well positioned to lead health systems through this transformation CMS introduces mandatory payment model for joint replacements Hospitals will be held accountable for the quality and costs of care from time of surgery through 90 days after discharge.

Questions
Appendix
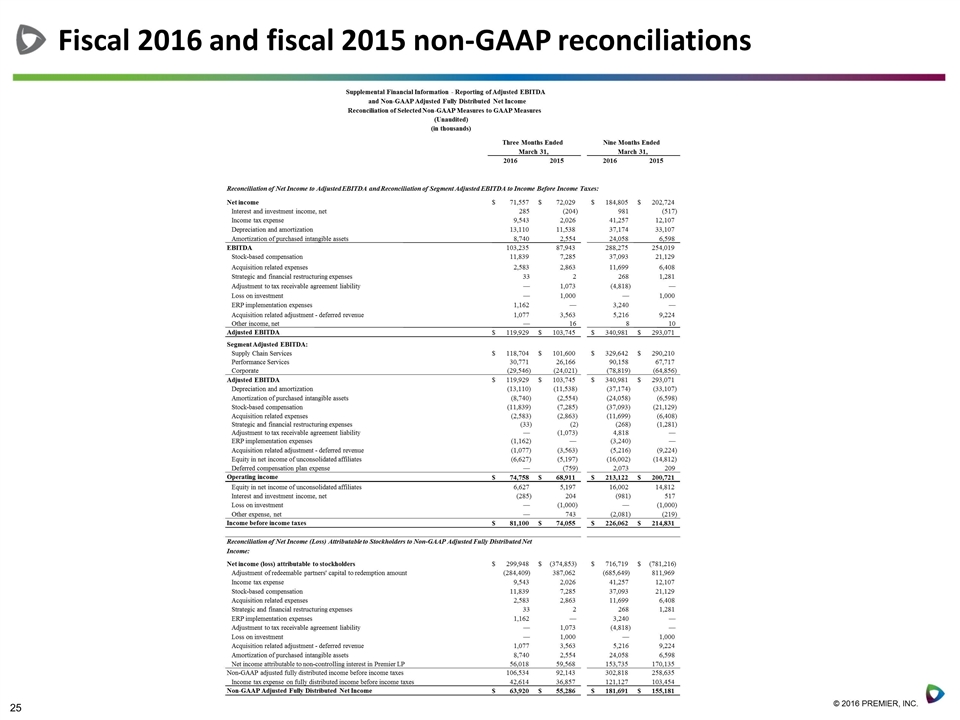
Fiscal 2016 and fiscal 2015 non-GAAP reconciliations 2016 2015 2016 2015 Net income 71,557 $ 72,029 $ 184,805 $ 202,724 $ Interest and investment income, net 285 (204) 981 (517) Income tax expense 9,543 2,026 41,257 12,107 Depreciation and amortization 13,110 11,538 37,174 33,107 Amortization of purchased intangible assets 8,740 2,554 24,058 6,598 EBITDA 103,235 87,943 288,275 254,019 Stock-based compensation 11,839 7,285 37,093 21,129 Acquisition related expenses 2,583 2,863 11,699 6,408 Strategic and financial restructuring expenses 33 2 268 1,281 Adjustment to tax receivable agreement liability — 1,073 (4,818) — Loss on investment — 1,000 — 1,000 ERP implementation expenses 1,162 — 3,240 — Acquisition related adjustment - deferred revenue 1,077 3,563 5,216 9,224 Other income, net — 16 8 10 Adjusted EBITDA 119,929 $ 103,745 $ 340,981 $ 293,071 $ Segment Adjusted EBITDA: Supply Chain Services 118,704 $ 101,600 $ 329,642 $ 290,210 $ Performance Services 30,771 26,166 90,158 67,717 Corporate (29,546) (24,021) (78,819) (64,856) Adjusted EBITDA 119,929 $ 103,745 $ 340,981 $ 293,071 $ Depreciation and amortization (13,110) (11,538) (37,174) (33,107) Amortization of purchased intangible assets (8,740) (2,554) (24,058) (6,598) Stock-based compensation (11,839) (7,285) (37,093) (21,129) Acquisition related expenses (2,583) (2,863) (11,699) (6,408) Strategic and financial restructuring expenses (33) (2) (268) (1,281) Adjustment to tax receivable agreement liability — (1,073) 4,818 — ERP implementation expenses (1,162) — (3,240) — Acquisition related adjustment - deferred revenue (1,077) (3,563) (5,216) (9,224) Equity in net income of unconsolidated affiliates (6,627) (5,197) (16,002) (14,812) Deferred compensation plan expense — (759) 2,073 209 Operating income 74,758 $ 68,911 $ 213,122 $ 200,721 $ Equity in net income of unconsolidated affiliates 6,627 5,197 16,002 14,812 Interest and investment income, net (285) 204 (981) 517 Loss on investment — (1,000) — (1,000) Other expense, net — 743 (2,081) (219) Income before income taxes 81,100 $ 74,055 $ 226,062 $ 214,831 $ Net income (loss) attributable to stockholders 299,948 $ (374,853) $ 716,719 $ (781,216) $ Adjustment of redeemable partners' capital to redemption amount (284,409) 387,062 (685,649) 811,969 Income tax expense 9,543 2,026 41,257 12,107 Stock-based compensation 11,839 7,285 37,093 21,129 Acquisition related expenses 2,583 2,863 11,699 6,408 Strategic and financial restructuring expenses 33 2 268 1,281 ERP implementation expenses 1,162 — 3,240 — Adjustment to tax receivable agreement liability — 1,073 (4,818) — Loss on investment — 1,000 — 1,000 Acquisition related adjustment - deferred revenue 1,077 3,563 5,216 9,224 Amortization of purchased intangible assets 8,740 2,554 24,058 6,598 Net income attributable to non-controlling interest in Premier LP 56,018 59,568 153,735 170,135 Non-GAAP adjusted fully distributed income before income taxes 106,534 92,143 302,818 258,635 Income tax expense on fully distributed income before income taxes 42,614 36,857 121,127 103,454 Non-GAAP Adjusted Fully Distributed Net Income 63,920 $ 55,286 $ 181,691 $ 155,181 $ Three Months Ended March 31, Nine Months Ended March 31, Supplemental Financial Information - Reporting of Adjusted EBITDA (Unaudited) (in thousands) Reconciliation of Selected Non-GAAP Measures to GAAP Measures and Non-GAAP Adjusted Fully Distributed Net Income Reconciliation of Net Income to Adjusted EBITDA and Reconciliation of Segment Adjusted EBITDA to Income Before Income Taxes: Reconciliation of Net Income (Loss) Attributable to Stockholders to Non-GAAP Adjusted Fully Distributed Net Income:
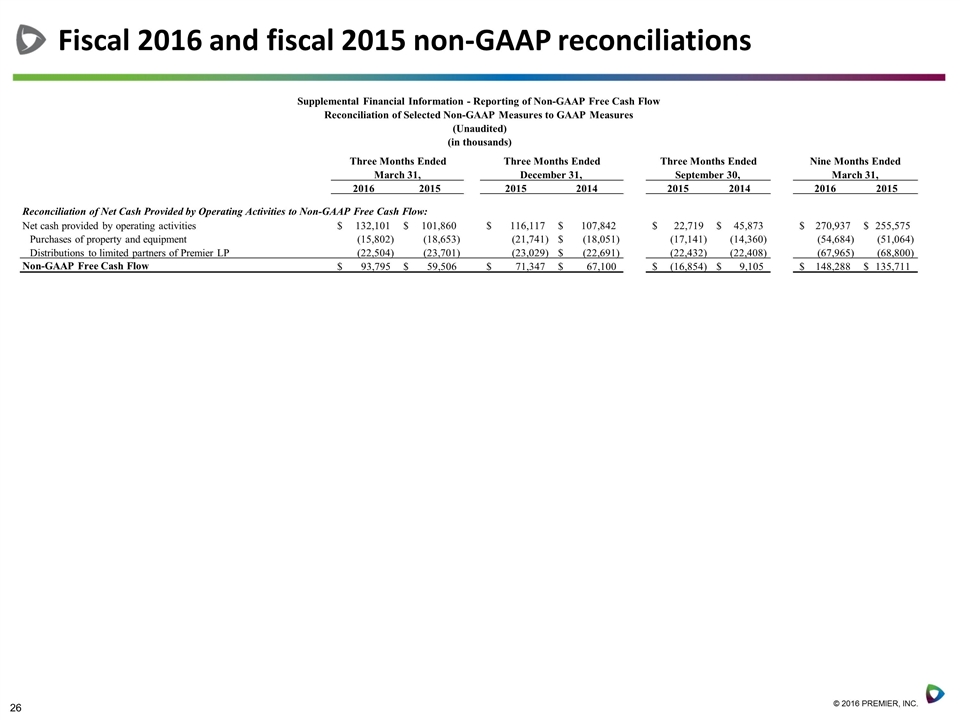
Fiscal 2016 and fiscal 2015 non-GAAP reconciliations 2016 2015 2015 2014 2015 2014 2016 2015 Reconciliation of Net Cash Provided by Operating Activities to Non-GAAP Free Cash Flow: Net cash provided by operating activities 132,101 $ 101,860 $ 116,117 $ 107,842 $ 22,719 $ 45,873 $ 270,937 $ 255,575 $ Purchases of property and equipment (15,802) (18,653) (21,741) (18,051) $ (17,141) (14,360) (54,684) (51,064) Distributions to limited partners of Premier LP (22,504) (23,701) (23,029) (22,691) $ (22,432) (22,408) (67,965) (68,800) Non-GAAP Free Cash Flow 93,795 $ 59,506 $ 71,347 $ 67,100 $ (16,854) $ 9,105 $ 148,288 $ 135,711 $ Supplemental Financial Information - Reporting of Non-GAAP Free Cash Flow Reconciliation of Selected Non-GAAP Measures to GAAP Measures (Unaudited) (in thousands) Nine Months Ended March 31, Three Months Ended September 30, Three Months Ended December 31, Three Months Ended March 31,
Fiscal 2016 and fiscal 2015 non-GAAP reconciliations
