Attached files
| file | filename |
|---|---|
| EX-32 - CERTIFICATION - KINGSTONE COMPANIES, INC. | kins_ex32.htm |
| EX-31.2 - CERTIFICATION - KINGSTONE COMPANIES, INC. | kins_ex312.htm |
| EX-31.1 - CERTIFICATION - KINGSTONE COMPANIES, INC. | kins_ex311.htm |
UNITED STATES
SECURITIES AND EXCHANGE COMMISSION
WASHINGTON, D.C. 20549
FORM 10-Q
(Mark one)
|
þ
|
QUARTERLY REPORT PURSUANT TO SECTION 13 OR 15(d) OF THE SECURITIES EXCHANGE ACT OF 1934
|
For the quarterly period ended March 31, 2016
OR
|
o
|
TRANSITION REPORT PURSUANT TO SECTION 13 OR 15(d) OF THE SECURITIES EXCHANGE ACT OF 1934
|
For the transition period from _________to _________
Commission File Number 0-1665
KINGSTONE COMPANIES, INC.
(Exact name of registrant as specified in its charter)
| Delaware | 36-2476480 | |
|
(State or other jurisdiction of incorporation or organization)
|
(I.R.S. Employer Identification Number)
|
15 Joys Lane
Kingston, NY 12401
(Address of principal executive offices)
(845) 802-7900
(Registrant’s telephone number, including area code)
Indicate by check mark whether the registrant (1) has filed all reports required to be filed by Section 13 or 15(d) of the Securities Exchange Act of 1934 during the preceding 12 months (or for such shorter period that the registrant was required to file such reports), and (2) has been subject to such filing requirements for the past 90 days. Yes þ No o
Indicate by check mark whether the registrant has submitted electronically and posted on its corporate Web site, if any, every Interactive Data File required to be submitted and posted pursuant to Rule 405 of Regulation S-T (§ 232.405 of this chapter) during the preceding 12 months (or for such shorter period that the registrant was required to submit and post such files). Yes þ No o
Indicate by check mark whether the registrant is a large accelerated filer, an accelerated filer, a non-accelerated filer or a smaller reporting company. See the definitions of “large accelerated filer”, “accelerated filer”, and “smaller reporting company” in Rule 12b-2 of the Exchange Act. (Check one):
|
Large accelerated filer o
|
Accelerated filero
|
Non-accelerated filer o
|
Smaller reporting company þ
|
|||
| (Do not check if a smaller reporting company) |
Indicate by check mark whether the registrant is a shell company (as defined in Rule 12b-2 of the Exchange Act). Yes o No þ
As of May 12, 2016 there were 7,912,375 shares of the registrant’s common stock outstanding.
KINGSTONE COMPANIES, INC.
INDEX
|
PAGE
|
||||
|
PART I — FINANCIAL INFORMATION
|
4
|
|||
|
4
|
||||
|
4
|
||||
|
5
|
||||
|
6
|
||||
|
7
|
||||
|
8
|
||||
|
34
|
||||
|
57
|
||||
|
57
|
||||
|
PART II — OTHER INFORMATION
|
58
|
|||
|
58
|
||||
|
58
|
||||
|
58
|
||||
|
58
|
||||
|
58
|
||||
|
58
|
||||
|
59
|
||||
| 60 | ||||
| EXHIBIT 3(a) | ||||
| EXHIBIT 3(b) | ||||
| EXHIBIT 31(a) | ||||
| EXHIBIT 31(b) | ||||
| EXHIBIT 32 | ||||
| EXHIBIT 101.INS XBRL Instance Document | ||||
| EXHIBIT 101.SCH XBRL Taxonomy Extension Schema | ||||
| EXHIBIT 101.CAL XBRL Taxonomy Extension Calculation Linkbase | ||||
| EXHIBIT 101.DEF XBRL Taxonomy Extension Definition Linkbase | ||||
| EXHIBIT 101.LAB XBRL Taxonomy Extension Label Linkbase | ||||
| EXHIBIT 101.PRE XBRL Taxonomy Extension Presentation Linkbase | ||||
2
Forward-Looking Statements
This Quarterly Report on Form 10-Q contains forward-looking statements as that term is defined in the federal securities laws. The events described in forward-looking statements contained in this Quarterly Report may not occur. Generally, these statements relate to business plans or strategies, projected or anticipated benefits or other consequences of our plans or strategies, projected or anticipated benefits from acquisitions to be made by us, or projections involving anticipated revenues, earnings or other aspects of our operating results. The words "may," "will," "expect," "believe," "anticipate," "project," "plan," "intend," "estimate," and "continue," and their opposites and similar expressions are intended to identify forward-looking statements. We caution you that these statements are not guarantees of future performance or events and are subject to a number of uncertainties, risks and other influences, many of which are beyond our control that may influence the accuracy of the statements and the projections upon which the statements are based. Factors which may affect our results include, but are not limited to, the risks and uncertainties discussed in Item 7 of our Annual Report on Form 10-K for the year ended December 31, 2015 under “Factors That May Affect Future Results and Financial Condition.”
Any one or more of these uncertainties, risks and other influences could materially affect our results of operations and whether forward-looking statements made by us ultimately prove to be accurate. Our actual results, performance and achievements could differ materially from those expressed or implied in these forward-looking statements. We undertake no obligation to publicly update or revise any forward-looking statements, whether from new information, future events or otherwise.
3
|
KINGSTONE COMPANIES, INC. AND SUBSIDIARIES
|
||
|
March 31,
|
December 31,
|
|||||||
|
2016
|
2015
|
|||||||
|
(unaudited)
|
||||||||
|
Assets
|
||||||||
|
Fixed-maturity securities, held-to-maturity, at amortized cost (fair value of $5,366,630 at March 31, 2016 and $5,241,095 at December 31, 2015)
|
$ | 5,140,522 | $ | 5,138,872 | ||||
|
Fixed-maturity securities, available-for-sale, at fair value (amortized cost of $71,617,357 at March 31, 2016 and $62,221,129 at December 31, 2015)
|
73,230,016 | 62,502,064 | ||||||
|
Equity securities, available-for-sale, at fair value (cost of $9,501,112 at March 31, 2016 and $8,751,537 at December 31, 2015)
|
10,025,750 | 9,204,270 | ||||||
|
Total investments
|
88,396,288 | 76,845,206 | ||||||
|
Cash and cash equivalents
|
5,579,224 | 13,551,372 | ||||||
|
Premiums receivable, net
|
10,522,191 | 10,621,655 | ||||||
|
Reinsurance receivables, net
|
35,830,346 | 31,270,235 | ||||||
|
Deferred policy acquisition costs
|
10,977,276 | 10,835,306 | ||||||
|
Intangible assets, net
|
1,638,887 | 1,757,816 | ||||||
|
Property and equipment, net
|
3,169,531 | 3,152,266 | ||||||
|
Other assets
|
1,511,848 | 1,095,894 | ||||||
|
Total assets
|
$ | 157,625,591 | $ | 149,129,750 | ||||
|
Liabilities
|
||||||||
|
Loss and loss adjustment expense reserves
|
$ | 46,030,765 | $ | 39,876,500 | ||||
|
Unearned premiums
|
49,013,099 | 48,890,241 | ||||||
|
Advance premiums
|
1,731,862 | 1,199,376 | ||||||
|
Reinsurance balances payable
|
3,225,893 | 1,688,922 | ||||||
|
Deferred ceding commission revenue
|
6,416,209 | 6,435,068 | ||||||
|
Accounts payable, accrued expenses and other liabilities
|
2,960,922 | 4,826,603 | ||||||
|
Income taxes payable
|
917,127 | 263,622 | ||||||
|
Deferred income taxes
|
1,106,310 | 672,190 | ||||||
|
Total liabilities
|
111,402,187 | 103,852,522 | ||||||
|
Commitments and Contingencies
|
||||||||
|
Stockholders' Equity
|
||||||||
|
Preferred stock, $.01 par value; authorized 2,500,000 shares
|
- | - | ||||||
|
|
||||||||
|
Common stock, $.01 par value; authorized 20,000,000 shares; issued 8,289,606 shares at March 31, 2016 and December 31, 2015; outstanding 7,317,137 shares at March 31, 2016 and 7,328,637 shares at December 31, 2015
|
82,896 | 82,896 | ||||||
|
Capital in excess of par
|
33,019,316 | 32,987,082 | ||||||
|
Accumulated other comprehensive income
|
1,410,614 | 484,220 | ||||||
|
Retained earnings
|
13,688,654 | 13,605,225 | ||||||
| 48,201,480 | 47,159,423 | |||||||
|
Treasury stock, at cost, 972,469 shares at March 31, 2016 and 960,969 shares at December 31, 2015
|
(1,978,076 | ) | (1,882,195 | ) | ||||
|
Total stockholders' equity
|
46,223,404 | 45,277,228 | ||||||
|
Total liabilities and stockholders' equity
|
$ | 157,625,591 | $ | 149,129,750 | ||||
See accompanying notes to condensed consolidated financial statements.
4
|
KINGSTONE COMPANIES, INC. AND SUBSIDIARIES
|
|||
|
Three months ended March 31,
|
2016
|
2015
|
||||||
|
Revenues
|
||||||||
|
Net premiums earned
|
$ | 14,531,675 | $ | 10,385,799 | ||||
|
Ceding commission revenue
|
2,770,337 | 3,089,404 | ||||||
|
Net investment income
|
813,057 | 574,656 | ||||||
|
Net realized gains (losses) on sales of investments
|
80,436 | (67,494 | ) | |||||
|
Other income
|
249,347 | 631,191 | ||||||
|
Total revenues
|
18,444,852 | 14,613,556 | ||||||
|
Expenses
|
||||||||
|
Loss and loss adjustment expenses
|
9,483,855 | 7,063,217 | ||||||
|
Commission expense
|
4,270,066 | 3,412,327 | ||||||
|
Other underwriting expenses
|
3,346,441 | 2,999,155 | ||||||
|
Other operating expenses
|
329,239 | 328,498 | ||||||
|
Depreciation and amortization
|
283,828 | 235,662 | ||||||
|
Total expenses
|
17,713,429 | 14,038,859 | ||||||
|
Income from operations before taxes
|
731,423 | 574,697 | ||||||
|
Income tax expense
|
190,391 | 192,198 | ||||||
|
Net income
|
541,032 | 382,499 | ||||||
|
Other comprehensive income, net of tax
|
||||||||
|
Gross change in unrealized gains on available-for-sale-securities
|
1,484,064 | 705,574 | ||||||
|
Reclassification adjustment for (gains) losses included in net income
|
(80,436 | ) | 67,494 | |||||
|
Net change in unrealized gains
|
1,403,628 | 773,068 | ||||||
|
Income tax expense related to items of other comprehensive income
|
(477,234 | ) | (262,843 | ) | ||||
|
Other comprehensive income, net of tax
|
926,394 | 510,225 | ||||||
|
Comprehensive income
|
$ | 1,467,426 | $ | 892,724 | ||||
|
Earnings per common share:
|
||||||||
|
Basic
|
$ | 0.07 | $ | 0.05 | ||||
|
Diluted
|
$ | 0.07 | $ | 0.05 | ||||
|
Weighted average common shares outstanding
|
||||||||
|
Basic
|
7,322,385 | 7,318,271 | ||||||
|
Diluted
|
7,360,564 | 7,344,563 | ||||||
|
Dividends declared and paid per common share
|
$ | 0.0625 | $ | 0.0500 | ||||
See accompanying notes to condensed consolidated financial statements.
5
|
KINGSTONE COMPANIES, INC. AND SUBSIDIARIES
|
|
Three months ended March 31, 2016
|
|
Accumulated
|
||||||||||||||||||||||||||||||||||||||||
|
Capital
|
Other
|
|||||||||||||||||||||||||||||||||||||||
|
Preferred Stock
|
Common Stock
|
in Excess
|
Comprehensive
|
Retained
|
Treasury Stock
|
|||||||||||||||||||||||||||||||||||
|
Shares
|
Amount
|
Shares
|
Amount
|
of Par
|
Income
|
Earnings
|
Shares
|
Amount
|
Total
|
|||||||||||||||||||||||||||||||
|
Balance, January 1, 2016
|
- | $ | - | 8,289,606 | $ | 82,896 | $ | 32,987,082 | $ | 484,220 | $ | 13,605,225 | 960,969 | $ | (1,882,195 | ) | $ | 45,277,228 | ||||||||||||||||||||||
|
Stock-based compensation
|
- | - | - | - | 32,234 | - | - | - | - | 32,234 | ||||||||||||||||||||||||||||||
|
Acquisition of treasury stock
|
- | - | - | - | - | - | - | 11,500 | (95,881 | ) | (95,881 | ) | ||||||||||||||||||||||||||||
|
Dividends
|
- | - | - | - | - | - | (457,603 | ) | - | - | (457,603 | ) | ||||||||||||||||||||||||||||
|
Net income
|
- | - | - | - | - | - | 541,032 | - | - | 541,032 | ||||||||||||||||||||||||||||||
|
Change in unrealized gains on available-
|
||||||||||||||||||||||||||||||||||||||||
|
for-sale securities, net of tax
|
- | - | - | - | - | 926,394 | - | - | - | 926,394 | ||||||||||||||||||||||||||||||
|
Balance, March 31, 2016
|
- | $ | - | 8,289,606 | $ | 82,896 | $ | 33,019,316 | $ | 1,410,614 | $ | 13,688,654 | 972,469 | $ | (1,978,076 | $ | 46,223,404 | |||||||||||||||||||||||
See accompanying notes to condensed consolidated financial statements.
6
| Condensed Consolidated Statements of Cash Flows (Unaudited) |
| Three months ended March 31, |
|
2016
|
2015
|
|||||||
|
Cash flows provided by operating activities:
|
||||||||
|
Net income
|
$ | 541,032 | $ | 382,499 | ||||
|
Adjustments to reconcile net income to net cash flows provided by operating activities:
|
||||||||
|
Net realized (gains) losses on sale of investments
|
(80,436 | ) | 67,494 | |||||
|
Depreciation and amortization
|
283,828 | 235,662 | ||||||
|
Amortization of bond premium, net
|
92,646 | 80,220 | ||||||
|
Stock-based compensation
|
32,234 | 38,892 | ||||||
|
Excess tax benefit from exercise of stock options
|
- | (221,136 | ) | |||||
|
Deferred income tax expense
|
(43,114 | ) | (9,856 | ) | ||||
|
(Increase) decrease in operating assets:
|
||||||||
|
Premiums receivable, net
|
99,464 | (481,267 | ) | |||||
|
Receivables - reinsurance contracts
|
- | (134,656 | ) | |||||
|
Reinsurance receivables, net
|
(4,560,111 | ) | (976,328 | ) | ||||
|
Deferred policy acquisition costs
|
(141,970 | ) | (49,985 | ) | ||||
|
Other assets
|
(666,404 | ) | 177,501 | |||||
|
Increase (decrease) in operating liabilities:
|
||||||||
|
Loss and loss adjustment expense reserves
|
6,154,265 | 2,238,581 | ||||||
|
Unearned premiums
|
122,858 | 468,420 | ||||||
|
Advance premiums
|
532,486 | 407,514 | ||||||
|
Reinsurance balances payable
|
1,536,971 | (77,807 | ) | |||||
|
Deferred ceding commission revenue
|
(18,859 | ) | (53,978 | ) | ||||
|
Accounts payable, accrued expenses and other liabilities
|
(1,212,176 | ) | (1,257,693 | ) | ||||
|
Net cash flows provided by operating activities
|
2,672,714 | 834,077 | ||||||
|
Cash flows used in investing activities:
|
||||||||
|
Purchase - fixed-maturity securities available-for-sale
|
(15,890,742 | ) | (3,349,181 | ) | ||||
|
Purchase - equity securities available-for-sale
|
(1,831,513 | ) | (1,145,558 | ) | ||||
|
Sale or maturity - fixed-maturity securities available-for-sale
|
6,401,092 | 716,892 | ||||||
|
Sale - equity securities available-for-sale
|
1,161,501 | - | ||||||
|
Acquisition of fixed assets
|
(182,164 | ) | (165,829 | ) | ||||
|
Other investing activities
|
250,448 | 3,170 | ||||||
|
Net cash flows used in investing activities
|
(10,091,378 | ) | (3,940,506 | ) | ||||
|
Cash flows used in financing activities:
|
||||||||
|
Withholding taxes paid on net exercise of stock options
|
- | (243,662 | ) | |||||
|
Excess tax benefit from exercise of stock options
|
- | 221,136 | ||||||
|
Purchase of treasury stock
|
(95,881 | ) | (128,763 | ) | ||||
|
Dividends paid
|
(457,603 | ) | (365,505 | ) | ||||
|
Net cash flows used in financing activities
|
(553,484 | ) | (516,794 | ) | ||||
|
Decrease in cash and cash equivalents
|
$ | (7,972,148 | ) | $ | (3,623,223 | ) | ||
|
Cash and cash equivalents, beginning of period
|
13,551,372 | 9,906,878 | ||||||
|
Cash and cash equivalents, end of period
|
$ | 5,579,224 | $ | 6,283,655 | ||||
|
Supplemental disclosures of cash flow information:
|
||||||||
|
Cash paid for income taxes
|
$ | 30,000 | $ | 300,500 | ||||
|
Supplemental schedule of non-cash investing and financing activities:
|
||||||||
|
Value of shares deducted from exercise of stock options for payment of withholding taxes
|
$ | - | $ | 243,662 | ||||
See accompanying notes to condensed consolidated financial statements.
7
NOTES TO CONDENSED CONSOLIDATED FINANCIAL STATEMENTS
(Unaudited)
Note 1 - Nature of Business and Basis of Presentation
Kingstone Companies, Inc. (referred to herein as "Kingstone" or the “Company”), through its wholly owned subsidiary, Kingstone Insurance Company (“KICO”), underwrites property and casualty insurance to small businesses and individuals exclusively through independent agents and brokers. KICO is a licensed insurance company in the States of New York, New Jersey, Connecticut, Pennsylvania, Rhode Island and Texas; however, KICO writes substantially all of its business in New York. Through March 31, 2015, Kingstone, through its wholly owned subsidiary, Payments Inc., a licensed premium finance company in the State of New York, received fees for placing contracts with a third party licensed premium finance company (see Note 11 – Premium Finance Placement Fees).
The accompanying unaudited condensed consolidated financial statements included in this report have been prepared in accordance with accounting principles generally accepted in the United States (“GAAP”) for interim financial information and the instructions to Securities and Exchange Commission (“SEC”) Form 10-Q and Article 8-03 of SEC Regulation S-X. The principles for condensed interim financial information do not require the inclusion of all the information and footnotes required by generally accepted accounting principles for complete financial statements. Therefore, these financial statements should be read in conjunction with the consolidated financial statements as of and for the year ended December 31, 2015 and notes thereto included in the Company’s Annual Report on Form 10-K filed with the SEC on March 24, 2016. The accompanying condensed consolidated financial statements have not been audited by an independent registered public accounting firm in accordance with standards of the Public Company Accounting Oversight Board (United States) but, in the opinion of management, such financial statements include all adjustments, consisting only of normal recurring adjustments, necessary for a fair statement of the Company’s financial position and results of operations. The results of operations for the three months ended March 31, 2016 may not be indicative of the results that may be expected for the year ending December 31, 2016.
Note 2 – Accounting Policies
Use of Estimates
The preparation of financial statements in conformity with GAAP requires management to make estimates and assumptions that affect the reported amounts of assets and liabilities and disclosure of contingent assets and liabilities at the date of the consolidated financial statements and the reported amounts of revenues and expenses during the reporting period. Such estimates and assumptions, which include the reserves for losses and loss adjustment expenses, are subject to considerable estimation error due to the inherent uncertainty in projecting ultimate claim amounts that will be reported and settled over a period of several years. In addition, estimates and assumptions associated with receivables under reinsurance contracts related to contingent ceding commission revenue require considerable judgment by management. On an on-going basis, management reevaluates its assumptions and the methods of calculating its estimates. Actual results may differ significantly from the estimates and assumptions used in preparing the consolidated financial statements.
8
Principles of Consolidation
The consolidated financial statements consist of Kingstone and its wholly owned subsidiaries; (1) KICO and its wholly owned subsidiaries, CMIC Properties, Inc. (“Properties”) and 15 Joys Lane, LLC (“15 Joys Lane”), which together own the land and building from which KICO operates, and (2) Payments Inc. All significant inter-company transactions have been eliminated in consolidation.
Accounting Pronouncements
In May 2014, the Financial Accounting Standards Board (“FASB) issued Accounting Standards Update (“ASU”) 2014-09 – Revenue from Contracts with Customers (Topic 606). The core principle of the new guidance is that an entity should recognize revenue to reflect the transfer of goods and services to customers in an amount equal to the consideration the entity receives or expects to receive. ASU No. 2014-09, as amended by ASU No. 2015-14, ASU No. 2016-08 and ASU No. 2016-10, is effective for annual reporting periods beginning after December 15, 2017, including interim periods within that reporting period. Early adoption is permitted for annual reporting periods beginning after December 15, 2016. The Company will apply the guidance using a modified retrospective approach. The Company does not expect these amendments to have a material effect on its consolidated financial statements.
In May 2015, FASB issued ASU 2015-09, Financial Services – Insurance (Topic 944): Disclosures About Short-Duration Contracts. The updated accounting guidance requires expanded disclosures for insurance entities that issue short-duration contracts. The expanded disclosures are designed to provide additional insight into an insurance entity’s ability to underwrite and anticipate costs associated with insurance claims. The disclosures include information about incurred and paid claims development by accident year, on a net basis after reinsurance, for the number of years claims incurred typically remain outstanding, not to exceed ten years. Each period presented in the disclosure about claims development that precedes the current reporting period is considered required supplementary information. The expanded disclosures also include information about significant changes in methodologies and assumptions, a reconciliation of incurred and paid claims development to the carrying amount of the liability for unpaid claims and claim adjustment expenses, the total amount of incurred but not reported liabilities plus expected development, claims frequency information including the methodology used to determine claim frequency and any changes to that methodology, and claim duration. The guidance is effective for annual periods beginning after December 15, 2015, and interim periods beginning after December 15, 2016, and is to be applied retrospectively. The new guidance affects disclosures only and will have no impact on the Company’s results of operations or financial position.
In January of 2016, the FASB issued ASU 2016-01 – Financial Instruments – Overall (Subtopic 825-10): Recognition and Measurement of Financial Assets and Financial Liabilities.” The updated accounting guidance requires changes to the reporting model for financial instruments. The primary change for the Company is expected to be the requirement for equity investments (except those accounted for under the equity method of accounting or those that result in consolidation of the investee) to be measured at fair value with changes in fair value recognized in net income. The updated guidance is effective for fiscal years beginning after December 15, 2017, including interim periods within those fiscal years. The Company is currently evaluating the effect the updated guidance will have on its consolidated financial statements.
9
In February 2016, FASB issued ASU No. 2016-02 – Leases (Topic 842). Under this ASU, lessees will recognize a right-of-use asset and corresponding liability on the balance sheet for all leases, except for leases covering a period of fewer than 12 months. The liability is to be measured as the present value of the future minimum lease payments taking into account renewal options if applicable plus initial incremental direct costs such as commissions. The minimum payments are discounted using the rate implicit in the lease or, if not known, the lessee’s incremental borrowing rate. The lessee’s income statement treatment for leases will vary depending on the nature of what is being leased. A financing type lease is present when, among other matters, the asset is being leased for a substantial portion of its economic life or has an end-of-term title transfer or a bargain purchase option as in today’s practice. The payment of the liability set up for such leases will be apportioned between interest and principal; the right-of use asset will be generally amortized on a straight-line basis. If the lease does not qualify as a financing type lease, it will be accounted for on the income statement as rent on a straight-line basis. The guidance will be effective for the Company for reporting periods beginning after December 15, 2018. The Company will apply the guidance using a modified retrospective approach. Early application is permitted. The Company is evaluating whether the adoption of ASU 2016-02 will have a significant impact on its consolidated results of operations, financial position or cash flows.
In January 2016, the FASB issued ASU No. 2016-09 – Compensation - Stock Compensation (Topic 718): Improvements to Employee Share-Based Payment Accounting. The amendments are intended to improve the accounting for employee share-based payments. These amendments to current accounting guidance will require all income tax effects of awards to be recognized in the income statement when the awards vest or are settled rather than through additional paid in capital in the equity section of the balance sheet. The amendments also permit an employer to repurchase an employee’s shares at the maximum statutory tax rate in the employee’s applicable jurisdiction for tax withholding purposes without triggering liability accounting. Finally, the amendments permit entities to make a one-time accounting policy election to account for forfeitures as they occur. Specific adoption methods depend on the issue being adopted and range from prospective to retrospective adoption. Early adoption is permitted, however all amendments must be adopted in the same period. The Company is evaluating whether the adoption of ASU 2016-09 will have a significant impact on its consolidated results of operations, financial position or cash flows.
The Company has determined that all other recently issued accounting pronouncements will not have a material impact on its consolidated financial position, results of operations and cash flows, or do not apply to its operations.
10
Note 3 - Investments
Available-for-Sale Securities
The amortized cost and fair value of investments in available-for-sale fixed-maturity securities and equity securities as of March 31, 2016 and December 31, 2015 are summarized as follows:
|
March 31, 2016
|
||||||||||||||||||||||||
|
Net
|
||||||||||||||||||||||||
|
|
Cost or
|
Gross
|
Gross Unrealized Losses
|
Unrealized
|
||||||||||||||||||||
|
Amortized
|
Unrealized
|
Less than 12
|
More than 12
|
Fair
|
Gains/
|
|||||||||||||||||||
|
Category
|
Cost
|
Gains
|
Months
|
Months
|
Value
|
(Losses)
|
||||||||||||||||||
|
Fixed-Maturity Securities:
|
||||||||||||||||||||||||
|
Political subdivisions of States,
|
||||||||||||||||||||||||
|
Territories and Possessions
|
$ | 10,211,142 | $ | 490,669 | $ | (2,510 | ) | $ | (5,060 | ) | $ | 10,694,241 | $ | 483,099 | ||||||||||
|
Corporate and other bonds
|
||||||||||||||||||||||||
|
Industrial and miscellaneous
|
$ | 45,367,395 | 1,247,820 | (210,199 | ) | (59,298 | ) | 46,345,718 | 978,323 | |||||||||||||||
|
Residential mortgage backed
|
||||||||||||||||||||||||
|
securities
|
$ | 16,038,820 | 188,141 | (36,904 | ) | - | 16,190,057 | 151,237 | ||||||||||||||||
|
Total fixed-maturity securities
|
$ | 71,617,357 | 1,926,630 | (249,613 | ) | (64,358 | ) | 73,230,016 | 1,612,659 | |||||||||||||||
|
Equity Securities:
|
||||||||||||||||||||||||
|
Preferred stocks
|
$ | 3,187,826 | 77,621 | - | (30,072 | ) | 3,235,375 | 47,549 | ||||||||||||||||
|
Common stocks
|
$ | 6,313,286 | 542,527 | (65,438 | ) | - | 6,790,375 | 477,089 | ||||||||||||||||
|
Total equity securities
|
$ | 9,501,112 | 620,148 | (65,438 | ) | (30,072 | ) | 10,025,750 | 524,638 | |||||||||||||||
|
Total
|
$ | 81,118,469 | $ | 2,546,778 | $ | (315,051 | ) | $ | (94,430 | ) | $ | 83,255,766 | $ | 2,137,297 | ||||||||||
11
|
December 31, 2015
|
||||||||||||||||||||||||
|
Net
|
||||||||||||||||||||||||
|
|
Cost or
|
Gross
|
Gross Unrealized Losses
|
Unrealized
|
||||||||||||||||||||
|
Amortized
|
Unrealized
|
Less than 12
|
More than 12
|
Fair
|
Gains/
|
|||||||||||||||||||
|
Category
|
Cost
|
Gains
|
Months
|
Months
|
Value
|
(Losses)
|
||||||||||||||||||
|
Fixed-Maturity Securities:
|
||||||||||||||||||||||||
|
Political subdivisions of States,
|
||||||||||||||||||||||||
|
Territories and Possessions
|
$ | 12,139,793 | $ | 431,194 | $ | (15,889 | ) | $ | - | $ | 12,555,098 | $ | 415,305 | |||||||||||
|
Corporate and other bonds
|
||||||||||||||||||||||||
|
Industrial and miscellaneous
|
45,078,044 | 490,444 | (512,427 | ) | (99,593 | ) | 44,956,468 | (121,576 | ) | |||||||||||||||
|
Residential mortgage backed
|
||||||||||||||||||||||||
|
securities
|
5,003,292 | 48,375 | (61,169 | ) | - | 4,990,498 | (12,794 | ) | ||||||||||||||||
|
Total fixed-maturity securities
|
62,221,129 | 970,013 | (589,485 | ) | (99,593 | ) | 62,502,064 | 280,935 | ||||||||||||||||
|
Equity Securities:
|
||||||||||||||||||||||||
|
Preferred stocks
|
2,874,173 | 70,799 | - | (29,322 | ) | 2,915,650 | 41,477 | |||||||||||||||||
|
Common stocks
|
5,877,364 | 514,977 | (103,721 | ) | - | 6,288,620 | 411,256 | |||||||||||||||||
|
Total equity securities
|
8,751,537 | 585,776 | (103,721 | ) | (29,322 | ) | 9,204,270 | 452,733 | ||||||||||||||||
|
Total
|
$ | 70,972,666 | $ | 1,555,789 | $ | (693,206 | ) | $ | (128,915 | ) | $ | 71,706,334 | $ | 733,668 | ||||||||||
A summary of the amortized cost and fair value of the Company’s investments in available-for-sale fixed-maturity securities by contractual maturity as of March 31, 2016 and December 31, 2015 is shown below:
|
March 31, 2016
|
December 31, 2015
|
|||||||||||||||
|
Amortized
|
Amortized
|
|||||||||||||||
|
Remaining Time to Maturity
|
Cost
|
Fair Value
|
Cost
|
Fair Value
|
||||||||||||
|
Less than one year
|
$ | 1,960,172 | $ | 1,989,139 | $ | 827,246 | $ | 837,918 | ||||||||
|
One to five years
|
21,829,957 | 22,476,966 | 17,146,349 | 17,393,571 | ||||||||||||
|
Five to ten years
|
30,423,009 | 31,171,743 | 37,877,726 | 37,884,450 | ||||||||||||
|
More than 10 years
|
1,365,399 | 1,402,111 | 1,366,516 | 1,395,627 | ||||||||||||
|
Residential mortgage backed securities
|
16,038,820 | 16,190,057 | 5,003,292 | 4,990,498 | ||||||||||||
|
Total
|
$ | 71,617,357 | $ | 73,230,016 | $ | 62,221,129 | $ | 62,502,064 | ||||||||
The actual maturities may differ from contractual maturities because certain borrowers have the right to call or prepay obligations with or without penalties.
12
Held-to-Maturity Securities
The amortized cost and fair value of investments in held-to-maturity fixed-maturity securities as of March 31, 2016 and December 31, 2015 are summarized as follows:
|
March 31, 2016
|
||||||||||||||||||||||||
|
Net
|
||||||||||||||||||||||||
|
|
Cost or
|
Gross
|
Gross Unrealized Losses
|
Unrealized
|
||||||||||||||||||||
|
Amortized
|
Unrealized
|
Less than 12
|
More than 12
|
Fair
|
Gains/
|
|||||||||||||||||||
|
Category
|
Cost
|
Gains
|
Months
|
Months
|
Value
|
(Losses)
|
||||||||||||||||||
|
U.S. Treasury securities
|
$ | 606,398 | $ | 147,641 | $ | - | $ | - | $ | 754,039 | $ | 147,641 | ||||||||||||
|
Political subdivisions of States,
|
||||||||||||||||||||||||
|
Territories and Possessions
|
1,418,827 | 88,948 | - | (66,215 | ) | 1,441,560 | 22,733 | |||||||||||||||||
|
Corporate and other bonds
|
||||||||||||||||||||||||
|
Industrial and miscellaneous
|
3,115,297 | 152,036 | (225 | ) | (96,077 | ) | 3,171,031 | 55,734 | ||||||||||||||||
|
Total
|
$ | 5,140,522 | $ | 388,625 | $ | (225 | ) | $ | (162,292 | ) | $ | 5,366,630 | $ | 226,108 | ||||||||||
|
December 31, 2015
|
||||||||||||||||||||||||
|
Net
|
||||||||||||||||||||||||
|
|
Cost or
|
Gross
|
Gross Unrealized Losses
|
Unrealized
|
||||||||||||||||||||
|
Amortized
|
Unrealized
|
Less than 12
|
More than 12
|
Fair
|
Gains/
|
|||||||||||||||||||
|
Category
|
Cost
|
Gains
|
Months
|
Months
|
Value
|
(Losses)
|
||||||||||||||||||
|
U.S. Treasury securities
|
$ | 606,389 | $ | 147,650 | $ | - | $ | - | $ | 754,039 | $ | 147,650 | ||||||||||||
|
Political subdivisions of States,
|
||||||||||||||||||||||||
|
Territories and Possessions
|
1,417,679 | 70,284 | - | (54,189 | ) | 1,433,774 | 16,095 | |||||||||||||||||
|
Corporate and other bonds
|
||||||||||||||||||||||||
|
Industrial and miscellaneous
|
3,114,804 | 82,265 | (17,980 | ) | (125,807 | ) | 3,053,282 | (61,522 | ) | |||||||||||||||
|
Total
|
$ | 5,138,872 | $ | 300,199 | $ | (17,980 | ) | $ | (179,996 | ) | $ | 5,241,095 | $ | 102,223 | ||||||||||
Held-to-maturity U.S. Treasury securities are held in trust pursuant to the New York State Department of Financial Services’ minimum funds requirement.
13
A summary of the amortized cost and fair value of the Company’s investments in held-to-maturity securities by contractual maturity as of March 31, 2016 and December 31, 2015 is shown below:
|
March 31, 2016
|
December 31, 2015
|
|||||||||||||||
|
Amortized
|
Amortized
|
|||||||||||||||
|
Remaining Time to Maturity
|
Cost
|
Fair Value
|
Cost
|
Fair Value
|
||||||||||||
|
Less than one year
|
$ | - | $ | - | $ | - | $ | - | ||||||||
|
One to five years
|
500,000 | 506,790 | 500,000 | 496,245 | ||||||||||||
|
Five to ten years
|
4,034,124 | 4,105,801 | 4,032,483 | 3,990,811 | ||||||||||||
|
More than 10 years
|
606,398 | 754,039 | 606,389 | 754,039 | ||||||||||||
|
Total
|
$ | 5,140,522 | $ | 5,366,630 | $ | 5,138,872 | $ | 5,241,095 | ||||||||
Investment Income
Major categories of the Company’s net investment income are summarized as follows:
|
Three months ended
|
||||||||
|
March 31,
|
||||||||
|
2016
|
2015
|
|||||||
|
Income:
|
||||||||
|
Fixed-maturity securities
|
$ | 664,476 | $ | 510,955 | ||||
|
Equity securities
|
175,951 | 122,569 | ||||||
|
Cash and cash equivalents
|
6,446 | 94 | ||||||
|
Total
|
846,873 | 633,618 | ||||||
|
Expenses:
|
||||||||
|
Investment expenses
|
33,816 | 58,962 | ||||||
|
Net investment income
|
$ | 813,057 | $ | 574,656 | ||||
Proceeds from the sale and maturity of fixed-maturity securities were $6,401,092 and $716,892 for the three months ended March 31, 2016 and 2015, respectively.
Proceeds from the sale of equity securities were $1,161,501 and $-0- for the three months ended March 31, 2016 and 2015, respectively.
14
The Company’s net realized gains (losses) on investments are summarized as follows:
|
Three months ended
|
||||||||
|
March 31,
|
||||||||
|
2016
|
2015
|
|||||||
|
Fixed-maturity securities:
|
||||||||
|
Gross realized gains
|
$ | 106,417 | $ | - | ||||
|
Gross realized losses
|
(105,543 | ) | (67,494 | ) | ||||
| 874 | (67,494 | ) | ||||||
|
Equity securities:
|
||||||||
|
Gross realized gains
|
82,688 | - | ||||||
|
Gross realized losses
|
(3,126 | ) | - | |||||
| 79,562 | - | |||||||
|
Net realized gains (losses)
|
$ | 80,436 | $ | (67,494 | ) | |||
Impairment Review
Impairment of investment securities results in a charge to operations when a market decline below cost is deemed to be other-than-temporary. The Company regularly reviews its fixed-maturity securities and equity securities portfolios to evaluate the necessity of recording impairment losses for other-than-temporary declines in the fair value of investments. In evaluating potential impairment, GAAP specifies (i) if the Company does not have the intent to sell a debt security prior to recovery and (ii) it is more likely than not that it will not have to sell the debt security prior to recovery, the security would not be considered other-than-temporarily impaired unless there is a credit loss. When the Company does not intend to sell the security and it is more likely than not that the Company will not have to sell the security before recovery of its cost basis, it will recognize the credit component of an other-than-temporary impairment (“OTTI”) of a debt security in earnings and the remaining portion in other comprehensive income. The credit loss component recognized in earnings is identified as the amount of principal cash flows not expected to be received over the remaining term of the security as projected based on cash flow projections. For held-to-maturity debt securities, the amount of OTTI recorded in other comprehensive income for the noncredit portion of a previous OTTI is amortized prospectively over the remaining life of the security on the basis of timing of future estimated cash flows of the security.
OTTI losses are recorded in the condensed consolidated statements of income and comprehensive income as net realized losses on investments and result in a permanent reduction of the cost basis of the underlying investment. The determination of OTTI is a subjective process and different judgments and assumptions could affect the timing of loss realization. At March 31, 2016 and December 31, 2015, there were 32 and 57 securities, respectively, that accounted for the gross unrealized loss. The Company determined that none of the unrealized losses were deemed to be OTTI for its portfolio of fixed-maturity investments and equity securities for the three months ended March 31, 2016 and 2015. Significant factors influencing the Company’s determination that unrealized losses were temporary included the magnitude of the unrealized losses in relation to each security’s cost, the nature of the investment and management’s intent and ability to retain the investment for a period of time sufficient to allow for an anticipated recovery of fair value to the Company’s cost basis.
15
The Company held securities with unrealized losses representing declines that were considered temporary at March 31, 2016 and December 31, 2015 as follows:
|
March 31, 2016
|
||||||||||||||||||||||||||||||||
|
Less than 12 months
|
12 months or more
|
Total
|
||||||||||||||||||||||||||||||
|
|
No. of
|
No. of
|
Aggregate
|
|||||||||||||||||||||||||||||
|
Fair
|
Unrealized
|
Positions
|
Fair
|
Unrealized
|
Positions
|
Fair
|
Unrealized
|
|||||||||||||||||||||||||
|
Category
|
Value
|
Losses
|
Held
|
Value
|
Losses
|
Held
|
Value
|
Losses
|
||||||||||||||||||||||||
|
Fixed-Maturity Securities:
|
||||||||||||||||||||||||||||||||
|
Political subdivisions of States, Territories and Possessions
|
$ | 334,827 | $ | (2,510 | ) | 1 | $ | 339,627 | $ | (5,060 | ) | 1 | $ | 674,454 | $ | (7,570 | ) | |||||||||||||||
|
Corporate and other bonds industrial and miscellaneous
|
5,269,173 | (210,199 | ) | 13 | 687,228 | (59,298 | ) | 2 | 5,956,401 | (269,497 | ) | |||||||||||||||||||||
|
Residential mortgage backed securities
|
1,614,256 | (36,904 | ) | 10 | - | - | - | 1,614,256 | (36,904 | ) | ||||||||||||||||||||||
|
Total fixed-maturity securities
|
$ | 7,218,256 | $ | (249,613 | ) | 24 | $ | 1,026,855 | $ | (64,358 | ) | 3 | $ | 8,245,111 | $ | (313,971 | ) | |||||||||||||||
|
Equity Securities:
|
||||||||||||||||||||||||||||||||
|
Preferred stocks
|
$ | - | $ | - | - | $ | 701,250 | $ | (30,072 | ) | 1 | $ | 701,250 | $ | (30,072 | ) | ||||||||||||||||
|
Common stocks
|
1,502,700 | (65,438 | ) | 4 | - | - | - | 1,502,700 | (65,438 | ) | ||||||||||||||||||||||
|
Total equity securities
|
$ | 1,502,700 | $ | (65,438 | ) | 4 | $ | 701,250 | $ | (30,072 | ) | 1 | $ | 2,203,950 | $ | (95,510 | ) | |||||||||||||||
|
Total
|
$ | 8,720,956 | $ | (315,051 | ) | 28 | $ | 1,728,105 | $ | (94,430 | ) | 4 | $ | 10,449,061 | $ | (409,481 | ) | |||||||||||||||
16
|
December 31, 2015
|
||||||||||||||||||||||||||||||||
|
Less than 12 months
|
12 months or more
|
Total
|
||||||||||||||||||||||||||||||
|
|
No. of
|
No. of
|
Aggregate
|
|||||||||||||||||||||||||||||
|
Fair
|
Unrealized
|
Positions
|
Fair
|
Unrealized
|
Positions
|
Fair
|
Unrealized
|
|||||||||||||||||||||||||
|
Category
|
Value
|
Losses
|
Held
|
Value
|
Losses
|
Held
|
Value
|
Losses
|
||||||||||||||||||||||||
| Fixed-Maturity Securities: | ||||||||||||||||||||||||||||||||
|
Political subdivisions of States, Territories and Possessions
|
$ | 1,432,005 | $ | (15,889 | ) | 4 | $ | - | $ | - | - | $ | 1,432,005 | $ | (15,889 | ) | ||||||||||||||||
|
Corporate and other bonds industrial and miscellaneous
|
18,424,609 | (512,427 | ) | 32 | 636,093 | (99,593 | ) | 2 | 19,060,702 | (612,020 | ) | |||||||||||||||||||||
|
Residential mortgage backed securities
|
2,413,980 | (61,169 | ) | 12 | - | - | - | 2,413,980 | (61,169 | ) | ||||||||||||||||||||||
|
Total fixed-maturity securities
|
$ | 22,270,594 | $ | (589,485 | ) | 48 | $ | 636,093 | $ | (99,593 | ) | 2 | $ | 22,906,687 | $ | (689,078 | ) | |||||||||||||||
| Equity Securities: | ||||||||||||||||||||||||||||||||
|
Preferred stocks
|
$ | - | $ | - | - | $ | 702,000 | $ | (29,322 | ) | 1 | $ | 702,000 | $ | (29,322 | ) | ||||||||||||||||
|
Common stocks
|
2,538,900 | (103,721 | ) | 6 | - | - | - | 2,538,900 | (103,721 | ) | ||||||||||||||||||||||
|
Total equity securities
|
$ | 2,538,900 | $ | (103,721 | ) | 6 | $ | 702,000 | $ | (29,322 | ) | 1 | $ | 3,240,900 | $ | (133,043 | ) | |||||||||||||||
|
Total
|
$ | 24,809,494 | $ | (693,206 | ) | 54 | $ | 1,338,093 | $ | (128,915 | ) | 3 | $ | 26,147,587 | $ | (822,121 | ) | |||||||||||||||
17
Note 4 - Fair Value Measurements
Fair value is the price that would be received upon sale of an asset or paid to transfer a liability in an orderly transaction between market participants at the measurement date. The valuation technique used by the Company to fair value its financial instruments is the market approach which uses prices and other relevant information generated by market transactions involving identical or comparable assets.
The fair value hierarchy gives the highest priority to quoted prices in active markets for identical assets or liabilities (Level 1) and the lowest priority to unobservable inputs (Level 3). If the inputs used to measure the assets or liabilities fall within different levels of the hierarchy, the classification is based on the lowest level input that is significant to the fair value measurement of the asset or liability. Classification of assets and liabilities within the hierarchy considers the markets in which the assets and liabilities are traded, including during period of market disruption, and the reliability and transparency of the assumptions used to determine fair value. The hierarchy requires the use of observable market data when available. The levels of the hierarchy and those investments included in each are as follows:
Level 1—Inputs to the valuation methodology are quoted prices (unadjusted) for identical assets or liabilities traded in active markets. Included are those investments traded on an active exchange, such as the NASDAQ Global Select Market, U.S. Treasury securities and obligations of U.S. government agencies, together with corporate debt securities that are generally investment grade.
Level 2—Inputs to the valuation methodology include quoted prices for similar assets or liabilities in active markets, quoted prices for identical or similar assets or liabilities in markets that are not active, inputs other than quoted prices that are observable for the asset or liability and market-corroborated inputs. Municipal and corporate bonds, and residential mortgage-backed securities, that are traded in less active markets are classified as Level 2. These securities are valued using market price quotations for recently executed transactions.
Level 3—Inputs to the valuation methodology are unobservable for the asset or liability and are significant to the fair value measurement. Material assumptions and factors considered in pricing investment securities and other assets may include appraisals, projected cash flows, market clearing activity or liquidity circumstances in the security or similar securities that may have occurred since the prior pricing period.
The availability of observable inputs varies and is affected by a wide variety of factors. When the valuation is based on models or inputs that are less observable or unobservable in the market, the determination of fair value requires significantly more judgment. The degree of judgment exercised by management in determining fair value is greatest for investments categorized as Level 3. For investments in this category, the Company considers prices and inputs that are current as of the measurement date. In periods of market dislocation, as characterized by current market conditions, the ability to observe prices and inputs may be reduced for many instruments. This condition could cause a security to be reclassified between levels.
18
The Company’s investments are allocated among pricing input levels at March 31, 2016 and December 31, 2015 as follows:
|
March 31, 2016
|
||||||||||||||||
|
($ in thousands)
|
Level 1
|
Level 2
|
Level 3
|
Total
|
||||||||||||
| Fixed-maturity securities available-for-sale | ||||||||||||||||
|
Political subdivisions of States, Territories and Possessions
|
$ | - | $ | 10,694,241 | $ | - | $ | 10,694,241 | ||||||||
|
Corporate and other bonds industrial and miscellaneous
|
39,440,630 | 6,905,088 | - | 46,345,718 | ||||||||||||
|
Residential mortgage backed securities
|
- | 16,190,057 | - | 16,190,057 | ||||||||||||
|
Total fixed maturities
|
39,440,630 | 33,789,386 | - | 73,230,016 | ||||||||||||
|
Equity securities
|
10,025,750 | - | - | 10,025,750 | ||||||||||||
|
Total investments
|
$ | 49,466,380 | $ | 33,789,386 | $ | - | $ | 83,255,766 | ||||||||
|
December 31, 2015
|
||||||||||||||||
|
($ in thousands)
|
Level 1
|
Level 2
|
Level 3
|
Total
|
||||||||||||
| Fixed-maturity securities available-for-sale | ||||||||||||||||
|
Political subdivisions of States, Territories and Possessions
|
$ | - | $ | 12,555,098 | $ | - | $ | 12,555,098 | ||||||||
|
Corporate and other bonds industrial and miscellaneous
|
37,964,006 | 6,992,462 | - | 44,956,468 | ||||||||||||
|
Residential mortgage backed securities
|
- | 4,990,498 | - | 4,990,498 | ||||||||||||
|
Total fixed maturities
|
37,964,006 | 24,538,058 | - | 62,502,064 | ||||||||||||
|
Equity securities
|
9,204,270 | - | - | 9,204,270 | ||||||||||||
|
Total investments
|
$ | 47,168,276 | $ | 24,538,058 | $ | - | $ | 71,706,334 | ||||||||
Note 5 - Fair Value of Financial Instruments
The Company uses the following methods and assumptions in estimating its fair value disclosures for financial instruments:
Equity securities and fixed income securities available-for-sale: Fair value disclosures for these investments are included in “Note 3 - Investments.”
Cash and cash equivalents: The carrying values of cash and cash equivalents approximate their fair values because of the short-term nature of these instruments.
Premiums receivable and reinsurance receivables: The carrying values reported in the accompanying condensed consolidated balance sheets for these financial instruments approximate their fair values due to the short-term nature of the assets.
19
Real estate: The fair value of the land and building included in property and equipment, which is used in the Company’s operations, approximates the carrying value. The fair value was based on an appraisal dated September 8, 2015 prepared using the sales comparison approach and income approach, and accordingly the real estate is a Level 3 asset under the fair value hierarchy.
Reinsurance balances payable: The carrying value reported in the condensed consolidated balance sheets for these financial instruments approximates fair value.
The estimated fair values of the Company’s financial instruments as of March 31, 2016 and December 31, 2015 are as follows:
|
March 31, 2016
|
December 31, 2015
|
|||||||||||||||
|
Carrying Value
|
Fair Value
|
Carrying Value
|
Fair Value
|
|||||||||||||
|
Fixed-maturity securities held-to-maturity
|
$ | 5,140,522 | $ | 5,366,630 | $ | 5,138,872 | $ | 5,241,095 | ||||||||
|
Cash and cash equivalents
|
$ | 5,579,224 | $ | 5,579,224 | $ | 13,551,372 | $ | 13,551,372 | ||||||||
|
Premiums receivable
|
$ | 10,522,191 | $ | 10,522,191 | $ | 10,621,655 | $ | 10,621,655 | ||||||||
|
Reinsurance receivables
|
$ | 35,830,346 | $ | 35,830,346 | $ | 31,270,235 | $ | 31,270,235 | ||||||||
|
Real estate, net of accumulated depreciation
|
$ | 1,698,035 | $ | 1,925,000 | $ | 1,710,897 | $ | 1,925,000 | ||||||||
|
Reinsurance balances payable
|
$ | 3,225,893 | $ | 3,225,893 | $ | 1,688,922 | $ | 1,688,922 | ||||||||
Note 6 – Property and Casualty Insurance Activity
Premiums Earned
Premiums written, ceded and earned are as follows:
|
Direct
|
Assumed
|
Ceded
|
Net
|
|||||||||||||
|
Three months ended March 31, 2016
|
|
|
|
|||||||||||||
|
Premiums written
|
$ | 23,043,325 | $ | 5,078 | $ | (8,386,528 | ) | $ | 14,661,875 | |||||||
|
Change in unearned premiums
|
(126,428 | ) | 3,571 | (7,343 | ) | (130,200 | ) | |||||||||
|
Premiums earned
|
$ | 22,916,897 | $ | 8,649 | $ | (8,393,871 | ) | $ | 14,531,675 | |||||||
|
Three months ended March 31, 2015
|
||||||||||||||||
|
Premiums written
|
$ | 19,489,429 | $ | 7,911 | $ | (8,619,406 | ) | $ | 10,877,934 | |||||||
|
Change in unearned premiums
|
(472,331 | ) | 3,912 | (23,716 | ) | (492,135 | ) | |||||||||
|
Premiums earned
|
$ | 19,017,098 | $ | 11,823 | $ | (8,643,122 | ) | $ | 10,385,799 | |||||||
Premium receipts in advance of the policy effective date are recorded as advance premiums. The balance of advance premiums as of March 31, 2016 and December 31, 2015 was approximately $1,732,000 and $1,199,000, respectively.
20
Loss and Loss Adjustment Expense Reserves
The following table provides a reconciliation of the beginning and ending balances for unpaid losses and loss adjustment expense (“LAE”) reserves:
|
Three months ended
|
||||||||
|
March 31,
|
||||||||
|
2016
|
2015
|
|||||||
|
Balance at beginning of period
|
$ | 39,876,500 | $ | 39,912,683 | ||||
|
Less reinsurance recoverables
|
(16,706,364 | ) | (18,249,526 | ) | ||||
|
Net balance, beginning of period
|
23,170,136 | 21,663,157 | ||||||
|
Incurred related to:
|
||||||||
|
Current year
|
9,903,094 | 6,956,761 | ||||||
|
Prior years
|
(419,239 | ) | 106,456 | |||||
|
Total incurred
|
9,483,855 | 7,063,217 | ||||||
|
Paid related to:
|
||||||||
|
Current year
|
3,006,210 | 1,685,306 | ||||||
|
Prior years
|
3,421,820 | 3,201,258 | ||||||
|
Total paid
|
6,428,030 | 4,886,564 | ||||||
|
|
||||||||
|
Net balance at end of period
|
26,225,961 | 23,839,810 | ||||||
|
Add reinsurance recoverables
|
19,804,804 | 18,311,454 | ||||||
|
Balance at end of period
|
$ | 46,030,765 | $ | 42,151,264 | ||||
Incurred losses and LAE are net of reinsurance recoveries under reinsurance contracts of $4,313,667 and $5,448,387 for the three months ended March 31, 2016 and 2015, respectively.
Prior year incurred loss and LAE development is based upon estimates by line of business and accident year. Prior year loss and LAE development incurred during the three months ended March 31, 2016 and 2015 was $(419,239) favorable and $106,456 unfavorable, respectively. The Company’s management continually monitors claims activity to assess the appropriateness of carried case and incurred but not reported (“IBNR”) reserves, giving consideration to Company and industry trends.
Due to the inherent uncertainty associated with the reserving process, the ultimate liability may differ, perhaps substantially, from the original estimate. Such estimates are regularly reviewed and updated and any resulting adjustments are included in the current year’s results. Reserves are closely monitored and are recomputed periodically using the most recent information on reported claims and a variety of statistical techniques. On at least a monthly basis, the Company reviews by line of business existing reserves, new claims, changes to existing case reserves and paid losses with respect to the current and prior years. Several methods are used, varying by product line and accident year, in order to determine the required IBNR reserves. These methods include the following:
Paid Loss Development – historical patterns of paid loss development are used to project future paid loss emergence in order to estimate required reserves.
Incurred Loss Development – historical patterns of incurred loss development, reflecting both paid losses and changes in case reserves, are used to project future incurred loss emergence in order to estimate required reserves.
21
Paid Bornhuetter-Ferguson (“BF”) – an estimated loss ratio for a particular accident year is determined, and is weighted against the portion of the accident year claims that have been paid, based on historical paid loss development patterns. The estimate of required reserves assumes that the remaining unpaid portion of a particular accident year will pay out at a rate consistent with the estimated loss ratio for that year. This method can be useful for situations where an unusually high or low amount of paid losses exists at the early stages of the claims development process.
Incurred Bornhuetter-Ferguson (“BF”) - an estimated loss ratio for a particular accident year is determined, and is weighted against the portion of the accident year claims that have been reported, based on historical incurred loss development patterns. The estimate of required reserves assumes that the remaining unreported portion of a particular accident year will pay out at a rate consistent with the estimated loss ratio for that year. This method can be useful for situations where an unusually high or low amount of reported losses exists at the early stages of the claims development process.
Management’s best estimate of required reserves is generally based on an average of the methods above, with appropriate weighting of the various methods based on the line of business and accident year being projected. In some cases, additional methods or historical data from industry sources are employed to supplement the projections derived from the methods listed above.
Two key assumptions that materially affect the estimate of loss reserves are the loss ratio estimate for the current accident year used in the BF methods described above, and the loss development factor selections used in the loss development methods described above. The loss ratio estimates used in the BF methods are selected after reviewing historical accident year loss ratios adjusted for rate changes, trend, and mix of business.
The Company is not aware of any claims trends that have emerged or that would cause future adverse development that have not already been considered in existing case reserves and in its current loss development factors.
In New York State, lawsuits for negligence are subject to certain limitations and must be commenced within three years from the date of the accident or are otherwise barred. Accordingly, the Company’s exposure to unreported claims (‘pure’ IBNR) for accident dates of March 31, 2013 and prior is limited although there remains the possibility of adverse development on reported claims (‘case development’ IBNR).
Commercial Auto Line of Business
Effective October 1, 2014 the Company decided that it would no longer accept applications for new commercial auto policies. The action was taken following a series of underwriting and pricing measures which were intended to improve the profitability of this line of business. The actions taken did not yield the hoped for results. In February 2015, the Company made the decision that it would no longer offer renewals on its existing commercial auto policies beginning with those that expire on or after May 1, 2015. The Company had 34 and 599 commercial auto policies in force as of March 31, 2016 and 2015, respectively.
22
Reinsurance
The Company’s quota share reinsurance treaties are on a July 1 through June 30 fiscal year basis; therefore, for year to date fiscal periods after June 30, two separate treaties will be included in such periods.
The Company’s quota share reinsurance treaty in effect for the three months ended March 31, 2016 for its personal lines business, which primarily consists of homeowners’ policies, was covered under the July 1, 2015/June 30, 2016 treaty year (“2015/2016 Treaty”). The Company’s quota share reinsurance treaty in effect for the three months ended March 31, 2015 was covered under the July 1, 2014/June 30, 2015 treaty year (“2014/2015 Treaty”).
The Company’s personal lines quota share treaty that covered the July 1, 2013/June 30, 2014 treaty year was a two year treaty that expired on June 30, 2015. Effective July 1, 2014, the Company exercised its contractual option to reduce the ceding percentage in the personal lines quota share treaty from 75% to 55%. The Company entered into new annual treaties with different terms effective July 1, 2015. The Company’s 2014/2015 Treaty and 2015/2016 Treaty provide for the following material terms:
23
|
Treaty Year
|
||||||||
|
July 1, 2015
|
July 1, 2014
|
|||||||
|
to
|
to
|
|||||||
|
Line of Busines
|
June 30, 2016
|
June 30, 2015
|
||||||
|
Personal Lines:
|
||||||||
|
Homeowners, dwelling fire and canine legal liability
|
||||||||
|
Quota share treaty:
|
||||||||
|
Percent ceded
|
40 | % | 55 | % | ||||
|
Risk retained
|
$ | 450,000 | $ | 360,000 | ||||
|
Losses per occurrence subject to quota share reinsurance coverage
|
$ | 750,000 | $ | 800,000 | ||||
|
Excess of loss coverage above quota share coverage
|
$ | 3,750,000 | $ | 3,200,000 | ||||
|
in excess of
|
in excess of
|
|||||||
| $ | 750,000 | $ | 800,000 | |||||
|
Total reinsurance coverage per occurrence
|
$ | 4,050,000 | $ | 3,640,000 | ||||
|
Losses per occurrence subject to reinsurance coverage
|
$ | 4,500,000 | $ | 4,000,000 | ||||
|
Expiration date
|
June 30, 2016
|
June 30, 2015
|
||||||
|
Personal Umbrella
|
||||||||
|
Quota share treaty:
|
||||||||
|
Percent ceded - first million dollars of coverage
|
90 | % | 90 | % | ||||
|
Percent ceded - excess of one million dollars of coverage
|
100 | % | 100 | % | ||||
|
Risk retained
|
$ | 100,000 | $ | 100,000 | ||||
|
Total reinsurance coverage per occurrence
|
$ | 2,900,000 | $ | 2,900,000 | ||||
|
Losses per occurrence subject to quota share reinsurance coverage
|
$ | 3,000,000 | $ | 3,000,000 | ||||
|
Expiration date
|
June 30, 2016
|
June 30, 2015
|
||||||
|
Commercial Lines:
|
||||||||
|
General liability commercial policies, except for commercial auto
|
||||||||
|
Quota share treaty:
|
||||||||
|
Percent ceded (terminated effective July 1, 2014)
|
None
|
None
|
||||||
|
Risk retained
|
$ | 425,000 | $ | 400,000 | ||||
|
Losses per occurrence subject to quota share reinsurance coverage
|
None
|
None
|
||||||
|
Excess of loss coverage above quota share coverage
|
$ | 4,075,000 | $ | 3,600,000 | ||||
|
in excess of
|
in excess of
|
|||||||
| $ | 425,000 | $ | 400,000 | |||||
|
Total reinsurance coverage per occurrence
|
$ | 4,075,000 | $ | 3,600,000 | ||||
|
Losses per occurrence subject to reinsurance coverage
|
$ | 4,500,000 | $ | 4,000,000 | ||||
|
Commercial Auto:
|
||||||||
|
Risk retained
|
$ | 300,000 | $ | 300,000 | ||||
|
Excess of loss coverage in excess of risk retained
|
$ | 1,700,000 | $ | 1,700,000 | ||||
|
in excess of
|
in excess of
|
|||||||
| $ | 300,000 | $ | 300,000 | |||||
|
Catastrophe Reinsurance:
|
||||||||
|
Initial loss subject to personal lines quota share treaty
|
$ | 4,000,000 | $ | 4,000,000 | ||||
|
Risk retained per catastrophe occurrence (1)
|
$ | 2,400,000 | $ | 1,800,000 | ||||
|
Catastrophe loss coverage in excess of quota share coverage (2) (3)
|
$ | 176,000,000 | $ | 137,000,000 | ||||
|
Severe winter weather aggregate (3)
|
Yes
|
Yes
|
||||||
|
Reinstatement premium protection (4)
|
Yes
|
No
|
||||||
|
1.
|
Plus losses in excess of catastrophe coverage.
|
|
2.
|
Catastrophe coverage is limited on an annual basis to two times the per occurrence amounts. Effective July 1, 2015, the duration of a catastrophe occurrence from windstorm, hail, tornado, hurricane and cyclone was extended to 120 consecutive hours from 96 consecutive hours.
|
|
3.
|
Effective July 1, 2014, our catastrophe treaty also covers losses caused by severe winter weather during any consecutive 28 day period.
|
|
4.
|
Effective July 1, 2015, reinstatement premium protection for $16,000,000 of catastrophe coverage in excess of $4,000,000.
|
24
The single maximum risks per occurrence to which the Company is subject under the new treaties effective July 1, 2015 and under the treaties that expired on June 30, 2015 are as follows:
|
July 1, 2015 - June 30, 2016
|
July 1, 2014 - June 30, 2015
|
|||||||
|
Treaty
|
Extent of Loss
|
Risk Retained
|
Extent of Loss
|
Risk Retained
|
||||
|
Personal Lines
|
Initial $750,000
|
$450,000
|
Initial $800,000
|
$360,000
|
||||
|
$750,000 - $4,500,000
|
None(1)
|
$800,000 - $4,000,000
|
None(1)
|
|||||
|
Over $4,500,000
|
100%
|
Over $4,000,000
|
100%
|
|||||
|
Personal Umbrella
|
Initial $1,000,000
|
$100,000
|
Initial $1,000,000
|
$100,000
|
||||
|
$1,000,000 - $3,000,000
|
None(1)
|
$1,000,000 - $3,000,000
|
None(1)
|
|||||
|
Over $3,000,000
|
100%
|
Over $3,000,000
|
100%
|
|||||
|
Commercial Lines
|
Initial $425,000
|
$425,000
|
Initial $400,000
|
$400,000
|
||||
|
$425,000 - $4,500,000
|
None(1)
|
$400,000 - $4,000,000
|
None(1)
|
|||||
|
Over $4,500,000
|
100%
|
Over $4,000,000
|
100%
|
|||||
|
Commercial Auto
|
Initial $300,000
|
$300,000
|
Initial $300,000
|
$300,000
|
||||
|
$300,000 - $2,000,000
|
None(1)
|
$300,000 - $2,000,000
|
None(1)
|
|||||
|
Over $2,000,000
|
100%
|
Over $2,000,000
|
100%
|
|||||
|
Catastrophe (2)
|
Initial $4,000,000
|
$2,400,000
|
Initial $4,000,000
|
$1,800,000
|
||||
|
$4,000,000 - $180,000,000
|
None
|
$4,000,000 - $141,000,000
|
None
|
|||||
|
Over $180,000,000
|
100%
|
Over $141,000,000
|
100%
|
|||||
|
(1)
|
Covered by excess of loss treaties.
|
|
(2)
|
Catastrophe coverage is limited on an annual basis to two times the per occurrence amounts.
|
The Company’s reinsurance program is structured to enable the Company to significantly grow its premium volume while maintaining regulatory capital and other financial ratios generally within or below the expected ranges used for regulatory oversight purposes. The reinsurance program also provides income as a result of ceding commissions earned pursuant to the quota share reinsurance contracts. The Company’s participation in reinsurance arrangements does not relieve the Company of its obligations to policyholders.
Ceding Commission Revenue
The Company earns ceding commission revenue under its quota share reinsurance agreements based on: (i) a fixed provisional commission rate at which provisional ceding commissions are earned, and (ii) a sliding scale of commission rates and ultimate treaty year loss ratios on the policies reinsured under each of these agreements based upon which contingent ceding commissions are earned. The sliding scale includes minimum and maximum commission rates in relation to specified ultimate loss ratios. The commission rate and contingent ceding commissions earned increases when the estimated ultimate loss ratio decreases and, conversely, the commission rate and contingent ceding commissions earned decreases when the estimated ultimate loss ratio increases.
The Company’s estimated ultimate treaty year loss ratios (“Loss Ratio(s)”) for treaties in effect for the three months ended March 31, 2016 are attributable to contracts for the 2015/2016 Treaty. The Company’s Loss Ratios for treaties in effect for the three months ended March 31, 2015 are attributable to contracts for the 2014/2015 Treaty.
25
Treaties in effect for the three months ended March 31, 2016
Under the 2015/2016 Treaty, the Company is receiving a higher upfront fixed provisional rate in exchange for a less favorable sliding scale contingent rate. Under this arrangement, the Company earns more provisional ceding commissions, while contingent ceding commissions are reduced due to the less favorable sliding scale rate. The Company’s Loss Ratio for the period July 1, 2015 through March 31, 2016, which is attributable to the 2015/2016 Treaty, was higher than the contractual Loss Ratio at which provisional ceding commissions are earned. Accordingly, for the three month period ended March 31, 2016, the Company’s contingent ceding commission earned was reduced as a result of the estimated Loss Ratio for the 2015/2016 Treaty.
Treaties in effect for the three months ended March 31, 2015
The Company’s Loss Ratio for the period July 1, 2014 through March 31, 2015, which is attributable to the 2014/2015 Treaty, was lower than the contractual Loss Ratio at which the provisional ceding commissions are earned. As a result of severe winter weather during the three months ended March 31, 2015, the Loss Ratio attributable to this treaty as of March 31, 2015 was greater than the Loss Ratio as of December 31, 2014. Accordingly, for the three months ended March 31, 2015, the Company’s contingent ceding commission earned was reduced as a result of the increase in the estimated Loss Ratio for the 2014/2015 Treaty.
In addition to the treaties that were in effect for three months ended March 31, 2016 and 2015, the Loss Ratios from prior years’ treaties are subject to change as loss reserves from those periods increase or decrease, resulting in an increase or decrease in the commission rate and contingent ceding commissions earned.
Ceding commission revenue consists of the following:
|
Three months ended
|
||||||||
|
March 31,
|
||||||||
|
2016
|
2015
|
|||||||
|
Provisional ceding commissions earned
|
$ | 3,099,614 | $ | 2,915,029 | ||||
|
Contingent ceding commissions earned
|
(329,277 | ) | 174,375 | |||||
| $ | 2,770,337 | $ | 3,089,404 | |||||
Provisional ceding commissions are settled monthly. Balances due from reinsurers for contingent ceding commissions on quota share treaties are settled annually based on the loss ratio of each treaty year that ends on June 30.
Note 7 – Stockholders’ Equity
Dividend Declared
Dividends declared and paid on Common Stock were $457,603 and $365,505 for the three months ended March 31, 2016 and 2015, respectively. The Company’s Board of Directors approved a quarterly dividend on May 11, 2016 of $.0625 per share payable in cash on June 15, 2016 to stockholders of record as of May 31, 2016 (see Note 12).
26
Stock Options
Pursuant to the Company’s 2005 Equity Participation Plan (the “2005 Plan”), which provides for the issuance of incentive stock options, non-statutory stock options and restricted stock, a maximum of 700,000 shares of the Company’s Common Stock are permitted to be issued pursuant to options granted and restricted stock issued. Effective August 12, 2014, the Company adopted the 2014 Equity Participation Plan (the “2014 Plan”) pursuant to which, subject to stockholder approval on or before August 12, 2015, a maximum of 700,000 shares of Common Stock of the Company are authorized to be issued pursuant to the grant of incentive stock options, non-statutory stock options, stock appreciation rights, restricted stock and stock bonuses. The stockholders approved the 2014 Plan on August 11, 2015. Incentive stock options granted under the 2014 Plan and 2005 Plan expire no later than ten years from the date of grant (except no later than five years for a grant to a 10% stockholder). The Board of Directors or the Stock Option Committee determines the expiration date with respect to non-statutory stock options and the vesting provisions for restricted stock granted under the 2014 Plan and 2005 Plan.
The results of operations for the three months ended March 31, 2016 and 2015 include stock-based stock option compensation expense totaling approximately $32,000 and $39,000, respectively. Stock-based compensation expense related to stock options for the three months ended March 31, 2016 and 2015 is net of estimated forfeitures of 17% for both periods. Such amounts have been included in the condensed consolidated statements of income and comprehensive income within other operating expenses.
Stock-based compensation expense in 2016 and 2015 is the estimated fair value of options granted amortized on a straight-line basis over the requisite service period for the entire portion of the award less an estimate for anticipated forfeitures. The Company uses the “simplified” method to estimate the expected term of the options because the Company’s historical share option exercise experience does not provide a reasonable basis upon which to estimate expected term. The weighted average estimated fair value of stock options granted during the three months ended March 31, 2016 was $1.97 per share. No options were granted during the three months March 31, 2015. The fair value of stock options at the grant date was estimated using the Black-Scholes option-pricing model. The following weighted average assumptions were used for grants during the following periods:
|
Three months ended
|
|||
|
March 31,
|
|||
|
2016
|
2015
|
||
|
Dividend Yield
|
3.18%
|
na
|
|
|
Volatility
|
31.61%
|
na
|
|
|
Risk-Free Interest Rate
|
1.11%
|
na
|
|
|
Expected Life
|
3.25 years
|
na
|
|
The Black-Scholes option valuation model was developed for use in estimating the fair value of traded options, which have no vesting restrictions and are fully transferable. In addition, option valuation models require the input of highly subjective assumptions including the expected stock price volatility. Because our stock options have characteristics significantly different from those of traded options, and because changes in the subjective input assumptions can materially affect the fair value estimate, in management's opinion, the existing models do not necessarily provide a reliable single measure of the fair value of our stock options.
27
A summary of stock option activity under the Company’s 2014 Plan for the three months ended March 31, 2016 is as follows:
|
Stock Options
|
Number of Shares
|
Weighted Average Exercise Price per Share
|
Weighted Average Remaining Contractual Term
|
Aggregate Intrinsic Value
|
||||||||||||
|
Outstanding at January 1, 2016
|
339,750 | $ | 6.34 | 3.36 | $ | 904,775 | ||||||||||
|
Granted
|
25,000 | $ | 7.85 | $ | 10,250 | |||||||||||
|
Exercised
|
- | $ | - | $ | - | |||||||||||
|
Forfeited
|
- | $ | - | $ | - | |||||||||||
|
Outstanding at March 31, 2016
|
364,750 | $ | 6.44 | 3.24 | $ | 663,610 | ||||||||||
|
Vested and Exercisable at March 31, 2016
|
197,875 | $ | 6.26 | 3.12 | $ | 394,854 | ||||||||||
The aggregate intrinsic value of options outstanding and options exercisable at March 31, 2016 is calculated as the difference between the exercise price of the underlying options and the market price of the Company’s Common Stock for the options that had exercise prices that were lower than the $8.26 closing price of the Company’s Common Stock on March 31, 2016. No options were exercised during the three months ended March 31, 2016.
Participants in the 2005 and 2014 Plans may exercise their outstanding vested options, in whole or in part, by having the Company reduce the number of shares otherwise issuable by a number of shares having a fair market value equal to the exercise price of the option being exercised (“Net Exercise”). All of the 120,000 options exercised during the three months ended March 31, 2015 were Net Exercises.
As of March 31, 2016, the fair value of unamortized compensation cost related to unvested stock option awards was approximately $98,000. Unamortized compensation cost as of March 31, 2016 is expected to be recognized over a remaining weighted-average vesting period of 1.51 years.
As of March 31, 2016, there were 625,000 shares reserved for grants under the 2014 Plan.
Other Equity Compensation
On January 4, 2016, the Company granted a total of 6,000 shares of restricted common stock under the 2014 Plan to its three then non-employee directors. On March 29, 2016, the Company granted 1,500 shares of restricted common stock under the 2014 Plan to a newly elected non-employee director. One-third of the shares granted will vest on each of the three following anniversaries following the grant date. The fair value of the shares will be determined on each of the vesting dates. For the three months ended March 31, 2016, no stock-based compensation for these grants is included in the condensed consolidated statements of income and comprehensive income.
Private Placement
See Note 12 Subsequent Events.
28
Note 8 – Income Taxes
The Company files a consolidated U.S. federal income tax return that includes all wholly owned subsidiaries. State tax returns are filed on a consolidated or separate basis depending on applicable laws. The Company records adjustments related to prior years’ taxes during the period when they are identified, generally when the tax returns are filed. The effect of these adjustments on the current and prior periods (during which the differences originated) is evaluated based upon quantitative and qualitative factors and are considered in relation to the financial statements taken as a whole for the respective periods. The Company has evaluated this year’s amounts in relation to the current and prior reporting periods and determined that a restatement of those prior reporting periods is not appropriate.
Deferred tax assets and liabilities are determined using the enacted tax rates applicable to the period the temporary differences are expected to be recovered. Accordingly, the current period income tax provision can be affected by the enactment of new tax rates. The net deferred income taxes on the balance sheet reflect temporary differences between the carrying amounts of the assets and liabilities for financial reporting purposes and income tax purposes, tax effected at a various rates depending on whether the temporary differences are subject to federal taxes, state taxes, or both. Significant components of the Company’s deferred tax assets and liabilities are as follows:
|
March 31,
|
December 31,
|
|||||||
|
2016
|
2015
|
|||||||
|
Deferred tax asset:
|
||||||||
|
Net operating loss carryovers (1)
|
$ | 131,626 | $ | 150,492 | ||||
|
Claims reserve discount
|
459,217 | 405,709 | ||||||
|
Unearned premium
|
2,600,074 | 2,555,012 | ||||||
|
Deferred ceding commission revenue
|
2,181,511 | 2,187,923 | ||||||
|
Other
|
92,904 | 151,250 | ||||||
|
Total deferred tax assets
|
5,465,332 | 5,450,386 | ||||||
|
Deferred tax liability:
|
||||||||
|
Investment in KICO (2)
|
1,169,000 | 1,169,000 | ||||||
|
Deferred acquisition costs
|
3,732,274 | 3,684,004 | ||||||
|
Intangibles
|
557,222 | 597,657 | ||||||
|
Depreciation and amortization
|
367,642 | 415,938 | ||||||
|
Net unrealized appreciation of securities - available for sale
|
745,504 | 255,977 | ||||||
|
Total deferred tax liabilities
|
6,571,642 | 6,122,576 | ||||||
|
Net deferred income tax liability
|
$ | (1,106,310 | ) | $ | (672,190 | ) | ||
|
March 31,
|
December 31,
|
||||||||
|
Type of NOL
|
2016
|
2015
|
Expiration
|
||||||
|
State only (A)
|
$ | 563,108 | $ | 540,865 |
December 31, 2036
|
||||
|
Valuation allowance
|
(441,682 | ) | (403,973 | ) | |||||
|
State only, net of valuation allowance
|
121,426 | 136,892 | |||||||
|
Amount subject to Annual Limitation, federal only (B)
|
10,200 | 13,600 |
December 31, 2019
|
||||||
|
Total deferred tax asset from net operating loss carryovers
|
$ | 131,626 | $ | 150,492 | |||||
29
(A) Kingstone generates operating losses for state purposes and has prior year NOLs available. The state NOL as of March 31, 2016 and December 31, 2015 was approximately $8,663,000 and $8,321,000, respectively. KICO, the Company’s insurance underwriting subsidiary, is not subject to state income taxes. KICO’s state tax obligations are paid through a gross premiums tax, which is included in the condensed consolidated statements of income and comprehensive income within other underwriting expenses. A valuation allowance has been recorded due to the uncertainty of generating enough state taxable income to utilize 100% of the available state NOLs over their remaining lives, which expire between 2027 and 2036.
(B) The Company has an NOL of $30,000 that is subject to Internal Revenue Code Section 382, which places a limitation on the utilization of the federal NOL loss to approximately $10,000 per year (“Annual Limitation”) as a result of a greater than 50% ownership change of the Company in 1999. The losses subject to the Annual Limitation will be available for future years, expiring through December 31, 2019.
|
(2)
|
Deferred tax liability - investment in KICO
|
On July 1, 2009, the Company completed the acquisition of 100% of the issued and outstanding common stock of KICO (formerly known as Commercial Mutual Insurance Company (“CMIC”)) pursuant to the conversion of CMIC from an advance premium cooperative to a stock property and casualty insurance company. Pursuant to the plan of conversion, the Company acquired a 100% equity interest in KICO, in consideration for the exchange of $3,750,000 principal amount of surplus notes of CMIC. In addition, the Company forgave all accrued and unpaid interest on the surplus notes as of the date of conversion. As of the date of acquisition, unpaid accrued interest on the surplus notes along with the accretion of the discount on the original purchase of the surplus notes totaled $2,921,319 (together “Untaxed Interest”). As of the date of acquisition, the deferred tax liability on the Untaxed Interest was $1,169,000. A temporary difference with an indefinite life exists when the parent has a lower carrying value of its subsidiary for income tax purposes. The Company is required to maintain its deferred tax liability of $1,169,000 related to this temporary difference until the stock of KICO is sold, or the assets of KICO are sold or KICO and the parent are merged.
In assessing the valuation of deferred tax assets, the Company considers whether it is more likely than not that some portion or all of the deferred tax assets will not be realized. The ultimate realization of deferred tax assets is dependent upon the generation of future taxable income during the periods in which those temporary differences become deductible. No valuation allowance against deferred tax assets has been established, except for NOL limitations, as the Company believes it is more likely than not the deferred tax assets will be realized based on the historical taxable income of KICO, or by offset to deferred tax liabilities.
The Company had no material unrecognized tax benefit and no adjustments to liabilities or operations were required. There were no interest or penalties related to income taxes that have been accrued or recognized as of and for the three months ended March 31, 2016 and 2015. If any had been recognized these would have been reported in income tax expense.
The tax returns for years ended December 31, 2012 through 2015 are subject to examination, generally for three years after filing.
Note 9 – Earnings Per Common Share
Basic net earnings per common share is computed by dividing income available to common shareholders by the weighted-average number of common shares outstanding. Diluted earnings per common share reflect, in periods in which they have a dilutive effect, the impact of common shares issuable upon exercise of stock options. The computation of diluted earnings per common share excludes those options with an exercise price in excess of the average market price of the Company’s common shares during the periods presented.
30
The computation of diluted earnings per common share excludes outstanding options in periods where the exercise of such options would be anti-dilutive. For the three months ended March 31, 2016 and 2015, the inclusion of 54,327 and 77,500 options, respectively, in the computation of diluted earnings per common share would have been anti-dilutive for the periods and, as a result, the weighted average number of common shares used in the calculation of diluted earnings per common share has not been adjusted for the effect of such options.
The reconciliation of the weighted average number of common shares used in the calculation of basic and diluted earnings per common share follows:
|
Three months ended
|
||||||||
|
March 31,
|
||||||||
|
2016
|
2015
|
|||||||
|
Weighted average number of shares outstanding
|
7,322,385 | 7,318,271 | ||||||
|
Effect of dilutive securities, common share equivalents
|
38,179 | 26,292 | ||||||
|
Weighted average number of shares outstanding,
|
||||||||
|
used for computing diluted earnings per share
|
7,360,564 | 7,344,563 | ||||||
Note 10 - Commitments and Contingencies
Litigation
From time to time, the Company is involved in various legal proceedings in the ordinary course of business. For example, to the extent a claim asserted by a third party in a lawsuit against one of the Company’s insureds covered by a particular policy, the Company may have a duty to defend the insured party against the claim. These claims may relate to bodily injury, property damage or other compensable injuries as set forth in the policy. Such proceedings are considered in estimating the liability for loss and LAE expenses. The Company is not subject to any other pending legal proceedings that management believes are likely to have a material adverse effect on the financial statements.
Office Lease
On March 27, 2015, the Company entered into a lease agreement for an additional office facility for KICO located in Valley Stream, NY under a non-cancelable operating lease. In addition to the base rental costs, occupancy lease agreements generally provide for rent escalations resulting from increased assessments from real estate taxes and other charges.
The lease commencement date was July 1, 2015 and rent commencement begins January 1, 2016. The lease has a term of seven years and six months.
Rent expense under the lease will be recognized on a straight-line basis over the lease term. At March 31, 2016, cumulative rent expense exceeded cumulative rent payments by $53,190. This difference is recorded as deferred rent and is included in accounts payable, accrued expenses and other liabilities in the accompanying condensed consolidated balance sheets.
31
As of March 31, 2016, aggregate future minimum rental commitments under the Company’s lease agreement is as follows:
|
For the Year Ending December 31,
|
Total
|
|||
|
2016 (nine months)
|
$ | 75,563 | ||
|
2017
|
104,276 | |||
|
2018
|
107,926 | |||
|
2019
|
111,703 | |||
|
2020
|
115,613 | |||
|
Thereafter
|
243,506 | |||
|
Total
|
$ | 758,587 | ||
Rent expense for the three months ended March 31, 2016 amounted to $26,126 and is included in the condensed consolidated statements of income and comprehensive income within other underwriting expenses.
Note 11 – Premium Finance Placement Fees
The Company’s wholly owned subsidiary, Payments Inc. (“Payments”), is licensed as a premium finance agency in the state of New York. Prior to February 1, 2008, Payments provided premium financing in connection with the obtaining of insurance policies. Effective February 1, 2008, Payments sold its outstanding premium finance loan portfolio. The purchaser of the portfolio (the “Purchaser”) agreed that, during the five year period ended February 1, 2013 (which period was extended to February 1, 2015), it would purchase, assume and service all eligible premium finance contracts originated by Payments in the state of New York (the “Agreement”). In connection with such purchases, Payments was entitled to receive a fee generally equal to a percentage of the amount financed.
On July 17, 2014, the Purchaser terminated the Agreement effective February 1, 2015. Following any expiration or termination of the obligation of the Purchaser to purchase premium finance contracts, Payments was entitled to receive the fees for an additional two years (“Termination Period”) with regard to contracts for policies from the Company’s producers. On March 26, 2015, the Company and the Purchaser agreed to amend the Termination Period to end as of March 31, 2015. The Company received a one-time payment of $350,000 in exchange for the fees that the Company would have received during the Termination Period. The Company’s premium financing business consisted of the placement fees that Payments earned from placing contracts.
Placement fee revenue included in other income and the related direct expenses included in other operating expenses in the condensed consolidated statements of net income and comprehensive income are as follows (unaudited:
|
For the Three Months Ended
|
||||||||
|
March 31,
|
||||||||
|
2016
|
2015
|
|||||||
|
Placement fee revenue
|
$ | - | $ | 54,343 | ||||
|
Early termination fee
|
- | 350,000 | ||||||
|
Direct expenses
|
- | (12,989 | ) | |||||
|
Net income before taxes from placement fees
|
$ | - | $ | 391,354 | ||||
32
Note 12 – Subsequent Events
The Company has evaluated events that occurred subsequent to March 31, 2016 through the date these financial statements were issued for matters that required disclosure or adjustment in these condensed consolidated financial statements.
Dividends Declared and Paid
On May 11, 2016, the Company’s Board of Directors approved a quarterly dividend of $.0625 per share payable in cash on June 15, 2016 to stockholders of record as of May 31, 2016.
Private Placement of Common Stock
On April 18, 2016 the Company sold 595,238 newly issued shares of its common stock to RenaissanceRe Ventures Ltd., a subsidiary of RenaissanceRe Holdings Ltd. (NYSE:RNR) (“RenaissanceRe”), in a private placement. RenaissanceRe is a global provider of catastrophe and specialty reinsurance and insurance.
The new common shares were sold to RenaissanceRe at a price of $8.40 per share. The Company received net proceeds of approximately $4,850,000 from the private placement. The Company intends to use the net proceeds of the offering to support the continued growth of KICO, and for general corporate purposes.
33
Overview
We offer property and casualty insurance products to small businesses and individuals in New York State through our subsidiary, Kingstone Insurance Company (“KICO”). KICO’s insureds are located primarily in downstate New York, consisting of New York City, Long Island and Westchester County. We are also licensed in the States of New Jersey, Connecticut, Pennsylvania, Rhode Island and Texas.
We derive substantially all of our revenue from KICO, which includes revenues from earned premiums, ceding commissions from quota share reinsurance, net investment income generated from its portfolio, and net realized gains and losses on investment securities. All of KICO’s insurance policies are for a one year period. Earned premiums represent premiums received from insureds, which are recognized as revenue over the period of time that insurance coverage is provided (i.e., ratably over the one year life of the policy). A significant period of time normally elapses between the receipt of insurance premiums and the payment of insurance claims. During this time, KICO invests the premiums, earns investment income and generates net realized and unrealized investment gains and losses on investments.
Our expenses include the insurance underwriting expenses of KICO and other operating expenses. Insurance companies incur a significant amount of their total expenses from losses incurred by policyholders, which are commonly referred to as claims. In settling these claims for losses, various loss adjustment expenses (“LAE”) are incurred such as insurance adjusters’ fees and litigation expenses. In addition, insurance companies incur policy acquisition costs. Policy acquisition costs include commissions paid to producers, premium taxes, and other expenses related to the underwriting process, including employees’ compensation and benefits.
Other operating expenses include our corporate expenses as a holding company. These expenses include legal and auditing fees, executive employment costs, and other costs directly associated with being a public company.
Product Lines
Our product lines include the following:
Personal lines: Our largest line of business is personal lines, consisting of homeowners, dwelling fire, 3-4 family dwelling package, cooperative and condominium, renters, equipment breakdown and service line endorsements, and personal umbrella policies.
Commercial liability: We offer business owners policies, which consist primarily of small business retail, service, and office risks without a residential exposure. We also write artisan’s liability policies for small independent contractors with seven or fewer employees. In addition, we write special multi-peril policies for larger and more specialized business owners’ risks, including those with limited residential exposures.
Commercial automobile: Until recently we provided liability and physical damage coverage for light vehicles owned by small contractors and artisans. However, due to the poor performance of this line, effective October 1, 2014, we decided to no longer accept new commercial auto policies. In February 2015, we decided to no longer offer renewals to our existing commercial auto policies beginning with those that expired on or after May 1, 2015. As of April 30, 2016 we have no commercial auto policies in force and this product line will be in run-off until all claims are paid.
34
Livery physical damage: We write for-hire vehicle physical damage only policies for livery and car service vehicles and taxicabs. These policies insure only the physical damage portion of insurance for such vehicles, with no liability coverage included.
Other: We write canine legal liability policies and also have a small participation in mandatory state joint underwriting associations.
Key Measures
We utilize the following key measures in analyzing the results of our insurance underwriting business:
Net loss ratio: The net loss ratio is a measure of the underwriting profitability of an insurance company’s business. Expressed as a percentage, this is the ratio of net losses and loss adjustment expenses (“LAE”) incurred to net premiums earned.
Net underwriting expense ratio: The net underwriting expense ratio is a measure of an insurance company’s operational efficiency in administering its business. Expressed as a percentage, this is the ratio of the sum of acquisition costs (the most significant being commissions paid to our producers) and other underwriting expenses less ceding commission revenue less other income to net premiums earned.
Net combined ratio: The net combined ratio is a measure of an insurance company’s overall underwriting profit. This is the sum of the net loss and net underwriting expense ratios. If the net combined ratio is at or above 100 percent, an insurance company cannot be profitable without investment income, and may not be profitable if investment income is insufficient.
Underwriting income: Underwriting income is net pre-tax income attributable to our insurance underwriting business before investment activity. It excludes net investment income, net realized gains from investments, and depreciation and amortization (net premiums earned less expenses included in combined ratio). Underwriting income is a measure of an insurance company’s overall operating profitability before items such as investment income, depreciation and amortization, interest expense and income taxes.
Critical Accounting Policies and Estimates
Our condensed consolidated financial statements include the accounts of Kingstone Companies, Inc. and all majority-owned and controlled subsidiaries. The preparation of financial statements in conformity with accounting principles generally accepted in the United States requires our management to make estimates and assumptions in certain circumstances that affect amounts reported in our consolidated financial statements and related notes. In preparing these financial statements, our management has utilized information available including our past history, industry standards and the current economic environment, among other factors, in forming its estimates and judgments of certain amounts included in the consolidated financial statements, giving due consideration to materiality. It is possible that the ultimate outcome as anticipated by our management in formulating its estimates inherent in these financial statements might not materialize. However, application of the critical accounting policies involves the exercise of judgment and use of assumptions as to future uncertainties and, as a result, actual results could differ from these estimates. In addition, other companies may utilize different estimates, which may impact comparability of our results of operations to those of companies in similar businesses.
We believe that the most critical accounting policies relate to the reporting of reserves for loss and LAE, including losses that have occurred but have not been reported prior to the reporting date, amounts recoverable from third party reinsurers, deferred ceding commission revenue, deferred policy acquisition costs, deferred income taxes, the impairment of investment securities, intangible assets and the valuation of stock-based compensation. See Note 2 to the condensed consolidated financial statements - “Accounting Policies” for information related to updated accounting policies.
35
Consolidated Results of Operations
Three Months Ended March 31, 2016 Compared to Three Months Ended March 31, 2015
The following table summarizes the changes in the results of our operations (in thousands) for the periods indicated:
|
Three months ended March 31,
|
||||||||||||||||
|
($ in thousands)
|
2016
|
2015
|
Change
|
Percent
|
||||||||||||
|
Revenues
|
||||||||||||||||
|
Direct written premiums
|
$ | 23,043 | $ | 19,489 | $ | 3,554 | 18.2 % | |||||||||
|
Assumed written premiums
|
5 | 8 | (3 | ) | (37.5)% | |||||||||||
| 23,048 | 19,497 | 3,551 | 18.2 % | |||||||||||||
|
Ceded written premiums
|
||||||||||||||||
|
Ceded to quota share treaties
|
5,823 | 7,328 | (1,505 | ) | (20.5)% | |||||||||||
|
Ceded to excess of loss treaties
|
319 | 307 | 12 | 3.9 % | ||||||||||||
|
Ceded to catastrophe treaties
|
2,244 | 984 | 1,260 | 128.0 % | ||||||||||||
|
Total ceded written premiums
|
8,386 | 8,619 | (233 | ) | (2.7)% | |||||||||||
|
Net written premiums
|
14,662 | 10,878 | 3,784 | 34.8 % | ||||||||||||
|
Change in net unearned premiums
|
(130 | ) | (492 | ) | 362 | (73.6)% | ||||||||||
|
Net premiums earned
|
14,532 | 10,386 | 4,146 | 39.9 % | ||||||||||||
|
Ceding commission revenue
|
||||||||||||||||
|
Excluding the effect of catastrophes
|
2,770 | 4,204 | (1,434 | ) | (34.1)% | |||||||||||
|
Effect of catastrophes (1)
|
- | (1,115 | ) | 1,115 | (100.0)% | |||||||||||
|
Total ceding commission revenue
|
2,770 | 3,089 | (319 | ) | (10.3)% | |||||||||||
|
Net investment income
|
813 | 574 | 239 | 41.6 % | ||||||||||||
|
Net realized gain(loss) on investments
|
80 | (67 | ) | 147 | (219.4)% | |||||||||||
|
Other income
|
249 | 631 | (382 | ) | (60.5)% | |||||||||||
|
Total revenues
|
18,444 | 14,613 | 3,831 | 26.2 % | ||||||||||||
|
Expenses
|
||||||||||||||||
|
Loss and loss adjustment expenses
|
||||||||||||||||
|
Direct and assumed:
|
||||||||||||||||
|
Loss and loss adjustment expenses excluding the effect of catastrophes
|
11,460 | 8,426 | 3,034 | 36.0 % | ||||||||||||
|
Losses from catastrophes (1)
|
2,337 | 4,085 | (1,748 | ) | (42.8)% | |||||||||||
|
Total direct and assumed loss and loss adjustment expenses
|
13,797 | 12,511 | 1,286 | 10.3 % | ||||||||||||
|
Ceded loss and loss adjustment expenses:
|
||||||||||||||||
|
Loss and loss adjustment expenses excluding the effect of catastrophes
|
3,378 | 3,201 | 177 | 5.5 % | ||||||||||||
|
Losses from catastrophes (1)
|
935 | 2,247 | (1,312 | ) | (58.4)% | |||||||||||
|
Total ceded loss and loss adjustment expenses
|
4,313 | 5,448 | (1,135 | ) | (20.8)% | |||||||||||
|
Net loss and loss adjustment expenses:
|
||||||||||||||||
|
Loss and loss adjustment expenses excluding the effect of catastrophes
|
8,082 | 5,225 | 2,857 | 54.7 % | ||||||||||||
|
Losses from catastrophes (1)
|
1,402 | 1,838 | (436 | ) | (23.7)% | |||||||||||
|
Net loss and loss adjustment expenses
|
9,484 | 7,063 | 2,421 | 34.3 % | ||||||||||||
|
Commission expense
|
4,270 | 3,412 | 858 | 25.1 % | ||||||||||||
|
Other underwriting expenses
|
3,346 | 2,999 | 347 | 11.6 % | ||||||||||||
|
Other operating expenses
|
329 | 328 | 1 | 0.3 % | ||||||||||||
|
Depreciation and amortization
|
284 | 236 | 48 | 20.3 % | ||||||||||||
|
Total expenses
|
17,713 | 14,039 | 3,675 | 26.2 % | ||||||||||||
|
Income from operations before taxes
|
731 | 574 | 157 | 27.4% | ||||||||||||
|
Provision for income tax
|
190 | 192 | (2 | ) | (1.0)% | |||||||||||
|
Net income
|
$ | 541 | $ | 382 | $ | 159 | 41.6% | |||||||||
(1) For the three months ended March 31, 2016 and 2015, includes the effects of severe winter weather (which we define as a catastrophe). We define a “catastrophe” as an event or series of related events that involve multiple first party policyholders, or an event or series of events that produce a number of claims in excess of a preset, per-event threshold of average claims in a specific area, occurring within a certain amount of time constituting the event or series of events. Catastrophes are caused by various natural events including high winds, excessive rain, winter storms, severe winter weather, tornadoes, hailstorms, wildfires, tropical storms, and hurricanes.
36
|
Three months ended March 31,
|
||||||||||||||||
|
2016
|
2015
|
Percentage Point Change
|
Percent Change
|
|||||||||||||
|
Key ratios:
|
||||||||||||||||
|
Net loss ratio
|
65.3 | % | 68.0 | % | (2.7 | ) | (4.0 | )% | ||||||||
|
Net underwriting expense ratio
|
31.6 | % | 29.9 | % | 1.7 | 5.7 | % | |||||||||
|
Net combined ratio
|
96.9 | % | 97.9 | % | (1.0 | ) | (1.0 | )% | ||||||||
Direct Written Premiums
Direct written premiums during the three months ended March 31, 2016 (“2016”) were $23,043,000 compared to $19,489,000 during the three months ended March 31, 2015 (“2015”). The increase of $3,554,000, or 18.2%, was primarily due to an increase in policies in-force during 2016 as compared to 2015. We wrote more new policies as a result of continued demand for our products in the markets that we serve. Policies in-force increased by 17.5% as of March 31, 2016 compared to March 31, 2015.
Our growth rate in direct premiums written was dampened somewhat due to the suspension, effective October 1, 2014, of the writing of new policies in our commercial auto line of business due to a history of poor underwriting results. In February 2015, we made the decision to no longer offer renewals on our existing commercial auto policies beginning with those that expire on or after May 1, 2015. Our direct written premiums in our continuing lines of business grew by 21.6% in 2016 compared to 2015. Policies-in-force in our continuing lines of business increased by 18.9% as March 31, 2016 compared to March 31, 2015.
Net Written Premiums and Net Premiums Earned
The following table describes the quota share reinsurance ceding rates in effect during 2016 and 2015. For purposes of the discussion herein, the change in quota share ceding rates on July 1 of each year will be referred to as “the Cut-off”. This table should be referred to in conjunction with the discussions for net written premiums, net premiums earned, ceding commission revenue and net loss and loss adjustment expenses that follow.
|
Three months ended
|
||||||||
|
March 31,
|
||||||||
|
2016
|
2015
|
|||||||
|
("2015/2016 Treaty")
|
("2014/2015 Treaty")
|
|||||||
|
Quota share reinsurance rates
|
||||||||
|
Personal lines
|
40 | % | 55 | % | ||||
Net written premiums increased $3,784,000, or 34.8%, to $14,662,000 in 2016 from $10,878,000 in 2015. Net written premiums include direct and assumed premiums, less the amount of written premiums ceded under our reinsurance treaties (quota share, excess of loss, and catastrophe). Our personal lines business is currently subject to a quota share treaty. A reduction to the quota share percentage or elimination of a quota share treaty will reduce our ceded written premiums, which will result in a corresponding increase to our net written premiums.
37
Effective July 1, 2015, we decreased the quota share ceding rate in our personal lines quota share treaty from 55% to 40%. The Cut-off of this treaty on July 1, 2015 resulted in a $5,866,000 return of unearned premiums from our reinsurers that were previously ceded under the expiring personal lines quota share treaty. The new treaty is on a “net” of catastrophe reinsurance basis, as opposed to the “gross” arrangement that existed in prior years. Under a “net” arrangement, all catastrophe reinsurance coverage is now purchased directly by us, which increases our ceded premium for that component.
Most of the premiums written under our personal lines are also subject to our catastrophe treaty. An increase in our personal lines business gives rise to more property exposure, which increases our exposure to catastrophe risk; therefore, our premiums for catastrophe insurance will increase. This results in an increase in premiums ceded under our catastrophe treaty, which reduces net written premiums. With the inception of our personal lines quota share treaty being on a “net” basis effective July 1, 2015, our catastrophe premiums are paid based on all of our direct written premiums subject to the quota share, compared to catastrophe premiums being paid only on the amount of written premiums that we retained under the expired “gross” basis. As a result of the increase in our personal lines business and the change to a “net” basis for our personal lines quota share treaty, ceded catastrophe premiums increased by $1,260,000, or 128.0%, to $2,244,000 in 2016 from $984,000 in 2015.
An increase in written premiums will also increase the premiums ceded under our excess of loss treaties, which incrementally reduces our net written premiums. In 2016, our ceded excess of loss reinsurance premiums increased by $12,000 over the ceded premiums for 2015.
Net premiums earned increased $4,146,000, or 39.9%, to $14,532,000 in 2016 from $10,386,000 in 2015. The increase was primarily due to us retaining more earned premiums as result of the reduction of the quota share percentage in our personal lines quota share treaty. The decreases in our quota share ceding percentages from the July 1, 2015 and 2014 Cut-offs gave us a return of premiums previously ceded, which increases our net premiums earned during the twelve month periods after the Cut-offs. In addition, as premiums written earn ratably over a twelve month period, net premiums earned in 2016 increased due to the higher net written premiums generated for the twelve months ended March 31, 2016 compared to the twelve months ended March 31, 2015.
Ceding Commission Revenue
The following table describes the quota share provisional ceding commission rates in effect during 2016 and 2015. This table should be referred to in conjunction with the discussion for ceding commission revenue that follows.
|
Three months ended
|
||||||||
|
March 31,
|
||||||||
|
2016
|
2015
|
|||||||
|
("2015/2016 Treaty")
|
("2014/2015 Treaty")
|
|||||||
|
Provisional ceding commission rate on quota share treaty
|
||||||||
|
Personal lines
|
55 | % | 40 | % | ||||
38
The following table summarizes the changes in the components of ceding commission revenue (in thousands) for the periods indicated:
|
Three months ended March 31,
|
||||||||||||||||
|
($ in thousands)
|
2016
|
2015
|
Change
|
Percent
|
||||||||||||
|
Provisional ceding commissions earned
|
$ | 3,099 | $ | 2,915 | $ | 184 | 6.3 | % | ||||||||
|
Contingent ceding commissions earned
|
||||||||||||||||
|
Contingent ceding commissions earned excluding
|
||||||||||||||||
|
the effect of catastrophes
|
(329 | ) | 1,289 | (1,618 | ) | (125.5 | ) % | |||||||||
|
Effect of catastrophes on ceding commissions earned
|
- | (1,115 | ) | 1,115 | (100.0 | ) % | ||||||||||
|
Contingent ceding commissions earned
|
(329 | ) | 174 | (503 | ) | (289.1 | ) % | |||||||||
|
Total ceding commission revenue
|
$ | 2,770 | $ | 3,089 | $ | (319 | ) | (10.3 | ) % | |||||||
Ceding commission revenue was $2,770,000 in 2016 compared to $3,089,000 in 2015. The decrease of $319,000, or 10.3%, was due to a decrease in contingent ceding commissions earned, partially offset by an increase in provisional ceding commissions earned.
Provisional Ceding Commissions Earned
We receive a provisional ceding commission based on ceded written premiums. Under the terms of the 2015/2016 Treaty, the provisional ceding commission rate increased to 55% from 40% under the 2014/2015 Treaty. The $184,000 increase in provisional ceding commissions earned is due to: (1) an increase in personal lines direct written premiums subject to the quota share and (2) an increase in the provisional ceding commission rates under the 2015/2016 Treaty, partially offset by (1) a decrease in the amount of premiums subject to provisional ceding commissions due to the reduction in quota share rates and (2) a decrease in the percentage of ceded premiums subject to quota share under the “net” 2015/2016 Treaty compared to the “gross” 2014/2015 Treaty
Contingent Ceding Commissions Earned
As a result of the increase in the provisional ceding commission rate to 55% under the 2015/2016 Treaty from 40% under the 2014/2015 Treaty, we do not have an opportunity to earn as much contingent ceding commissions. Under the “net” treaty in effect as of July 1, 2015, catastrophe losses in excess of the first $4,000,000 will fall outside of the quota share treaty and such losses will not have an impact on contingent ceding commissions, as was the case under previous “gross” treaties. The new structure eliminates the adverse impact that catastrophe losses above $4,000,000 would have on contingent ceding commissions.
We receive a contingent ceding commission based on a sliding scale in relation to the losses incurred under our quota share treaties. The lower the ceded loss ratio, the more contingent commission we receive. The amount of contingent ceding commissions we are eligible to receive under the personal lines quota share treaty described in the table above that was in effect during 2016 are subject to change based on losses incurred from claims with accident dates beginning July 1, 2015. The amount of contingent ceding commissions we are eligible to receive under our prior years’ quota share treaties is subject to change based on losses incurred related to claims with accident dates before July 1, 2015 under those treaties.
The term of our expired personal lines reinsurance quota share treaty covered the period from July 1, 2013 to June 30, 2015 (“2013/2015 Treaty”). The computation to arrive at contingent ceding commission revenue under the 2013/2015 Treaty included catastrophe losses and LAE incurred from severe winter weather during 2015 (see discussion of “Net Loss and LAE” below). Such losses increased our ceded loss ratio in our 2013/2015 Treaty, which reduced our contingent ceding commission revenue in accordance with the sliding scale discussed above in 2015 by $1,115,000. Catastrophe losses for 2016 have no impact on our contingent ceding commission revenue since the ultimate loss ratio used to determine these commissions was not affected by the 2016 severe winter weather. See “Reinsurance” below for changes to our personal lines quota share treaty effective July 1, 2015
39
Net Investment Income
Net investment income was $813,000 in 2016 compared to $574,000 in 2015. The increase of $239,000, or 41.6%, was due to an increase in average invested assets in 2016. The increase in cash and invested assets resulted primarily from increased operating cash flows for the period after March 31, 2015. The increase in operating cash flows is due in part from the reduction in quota share rates on July 1, 2015. The reduction in quota share rates results in a decline in ceded premiums, which leads to more cash flow and more invested funds. The pre-tax equivalent investment yield on estimated annual income, excluding cash, was 4.80% and 4.79% as of March 31, 2016 and 2015, respectively.
Other Income
Other income was $249,000 in 2016 compared to $631,000 in 2015. The decrease of $382,000, or 60.5%, was primarily due to the $350,000 we received in 2015 as early settlement of the termination agreement that generated placement fees in our premium finance business (see Note 11 to the Condensed Consolidated Financial Statements).
Net Loss and LAE
Net loss and LAE was $9,484,000 in 2016 compared to $7,063,000 in 2015. The net loss ratio was 65.3% in 2016 compared to 68.0% in 2015, a decrease of 2.7 percentage points. The following graphs summarize the changes in the components of net loss ratio for the periods indicated:
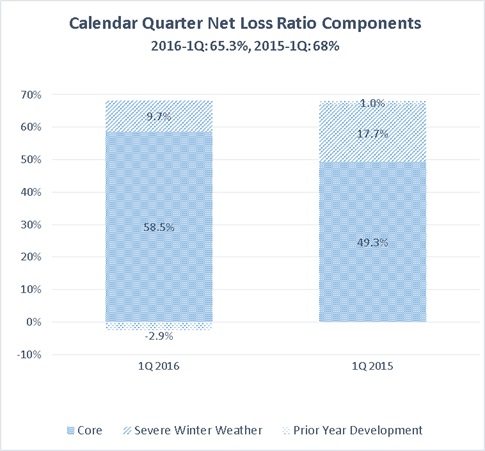
40
During 2016, the net loss ratio decreased compared to 2015 due to a combination of several factors. First, there was continued improvement in the impact of prior year loss development, as we recorded 2.9 points of favorable prior year loss development in 2016 compared to 1.0 point of adverse (unfavorable) prior year development in 2015, or an improvement of 3.9 points year-over-year. The favorable prior year development relates mostly to commercial auto and commercial lines for accident years 2014 and prior. Second, the impact of severe winter weather, determined as the losses incurred above those expected in an average winter season, was lower in 2016 than in 2015. Severe winter weather had a 9.7 point impact on the net loss ratio in 2016 compared to 17.7 points in 2015, or a decrease of 8.0 points. In general, 2016 was a more benign winter season than 2015. However, there was one severe freezing event in mid-February with temperatures below zero in many locations. This single event resulted in numerous claims from frozen pipes and resulting water damage. Because of its timing during the start of a holiday week, this event also resulted in a few very large water damage claims that impacted our loss ratio. Thus, the average loss severity per claim was higher for the 2016 winter season than in 2015 even though the impact on the net loss ratio was lower than in 2015. As in prior years, the winter claim provision in our catastrophe reinsurance treaty that adds coverage for winter weather losses in excess of $4,000,000 over any 28 day period was not triggered. Finally, offsetting some of these improvements was an increase in the core loss ratio (excluding prior year loss development and severe winter weather), which was 58.5% in 2016 compared to 49.3% in 2015, or an increase of 9.2 points. The increase in the core net loss ratio was driven by higher average claims severity for our personal lines business. This was caused by an increase in larger fire claims in 2016 compared to 2015. See table below under “Additional Financial Information” summarizing net loss ratios by line of business.
Commercial Auto Line of Business
Effective October 1, 2014 we decided to no longer accept applications for new commercial auto coverage. The action was taken following a series of underwriting and pricing measures which were intended to improve the profitability of this line of business. The actions taken did not yield the hoped for results. In February 2015, we decided to no longer offer renewals to our existing commercial auto policies beginning with those that expired on or after May 1, 2015. As of March 31, 2016, we had 34 commercial auto policies in force, which represented 0.1% of our policies in force.
Commission Expense
Commission expense was $4,270,000 in 2016 or 18.6% of direct earned premiums. Commission expense was $3,412,000 in 2015 or 17.9% of direct earned premiums. The increase of $858,000, or 25.1%, is due to the increase in direct written premiums in 2016 as compared to 2015 and a change in the mix of business to lines of business with higher commission rates, and an increase in bonus commissions.
Other Underwriting Expenses
Other underwriting expenses were $3,346,000 in 2016 compared to $2,999,000 in 2015. The increase of $347,000, or 11.6%, in other underwriting expenses was primarily due to expenses directly and indirectly related to growth in direct written premiums. Expenses directly related to the increase in direct written premiums primarily consist of underwriting expenses, software usage fees and state premium taxes. Expenses indirectly related to the increase in direct written premiums primarily consist of salaries along with related other employment costs. Salaries and employment costs were $1,516,000 in 2016 compared to $1,314,000 in 2015. The increase of $202,000, or 15.4%, was due to hiring of additional staff to service our current level of business and anticipated growth in volume. In addition, there were annual rate increases in both salaries and the cost of employee benefits. Other underwriting expenses as a percentage of direct written premiums decreased to 14.5% in 2016 from 15.4% in 2015. Other underwriting expenses as a percentage of direct earned premiums decreased to 14.6% in 2016 from 15.8% in 2015.
Our net underwriting expense ratio in 2016 was 31.6% compared with 29.9% in 2015. The following table shows the individual components of our net underwriting expense ratio for the periods indicated:
|
Three months ended
|
||||||||||||
|
March 31,
|
Percentage
|
|||||||||||
|
2016
|
2015
|
Point Change
|
||||||||||
|
Ceding commission revenue - provisional
|
(21.3 | )% | (28.1 | )% | 7.5 | |||||||
|
Ceding commission revenue - contingent
|
2.2 | (1.7 | ) | 3.2 | ||||||||
|
Other income
|
(1.7 | ) | (2.1 | ) | 0.4 | |||||||
|
Acquistion costs and other underwriting expenses:
|
||||||||||||
|
Commission expense
|
29.4 | 32.9 | (3.5 | ) | ||||||||
|
Other underwriting expenses
|
23.0 | 28.9 | (5.9 | ) | ||||||||
|
Net underwriting expense ratio
|
31.6 | % | 29.9 | % | 1.7 | |||||||
The increase of 1.7 percentage points was due to the individual components of provisional ceding commission revenue, commission expense and other underwriting expenses and their relation to the increase in net premiums earned as a result of the additional retention resulting from the Cut-offs to our quota share treaties on July 1, 2015.
41
Other Operating Expenses
Other operating expenses, related to the expenses of our holding company, were $329,000 in 2016 compared to $328,000 in 2015. The increase in 2016 of $1,000, or 0.3%, was primarily due to immaterial net fluctuations in various other operating expenses.
Depreciation and Amortization
Depreciation and amortization was $284,000 in 2016 compared to $236,000 in 2015. The increase of $48,000, or 20.3%, in depreciation and amortization was primarily due to depreciation on newly purchased assets used to upgrade our systems infrastructure and the Kingston, New York home office building from which we operate.
Income Tax Expense
Income tax expense in 2016 was $190,000, which resulted in an effective tax rate of 26.0%. Income tax expense in 2015 was $192,000, which resulted in an effective tax rate of 33.4%. Income before taxes was $731,000 in 2016 compared to $574,000 in 2015. The decrease in the effective tax rate by 7.4 percentage points in 2016 is a result of the increase in benefits from various permanent differences.
Net Income
Net income was $541,000 in 2016 compared to $382,000 in 2015. The increase in net income of $158,000, or 41.4%, was due to the circumstances described above that caused the increase in our net premiums earned, net investment income, and a decrease in our net loss ratio, partially offset by a decrease in ceding commission revenue, other income, and increases in other underwriting expenses related to premium growth and other operating expenses.
Additional Financial Information
We operate our business as one segment, property and casualty insurance. Within this segment, we offer a wide array of property and casualty policies to our producers. The following table summarizes gross and net premiums written, net premiums earned, and loss and loss adjustment expenses by major product type, which were determined based primarily on similar economic characteristics and risks of loss.
42
|
For the Three Months Ended
|
||||||||
|
March 31,
|
||||||||
|
2016
|
2015
|
|||||||
|
Gross premiums written:
|
||||||||
|
Personal lines
|
$ | 17,441,086 | $ | 14,237,717 | ||||
|
Commercial lines
|
3,128,138 | 2,799,370 | ||||||
|
Commercial auto(1)
|
(8,793 | ) | 535,236 | |||||
|
Livery physical damage
|
2,431,915 | 1,872,615 | ||||||
|
Other(2)
|
56,057 | 52,402 | ||||||
|
Total
|
$ | 23,048,403 | $ | 19,497,340 | ||||
|
Net premiums written:
|
||||||||
|
Personal lines
|
$ | 9,385,438 | $ | 5,952,781 | ||||
|
Commercial lines
|
2,814,905 | 2,537,775 | ||||||
|
Commercial auto(1)
|
(8,485 | ) | 485,914 | |||||
|
Livery physical damage
|
2,431,915 | 1,872,615 | ||||||
|
Other(2)
|
38,102 | 28,850 | ||||||
|
Total
|
$ | 14,661,875 | $ | 10,877,935 | ||||
|
Net premiums earned:
|
||||||||
|
Personal lines
|
$ | 9,463,896 | $ | 5,960,475 | ||||
|
Commercial lines
|
2,680,725 | 2,412,143 | ||||||
|
Commercial auto(1)
|
85,088 | 662,632 | ||||||
|
Livery physical damage
|
2,255,854 | 1,306,577 | ||||||
|
Other(2)
|
46,112 | 43,972 | ||||||
|
Total
|
$ | 14,531,675 | $ | 10,385,799 | ||||
|
Net loss and loss adjustment expenses:
|
||||||||
|
Personal lines
|
$ | 7,548,551 | $ | 4,348,571 | ||||
|
Commercial lines
|
910,834 | 1,467,693 | ||||||
|
Commercial auto(1)
|
(456,486 | ) | 339,208 | |||||
|
Livery physical damage
|
988,553 | 547,741 | ||||||
|
Other(2)
|
76,079 | 77,146 | ||||||
|
Unallocated loss adjustment expenses
|
416,324 | 282,858 | ||||||
|
Total
|
$ | 9,483,855 | $ | 7,063,217 | ||||
|
Net loss ratio:
|
||||||||
|
Personal lines
|
79.8 | % | 73.0 | % | ||||
|
Commercial lines
|
34.0 | % | 60.8 | % | ||||
|
Commercial auto(1)
|
-536.5 | % | 51.2 | % | ||||
|
Livery physical damage
|
43.8 | % | 41.9 | % | ||||
|
Other(2)
|
165.0 | % | 175.4 | % | ||||
|
Total
|
65.3 | % | 68.0 | % | ||||
|
1.
|
Effective October 1, 2014 we decided to no longer accept applications for new commercial auto coverage. In February 2015, we decided to no longer offer renewals to our existing commercial auto policies beginning with those that expired on or after May 1, 2015.
|
|
2.
|
“Other” includes, among other things, premiums and loss and loss adjustment expenses from our participation in a mandatory state joint underwriting association.
|
43
Insurance Underwriting Business on a Standalone Basis
Our insurance underwriting business reported on a standalone basis for the periods indicated is as follows:
|
Three months ended
|
||||||||
|
March 31,
|
||||||||
|
2016
|
2015
|
|||||||
|
Revenues
|
||||||||
|
Net premiums earned
|
$ | 14,531,675 | $ | 10,385,799 | ||||
|
Ceding commission revenue
|
2,770,337 | 3,089,404 | ||||||
|
Net investment income
|
813,057 | 574,656 | ||||||
|
Net realized gain(loss) on investments
|
80,436 | (67,494 | ) | |||||
|
Other income
|
248,998 | 220,336 | ||||||
|
Total revenues
|
18,444,503 | 14,202,701 | ||||||
|
Expenses
|
||||||||
|
Loss and loss adjustment expenses
|
9,483,855 | 7,063,217 | ||||||
|
Commission expense
|
4,270,066 | 3,412,327 | ||||||
|
Other underwriting expenses
|
3,346,441 | 2,999,155 | ||||||
|
Depreciation and amortization
|
283,538 | 234,816 | ||||||
|
Total expenses
|
17,383,900 | 13,709,515 | ||||||
|
Income from operations
|
1,060,603 | 493,186 | ||||||
|
Income tax expense
|
272,438 | 118,062 | ||||||
|
Net income
|
$ | 788,165 | $ | 375,124 | ||||
|
Key Measures:
|
||||||||
|
Net loss ratio
|
65.3 | % | 68.0 | % | ||||
|
Net underwriting expense ratio
|
31.6 | % | 29.9 | % | ||||
|
Net combined ratio
|
96.9 | % | 97.9 | % | ||||
|
Reconciliation of net underwriting expense ratio:
|
||||||||
|
Acquisition costs and other
|
||||||||
|
underwriting expenses
|
$ | 7,616,507 | $ | 6,411,482 | ||||
|
Less: Ceding commission revenue
|
(2,770,337 | ) | (3,089,404 | ) | ||||
|
Less: Other income
|
(248,998 | ) | (220,336 | ) | ||||
|
Net underwriting expenses
|
$ | 4,597,172 | $ | 3,101,742 | ||||
|
Net premiums earned
|
$ | 14,531,675 | $ | 10,385,799 | ||||
|
Net Underwriting Expense Ratio
|
31.6 | % | 29.9 | % | ||||
44
An analysis of our direct, assumed and ceded earned premiums, loss and loss adjustment expenses, and loss ratios is shown below:
|
Direct
|
Assumed
|
Ceded
|
Net
|
|||||||||||||
|
Three months ended March 31, 2016
|
||||||||||||||||
|
Written premiums
|
$ | 23,043,325 | $ | 5,078 | $ | (8,386,528 | ) | $ | 14,661,875 | |||||||
|
Change in unearned premiums
|
(126,428 | ) | 3,571 | (7,343 | ) | (130,200 | ) | |||||||||
|
Earned premiums
|
$ | 22,916,897 | $ | 8,649 | $ | (8,393,871 | ) | $ | 14,531,675 | |||||||
|
Loss and loss adjustment expenses exluding
|
||||||||||||||||
|
the effect of catastrophes
|
$ | 11,437,764 | $ | 22,297 | $ | (3,378,683 | ) | $ | 8,081,378 | |||||||
|
Catastrophe loss
|
2,337,461 | - | (934,984 | ) | 1,402,477 | |||||||||||
|
Loss and loss adjustment expenses
|
$ | 13,775,225 | $ | 22,297 | $ | (4,313,667 | ) | $ | 9,483,855 | |||||||
|
Loss ratio excluding the effect of catastrophes
|
49.9 | % | 257.8 | % | 40.3 | % | 55.6 | % | ||||||||
|
Catastrophe loss
|
10.2 | % | 0.0 | % | 11.1 | % | 9.7 | % | ||||||||
|
Loss ratio
|
60.1 | % | 257.8 | % | 51.4 | % | 65.3 | % | ||||||||
|
Three months ended March 31, 2015
|
||||||||||||||||
|
Written premiums
|
$ | 19,489,429 | $ | 7,911 | $ | (8,619,406 | ) | $ | 10,877,934 | |||||||
|
Change in unearned premiums
|
(472,331 | ) | 3,912 | (23,716 | ) | (492,135 | ) | |||||||||
|
Earned premiums
|
$ | 19,017,098 | $ | 11,823 | $ | (8,643,122 | ) | $ | 10,385,799 | |||||||
|
Loss and loss adjustment expenses exluding
|
||||||||||||||||
|
the effect of catastrophes
|
$ | 8,368,211 | $ | 58,042 | $ | (3,201,444 | ) | $ | 5,224,809 | |||||||
|
Catastrophe loss
|
4,085,351 | - | (2,246,943 | ) | 1,838,408 | |||||||||||
|
Loss and loss adjustment expenses
|
$ | 12,453,562 | $ | 58,042 | $ | (5,448,387 | ) | $ | 7,063,217 | |||||||
|
Loss ratio excluding the effect of catastrophes
|
44.0 | % | 490.9 | % | 37.0 | % | 50.3 | % | ||||||||
|
Catastrophe loss
|
21.5 | % | 0.0 | % | 26.0 | % | 17.7 | % | ||||||||
|
Loss ratio
|
65.5 | % | 490.9 | % | 63.0 | % | 68.0 | % | ||||||||
45
The key measures for our insurance underwriting business for the periods indicated are as follows:
|
Three months ended
|
||||||||
|
March 31,
|
||||||||
|
2016
|
2015
|
|||||||
|
Net premiums earned
|
$ | 14,531,675 | $ | 10,385,799 | ||||
|
Ceding commission revenue (1)
|
2,770,337 | 3,089,404 | ||||||
|
Other income
|
248,998 | 220,336 | ||||||
|
Loss and loss adjustment expenses (2)
|
9,483,855 | 7,063,217 | ||||||
|
Acquistion costs and other underwriting expenses:
|
||||||||
|
Commission expense
|
4,270,066 | 3,412,327 | ||||||
|
Other underwriting expenses
|
3,346,441 | 2,999,155 | ||||||
|
Total acquistion costs and other
|
||||||||
|
underwriting expenses
|
7,616,507 | 6,411,482 | ||||||
|
Underwriting income
|
$ | 450,648 | $ | 220,840 | ||||
|
Key Measures:
|
||||||||
|
Net loss ratio excluding the effect of catastrophes
|
55.6 | % | 50.3 | % | ||||
|
Effect of catastrophe loss on net loss ratio (2) (3)
|
9.7 | % | 17.7 | % | ||||
|
Net loss ratio
|
65.3 | % | 68.0 | % | ||||
|
Net underwriting expense ratio excluding the
|
||||||||
|
effect of catastrophes
|
31.6 | % | 19.1 | % | ||||
|
Effect of catastrophe loss on net underwriting
|
||||||||
|
expense ratio (1) (2) (3)
|
0.0 | % | 10.8 | % | ||||
|
Net underwriting expense ratio
|
31.6 | % | 29.9 | % | ||||
|
Net combined ratio excluding the effect
|
||||||||
|
of catastrophes
|
87.2 | % | 69.4 | % | ||||
|
Effect of catastrophe loss on net combined
|
||||||||
|
ratio (1) (2) (3)
|
9.7 | % | 28.5 | % | ||||
|
Net combined ratio
|
96.9 | % | 97.9 | % | ||||
|
Reconciliation of net underwriting expense ratio:
|
||||||||
|
Acquisition costs and other
|
||||||||
|
underwriting expenses
|
$ | 7,616,507 | $ | 6,411,482 | ||||
|
Less: Ceding commission revenue (1)
|
(2,770,337 | ) | (3,089,404 | ) | ||||
|
Less: Other income
|
(248,998 | ) | (220,336 | ) | ||||
|
|
$ | 4,597,172 | $ | 3,101,742 | ||||
_________________________________________________
(1) For the three months ended March 31, 2016 and 2015, the effect of severe winter weather, defined as a catastrophe, reduced contingent ceding commission revenue by $-0- and $1,115,158, respectively.
(2) For the three months ended March 31, 2016 and 2015, includes the sum of net catastrophe losses and loss adjustment expenses of $1,402,477 and $1,838,408, respectively, resulting from severe winter weather.
46
(3) For the three months ended March 31, 2016 and 2015, the effect of catastrophe loss from severe winter weather on our net combined ratio only includes the direct effects of loss and loss adjustment expenses and ceding commission revenue and does not include the indirect effects of a $84,149 and $125,349, respectively, decrease in other underwriting expenses.
Investments
Portfolio Summary
The following table presents a breakdown of the amortized cost, aggregate fair value and unrealized gains and losses by investment type as of March 31, 2016 and December 31, 2015:
Available-for-Sale Securities
|
March 31, 2016
|
||||||||||||||||||||||||
|
|
Cost or
|
Gross
|
Gross Unrealized Losses
|
Aggregate
|
% of
|
|||||||||||||||||||
|
Amortized
|
Unrealized
|
Less than 12
|
More than 12
|
Fair
|
Fair
|
|||||||||||||||||||
|
Category
|
Cost
|
Gains
|
Months
|
Months
|
Value
|
Value
|
||||||||||||||||||
|
Political subdivisions of States,
|
||||||||||||||||||||||||
|
Territories and Possessions
|
$ | 10,211,142 | $ | 490,669 | $ | (2,510 | ) | $ | (5,060 | ) | $ | 10,694,241 | 12.8 | % | ||||||||||
|
Corporate and other bonds
|
||||||||||||||||||||||||
|
Industrial and miscellaneous
|
45,367,395 | 1,247,820 | (210,199 | ) | (59,298 | ) | 46,345,718 | 55.8 | % | |||||||||||||||
|
Residential mortgage backed
|
||||||||||||||||||||||||
|
securities
|
16,038,820 | 188,141 | (36,904 | ) | - | 16,190,057 | 19.4 | % | ||||||||||||||||
|
Total fixed-maturity securities
|
71,617,357 | 1,926,630 | (249,613 | ) | (64,358 | ) | 73,230,016 | 88.0 | % | |||||||||||||||
|
Equity Securities
|
9,501,112 | 620,148 | (65,438 | ) | (30,072 | ) | 10,025,750 | 12.0 | % | |||||||||||||||
|
Total
|
$ | 81,118,469 | $ | 2,546,778 | $ | (315,051 | ) | $ | (94,430 | ) | $ | 83,255,766 | 100.0 | % | ||||||||||
|
December 31, 2015
|
||||||||||||||||||||||||
|
|
Cost or
|
Gross
|
Gross Unrealized Losses
|
Aggregate
|
% of
|
|||||||||||||||||||
|
Amortized
|
Unrealized
|
Less than 12
|
More than 12
|
Fair
|
Fair
|
|||||||||||||||||||
|
Category
|
Cost
|
Gains
|
Months
|
Months
|
Value
|
Value
|
||||||||||||||||||
|
Political subdivisions of States,
|
||||||||||||||||||||||||
|
Territories and Possessions
|
$ | 12,139,793 | $ | 431,194 | $ | (15,889 | ) | $ | - | $ | 12,555,098 | 17.5 | % | |||||||||||
|
Corporate and other bonds
|
||||||||||||||||||||||||
|
Industrial and miscellaneous
|
45,078,044 | 490,444 | (512,427 | ) | (99,593 | ) | 44,956,468 | 62.7 | % | |||||||||||||||
|
Residential mortgage backed
|
||||||||||||||||||||||||
|
securities
|
5,003,292 | 48,375 | (61,169 | ) | - | 4,990,498 | 7.0 | % | ||||||||||||||||
|
Total fixed-maturity securities
|
62,221,129 | 970,013 | (589,485 | ) | (99,593 | ) | 62,502,064 | 87.2 | % | |||||||||||||||
|
Equity Securities
|
8,751,537 | 585,776 | (103,721 | ) | (29,322 | ) | 9,204,270 | 12.8 | % | |||||||||||||||
|
Total
|
$ | 70,972,666 | $ | 1,555,789 | $ | (693,206 | ) | $ | (128,915 | ) | $ | 71,706,334 | 100.0 | % | ||||||||||
47
Held-to-Maturity Securities
|
March 31, 2016
|
||||||||||||||||||||||||
|
|
Cost or
|
Gross
|
Gross Unrealized Losses
|
% of
|
||||||||||||||||||||
|
Amortized
|
Unrealized
|
Less than 12
|
More than 12
|
Fair
|
Fair
|
|||||||||||||||||||
|
Category
|
Cost
|
Gains
|
Months
|
Months
|
Value
|
Value
|
||||||||||||||||||
|
U.S. Treasury securities
|
$ | 606,398 | $ | 147,641 | $ | - | $ | - | $ | 754,039 | 14.1 | % | ||||||||||||
|
Political subdivisions of States,
|
||||||||||||||||||||||||
|
Territories and Possessions
|
1,418,827 | 88,948 | - | (66,215 | ) | 1,441,560 | 26.9 | % | ||||||||||||||||
|
Corporate and other bonds
|
||||||||||||||||||||||||
|
Industrial and miscellaneous
|
3,115,297 | 152,036 | (225 | ) | (96,077 | ) | 3,171,031 | 59.0 | % | |||||||||||||||
|
Total
|
$ | 5,140,522 | $ | 388,625 | $ | (225 | ) | $ | (162,292 | ) | $ | 5,366,630 | 100.0 | % | ||||||||||
|
December 31, 2015
|
||||||||||||||||||||||||
|
|
Cost or
|
Gross
|
Gross Unrealized Losses
|
% of
|
||||||||||||||||||||
|
Amortized
|
Unrealized
|
Less than 12
|
More than 12
|
Fair
|
Fair
|
|||||||||||||||||||
|
Category
|
Cost
|
Gains
|
Months
|
Months
|
Value
|
Value
|
||||||||||||||||||
|
U.S. Treasury securities
|
$ | 606,389 | $ | 147,650 | $ | - | $ | - | $ | 754,039 | 14.4 | % | ||||||||||||
|
Political subdivisions of States,
|
||||||||||||||||||||||||
|
Territories and Possessions
|
1,417,679 | 70,284 | - | (54,189 | ) | 1,433,774 | 27.4 | % | ||||||||||||||||
|
Corporate and other bonds
|
||||||||||||||||||||||||
|
Industrial and miscellaneous
|
3,114,804 | 82,265 | (17,980 | ) | (125,807 | ) | 3,053,282 | 58.2 | % | |||||||||||||||
|
Total
|
$ | 5,138,872 | $ | 300,199 | $ | (17,980 | ) | $ | (179,996 | ) | $ | 5,241,095 | 100.0 | % | ||||||||||
U.S. Treasury securities included in held-to-maturity securities are held in trust pursuant to the New York State Department of Financial Services’ minimum funds requirement.
A summary of the amortized cost and fair value of the Company’s investments in held-to-maturity securities by contractual maturity as of March 31, 2016 and December 31, 2015 is shown below:
|
March 31, 2016
|
December 31, 2015
|
|||||||||||||||
|
Amortized
|
Amortized
|
|||||||||||||||
|
Remaining Time to Maturity
|
Cost
|
Fair Value
|
Cost
|
Fair Value
|
||||||||||||
|
Less than one year
|
$ | - | $ | - | $ | - | $ | - | ||||||||
|
One to five years
|
500,000 | 506,790 | 500,000 | 496,245 | ||||||||||||
|
Five to ten years
|
4,034,124 | 4,105,801 | 4,032,483 | 3,990,811 | ||||||||||||
|
More than 10 years
|
606,398 | 754,039 | 606,389 | 754,039 | ||||||||||||
|
Total
|
$ | 5,140,522 | $ | 5,366,630 | $ | 5,138,872 | $ | 5,241,095 | ||||||||
48
Credit Rating of Fixed-Maturity Securities
The table below summarizes the credit quality of our available-for-sale fixed-maturity securities as of March 31, 2016 and December 31, 2015 as rated by Standard & Poor’s (or, if unavailable from Standard & Poor’s, then Moody’s or Fitch):
|
March 31, 2016
|
December 31, 2015
|
|||||||||||||||
|
Percentage of
|
Percentage of
|
|||||||||||||||
|
Fair Market
|
Fair Market
|
Fair Market
|
Fair Market
|
|||||||||||||
|
Value
|
Value
|
Value
|
Value
|
|||||||||||||
|
Rating
|
||||||||||||||||
|
U.S. Treasury securities
|
$ | - | 0.0 | % | $ | - | 0.0 | % | ||||||||
|
Corporate and municipal bonds
|
||||||||||||||||
|
AAA
|
1,632,581 | 2.2 | % | 2,218,147 | 3.5 | % | ||||||||||
|
AA
|
7,988,483 | 10.9 | % | 9,060,781 | 14.5 | % | ||||||||||
| A | 11,998,733 | 16.4 | % | 10,639,888 | 17.0 | % | ||||||||||
|
BBB
|
33,793,283 | 46.3 | % | 35,592,750 | 57.1 | % | ||||||||||
|
Total corporate and municipal bonds
|
55,413,080 | 75.8 | % | 57,511,566 | 92.1 | % | ||||||||||
|
Residential mortgage backed securities
|
||||||||||||||||
|
AA
|
11,036,982 | 15.0 | % | - | 0.0 | % | ||||||||||
| A | 853,260 | 1.2 | % | 216,077 | 0.3 | % | ||||||||||
|
BBB
|
984,230 | 1.3 | % | - | 0.0 | % | ||||||||||
|
CCC
|
446,406 | 0.6 | % | 457,889 | 0.7 | % | ||||||||||
|
CC
|
396,165 | 0.5 | % | 402,558 | 0.6 | % | ||||||||||
| D | 4,099,893 | 5.6 | % | 3,913,974 | 6.3 | % | ||||||||||
|
Total residential mortgage backed securities
|
17,816,936 | 24.2 | % | 4,990,498 | 7.9 | % | ||||||||||
|
Total
|
$ | 73,230,016 | 100.0 | % | $ | 62,502,064 | 100.0 | % | ||||||||
The table below summarizes the average yield by type of fixed-maturity security as of March 31, 2016 and December 31, 2015:
|
Category
|
March 31, 2016
|
December 31, 2015
|
||||||
|
U.S. Treasury securities and
|
||||||||
|
obligations of U.S. government
|
||||||||
|
corporations and agencies
|
3.44 | % | 3.44 | % | ||||
|
Political subdivisions of States,
|
||||||||
|
Territories and Possessions
|
3.61 | % | 3.55 | % | ||||
|
Corporate and other bonds
|
||||||||
|
Industrial and miscellaneous
|
4.74 | % | 4.28 | % | ||||
|
Residential mortgage backed securities
|
4.10 | % | 6.24 | % | ||||
|
Total
|
4.42 | % | 4.26 | % | ||||
49
The table below lists the weighted average maturity and effective duration in years on our fixed-maturity securities as of March 31, 2016 and December 31, 2015:
|
March 31, 2016
|
December 31, 2015
|
|||||||
|
Weighted average effective maturity
|
5.0 | 5.5 | ||||||
|
Weighted average final maturity
|
8.6 | 7.3 | ||||||
|
Effective duration
|
4.4 | 4.9 | ||||||
Fair Value Consideration
As disclosed in Note 4 to the Condensed Consolidated Financial Statements, with respect to “Fair Value Measurements,” we define fair value as the price that would be received to sell an asset or paid to transfer a liability in a transaction involving identical or comparable assets or liabilities between market participants (an “exit price”). The fair value hierarchy distinguishes between inputs based on market data from independent sources (“observable inputs”) and a reporting entity’s internal assumptions based upon the best information available when external market data is limited or unavailable (“unobservable inputs”). The fair value hierarchy prioritizes fair value measurements into three levels based on the nature of the inputs. Quoted prices in active markets for identical assets have the highest priority (“Level 1”), followed by observable inputs other than quoted prices including prices for similar but not identical assets or liabilities (“Level 2”), and unobservable inputs, including the reporting entity’s estimates of the assumption that market participants would use, having the lowest priority (“Level 3”). As of March 31, 2016 and December 31, 2015, 59% and 66%, respectively, of the investment portfolio recorded at fair value was priced based upon quoted market prices.
As more fully described in Note 3 to our Condensed Consolidated Financial Statements, “Investments—Impairment Review,” we completed a detailed review of all our securities in a continuous loss position as of March 31, 2016 and December 31, 2015, and concluded that the unrealized losses in these asset classes are temporary in nature and the result of a decrease in value due to technical spread widening and broader market sentiment, rather than fundamental collateral deterioration.
50
The table below summarizes the gross unrealized losses of our fixed-maturity securities available-for-sale and equity securities by length of time the security has continuously been in an unrealized loss position as of March 31, 2016 and December 31, 2015:
|
March 31, 2016
|
||||||||||||||||||||||||||||||||
|
Less than 12 months
|
12 months or more
|
Total
|
||||||||||||||||||||||||||||||
|
|
No. of
|
No. of
|
Aggregate
|
|||||||||||||||||||||||||||||
|
Fair
|
Unrealized
|
Positions
|
Fair
|
Unrealized
|
Positions
|
Fair
|
Unrealized
|
|||||||||||||||||||||||||
|
Category
|
Value
|
Losses
|
Held
|
Value
|
Losses
|
Held
|
Value
|
Losses
|
||||||||||||||||||||||||
| Fixed-Maturity Securities: | ||||||||||||||||||||||||||||||||
|
Political subdivisions of States, Territories and Possessions
|
$ | 334,827 | $ | (2,510 | ) | 1 | $ | 339,627 | $ | (5,060 | ) | 1 | $ | 674,454 | $ | (7,570 | ) | |||||||||||||||
|
Corporate and other bonds industrial and miscellaneous
|
5,269,173 | (210,199 | ) | 13 | 687,228 | (59,298 | ) | 2 | 5,956,401 | (269,497 | ) | |||||||||||||||||||||
|
Residential mortgage backed securities
|
1,614,256 | (36,904 | ) | 10 | - | - | - | 1,614,256 | (36,904 | ) | ||||||||||||||||||||||
|
Total fixed-maturitysecurities
|
$ | 7,218,256 | $ | (249,613 | ) | 24 | $ | 1,026,855 | $ | (64,358 | ) | 3 | $ | 8,245,111 | $ | (313,971 | ) | |||||||||||||||
|
Equity Securities:
|
||||||||||||||||||||||||||||||||
|
Preferred stocks
|
$ | - | $ | - | - | $ | 701,250 | $ | (30,072 | ) | 1 | $ | 701,250 | $ | (30,072 | ) | ||||||||||||||||
|
Common stocks
|
1,502,700 | (65,438 | ) | 4 | - | - | - | 1,502,700 | (65,438 | ) | ||||||||||||||||||||||
|
Total equity securities
|
$ | 1,502,700 | $ | (65,438 | ) | 4 | $ | 701,250 | $ | (30,072 | ) | 1 | $ | 2,203,950 | $ | (95,510 | ) | |||||||||||||||
|
Total
|
$ | 8,720,956 | $ | (315,051 | ) | $ | 28 | $ | 1,728,105 | $ | (94,430 | ) | $ | 4 | $ | 10,449,061 | $ | (409,481 | ) | |||||||||||||
51
|
December 31, 2015
|
||||||||||||||||||||||||||||||||
|
Less than 12 months
|
12 months or more
|
Total
|
||||||||||||||||||||||||||||||
|
|
No. of
|
No. of
|
Aggregate
|
|||||||||||||||||||||||||||||
|
Fair
|
Unrealized
|
Positions
|
Fair
|
Unrealized
|
Positions
|
Fair
|
Unrealized
|
|||||||||||||||||||||||||
|
Category
|
Value
|
Losses
|
Held
|
Value
|
Losses
|
Held
|
Value
|
Losses
|
||||||||||||||||||||||||
| Fixed-Maturity Securities: | ||||||||||||||||||||||||||||||||
|
Political subdivisions of States, Territories and Possessions
|
$ | 1,432,005 | $ | (15,889 | ) | 4 | $ | - | $ | - | - | $ | 1,432,005 | $ | (15,889 | ) | ||||||||||||||||
|
Corporate and other bonds industrial and miscellaneous
|
18,424,609 | (512,427 | ) | 32 | 636,093 | (99,593 | ) | 2 | 19,060,702 | (612,020 | ) | |||||||||||||||||||||
|
Residential mortgage backed securities
|
2,413,980 | (61,169 | ) | 12 | - | - | - | 2,413,980 | (61,169 | ) | ||||||||||||||||||||||
|
Total fixed-maturity securities
|
$ | 22,270,594 | $ | (589,485 | ) | 48 | $ | 636,093 | $ | (99,593 | ) | 2 | $ | 22,906,687 | $ | (689,078 | ) | |||||||||||||||
|
Equity Securities:
|
||||||||||||||||||||||||||||||||
|
Preferred stocks
|
$ | - | $ | - | - | $ | 702,000 | $ | (29,322 | ) | 1 | $ | 702,000 | $ | (29,322 | ) | ||||||||||||||||
|
Common stocks
|
2,538,900 | (103,721 | ) | 6 | - | - | - | 2,538,900 | (103,721 | ) | ||||||||||||||||||||||
|
Total equity securities
|
$ | 2,538,900 | $ | (103,721 | ) | 6 | $ | 702,000 | $ | (29,322 | ) | 1 | $ | 3,240,900 | $ | (133,043 | ) | |||||||||||||||
|
Total
|
$ | 24,809,494.00 | $ | (693,206.00 | ) | $ | 54.00 | $ | 1,338,093.00 | $ | (128,915.00 | ) | $ | 3.00 | $ | 26,147,587.00 | $ | (822,121.00 | ) | |||||||||||||
52
There were 32 securities at March 31, 2016 that accounted for the gross unrealized loss, none of which were deemed by us to be other than temporarily impaired. There were 57 securities at December 31, 2015 that accounted for the gross unrealized loss, none of which were deemed by us to be other than temporarily impaired. Significant factors influencing our determination that unrealized losses were temporary included the magnitude of the unrealized losses in relation to each security’s cost, the nature of the investment and management’s intent not to sell these securities and it being not more likely than not that we will be required to sell these investments before anticipated recovery of fair value to our cost basis.
Liquidity and Capital Resources
Cash Flows
The primary sources of cash flow are from our insurance underwriting subsidiary, KICO, and include direct premiums written, ceding commissions from our quota share reinsurers, loss recovery payments from our reinsurers, investment income and proceeds from the sale or maturity of investments. Funds are used by KICO for ceded premium payments to reinsurers, which are paid on a net basis after subtracting losses paid on reinsured claims and reinsurance commissions. KICO also uses funds for loss payments and loss adjustment expenses on our net business, commissions to producers, salaries and other underwriting expenses as well as to purchase investments and fixed assets.
On April 18, 2016 we sold 595,238 newly issued shares of our common stock to RenaissanceRe Ventures Ltd., a subsidiary of RenaissanceRe Holdings Ltd. (NYSE:RNR) (“RenaissanceRe”), in a private placement. RenaissanceRe is a global provider of catastrophe and specialty reinsurance and insurance. The new common shares were sold to RenaissanceRe at a price of $8.40 per share. We received net proceeds of approximately $4,850,000 from the private placement. We intend to use the net proceeds of the offering to support the continued growth of KICO, and for general corporate purposes.
Through the quarter ended March 31, 2016, the primary sources of cash flow for our holding company are dividends received from KICO, subject to statutory restrictions. For the three months ended March 31, 2016, KICO paid dividends of $450,000 to us.
If the aforementioned sources of cash flow currently available are insufficient to cover our holding company cash requirements, we will seek to obtain additional financing.
Our reconciliation of net income to net cash provided by operations is generally influenced by the collection of premiums in advance of paid losses, the timing of reinsurance, issuing company settlements and loss payments.
53
Cash flow and liquidity are categorized into three sources: (1) operating activities; (2) investing activities; and (3) financing activities, which are shown in the following table:
|
Three Months Ended March 31,
|
2016
|
2015
|
||||||
|
Cash flows provided by (used in):
|
||||||||
|
Operating activities
|
$ | 2,672,714 | $ | 834,077 | ||||
|
Investing activities
|
(10,091,378 | ) | (3,940,506 | ) | ||||
|
Financing activities
|
(553,484 | ) | (516,794 | ) | ||||
|
Net decrease in cash and cash equivalents
|
(7,972,148 | ) | (3,623,223 | ) | ||||
|
Cash and cash equivalents, beginning of period
|
13,551,372 | 9,906,878 | ||||||
|
Cash and cash equivalents, end of period
|
$ | 5,579,224 | $ | 6,283,655 | ||||
Net cash provided by operating activities was $2,673,000 in 2016 as compared to $834,000 provided in 2015. The $1,839,000 increase in cash flows provided by operating activities in 2016 was primarily a result of an increase in cash arising from net fluctuations in assets and liabilities relating to operating activities of KICO as affected by the growth in its operations which are described above, and an increase in net income (adjusted for non-cash items) of $31,000.
Net cash used in investing activities was $10,091,000 in 2016 compared to $3,941,000 used in 2015. The $6,150,000 increase in cash used in investing activities is the result of a $13,228,000 increase in acquisitions of invested assets and collection of a $250,000 note receivable included in other assets, offset by a $6,845,000 increase in sales or maturities of invested assets.
Net cash used in financing activities was $553,000 in 2016 compared to $517,000 used in 2015. The $36,000 increase in cash used in financing activities is the result of a $92,000 increase in dividends paid due an increase in the dividend rate, offset partially by a $33,000 decrease in the purchase of treasury stock.
Reinsurance
Our quota share reinsurance treaties are on a July 1 through June 30 fiscal year basis; therefore, for year to date fiscal periods after June 30, two separate treaties will be included in such periods.
Our quota share reinsurance treaty in effect for 2016 for our personal lines business, which primarily consists of homeowners’ policies, was covered under the 2015/2016 Treaty. Our quota share reinsurance treaty in effect for 2015 for our personal lines business, which primarily consists of homeowners’ policies, was covered under the 2014/2015 Treaty.
Our personal lines quota share treaty that covered the July 1, 2013/June 30, 2014 treaty year was a two year treaty that expired on June 30, 2015. Effective July 1, 2014, we exercised our contractual option to reduce the ceding percentage in the personal lines quota share treaty from 75% to 55%. We entered into new annual treaties with different terms effective July 1, 2015. Our 2014/2015 Treaty and 2015/2016 Treaty provide for the following material terms:
54
|
Treaty Year
|
||||||||
|
July 1, 2015
|
July 1, 2014
|
|||||||
|
to
|
to
|
|||||||
|
Line of Busines
|
June 30, 2016
|
June 30, 2015
|
||||||
|
Personal Lines:
|
||||||||
|
Homeowners, dwelling fire and canine legal liability
|
||||||||
|
Quota share treaty:
|
||||||||
|
Percent ceded
|
40 | % | 55 | % | ||||
|
Risk retained
|
$ | 450,000 | $ | 360,000 | ||||
|
Losses per occurrence subject to quota share reinsurance coverage
|
$ | 750,000 | $ | 800,000 | ||||
|
Excess of loss coverage above quota share coverage
|
$ | 3,750,000 | $ | 3,200,000 | ||||
|
in excess of
|
in excess of
|
|||||||
| $ | 750,000 | $ | 800,000 | |||||
|
Total reinsurance coverage per occurrence
|
$ | 4,050,000 | $ | 3,640,000 | ||||
|
Losses per occurrence subject to reinsurance coverage
|
$ | 4,500,000 | $ | 4,000,000 | ||||
|
Expiration date
|
June 30, 2016
|
June 30, 2015
|
||||||
|
Personal Umbrella
|
||||||||
|
Quota share treaty:
|
||||||||
|
Percent ceded - first million dollars of coverage
|
90 | % | 90 | % | ||||
|
Percent ceded - excess of one million dollars of coverage
|
100 | % | 100 | % | ||||
|
Risk retained
|
$ | 100,000 | $ | 100,000 | ||||
|
Total reinsurance coverage per occurrence
|
$ | 2,900,000 | $ | 2,900,000 | ||||
|
Losses per occurrence subject to quota share reinsurance coverage
|
$ | 3,000,000 | $ | 3,000,000 | ||||
|
Expiration date
|
June 30, 2016
|
June 30, 2015
|
||||||
|
Commercial Lines:
|
||||||||
|
General liability commercial policies, except for commercial auto
|
||||||||
|
Quota share treaty:
|
||||||||
|
Percent ceded (terminated effective July 1, 2014)
|
None
|
None
|
||||||
|
Risk retained
|
$ | 425,000 | $ | 400,000 | ||||
|
Losses per occurrence subject to quota share reinsurance coverage
|
None
|
None
|
||||||
|
Excess of loss coverage above quota share coverage
|
$ | 4,075,000 | $ | 3,600,000 | ||||
|
in excess of
|
in excess of
|
|||||||
| $ | 425,000 | $ | 400,000 | |||||
|
Total reinsurance coverage per occurrence
|
$ | 4,075,000 | $ | 3,600,000 | ||||
|
Losses per occurrence subject to reinsurance coverage
|
$ | 4,500,000 | $ | 4,000,000 | ||||
|
Commercial Auto:
|
||||||||
|
Risk retained
|
$ | 300,000 | $ | 300,000 | ||||
|
Excess of loss coverage in excess of risk retained
|
$ | 1,700,000 | $ | 1,700,000 | ||||
|
in excess of
|
in excess of
|
|||||||
| $ | 300,000 | $ | 300,000 | |||||
|
Catastrophe Reinsurance:
|
||||||||
|
Initial loss subject to personal lines quota share treaty
|
$ | 4,000,000 | $ | 4,000,000 | ||||
|
Risk retained per catastrophe occurrence (1)
|
$ | 2,400,000 | $ | 1,800,000 | ||||
|
Catastrophe loss coverage in excess of quota share coverage (2) (3)
|
$ | 176,000,000 | $ | 137,000,000 | ||||
|
Severe winter weather aggregate (3)
|
Yes
|
Yes
|
||||||
|
Reinstatement premium protection (4)
|
Yes
|
No
|
||||||
1. Plus losses in excess of catastrophe coverage.
2. Catastrophe coverage is limited on an annual basis to two times the per occurrence amounts. Effective July 1, 2015, the duration of a catastrophe occurrence from windstorm, hail, tornado, hurricane and cyclone was extended to 120 consecutive hours from 96 consecutive hours.
3. Effective July 1, 2014, our catastrophe treaty also covers losses caused by severe winter weather during any consecutive 28 day period.
4. Effective July 1, 2015, reinstatement premium protection for $16,000,000 of catastrophe coverage in excess of $4,000,000.
55
The single maximum risks per occurrence to which we are subject under the new treaties effective July 1, 2015 and under the treaties that expired on June 30, 2015 are as follows:
|
July 1, 2015 - June 30, 2016
|
July 1, 2014 - June 30, 2015
|
|||||||
|
Treaty
|
Extent of Loss
|
Risk Retained
|
Extent of Loss
|
Risk Retained
|
||||
|
Personal Lines
|
Initial $750,000
|
$450,000
|
Initial $800,000
|
$360,000
|
||||
|
$750,000 - $4,500,000
|
None(1)
|
$800,000 - $4,000,000
|
None(1)
|
|||||
|
Over $4,500,000
|
100%
|
Over $4,000,000
|
100%
|
|||||
|
Personal Umbrella
|
Initial $1,000,000
|
$100,000
|
Initial $1,000,000
|
$100,000
|
||||
|
$1,000,000 - $3,000,000
|
None(1)
|
$1,000,000 - $3,000,000
|
None(1)
|
|||||
|
Over $3,000,000
|
100%
|
Over $3,000,000
|
100%
|
|||||
|
Commercial Lines
|
Initial $425,000
|
$425,000
|
Initial $400,000
|
$400,000
|
||||
|
$425,000 - $4,500,000
|
None(1)
|
$400,000 - $4,000,000
|
None(1)
|
|||||
|
Over $4,500,000
|
100%
|
Over $4,000,000
|
100%
|
|||||
|
Commercial Auto
|
Initial $300,000
|
$300,000
|
Initial $300,000
|
$300,000
|
||||
|
$300,000 - $2,000,000
|
None(1)
|
$300,000 - $2,000,000
|
None(1)
|
|||||
|
Over $2,000,000
|
100%
|
Over $2,000,000
|
100%
|
|||||
|
Catastrophe (2)
|
Initial $4,000,000
|
$2,400,000
|
Initial $4,000,000
|
$1,800,000
|
||||
|
$4,000,000 - $180,000,000
|
None
|
$4,000,000 - $141,000,000
|
None
|
|||||
|
Over $180,000,000
|
100%
|
Over $141,000,000
|
100%
|
|||||
_______________
(1) Covered by excess of loss treaties.
(2) Catastrophe coverage is limited on an annual basis to two times the per occurrence amounts.
Off-Balance Sheet Arrangements
We have no off-balance sheet arrangements that have or are reasonably likely to have a current or future effect on our financial condition, changes in financial condition, revenues or expenses, results of operations, liquidity, capital expenditures or capital resources that is material to investors.
Factors That May Affect Future Results and Financial Condition
Based upon the factors set forth under “Factors That May Affect Future Results and Financial Condition” in Item 7 of our Annual Report on Form 10-K for the year ended December 31, 2015, as well as other factors affecting our operating results and financial condition, past financial performance should not be considered to be a reliable indicator of future performance, and investors should not use historical trends to anticipate results or trends in future periods. In addition, such factors, among others, may affect the accuracy of certain forward-looking statements contained in our periodic reports, including this Quarterly Report.
56
Not applicable
Evaluation of Disclosure Controls and Procedures
We maintain disclosure controls and procedures (as defined in Exchange Act Rule 13a-15(e)) that are designed to assure that information required to be disclosed in our Exchange Act reports is recorded, processed, summarized and reported within the time periods specified in the SEC’s rules and forms, and that such information is accumulated and communicated to management, including our Chief Executive Officer and Chief Financial Officer, as appropriate, to allow timely decisions regarding required disclosures.
As required by Exchange Act Rule 13a-15(b), as of the end of the period covered by this Quarterly Report, under the supervision and with the participation of our Chief Executive Officer and Chief Financial Officer, we evaluated the effectiveness of our disclosure controls and procedures. Based on this evaluation, our Chief Executive Officer and Chief Financial Officer concluded that our disclosure controls and procedures were effective as of March 31, 2016.
Changes in Internal Control over Financial Reporting
There was no change in our internal control over financial reporting during our most recently completed fiscal quarter that has materially affected, or is reasonably likely to materially affect, our internal control over financial reporting.
57
PART II. OTHER INFORMATION
None
Not applicable
(a) None
(b) Not applicable
(c) The following table sets forth certain information with respect to purchases of common stock made by us or any “affiliated purchaser” during the quarter ended March 31, 2016:
|
Period
|
Total Number of Shares Purchased
|
Average Price Paid per Share
|
Total Number of Shares Purchased as Part of Publicly Announced Plans or Programs
|
Maximum Number of Shares that May Be Purchased Under the Plans or Programs
|
||||||||||||
|
1/1/16 - 1/31/16
|
7,000 | $ | 8.31 | - | - | |||||||||||
|
2/1/16 – 2/29/16
|
- | - | - | - | ||||||||||||
|
3/1/16 – 3/31/16
|
6,008 | (1) | $ | 8.35 | (1) | - | - | |||||||||
|
Total
|
13,008 | $ | 8.33 | (1) | - | - | ||||||||||
(1) Includes 1,508 shares purchased by “affiliated purchaser” at a price of $8.25 per share.
None
Not applicable
None
58
| Exhibit No. | Description | |
|
3(a)
|
Restated Certificate of Incorporation, as amended1
|
|
|
3(b)
|
By-laws, as amended2
|
|
|
|
|
|
|
Rule 13a-14(a)/15d-14(a) Certification of Principal Executive Officer as adopted pursuant to Section 302 of the Sarbanes-Oxley Act of 2002
|
||
|
|
|
|
|
Rule 13a-14(a)/15d-14(a) Certification of Principal Financial Officer as adopted pursuant to Section 302 of the Sarbanes-Oxley Act of 2002
|
||
|
Certification of Chief Executive Officer and Chief Financial Officer Certification of Chief Executive Officer and Chief Financial Officer Pursuant to 18 U.S.C. Section 1350, as Adopted Pursuant to Section 906 of the Sarbanes-Oxley Act of 2002
|
||
|
|
|
|
|
101.INS
|
XBRL Instance Document
|
|
|
|
|
|
|
101.SCH
|
101.SCH XBRL Taxonomy Extension Schema.
|
|
|
|
|
|
|
101.CAL
|
101.CAL XBRL Taxonomy Extension Calculation Linkbase.
|
|
|
|
|
|
|
101.DEF
|
101.DEF XBRL Taxonomy Extension Definition Linkbase.
|
|
|
|
|
|
|
101.LAB
|
101.LAB XBRL Taxonomy Extension Label Linkbase.
|
|
|
|
|
|
|
101.PRE
|
101.PRE XBRL Taxonomy Extension Presentation Linkbase.
|
1Denotes document filed as Exhibit 3 (a) to our Quarterly Report on Form 10-Q for the period ended March 31, 2014 and incorporated herein by reference.
2 Denotes document filed Exhibit 3.1 to our Current Report on Form 8-K for an event dated November 5, 2009 and incorporated herein by reference.
59
Pursuant to the requirements of the Securities Exchange Act of 1934, the registrant has duly caused this report to be signed on its behalf by the undersigned thereunto duly authorized.
|
KINGSTONE COMPANIES, INC.
|
|||
|
Dated: May 12, 2016
|
By:
|
/s/ Barry B. Goldstein | |
| Barry B. Goldstein | |||
| President | |||
|
Dated: May 12, 2016
|
By:
|
/s/ Victor Brodsky | |
| Victor Brodsky | |||
|
Chief Financial Officer
|
|||