Attached files
| file | filename |
|---|---|
| 8-K - 8-K - Green Plains Partners LP | gpp-20160512x8k.htm |
| EX-23.1 - EX-23.1 - Green Plains Partners LP | gpp-20160512xex23_1.htm |
| EX-10.1 - EX-10.1 - Green Plains Partners LP | gpp-20160512xex10_1.htm |
GREEN PLAINS PARTNERS LP
RECAST OF CERTAIN SECTIONS OF THE 2015 ANNUAL REPORT ON FORM 10-K
TABLE OF CONTENTS
|
|
|
|
|
|
Page |
|
|
PART I |
||
|
2 |
||
|
|
|
|
|
Recast Item 1. |
4 |
|
|
|
||
|
PART II |
||
|
|
||
|
Recast Item 6. |
12 |
|
|
|
||
|
Recast Item 7. |
Management’s Discussion and Analysis of Financial Condition and Results of Operations. |
15 |
|
|
||
|
PART IV |
||
|
|
||
|
Recast Item 15. |
24 |
|
|
|
||
1
The abbreviations, acronyms and industry terminology used in this report are defined as follows:
Green Plains Partners LP and Subsidiaries:
|
Birmingham |
Birmingham BioEnergy Partners LLC, a subsidiary of BlendStar LLC |
|
BlendStar |
BlendStar LLC and its subsidiaries, the partnership’s predecessor for accounting purposes |
|
Green Plains Capital Company |
Green Plains Capital Company LLC |
|
Green Plains Ethanol Storage |
Green Plains Ethanol Storage LLC |
|
Green Plains Logistics |
Green Plains Logistics LLC |
|
Green Plains Operating Company |
Green Plains Operating Company LLC |
|
Green Plains Partners; the partnership |
Green Plains Partners LP and its subsidiaries |
|
Green Plains Trucking II |
Green Plains Trucking II LLC |
|
MLP predecessor |
BlendStar LLC and its subsidiaries, and the assets, liabilities and results of operations of the ethanol storage and leased railcar assets contributed by Green Plains |
Green Plains Inc. and Subsidiaries:
|
Green Plains; our parent or sponsor |
Green Plains Inc. and its subsidiaries |
|
Green Plains Hereford |
Green Plains Hereford LLC |
|
Green Plains Holdings |
Green Plains Holdings LLC; our general partner |
|
Green Plains Hopewell |
Green Plains Hopewell LLC |
|
Green Plains Obion |
Green Plains Obion LLC |
|
Green Plains Trade |
Green Plains Trade Group LLC |
|
Green Plains Trucking |
Green Plains Trucking LLC |
Accounting Defined Terms:
|
ARO |
Asset retirement obligation |
|
ASC |
Accounting Standards Codification |
|
EBITDA |
Earnings before interest, taxes, depreciation and amortization |
|
Exchange Act |
Securities Exchange Act of 1934, as amended |
|
FASB |
Financial Accounting Standards Board |
|
GAAP |
U.S. Generally Accepted Accounting Principles |
|
IDR |
Incentive distribution right |
|
IPO |
Initial public offering of Green Plains Partners LP |
|
IRA |
Individual retirement account |
|
IRS |
Internal Revenue Service |
|
JOBS Act |
Jumpstart Our Business Startups Act of 2012 |
|
LIBOR |
London Interbank Offered Rate |
|
LTIP |
Green Plains Partners LP 2015 Long-Term Incentive Plan |
|
Nasdaq |
The Nasdaq Global Market |
|
NEO |
Named executive officer |
|
NMTC |
New markets tax credits |
|
PCAOB |
Public Company Accounting Oversight Board |
|
Securities Act |
Securities Act of 1933 |
|
SEC |
Securities and Exchange Commission |
Industry Defined Terms:
|
Bgy |
Billion gallons per year |
|
BNSF |
BNSF Railway Company |
|
CAFE |
Corporate Average Fuel Economy |
|
CARB |
California Air Resources Board |
|
CBOB |
Conventional blendstock for oxygenate blending |
|
Clean Water Act |
Water Pollution Control Act of 1972 |
2
|
CSX |
CSX Transportation, Inc. |
|
DOT |
U.S. Department of Transportation |
|
E15 |
Gasoline blended with up to 15% ethanol by volume |
|
E85 |
Gasoline blended with up to 85% ethanol by volume |
|
EIA |
U.S. Energy Information Administration |
|
EISA |
Energy Independence and Security Act of 2007, as amended |
|
EPA |
U.S. Environmental Protection Agency |
|
FRA |
Federal Railroad Administration |
|
ILUC |
Indirect land usage charge |
|
KCS |
Kansas City Southern Railway Company |
|
LCFS |
Low Carbon Fuel Standard |
|
Mmg |
Million gallons |
|
Mmgy |
Million gallons per year |
|
MTBE |
Methyl tertiary-butyl ether |
|
OSHA |
U.S. Occupational Safety and Health Administration |
|
PHMSA |
Pipeline and Hazardous Materials Safety Administration |
|
RFS II |
Renewable Fuels Standard II |
|
RIN |
Renewable identification number |
|
U.S. |
United States |
|
USDA |
U.S. Department of Agriculture |
3
PART I
References to “we,” “our,” “us” or the “partnership” used in present tense for periods beginning on or after July 1, 2015, refer to Green Plains Partners LP and its subsidiaries. References to the “MLP predecessor” used in a historical context for periods ended on or before June 30, 2015, refer to BlendStar LLC and its subsidiaries, the partnership’s predecessor for accounting purposes, and the assets, liabilities and results of operations of the ethanol storage and leased railcar assets contributed by Green Plains in connection with the IPO on July 1, 2015. References to our “sponsor” in transactions subsequent to the IPO refer to Green Plains.
Formation, Initial Public Offering and Subsequent Drop Down
We are a master limited partnership formed by our parent on March 2, 2015. On July 1, 2015, we completed our IPO of 11,500,000 common units representing limited partner interests. Our common units are traded under the symbol “GPP” on Nasdaq. After completing the IPO, in addition to the interests of BlendStar, we received the assets and liabilities of the ethanol storage and leased railcar assets, previously owned and operated by our parent, in a transfer between entities under common control.
Effective January 1, 2016, we acquired the ethanol storage and leased railcar assets of the Hereford, Texas and Hopewell, Virginia ethanol production facilities from our sponsor in a transfer between entities under common control. The assets were recognized at historical cost and reflected retroactively along with related expenses for periods prior to the effective date of the acquisition, subsequent to the initial dates the assets were acquired by our sponsor, or October 23, 2015, and November 12, 2015, for Hopewell and Hereford, respectively. There were no revenues related to these assets for periods before January 1, 2016, when amendments to our commercial agreements related to the drop down became effective.
Overview
Green Plains Partners is a Delaware limited partnership that provides fee-based fuel storage and transportation services by owning, operating, developing and acquiring ethanol and fuel storage tanks, terminals, transportation assets and other related assets and businesses. We were formed by Green Plains, a vertically integrated ethanol producer, to support its marketing and distribution activities as its primary downstream logistics provider.
We generate a substantial portion of our revenues under fee-based commercial agreements with Green Plains Trade for receiving, storing, transferring and transporting ethanol and other fuels, which are supported by minimum volume or take-or-pay capacity commitments. We do not take ownership or receive any payments based on the value of the ethanol or other fuels we handle. As a result, we do not have any direct exposure to fluctuating commodity prices.
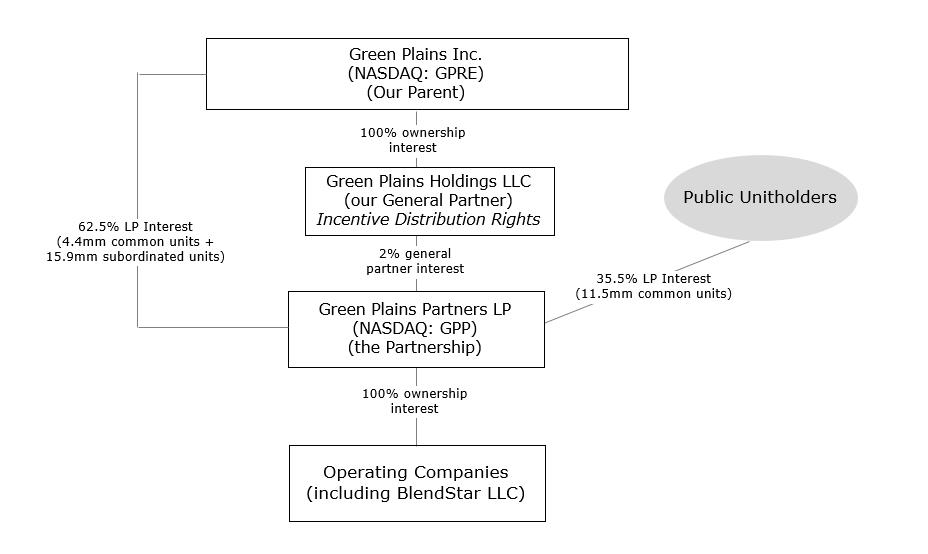
Our parent owns a 62.5% limited partner interest in us, consisting of 4,389,642 common units and 15,889,642 subordinated units, all of our incentive distribution rights and a 2.0% general partner interest. The public owns the remaining 35.5% limited partner interest. The following diagram depicts our simplified organizational structure at December 31, 2015:
4
Our Assets and Operations
Ethanol Storage. Our ethanol storage assets are the principal method of storing the ethanol produced at our parent’s ethanol production plants. Each of our parent’s ethanol production plants are located near major rail lines. Ethanol is distributed from our storage facilities to bulk terminals via truck or railcar.
We own 30 ethanol storage facilities and approximately 47 acres of land. Our storage tanks are located at our parent’s 14 ethanol production plants in Indiana, Iowa, Michigan, Minnesota, Nebraska, Tennessee, Texas and Virginia.
Our ethanol storage tanks have combined storage capacity of approximately 31.8 mmg and aggregate throughput capacity of approximately 1,677 mmgy. For the year ended December 31, 2015, the ethanol storage assets had throughput of approximately 948 mmg, representing 91.1% of our parent’s daily average production capacity. The following table presents additional ethanol production plant details by location:
|
Plant Location |
Initial Operation or Acquisition Date |
Major Rail Line Access |
Plant Production Capacity (mmgy) |
On-Site Ethanol Storage Capacity (thousands of gallons) |
Throughput |
|
Atkinson, Nebraska |
June 2013 |
BNSF |
53 |
2,074 |
45 |
|
Bluffton, Indiana |
Sept. 2008 |
Norfolk Southern |
120 |
3,000 |
116 |
|
Central City, Nebraska |
July 2009 |
Union Pacific |
106 |
2,250 |
101 |
|
Fairmont, Minnesota |
Nov. 2013 |
Union Pacific |
119 |
3,124 |
91 |
|
Hereford, Texas (1) |
Nov. 2015 |
BNSF |
100 |
4,406 |
12 |
|
Hopewell, Virginia (1)(2) |
Oct. 2015 |
Norfolk Southern |
60 |
761 |
- |
|
Lakota, Iowa |
Oct. 2010 |
Union Pacific |
112 |
2,500 |
99 |
|
Obion, Tennessee |
Nov. 2008 |
Canadian National |
120 |
3,000 |
115 |
|
Ord, Nebraska |
July 2009 |
Union Pacific |
55 |
1,550 |
56 |
|
Otter Tail, Minnesota |
Mar. 2011 |
BNSF |
60 |
2,000 |
49 |
|
Riga, Michigan |
Oct. 2010 |
Norfolk Southern |
60 |
1,239 |
50 |
|
Shenandoah, Iowa |
Aug. 2007 |
BNSF |
69 |
1,524 |
69 |
|
Superior, Iowa |
July 2008 |
Union Pacific |
60 |
1,238 |
51 |
|
Wood River, Nebraska |
Nov. 2013 |
Union Pacific |
121 |
3,124 |
94 |
|
Total |
1,215 |
31,790 |
948 |
(1) The ethanol storage and railcar assets at the Hereford and Hopewell plants were acquired on January 1, 2016, from our parent. Throughput for the year ended December 31, 2015, relates only to the period since the assets were acquired by our parent.
(2) The Hopewell plant resumed operations on February 8, 2016.
5
Terminal and Distribution Services. We own and operate eight fuel terminals with access to major rail lines that have combined total storage capacity of approximately 7.4 mmg in Alabama, Louisiana, Mississippi, Kentucky, Tennessee and Oklahoma. We also own approximately five acres of land and lease approximately 19 acres of land where our fuel terminals are located. For the year ended December 31, 2015, the aggregate throughput at these facilities was approximately 321.5 mmg.
Ethanol is transported from our terminals to third-parties for blending with gasoline and transferred to a loading rack for delivery by truck to retail gas stations. Our Birmingham facility is one of 20 facilities in the United States capable of efficiently receiving and offloading ethanol and other fuels from unit trains.
The following table presents additional fuel terminal details by location:
|
Fuel Terminal Facility Location |
Major |
On-Site Storage Capacity |
Throughput Capacity (mmgy) |
|
Birmingham, Alabama - Unit Train Terminal |
BNSF |
6,542 |
300 |
|
Other Fuel Terminal Facilities |
(1) |
880 |
522 |
|
|
7,422 |
822 |
(1) Access to our seven other fuel terminal facilities is available from BNSF, KCS, Canadian National, Union Pacific, Norfolk Southern and CSX.
Transportation and Delivery. Ethanol deliveries to distant markets are shipped using major U.S. rail carriers that can switch cars to other major railroads. Currently, our leased railcar fleet consists of approximately 2,700 railcars with an aggregate capacity of approximately 79.6 mmg. We expect our railcar volumetric capacity will fluctuate over the normal course of business as our existing railcar leases expire and we enter into or acquire new railcar leases. Our volumetric capacity is used to transport product primarily from our fuel terminals or third-party production facilities to international export terminals and refineries located throughout the United States.
We also own and operate a fleet of seven trucks to transport ethanol and other biofuels.
Segments
Our operations consist of one reportable segment with all business activities conducted in the United States.
Our Relationship with Green Plains
Our parent is a vertically integrated producer, marketer and distributor of ethanol and the fourth largest producer in North America. Our parent mitigates commodity price volatility by having operations throughout the ethanol value chain, which differentiates it from other companies focused only on ethanol production.
We benefit significantly from our relationship with our parent. Our assets are the principal method of storing and delivering the ethanol our parent produces for its customers and the commercial agreements with Green Plains Trade account for a substantial portion of our revenues.
Our parent has a majority interest in us through ownership of our general partner, a 62.5% limited partner interest and all of our incentive distribution rights. We believe our parent will continue to support the successful execution of our business strategies given its significant ownership in us and the importance of our assets to Green Plains’ operations.
We entered into several agreements with our parent, which were established in conjunction with the IPO, including: an omnibus agreement; a contribution, conveyance and assumption agreement; an operational services and secondment agreement; and various commercial agreements described below. For additional information related to these agreements, please refer to Note 3 – Initial Public Offering to the consolidated financial statements included under Recast Item 15 – Exhibits, Financial Statement Schedules.
Commercial Agreements with Affiliate
A substantial portion of our revenues and cash flows are derived from our commercial agreements with Green Plains Trade, our primary customer, including a (1) ten-year fee-based storage and throughput agreement, (2) Birmingham terminal services agreement, (3) six-year fee-based rail transportation services agreement and (4) various other transportation and terminal services agreements. For the agreements in their entirety, please refer to the current report on Form 8-K filed with the SEC on July 6, 2015, and the amendments filed with our annual report on Form 10-K, filed with the SEC on February 18,
6
2016, or our 2015 annual report.
Minimum Volume Commitments. Our storage and throughput agreement and certain terminal services agreements with Green Plains Trade are supported by minimum volume commitments. Our rail transportation services agreement is supported by minimum take-or-pay capacity commitments. Green Plains Trade is required to pay us fees for these minimum commitments regardless of the actual throughput or volume, capacity used or amount of product tendered for transport, assuring us that we will receive a certain amount of revenue during the terms of these agreements. The nature of these arrangements will provide stable and predictable cash flows over time.
Storage and Throughput Agreement. Under our storage and throughput agreement, Green Plains Trade is obligated to throughput a minimum of 246.5 mmg of product per calendar quarter at our storage facilities. Green Plains Trade is obligated to pay $0.05 per gallon on all throughput volumes, subject to an inflation escalator based on the producer price index following the last day of the primary term’s fifth year. If Green Plains Trade fails to meet its minimum volume commitment during any quarter, Green Plains Trade will pay us a deficiency payment equal to the deficient volume multiplied by the applicable fee. The deficiency payment may be applied as a credit toward volumes throughput by Green Plains Trade in excess of the minimum volume commitment during the next four quarters, after which time any unused credits will expire. For each of the quarters ended September 30, 2015, and December 31, 2015, Green Plains Trade met its minimum volume commitment, with throughput of 215.6 mmg and 248.8 mmg, respectively. At December 31, 2015, the remaining primary term of our storage and throughput agreement was 9.5 years. The storage and throughput agreement will automatically renew for successive one-year terms unless either party provides written notice of its intent to terminate at least 360 days prior to the end of the remaining primary or renewal term.
The current minimum volume commitment was increased from 212.5 mmg of product per calendar quarter in connection with the acquisition of the Hereford, Texas and Hopewell, Virginia ethanol storage and leased railcar assets, effective January 1, 2016. All other terms and conditions are substantially the same as the initial agreement.
Terminal Services Agreement. Under our terminal services agreement for the Birmingham facility, Green Plains Trade is obligated to pay $0.0355 per gallon on all throughput volumes, subject to a minimum volume commitment of approximately 2.8 mmg per month of ethanol and other fuels, equivalent to 33.2 mmgy, as well as fees for ancillary services. At December 31, 2015, the remaining primary term of the terminal services agreement was approximately two years. The terminal services agreement will automatically renew for successive one-year renewal terms unless either party provides written notice of its intent to terminate at least 90 days prior to the end of the remaining primary or renewal term. Other terminal services agreements with Green Plains Trade and third parties also contain minimum volume commitments with various remaining terms.
Rail Transportation Service Agreement. Under our rail transportation services agreement, Green Plains Trade is obligated to transport ethanol and other fuels by rail from identified receipt and delivery points and pay an average monthly fee of approximately $0.0357 per gallon for all railcar volumetric capacity provided. Currently, our minimum railcar volumetric capacity commitment is 79.6 mmg and the weighted average remaining term of all railcar lease agreements is 2.5 years. At December 31, 2015, the remaining primary term of our rail transportation services agreement was 5.5 years. The rail transportation services agreement will automatically renew for successive one-year renewal terms unless either party provides written notice of its intent to terminate at least 360 days prior to the end of the remaining primary or renewal term.
We lease our railcars from third parties under lease agreements with various terms. The minimum take-or-pay capacity commitment is reduced by the capacity of the railcars subject to expiration under our lease agreements.
Effective January 1, 2016, as previously amended, the rail transportation services agreement was adjusted pursuant to its terms in connection with the acquisition of the Hereford, Texas and Hopewell, Virginia ethanol storage and leased railcar assets. The minimum railcar volumetric capacity commitment was increased by 6.7 mmg, to its current level.
Green Plains Trade is also obligated to pay a monthly fee of approximately $0.0013 per gallon for logistical operations management and other services based on railcar volumetric capacity obtained by Green Plains Trade from third parties.
Trucking Transportation Agreement. Under our trucking transportation agreement, Green Plains Trade pays us to transport ethanol and other fuels from identified receipt and delivery points by truck. At December 31, 2015, the remaining term of our trucking transportation agreement was six months. The trucking transportation agreement will automatically renew for successive one-year renewal terms unless either party provides written notice of its intent to terminate at least 30 days prior to the end of the remaining primary or renewal term. Green Plains Trade is obligated to pay a monthly trucking
7
transportation services fee equal to the aggregate amount of product volume transported in a calendar month multiplied by the applicable rate for each truck lane.
We also entered into an omnibus agreement and an operational services and secondment agreement with our parent. For more information, see Note 3 – Initial Public Offering to the consolidated financial statements included under Recast Item 15 – Exhibits, Financial Statement Schedules.
Competitive Strengths
We believe that the following competitive strengths position us to successfully execute our business strategies:
Stable and Predictable Cash Flows. A substantial portion of our revenues and cash flows are derived from long-term, fee-based commercial agreements with Green Plains Trade, including a storage and throughput agreement, rail transportation services agreement, terminal services agreement and other transportation agreements. Our storage and throughput agreement and certain terminal services agreements are supported by minimum volume commitments, and our rail transportation services agreement is supported by minimum take-or-pay capacity commitments. Green Plains Trade is obligated to pay us fees for these minimum commitments regardless of actual throughput or volume, capacity used or amount of product tendered for transport, assuring us that we will receive a certain amount of revenue during the terms of these agreements.
Advantageous Relationship with Our Parent. Our assets are the principal method of storing and delivering the ethanol our parent produces, and the related agreements with Green Plains Trade include minimum volume or take-or-pay capacity commitments. Furthermore, as general partner and owner of a 62.5% limited partner interest in us and all of our incentive distribution rights, our parent directly benefits from our growth, which provides incentive to pursue projects that directly or indirectly enhance the value of our business and assets. This can be accomplished though organic expansion, accretive acquisitions or the development of downstream distribution services. Under an omnibus agreement, we are granted the right of first offer, for a period of five years, on any ethanol storage asset, fuel terminal facility or transportation asset our parent owns, constructs or acquires and decides to sell.
Quality Assets. Our portfolio of assets have an expected remaining weighted average useful life of over 20 years. Our assets are strategically located in eight states near major rail lines, which minimizes our exposure to weather-related downtime and transportation congestion, while enabling access to markets across the United States. Given the nature of our assets, we expect to incur only modest maintenance-related expenses and capital expenditures in the near future.
Financial Strength and Flexibility. Our borrowing capacity and ability to access debt and equity capital markets provide financial flexibility necessary to achieve our organic and acquisition growth strategies.
Proven Management Team. Each member of our senior management team is an employee of our parent who also devotes time to manage our business affairs. We believe the level of commercial, operational and financial expertise of our senior management team, which averages approximately 25 years of industry experience, will allow us to successfully execute our business strategies.
Business Strategy
We believe ethanol could become an increasingly larger portion of the global fuel supply driven by volatile oil prices, heightened environmental concerns, energy independence and national security concerns. We intend to further develop and strengthen our business by pursuing the following growth strategies:
Generate Stable, Fee-Based Cash Flows. A substantial portion of our revenues and cash flows are derived from our commercial agreements with Green Plains Trade. Under these agreements, we do not have direct exposure to fluctuating commodity prices. We will continue to establish fee-based contracts with our parent and third parties that generate stable and predictable cash flows as we grow.
Grow Organically. We will collaborate with our parent and other potential third-party customers to identify opportunities to construct assets that provide us with stable cash flows through fee-based service agreements. Plant expansion by our parent that increases its production capacity also increases annual throughput at our facilities. Our capital expenditures associated with expansion would be minimal since our ethanol storage facilities have available capacity to accommodate growth.
Acquire Strategic Assets. We intend to pursue strategic acquisitions independently and jointly with our parent to grow
8
our business. The U.S. ethanol production industry is poised for consolidation. Our parent has a proven history of identifying, acquiring and integrating assets that are accretive to its business. Under the omnibus agreement, we have a five-year, right of first offer on any fuel storage, terminal or transportation asset our parent owns, constructs or acquires and decides to sell. In addition, we intend to continually monitor the marketplace to identify and pursue assets that complement or diversify our existing operations, including fuel storage and terminal assets in close proximity to our existing asset base.
Development of Downstream Distribution Services. Our parent will continue to use its logistical capabilities and expertise to further develop downstream ethanol distribution services. We will benefit from our parent’s marketing and distribution strategy due to the strategic locations of our ethanol storage facilities and fuel terminal facilities.
Conduct Safe, Reliable and Efficient Operations. We conduct routine inspections of our assets in accordance with applicable laws and regulations and are committed to maintaining safe, reliable and environmentally compliant operations. We seek to improve our operating performance through preventive maintenance, employee training, and safety and development programs.
Recent Developments
On November 4, 2015, we announced plans to form a joint venture, as a 50% partner, to build an ethanol unit train terminal in Maumelle, Arkansas. The terminal will be capable of unloading 110-car unit trains in less than 24 hours and initially include storage for approximately 4.2 mmg of ethanol. The project is expected to cost approximately $12 million and be completed during the fourth quarter of 2016.
Effective January 1, 2016, we acquired the ethanol storage and leased railcar assets of the Hereford, Texas and Hopewell, Virginia ethanol production facilities from our parent for consideration of $62.3 million. We used our revolving credit facility and cash on hand to fund the purchase. The acquired assets include three ethanol storage tanks that support the plants’ combined production capacity of approximately 160 mmgy and 224 leased railcars with volumetric capacity of approximately 6.7 mmg. We amended the storage and throughput agreement with Green Plains Trade, increasing the minimum volume commitment from 212.5 mmg to 246.5 mmg per calendar quarter. We also adjusted the rail transportation services agreement, increasing the minimum railcar volumetric capacity commitment 6.7 mmg to 79.6 mmg.
Our Competition
Our contractual relationship with Green Plains Trade and the integrated nature of our storage tanks with our parent’s production facilities minimizes potential competition for storage and distribution services provided under our commercial agreements from other third-party operators.
We compete with independent fuel terminal operators and major fuel producers for terminal services based on terminal location, services provided, safety and cost. While there are numerous fuel producers and distributors that own terminal operations similar to ours, they are not typically focused on providing services to third parties. Independent operators are often located near key distribution points with cost advantages and provide more efficient services and distribution capabilities into strategic markets with a variety of transportation options. Companies often rely on independent providers when their own storage facilities cannot handle their volumes or they cannot manage their throughput adequately due to lack of expertise, market congestion, size constraints, optionality or the nature of the materials being stored.
We believe we are well-positioned to compete effectively in a growing market due to our expertise managing third-party terminal services and logistics. We are a low-cost operator, focused on safety and efficiency, capable of managing the needs of multiple constituencies across geographical markets. While the competitiveness of our services can be impacted by competition from new entrants, transportation constraints, industry production levels and related storage needs, we believe there are significant barriers to entry that partially mitigate these risks, including significant capital costs, execution risk, complex permitting requirements, development cycle, financial and working capital constraints, expertise and experience, and ability to effectively capture strategic assets or locations.
Seasonality
Our business is directly affected by the supply and demand for ethanol and other fuels in the markets served by our assets. However, the effects of seasonality on our revenues are substantially mitigated through our fee-based commercial agreements with Green Plains Trade, which include minimum volume or take-or-pay capacity commitments.
9
Major Customer
Revenues from Green Plains Trade, controlled by our parent, totaled approximately $42.5 million, or 83.5%, of our consolidated revenues for 2015. We are highly dependent on Green Plains Trade and expect to derive most of our revenues from them in the foreseeable future. Accordingly, we are indirectly subject to the business risks of Green Plains Trade. For additional information, please read Risk Factors—Risks Related to Our Business. Since a substantial majority of our revenues are, and in the foreseeable future are expected to be, derived from Green Plains Trade, any development that materially and adversely affects Green Plain Trade’s operations, financial condition or market reputation could have a material adverse impact on us.
Regulatory Matters
Government Ethanol Programs and Policies
The domestic ethanol market is impacted by federal mandates under the RFS II, which sets the required volume of renewable fuel to be blended with transportation fuel in the United States. On June 10, 2015, the EPA proposed volume targets for conventional ethanol of 13.25 billion gallons, 13.40 billion gallons and 14.00 billion gallons for 2014, 2015 and 2016, respectively. On November 30, 2015, the EPA announced final volume requirements for conventional ethanol that were higher than the levels proposed in June of 13.61 billion gallons, 14.05 billion gallons and 14.50 billion gallons for 2014, 2015 and 2016, respectively.
In April 2013, the Master Limited Partnership Parity Act was introduced in the U.S. House of Representatives as H.R. 1696 to extend the publicly traded partnership ownership structure to renewable energy projects, including ethanol production. The legislation was proposed to provide a more level financing system and tax burden for renewable energy equal to fossil energy projects. H.R. 1696 did not advance out of committee during the 113th Congress and its co-sponsors have not re-introduced the bill.
Environmental Regulation
Our operations are subject to environmental regulations, including those that govern the handling and release of ethanol, crude oil and other liquid hydrocarbon materials. Compliance with existing and anticipated environmental laws and regulations will increase our overall cost of business, including capital costs to construct, maintain, operate, and upgrade equipment and facilities. However, we do not believe that this will have a material impact on our operations or financial position.
There are also risks of accidental releases into the environment associated with our operations, such as releases of ethanol from our storage facilities. Should an event, such as an accidental release, not be covered by our insurance, we could be subject to substantial liabilities arising from environmental cleanup and restoration costs, claims made by neighboring landowners and other third parties for personal injury and property damage, and fines or penalties for any related violations of environmental laws or regulations.
Under the omnibus agreement, our parent indemnified us from all known and certain unknown environmental liabilities associated with owning and operating our assets that occurred on or before the closing of the IPO. In turn, we have agreed to indemnify our parent from future environmental liabilities associated with the activities of the partnership.
Construction or maintenance of our terminal and storage facilities may impact wetlands, which are regulated by the EPA and the U.S. Army Corps of Engineers under the Clean Water Act.
Other Regulations
In July 2014, the DOT proposed new regulations to improve the transportation of flammable materials by rail, which it finalized on May 1, 2015. The Enhanced Tank Car Standards and Operational Controls for High-Hazard Flammable Trains calls for an enhanced tank car standard known as the DOT specification 117 and establishes a schedule to retrofit or replace older tank cars that carry crude oil and ethanol. The rule also establishes braking standards intended to reduce the severity of accidents and new operational protocols. Companies that transport hazardous materials must develop more accurate classification protocols. As a result of the final rule, lease costs for railcars may increase over the long term. Additionally, existing railcars could be out of service for a period of time while such upgrades are made, tightening supply in an industry that is highly dependent on railcars to transport product. We intend to retrofit or replace our leased railcars to comply with the new regulations. Retrofitting costs will be reimbursed by Green Plains Trade under our rail transportation services agreement.
10
Employees
We do not have any employees. We are managed and operated by the executive officers of our general partner, who are also officers of our parent, and our general partner’s board of directors. Our general partner and its affiliates have approximately 15 full-time equivalent employees under the direct management and supervision of our general partner for our operations.
Available Information
Our annual reports on Form 10-K, quarterly reports on Form 10-Q, current reports on Form 8-K and amendments to those reports are available on our website at www.greenplainspartners.com shortly after we file or furnish the information with the SEC. You can also find the charter of our audit committee, as well as our code of ethics in the corporate governance section of our website. The information found on our website is not part of this or any other report we file or furnish with the SEC. For more information on our parent, please visit www.gpreinc.com. Alternatively, investors may read and copy any materials we file with the SEC at the SEC’s Public Reference Room at 100 F Street, NE, Washington, DC 20549 or visit the SEC website at www.sec.gov to access our reports and information statements filed with the SEC.
11
Recast Item 6. Selected Financial Data.
The statement of operations data for the years ended December 31, 2015, 2014 and 2013, and the balance sheet data as of December 31, 2015 and 2014, are derived from our audited recast consolidated financial statements and should be read together with the accompanying recast notes included elsewhere in this report.
The balance sheet data as of December 31, 2013, is derived from our audited consolidated financial statements that are not included in this report, which describe a number of matters that materially affect the comparability of the periods presented.
Our results of operations are not comparable to periods prior to our IPO on July 1, 2015, when the storage and transportation agreements between us and Green Plains Trade became effective. The ethanol storage and leased railcar assets contributed by our parent are recognized at historical cost and reflected retroactively in our consolidated financial statements, along with related expenses, such as depreciation, amortization and railcar lease expenses. There were no revenues related to these assets reflected in the consolidated financial statements for periods before July 1, 2015. Periods ended on or before June 30, 2015, include the activities of BlendStar, which provided terminal and trucking services for our parent as well as third parties.
These recast financial statements also reflect the acquisition of the ethanol storage and leased railcar assets of the Hereford, Texas and Hopewell, Virginia ethanol production facilities from our sponsor in a transfer between entities under common control, effective January 1, 2016. The assets were recognized at historical cost and reflected retroactively along with related expenses for periods prior to the effective date of the acquisition, subsequent to the initial dates the assets were acquired by our sponsor, or October 23, 2015, and November 12, 2015, for Hopewell and Hereford, respectively. There were no revenues related to these assets for periods before January 1, 2016, when amendments to our commercial agreements related to the drop down became effective.
The following recast selected financial data should be read together with Recast Item 7 – Management’s Discussion and Analysis of Financial Condition and Results of Operations – Adjusted EBITDA and Distributable Cash Flow of this report. The financial information below is not necessarily indicative of our expected results for any future period, which could differ materially from historical results due to numerous factors, including those discussed in Item 1A – Risk Factors of our 2015 annual report.
12
|
|
Year Ended December 31, |
||||||||
|
|
2015 |
2014 |
2013 |
||||||
|
Statement of Operations Data: |
|||||||||
|
(in thousands, except per unit information) |
|||||||||
|
Revenues |
$ |
50,937 |
$ |
12,843 |
$ |
11,032 | |||
|
Operations and maintenance |
29,601 | 26,424 | 17,854 | ||||||
|
General and administrative |
3,114 | 1,403 | 1,402 | ||||||
|
Depreciation and amortization |
5,828 | 5,544 | 3,572 | ||||||
|
Operating income (loss) |
12,394 | (20,528) | (11,796) | ||||||
|
Other income (expense) |
(295) | (63) | (719) | ||||||
|
Net income (loss) |
16,108 | (12,833) | (7,810) | ||||||
|
Net loss attributable to MLP predecessor |
(6,628) | (12,833) | (7,810) | ||||||
|
Net loss attributable to sponsor |
(273) |
- |
- |
||||||
|
Net income attributable to the partnership |
23,009 |
- |
- |
||||||
|
|
|||||||||
|
Earnings per limited partner unit (basic and diluted): |
|||||||||
|
Common units |
$ |
0.71 | |||||||
|
Subordinated units |
$ |
0.71 | |||||||
|
|
|||||||||
|
Weighted average limited partner units outstanding (basic and diluted): |
|||||||||
|
Common units |
15,897 | ||||||||
|
Subordinated units |
15,890 | ||||||||
|
|
|||||||||
|
Distribution declared per unit |
$ |
0.8025 | |||||||
|
|
December 31, |
||||||||
|
|
2015 |
2014 |
2013 |
||||||
|
Balance Sheet Data (in thousands): |
|||||||||
|
Cash and cash equivalents |
$ |
16,385 |
$ |
5,705 |
$ |
1,704 | |||
|
Current assets |
33,919 | 12,036 | 7,383 | ||||||
|
Total assets |
95,998 | 79,992 | 73,445 | ||||||
|
Long-term debt |
8,100 | 8,100 | 8,100 | ||||||
|
Total liabilities |
24,188 | 12,685 | 14,194 | ||||||
|
Partners' capital |
71,810 | 67,307 | 59,251 | ||||||
Adjusted EBITDA is defined as earnings before interest expense, income tax expense, depreciation and amortization, plus adjustments for transaction costs related to acquisitions or financing transactions, minimum volume commitment deficiency payments, unit-based compensation expense and net gains or losses on asset sales. Distributable cash flow is defined as adjusted EBITDA less interest paid or payable, cash paid for income taxes and maintenance capital expenditures.
Adjusted EBITDA and distributable cash flow presentations are not made in accordance with GAAP and therefore should not be considered in isolation or as alternatives to net income, operating income or any other measure of financial performance presented in accordance with GAAP to analyze our results. Distributable cash flow computations for periods prior to the partnership’s IPO are not considered meaningful. Refer to Recast Item 7 – Management’s Discussion and Analysis of Financial Condition and Results of Operations for additional information.
13
The following table presents a reconciliation of net income to adjusted EBITDA for each of the periods presented and a reconciliation of net income to distributable cash flow for the period since the IPO was completed (in thousands):
|
|
|
|
|
|
|
|
|
|
|
|
|
|
|
|
|
|
|
|
|
|
|
|
|
|
|
|
|
|
|
|
|
Post IPO (1) |
|
Year Ended December 31, |
|||||||||
|
|
|
2015 |
|
2015 |
|
2014 |
|
2013 |
|
||||
|
Other Financial Data (in thousands, except per unit data): |
|
|
|
|
|
|
|
|
|
|
|
|
|
|
Net income (loss) |
|
$ |
22,736 |
|
$ |
16,108 |
|
$ |
(12,833) |
|
$ |
(7,810) |
|
|
Interest expense |
|
|
327 |
|
|
381 |
|
|
138 |
|
|
768 |
|
|
Income tax benefit |
|
|
(10) |
|
|
(4,009) |
|
|
(7,758) |
|
|
(4,705) |
|
|
Depreciation and amortization |
|
|
3,107 |
|
|
5,828 |
|
|
5,544 |
|
|
3,572 |
|
|
Transaction costs |
|
|
907 |
|
|
907 |
|
|
- |
|
|
- |
|
|
Unit-based compensation expense |
|
|
67 |
|
|
67 |
|
|
- |
|
|
- |
|
|
Adjusted EBITDA |
|
|
27,134 |
|
|
19,282 |
|
$ |
(14,909) |
|
$ |
(8,175) |
|
|
Adjusted EBITDA attributable to the MLP Predecessor |
|
|
- |
|
|
(7,852) |
|
|
|
|
|
|
|
|
Adjusted EBITDA attributable to sponsor |
|
|
(232) |
|
|
(232) |
|
|
|
|
|
|
|
|
Adjusted EBITDA attributable to the partnership |
|
$ |
27,366 |
|
$ |
27,366 |
|
|
|
|
|
|
|
|
Less: |
|
|
|
|
|
|
|
|
|
|
|
|
|
|
Interest paid or payable |
|
|
327 |
|
|
|
|
|
|
|
|
|
|
|
Maintenance capital expenditures |
|
|
148 |
|
|
|
|
|
|
|
|
|
|
|
Distributable cash flow (2) |
|
$ |
26,891 |
|
|
|
|
|
|
|
|
|
|
|
|
|
|
|
|
|
|
|
|
|
|
|
|
|
|
Distributions declared (3) |
|
$ |
26,032 |
|
|
|
|
|
|
|
|
|
|
|
|
|
|
|
|
|
|
|
|
|
|
|
|
|
|
Coverage ratio |
|
|
1.03x |
|
|
|
|
|
|
|
|
|
|
|
|
|
|
|
|
|
|
|
|
|
|
|
|
|
(1) Represents the adjusted EBITDA and DCF computations for the period since the IPO was completed, from July 1, 2015, to December 31, 2015. Amounts have been recast to include the historical results of operations related to the net assets acquired in a transfer between entities under common control; see Note 1 – Basis of Presentation and Description of Business and Note 4 - Acquisition to the consolidated financial statements for further discussion.
(2) DCF computations for periods before our IPO are not considered meaningful.
(3) Includes distributions declared for the quarters ended September 30, 2015, and December 31, 2015.
14
Recast Item 7. Management’s Discussion and Analysis of Financial Condition and Results of Operations.
General
The following discussion and analysis includes information management believes is relevant to understand and assess our financial condition and results of operations. This section should be read together with our recast consolidated financial statements and accompanying recast notes contained in this report, as well as risk factors contained in our 2015 annual report.
Information about our business, properties and strategy can be found under Recast Item 1 – Business and a description of our risk factors can be found under Item 1A – Risk Factors in our 2015 annual report.
Overview
We are a master limited partnership formed by our parent to be its principle provider of fuel storage and transportation services. On July 1, 2015, we completed our IPO, and, in addition to the interests of BlendStar, received the assets and liabilities of the ethanol storage and leased railcar assets contributed by our parent in a transfer between entities under common control. We also entered into long-term, fee-based commercial agreements for storage and transportation services with Green Plains Trade, which are supported by minimum volume or take-or-pay capacity commitments.
Industry Factors Affecting our Results of Operations
Ethanol Supply and Demand
The volume of ethanol and other fuels handled at our facilities depends on our parent’s production levels and fuel blending margins, which are impacted by numerous factors that ultimately affect the supply and demand for ethanol and other fuels, including domestic production levels, government policies and mandates, economic incentives, global markets, environmental regulations and the price of feedstock, both domestically and abroad.
Domestic Production. Domestic ethanol production has been steadily increasing to an estimated 14.8 billion gallons in 2015 from 14.3 billion gallons in 2014, according to the EIA. The ethanol production market continues to be fairly fragmented. As of January 23, 2016, there were 216 ethanol plants capable of producing 15.7 bgy according to Ethanol Producer Magazine. The top five producers account for 43% of the domestic production capacity.
Government Policies and Regulations. Federal mandates supporting the use of renewable fuels continue to be a major driver in U.S. demand for ethanol. Ethanol policies are influenced by the desire to reduce fuel emissions and our dependency on foreign oil. In November 2015, the EPA announced final volume requirements for conventional ethanol of 13.61 billion gallons, 14.05 billion gallons and 14.50 billion gallons for 2014, 2015 and 2016, respectively. Significant increases in production capacity beyond the RFS II mandated level could negatively impact the ethanol industry. Reductions to governmental usage mandates could adversely affect the market for ethanol and our results of operations. The results of the 2016 presidential election could impact federal policies regarding renewable fuels. Environmental laws and regulations may impact the cost to produce or transport ethanol, which can indirectly affect supply.
Economic Incentives. Domestic demand has also been influenced by economic incentives for refiners and blenders to use ethanol as an additive to reduce vehicle emissions and increase octane levels based on its relative octane value and the market for RINs, which are used to comply with RFS II. Even though gasoline traded at a discount to ethanol during the year, ethanol continued to be the most economical oxygenate over Gulf Coast alkylate and reformate substitutes, and the most affordable source of octanes over Gulf Coast 93 and toluene substitutes. These incentives may be affected by the price of crude oil, which decreased in price per barrel by approximately 43% from December 31, 2014, to December 31, 2015. Increased consumer acceptance and availability of higher blends such as E15 has also helped to support domestic demand.
Global Markets. Since 2010, the United States has been the world’s largest producer and consumer of ethanol. Approximately 6% of domestic ethanol is marketed worldwide and competes with other sources, primarily Brazil. The United States and Brazil account for more than 80% of all ethanol production worldwide, according to the USDA Foreign Agriculture Service. Annual reported production worldwide has also increased year over year. In 2014, global production was 24.6 billion gallons, according to the U.S. Department of Energy. Increased ethanol production capacity could create excess supply in world markets, resulting in lower ethanol prices throughout the world, including the United States.
A significant change in feedstock prices, transportations rates, foreign exchanges rates and government policies could also alter global supply dynamics in the top producing countries. In the United States, the primary feedstock for ethanol is
15
corn; in Brazil, the primary feedstock for ethanol is sugarcane. In March 2015, the Brazilian government increased their required ethanol blend to 27% from 25% which, along with more competitively priced ethanol produced from corn, significantly reduced U.S. ethanol imports from Brazil.
Our Parent’s Production Levels
Our parent’s operating margins influence its production levels, which in turn affects the volume of ethanol we will store, throughput and transport. Our parent’s operating margins are affected by the supply and demand for ethanol and other fuels, which are impacted by the cost of corn and natural gas, and the market price for ethanol, distillers grains and corn oil.
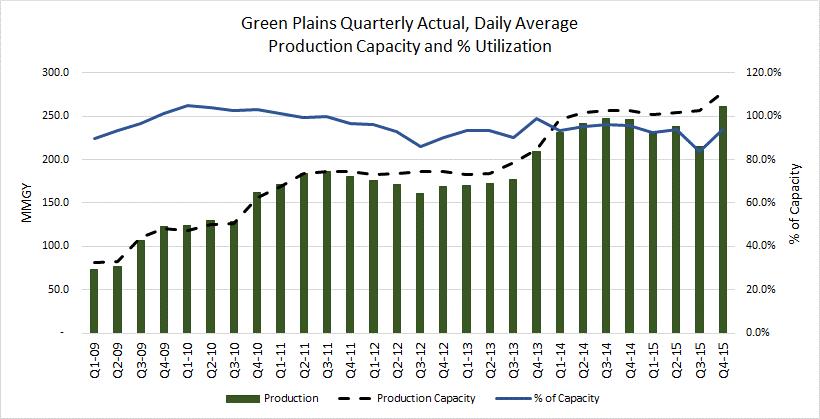
Our parent operated at approximately 91.1% of its average daily production capacity for the year ended December 31, 2015. From January 1, 2009, to December 31, 2015, our parent’s quarterly ethanol production increased 256.4%, from 73.2 mmg to 260.8 mmg, primarily from third-party acquisitions. Over the same time period, our parent’s ethanol production averaged 95.7% of its daily average production capacity and never fell below 83.8%. As part of its Phase I production capacity expansion program, our parent has added 35 mmgy of production capacity as of December 2015 and plans to add up to an additional 50 mmgy over the next twelve months. Our parent will explore other related expansion projects in the future. Our parent’s quarterly actual production, daily average production capacity and utilization are highlighted in the following chart:
Financial Condition and Results of Operations of Our Parent
Our parent guarantees Green Plains Trade’s obligations under our storage and throughput agreement and rail transportation service agreements, which account for a substantial portion of our revenues. Any change in our parent’s business or financial strategy or event that negatively impacts its financial condition, results of operations or cash flows may materially and adversely affect our financial condition, results of operations or cash flows.
Availability of Railcars
The long-term growth of our business depends on the availability of railcars, which we currently lease, to transport ethanol and other fuels on reasonable terms. Railcars may become unavailable due to increased demand, maintenance or other logistical constraints. Future railcar shortages caused by increased demand for railcar transportation or changes in regulatory standards that apply to railcars could negatively impact our business and our ability to grow.
On May 1, 2015, the DOT announced an enhanced tank car standard, known as the DOT specification 117, which establishes a schedule to retrofit or replace older tank cars that carry crude oil and ethanol. The rule may have an adverse effect on our operations as railcar lease costs may increase over the long term and existing railcars may be out of service for
16
an extended period of time while these upgrades are made, tightening supply in an industry that is highly dependent on railcar transportation.
How We Evaluate Our Operations
Our management uses a variety of financial and operating metrics to evaluate our operating results and measure profitability, including: throughput volume and capacity, operations and maintenance expense, adjusted EBITDA and distributable cash flow.
Throughput Volume and Capacity
Our revenues are dependent on the volume of ethanol and other fuels we throughput at our ethanol storage and fuel terminal facilities, and the volumetric capacity that is used to transport ethanol and other fuels by railcars. The volume of ethanol and other fuels we store, throughput or transport, and the railcar volumetric capacity we provide are affected by our parent’s operating margins at its ethanol production plants as well as the overall supply and demand for ethanol and other fuels in markets served directly or indirectly by our assets.
Green Plains Trade is obligated to meet minimum volumes or take-or-pay capacity commitments under our commercial agreements. Our results of operations may be impacted by our parent’s use of our assets in excess of its minimum volume commitments, our ability to capture incremental volumes or capacity from Green Plains Trade or third parties and our ability to retain Green Plains Trade as a customer, enter into contracts with new customers and increase volume commitments.
Operations and Maintenance Expenses
Our management seeks to maximize the profitability of our operations by effectively managing operations and maintenance expenses. Our expenses are relatively stable across a broad range of storage, throughput and transportation volumes and usage, but can fluctuate from period to period depending on maintenance activities. We manage our expenses by scheduling maintenance activities over time to avoid significant variability in our cash flows.
Adjusted EBITDA and Distributable Cash Flow
Adjusted EBITDA is defined as earnings before interest expense, income tax expense, depreciation and amortization, plus adjustments for transaction costs related to acquisitions or financing transactions, minimum volume commitment deficiency payments, unit-based compensation expense and net gains or losses on asset sales.
Distributable cash flow is defined as adjusted EBITDA less interest paid or payable, cash paid for income taxes and maintenance capital expenditures, which are defined under our partnership agreement as cash expenditures (including expenditures for the construction or development of new capital assets or the replacement, improvement or expansion of existing capital assets) made to maintain our operating capacity or operating income.
We believe that the presentation of adjusted EBITDA and distributable cash flow will provide useful information to investors in assessing our financial condition and results of operations. Adjusted EBITDA and distributable cash flow are supplemental financial measures that we use to assess our financial performance; however, these presentations are not made in accordance with GAAP. The GAAP measure most directly comparable to adjusted EBITDA and distributable cash flow is net income. Since adjusted EBITDA and distributable cash flow may be defined differently by other companies in our industry, our definitions of adjusted EBITDA and distributable cash flow may not be comparable to similarly titled measures of other companies, diminishing its utility. Adjusted EBITDA and distributable cash flow should not be considered in isolations or as alternatives to net income, operating income or any other measure of financial performance presented in accordance with GAAP to analyze our results. Refer to Recast Item 6 – Selected Financial Data for reconciliations of net income to adjusted EBITDA and distributable cash flow.
Components of Revenues and Expenses
Revenues. Our revenues consist primarily of volume-based service fees for receiving, storing, transferring and transporting ethanol and other fuels.
For more information about these charges and the services covered by these agreements, please refer to Note 16 – Related Party Transactions to the consolidated financial statements included under Recast Item 15 – Exhibits, Financial Statement Schedules.
17
Operations and Maintenance Expenses. Our operations and maintenance expenses consist primarily of lease expenses related to our transportation assets, labor expenses, outside contractor expenses, insurance premiums, repairs and maintenance expenses and utility costs. These expenses also include fees for certain management, maintenance and operational services to support our facilities allocated by our parent under our operational services and secondment agreement.
General and Administrative Expenses. Our general and administrative expenses consist primarily of employee salaries, incentives and benefits; office expenses; professional fees for accounting, legal, and consulting services; and other costs allocated by our parent. Our general and administrative expenses include direct monthly charges for the management of our assets and certain expenses allocated by our parent under our omnibus agreement for general corporate services, such as treasury, accounting, human resources and legal services. These expenses are charged or allocated to us based on the nature of the expense and our proportionate share of employee time or capital expenditures and operating expenses.
For more information about fees we reimburse our parent for services received, please read Note 16 – Related Party Transactions to the consolidated financial statements included under Recast Item 15 – Exhibits, Financial Statement Schedules.
Other Income (Expense). Other income (expense) includes interest earned, interest expense and other non-operating items.
Results of Operations
Comparability of our Financial Results
For the year ended December 31, 2015, the following discussion reflects the results of the MLP predecessor for the first six months of 2015 and the results of the partnership post-IPO for second half of 2015. The discussion for the year ended December 31, 2015, also includes the results related to assets we acquired from our sponsor since the IPO in a transfer between entities under common control. The years ended December 31, 2014 and 2013, reflect only the results of the MLP predecessor.
Under GAAP, when accounting for transfers of assets between entities under common control, the entity that receives the net assets initially recognizes the assets and liabilities transferred at their carrying amounts at the date of transfer. Prior period financial statements of the transferee are recast for all periods in which the transferred operations were part of the ultimate parent’s consolidated financial statements. On July 1, 2015, in addition to the interests of BlendStar, we received the assets and liabilities of certain ethanol storage and railcar assets contributed by our parent in a transfer between entities under common control. We recognized the assets and liabilities transferred at our parent’s historical cost basis, which are reflected retroactively in the consolidated financial statements presented in this report. Expenses related to these contributed assets, such as depreciation, amortization and railcar lease expenses, are also reflected retroactively in the consolidated financial statements. No revenues related to the operation of the ethanol storage and railcar contributed assets are reflected in the consolidated financial statements for periods before July 1, 2015, the date the related commercial agreements became effective.
Effective January 1, 2016, we acquired the ethanol storage and leased railcar assets of the Hereford, Texas and Hopewell, Virginia ethanol production facilities from our sponsor in a transfer between entities under common control. The assets were recognized at historical cost and reflected retroactively along with related expenses for periods prior to the effective date of the acquisition, subsequent to the initial dates the assets were acquired by our sponsor, or October 23, 2015, and November 12, 2015, for Hopewell and Hereford, respectively. There were no revenues related to these assets for periods before January 1, 2016, when amendments to our commercial agreements related to the drop down became effective.
18
Selected Financial Information and Operating Data
The following table reflects selected financial information (in thousands):
|
|
Year Ended December 31, |
||||||||
|
|
2015 |
2014 |
2013 |
||||||
|
Revenues |
|||||||||
|
Storage and throughput services |
$ |
23,125 |
$ |
- |
$ |
- |
|||
|
Terminal services |
12,006 | 12,129 | 11,032 | ||||||
|
Railcar capacity |
13,818 |
- |
- |
||||||
|
Other |
1,988 | 714 |
- |
||||||
|
Total revenues |
50,937 | 12,843 | 11,032 | ||||||
|
Operating expenses |
|||||||||
|
Operations and maintenance |
29,601 | 26,424 | 17,854 | ||||||
|
General and administrative |
3,114 | 1,403 | 1,402 | ||||||
|
Depreciation |
5,828 | 5,544 | 3,572 | ||||||
|
Total operating expenses |
38,543 | 33,371 | 22,828 | ||||||
|
Operating income (loss) |
$ |
12,394 |
$ |
(20,528) |
$ |
(11,796) | |||
|
|
|||||||||
The following table reflects selected operating data (in mmg, except railcar capacity billed):
|
|
|||||||||
|
|
Year Ended December 31, |
||||||||
|
|
2015 |
2014 |
2013 |
||||||
|
Product volumes |
|||||||||
|
Storage and throughput services (1) |
464.4 |
- |
- |
||||||
|
|
|||||||||
|
Terminal services: |
|||||||||
|
Affiliate |
107.4 | 109.9 | 121.1 | ||||||
|
Non-affiliate |
214.2 | 214.8 | 192.8 | ||||||
|
|
321.6 | 324.7 | 313.9 | ||||||
|
|
|||||||||
|
Railcar capacity billed (daily avg. mmg) (1)(2) |
64.0 |
- |
- |
||||||
|
|
|||||||||
(1) Volumetric data for periods before July 1, 2015, is not considered meaningful, as the related commercial agreements were not in effect prior to that date.
(2) Railcar capacity for 2015 is based on capacity since July 1, 2015, when the commercial agreement became effective.
Year Ended December 31, 2015, Compared with the Year Ended December 31, 2014
Revenues
Revenues generated from our storage and throughput agreement and rail transportation services agreement with Green Plains Trade, executed in connection with our IPO and effective beginning July 1, 2015, were $36.9 million for the year ended December 31, 2015.
Revenues generated by trucking and terminal services increased $1.2 million for the year ended December 31, 2015, compared with the same period for 2014, due to an increase in the number of trucks in service and locations where we do business.
Operations and Maintenance Expenses
Operations and maintenance expenses increased $3.2 million for the year ended December 31, 2015, compared with the same period for 2014, primarily due to increased railcar lease expenses, wages and fuel costs associated with our trucking operations. This was partially offset by a decrease in throughput unloading fees.
19
General and Administrative Expenses
General and administrative expenses increased $1.7 million for the year ended December 31, 2015, compared with the same period for 2014, primarily due to transaction costs related to the formation of the partnership and the acquisition of Hereford, Texas and Hopewell, Virginia storage and transportation assets, additional expenses attributable to being a public company, unit-based compensation and board fees.
Year Ended December 31, 2014, Compared with the Year Ended December 31, 2013
Revenues
Revenues generated by trucking and terminal services increased $1.8 million for the year ended December 31, 2014, compared with the same period in 2013, due to increased non-affiliate throughput revenues across BlendStar terminal facilities of $1.1 million, and the commencement of trucking operations at BlendStar in January 2014, resulting in 2014 revenues of $0.7 million.
Operations and Maintenance Expenses
Operations and maintenance expenses increased $8.6 million for the year ended December 31, 2014, compared with the same period in 2013, primarily due to increased railcar lease expenses.
Depreciation Expense
Depreciation expense increased $2.0 million for the year ended December 31, 2014, compared with the same period for 2013, primarily due to the acquisition of additional storage and leased railcar assets in November 2013.
Liquidity and Capital Resources
Our principal sources of liquidity include cash generated from operating activities and borrowings under our revolving credit facility. Capital expenditures are funded primarily from external sources, using a combination of debt and equity financing.
On July 1, 2015, upon completion of the IPO, we received net proceeds of $157.5 million from the sale of 11,500,000 common units, after deducting underwriting discounts of $10.3 million, structuring fees of $0.9 million and other IPO expenses of approximately $3.8 million. We used the net proceeds to make a cash distribution of $155.3 million to Green Plains, in part, as reimbursement of certain capital expenditures incurred and to pay $0.9 million in origination fees under our new revolving credit facility. We retained the remaining $1.3 million for general partnership purposes.
On December 31, 2015, our cash and cash equivalents were $16.4 million and we had no borrowings against our $100.0 million revolving credit facility. Effective January 1, 2016, we acquired the ethanol storage and leased railcar assets located in Hereford, Texas and Hopewell, Virginia from our parent for consideration of $62.3 million, which we financed by drawing $48.0 million on the revolving credit facility and using cash on hand.
Our ongoing sources of liquidity include cash generated from operations, borrowings under our revolving credit facility and issuances of additional debt and equity securities. We consider opportunities to repay, redeem, repurchase or refinance our debt, depending on market conditions, as part of our normal course of doing business. Our ability to meet our debt service obligations and other capital requirements depends on our future operating performance, which is subject to general economic, financial, business, competitive, legislative, regulatory and other conditions, many of which are beyond our control.
We plan to fund future expansion capital expenditures primarily from external sources, including borrowings under our revolving credit facility and issuances of debt and equity securities, and expect these sources will be adequate for both our short-term and long-term liquidity needs.
Net cash provided by operating activities was $15.7 million in 2015 compared with net cash used by operating activities of $16.3 million in 2014. Cash flows from operating activities were affected primarily by increases in operating profits and decreases in working capital. Net cash used by investing activities was $1.5 million in 2015, primarily due to capital expenditures for expansion projects. Net cash used by financing activities was $3.6 million in 2015, primarily due to IPO-related activity and an equity distribution of $3.3 million from a subsidiary of the MLP predecessor to our parent in February 2015.
20
We incurred capital expenditures of $1.5 million in 2015 for various projects, including $1.2 million related to the purchase of additional trucks and tankers. Capital spending for 2016 is expected to be approximately $6.1 million related to our investment in the Maumelle, Arkansas unit train joint venture, which we expect to finance primarily with our revolving credit facility.
Revolving Credit Facility
On July 1, 2015, Green Plains Operating Company entered into an agreement for a five-year, $100.0 million revolving credit facility with various lenders to fund working capital, acquisitions, distributions, capital expenditures and other general partnership purposes. The revolving credit facility contains customary representations and warranties, affirmative and negative covenants and events of default. The negative covenants restrict our ability to incur additional debt, acquire and sell assets, create liens, invest capital, pay distributions, and materially amend our commercial agreements with Green Plains Trade. The facility can be increased by up to $50.0 million without the consent of the lenders and is available for revolving loans, including sublimits of $15.0 million for swing line loans and $15.0 million for letters of credit. For more information related to our debt, see Note 8 – Debt to the consolidated financial statements included under Recast Item 15 – Exhibits, Financial Statement Schedules.
We had no borrowings outstanding under the revolving credit facility and were in compliance with our debt covenants as of December 31, 2015. Effective January 1, 2016, we acquired the ethanol storage and leased railcar assets located in Hereford, Texas and Hopewell, Virginia from our parent for consideration of $62.3 million, which we financed by drawing $48.0 million on the revolving credit facility and using cash on hand. We expect to maintain compliance with our debt covenants over the next twelve months.
Distributions to Unitholders
The partnership agreement provides for a minimum quarterly distribution of $0.40 per unit, which equates to approximately $13.0 million per quarter, or $51.9 million per year, based on the 2% general partner interest and the number of common and subordinated units currently outstanding. For more information, see Note 11 – Partners’ Capital to the consolidated financial statements included under Recast Item 15 – Exhibits, Financial Statement Schedules.
On October 22, 2015, the board of directors of our general partner declared our first quarterly cash distribution of $0.40 per unit for the third quarter ended September 30, 2015. The distribution was paid on November 13, 2015, to unitholders of record as of November 6, 2015.
On January 21, 2016, the board of directors of our general partner declared a quarterly cash distribution of $0.4025 per unit, or $1.61 per unit on an annualized basis, for the quarter ended December 31, 2015. The distribution is payable on February 12, 2016, to unitholders of record as of February 5, 2016.
Recast Contractual Obligations
Our contractual obligations as of December 31, 2015, were as follows (in thousands):
|
|
|||||||||||||||
|
|
Payments Due By Period |
||||||||||||||
|
Contractual Obligations |
Total |
Less Than |
1-3 Years |
3-5 Years |
More Than |
||||||||||
|
Long-term and short-term debt obligations (1) |
$ |
8,100 |
$ |
- |
$ |
- |
$ |
665 |
$ |
7,435 | |||||
|
Interest and fees on debt obligations (2) |
1,002 | 100 | 200 | 197 | 505 | ||||||||||
|
Operating leases (3) |
64,627 | 22,560 | 26,084 | 15,150 | 833 | ||||||||||
|
Service agreements (4) |
514 | 292 | 222 |
- |
- |
||||||||||
|
Other (5) |
4,030 | 638 | 371 | 1,164 | 1,857 | ||||||||||
|
Total contractual obligations |
$ |
78,273 |
$ |
23,590 |
$ |
26,877 |
$ |
17,176 |
$ |
10,630 | |||||
(1) Includes the current portion of long-term debt and excludes the effect of any debt discounts.
(2) Interest amounts are calculated over the terms of the loans using current interest rates, assuming scheduled principal and interest amounts are paid pursuant to the debt agreements. Includes administrative and/or commitment fees on debt obligations.
(3) Operating lease costs are primarily for property and railcar leases.
(4) Service agreements are related to minimum commitments on unloading contracts.
(5) Includes asset retirement obligations to return property to its original condition at the termination of lease agreements.
21
Effects of Inflation
Inflation in the United States has been relatively low in recent years and we do not expect it to have a material impact on our future results of operations.
Critical Accounting Policies and Estimates
The preparation of our consolidated financial statements requires that we use estimates that affect the reported assets, liabilities, revenues, expenses and related disclosures for contingent assets and liabilities. We base our estimates on experience and assumptions we believe are proper and reasonable. While we regularly evaluate the appropriateness of these estimates, actual results could differ materially from our estimates. The following accounting policies, in particular, may be impacted by judgments, assumptions and estimates used to prepare our consolidated financial statements.
Revenue Recognition
A substantial portion of our revenues and cash flows are derived from commercial agreements with Green Plains Trade. We recognize revenues when evidence of an arrangement exists; there is risk of loss and title transfer to the customer; the price is fixed or determinable; and collectability is reasonably assured. Storage, terminal and transportation services revenues are recognized when services are performed, which occurs when the product is delivered to the customer.
Our storage and throughput agreement and certain terminal services agreements with Green Plains Trade are supported by minimum volume commitments. Our rail transportation services agreement is supported by minimum take-or-pay capacity commitments. Green Plains Trade is required to pay us fees for these minimum commitments regardless of the actual volume, throughput or capacity used for transport. Payment related to volume that was not actually throughput by Green Plains Trade is applied as a credit toward volume in excess of the minimum volume commitment during any of the next four quarters, after which time unused credits expire. We record a liability for deferred revenues in the amount of the credit that may be used in future periods and for customer prepayments before the product is delivered. We recognize revenue and relieve the liability when throughput volumes exceed the minimum volume commitment or unused credits expire. As a result, a significant portion of our revenues may be associated with cash collected during an earlier period that do not generate any cash during the current period.
Depreciation of Property and Equipment
Property and equipment are stated at cost less accumulated depreciation. We calculate depreciation expense using the straight-line method based on the estimated useful life of each asset. We assign asset lives based on reasonable estimates regarding the timing in which assets are placed into service. We periodically evaluate the estimated useful lives of our property, plant and equipment and revise our estimates. The determination of an asset’s estimated useful life takes a number of factors into consideration, including technological change, normal depreciation and physical usage. We periodically evaluate whether events or circumstances have occurred that may warrant a revision of the estimated useful lives of our fixed assets, which is accounted for prospectively.
Impairment of Long-Lived Assets and Goodwill
Our long-lived assets consist of property and equipment. We review long-lived assets for impairment whenever events or changes in circumstances indicate the carrying amount of the asset may not be recoverable. We measure recoverability by comparing the carrying amount of the asset with the estimated undiscounted future cash flows the asset is expected generate. If the carrying amount of the asset exceeds its estimated future cash flows, we record an impairment charge for the amount in excess of the fair value. No impairment charges have been recorded during the periods presented.
Our goodwill consists of amounts related to our predecessor’s acquisition of its fuel terminal and distribution business. We review goodwill at the reporting unit level for impairment at least annually, as of October 1, or more frequently when events or changes in circumstances indicate that impairment may have occurred.
We assess the qualitative factors of goodwill to determine whether it is more likely than not that the fair value of a reporting unit is less than its carrying amount as a basis for determining whether it is necessary to perform a two-step goodwill impairment test. Under the first step, we compare the estimated fair value of the reporting unit with its carrying value including goodwill. If the estimated fair value is less than the carrying value, we complete a second step to determine the amount of the goodwill impairment. In the second step, we allocate the reporting unit’s fair value to all of its assets and
22
liabilities other than goodwill to determine an implied fair value. We compare the result with the carrying amount and record an impairment charge for the difference.
We estimate the amount and timing of projected cash flows that will be generated by an asset over an extended period of time when we review our long-lived assets and goodwill. Circumstances that may indicate impairment include a decline in future projected cash flows, a decision to suspend plant operations for an extended period of time, a sustained decline in our market capitalization, a sustained decline in market prices for similar assets or businesses, or a significant adverse change in legal or regulatory matters or business climate. Significant management judgment is required to determine the fair value of our long-lived assets and goodwill and measure impairment, including projected cash flows. Fair value is determined through various valuation techniques, including discounted cash flow models, sales of comparable properties and third-party independent appraisals. Changes in estimated fair value could result in a write-down of the asset.
Asset Retirement Obligations
Under certain lease agreements, we have asset retirement obligations requiring us to return the property to its original condition upon termination of the lease agreement. Determining future restoration and removal costs is subjective, requiring management to make estimates and judgments. Asset removal technologies and costs, regulatory and other compliance considerations and the timing of expenditures are subject to change. Accretion expense is recognized over time as the discounted liabilities are accreted to their expected settlement value.
Recent Accounting Pronouncements
For information related to recent accounting pronouncements, see Note 2 –Summary of Significant Accounting Policies to the consolidated financial statements included under Recast Item 15 – Exhibits, Financial Statement Schedules.
Off-Balance Sheet Arrangements
We do not have any off-balance sheet arrangements, other than operating leases, which are entered into in the ordinary course of business and disclosed in the Recast Contractual Obligations section above.
23
Part IV
Recast Item 15. Exhibits, Financial Statement Schedules.
(1) Financial Statements. The following recast consolidated financial statements and notes are filed as part of this report.
|
|
Page |
|
Report of Independent Registered Public Accounting Firm |
F-1 |
|
Consolidated Balance Sheets as of December 31, 2015 and 2014 |
F-2 |
|
Consolidated Statements of Operations for the years-ended December 31, 2015, 2014 and 2013 |
F-3 |
|
Consolidated Statements of Partners' Capital for the years-ended December 31, 2015, 2014 and 2013 |
F-4 |
|
Consolidated Statements of Cash Flows for the years-ended December 31, 2015, 2014 and 2013 |
F-5 |
|
Notes to Consolidated Financial Statements |
F-6 |
(2) Financial Statement Schedules. All schedules have been omitted because they are not applicable or the required information is included in the consolidated financial statements or notes.
24
Report of Independent Registered Public Accounting Firm
The Board of Directors of
Green Plains Holdings LLC, the general partner of Green Plains Partners LP
and
Unitholders of Green Plains Partners LP
We have audited the accompanying consolidated balance sheets of Green Plains Partners LP and subsidiaries (the partnership) as of December 31, 2015 and 2014, and the related consolidated statements of operations, partners’ capital, and cash flows for each of the years in the three year period ended December 31, 2015. These consolidated financial statements are the responsibility of the partnership’s management. Our responsibility is to express an opinion on these consolidated financial statements based on our audits.
We conducted our audits in accordance with the standards of the Public Company Accounting Oversight Board (United States). Those standards require that we plan and perform the audit to obtain reasonable assurance about whether the financial statements are free of material misstatement. An audit includes examining, on a test basis, evidence supporting the amounts and disclosures in the financial statements. An audit also includes assessing the accounting principles used and significant estimates made by management, as well as evaluating the overall financial statement presentation. We believe that our audits provide a reasonable basis for our opinion.
In our opinion, the consolidated financial statements referred to above present fairly, in all material respects, the financial position of Green Plains Partners LP and subsidiaries as of December 31, 2015 and 2014, and the results of their operations and their cash flows for each of the years in the three year period ended December 31, 2015, in conformity with U.S. generally accepted accounting principles.
As discussed in Note 1 to the consolidated financial statements, the partnership recognized the assets and liabilities transferred on July 1, 2015, and January 1, 2016, at the parent’s historical cost basis. Such assets and liabilities and the associated expenses are reflected retroactively.
/s/ KPMG LLP
Omaha, Nebraska
May 12, 2016
F-1
GREEN PLAINS PARTNERS LP
CONSOLIDATED BALANCE SHEETS
(in thousands, except unit amounts)
|
|
||||||
|
|
December 31, |
|||||
|
|
2015* |
2014 |
||||
|
|
||||||
|
ASSETS |
||||||
|
Current assets |
||||||
|
Cash and cash equivalents |
$ |
16,385 |
$ |
5,705 | ||
|
Accounts receivable, net of allowances of $0 and $6, respectively |
566 | 484 | ||||
|
Accounts receivable from affiliates |
14,347 | 3,367 | ||||
|
Prepaid expenses and other |
2,621 | 2,480 | ||||
|
Total current assets |
33,919 | 12,036 | ||||
|
|
||||||
|
Property and equipment, net |
41,862 | 37,926 | ||||
|
Goodwill |
10,598 | 10,598 | ||||
|
Note receivable |
8,100 | 8,100 | ||||
|
Other assets |
1,442 | 2,320 | ||||
|
Deferred income taxes |
77 | 9,012 | ||||
|
Total assets |
$ |
95,998 |
$ |
79,992 | ||
|
|
||||||
|
LIABILITIES AND PARTNERS' CAPITAL |
||||||
|
Current liabilities |
||||||
|
Accounts payable |
$ |
4,590 |
$ |
293 | ||
|
Accounts payable to affiliates |
1,538 | 578 | ||||
|
Accrued and other liabilities |
7,475 | 810 | ||||
|
Total current liabilities |
13,603 | 1,681 | ||||
|
|
||||||
|
Long-term debt |
8,100 | 8,100 | ||||
|
Deferred lease liability |
349 | 329 | ||||
|
Asset retirement obligations |
1,808 | 2,015 | ||||
|
Other liabilities |
328 | 560 | ||||
|
Total liabilities |
24,188 | 12,685 | ||||
|
|
||||||
|
Partners' capital |
||||||
|
Net investment - MLP predecessor |
- |
67,307 | ||||
|
Net investment - sponsor |
6,299 |
- |
||||
|
Common unitholders - public (11,510,089 units issued and outstanding) |
161,079 |
- |
||||
|
Common unitholders - Green Plains (4,389,642 units issued and outstanding) |
(21,088) |
- |
||||
|
Subordinated unitholders - Green Plains (15,889,642 units issued and outstanding) |
(76,334) |
- |
||||
|
General partner interests |
1,854 |
- |
||||
|
Total partners' capital |
71,810 | 67,307 | ||||
|
Total liabilities and partners' capital |
$ |
95,998 |
$ |
79,992 | ||
*Recast to include the historical balances of net assets acquired in a transfer between entities under common control. See Notes 1 and 4 in the accompanying notes to consolidated financial statements for further discussion.
See accompanying notes to the consolidated financial statements.
F-2
GREEN PLAINS PARTNERS LP
CONSOLIDATED STATEMENTS OF OPERATIONS
(in thousands, except per unit amounts)
|
|
|||||||||
|
|
Year Ended December 31, |
||||||||
|
|
|||||||||
|
|
2015* |
2014 |
2013 |
||||||
|
Revenues |
|||||||||
|
Affiliate |
$ |
42,549 |
$ |
4,359 |
$ |
3,853 | |||
|
Non-affiliate |
8,388 | 8,484 | 7,179 | ||||||
|
Total revenues |
50,937 | 12,843 | 11,032 | ||||||
|
Operating expenses |
|||||||||
|
Operations and maintenance |
29,601 | 26,424 | 17,854 | ||||||
|
General and administrative |
3,114 | 1,403 | 1,402 | ||||||
|
Depreciation and amortization |
5,828 | 5,544 | 3,572 | ||||||
|
Total operating expenses |
38,543 | 33,371 | 22,828 | ||||||
|
Operating income (loss) |
12,394 | (20,528) | (11,796) | ||||||
|
Other income (expense) |
|||||||||
|
Interest income |
86 | 75 | 49 | ||||||
|
Interest expense |
(381) | (138) | (768) | ||||||
|
Total other expense |
(295) | (63) | (719) | ||||||
|
Income (loss) before income tax benefit |
12,099 | (20,591) | (12,515) | ||||||
|
Income tax benefit |
(4,009) | (7,758) | (4,705) | ||||||
|
Net income (loss) |
16,108 | (12,833) | (7,810) | ||||||
|
Net loss attributable to MLP predecessor |
(6,628) | (12,833) | (7,810) | ||||||
|
Net loss attributable to sponsor |
(273) |
- |
- |
||||||
|
Net income attributable to the partnership |
$ |
23,009 |
$ |
- |
$ |
- |
|||
|
|
|||||||||
|
Net income attributable to partners' ownership interest |
|||||||||
|
General partner |
$ |
460 | |||||||
|
Limited partners - common unitholders |
11,278 | ||||||||
|
Limited partners - subordinated unitholders |
11,271 | ||||||||
|
|
|||||||||
|
Earnings per limited partner unit (basic and diluted): |
|||||||||
|
Common units |
$ |
0.71 | |||||||
|
Subordinated units |
$ |
0.71 | |||||||
|
Weighted average limited partner units outstanding (basic and diluted): |
|||||||||
|
Common units |
15,897 | ||||||||
|
Subordinated units |
15,890 | ||||||||
|
|
|||||||||
|
|
|||||||||
|
|
|||||||||
*Recast to include the historical results of operations related to the net assets acquired in a transfer between entities under common control. See Notes 1 and 4 in the accompanying notes to consolidated financial statements for further discussion.
See accompanying notes to the consolidated financial statements.
F-3
GREEN PLAINS PARTNERS LP
CONSOLIDATED STATEMENTS OF PARTNERS’ CAPITAL
(in thousands)
|
|
|
|
|
|
|
|
|
|
|
|
|
|
|
|
|
|
|
|
|
|
|
|
|
|
|
|
|
|
|
|
Partners' Capital |
|
|
|
||||||||||
|
|
|
|
|
|
|
|
|
Limited Partners |
|
|
|
|
|
||||||||
|
|
|
|
Membership |
|
|
Sponsor Equity in |
|
|
Common Units- |
|
|
Common Units- |
|
|
Subordinated Units- |
|
|
General |
|
|
|
|
|
|
|
Interests |
|
|
Contributed Assets |
|
|
Public |
|
|
Green Plains |
|
|
Green Plains |
|
|
Partner |
|
|
Total |
|
Balance, December 31, 2012 |
|
$ |
31,823 |
|
$ |
- |
|
$ |
- |
|
$ |
- |
|
$ |
- |
|
$ |
- |
|
$ |
31,823 |
|
Net income (loss) |
|
|
(7,810) |
|
|
- |
|
|
- |
|
|
- |
|
|
- |
|
|
- |
|
|
(7,810) |
|
Debt converted to equity |
|
|
13,890 |
|
|
- |
|
|
- |
|
|
- |
|
|
- |
|
|
- |
|
|
13,890 |
|
Member contributions, net |
|
|
21,348 |
|
|
- |
|
|
- |
|
|
- |
|
|
- |
|
|
- |
|
|
21,348 |
|
Balance, December 31, 2013 |
|
|
59,251 |
|
|
- |
|
|
- |
|
|
- |
|
|
- |
|
|
- |
|
|
59,251 |
|
Net income (loss) |
|
|
(12,833) |
|
|
- |
|
|
- |
|
|
- |
|
|
- |
|
|
- |
|
|
(12,833) |
|
Member contributions, net |
|
|
20,889 |
|
|
- |
|
|
- |
|
|
- |
|
|
- |
|
|
- |
|
|
20,889 |
|
Balance, December 31, 2014 |
|
|
67,307 |
|
|
- |
|
|
- |
|
|
- |
|
|
- |
|
|
- |
|
|
67,307 |
|
Net loss attributed to MLP Predecessor |
|
|
(6,628) |
|
|
- |
|
|
- |
|
|
- |
|
|
- |
|
|
- |
|
|
(6,628) |
|
Member contributions, net |
|
|
7,890 |
|
|
- |
|
|
- |
|
|
- |
|
|
- |
|
|
- |
|
|
7,890 |
|
Allocation of MLP predecessor net investment to partners' capital |
|
|
(68,569) |
|
|
- |
|
|
- |
|
|
14,382 |
|
|
52,062 |
|
|
2,125 |
|
|
- |
|
Elimination of MLP predecessor income taxes |
|
|
- |
|
|
- |
|
|
- |
|
|
(3,212) |
|
|
(11,627) |
|
|
(475) |
|
|
(15,314) |
|
Proceeds from IPO, net of discounts, structuring fees, and other IPO expenses |
|
|
- |
|
|
- |
|
|
157,452 |
|
|
- |
|
|
- |
|
|
- |
|
|
157,452 |
|
Cash distribution to Green Plains related to IPO |
|
|
- |
|
|
- |
|
|
|
|
|
(33,616) |
|
|
(121,684) |
|
|
- |
|
|
(155,300) |
|
Quarterly cash distribution to unitholders |
|
|
- |
|
|
- |
|
|
(4,604) |
|
|
(1,756) |
|
|
(6,356) |
|
|
(259) |
|
|
(12,975) |
|
Acquisition of assets from sponsor in transfer between entities under common control |
|
|
- |
|
|
6,342 |
|
|
- |
|
|
- |
|
|
- |
|
|
- |
|
|
6,342 |
|
Contributions from sponsor |
|
|
- |
|
|
230 |
|
|
- |
|
|
- |
|
|
- |
|
|
- |
|
|
230 |
|
Net loss attributable to sponsor |
|
|
- |
|
|
(273) |
|
|
- |
|
|
- |
|
|
- |
|
|
- |
|
|
(273) |
|
Net income attributable to partnership |
|
|
- |
|
|
- |
|
|
8,164 |
|
|
3,114 |
|
|
11,271 |
|
|
460 |
|
|
23,009 |
|
Unit-based compensation, including general partner contribution |
|
|
- |
|
|
- |
|
|
67 |
|
|
- |
|
|
- |
|
|
3 |
|
|
70 |
|
Balance, December 31, 2015* |
|
$ |
- |
|
$ |
6,299 |
|
$ |
161,079 |
|
$ |
(21,088) |
|
$ |
(76,334) |
|
$ |
1,854 |
|
$ |
71,810 |
*Recast to include the historical equity effects related to balances of the net assets acquired in a transfer between entities under common control. See Notes 1 and 4 in the accompanying notes to consolidated financial statements for further discussion.
See accompanying notes to the consolidated financial statements.
F-4
GREEN PLAINS PARTNERS LP
CONSOLIDATED STATEMENTS OF CASH FLOWS
(in thousands)
|
|
|||||||||
|
|
|
Year Ended December 31, |
|||||||
|
|
2015* |
2014 |
2013 |
||||||
|
Cash flows from operating activities |
|||||||||
|
Net income (loss) |
$ |
16,108 |
$ |
(12,833) |
$ |
(7,810) | |||
|
Adjustments to reconcile net income (loss) to net cash |
|||||||||
|
Depreciation and amortization |
5,828 | 5,544 | 3,572 | ||||||
|
Accretion |
201 | 173 | 170 | ||||||
|
Amortization of debt issuance costs |
134 | 46 | 24 | ||||||
|
Deferred income taxes |
(4,076) | (7,360) | (4,255) | ||||||
|
Other |
67 | (20) | 35 | ||||||
|
Changes in operating assets and liabilities: |
|||||||||
|
Accounts receivable |
(82) | 465 | (116) | ||||||
|
Accounts receivable from affiliates |
(13,283) | (1,024) | (461) | ||||||
|
Prepaid expenses and other assets |
(404) | 30 | 145 | ||||||
|
Accounts payable and accrued liabilities |
10,962 | (318) | (1,371) | ||||||
|
Accounts payable to affiliates |
960 | (811) | (692) | ||||||
|
Other |
(682) | (233) | 86 | ||||||
|
Net cash provided (used) by operating activities |
15,733 | (16,341) | (10,673) | ||||||
|
|
|||||||||
|
Cash flows from investing activities |
|||||||||
|
Purchases of property and equipment |
(1,497) | (547) | (1,122) | ||||||
|
Acquisition of business, net of cash acquired |
- |
- |
(10,301) | ||||||
|
Proceeds on disposal of assets, net |
19 |
- |
40 | ||||||
|
Receipt of grant |
- |
- |
1,900 | ||||||
|
Net cash used by investing activities |
(1,478) | (547) | (9,483) | ||||||
|
|
|||||||||
|
Cash flows from financing activities |
|||||||||
|
Proceeds from initial public offering, net |
157,452 |
- |
- |
||||||
|
Payments of distributions |
(168,275) |
- |
- |
||||||
|
Payments of loan fees |
(875) |
- |
(337) | ||||||
|
Net contributions from Green Plains |
8,123 | 20,889 | 23,522 | ||||||
|
Proceeds from issuance on long-term debt |
- |
- |
8,100 | ||||||
|
Payments on long-term debt |
- |
- |
(212) | ||||||
|
Notes payable - affiliate |
- |
- |
(1,466) | ||||||
|
Note receivable |
(8,100) | ||||||||
|
Net cash provided (used) by financing activities |
(3,575) | 20,889 | 21,507 | ||||||
|
|
|||||||||
|
Net change in cash and cash equivalents |
10,680 | 4,001 | 1,351 | ||||||
|
Cash and cash equivalents, beginning of period |
5,705 | 1,704 | 353 | ||||||
|
Cash and cash equivalents, end of period |
$ |
16,385 |
$ |
5,705 |
$ |
1,704 | |||
|
|
|||||||||
|
Supplemental disclosures of cash flow |
|||||||||
|
Cash paid for income taxes |
$ |
1,006 |
$ |
1,387 |
$ |
- |
|||
|
Cash paid for interest |
$ |
173 |
$ |
100 |
$ |
737 | |||
|
Note payable with affiliate converted to equity |
$ |
- |
$ |
- |
$ |
13,890 | |||
*Recast to include the historical cash flow activity related to the net assets acquired in a transfer between entities under common control. See Notes 1 and 4 in the accompanying notes to consolidated financial statements for further discussion.
See accompanying notes to the consolidated financial statements.
F-5
GREEN PLAINS PARTNERS LP
NOTES TO CONSOLIDATED FINANCIAL STATEMENTS
1. BASIS OF PRESENTATION AND DESCRIPTION OF BUSINESS
References to the Partnership and to the MLP Predecessor
References to “the partnership” in the recast consolidated financial statements and in these recast notes to the consolidated financial statements refer to Green Plains Partners LP and its subsidiaries. References to the “MLP predecessor” refer to BlendStar LLC and its subsidiaries, the partnership’s predecessor for accounting purposes, and the assets, liabilities and results of operations of certain ethanol storage and railcar assets contributed by Green Plains Inc. in connection with the IPO on July 1, 2015. References to “the sponsor” in transactions subsequent to the IPO refers to Green Plains Inc.
On July 1, 2015, Green Plains Partners closed its IPO of common units representing limited partner interests of the partnership. Green Plains Holdings LLC, a wholly owned subsidiary of Green Plains Inc., serves as the general partner of the partnership. References to (i) “the general partner” and “Green Plains Holdings” refer to Green Plains Holdings LLC; (ii) “the parent” and “Green Plains” refer to Green Plains Inc.; and (iii) “Green Plains Trade” refers to Green Plains Trade Group LLC, a wholly owned subsidiary of Green Plains.
Consolidated Financial Statements
The consolidated financial statements, prepared in accordance with GAAP, include the accounts of the Green Plains Partners LP and its subsidiaries. All significant intercompany balances and transactions are eliminated on a consolidated basis for reporting purposes.
When transferring assets between entities under common control, the entity receiving the net assets initially recognizes the carrying amounts of the assets and liabilities at the date of transfer. The transferee’s prior period financial statements are recast for all periods its operations were part of the parent’s consolidated financial statements.
On July 1, 2015, in addition to the interests of BlendStar, the partnership received the assets and liabilities of the ethanol storage and railcar assets contributed by its parent in a transfer between entities under common control. The partnership recognized the assets and liabilities transferred at the parent’s historical cost basis, which are reflected retroactively in the consolidated financial statements. Expenses related to these assets, such as depreciation, amortization and railcar lease expenses are also reflected retroactively. There are no revenues related to these assets reflected in the consolidated financial statements for periods before July 1, 2015, when the related commercial agreements became effective.
Effective January 1, 2016, the partnership acquired the ethanol storage and leased railcar assets of the Hereford, Texas and Hopewell, Virginia ethanol production facilities from its sponsor in a transfer between entities under common control. The assets were recognized at historical cost and reflected retroactively along with related expenses for periods prior to the effective date of the acquisition, subsequent to the initial dates the assets were acquired by the sponsor, or October 23, 2015, and November 12, 2015, for Hopewell and Hereford, respectively. There were no revenues related to these assets for periods before January 1, 2016, when amendments to the commercial agreements related to the drop down became effective.
The MLP predecessor was a single member limited liability company, treated as a non-taxable disregarded entity in Green Plains’ federal and state income tax returns. For periods prior to the IPO, the consolidated financial statements reflect income taxes as if the MLP predecessor had filed separate federal and state tax returns.
Reclassifications
Certain amounts were reclassified to conform to a revised current year presentation. These reclassifications did not affect total revenues, operating expenses, net income or partners’ capital.
Use of Estimates in the Preparation of Consolidated Financial Statements
Preparation of the consolidated financial statements in accordance with GAAP requires management to make estimates and assumptions that affect the reported assets and liabilities and disclosure of contingent assets and liabilities at the date of the consolidated financial statements and the reported amounts of revenues and expenses during the reporting period. The partnership bases its estimates on historical experience and assumptions it believes are proper and reasonable under the circumstances. The partnership regularly evaluates the appropriateness of these estimates and assumptions. Actual results
F-6
could differ from those estimates. Key accounting policies, including, but not limited to, those related to depreciation of property and equipment, asset retirement obligations, and impairment of long-lived assets and goodwill are impacted significantly by judgments, assumptions and estimates used to prepare the consolidated financial statements.
Description of Business
The partnership provides fuel storage and transportation services by owning, operating, developing and acquiring ethanol and fuel storage tanks, terminals, transportation assets and other related assets and businesses. The partnership is its parent’s primary downstream logistics provider to support the parent’s approximately 1.2 bgy ethanol marketing and distribution business since the partnership’s assets are the principal method of storing and delivering the ethanol the parent produces. The ethanol produced by the parent is fuel grade, made principally from starch extracted from corn, and is primarily used for blending with gasoline. Ethanol currently comprises approximately 10% of the U.S. gasoline market and is an economical source of octane and oxygenate for blending into the fuel supply. The partnership does not take ownership of, or receive any payments based on the value of, the ethanol or other fuels it handles; as a result, the partnership does not have any direct exposure to fluctuations in commodity prices.
2. SUMMARY OF SIGNIFICANT ACCOUNTING POLICIES
Cash and Cash Equivalents
The Company considers short-term highly liquid investments with original maturities of three months or less to be cash equivalents. Cash and cash equivalents include bank deposits.
Revenue Recognition
The partnership recognizes revenues when all of the following criteria are satisfied: persuasive evidence of an arrangement exists; services have been rendered; the price is fixed and determinable; and collectability is reasonably assured.
The partnership derives revenues when product is delivered to the customer after volumes are transported through its ethanol storage tanks and fuel terminals, and transportation services are performed. The partnership generates a substantial portion of its revenues under fee-based commercial agreements with Green Plains Trade.
The partnership’s storage and throughput agreement and certain terminal services agreements with Green Plains Trade are supported by minimum volume commitments. The partnership’s rail transportation services agreement is supported by minimum take-or-pay capacity commitments. Green Plains Trade is required to pay the partnership fees for these minimum commitments regardless of the actual volume, throughput or capacity used for transport. Payment related to volume that was not actually throughput by Green Plains Trade is applied as a credit toward volume in excess of the minimum volume commitment during any of the next four quarters, after which time unused credits expire. The partnership records a liability for deferred revenue in the amount of the credit that may be used in future periods and for any customer prepayments before the product is delivered. The partnership recognizes revenue and relieves the liability when throughput volumes exceed the minimum volume commitment or unused credits expire. As a result, a significant portion of the partnership’s revenues may be associated with cash collected during an earlier period that do not generate any cash during the current period.
Concentrations of Credit Risk
In the normal course of business, the partnership is exposed to credit risk resulting from the possibility a loss may occur due to failure of another party to perform according to the terms of a contract. The partnership provides fuel storage and transportation services for various parties with a significant portion of its revenues earned from Green Plains Trade. The partnership continually monitors its credit risk exposure and concentrations.
Trade Accounts Receivable
Trade accounts receivable are recorded at the invoiced amount. The partnership assesses the need for an allowance for doubtful accounts for estimated losses inherent in its accounts receivable portfolio. In assessing the required allowance, the partnership considers historical losses adjusted to take into account current market conditions and its customers’ financial condition, the amount of receivables in dispute, current receivables’ aging and current payment patterns. The partnership does not have any off-balance-sheet credit exposure related to its customers.
F-7
Property and Equipment
Property and equipment are stated at cost less accumulated depreciation. Depreciation of these assets is generally computed using the straight-line method over the following estimated useful lives of the assets:
|
|
||
|
|
Years |
|
|
Buildings and improvements |
10-40 |
|
|
Tanks and terminal equipment |
15-40 |
|
|
Rail and rail equipment |
10-22 |
|
|
Other machinery and equipment |
5-7 |
|
|
Computer and software |
3-5 |
|
|
Office furniture and equipment |
5-7 |
Property and equipment is capitalized at cost. Land improvements are capitalized and depreciated. Expenditures for property betterments and renewals are capitalized. Costs of repairs and maintenance are charged to expense as incurred. The partnership periodically evaluates whether events and circumstances have occurred that may warrant revision of the estimated useful life of its fixed assets.
Asset Retirement Obligations
The partnership records an ARO for the fair value of the estimated costs to retire a tangible long-lived asset in the period in which it is incurred if it can be reasonably estimated, which is subsequently adjusted for accretion expense. The corresponding asset retirement costs are capitalized as a long-lived asset and depreciated on a straight-line basis over the asset’s remaining useful life. The expected present value technique used to calculate the fair value of AROs includes assumptions about costs, settlement dates, interest accretion and inflation. Changes in assumptions, including the amount or timing of estimated cash flows, could result in increases or decreases to the AROs. The partnership’s AROs are based on legal obligations to perform remedial activity when certain machinery and equipment are disposed and operating leases expire.
Impairment of Long-Lived Assets
The partnership reviews its long-lived assets, currently consisting of property and equipment, for impairment when events or changes in circumstances indicate that the carrying amount of a long-lived asset may not be recoverable. Recoverability of assets to be held and used is measured by comparison of the carrying amount of an asset to estimated undiscounted future cash flows expected to be generated by the asset. If the carrying amount of an asset exceeds its estimated future cash flows, an impairment charge is recognized in the amount by which the carrying amount of the asset exceeds the fair value of the asset. Significant management judgment is required in determining the fair value of long-lived assets to measure impairment, including projections of future discounted cash flows. No impairment charges were recorded for the periods reported.
Goodwill
Goodwill is an asset representing the future economic benefits arising from other assets acquired in a business combination that are not individually identified and separately recognized. The partnership’s goodwill currently is comprised of amounts recognized by the MLP predecessor related to terminal services assets.
Goodwill is reviewed for impairment at least annually. The qualitative factors of goodwill are assessed to determine whether it is more likely than not that the fair value of a reporting unit is less than its carrying amount as a basis for determining whether it is necessary to perform the two-step goodwill impairment test. Under the first step, the fair value of the reporting unit is compared with its carrying value (including goodwill). If the fair value of the reporting unit is less than its carrying value, an indication of goodwill impairment exists for the reporting unit and the entity must perform step two of the impairment test. Under the second step, an impairment loss is recognized for any excess of the carrying amount of the reporting unit’s goodwill over the implied fair value of that goodwill. The implied fair value of goodwill is determined by allocating the fair value of the reporting unit in a manner similar to a purchase price allocation and the residual fair value after this allocation is the implied fair value of the reporting unit goodwill. Fair value of the reporting unit is determined using a discounted cash flow analysis. If the fair value of the reporting unit exceeds its carrying value, no further analysis is necessary. The partnership performs its annual impairment review of goodwill at October 1, and when a triggering event occurs between annual impairment tests. No impairment losses were recorded for the periods reported.
F-8
Segment Reporting
The partnership accounts for segment reporting in accordance with ASC 280, Segment Reporting, which establishes standards for entities reporting information about the operating segments and geographic areas in which they operate. Management evaluated how its chief operating decision maker has organized the partnership for purposes of making operating decisions and assessing performance, and concluded it has one reportable segment.
Income Taxes
Subsequent to its IPO, the partnership is a limited partnership and as a result is not subject to federal and state income taxes. The general partner and the unitholders are responsible for paying federal and state income taxes on their share of the partnership’s taxable income.
The partnership recognizes uncertainties in income taxes within the financial statements under a process by which the likelihood of a tax position is gauged based upon the technical merits of the position, and then a subsequent measurement relates the maximum benefit and the degree of likelihood to determine the amount of benefit recognized in the financial statements.
Financing Costs
Fees and costs related to securing debt financing are recorded as financing costs. Debt issuance costs are stated at cost and are amortized utilizing the effective interest method for term loans and on a straight-line basis for revolving credit arrangements over the life of the agreements. However, during periods of construction, amortization of such costs is capitalized in construction-in-progress.
General and Administrative Expenses
General and administrative expenses are primarily general and administrative expenses for employee salaries, incentives and benefits; office expenses; director compensation; and professional fees for accounting, legal, consulting, and investor relations activities.
Unit-Based Compensation
The partnership recognizes compensation cost using a fair value based method whereby compensation cost is measured at the grant date based on the value of the award and is recognized over the service period, which is usually the vesting period. Units issued for compensation are valued using the market price of the stock on the date of the related agreement.
Earnings Per Unit
The partnership has identified common and subordinated units as participating securities and computes earnings per limited partner unit using the two-class method. Earnings per limited partner unit is computed by dividing limited partners' interest in net income, after deducting any incentive distributions, by the weighted-average number of common and subordinated units outstanding during the period, adjusted for the dilutive effect of any outstanding dilutive securities.
Recent Accounting Pronouncements
Effective January 1, 2015, the partnership early adopted the amended guidance in ASC 740, Income Taxes: Balance Sheet Classification of Deferred Taxes, which requires entities with a classified balance sheet to present all deferred tax assets and liabilities as noncurrent. The consolidated balance sheets reflect the retrospective adjustment for the amended guidance.
Effective January 1, 2016, the partnership will adopt the amended guidance in ASC 835-30, Interest - Imputation of Interest: Simplifying the Presentation of Debt Issuance Costs, which requires debt issuance costs related to a recognized debt liability be presented in the balance sheet as a direct deduction from the carrying amount of that debt liability, consistent with debt discounts. The amended guidance will be applied on a retrospective basis and the balance sheet of each individual period presented will be adjusted to reflect the period-specific effects of the new guidance.
Effective January 1, 2016, the partnership will adopt the amended guidance in ASC 260, Effects on Historical Earnings per Unit of Master Limited Partnership Dropdown Transactions, which specifies how to calculate historical earnings or losses per unit under the two-class method of a transferred business before the date of a dropdown transaction that should be
F-9
allocated entirely to the general partner. The standard is effective for interim and annual periods beginning after December 15, 2015, and early adoption is permitted. The partnership is currently evaluating whether the adoption of ASC Topic 260 will have any impact on its consolidated financial statements, disclosures or future drop-down transactions.
Effective January 1, 2018, the partnership will adopt the amended guidance in ASC 606, Revenue from Contracts with Customers, which requires revenue recognition to reflect the transfer of promised goods or services to customers. The updated standard permits either the retrospective or cumulative effect transition method. Early application beginning January 1, 2017, is permitted. The partnership does not expect the adoption of this guidance to have a material impact on its consolidated financial statements.
3. INITIAL PUBLIC OFFERING
On June 26, 2015, the common units of the partnership began trading under the symbol “GPP” on Nasdaq. On July 1, 2015, the partnership closed the IPO of 11,500,000 common units to the public at a price of $15.00 per common unit.
In connection with the IPO, the partnership issued (i) 4,389,642 common units and 15,889,642 subordinated units to Green Plains and its affiliates, representing a 62.5% limited partner interest in the partnership; (ii) a 2.0% general partner interest in the partnership and all of its incentive distribution rights to the general partner; and (iii) 11,500,000 common units to the public, representing a 35.5% limited partner interest in the partnership. Green Plains contributed the interests of BlendStar, its ethanol storage facilities and transportation assets, including its leased railcar fleet, to the partnership, and, through its wholly owned subsidiary, controls all of the business and affairs of the partnership.
The partnership received net proceeds of $157.5 million from the sale of 11,500,000 common units, after deducting underwriting discounts of $10.3 million, structuring fees of $0.9 million and other IPO expenses of approximately $3.8 million. The partnership used the net proceeds to make a cash distribution of $155.3 million to Green Plains, in part, as reimbursement for capital expenditures incurred and to pay $0.9 million in origination fees under its new revolving credit facility. The remaining $1.3 million was retained for general partnership purposes.
The following descriptions relate to agreements entered into in connection with the IPO on July 1, 2015. For additional information and the agreements in their entirety, please refer to the prospectus and the current report on Form 8-K filed with the SEC on July 6, 2015, and Note 16 – Related Party Transactions to consolidated financial statements in this report.
Omnibus Agreement
In connection with the IPO, the partnership entered into an omnibus agreement with Green Plains and its affiliates which addresses:
|
· |
the partnership’s obligation to reimburse Green Plains for direct or allocated costs and expenses incurred by Green Plains for general and administrative services (in addition to expenses incurred by the general partner and its affiliates that are reimbursed under the First Amended and Restated Agreement of Limited Partnership of the Green Plains Partners LP, or the partnership agreement); |
|
· |
the prohibition of Green Plains and its subsidiaries from owning, operating or investing in any business that owns or operates fuel terminals or fuel transportation assets in the United States, subject to exceptions; |
|
· |
the partnership’s right of first offer to acquire assets if Green Plains decides to sell them for up to five years from the consummation of the IPO; |
|
· |
a nontransferable, nonexclusive, royalty-free license to use the Green Plains trademark and name; |
|
· |
the allocation of taxes among the parent, the partnership and its affiliates and the parent’s preparation and filing of tax returns; and |
|
· |
an indemnity by Green Plains for environmental and other liabilities, the partnership’s obligation to indemnify Green Plains and its subsidiaries for events and conditions associated with the operation of partnership assets that occur after the closing of the IPO, and for environmental liabilities related to partnership assets to the extent Green Plains is not required to indemnify the partnership. |
If Green Plains or its affiliates cease to control the general partner, then either Green Plains or the partnership may terminate the omnibus agreement, provided that (i) the indemnification obligations of the parties survive according to their respective terms; and (ii) Green Plains’ obligation to reimburse the partnership for operational failures survives according to its terms.
F-10
Contribution, Conveyance and Assumption Agreement
On July 1, 2015, in connection with the IPO, the partnership entered into a contribution, conveyance and assumption agreement with the general partner, Green Plains, Green Plains Operating Company, Green Plains Obion and Green Plains Trucking, and the following transactions, among others, occurred concurrently with the closing of the IPO:
|
· |
Green Plains conveyed its 2.25% limited liability interest in Green Plains Operating Company to the general partner, which the general partner then conveyed to the partnership in exchange for the general partner interest and all of the limited partner interests in the partnership classified as incentive distribution rights under the partnership agreement; |
|
· |
Green Plains conveyed its remaining 97.75% limited liability interest in Green Plains Operating Company to the partnership in exchange for 3,629,982 common units and 13,139,822 subordinated units; |
|
· |
Green Plains Obion conveyed its 10.32% limited liability interest in Green Plains Ethanol Storage to the partnership in exchange for 649,705 common units and 2,351,806 subordinated units; and |
|
· |
Green Plains Trucking conveyed its 100% interest in Green Plains Trucking II to the partnership in exchange for 109,955 common units and 398,014 subordinated units. |
Subsequent to the IPO, Green Plains Obion and Green Plains Trucking conveyed their interest in the partnership to Green Plains.
Operating Services and Secondment Agreement
In connection with the IPO, the general partner entered into an operational services and secondment agreement with Green Plains. Under the terms of the agreement, Green Plains seconds employees to the general partner to provide management, maintenance and operational functions for the partnership, including regulatory matters, health, environment, safety and security programs, operational services, emergency response, employees training, finance and administration, human resources, business operations and planning. The seconded personnel are under the direct management and supervision of the general partner.
The general partner reimburses the parent for the cost of the seconded employees, including wages and benefits. If a seconded employee does not devote 100% of his or her time providing services to the general partner, the general partner reimburses the parent for a prorated portion of the employee’s overall wages and benefits based on the percentage of time the employee spent working for the general partner. The parent bills the general partner monthly in arrears for services provided during the prior month. Payment is due within 10 days of the general partner’s receipt of the invoice.
Revolving Credit Facility
In connection with the IPO, Green Plains Operating Company, entered into an agreement for a five-year, $100.0 million revolving credit facility, as the borrower, with various lenders to fund working capital, acquisitions, distributions, capital expenditures and other general partnership purposes. The revolving credit facility contains customary representations and warranties, affirmative covenants, negative covenants and events of default. The negative covenants include restrictions on the partnership’s ability to incur additional debt, acquire and sell assets, create liens, invest capital, pay distributions and materially amend the partnership’s commercial agreements with Green Plains Trade. See Note 8 – Debt to the consolidated financial statements for further details regarding the revolving credit facility.
Commercial Agreements
In connection with the IPO, the partnership entered into various fee-based commercial agreements with Green Plains Trade, including:
|
· |
10-year storage and throughput agreement; |
|
· |
6-year rail transportation services agreement; and |
|
· |
1-year fee-based trucking transportation agreement. |
We also assumed:
|
· |
2.5-year terminal services agreement for our Birmingham, Alabama unit train terminal; and |
|
· |
various other terminal services agreements for our other fuel terminal facilities, each with Green Plains Trade. |
F-11
The storage and throughput agreement and terminal services agreements are supported by minimum volume commitments. The rail transportation services agreement is supported by minimum take-or-pay capacity commitments. All of the commercial agreements with Green Plains Trade include provisions that permit Green Plains Trade to suspend, reduce or terminate its obligations under the applicable commercial agreement if certain events occur, including a material breach of the applicable commercial agreement by the partnership, force majeure events that prevent the partnership or Green Plains Trade from performing the respective obligations under the applicable commercial agreement, and not being available to Green Plains Trade for any reason other than action or inaction by Green Plains Trade. If Green Plains Trade reduces its minimum commitment under the commercial agreements, Green Plains Trade is required to pay fees on the revised minimum commitments only.
4. ACQUISITION
Effective January 1, 2016, the partnership acquired the ethanol storage and leased railcar assets located in Hereford, Texas and Hopewell, Virginia from Green Plains, its sponsor, for consideration of $62.3 million. The transaction was financed through the use of the revolving credit facility and cash on hand.
This transaction was considered a transfer between entities under common control, therefore the net assets were transferred at their historical cost of $6.3 million as of the original date of acquisition by the sponsor in the fourth quarter of 2015. The recast financial statements have been retroactively adjusted to reflect the results of operations, financial position and cash flows of this transaction as if the net assets were owned by the partnership since the sponsor purchased the two ethanol production facilities in the fourth quarter of 2015.
The following is a summary of assets acquired and liabilities assumed as of January 1, 2016 (in thousands):
|
Purchase price, January 1, 2016 |
$ |
62,312 | |
|
Identifiable assets acquired and liabilities assumed: |
|||
|
Property and equipment, net |
6,447 | ||
|
Asset retirement obligations |
(148) | ||
|
Total identifiable net assets |
6,299 | ||
|
Partners' capital effect, January 1, 2016 |
$ |
56,013 |
The following is a summary of the results of operations of the acquired assets for the period of common control during the year ended December 31, 2015 (in thousands):
|
|
Year Ended |
||
|
Operations and maintenance |
$ |
232 | |
|
Depreciation and amortization |
41 | ||
|
Total operating expenses |
273 | ||
|
Net loss attributable to sponsor |
$ |
(273) | |
At the time of acquisition, the Hopewell facility was not operational; however, upon completion of certain maintenance and enhancement projects, operations began at the plant in early February 2016. In conjunction with the transfer of assets under common control, the partnership entered into amendments to the 1) omnibus agreement, 2) operational services agreement, and 3) ethanol storage and throughput agreement; the rail transportation services agreement was also adjusted. Please refer to Note 16 – Related Party Transactions to consolidated financial statements for additional information.
5. FAIR VALUE DISCLOSURES
The following methods, assumptions and valuation techniques were used to estimate the fair value of the partnership’s financial instruments:
Level 1 – unadjusted quoted prices in active markets for identical assets or liabilities the partnership can access at the measurement date.
F-12
Level 2 – directly or indirectly observable inputs such, as quoted prices for similar assets or liabilities in active markets other than quoted prices included within Level 1, quoted prices for identical or similar assets in markets that are not active, and other inputs that are observable or can be substantially corroborated by observable market data through correlation or other means.
Level 3 – unobservable inputs that are supported by little or no market activity and comprise a significant component of the fair value of the assets or liabilities. The partnership currently does not have any recurring Level 3 financial instruments.
The carrying amounts of financial assets and liabilities with maturities of less than one year, including accounts receivable, cash and cash equivalents and accounts payable, approximate fair value due to the short period to maturity.
The partnership uses market interest rates to measure the fair value of its long‑term debt and adjusts those rates for all necessary risks, including its own credit risk. At December 31, 2015 and 2014, the carrying amount of debt approximated fair value.
6. PROPERTY AND EQUIPMENT
The components of property and equipment are as follows (in thousands):
|
|
||||||
|
|
December 31, |
|||||
|
|
2015 |
2014 |
||||
|
Tanks and terminal equipment |
$ |
37,974 |
$ |
32,244 | ||
|
Leasehold improvements and other |
10,242 | 10,092 | ||||
|
Rail and rail equipment |
4,551 | 4,551 | ||||
|
Land and buildings |
7,022 | 6,335 | ||||
|
Trucks and other vehicles |
1,495 | 357 | ||||
|
Computer equipment, furniture and fixtures |
216 | 208 | ||||
|
Construction-in-progress |
82 | 95 | ||||
|
Total property and equipment |
61,582 | 53,882 | ||||
|
Less: accumulated depreciation |
(19,720) | (15,956) | ||||
|
Property and equipment, net |
$ |
41,862 |
$ |
37,926 | ||
In connection with the closing of the IPO on July 1, 2015, in addition to the interests of BlendStar, Green Plains contributed certain ethanol storage and railcar fixed assets in a transfer between entities under common control with a carrying value of $18.7 million. Effective January 1, 2016, the sponsor contributed the ethanol storage and railcar fixed assets of the Hereford, Texas and Hopewell, Virginia ethanol production facilities in a transfer between entities under common control with a carrying value of $6.4 million. The partnership recognized the assets at historical cost, which are reflected retroactively in the property and equipment table and the consolidated financial statements presented in this report.
7. GOODWILL
The partnership did not have any changes in the carrying amount of goodwill, which was $10.6 million at December 31, 2015 and 2014.
8. DEBT
Revolving Credit Facility
On July 1, 2015, Green Plains Operating Company entered into an agreement for a five-year, $100.0 million revolving credit facility, as the borrower, with various lenders to fund working capital, acquisitions, distributions, capital expenditures and other general partnership purposes. The revolving credit facility contains customary representations and warranties, affirmative covenants, negative covenants and events of default. The negative covenants include restrictions on the partnership’s ability to incur additional debt, acquire and sell assets, create liens, invest capital, pay distributions and materially amend the partnership’s commercial agreements with Green Plains Trade.
The revolving credit facility allows the partnership to request an increase up to an aggregate amount of $50.0 million without the consent of the lenders. The revolving credit facility is available for revolving loans, including sublimits of $15.0
F-13
million for swing line loans and $15.0 million for letters of credit. The partnership’s obligations under the revolving credit facility is secured by a first priority lien on (i) the capital stock of the partnership’s present and future subsidiaries, (ii) all of the partnership’s present and future personal property, including, but not limited to, investment property, general intangibles and contract rights, including rights under any agreements with Green Plains Trade, and (iii) all proceeds and products of the equity interests of the partnership’s present and future subsidiaries as well as its personal property. The partnership, each of its existing subsidiaries and future domestic subsidiaries also guarantee the revolving credit facility.
Loans under the revolving credit facility are subject to a floating interest rate based on the partnership’s maximum consolidated net leverage ratio equal to (a) a base rate plus 75 to 175 basis points per year or (b) a LIBOR rate plus 175 to 275 basis points. The base rate is established as the highest of (i) the rate Bank of America, N.A. announces as its prime lending rate, (ii) the daily one-month LIBOR plus 100 basis points per year or (iii) the federal funds rate plus 50 basis points per year. The unused portion of the revolving credit facility is subject to a commitment fee based on the maximum consolidated net leverage ratio ranging from 30 to 50 basis points per year. The interest rate shall automatically be increased by 2.0% per year on overdue amounts for the period during which any event of default occurs or at the request of the lenders holding a majority of the commitments.
The revolving credit facility requires the partnership to maintain a maximum consolidated net leverage ratio, as defined in the credit agreement, of no more than 3.50 to 1.00 and a minimum consolidated interest coverage ratio, as defined in the credit agreement, of no less than 2.75 to 1.00.
In the event of default, the agent is entitled to take various actions, including the acceleration of amounts due under the revolving credit facility, termination of the commitments under the revolving credit facility and all remedial actions available to a secured creditor. The events of default comprise customary events for a financing agreement of this type, including, without limitation, payment defaults, material inaccuracies of representations and warranties, defaults in the performance of affirmative or negative covenants, including financial covenants, bankruptcy or related defaults, defaults relating to judgments, nonpayment of other material debt and change in control. In connection with the revolving credit facility, the partnership and its subsidiaries entered into customary ancillary agreements and arrangements, which, among other things, provide that the debt, obligations and liabilities arising under or in connection with the revolving credit facility are unconditionally guaranteed by the partnership and each of its existing subsidiaries and future domestic subsidiaries.
The partnership had no borrowings outstanding under the revolving credit facility as of December 31, 2015.
Qualified Low Income Community Investment Notes
Birmingham, a subsidiary of BlendStar, was a recipient of qualified low income community investment notes executed in June 2013 in conjunction with NMTC financing related to the Birmingham, Alabama terminal. Promissory notes payable totaling $10.0 million and notes receivable of $8.1 million were issued in connection with this transaction. The notes payable bear an interest rate of 1.0% per year and require quarterly interest only payments through December 31, 2019. Beginning March 15, 2020, the notes payable require quarterly principal and interest payments of approximately $0.2 million and mature on September 15, 2031. BlendStar retains the right to call $8.1 million of the promissory notes payable in 2020. Income tax credits were generated for the benefit of the lender in connection with the NMTC financing. BlendStar guaranteed the lender the value of these income tax credits over their statutory lives of seven years in the event the income tax credits are recaptured or reduced. The value of the income tax credits was estimated to be $5.0 million at the time of the transaction. The partnership believes the likelihood of recapture or reduction of the income tax credits is remote, and therefore has not established a liability in connection with this guarantee.
The investors of the NMTC financing paid $1.9 million to Birmingham in the form of a promissory note and are entitled to all of the NMTC tax benefits derived from the Birmingham facility. This transaction includes a put/call provision under which BlendStar can cause the $1.9 million to be forgiven. The partnership accounted for the $1.9 million as a grant received and reflected a reduction in the carrying value of the property and equipment at Birmingham, which is recognized in earnings as a decrease in depreciation expense over the useful life of the property and equipment.
F-14
Scheduled long‑term debt repayments as of December 31, 2015, are as follows (in thousands):
|
|
|||
|
Year Ending December 31, |
Amount |
||
|
2016 |
$ |
- |
|
|
2017 |
- |
||
|
2018 |
- |
||
|
2019 |
- |
||
|
2020 |
665 | ||
|
Thereafter |
7,435 | ||
|
Total |
$ |
8,100 | |
Covenant Compliance
The partnership, including all of its subsidiaries, was in compliance with its debt covenants as of December 31, 2015.
Capitalized Interest
The partnership’s policy is to capitalize interest costs incurred on debt during the construction of major projects. The partnership had no capitalized interest for the years ended December 31, 2015 and 2014.
9. ASSET RETIREMENT OBLIGATIONS
Under various lease agreements, the partnership has AROs when certain machinery and equipment are disposed or operating leases expire. The following table summarizes the change in the liability for the AROs (in thousands):
|
|
|||
|
|
Amount |
||
|
Balance, December 31, 2013 |
$ |
2,148 | |
|
Accretion expense |
173 | ||
|
Revisions in estimated cash flows |
(278) | ||
|
Balance, December 31, 2014 |
2,043 | ||
|
Additional asset retirement obligations incurred |
202 | ||
|
Accretion expense |
201 | ||
|
Balance, December 31, 2015 |
$ |
2,446 | |
As of December 31, 2015 and 2014, current AROs of $638 thousand and $28 thousand, respectively, are included in accrued and other liabilities on the consolidated balance sheets.
10. UNIT-BASED COMPENSATION
The board of directors of the general partner adopted the LTIP upon completion of the IPO. The LTIP is intended to promote the interests of the partnership, its general partner and affiliates by providing incentive compensation awards based on units to employees, consultants and directors to encourage superior performance. The LTIP reserves 2,500,000 common units for issuance in the form of options, restricted units, phantom units, distributable equivalent rights, substitute awards, unit appreciation rights, unit awards, profits interest units or other unit-based awards. The partnership measures unit-based compensation grants at fair value on the grant date and records noncash compensation expense related to the awards over the requisite service period.
In August 2015, the partnership granted 10,089 restricted unit awards under the LTIP, vesting on July 1, 2016, with a weighted average price of $14.93 to certain directors of the general partner. The restricted units are accounted for as equity-classified awards. The grant-date fair value, net of estimated forfeitures, is recognized as compensation costs on a straight-line basis over the requisite service period. Compensation costs of approximately $67 thousand were expensed during the year ended December 31, 2015. There were no unit-based compensation costs during the years ended December 31, 2014 and 2013. At December 31, 2015, there were $83 thousand of unrecognized compensation costs from unit-based compensation agreements, which are related to non-vested awards.
The general partner made a capital contribution of $3 thousand to maintain its 2% general partner interest in the partnership in connection with the restricted unit awards granted.
F-15
11. PARTNERS’ CAPITAL
A rollforward of the number of common and subordinated limited partner units outstanding is as follows:
|
|
|
Common Units- |
|
Common Units- |
|
Subordinated Units- |
|
|
|
|
Public |
Green Plains |
Green Plains |
Total |
||||
|
Units issued in connection with IPO, July 1, 2015 |
11,500,000 | 4,389,642 | 15,889,642 | 31,779,284 | ||||
|
Units issued under LTIP |
10,089 |
- |
- |
10,089 | ||||
|
Units outstanding, December 31, 2015 |
11,510,089 | 4,389,642 | 15,889,642 | 31,789,373 |
The partnership’s subordinated units are not entitled to distributions until the common units have received the minimum quarterly distribution for that quarter plus any arrearages of the minimum quarterly distribution from prior quarters. Subordinated units do not accrue arrearages.
The subordination period ends on the first business day after the date the partnership pays distributions of at least $1.60 on each of the outstanding common and subordinated units and the corresponding distribution on the general partner’s 2% general partner interest for three consecutive, four quarter periods ending on or after June 30, 2018, or $2.40 on each of the outstanding common units and subordinated units, and the corresponding distribution on the general partner’s 2% general partner interest and incentive distribution rights for any four-quarter period ending on or after June 30, 2016, provided there are no arrearages of the minimum quarterly distributions from prior quarters at that time. When the subordination period ends, each outstanding subordinated unit will convert into one common unit and the common units will no longer be entitled to arrearages.
Issuance of Additional Securities
The partnership agreement authorizes the partnership to issue unlimited additional partnership interests on the terms and conditions determined by the general partner without unitholder approval.
It is possible the partnership will fund acquisitions through the issuance of additional common units, subordinated units or other partnership interests. Holders of any additional common units are entitled to share equally with existing holders in the partnership’s distributions of available cash. The issuance of additional common units or other partnership interests may dilute the value of the existing holders of common units’ interests.
In accordance with Delaware law and the provisions of the partnership agreement, the partnership may also issue additional interests that have rights to distributions or special voting rights the common units do not have, as determined by the general partner. In addition, the partnership agreement does not prohibit the partnership’s subsidiaries to issue equity interests, which may effectively rank senior to the common units.
The general partner has the right, which it may from time to time assign in whole or in part to any of its affiliates, to purchase common units, subordinated units or other partnership interests from the partnership whenever, and on the same terms that, the partnership issues those interests to persons other than the general partner and its affiliates to maintain the percentage interest of the general partner and its affiliates, including interests represented by common and subordinated units that existed immediately prior to each issuance. The other holders of common units do not have preemptive rights under the partnership agreement to acquire additional common units or other partnership interests.
Cash Distribution Policy
Quarterly distributions are made within 45 days after the end of each calendar quarter, assuming we have sufficient available cash. Available cash generally means, all cash and cash equivalents on hand at the end of that quarter less cash reserves established by the general partner plus all or any portion of the cash on hand resulting from working capital borrowings made subsequent to the end of that quarter.
The general partner is entitled to 2% of all distributions prior to the partnership’s liquidation. The general partner’s 2% general partner interest is reduced if the partnership issues additional partnership interests and the general partner does not contribute a proportionate amount of capital to the partnership to maintain its 2% general partner interest.
F-16
Before the partnership makes quarterly distributions to subordinated unitholders, the common unitholders are entitled to receive the full minimum quarterly distribution plus any arrearages in distributions from prior quarters. During the subordination period, the partnership makes distributions in the following manner:
|
· |
first, 98% to the common unitholders, pro rata, and 2% to the general partner, until the partnership distributes an amount equal to the minimum quarterly distribution for that quarter on each outstanding common unit; |
|
· |
second, 98% to the common unitholders, pro rata, and 2% to the general partner, until the partnership distributes an amount equal to any arrearages of the minimum quarterly distribution for any prior quarters during the subordination period on each outstanding common unit; |
|
· |
third, 98% to the subordinated unitholders, pro rata, and 2% to the general partner, until the partnership distributes an amount equal to the minimum quarterly distribution for that quarter on each outstanding subordinated unit; and |
|
· |
thereafter, in the manner described in the table below. |
The preceding discussion is based on the assumptions that the general partner maintains its 2% general partner interest and the partnership does not issue additional classes of equity securities.
The general partner also initially holds incentive distribution rights that entitles it to receive increasing percentages, up to 48%, of available cash distributed from operating surplus, as defined in the partnership agreement, in excess of $0.46 per unit per quarter. The maximum distribution of 48% does not include any distributions the general partner or its affiliates may receive on its general partner interest, common units or subordinated units.
The following table illustrates the percentage allocations of available cash from operating surplus during the subordination period between the unitholders and the general partner, as the holder of the incentive distribution rights, based on the specified target distribution levels:
|
|
Marginal Percentage Interest in Distribution (1) |
||||||
|
|
|
Total Quarterly Distribution Per Unit - Target Amount |
|
Common and Subordinated Unitholders |
|
General Partner (as holder of Incentive Distribution Rights) (2) |
|
|
Minimum quarterly distribution |
$0.40 |
98.0% |
2.0% |
||||
|
First target distribution |
above $0.40 |
up to $0.46 |
98.0% |
2.0% |
|||
|
Second target distribution |
above $0.46 |
up to $0.50 |
85.0% |
15.0% |
|||
|
Third target distribution |
above $0.50 |
up to $0.60 |
75.0% |
25.0% |
|||
|
Thereafter |
above $0.60 |
50.0% |
50.0% |
||||
(1) Includes percentage interests of the general partner, as the holder of incentive distribution rights, and the unitholders when the partnership distributes available cash from operating surplus up to and including the corresponding amount in the column “Total Quarterly Distribution Per Unit Target Amount.” The percentage interests shown for the unitholders and the general partner for the minimum quarterly distribution are also applicable to quarterly distribution amounts that are less than the minimum quarterly distribution.
(2) The percentage interests for the general partner assume the general partner contributed additional capital necessary to maintain its 2% general partner interest, did not transfer any of its incentive distribution rights and there were no arrearages on common units.
The table below summarizes 2015 quarterly cash distributions declarations, payments and scheduled payments through February 12, 2016:
|
|
||||||||
|
|
Year Ended |
|||||||
|
|
Declaration Date |
Record Date |
Payment Date |
Quarterly Distribution |
||||
|
Third quarter |
October 22, 2015 |
November 6, 2015 |
November 13, 2015 |
$ |
0.40 |
|||
|
Fourth quarter |
January 21, 2016 |
February 5, 2015 |
February 12, 2016 |
$ |
0.4025 |
|||
On January 21, 2016, the board of directors of the general partner declared a quarterly cash distribution of $0.4025 per unit, or approximately $13.1 million in total, for the quarter ended year ended December 31, 2015. The distribution was paid
F-17
on February 12, 2016, to unitholders of record as of February 5, 2016. The allocation of total cash distributions to the general and limited partners applicable to the period the distributions were earned are as follows (in thousands):
|
|
Year Ended |
|
|
General partner distribution |
$ |
521 |
|
Limited partners' distributions: |
||
|
Limited partner common units - public |
9,237 | |
|
Limited partner common units - Green Plains |
3,523 | |
|
Limited partner subordinated units - Green Plains |
12,751 | |
|
Total limited partners' distributions |
25,511 | |
|
Total cash distributions |
$ |
26,032 |
12. EARNINGS PER UNIT
The partnership computes earnings per unit using the two-class method. Earnings per unit applicable to common and subordinated units is calculated by dividing the respective limited partners’ interest in net income by the weighted average number of common and subordinated units outstanding during the period, adjusted for the dilutive effect of any outstanding dilutive securities. Diluted earnings per limited partner unit is the same as basic earnings per limited partner unit as there were no potentially dilutive common or subordinated units outstanding as of December 31, 2015. Earnings per unit is calculated for periods following the IPO since there were no units outstanding before July 1, 2015 (in thousands, except for per unit data):
|
|
|||||||||||
|
|
Year Ended |
||||||||||
|
|
Limited Partner Common Units |
|
Limited Partner |
|
General Partner |
|
Total |
||||
|
Net income |
|||||||||||
|
Distributions declared |
$ |
12,760 |
$ |
12,751 |
$ |
521 |
$ |
26,032 | |||
|
Earnings less than distributions |
(1,482) | (1,480) | (61) | (3,023) | |||||||
|
Total net income |
$ |
11,278 |
$ |
11,271 |
$ |
460 |
$ |
23,009 | |||
|
|
|||||||||||
|
Weighted-average units outstanding - basic and diluted |
15,897 | 15,890 | |||||||||
|
|
|||||||||||
|
Earnings per limited partner unit - basic and diluted |
$ |
0.71 |
$ |
0.71 | |||||||
13. INCOME TAXES
The partnership is a limited partnership and as a result is not subject to federal and state income taxes. The general partner and the unitholders are responsible for paying federal and state income taxes on their share of the partnership’s taxable income.
Green Plains Capital Company is a subsidiary of the partnership and is taxed as a corporation. Green Plains Capital Company recorded deferred tax assets in the amount of $77 thousand and income taxes payable in the amount of $67 thousand. Green Plains Capital Company’s effective tax rate for 2015 was immaterial to the financial statements.
The MLP predecessor was a single member limited liability company, treated as a non-taxable disregarded entity in Green Plains’ federal and state income tax returns. For periods prior to the IPO, the consolidated financial statements reflect income taxes as if the MLP predecessor had filed separate federal and state tax returns. Under a tax sharing agreement between the MLP predecessor and Green Plains, the MLP predecessor periodically makes payments to Green Plains for its share of Green Plains’ tax liabilities. Differences between amounts due to Green Plains under the agreement and the total income tax expense of the MLP predecessor, which is determined as if the MLP predecessor filed separate tax returns, are reflected as member contributions in partners’ capital. These amounts included contributions of $11 thousand for the year
F-18
ended December 31, 2015 and distributions of $437 thousand and $460 thousand for the years ended December 31, 2014 and 2013.
Income taxes for the MLP predecessor were accounted for under the asset and liability method. Income taxes receivable were $1.3 million for 2014 and reflected in accounts receivable to affiliate in the consolidated balance sheets. Income taxes payable were $0.1 million for 2013 and reflected in accounts payable to affiliates in the consolidated balance sheets. Deferred tax assets and liabilities are recognized for the future tax consequences attributable to differences between the financial statement carrying amounts of existing assets and liabilities and their respective tax bases, and for net operating loss and tax credit carry-forwards. Deferred tax assets and liabilities are measured using enacted tax rates expected to apply to taxable income in the years in which those temporary differences are expected to be recovered or settled. The effect on deferred tax assets and liabilities of a change in tax rates is recognized in income in the period that includes the enactment date.
At the closing of the IPO, current and deferred income taxes were settled through equity contributions from Green Plains. At the same time, the MLP predecessor’s participation in the tax sharing agreement was terminated.
Income tax expense (benefit) consists of the following (in thousands):
|
|
Year Ended December 31, |
|||||||
|
|
2015 |
2014 |
2013 |
|||||
|
Current |
$ |
67 |
$ |
(398) |
$ |
(450) | ||
|
Deferred |
(4,076) | (7,360) | (4,255) | |||||
|
Total |
$ |
(4,009) |
$ |
(7,758) |
$ |
(4,705) | ||
Differences between income tax expense (benefit) computed at the statutory federal income tax rate and as presented on the consolidated statements of operations are summarized as follows (in thousands):
|
|
Year Ended December 31, |
|||||||
|
|
2015 |
2014 |
2013 |
|||||
|
Tax expense at federal statutory |
||||||||
|
rate of 35% |
$ |
(3,666) |
$ |
(7,207) |
$ |
(4,380) | ||
|
State income tax expense, net |
||||||||
|
of federal benefit |
(282) | (546) | (329) | |||||
|
Other |
(61) | (5) | 4 | |||||
|
Income tax expense |
$ |
(4,009) |
$ |
(7,758) |
$ |
(4,705) | ||
Significant components of deferred tax assets and liabilities are as follows (in thousands):
|
|
December 31, |
||||
|
|
2015 |
2014 |
|||
|
Deferred tax assets: |
|||||
|
Net operating loss carryforwards - Federal |
$ |
- |
$ |
10,596 | |
|
Net operating loss carryforwards - State |
- |
793 | |||
|
Investment in partnership |
77 |
- |
|||
|
Other |
- |
126 | |||
|
Total deferred tax assets |
77 | 11,515 | |||
|
|
|||||
|
Deferred tax liabilities: |
|||||
|
Fixed assets |
- |
(1,670) | |||
|
Organization and start-up costs |
- |
(472) | |||
|
Accrued expenses |
- |
(361) | |||
|
Total deferred tax liabilities |
- |
(2,503) | |||
|
Deferred income taxes |
$ |
77 |
$ |
9,012 | |
The partnership conducts business and its parent files tax returns in several states within the United States The partnership’s federal and state returns filed by its parent for the tax years ended November 30, 2012 and later are still subject
F-19
to audit.
14. COMMITMENTS AND CONTINGENCIES
Operating Leases
The partnership leases certain facilities, parcels of land, and railcars under agreements that expire on various dates. For accounting purposes, rent expense is based on a straight-line amortization of the total payments required over the term of the lease, which resulted in a deferred lease liability of approximately $349 thousand and $329 thousand as of December 31, 2015 and 2014, respectively. The partnership incurred lease expenses of $22.4 million, $21.2 million and $13.2 million during the years ended December 31, 2015, 2014 and 2013, respectively. Aggregate minimum lease payments under these agreements in future years are as follows (in thousands):
|
|
|||
|
Year Ending December 31, |
Amount |
||
|
2016 |
$ |
22,560 | |
|
2017 |
14,820 | ||
|
2018 |
11,264 | ||
|
2019 |
8,576 | ||
|
2020 |
6,574 | ||
|
Thereafter |
833 | ||
|
Total |
$ |
64,627 | |
In connection with the IPO, the partnership and Green Plains Trade entered into a ten-year storage and throughput agreement, under which Green Plains Trade is obligated to throughput a minimum of 212.5 mmg of product per calendar quarter at the partnership’s storage facilities and pay $0.05 per gallon on all volume it throughputs.
Effective January 1, 2016, the storage and throughput agreement was amended in connection with the acquisition of the ethanol storage and leased railcar assets located in Hereford, Texas and Hopewell, Virginia. In accordance with the amended agreement, Green Plains Trade is now obligated to a throughput of 246.5 mmg per calendar quarter. For accounting purposes, the partnership records revenues related to this agreement as operating lease revenues. Minimum revenues under this agreement in future years, including the January 1, 2016, amendment, are as follows (in thousands):
|
|
|||
|
Year Ending December 31, |
Amount |
||
|
2016 |
$ |
49,300 | |
|
2017 |
49,300 | ||
|
2018 |
49,300 | ||
|
2019 |
49,300 | ||
|
2020 |
49,300 | ||
|
Thereafter |
221,850 | ||
|
Total |
$ |
468,350 | |
F-20
Service Agreements
The partnership entered into agreements for contracted services with three vendors that require the partnership to pay minimum monthly amounts, which expire on various dates. The partnership exceeded all minimum commitments under these agreements during the years ended December 31, 2015, 2014 and 2013. Aggregate minimum payments under these agreements in future years are as follows (in thousands):
|
|
|||
|
Year Ending December 31, |
Amount |
||
|
2016 |
$ |
292 | |
|
2017 |
222 | ||
|
2018 |
- |
||
|
2019 |
- |
||
|
2020 |
- |
||
|
Thereafter |
- |
||
|
Total |
$ |
514 | |
Legal
Routinely, the partnership may be involved in litigation that arises during the ordinary course of business. The partnership is not currently party to any material litigation.
15. MAJOR CUSTOMERS
Revenues from three customers exceeding 10% of the partnership’s total revenues are as follows (in thousands):
|
|
|||||||||
|
|
Year Ended December 31, |
||||||||
|
|
2015 |
2014 |
2013 |
||||||
|
Green Plains Trade |
$ |
42,549 |
$ |
4,359 |
$ |
3,853 | |||
|
Customer A |
n/a |
3,053 | 3,388 | ||||||
|
Customer B |
n/a |
2,897 | 2,054 | ||||||
16. RELATED PARTY TRANSACTIONS
The partnership engages in various related party transactions with Green Plains and subsidiaries of Green Plains.
Green Plains provides a variety of shared services to the partnership, including general management, accounting and finance, payroll and human resources, information technology, legal, communications and treasury activities. These costs are proportionally allocated by Green Plains to its subsidiaries based on common financial metrics management believes are reasonable. While these allocated costs are not necessarily representative of costs that may have been incurred if they were from a third party, the partnership believes these costs would not have been materially different had they been calculated on a stand-alone basis. The partnership recorded expenses related to these shared services of approximately $1.6 million, $0.6 million and $0.5 million for the years ended December 31, 2015, 2014 and 2013. In addition, the partnership reimburses Green Plains for wages and benefit costs of employees directly performing services on its behalf. Green Plains may also pay certain direct costs on behalf of the partnership, which are reimbursed by the partnership. The partnership believes the consolidated financial statements reflect all material costs of doing business related to these operations, including expenses incurred by other entities on its behalf.
The partnership has various fee-based commercial agreements with Green Plains Trade. In connection with the IPO, the partnership entered into:
|
· |
10-year storage and throughput agreement; |
|
· |
6-year rail transportation services agreement; and |
|
· |
1-year fee-based trucking transportation agreement. |
F-21
The partnership also assumed:
|
· |
2.5-year terminal services agreement for our Birmingham, Alabama unit train terminal; and |
|
· |
various other terminal services agreements for our other fuel terminal facilities, each with Green Plains Trade. |
The storage and throughput agreement and terminal services agreements are supported by minimum volume commitments. The rail transportation services agreement is supported by minimum take-or-pay capacity commitments.
Under the storage and throughput agreement, Green Plains Trade was obligated to throughput a minimum of 212.5 mmg of product per calendar quarter at the partnership’s storage facilities and pay $0.05 per gallon on all volume it throughputs. If Green Plains Trade fails to meet its minimum volume commitment during any quarter, Green Plains Trade will pay the partnership a deficiency payment equal to the deficient volume multiplied by the applicable fee. The deficiency payment may be applied as a credit toward volumes throughput by Green Plains Trade in excess of the minimum volume commitment during the next four quarters, after which time any unused credits will expire. For each of the quarters ended September 30, 2015, and December 31, 2015, Green Plains Trade met its minimum volume commitment, with throughput of 215.6 mmg and 248.8 mmg, respectively. Effective January 1, 2016, the storage and throughput agreement was amended in connection with the acquisition of ethanol storage and leased railcar assets located in Hereford, Texas and Hopewell, Virginia. Under the amended agreement, Green Plains Trade is now obligated to a throughput of 246.5 mmg per calendar quarter. All other terms and conditions are substantially similar to the initial agreement.
Under the rail transportation services agreement, Green Plains Trade is obligated to use the partnership to transport ethanol and other fuels from receipt points identified by Green Plains Trade to nominated delivery points. During the year ended December 31, 2015, the average monthly fee was approximately $0.0358 per gallon for the railcar volumetric capacity provided by the partnership, currently at 69.5 mmg. Green Plains Trade is also obligated to use the partnership for logistical operations management and other services related to railcar volumetric capacity. Green Plains Trade is obligated to pay a monthly fee of approximately $0.0013 per gallon for these services. Green Plains Trade reimburses the partnership for costs related to: (1) railcar switching and unloading fees; (2) increased costs related to changes in law or governmental regulation related to the specification, operation or maintenance of railcars; (3) demurrage charges, except when the charges are due to the partnership’s gross negligence or willful misconduct; and (4) fees related to rail transportation services under transportation contracts with third-party common carriers. Since the IPO, any lease renewals entered in to by Green Plains Trade were done in the normal course of business at comparable margins. Effective January 1, 2016, the rail transportation agreement, as previously amended, was adjusted pursuant to its terms in connection with the acquisition of ethanol storage and leased railcar assets located in Hereford, Texas and Hopewell, Virginia. The minimum railcar volumetric capacity commitment was increased by 6.7 mmg, to an aggregate of 79.6 mmg.
Under the trucking transportation agreement, Green Plains Trade pays the partnership to use its truck transportation services to transport ethanol and other fuels from receipt points identified by Green Plains Trade to nominated delivery points. Green Plains Trade is obligated to pay a monthly trucking transportation services fee equal to the aggregate volume transported in a calendar month by the partnership’s trucks, multiplied by the applicable rate for each trucking lane. Green Plains Trade reimburses the partnership for costs related to: (1) truck switching and unloading fees; (2) increased costs related to changes in law or governmental regulation related to the specification, operation and maintenance of trucks; and (3) fees related to trucking transportation services under transportation contracts with third-party common carriers.
Under the Birmingham terminal services agreement, Green Plains Trade is obligated to pay $0.0355 per gallon on its throughput subject to a minimum volume commitment of approximately 2.8 mmg per month of ethanol and other fuels, as well as fees for providing ancillary services.
The partnership recorded revenues from Green Plains Trade under the storage and throughput agreement and rail transportation agreement of $36.9 million for the year ended December 31, 2015. The MLP predecessor recorded revenues from Green Plains Trade related to trucking and terminal services of $5.6 million, $4.4 million and $3.9 million for the years ended December 31, 2015, 2014 and 2013, respectively.
In February 2015, a subsidiary of the MLP predecessor made an equity distribution to Green Plains in the amount of $3.3 million.
BlendStar had a note payable due to Green Plains at the beginning of 2013 and made periodic interest and principal payments on the note at an interest rate of 7.50%. BlendStar paid Green Plains approximately $689 thousand in interest during the year ended December 31, 2013. During 2013, Green Plains and BlendStar agreed to convert intercompany advances, primarily for previously incurred capital expenditures, of $13.9 million as a member contribution to equity.
F-22
17. QUARTERLY FINANCIAL DATA (Unaudited)
The following tables set forth certain unaudited financial data for each of the quarters within the years ended December 31, 2015 and 2014 (in thousands, except per unit amounts). This information has been derived from the partnership’s consolidated financial statements and in management’s opinion, reflects all adjustments necessary for a fair presentation of the information for the quarters presented. The operating results for any quarter are not necessarily indicative of results for any future period.
|
|
||||||||||||
|
|
Three Months Ended |
|||||||||||
|
|
December 31, |
September 30, |
June 30, |
March 31, |
||||||||
|
Revenues |
$ |
22,686 |
$ |
21,410 |
$ |
3,445 |
$ |
3,396 | ||||
|
Operating expenses |
10,708 | 10,380 | 8,905 | 8,550 | ||||||||
|
Operating income (expense) |
11,978 | 11,030 | (5,460) | (5,154) | ||||||||
|
Other income (expense) |
(131) | (151) | (14) | 1 | ||||||||
|
Income tax benefit |
(10) |
- |
(2,060) | (1,939) | ||||||||
|
Net income (loss) |
11,857 | 10,879 | (3,414) | (3,214) | ||||||||
|
Net loss attributable to MLP predecessor |
- |
- |
(3,414) | (3,214) | ||||||||
|
Net loss attributable to sponsor |
(273) |
- |
- |
- |
||||||||
|
Net income attributable to the partnership |
$ |
12,130 |
$ |
10,879 |
$ |
- |
$ |
- |
||||
|
Earnings per limited partner unit (basic and diluted): |
||||||||||||
|
Common units |
$ |
0.37 |
$ |
0.34 | ||||||||
|
Subordinated units |
$ |
0.37 |
$ |
0.34 | ||||||||
|
Distribution declared |
$ |
0.4025 |
$ |
0.40 | ||||||||
*Recast to include the historical results of operations related to the net assets acquired in a transfer between entities under common control. See Notes 1 and 4 to the consolidated financial statements for further discussion.
|
|
Three Months Ended |
|||||||||||
|
|
December 31, |
September 30, |
June 30, |
March 31, |
||||||||
|
Revenues |
$ |
3,288 |
$ |
3,401 |
$ |
3,277 |
$ |
2,877 | ||||
|
Operating expenses |
9,762 | 8,669 | 7,735 | 7,205 | ||||||||
|
Operating income (expense) |
(6,474) | (5,268) | (4,458) | (4,328) | ||||||||
|
Other income (expense) |
(16) | (15) | (23) | (9) | ||||||||
|
Income tax benefit |
(2,450) | (1,988) | (1,688) | (1,632) | ||||||||
|
Net income (loss) |
(4,040) | (3,295) | (2,793) | (2,705) | ||||||||
|
Net loss attributable to MLP predecessor |
(4,040) | (3,295) | (2,793) | (2,705) | ||||||||
|
Net income attributable to the partnership |
$ |
- |
$ |
- |
$ |
- |
$ |
- |
||||
F-23