Attached files
| file | filename |
|---|---|
| 8-K - CURRENT REPORT - Wendy's Co | d158401d8k.htm |
 © 2015 Quality Is Our Recipe, LLC First-Quarter 2016 Conference Call May 11, 2016 Exhibit 99.1 |
 © 2015 Quality Is Our Recipe, LLC LILIANA ESPOSITO Chief Communications Officer |
 Today’s Agenda First Quarter Update Todd Penegor President & Chief Financial Officer CFO Introduction Gunther Plosch Incoming Chief Financial Officer Q&A 3 |
 This presentation, and certain information that management may discuss in connection with this presentation,
contains certain statements that are not historical facts, including
information concerning possible or assumed future results of
our operations. Those statements constitute “forward-looking statements” within the meaning of the Private Securities Litigation Reform Act of 1995 (The “Reform Act”). For all forward-looking
statements, we claim the protection of the safe harbor for
forward-looking statements contained in the Reform
Act. Many important factors could affect our future results
and could cause those results to differ materially from
those expressed in or implied by our forward-looking statements. Such
factors, all of which are difficult or impossible to predict
accurately, and many of which are beyond our control, include but are not limited to those identified under the caption “Forward-Looking Statements” in our news release issued on May 11, 2016
and in the “Special Note Regarding Forward-Looking
Statements and Projections” and “Risk Factors”
sections of our most recent Form 10-K / Form 10-Qs.
In addition, this presentation and certain information management may
discuss in connection with this presentation reference
non-GAAP financial measures, such as adjusted earnings before interest, taxes, depreciation and amortization (or adjusted EBITDA), adjusted EBITDA margin and adjusted earnings per
share. Adjusted EBITDA, adjusted EBITDA margin and adjusted earnings per
share exclude certain expenses, net of certain benefits.
Reconciliations of non-GAAP financial measures to the most directly comparable GAAP financial measures are provided in the Appendix to this presentation, and are included in our news
release issued on May 11, 2016 and posted on
www.aboutwendys.com. Forward-Looking Statements and
Non-GAAP Financial Measures
4 |
 5 |
 1968-2016 David Poplar |
 7 |
 © 2015 Quality Is Our Recipe, LLC TODD PENEGOR President and Chief Financial Officer |
 © 2015 Quality Is Our Recipe, LLC NA COMPANY-OPERATED RESTAURANT MARGIN INCREASES 250 BPS TO 17.2% SYSTEM OPTIMIZATION, IMAGE ACTIVATION, NEW RESTAURANT DEVELOPMENT ON TRACK 9 Q1 NA SYSTEM SRS OF 3.6%; TWO-YEAR SRS OF 6.8% HIGHEST IN 10+ YEARS COMPANY RAISES 2016 ADJ. EPS OUTLOOK TO $0.38 TO $0.40 COMPANY RAISES 2016 ADJ. EBITDA OUTLOOK TO DOWN 1% TO UP 1% |
 Long-Term Growth Drivers 10 2016 & Beyond SRS Acceleration (~3% System Growth) 2017 & Beyond N.A. Net Restaurant Development (~500 Net New Restaurants) 2019 & Beyond International Expansion (Establish Foundation for Accelerated Growth) |
 |
 12 Balance Across the Menu Price/Value Core LTO |
 Customers Are Noticing the Stronger Wendy’s Source: Wendy’s Brand Health Tracking, Q1 2016 vs.Q1 2015
High Quality
Food Worth What You Pay Modern and Up To Date Restaurants 13 +25% +12% +16% |
 N.A. System SRS 3.6% 3.2% 2-Year 6.8% N.A. Co. Rest. Margin 17.2% 14.7% +250 bps G&A $64.6 $59.7 (8.2%) Adjusted EBITDA** $98.1 $80.8 21.4% Adjusted EBITDA Margin** 25.9% 17.9% +800 bps Adjusted EPS** $0.11 $0.06 83.3% $ Mils (except per share amounts) First Quarter Financial Highlights 2016* 2015* B/(W) ** See Reconciliation of Adjusted EBITDA, Adjusted EBITDA Margin and Adjusted EPS in the Appendix.
14 (Unaudited) * Due to the May 2015 sale of its bakery business, the Company has presented its bakery results as discontinued operations in its financial statements. |
 Q1 2016 vs. Q1 2015: Adjusted EBITDA 15 * * Excludes ~$3M of Bakery EBITDA (Unaudited) $ in millions Q1 2015 Restaruant EBITDA (incl IA) $81 $10 Lease Buyout $7 ($16) ($5) $21 Disposed Restaurant EBITDA (Sys Op) Q1 2016 G&A $98 Royalties, Franchise Fees & Net Rental Income 375 Fewer Company Restaurant |
  Q1 2016 vs. Q1 2015: Adjusted EPS Interest Expense Q1 2016 $0.04 $0.06 Q1 2015 Adjusted EBITDA Share Repurchases Depreciation $0.01 ($0.03) $0.03 $0.11 16 (Unaudited) |
 Committed to Returning Cash to Shareholders 17 Ended Q1 with $313 million of cash Repurchased 4.9 Million shares for $48.2 Million in Q1 Approximately $308 Million remains against $1.4 Billion share repurchase
authorization
Remain committed to utilize remaining authorization as proceeds come in
from System Optimization sales
|
 System Optimization Update System Optimization III • On track to complete by the end of 2016 • 55 restaurants sold in Q1 • Continue to expect pre-tax proceeds of $400-$475M • Expect Company ownership of ~5% at YE Ongoing System Optimization • Facilitated 113 franchisee-to-franchisee transfers via “Buy and Flip” in Q1 • Catalyst for growth by evolving franchisee base & driving new restaurant development / reimaging 18 |
 Reimaging Momentum Continues 10 74 308 794 1,313 1,853 2011 2012 2013 2014 2015 2016E Total System Annual Reimages & New Builds* Total System Cumulative Reimages & New Builds* 10 64 234 486 519 540 2011 2012 2013 2014 2015 2016E ~24% of NA system Image Activated at the end of Q1 2016 * Counts include Franchise Reimages open or under construction 19 |
 Compelling Reimaging Economics Mid-Single Digit to Low-Double Digit Sales Lift Minimal Closure Time ~70-80% of Sales Retained During Closure Time Profit Flow Through 40-50%** Optional Upgrades to Tailor to Trade Area STANDARD REFRESH $300K US Investment* $500K US Investment* * Does not include deferred maintenance or franchisee chosen upgrades, ** Profit Before Occupancy Flow Through
20 |
 2016 Outlook • Reaffirming • NA System SRS of ~3% • Company-operated restaurant margin of 18.5 to 19.0 percent • CAPEX of ~$135 million to $145 million • Free Cash Flow of ~$50 million to $75 million • Revising • Commodity costs to decrease ~3% • Reported effective tax rate of ~38 to 40% / Adjusted tax rate of ~32 to 34%
• G&A expense of ~$245 to $250 million COMPANY NOW EXPECTS ADJ. EPS OF $0.38-$0.40
AND ADJ. EBITDA OF DOWN 1% TO UP 1% 21 |
 2020 North America System Goals Are On Track! AUVs Restaurant Margins Sales to Investment Ratio New Restaurants Total Reimaged Restaurants Achievement requires two growth drivers: 22 (~500 Net) $2MM 20% 1.3x 1,000 60% + BRAND RELEVANCE ECONOMIC MODEL RELEVANCE |
 © 2015 Quality Is Our Recipe, LLC GUNTHER PLOSCH Incoming Chief Financial Officer |
 © 2015 Quality Is Our Recipe, LLC Peter Koumas Manager – Investor Relations Peter.Koumas@wendys.com (614) 764 - 8478 |
 2016 Investor Relations Calendar: Key Dates May 20 Kansas City (SunTrust) June 6 CFO Reception (New York) June 7 Goldman Sachs (New York) June 8 Stephens (New York) June 13-14 Los Angeles, Pasadena, Santa Monica (Guggenheim – debt / CL King – equity) August 10 2Q earnings release 25 |
 Q&A 26 |
 Appendix 27 |
 Reconciliation of Income from Continuing Operations to Adjusted EBITDA from
Continuing Operations
28 In Thousands (Unaudited) |
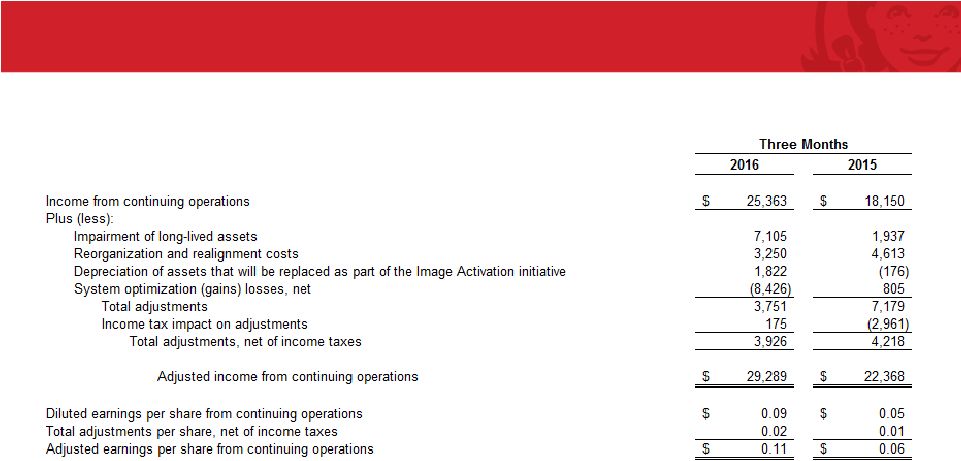 Reconciliation of Income and Diluted Earnings Per Share from Continuing Operations to
Adjusted Income and Adjusted Earnings Per Share from Continuing
Operations 29
In Thousands except per-share amounts
(Unaudited) |
 30 |