Attached files
| file | filename |
|---|---|
| 8-K - 8-K - Truett-Hurst, Inc. | v439545_8k.htm |
| EX-99.1 - EXHIBIT 99.1 - Truett-Hurst, Inc. | v439545_ex99-1.htm |
Exhibit 99.2

Truett - Hurst, Inc. FY16 Q3 Earnings Call May 10, 2016 NASDAQ: THST 1

2 Safe Harbor Statement This presentation (including the presentation and any subsequent questions and answers) contains statements that are forward - looking within the meaning of the Private Securities Litigation Reform Act of 1995 , Section 27 A of the Securities Act of 1933 and Section 21 E of the Securities Exchange Act of 1934 . Such forward - looking statements are based on the current beliefs of Truett - Hurst, Inc . ’s management and are not guarantees of future performance . Any such forward - looking statements are and will be, as the case may be, subject to many risks, uncertainties, assumptions and factors relating to the operations and business environments of Truett - Hurst, Inc . and its subsidiaries that may cause the actual results of the companies to be materially different from any future results expressed or implied in such forward - looking statements . These risk factors, include, but are not limited to, a reduction in the supply of grapes and bulk wine available to us ; significant competition ; any change in our relationships with retailers could harm our business ; we may not achieve or maintain profitability in the future ; the loss of key employees ; a reduction in our access to, or an increase in the cost of, the third - party services we use to produce our wine could harm our business ; credit facility restrictions on our current and future operations ; failure to protect, or infringement of, trademarks and proprietary rights ; these factors should not be construed as exhaustive and should be read in conjunction with the other cautionary statements that are included in this report or detailed in our periodic filings (including Forms 8 - K, 10 - K and 10 - Q) or other documents filed with the Securities and Exchange Commission . For more detailed information on us, please refer to our filings with the Securities and Exchange Commission, which are readily available at http : //www . sec . gov, or through the our Investor Relations website at http : //www . truetthurstinc . com . For additional information, see our annual report for the year ended June 30 , 2015 on Form 10 - K filed on September 28 , 2015 , or our other reports currently on file with the Securities and Exchange Commission, which contain a more detailed discussion of risks and uncertainties that may affect future results . We do not undertake to update any forward - looking statements unless otherwise required by law .

Agenda • Financial Update – Third Quarter: FY16 vs FY15 – Nine Months Ended March 31: FY16 vs FY15 – Nine Months Ended March 31: Statement of Operations Recap – Nine Months Ended March 31: Segment Analysis (as Adjusted) – Select Balance Sheet Data • Business Update • Q&A • Appendix – Ownership Structure 3

FINANCIAL UPDATE 4

Third Quarter FY16 vs FY15 (continuing operations) ― Revenue growth of 3.5% with net sales of $4.9 million (an increase of $0.2 million versus prior year) ― 1.2% decline in Wholesale ― Q3 FY16 domestic cases shipped increased slightly more than 10%; however, overall net sales in the quarter were impacted by a decrease of over 50% in export cases (primarily Canada). ― 16.9% increase in DTC ― Overall gross margin percent decreased to 35% from 39% ― Wholesale: 7.4 margin point decrease ― Q2 FY15 gross profit was a high point of gross margin as a percentage of net sales ― Sequential decline in gross margin impacted by higher finished goods costs on two specific items ― DTC: 70 basis point decrease ― Operating expenses of $1.7 million, a decrease of $0.4 million versus prior year 5

Nine Months FY16 vs FY15 ― Revenue growth of 32.5% with net sales of $19.8 million (an increase of $4.9 million versus prior year) ― 38.1% increase in Wholesale ― YTD FY15 net sales reduced by $0.6 million loss contingency related to Paperboy ― 15.5% increase in DTC ― Overall gross margin percent flat at 33% ― Wholesale: 1.4 margin point increase ― YTD FY15 gross profit reduced by $0.8 related to Paperboy loss contingency & inventory impairment ― YTD FY16 gross profit reduced by $0.2 million related to CA Winecraft inventory impairment ― DTC: flat at 65% ― Operating expenses of $6.2 million, an increase of $0.1 million ― General and administrative expense decreased $0.2 million ― Sales and marketing increased $0.2 million (declined as percentage of net sales) 6

7 Statement of Operations Nine Months: FY16 vs FY15 FY 15 FY 16 YTD YTD B / (W) Net sales 14,933$ 19,780$ 4,847$ 32.5% Gross profit 4,948 6,508 1,560 31.5% Gross Margin % 33% 33% 0% Sales and marketing ex stock comp 3,453 3,889 (436) 12.6% Sales and marketing stock comp 224 36 188 3,677 3,925 (248) 6.7% General and administrative ex stock comp 2,212 2,006 206 -9.3% General and administrative stock comp 234 238 (4) 2,446 2,244 202 -8.3% Other 12 10 2 Total Operating Expenses 6,135 6,179 (44) 0.7% Income (Loss) from Continuing Operations (1,187) 329 1,516 Non Operating Expenses Interest expense, net (207) (242) (35) Other (154) (148) 6 Income tax expense - (1) (1) (361) (391) (30) Discontinued Operations 58 45 (13) Net Income (Loss) attributable to THI and HDD (1,490)$ (17)$ 1,473$ Operating expenses (excluding stock comp) as a percentage of Net Sales Sales and marketing 23.1% 19.7% General and administrative 14.8% 10.1%

8 Segment Analysis (as Adjusted) Nine Months: FY16 vs FY15 As Adjusted Nine Months Ended 03/31 2015 2016 B / (W) % Net Sales Wholesale (A) 11,767 15,451 3,684 31% Direct to Consumer 3,748 4,329 581 16% 15,515 19,780 4,265 27% Gross Profit Wholesale (A), (B) 3,312 3,845 533 16% Direct to Consumer 2,427 2,810 383 16% 5,739 6,655 916 16% Gross Margin Wholesale 28% 25% -3% Direct to Consumer 65% 65% 0% 37% 34% -3% (A) FY15 reported numbers have been adjusted for the impact of the Paperboy loss contingency accrual and related inventory impairment ($0.6 impact to net sales and $0.8 impact to gross profit). (B) FY16 reported numbers have been adjusted for the impact of a $0.2 million inventory reserve for the remaining unsold CA Winecraft product in our inventory as of 12/31/15.

9 Select Balance Sheet Data 2015 2016 Q4 Q3 Total Assets 33,903$ 34,224$ Total Liabilities 17,554 17,618 Total Equity 16,349 16,606 33,903 34,224 Cash and cash equivalents 1,578 4,870 Property & equipment, net 5,743 5,716 Major Working Capital Accounts source / (use) A/R 2,783 1,722 1,061 Inventories 22,080 19,791 2,289 Bulk Wine Deposit 345 940 (595) AP & Accrueds 4,056 3,166 (890) 1,865 Interest Bearing Debt Credit facilities 9,034 10,055 Other Interest Bearing Debt 3,640 3,767 12,674 13,822 Cash and Cash equivalents (1,578) (4,870) in Net Debt Net Debt 11,096 8,952 (2,144)

BUSINESS UPDATE 10
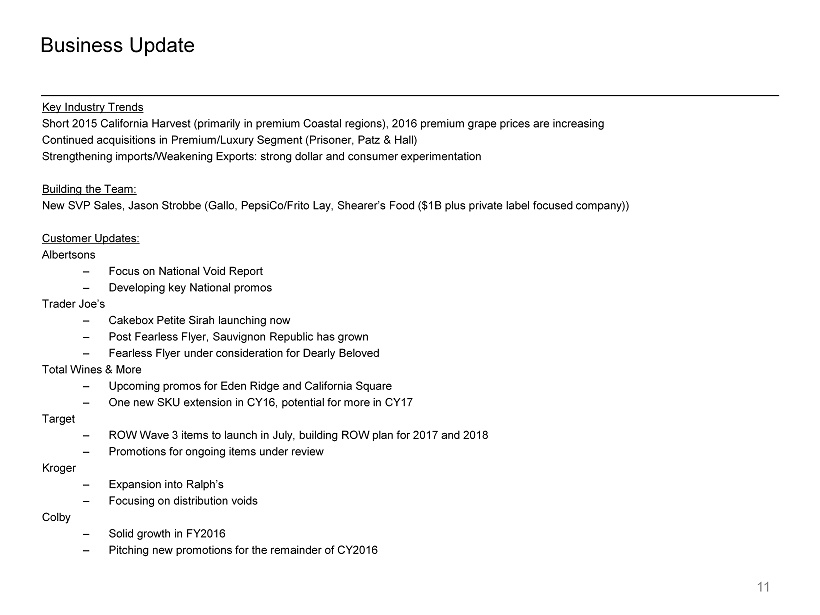
Key Industry Trends Short 2015 California Harvest (primarily in premium Coastal regions), 2016 premium grape prices are increasing Continued acquisitions in Premium/Luxury Segment (Prisoner, Patz & Hall) Strengthening imports/Weakening Exports: strong dollar and consumer experimentation Building the Team: New SVP Sales, Jason Strobbe (Gallo, PepsiCo/Frito Lay, Shearer’s Food ($1B plus private label focused company)) Customer Updates : Albertsons – Focus on National Void Report – Developing key National promos Trader Joe’s – Cakebox Petite Sirah launching now – Post Fearless Flyer, Sauvignon Republic has grown – Fearless Flyer under consideration for Dearly Beloved Total Wines & More – Upcoming promos for Eden Ridge and California Square – One new SKU extension in CY16, potential for more in CY17 Target – ROW Wave 3 items to launch in July, building ROW plan for 2017 and 2018 – Promotions for ongoing items under review Kroger – Expansion into Ralph’s – Focusing on distribution voids Colby – Solid growth in FY2016 – Pitching new promotions for the remainder of CY2016 11 Business Update

Q & A 12

A PPENDIX O WNERSHIP S TRUCTURE 13

14 Activity during quarter: • 6,212 LLC units converted and A shares issued • 40,000 equity incentives issued (net of cancelations) Ownership Structure HDD LLC Ownership Class A Shares (Fully Diluted) Members THI Total Outstanding Unconverted LLC Units Equity Incentives Total As of Initial Public Offering 4,102,644 2,700,000 6,802,644 2,700,000 4,102,644 252,000 7,054,644 60.3% 39.7% 100.0% 38.3% 58.2% 3.6% 100.0% Changes through 3/31/16: LLC Conversions (1,267,530) 1,267,530 0 1,267,530 (1,267,530) 0 0 Vesting of Equity Incentives Outstanding @ IPO Date 0 0 0 252,000 0 (252,000) 0 Post IPO Equity Incentives Equity Incentives Granted - RSA / RSU 0 0 0 0 0 181,273 181,273 Equity Incentives Granted - Options 0 0 0 0 0 470,000 470,000 Equity Incentives Vested 0 0 0 59,940 0 (59,940) 0 0 0 0 59,940 0 591,333 651,273 As of 3/31/16 2,835,114 3,967,530 6,802,644 4,279,470 2,835,114 591,333 7,705,917 41.7% 58.3% 100.0% 55.5% 36.8% 7.7% 100.0% Equity Market Capitalization based on Mar 31, 2016 Class A common stock closing price of $1.635 11,632,345$ Calculated using 4,279,470 Class A common shares outstanding and 2,835,114 LLC units convertible to Class A common stock as of March 31, 2016

Contact Information 15 Phillip L. Hurst Chief Executive Officer, President Email: phil@truetthurst.com T: 707.431.4408 M: 707.318.7480 Paul A. Forgue Chief Financial Officer & Chief Operations Officer Email: paul@truetthurst.com T: 707.431.4423 M: 707.494.3452 www.truetthurstinc.com ir@truetthurstinc.com
Call Playback Information Webcast/PowerPoint/Replay available at: http://www.truetthurstinc.com/index.php?s=151&cat=3 Replay available until May 17, 2016 16