Attached files
| file | filename |
|---|---|
| 8-K - 8-K - Advanced Emissions Solutions, Inc. | a8-k51116.htm |
| EX-99.1 - EXHIBIT 99.1 - Advanced Emissions Solutions, Inc. | pressrelease51016.htm |
© 2016 Advanced Emissions Solutions, Inc. All rights reserved. Confidential and Proprietary. May 11, 2016 EVENT TITLE Q1’16 Earnings Call

© 2016 Advanced Emissions Solutions, Inc. All rights reserved. Confidential and Proprietary. -2- Safe Harbor This presentation includes forward-looking statements within the meaning of Section 21E of the Securities Exchange Act of 1934, which provides a "safe harbor" for such statements in certain circumstances. The forward-looking statements include statements or expectations regarding future growth or contraction, competition, strategic review of alternatives for our EC business, our ability to commercialize our products and intellectual property; our ability to achieve sales and complete EC contracts; future contracts, projects, and operations; amount and timing of production of RC, timing and terms of the lease, lease renewal or sale of RC facilities, pipeline of tax equity investors and M-Prove Technology™ sales, CCS cash flow and ability to make distributions; future revenues, royalties earned, expenses, cash flow and use of cash, liquidity, debt and other financial and accounting measures; timing and outcome of our restructuring and cost containment efforts; our ability to remain compliant with Securities and Exchange Commission (SEC) reporting obligations and be relisted on the NASDAQ Stock Market LLC; scope, timing and impact of current and anticipated regulations and legislation; and related matters. These statements are based on current expectations, estimates, projections, beliefs and assumptions of our management. Such statements involve significant risks and uncertainties. Actual events or results could differ materially from those discussed in the forward-looking statements as a result of various factors, including but not limited to, changes and timing in laws, regulations, IRS interpretations or guidance, accounting rules and any pending court decisions, legal challenges to or repeal of them; changes in prices, economic conditions and market demand; the ability of the RC facilities to produce coal that qualifies for tax credits; the timing, terms and changes in contracts for RC facilities, or failure to lease or sell RC facilities; impact of competition; availability, cost of and demand for alternative tax credit vehicles and other technologies; technical, start-up and operational difficulties; availability of raw materials; loss of key personnel; reductions in operating costs may be less than expected; inability to comply with the terms of loan agreements; intellectual property infringement claims from third parties; the outcome of pending litigation; seasonality and other factors discussed in greater detail in our filings with the SEC. You are cautioned not to place undue reliance on such statements and to consult our SEC filings for additional risks and uncertainties that may apply to our business and the ownership of our securities. Our forward-looking statements are presented as of the date made, and we disclaim any duty to update such statements unless required by law to do so.
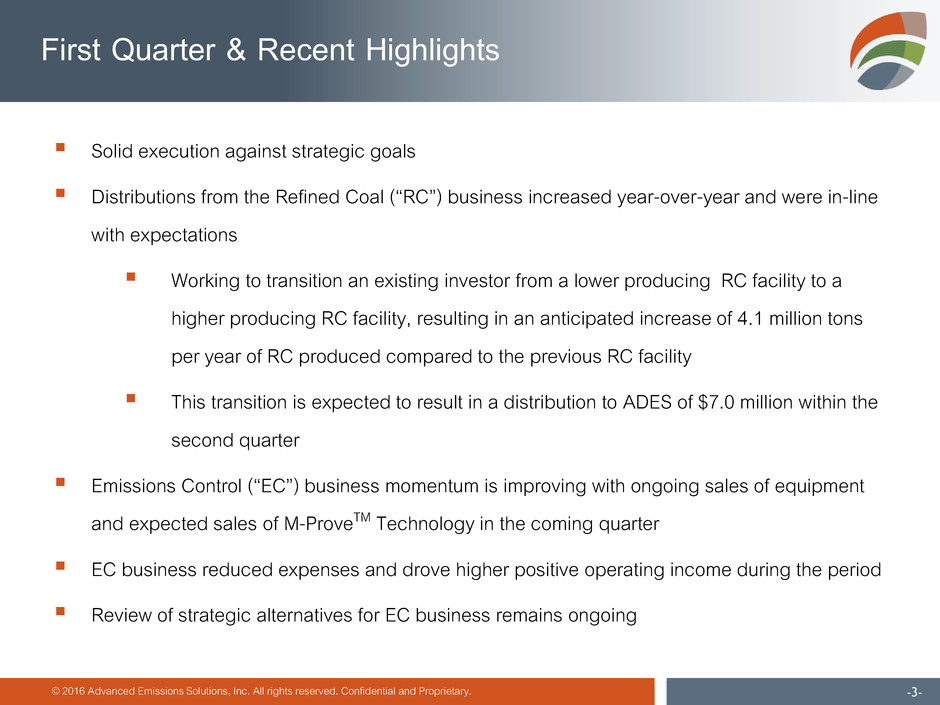
© 2016 Advanced Emissions Solutions, Inc. All rights reserved. Confidential and Proprietary. -3- First Quarter & Recent Highlights Solid execution against strategic goals Distributions from the Refined Coal (“RC”) business increased year-over-year and were in-line with expectations Working to transition an existing investor from a lower producing RC facility to a higher producing RC facility, resulting in an anticipated increase of 4.1 million tons per year of RC produced compared to the previous RC facility This transition is expected to result in a distribution to ADES of $7.0 million within the second quarter Emissions Control (“EC”) business momentum is improving with ongoing sales of equipment and expected sales of M-ProveTM Technology in the coming quarter EC business reduced expenses and drove higher positive operating income during the period Review of strategic alternatives for EC business remains ongoing
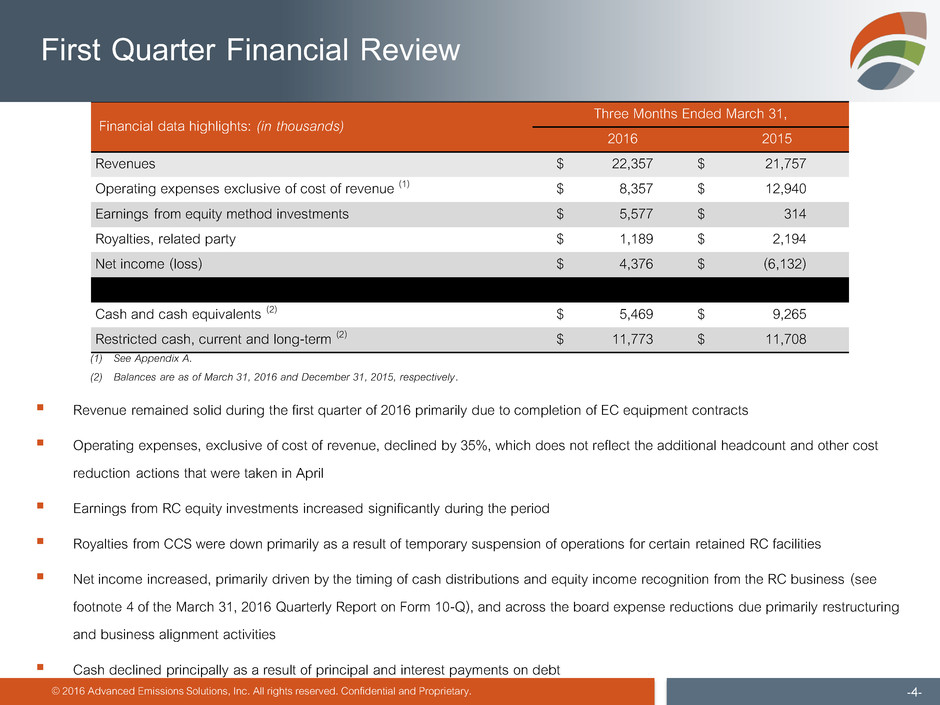
Financial data highlights: (in thousands) Three Months Ended March 31, 2016 2015 Revenues $ 22,357 $ 21,757 Operating expenses exclusive of cost of revenue (1) $ 8,357 $ 12,940 Earnings from equity method investments $ 5,577 $ 314 Royalties, related party $ 1,189 $ 2,194 Net income (loss) $ 4,376 $ (6,132) Cash and cash equivalents (2) $ 5,469 $ 9,265 Restricted cash, current and long-term (2) $ 11,773 $ 11,708 © 2016 Advanced Emissions Solutions, Inc. All rights reserved. Confidential and Proprietary. -4- First Quarter Financial Review Revenue remained solid during the first quarter of 2016 primarily due to completion of EC equipment contracts Operating expenses, exclusive of cost of revenue, declined by 35%, which does not reflect the additional headcount and other cost reduction actions that were taken in April Earnings from RC equity investments increased significantly during the period Royalties from CCS were down primarily as a result of temporary suspension of operations for certain retained RC facilities Net income increased, primarily driven by the timing of cash distributions and equity income recognition from the RC business (see footnote 4 of the March 31, 2016 Quarterly Report on Form 10-Q), and across the board expense reductions due primarily restructuring and business alignment activities Cash declined principally as a result of principal and interest payments on debt (1) See Appendix A. (2) Balances are as of March 31, 2016 and December 31, 2015, respectively.
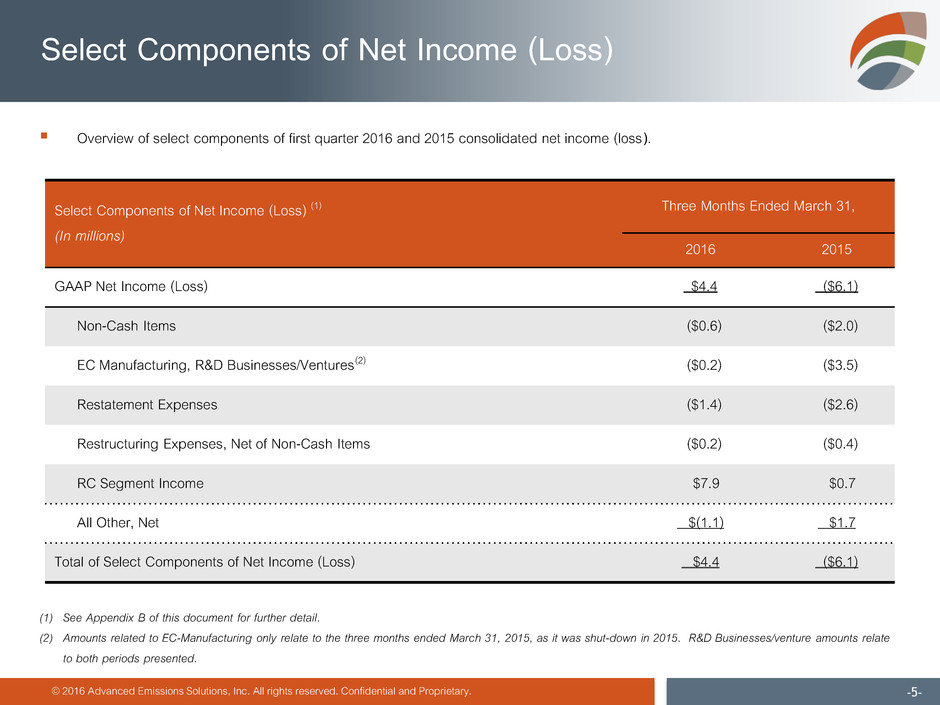
© 2016 Advanced Emissions Solutions, Inc. All rights reserved. Confidential and Proprietary. -5- Select Components of Net Income (Loss) Select Components of Net Income (Loss) (1) (In millions) Three Months Ended March 31, 2016 2015 GAAP Net Income (Loss) $4.4 ($6.1) Non-Cash Items ($0.6) ($2.0) EC Manufacturing, R&D Businesses/Ventures(2) ($0.2) ($3.5) Restatement Expenses ($1.4) ($2.6) Restructuring Expenses, Net of Non-Cash Items ($0.2) ($0.4) RC Segment Income $7.9 $0.7 All Other, Net $(1.1) $1.7 Total of Select Components of Net Income (Loss) $4.4 ($6.1) Overview of select components of first quarter 2016 and 2015 consolidated net income (loss). (1) See Appendix B of this document for further detail. (2) Amounts related to EC-Manufacturing only relate to the three months ended March 31, 2015, as it was shut-down in 2015. R&D Businesses/venture amounts relate to both periods presented.
Refined Coal

© 2016 Advanced Emissions Solutions, Inc. All rights reserved. Confidential and Proprietary. -7- RC Facilities Today and Tomorrow POTENTIAL 28 RC facilities in full-time operation Target remains 24 invested and 4 retained (~100 MT/year) 10 RC facilities installed (37.1 MT/year) 2016 2021 RC Facility information as of March 31, 2016 13 RC facilities leased/sold (40.0 MT/year) Operating (1) Not Operating(2) 5 RC facilities identified (19.2 MT/year) Full-time Operations Roadmap (1) All tonnage based on trailing 12 months (TTM) as of March 31, 2016 based on actual tonnage burned (2) Non operating tonnage is per US Energy Information Administration – TTM ended February, 2016
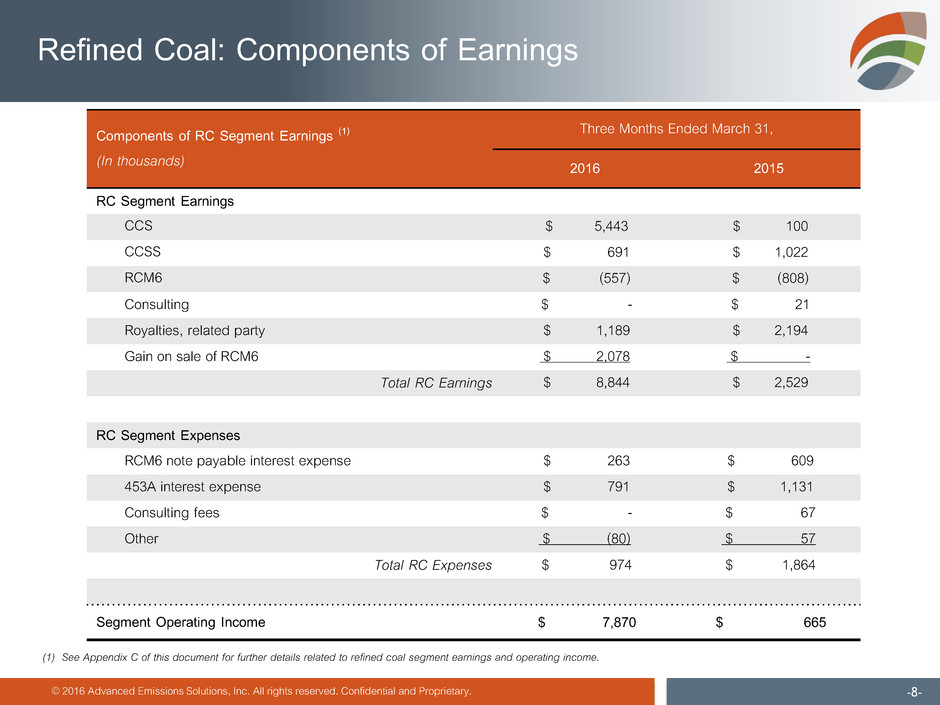
© 2016 Advanced Emissions Solutions, Inc. All rights reserved. Confidential and Proprietary. -8- Refined Coal: Components of Earnings Components of RC Segment Earnings (1) (In thousands) Three Months Ended March 31, 2016 2015 RC Segment Earnings CCS $ 5,443 $ 100 CCSS $ 691 $ 1,022 RCM6 $ (557) $ (808) Consulting $ - $ 21 Royalties, related party $ 1,189 $ 2,194 Gain on sale of RCM6 $ 2,078 $ - Total RC Earnings $ 8,844 $ 2,529 RC Segment Expenses RCM6 note payable interest expense $ 263 $ 609 453A interest expense $ 791 $ 1,131 Consulting fees $ - $ 67 Other $ (80) $ 57 Total RC Expenses $ 974 $ 1,864 Segment Operating Income $ 7,870 $ 665 (1) See Appendix C of this document for further details related to refined coal segment earnings and operating income.
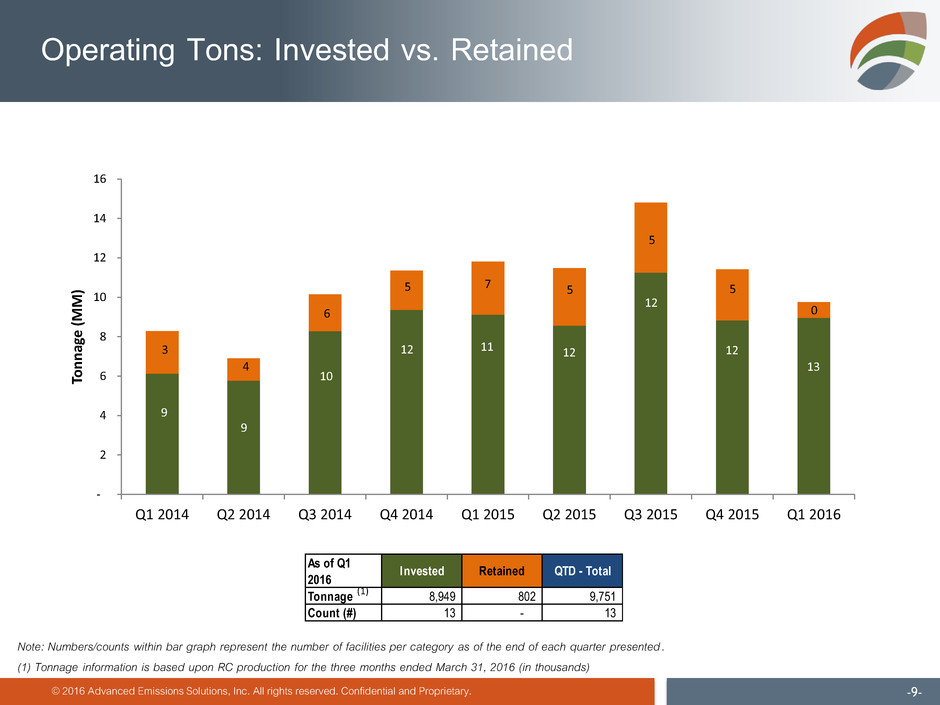
- 2 4 6 8 10 12 14 16 Q1 2014 Q2 2014 Q3 2014 Q4 2014 Q1 2015 Q2 2015 Q3 2015 Q4 2015 Q1 2016 Ton nag e (M M) © 2016 Advanced Emissions Solutions, Inc. All rights reserved. Confidential and Proprietary. -9- Operating Tons: Invested vs. Retained • Numbers within bar graph represent the number of per category as of the end of each quarter presented 9 3 9 4 10 6 12 5 11 7 12 5 12 5 12 5 13 0 Note: Numbers/counts within bar graph represent the number of facilities per category as of the end of each quarter presented. (1) Tonnag information is based upon RC production for the three months ended March 31, 2016 (in thousands) (1) Tonnage 8,949 802 9,751 Count (#) 13 - 13 As of Q1 20 6 Invested Retained QTD - Total
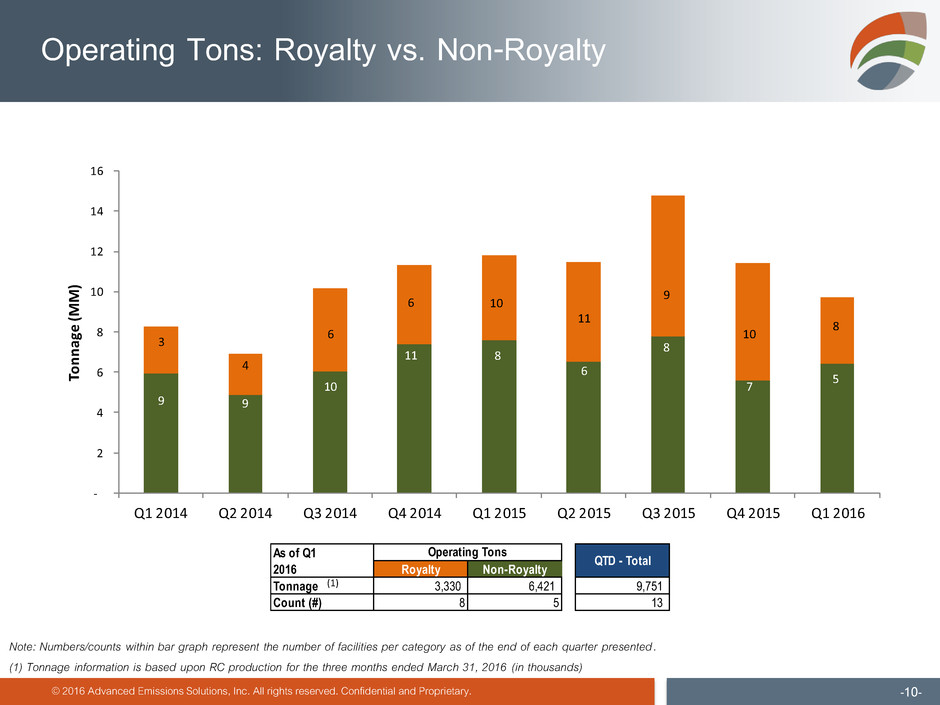
Tonnage Count (#) - 2 4 6 8 10 12 14 16 Q1 2014 Q2 2014 Q3 2014 Q4 2014 Q1 2015 Q2 2015 Q3 2015 Q4 2015 Q1 2016 Ton nag e (M M) © 2016 Advanced Emissions Solutions, Inc. All rights reserved. Confidential and Proprietary. -10- Operating Tons: Royalty vs. Non-Royalty Note: Numbers/counts within bar graph represent the number of facilities per category as of the end of each quarter presented. (1) Tonnage information is based upon RC production for the three months ended March 31, 2016 (in thousands) 9 3 9 4 10 6 11 6 8 10 6 11 8 9 7 10 5 8 (1) Royalty Non-Royalty Tonnage 3,330 6,421 9,751 Count (#) 8 5 13 As of Q1 20 6 Operating Tons QTD - Total
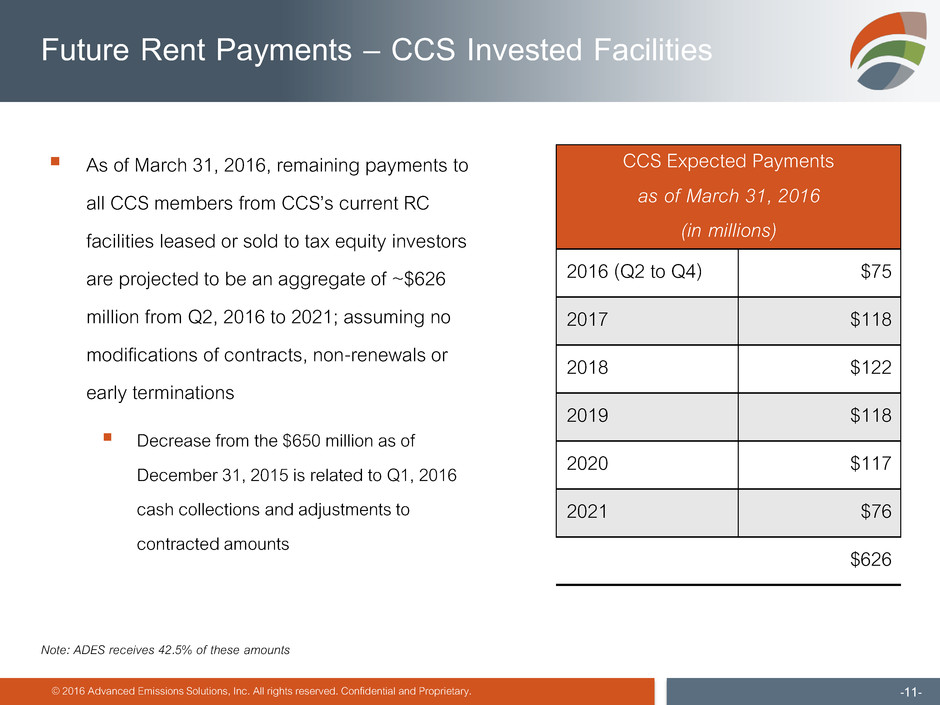
© 2016 Advanced Emissions Solutions, Inc. All rights reserved. Confidential and Proprietary. -11- Future Rent Payments – CCS Invested Facilities As of March 31, 2016, remaining payments to all CCS members from CCS’s current RC facilities leased or sold to tax equity investors are projected to be an aggregate of ~$626 million from Q2, 2016 to 2021; assuming no modifications of contracts, non-renewals or early terminations Decrease from the $650 million as of December 31, 2015 is related to Q1, 2016 cash collections and adjustments to contracted amounts CCS Expected Payments as of March 31, 2016 (in millions) 2016 (Q2 to Q4) $75 2017 $118 2018 $122 2019 $118 2020 $117 2021 $76 $626 Note: ADES receives 42.5% of these amounts
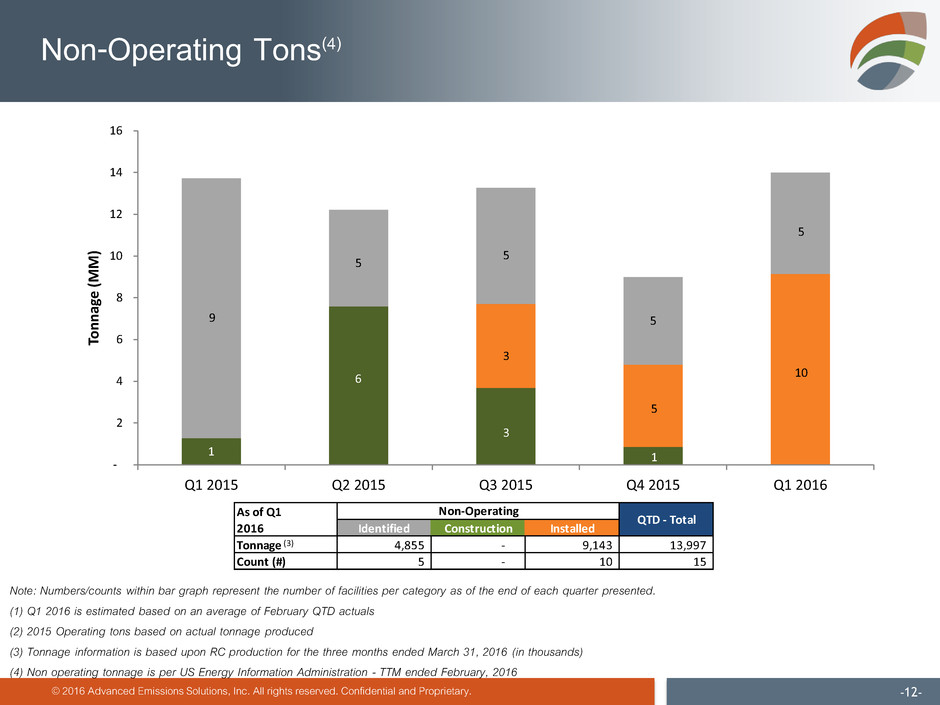
© 2016 Advanced Emissions Solutions, Inc. All rights reserved. Confidential and Proprietary. -12- Non-Operating Tons(4) Note: Numbers/counts within bar graph represent the number of facilities per category as of the end of each quarter presented. (1) Q1 2016 is estimated based on an average of February QTD actuals (2) 2015 Operating tons based on actual tonnage produced (3) Tonnage information is based upon RC production for the three months ended March 31, 2016 (in thousands) (4) Non operating tonnage is per US Energy Information Administration - TTM ended February, 2016 - 2 4 6 8 10 12 14 16 Q1 2015 Q2 2015 Q3 2015 Q4 2015 Q1 2016 Ton nag e (M M) 1 9 6 5 10 5 3 5 3 5 5 1 (3) Identified Construction Installed Tonnage 4,855 - 9,143 13,997 Count (#) 5 - 10 15 As of Q1 2016 Non-Operating QTD - Total
Emissions Control
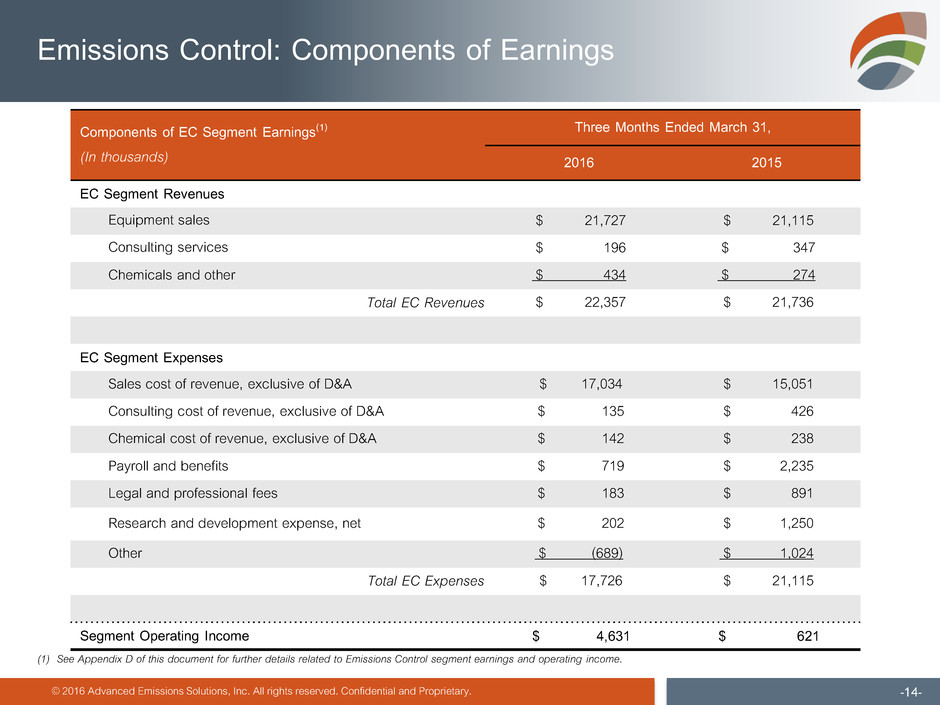
© 2016 Advanced Emissions Solutions, Inc. All rights reserved. Confidential and Proprietary. -14- Emissions Control: Components of Earnings Components of EC Segment Earnings(1) (In thousands) Three Months Ended March 31, 2016 2015 EC Segment Revenues Equipment sales $ 21,727 $ 21,115 Consulting services $ 196 $ 347 Chemicals and other $ 434 $ 274 Total EC Revenues $ 22,357 $ 21,736 EC Segment Expenses Sales cost of revenue, exclusive of D&A $ 17,034 $ 15,051 Consulting cost of revenue, exclusive of D&A $ 135 $ 426 Chemical cost of revenue, exclusive of D&A $ 142 $ 238 Payroll and benefits $ 719 $ 2,235 Legal and professional fees $ 183 $ 891 Research and development expense, net $ 202 $ 1,250 Other $ (689) $ 1,024 Total EC Expenses $ 17,726 $ 21,115 Segment Operating Income $ 4,631 $ 621 (1) See Appendix D of this document for further details related to Emissions Control segment earnings and operating income.
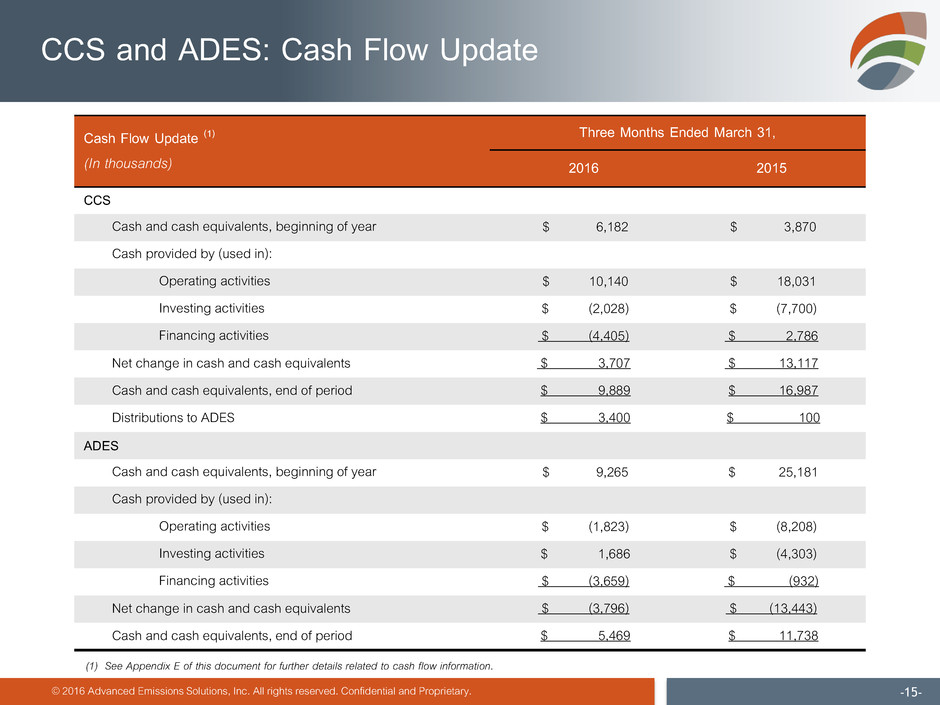
© 2016 Advanced Emissions Solutions, Inc. All rights reserved. Confidential and Proprietary. -15- CCS and ADES: Cash Flow Update Cash Flow Update (1) (In thousands) Three Months Ended March 31, 2016 2015 CCS Cash and cash equivalents, beginning of year $ 6,182 $ 3,870 Cash provided by (used in): Operating activities $ 10,140 $ 18,031 Investing activities $ (2,028) $ (7,700) Financing activities $ (4,405) $ 2,786 Net change in cash and cash equivalents $ 3,707 $ 13,117 Cash and cash equivalents, end of period $ 9,889 $ 16,987 Distributions to ADES $ 3,400 $ 100 ADES Cash and cash equivalents, beginning of year $ 9,265 $ 25,181 Cash provided by (used in): Operating activities $ (1,823) $ (8,208) Investing activities $ 1,686 $ (4,303) Financing activities $ (3,659) $ (932) Net change in cash and cash equivalents $ (3,796) $ (13,443) Cash and cash equivalents, end of period $ 5,469 $ 11,738 (1) See Appendix E of this document for further details related to cash flow information.

© 2016 Advanced Emissions Solutions, Inc. All rights reserved. Confidential and Proprietary. -16- 2016 Strategic Priorities NASDAQ Relisting and SEC Compliance with Financial Filings Drive New RC Closings and Incremental Cash Flows Each new tax-equity investor, above the current, drives $3-6 million in annual cash flow to ADES through 2021 Continue to Commercialize Emissions Control Products and IP Solid progress on positioning business to break even within four to six quarters (e.g. not relying on CCS cash flows) Implement Remaining Cost Controls Quarterly reductions throughout 2016; enter 2017 with new run rate Enhance Cash Flow and Liquidity Profile Eliminate debt as soon as it makes sense End 2016 with better liquidity profile than when we started Evaluate Strategic Alternatives to Ensure Proper Value

Appendix
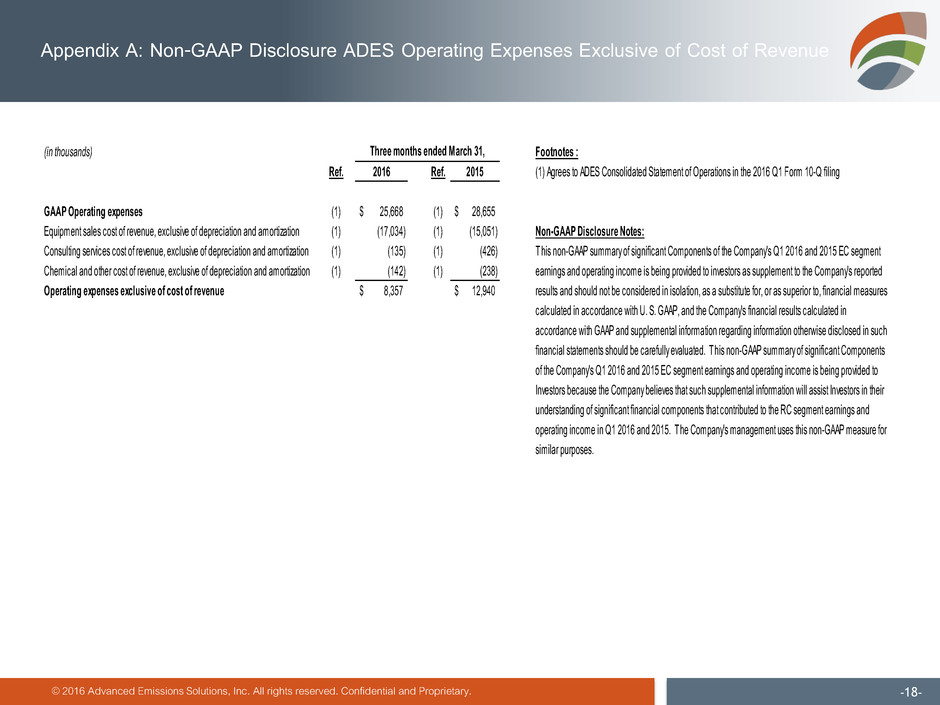
© 2016 Advanced Emissions Solutions, Inc. All rights reserved. Confidential and Proprietary. -18- Appendix A: Non-GAAP Disclosure ADES Operating Expenses Exclusive of Cost of Revenue (in thousands) Footnotes : Ref. 2016 Ref. 2015 (1) Agrees to ADES Consolidated Statement of Operations in the 2016 Q1 Form 10-Q filing GAAP Operating expenses (1) 25,668$ (1) 28,655$ Equipment sales cost of revenue, exclusive of depreciation and amortization (1) (17,034) (1) (15,051) Non-GAAP Disclosure Notes: Consulting services cost of revenue, exclusive of depreciation and amortization (1) (135) (1) (426) Chemical and other cost of revenue, exclusive of depreciation and amortization (1) (142) (1) (238) Operating expenses exclusive of cost of revenue 8,357$ 12,940$ Three months ended March 31, This non-GAAP summary of significant Components of the Company's Q1 2016 and 2015 EC segment earnings and operating income is being provided to investors as supplement to the Company's reported results and should not be considered in isolation, as a substitute for, or as superior to, financial measures calculated in accordance with U. S. GAAP, and the Company's financial results calculated in accordance with GAAP and supplemental information regarding information otherwise disclosed in such financial statements should be carefully evaluated. This non-GAAP summary of significant Components of the Company's Q1 2016 and 2015 EC segment earnings and operating income is being provided to Investors because the Company believes that such supplemental information will assist Investors in their understanding of significant financial components that contributed to the RC segment earnings and operating income in Q1 2016 and 2015. The Company's management uses this non-GAAP measure for similar purposes.
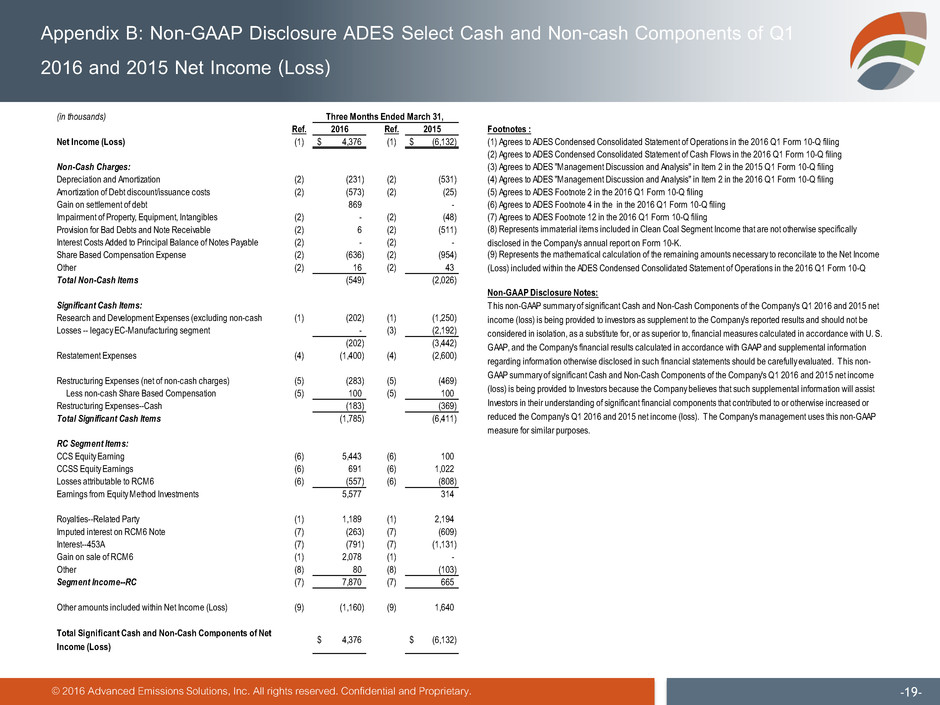
© 2016 Advanced Emissions Solutions, Inc. All rights reserved. Confidential and Proprietary. -19- Appendix B: Non-GAAP Disclosure ADES Select Cash and Non-cash Components of Q1 2016 and 2015 Net Income (Loss) (in thousands) Ref. 2016 Ref. 2015 Footnotes : Net Income (Loss) (1) 4,376$ (1) (6,132)$ (1) Agrees to ADES Condensed Consolidated Statement of Operations in the 2016 Q1 Form 10-Q filing (2) Agrees to ADES Condensed Consolidated Statement of Cash Flows in the 2016 Q1 Form 10-Q filing Non-Cash Charges: (3) Agrees to ADES "Management Discussion and Analysis" in Item 2 in the 2015 Q1 Form 10-Q filing Depreciation and Amortization (2) (231) (2) (531) (4) Agrees to ADES "Management Discussion and Analysis" in Item 2 in the 2016 Q1 Form 10-Q filing Amortization of Debt discount/issuance costs (2) (573) (2) (25) (5) Agrees to ADES Footnote 2 in the 2016 Q1 Form 10-Q filing Gain on settlement of debt 869 - (6) Agrees to ADES Footnote 4 in the in the 2016 Q1 Form 10-Q filing Impairment of Property, Equipment, Intangibles (2) - (2) (48) (7) Agrees to ADES Footnote 12 in the 2016 Q1 Form 10-Q filing Provision for Bad Debts and Note Receivable (2) 6 (2) (511) Interest Costs Added to Principal Balance of Notes Payable (2) - (2) - Share Based Compensation Expense (2) (636) (2) (954) Other (2) 16 (2) 43 Total Non-Cash Items (549) (2,026) Non-GAAP Disclosure Notes: Significant Cash Items: Research and Development Expenses (excluding non-cash (1) (202) (1) (1,250) Losses -- legacy EC-Manufacturing segment - (3) (2,192) (202) (3,442) Restatement Expenses (4) (1,400) (4) (2,600) Restructuring Expenses (net of non-cash charges) (5) (283) (5) (469) Less non-cash Share Based Compensation (5) 100 (5) 100 Restructuring Expenses--Cash (183) (369) Total Significant Cash Items (1,785) (6,411) RC Segment Items: CCS Equity Earning (6) 5,443 (6) 100 CCSS Equity Earnings (6) 691 (6) 1,022 Losses attributable to RCM6 (6) (557) (6) (808) Earnings from Equity Method Investments 5,577 314 Royalties--Related Party (1) 1,189 (1) 2,194 Imputed interest on RCM6 Note (7) (263) (7) (609) Interest--453A (7) (791) (7) (1,131) Gain on sale of RCM6 (1) 2,078 (1) - Other (8) 80 (8) (103) Segment I come--RC (7) 7,870 (7) 665 Other amounts included within Net Income (Loss) (9) (1,160) (9) 1,640 Total Significant Cash and Non-Cash Components of Net Income (Loss) 4,376$ (6,132)$ This non-GAAP summary of significant Cash and Non-Cash Components of the Company's Q1 2016 and 2015 net income (loss) is being provided to investors as supplement to the Company's reported results and should not be considered in isolation, as a substitute for, or as superior to, financial measures calculated in accordance with U. S. GAAP, and the Company's financial results calculated in accordance with GAAP and supplemental information regarding information otherwise disclosed in such financial statements should be carefully evaluated. This non- GAAP summary of significant Cash and Non-Cash Components of the Company's Q1 2016 and 2015 net income (loss) is being provided to Investors because the Company believes that such supplemental information will assist Investors in their understanding of significant financial components that contributed to or otherwise increased or reduced the Company's Q1 2016 and 2015 net income (loss). The Company's management uses this non-GAAP measure for similar purposes. Three Months Ended March 31, (8) Represents immaterial items included in Clean Coal Segment Income that are not otherwise specifically disclosed in the Company's annual report on Form 10-K. (9) Represents the mathematical calculation of the remaining amounts necessary to reconcilate to the Net Income (Loss) included within the ADES Condensed Consolidated Statement of Operations in the 2016 Q1 Form 10-Q
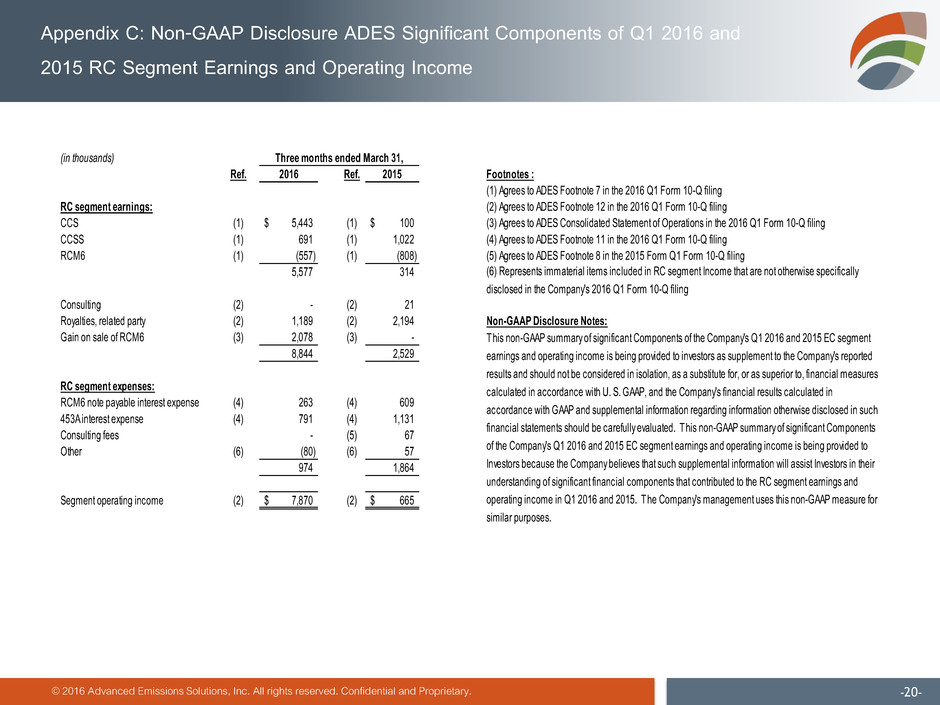
© 2016 Advanced Emissions Solutions, Inc. All rights reserved. Confidential and Proprietary. -20- Appendix C: Non-GAAP Disclosure ADES Significant Components of Q1 2016 and 2015 RC Segment Earnings and Operating Income (in thousands) Ref. 2016 Ref. 2015 Footnotes : (1) Agrees to ADES Footnote 7 in the 2016 Q1 Form 10-Q filing RC segment earnings: (2) Agrees to ADES Footnote 12 in the 2016 Q1 Form 10-Q filing CCS (1) 5,443$ (1) 100$ (3) Agrees to ADES Consolidated Statement of Operations in the 2016 Q1 Form 10-Q filing CCSS (1) 691 (1) 1,022 (4) Agrees to ADES Footnote 11 in the 2016 Q1 Form 10-Q filing RCM6 (1) (557) (1) (808) (5) Agrees to ADES Footnote 8 in the 2015 Form Q1 Form 10-Q filing 5,577 314 Consulting (2) - (2) 21 Royalties, related party (2) 1,189 (2) 2,194 Non-GAAP Disclosure Notes: Gain on sale of RCM6 (3) 2,078 (3) - 8,844 2,529 RC segment expenses: RCM6 note payable interest expense (4) 263 (4) 609 453A inter st expense (4) 791 (4) 1,131 Consulting fees - (5) 67 Other (6) (80) (6) 57 974 1,864 Segment operating income (2) 7,870$ (2) 665$ This non-GAAP summary of significant Components of the Company's Q1 2016 and 2015 EC segment earnings and operating income is being provided to investors as supplement to the Company's reported results and should not be considered in isolation, as a substitute for, or as superior to, financial measures calculated in accordance with U. S. GAAP, and the Company's financial results calculated in accordance with GAAP and supplemental information regarding information otherwise disclosed in such financial statements should be carefully evaluated. This non-GAAP summary of significant Components of the Company's Q1 2016 and 2015 EC segment earnings and operating income is being provided to Investors because the Company believes that such supplemental information will assist Investors in their understanding of significant financial components that contributed to the RC segment earnings and operating income in Q1 2016 and 2015. The Company's management uses this non-GAAP measure for similar purposes. Three months ended March 31, (6) Represents immaterial items included in RC segment Income that are not otherwise specifically disclosed in the Company's 2016 Q1 Form 10-Q filing
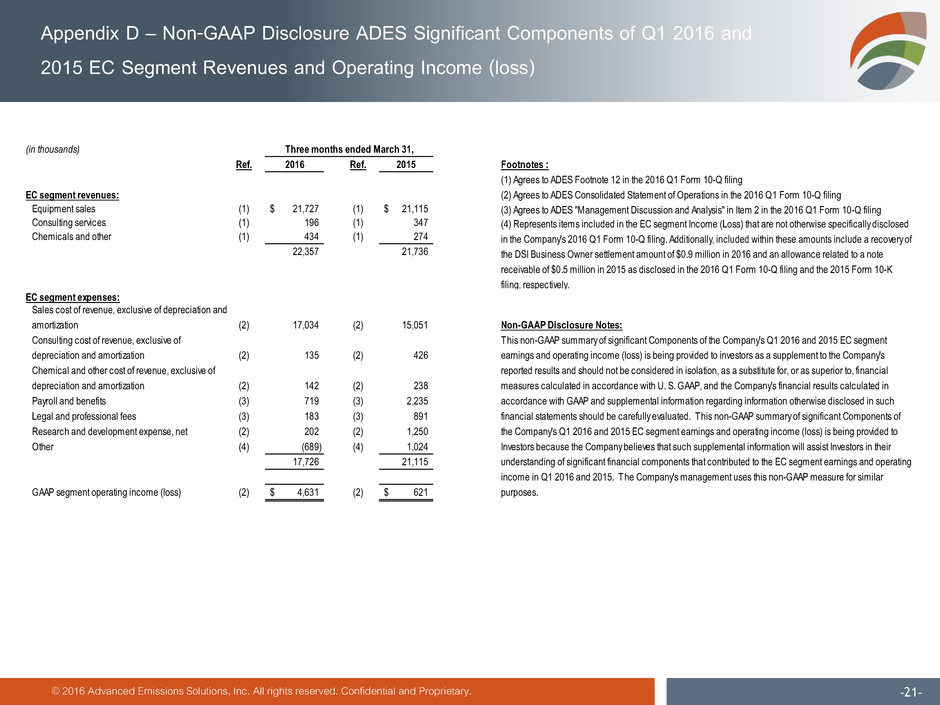
© 2016 Advanced Emissions Solutions, Inc. All rights reserved. Confidential and Proprietary. -21- Appendix D – Non-GAAP Disclosure ADES Significant Components of Q1 2016 and 2015 EC Segment Revenues and Operating Income (loss) (in thousands) Ref. 2016 Ref. 2015 Footnotes : (1) Agrees to ADES Footnote 12 in the 2016 Q1 Form 10-Q filing EC segment revenues: (2) Agrees to ADES Consolidated Statement of Operations in the 2016 Q1 Form 10-Q filing Equipment sales (1) 21,727$ (1) 21,115$ Consulting services (1) 196 (1) 347 Chemicals and other (1) 434 (1) 274 22,357 21,736 EC segment expenses: Sales cost of revenue, exclusive of depreciation and amortization (2) 17,034 (2) 15,051 Non-GAAP Disclosure Notes: Consulting cost of revenue, exclusive of depreciation and amortization (2) 135 (2) 426 Chemical and other cost of revenue, exclusive of depreciation and amortization (2) 142 (2) 238 Payroll and benefits (3) 719 (3) 2,235 Legal and professional fees (3) 183 (3) 891 R search and development expense, net (2) 202 (2) 1,250 Other (4) (689) (4) 1,024 17,726 21,115 GAAP segment operating income (loss) (2) 4,631$ (2) 621$ This non-GAAP summary of significant Components of the Company's Q1 2016 and 2015 EC segment earnings and operating income (loss) is being provided to investors as a supplement to the Company's reported results and should not be considered in isolation, as a substitute for, or as superior to, financial measures calculated in accordance with U. S. GAAP, and the Company's financial results calculated in accordance with GAAP and supplemental information regarding information otherwise disclosed in such financial statements should be carefully evaluated. This non-GAAP summary of significant Components of the Company's Q1 2016 and 2015 EC segment earnings and operating income (loss) is being provided to Investors because the Company believes that such supplemental information will assist Investors in their understanding of significant financial components that contributed to the EC segment earnings and operating income in Q1 2016 and 2015. The Company's management uses this non-GAAP measure for similar purposes. Three months ended March 31, (3) Agrees to ADES "Management Discussion and Analysis" in Item 2 in the 2016 Q1 Form 10-Q filing (4) Represents items included in the EC segment Income (Loss) that are not otherwise specifically disclosed in the Company's 2016 Q1 Form 10-Q filing. Additionally, included within these amounts include a recovery of the DSI Business Owner settlement amount of $0.9 million in 2016 and an allowance related to a note receivable of $0.5 million in 2015 as disclosed in the 2016 Q1 Form 10-Q filing and the 2015 Form 10-K filing, respectively.
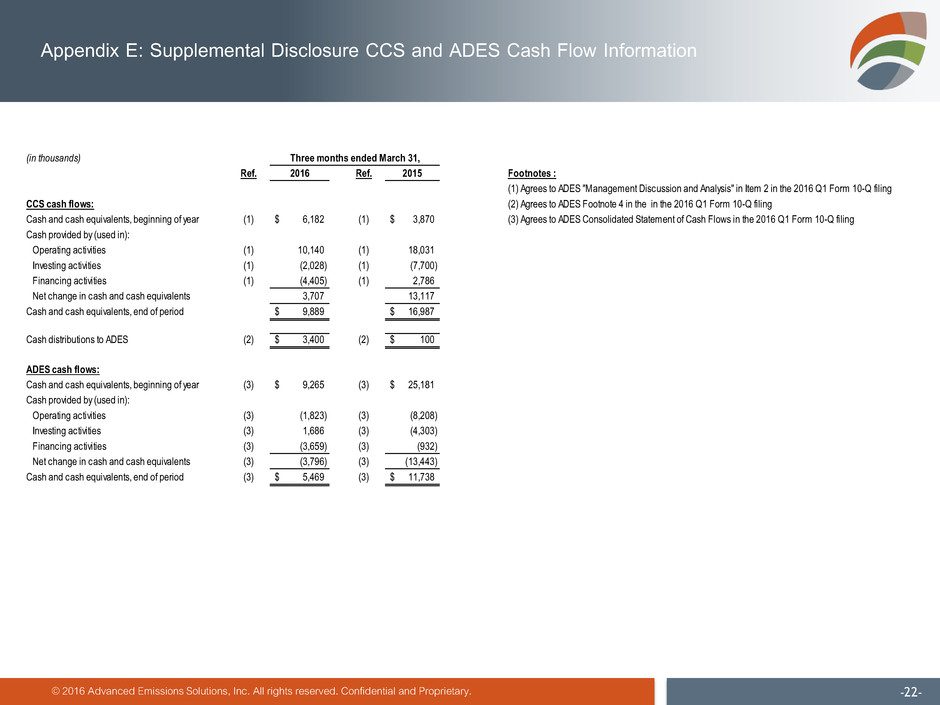
© 2016 Advanced Emissions Solutions, Inc. All rights reserved. Confidential and Proprietary. -22- Appendix E: Supplemental Disclosure CCS and ADES Cash Flow Information (in thousands) Ref. 2016 Ref. 2015 Footnotes : CCS cash flows: Cash and cash equivalents, beginning of year (1) 6,182$ (1) 3,870$ Cash provided by (used in): Operating activities (1) 10,140 (1) 18,031 Investing activities (1) (2,028) (1) (7,700) Financing activities (1) (4,405) (1) 2,786 Net change in cash and cash equivalents 3,707 13,117 Cash and cash equivalents, end of period 9,889$ 16,987$ Cash distributions to ADES (2) 3,400$ (2) 100$ ADES cash flows: Cash and cash equivalents, beginning of year (3) 9,265$ (3) 25,181$ Cash provided by (used in): Operating activities (3) (1,823) (3) (8,208) Investing activities (3) 1,686 (3) (4,303) Financing activities (3) (3,659) (3) (932) Net change in cash and cash equivalents (3) (3,796) (3) (13,443) Cash and cash equivalents, end of period (3) 5,469$ (3) 11,738$ Three months ended March 31, (1) Agrees to ADES "Management Discussion and Analysis" in Item 2 in the 2016 Q1 Form 10-Q filing (2) Agrees to ADES Footnote 4 in the in the 2016 Q1 Form 10-Q filing (3) Agrees to ADES Consolidated Statement of Cash Flows in the 2016 Q1 Form 10-Q filing
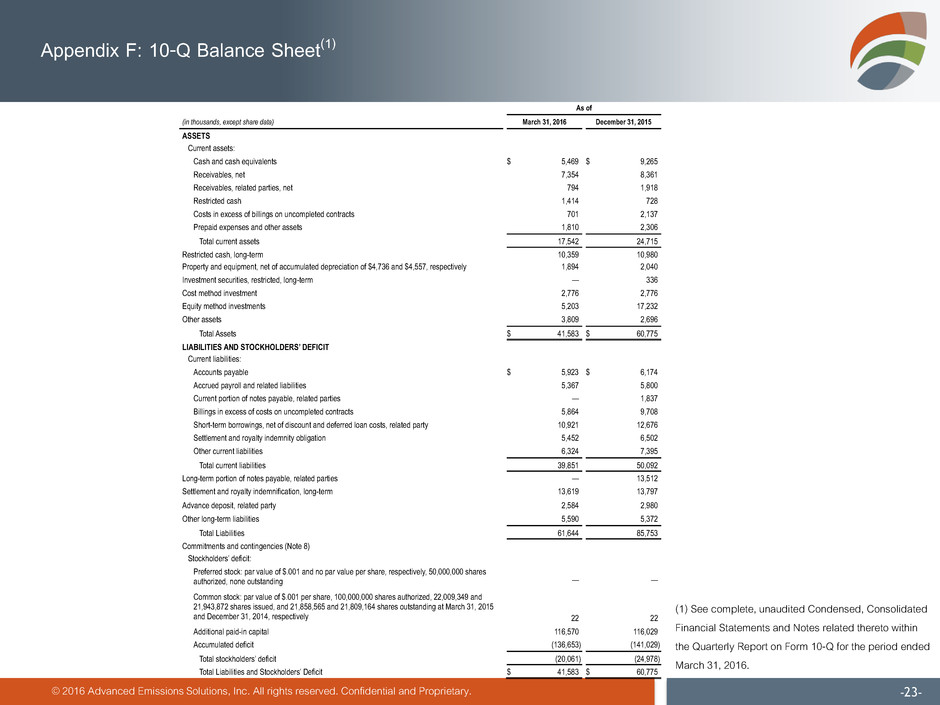
© 2016 Advanced Emissions Solutions, Inc. All rights reserved. Confidential and Proprietary. -23- Appendix F: 10-Q Balance Sheet(1) As of (in thousands, except share data) March 31, 2016 December 31, 2015 ASSETS Current assets: Cash and cash equivalents $ 5,469 $ 9,265 Receivables, net 7,354 8,361 Receivables, related parties, net 794 1,918 Restricted cash 1,414 728 Costs in excess of billings on uncompleted contracts 701 2,137 Prepaid expenses and other assets 1,810 2,306 Total current assets 17,542 24,715 Restricted cash, long-term 10,359 10,980 Property and equipment, net of accumulated depreciation of $4,736 and $4,557, respectively 1,894 2,040 Investment securities, restricted, long-term — 336 Cost method investment 2,776 2,776 Equity method investments 5,203 17,232 Other assets 3,809 2,696 Total Assets $ 41,583 $ 60,775 LIABILITIES AND STOCKHOLDERS’ DEFICIT Current liabilities: Accounts payable $ 5,923 $ 6,174 Accrued payroll and related liabilities 5,367 5,800 Current portion of notes payable, related parties — 1,837 Billings in excess of costs on uncompleted contracts 5,864 9,708 Short-term borrowings, net of discount and deferred loan costs, related party 10,921 12,676 Settlement and royalty indemnity obligation 5,452 6,502 Other current liabilities 6,324 7,395 Total current liabilities 39,851 50,092 Long-term portion of notes payable, related parties — 13,512 Settlement and royalty indemnification, long-term 13,619 13,797 Advance deposit, related party 2,584 2,980 Other long-term liabilities 5,590 5,372 Total Liabilities 61,644 85,753 Commitments and contingencies (Note 8) Stockholders’ deficit: Preferred stock: par value of $.001 and no par value per share, respectively, 50,000,000 shares authorized, none outstanding — — Common stock: par value of $.001 per share, 100,000,000 shares authorized, 22,009,349 and 21,943,872 shares issued, and 21,858,565 and 21,809,164 shares outstanding at March 31, 2015 and December 31, 2014, respectively 22 22 Additional paid-in capital 116,570 116,029 Accumulated deficit (136,653 ) (141,029 ) Total stockholders’ deficit (20,061 ) (24,978 ) Total Liabilities and Stockholders’ Deficit $ 41,583 $ 60,775 (1) See complete, unaudited Condensed, Consolidated Financial Statements and Notes related thereto within the Quarterly Report on Form 10-Q for the period ended March 31, 2016.

© 2016 Advanced Emissions Solutions, Inc. All rights reserved. Confidential and Proprietary. -24- Appendix G: 10-Q Income Statement(1) Three Months Ended March 31, (in thousands, except per share data and percentages) 2016 2015 Revenues: Equipment sales $ 21,727 $ 21,115 Consulting services 196 368 Chemicals and other 434 274 Total revenues 22,357 21,757 Operating expenses: Equipment sales cost of revenue, exclusive of depreciation and amortization 17,034 15,051 Consulting services cost of revenue, exclusive of depreciation and amortization 135 426 Chemical and other cost of revenue, exclusive of depreciation and amortization 142 238 Payroll and benefits 3,802 4,911 Rent and occupancy 394 631 Legal and professional fees 2,983 3,735 General and administrative 745 1,882 Research and development, net 202 1,250 Depreciation and amortization 231 531 Total operating expenses 25,668 28,655 Operating loss (3,311 ) (6,898 ) Other income (expense): Earnings from equity method investments 5,577 314 Royalties, related party 1,189 2,194 Interest expense (1,964 ) (1,775 ) Gain on sale of equity method investment 2,078 — Gain on settlement of note payable 869 — Other (9 ) 77 Total other income (expense), net 7,740 810 Income (loss) before income tax expense 4,429 (6,088 ) Income tax expense 53 44 Net income (loss) $ 4,376 $ (6,132 ) Income (loss) per common share: Basic $ 0.20 $ (0.28 ) Diluted $ 0.20 $ (0.28 ) Weighted-average number of common shares outstanding: Basic 21,849 21,696 Diluted 22,176 21,696 (1) See complete, unaudited Condensed, Consolidated Financial Statements and Notes related thereto within the Quarterly Report on Form 10-Q for the period ended March 31, 2016.
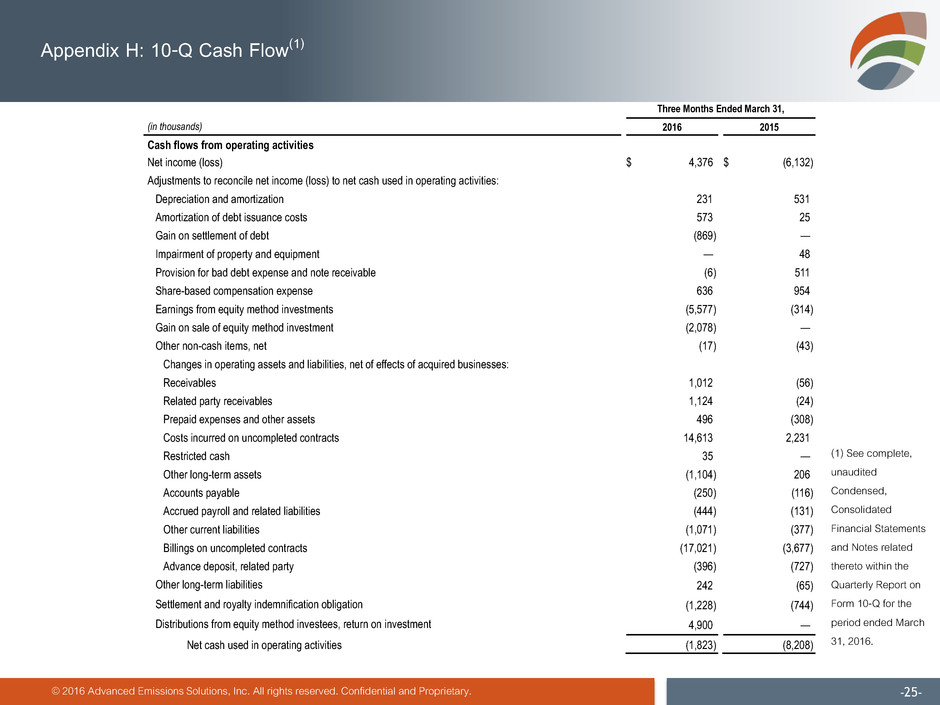
© 2016 Advanced Emissions Solutions, Inc. All rights reserved. Confidential and Proprietary. -25- Appendix H: 10-Q Cash Flow(1) Three Months Ended March 31, (in thousands) 2016 2015 Cash flows from operating activities Net income (loss) $ 4,376 $ (6,132 ) Adjustments to reconcile net income (loss) to net cash used in operating activities: Depreciation and amortization 231 531 Amortization of debt issuance costs 573 25 Gain on settlement of debt (869 ) — Impairment of property and equipment — 48 Provision for bad debt expense and note receivable (6 ) 511 Share-based compensation expense 636 954 Earnings from equity method investments (5,577 ) (314 ) Gain on sale of equity method investment (2,078 ) — Other non-cash items, net (17 ) (43 ) Changes in operating assets and liabilities, net of effects of acquired businesses: Receivables 1,012 (56 ) Related party receivables 1,124 (24 ) Prepaid expenses and other assets 496 (308 ) Costs incurred on uncompleted contracts 14,613 2,231 Restricted cash 35 — Other long-term assets (1,104 ) 206 Accounts payable (250 ) (116 ) Accrued payroll and related liabilities (444 ) (131 ) Other current liabilities (1,071 ) (377 ) Billings on uncompleted contracts (17,021 ) (3,677 ) Advance deposit, related party (396 ) (727 ) Other long-term liabilities 242 (65 ) Settlement and royalty indemnification obligation (1,228 ) (744 ) Distributions from equity method investees, return on investment 4,900 — Net cash used in operating activities (1,823 ) (8,208 ) (1) See complete, unaudited Condensed, Consolidated Financial Statements and Notes related thereto within the Quarterly Report on Form 10-Q for the period ended March 31, 2016.
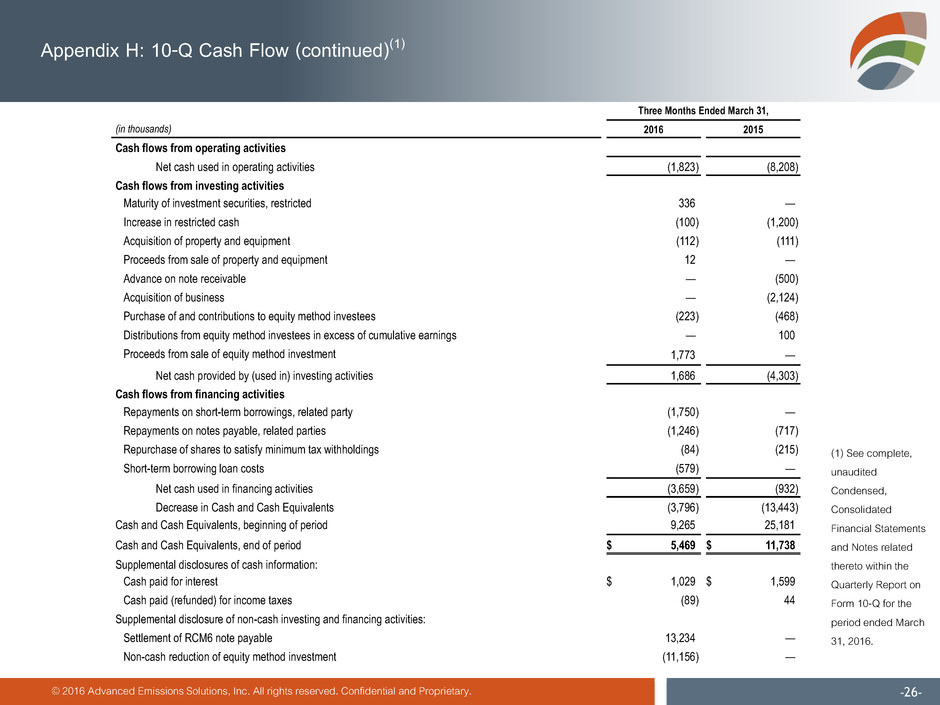
© 2016 Advanced Emissions Solutions, Inc. All rights reserved. Confidential and Proprietary. -26- Appendix H: 10-Q Cash Flow (continued)(1) Three Months Ended March 31, (in thousands) 2016 2015 Cash flows from operating activities Net cash used in operating activities (1,823 ) (8,208 ) Cash flows from investing activities Maturity of investment securities, restricted 336 — Increase in restricted cash (100 ) (1,200 ) Acquisition of property and equipment (112 ) (111 ) Proceeds from sale of property and equipment 12 — Advance on note receivable — (500 ) Acquisition of business — (2,124 ) Purchase of and contributions to equity method investees (223 ) (468 ) Distributions from equity method investees in excess of cumulative earnings — 100 Proceeds from sale of equity method investment 1,773 — Net cash provided by (used in) investing activities 1,686 (4,303 ) Cash flows from financing activities Repayments on short-term borrowings, related party (1,750 ) — Repayments on notes payable, related parties (1,246 ) (717 ) Repurchase of shares to satisfy minimum tax withholdings (84 ) (215 ) Short-term borrowing loan costs (579 ) — Net cash used in financing activities (3,659 ) (932 ) Decrease in Cash and Cash Equivalents (3,796 ) (13,443 ) Cash and Cash Equivalents, beginning of period 9,265 25,181 Cash and Cash Equivalents, end of period $ 5,469 $ 11,738 Supplemental disclosures of cash information: Cash paid for interest $ 1,029 $ 1,599 Cash paid (refunded) for income taxes (89 ) 44 Supplemental disclosure of non-cash investing and financing activities: Settlement of RCM6 note payable 13,234 — Non-cash reduction of equity method investment (11,156 ) — (1) See complete, unaudited Condensed, Consolidated Financial Statements and Notes related thereto within the Quarterly Report on Form 10-Q for the period ended March 31, 2016.
